18. rossignol wb struct transf (1) - projects at harvard · ivan rossignol trade and...
TRANSCRIPT

} IVAN ROSSIGNOL
Trade and Competitiveness Global Practice World Bank Group
Cambridge, MA April 14, 2016

-6
-4
-2
0
2
4
6
8
10
12
2003 2004 2005 2006 2007 2008 2009 2010 2011 2012 2013 2014
Sub-Saharan Africa Middle East & North Africa Latin America & Caribbean East Asia & Pacific Europe & Central Asia
GDP growth by region 2003 to 2014, % Poverty headcount by region, %

Gini index for select major developing countries
0 10 20 30 40 50 60 70
India
Indonesia
China
South Africa
2005 or later 1993 or earlier

Value added by sector Africa 1995 to 2014, % of GDP
0
10
20
30
40
50
60
70
1990 1991 1992 1993 1994 1995 1996 1997 1998 1999 2000 2001 2002 2003 2004 2005 2006 2007 2008 2009 2010 2011 2012 2013 2014
Agriculture Services Manufacturing

} IMF April growth forecasts revised down for 2016 to just 3.2% globally ◦ Contraction of 0.5% forecast in Latin America in 2016 ◦ Growth forecast revised down to 3.0% in 2016 for Sub-Saharan Africa ◦ Significant slow down in China ◦ Weak commodity prices may prolong or worsen the slow down
} McKinsey Global Institute forecasts 2.1% global growth for 2014-64 compared to 3.8% from 1950 to 2014 ◦ Secular stagnation in developed countries ◦ Threat of protectionism ◦ Growing inequality within countries creates additional challenges
} Have policies around macro stability and economic diversification been impactful and fast enough ?
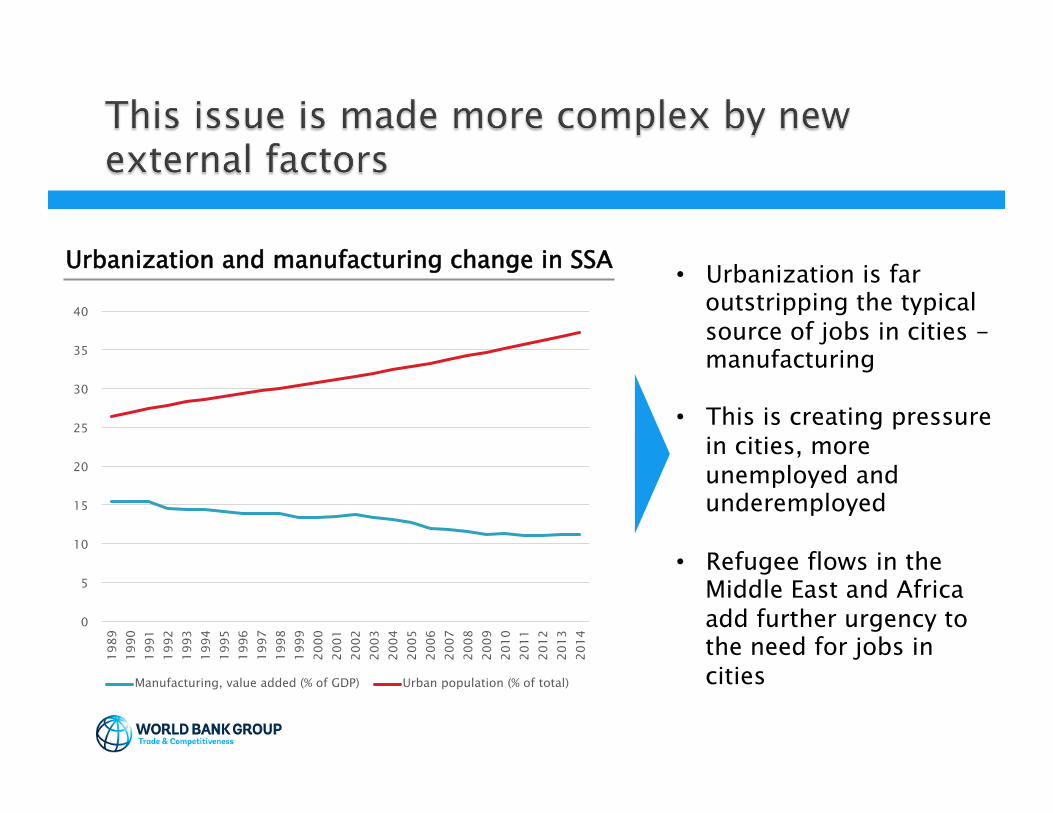
• Urbanization is far outstripping the typical source of jobs in cities - manufacturing
• This is creating pressure in cities, more unemployed and underemployed
• Refugee flows in the Middle East and Africa add further urgency to the need for jobs in cities
0
5
10
15
20
25
30
35
40
1989
19
90
1991
19
92
1993
19
94
1995
19
96
1997
19
98
1999
20
00
2001
20
02
2003
20
04
2005
20
06
2007
20
08
2009
20
10
2011
20
12
2013
20
14
Manufacturing, value added (% of GDP) Urban population (% of total)
Urbanization and manufacturing change in SSA
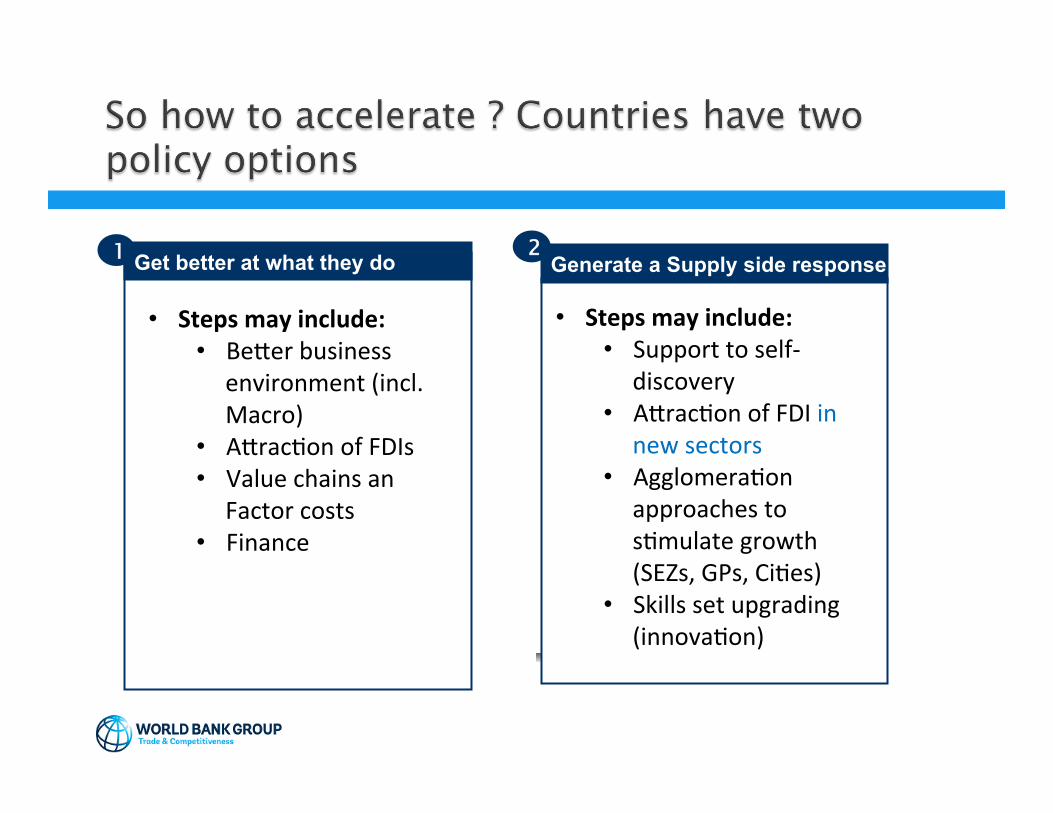
Get better at what they do
• Steps may include: • Be#er business
environment (incl. Macro)
• A#rac7on of FDIs • Value chains an
Factor costs • Finance
Generate a Supply side response
• Steps may include: • Support to self-‐
discovery • A#rac7on of FDI in
new sectors • Agglomera7on
approaches to s7mulate growth (SEZs, GPs, Ci7es)
• Skills set upgrading (innova7on)
1 2

Doing business and GDP, ranking
0
10
20
30
40
50
60
Sub Saharan Africa
1990 2012
Access to electricity in SSA, % households
Factor conditions are difficult to change

} Diversification: ask Harvard !
} Typical tools of new industrial policy 1. Matching grants 2. Special Economic Zones 3. Larger agglomeration approaches e.g. growth poles
and growth corridors 4. Exchange rate policy

} Industrial policy is difficult ◦ Many attempts to pick sectors have failed in both SSA and
LAC e.g. Ghana canned fruit, LAC import substitution
} But governments are ‘doomed to choose’ anyway according to Hausmann and Rodrik ◦ Even horizontal reforms may have differential impact
} Many value chain specific constraints need to be resolved, but with limited resources only some value chains can be focused on, which ones?
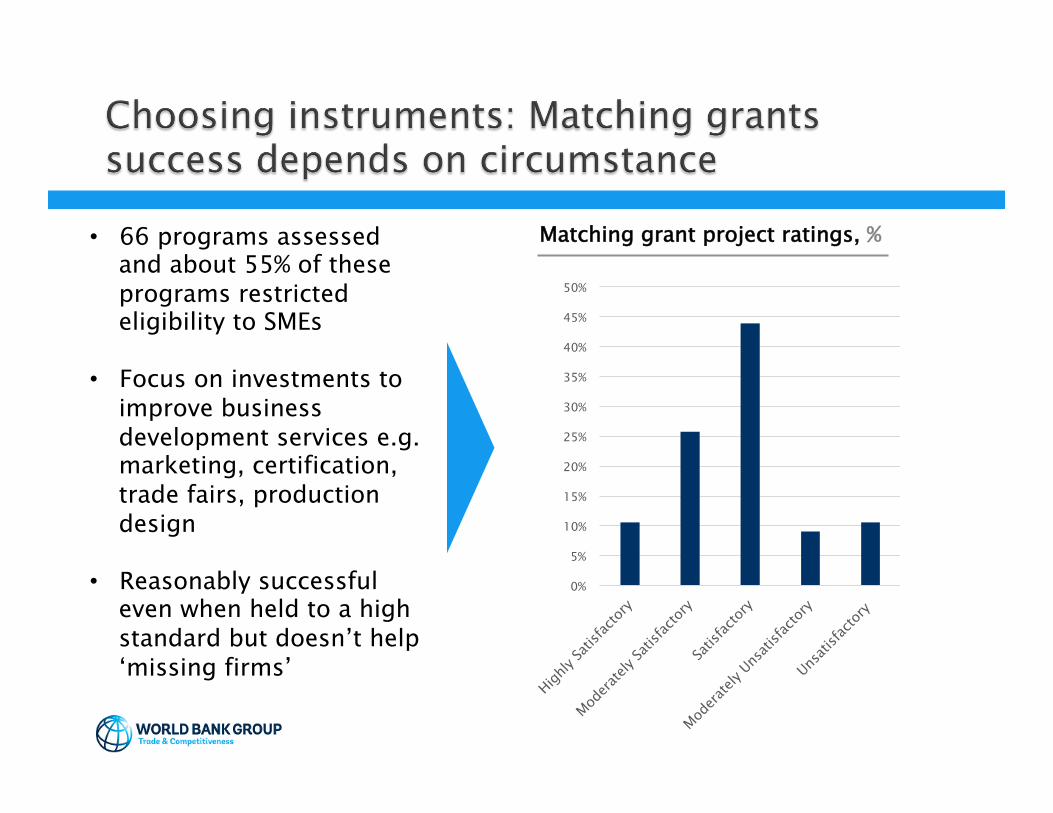
• 66 programs assessed and about 55% of these programs restricted eligibility to SMEs
• Focus on investments to improve business development services e.g. marketing, certification, trade fairs, production design
• Reasonably successful even when held to a high standard but doesn’t help ‘missing firms’
Matching grant project ratings, %
0%
5%
10%
15%
20%
25%
30%
35%
40%
45%
50%
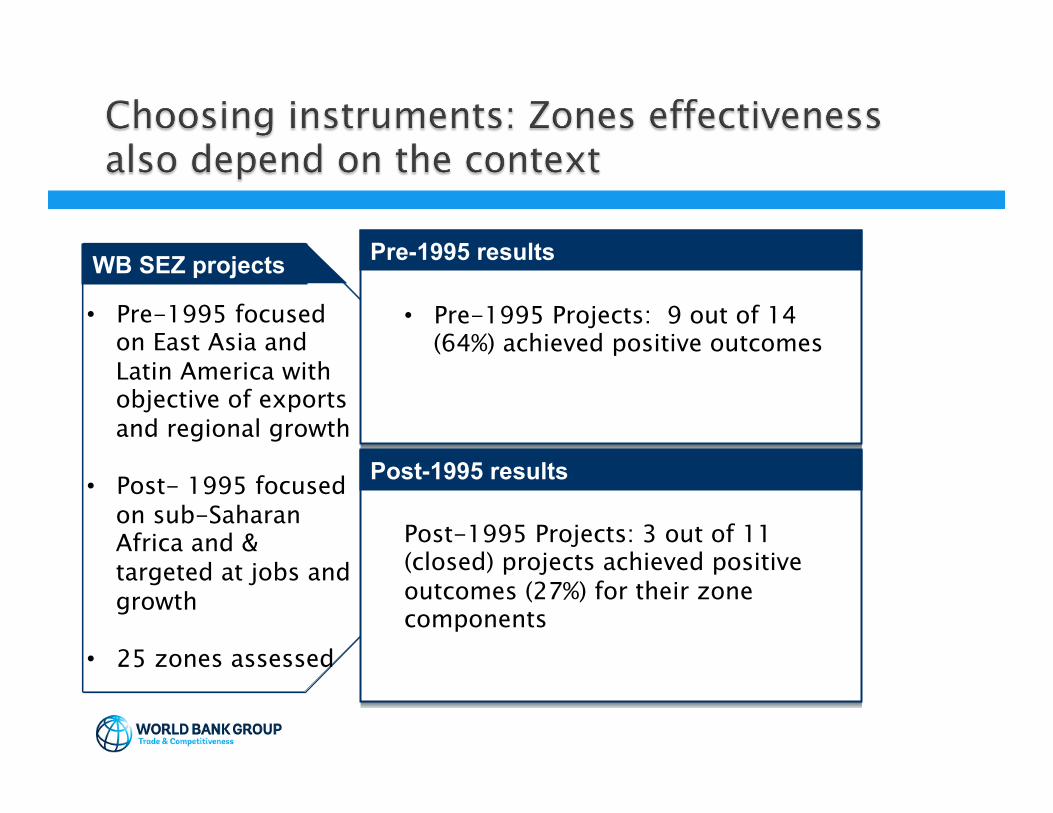
Pre-1995 results
Post-1995 results
WB SEZ projects
• Pre-1995 focused on East Asia and Latin America with objective of exports and regional growth
• Post- 1995 focused on sub-Saharan Africa and & targeted at jobs and growth
• 25 zones assessed
• Pre-1995 Projects: 9 out of 14 (64%) achieved positive outcomes
Post-1995 Projects: 3 out of 11 (closed) projects achieved positive outcomes (27%) for their zone components
} Twenty agglomeration projects were assessed } Project designs overestimated the intellectual clarity of the
agglomeration approach.
} While agglomeration interventions may ease coordination failures, entry and investment does not always increase. ◦ Madagascar project: attributing all new jobs in project areas to project--
average cost/job =$13,000, four times the K/L ratio for SSA firms in enterprise surveys
◦ Thresholds (in terms of lower costs and risk) may need to be reached to spur private investment.
◦ Agglomeration projects can have a large effect on land values, raising issues of ownership, control and allocation
} Developing cities around the private sector is still not clearly understood (how can one create clusters ?)
} What 60 years of development economics have brought us are fashions and counter fashions, with a common point: a common obsession for the blueprint
} What increasing anecdotal evidence is telling us is that identical policies have varying degrees of success: variables are infinite (are RCTs really helpful ?).
} What we are seeing is that countries with established processes to learn and refine approaches are the ones that are succeeding: Malaysia, South Korea and China (Heilmann). Countries with perfect institutions and legislation may not do as well: Rwanda, Pakistan
} Moving on from policy obsession to an implementation culture (the anti-French model)