180000 applying q exactive benchtop orbitrap lc...
TRANSCRIPT
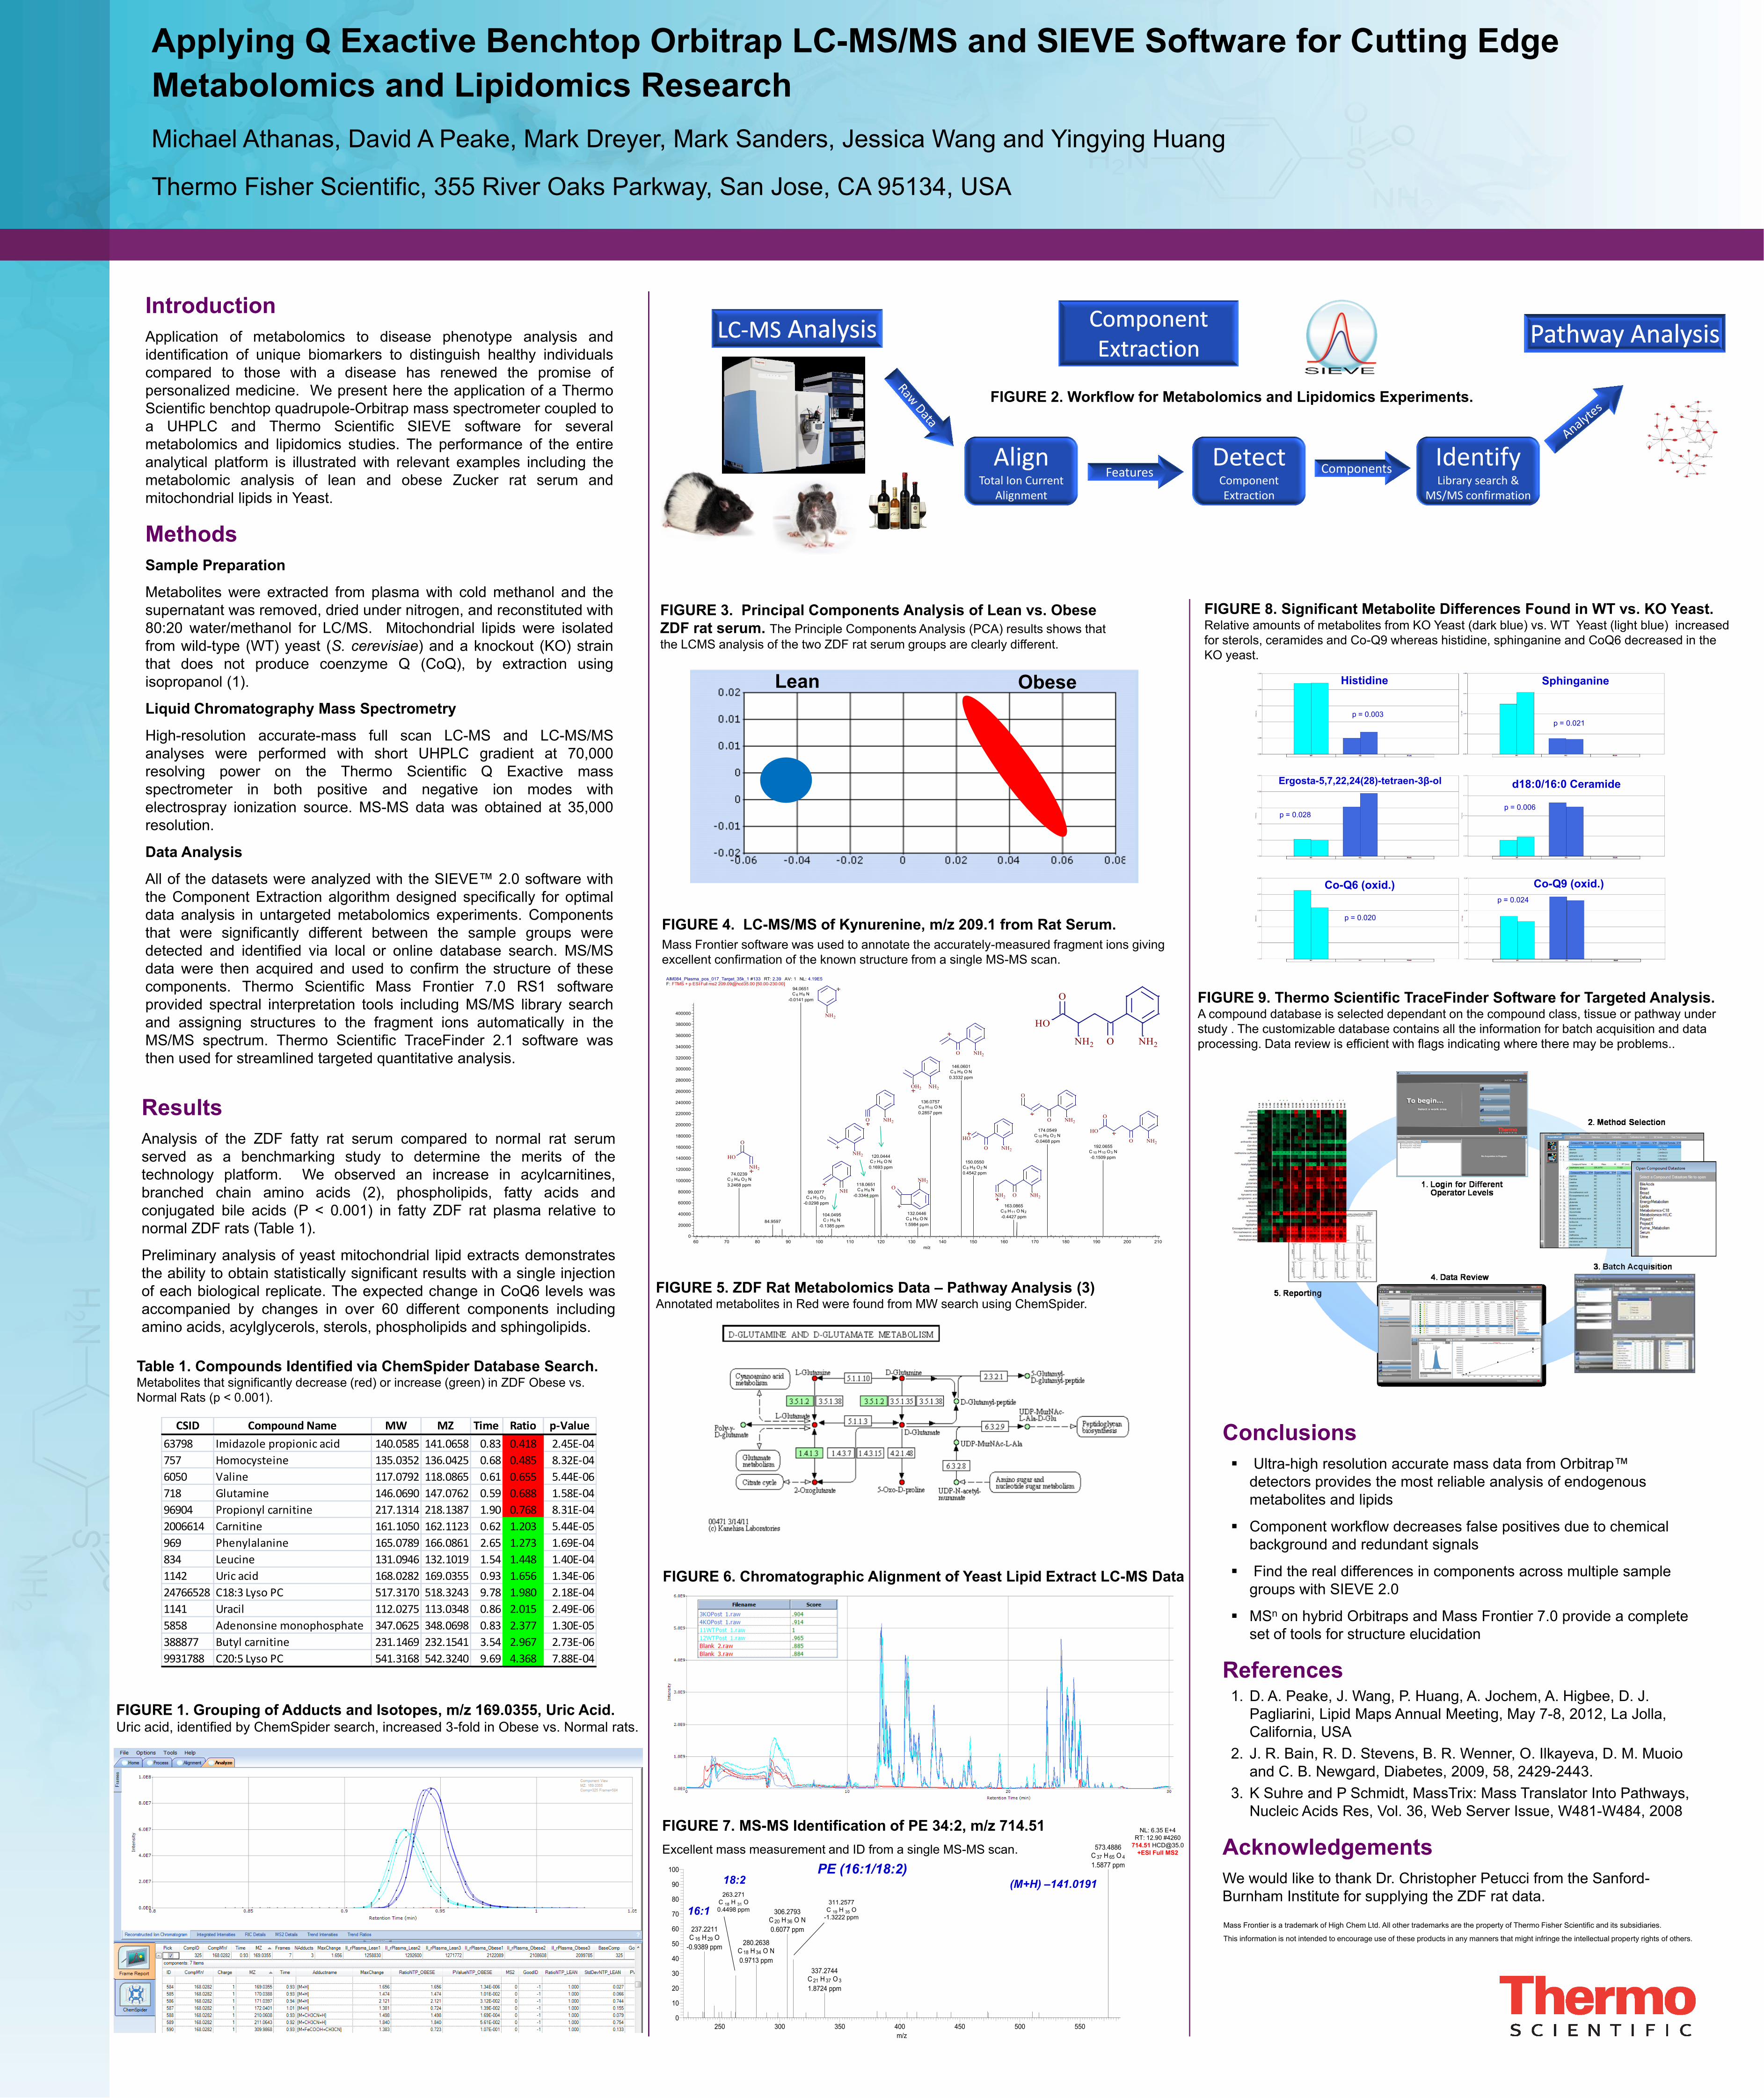
FIGURE 9. Thermo Scientific TraceFinder Software for Targeted Analysis. A compound database is selected dependant on the compound class, tissue or pathway under
study . The customizable database contains all the information for batch acquisition and data
processing. Data review is efficient with flags indicating where there may be problems..
Conclusions
Ultra-high resolution accurate mass data from Orbitrap™
detectors provides the most reliable analysis of endogenous
metabolites and lipids
Component workflow decreases false positives due to chemical
background and redundant signals
Find the real differences in components across multiple sample
groups with SIEVE 2.0
MSn on hybrid Orbitraps and Mass Frontier 7.0 provide a complete
set of tools for structure elucidation
References1. D. A. Peake, J. Wang, P. Huang, A. Jochem, A. Higbee, D. J.
Pagliarini, Lipid Maps Annual Meeting, May 7-8, 2012, La Jolla,
California, USA
2. J. R. Bain, R. D. Stevens, B. R. Wenner, O. Ilkayeva, D. M. Muoio
and C. B. Newgard, Diabetes, 2009, 58, 2429-2443.
3. K Suhre and P Schmidt, MassTrix: Mass Translator Into Pathways,
Nucleic Acids Res, Vol. 36, Web Server Issue, W481-W484, 2008
Acknowledgements
We would like to thank Dr. Christopher Petucci from the Sanford-
Burnham Institute for supplying the ZDF rat data.
Introduction
Application of metabolomics to disease phenotype analysis and
identification of unique biomarkers to distinguish healthy individuals
compared to those with a disease has renewed the promise of
personalized medicine. We present here the application of a Thermo
Scientific benchtop quadrupole-Orbitrap mass spectrometer coupled to
a UHPLC and Thermo Scientific SIEVE software for several
metabolomics and lipidomics studies. The performance of the entire
analytical platform is illustrated with relevant examples including the
metabolomic analysis of lean and obese Zucker rat serum and
mitochondrial lipids in Yeast.
Methods
Sample Preparation
Metabolites were extracted from plasma with cold methanol and the
supernatant was removed, dried under nitrogen, and reconstituted with
80:20 water/methanol for LC/MS. Mitochondrial lipids were isolated
from wild-type (WT) yeast (S. cerevisiae) and a knockout (KO) strain
that does not produce coenzyme Q (CoQ), by extraction using
isopropanol (1).
Liquid Chromatography Mass Spectrometry
High-resolution accurate-mass full scan LC-MS and LC-MS/MS
analyses were performed with short UHPLC gradient at 70,000
resolving power on the Thermo Scientific Q Exactive mass
spectrometer in both positive and negative ion modes with
electrospray ionization source. MS-MS data was obtained at 35,000
resolution.
Data Analysis
All of the datasets were analyzed with the SIEVE™ 2.0 software with
the Component Extraction algorithm designed specifically for optimal
data analysis in untargeted metabolomics experiments. Components
that were significantly different between the sample groups were
detected and identified via local or online database search. MS/MS
data were then acquired and used to confirm the structure of these
components. Thermo Scientific Mass Frontier 7.0 RS1 software
provided spectral interpretation tools including MS/MS library search
and assigning structures to the fragment ions automatically in the
MS/MS spectrum. Thermo Scientific TraceFinder 2.1 software was
then used for streamlined targeted quantitative analysis.
Results
Analysis of the ZDF fatty rat serum compared to normal rat serum
served as a benchmarking study to determine the merits of the
technology platform. We observed an increase in acylcarnitines,
branched chain amino acids (2), phospholipids, fatty acids and
conjugated bile acids (P < 0.001) in fatty ZDF rat plasma relative to
normal ZDF rats (Table 1).
Preliminary analysis of yeast mitochondrial lipid extracts demonstrates
the ability to obtain statistically significant results with a single injection
of each biological replicate. The expected change in CoQ6 levels was
accompanied by changes in over 60 different components including
amino acids, acylglycerols, sterols, phospholipids and sphingolipids.
Mass Frontier is a trademark of High Chem Ltd. All other trademarks are the property of Thermo Fisher Scientific and its subsidiaries.
This information is not intended to encourage use of these products in any manners that might infringe the intellectual property rights of others.
FIGURE 1. Grouping of Adducts and Isotopes, m/z 169.0355, Uric Acid.Uric acid, identified by ChemSpider search, increased 3-fold in Obese vs. Normal rats.
Applying Q Exactive Benchtop Orbitrap LC-MS/MS and SIEVE Software for Cutting Edge
Metabolomics and Lipidomics Research
Michael Athanas, David A Peake, Mark Dreyer, Mark Sanders, Jessica Wang and Yingying Huang
Thermo Fisher Scientific, 355 River Oaks Parkway, San Jose, CA 95134, USA
FIGURE 8. Significant Metabolite Differences Found in WT vs. KO Yeast. Relative amounts of metabolites from KO Yeast (dark blue) vs. WT Yeast (light blue) increased
for sterols, ceramides and Co-Q9 whereas histidine, sphinganine and CoQ6 decreased in the
KO yeast.
FIGURE 5. ZDF Rat Metabolomics Data – Pathway Analysis (3)Annotated metabolites in Red were found from MW search using ChemSpider.
FIGURE 2. Workflow for Metabolomics and Lipidomics Experiments.
Component Component ExtractionExtraction
Pathway AnalysisPathway AnalysisLCLC--MSMS AnalysisAnalysis
AlignTotal Ion Current
Alignment
Detect Component Extraction
Identify Library search &
MS/MS confirmation
Features Components
FIGURE 4. LC-MS/MS of Kynurenine, m/z 209.1 from Rat Serum.
Mass Frontier software was used to annotate the accurately-measured fragment ions giving
excellent confirmation of the known structure from a single MS-MS scan.
AIM084_Plasma_pos_017_Target_35k_1 #133 RT: 2.39 AV: 1 NL: 4.19E5F: FTMS + p ESI Full ms2 [email protected] [50.00-230.00]
60 70 80 90 100 110 120 130 140 150 160 170 180 190 200 210
m/z
0
20000
40000
60000
80000
100000
120000
140000
160000
180000
200000
220000
240000
260000
280000
300000
320000
340000
360000
380000
400000
Re
lative
Ab
un
da
nce
94.0651
C 6 H8 N
-0.0141 ppm
146.0601
C 9 H8 O N
0.3332 ppm
136.0757
C 8 H10 O N
0.2857 ppm
174.0549
C 10 H8 O2 N
-0.0468 ppm
192.0655
C 10 H10 O3 N
-0.1509 ppm120.0444
C 7 H6 O N
0.1693 ppm
150.0550
C 8 H8 O2 N
0.4542 ppm74.0239
C 2 H4 O2 N
3.2468 ppm 118.0651
C 8 H8 N
-0.3344 ppm99.0077
C 4 H3 O3
-0.0298 ppm163.0865
C 9 H11 O N2
-0.4427 ppm84.9597
132.0446
C 8 H6 O N
1.5984 ppm
104.0495
C 7 H6 N
-0.1385 ppm
ON 2H N 2H
O
OH
O
OH
O N 2H
O
O N 2H
N 2H O N 2H
N 2HO
OH
N 2HO
O 2H N 2H
O N 2H
N 2H
NH
N 2H
N 2H
O
OH
N 2H
O
FIGURE 3. Principal Components Analysis of Lean vs. Obese
ZDF rat serum. The Principle Components Analysis (PCA) results shows that
the LCMS analysis of the two ZDF rat serum groups are clearly different.
Lean Obese
CSID Compound Name MW MZ Time Ratio p-Value
63798 Imidazole propionic acid 140.0585 141.0658 0.83 0.418 2.45E-04
757 Homocysteine 135.0352 136.0425 0.68 0.485 8.32E-04
6050 Valine 117.0792 118.0865 0.61 0.655 5.44E-06
718 Glutamine 146.0690 147.0762 0.59 0.688 1.58E-04
96904 Propionyl carnitine 217.1314 218.1387 1.90 0.768 8.31E-04
2006614 Carnitine 161.1050 162.1123 0.62 1.203 5.44E-05
969 Phenylalanine 165.0789 166.0861 2.65 1.273 1.69E-04
834 Leucine 131.0946 132.1019 1.54 1.448 1.40E-04
1142 Uric acid 168.0282 169.0355 0.93 1.656 1.34E-06
24766528 C18:3 Lyso PC 517.3170 518.3243 9.78 1.980 2.18E-04
1141 Uracil 112.0275 113.0348 0.86 2.015 2.49E-06
5858 Adenonsine monophosphate 347.0625 348.0698 0.83 2.377 1.30E-05
388877 Butyl carnitine 231.1469 232.1541 3.54 2.967 2.73E-06
9931788 C20:5 Lyso PC 541.3168 542.3240 9.69 4.368 7.88E-04
Table 1. Compounds Identified via ChemSpider Database Search. Metabolites that significantly decrease (red) or increase (green) in ZDF Obese vs.
Normal Rats (p < 0.001).
FIGURE 6. Chromatographic Alignment of Yeast Lipid Extract LC-MS Data
Ergosta-5,7,22,24(28)-tetraen-3β-ol
Co-Q6 (oxid.) Co-Q9 (oxid.)
d18:0/16:0 Ceramide
Sphinganine
p = 0.003
p = 0.028
p = 0.020
p = 0.021
p = 0.006
p = 0.024
Histidine
p = 0.003
FIGURE 7. MS-MS Identification of PE 34:2, m/z 714.51
Excellent mass measurement and ID from a single MS-MS scan.
NL: 6.35 E+4
RT: 12.90 #4260
714.51 [email protected]
+ESI Full MS2
12WTPost_1 #4260 RT: 12.90 AV: 1 NL: 6.35E4F: FTMS + p ESI Full ms2 [email protected] [100.00-745.00]
250 300 350 400 450 500 550
m/z
0
10
20
30
40
50
60
70
80
90
100
Rela
tive A
bundance
573.4886C 37 H 65 O 4
1.5877 ppm
306.2793C 20 H 36 O N
0.6077 ppm237.2211C 16 H 29 O
-0.9389 ppm280.2638
C 18 H 34 O N
0.9713 ppm
337.2744C 21 H 37 O 3
1.8724 ppm
263.271
C 18 H 31 O
0.4498 ppm311.2577
C 19 H 35 O
-1.3222 ppm
PE (16:1/18:2)18:2
16:1
(M+H) –141.0191