18btc107j bioprocess principles semester- iv year
TRANSCRIPT

18BTC107J BIOPROCESS PRINCIPLES
18BTC107J BIOPROCESS PRINCIPLES
SEMESTER- IV
YEAR:
NAME:
REG NO:
SCHOOL OF BIOENGINEERING
DEPARTMENT OF BIOTECHNOLOGY SRM INSTITUTE OF SCIENCE AND TECHNOLOGY
(Under Section 3 of UGC Act, 1956) S.R.M. NAGAR, KATTANKULATHUR- 603 203.
KANCHEEPURAM DISTRICT

18BTC107J BIOPROCESS PRINCIPLES
SRM INSTITUTE OF SCIENCE AND TECHNOLOGY
(Under Section 3 of UGC Act, 1956)
S.R.M. NAGAR, KATTANKULATHUR- 603 203. KANCHEEPURAM DISTRICT
BONAFIDE CERTIFICATE
Register No. Certified to be the bonafide record of work done by of
Biotechnology B.Tech. Degree course in the practical in
SRM Institute of Science and Technology, Kattankulathur during the academic
year .
Lab Incharge
Date: Head of the Department
Submitted by University Examination held in at SRM Institute of
Science and Technology, Kattankulathur.
Date: Examiner 1 Examiner 2

18BTC107J BIOPROCESS PRINCIPLES
INDEX
Name: Class:
Reg. No.: Branch: Exp. No.
Date of
Exp
Title of Experiment Page No.
Date of submis
sion
Marks Signature

18BTC107J BIOPROCESS PRINCIPLES
Experiment No: 1
Date:
TYPES OF FERMENTATION
Based on the modes of operation the fermentation process are classified as batch, continuous
and fed-batch fermentation
Batch fermentation
In batch fermentation, a closed system where an initial and limited amount of sterilized medium
is introduced into a fermenter. The nutrient medium is inoculated with the microorganism and kept
for incubation for a definite period under optimum conditions. Oxygen is provided in the form of
air and pH is controlled by acid, base or any antifoaming agent, are being added during
fermentation process. During fermentation a change in the composition of the culture medium
(biomass and metabolites) as the microbes undergo different phases of growth and metabolism.
The culture broth is harvested, separated and purified when the desired product is formed.
Batch fermentation are widely used in primary and secondary metabolites production under
definite culture conditions that supports the fastest growth rate and the maximum growth could be
utilized for the biomass production. In order to obtain optimum yield of primary metabolites,
prolongation of exponential growth phase is required whereas it should be reduced in case of
secondary metabolites.

18BTC107J BIOPROCESS PRINCIPLES
Batch Reactor: Volume – constant
Material Balance Equation: Input = Output + Accumulation + Utilization
Substrate Balance: Amount of substrate entering/unit time = Amt. of substrate leaving/unit time +
amount of substrate utilized + amount of substrate remaining in the reactor
The specific growth rate is generally found to be a function of three parameters,
• The concentration of growth limiting substrate, S (g/L)
• The maximum specific growth rate, 𝜇𝑚𝑎𝑥 (time-1)
• Substrate saturation constant, KS (g/L)
Monod Equation,
𝜇 =𝜇𝑚𝑎𝑥. 𝑆𝐾𝑠 + 𝑆
Where S (g/L)- concentration of the essential growth medium component, μ - specific growth rate hr-1,
μm- Maximum specific growth rate (hr-1) achievable when S>>KS, KS - Monod constant and is equal to
the concentration of the essential medium component at which the specific growth rate is half of its
maximum value (μm/2).
Batch time with respect to substrate, product and cell concentration,
𝑡! =1𝜇𝑚 𝑙𝑛 𝑙𝑛[1 +
𝑌"#𝑋$
(𝑆$ − 𝑆%)]
𝑡! =1𝜇𝑚 𝑙𝑛 𝑙𝑛[1 +
𝜇&𝑋$𝑞'
(𝑃% − 𝑃$)]
𝑡! =1𝜇𝑚 𝑙𝑛 𝑙𝑛[
𝑋%𝑋$]
tb- batch time (Time);
Yxs- Yield coefficient (g/g);
S0 & SF- Initial and final substrate concentration (g/L);
P0 &PF- Initial and final product concentration (g/L);
X0 &XF- Initial and final cell concentration (g/L);
qp- specific product formation rate (g/g/h)

18BTC107J BIOPROCESS PRINCIPLES
Continuous fermentation
A closed system of fermentation that operated for an indefinite period of time. Here fresh sterilized
nutrient medium is added intermittently or continuously and at the same time in order to recover cells
and fermented products, an equivalent amount of spend medium along with the microbes are withdrawn
either intermittently or continuously. As a result, concentration and volume of the nutrient medium is
optimally maintained in an automatic manner. However, continuous fermentation process lowers the
operating cost as it has high productivity with less down time. In this mode of operation, medium and
inoculum are initially added to the reactor and constant volume of the broth is maintained. This process
has been generally used for organic solvents, starter culture, antibiotics and single cell protein
production.
Continuous fermentation can be carried out in three ways as follows,
Single stage fermentation
In this process, the nutrient medium and culture are kept in continuous mode of operation by balancing
the input and the output of the harvested culture and the nutrient medium in a single fermenter.
Multiple stage fermentation
Two or more fermenters are operated simultaneously where growth phase and synthetic phase of the
fermentation process are being carried out in different fermenters. This process is more suitable for those
fermentation in which the different phases (growth and synthetic) of the microbes are not simultaneous.
Recycle fermentation
A portion of the nutrient medium is withdrawn and added back into the culture vessel. Therefore, the

18BTC107J BIOPROCESS PRINCIPLES
culture is recycled back into fermenter and this method is mainly carried out for hydrocarbon
fermentation process. Whereas recycling of cells provides increase in the cell population that result in
greater productivity of the desired product.
1) Turbidostat Method:
In this process, total cell count has been kept constant by measuring the turbidity of the microbial culture
during the fermentation process. Hence, the nutrient feed rate and the culture withdrawal rate can be
regulated. Those fermentation process which employs turbidostat, should be carried out at low cell
population that utilize the less amount of substrate and reduce the wastage of larger amount of substrate
that is being unused.
2) Chemostat method:
A constant value of nutrient feed rate and the withdrawal rate of harvest culture are maintained which is
achieved by controlled growth rate of microbial culture by adjusting the concentration of any chemical
compound used in the nutrient medium (oxygen, carbon and nitrogen source) that act as growth limiting
factor. Sometimes pH, temperature and the presence of toxic byproducts generated during fermentation
process also act as a growth limiting factor. This fermentation process is performed most often than the
turbidostat due to the presence of less amount of unused medium and fewer mechanical problems.
Turbidostat Model

18BTC107J BIOPROCESS PRINCIPLES
Chemostat
The flow of medium into the vessels is related to the volume of vessel by terms of dilution rate (D),
𝐷 = %( (time-1)
Where
F= Flow rate (m3/time)
V= volume (m3)
Residence time (R), reciprocal of dilution rate
𝜏 = 1𝐷(𝑇𝑖𝑚𝑒)
The net change in the cell concentration over time period is expressed as, 𝑑𝑥𝑑𝑡 = 𝜇" −𝐷"
At steady state, µ = 𝐷
Therefore, 𝐷 = )&*".-.#/-
S- steady state concentration of substrate in chemostat
𝑆′ = 𝐾#𝐷
𝜇&*" − 𝐷
The concentration of the cell in the chemostat at steady state can be related to yield coefficient as

18BTC107J BIOPROCESS PRINCIPLES
𝑋′ = 𝑌0/-(𝑆2 − 𝑆′)
Si- Initial substrate concentration (g/L)
S’ – steady state substrate concentration (g/L)
Y – Yield coefficient (g/g)
X’- Steady state cell concentration (g/L)
Fed batch fermentation
A modified form of batch fermentation process where substrate is periodically added in regular intervals
as the fermentation process progress. Hence, an optimal concentration of the substrate is maintained.
This process is essential for those fermentation processes where the secondary metabolites are being
subjected to catabolic repression by the presence of high nitrogen, carbohydrates or glucose
concentration in the nutrient medium. The critical elements of the medium are provided in lesser amount
during the start of the fermentation process while during the production phase the substrate are being
added in small amount. This process is mostly widely employed for the penicillin production. Fixed,
variable and cyclic were the three types of fed batch fermentation process.
Based on the process requirements the fermentation are classified as aerobic and anaerobic fermentation
Time of the fed batch cell biomass weight in fed batch reactor at a given time t,
𝑋3 = 𝑋$ +(𝑌"#𝑆2𝐹)𝑡4!
Xt – Cell concentration at given time‘t’ (g/L);
X0 – Cell concentration at initial time (g/L);
Yxs – Yield coefficient (g/g)

18BTC107J BIOPROCESS PRINCIPLES
Si - Initial substrate concentration (g/L)
F- Flow rate (m3/ time)
tfb – Time for fed-batch cycle (time)
Aerobic fermentation
Aerobic fermentation is carried out in the presence of oxygen. Most of products of human utility are
generally produced by this type of fermentation.
Aerobic fermenter
Anaerobic fermentation
Fermentation carried out in the absence of oxygen and the anaerobic microbes are of two types, obligate
and facultative anaerobes. For example, the Clostridium sp., remain active only in the absence of oxygen
or cannot withstand oxygen for optimum production of the desired product. Similarly, lactic acid bacteria
are facultative anaerobes that are able to remain active in the presence of small amount of oxygen.
However, in case of yeast an initial aeration is required for building the high cell yield before creating
an anaerobic condition.
In this fermentation process, anaerobic condition is created by pumping the inert gases like nitrogen,
argon and removing the oxygen present in the head space of the fermenter or by the emergence of certain
gases like hydrogen and carbon dioxide. Sometimes soon after the sterilization, the nutrient medium is
inoculated at the bottom of the fermenter and also stationary/viscous medium also used for creating the
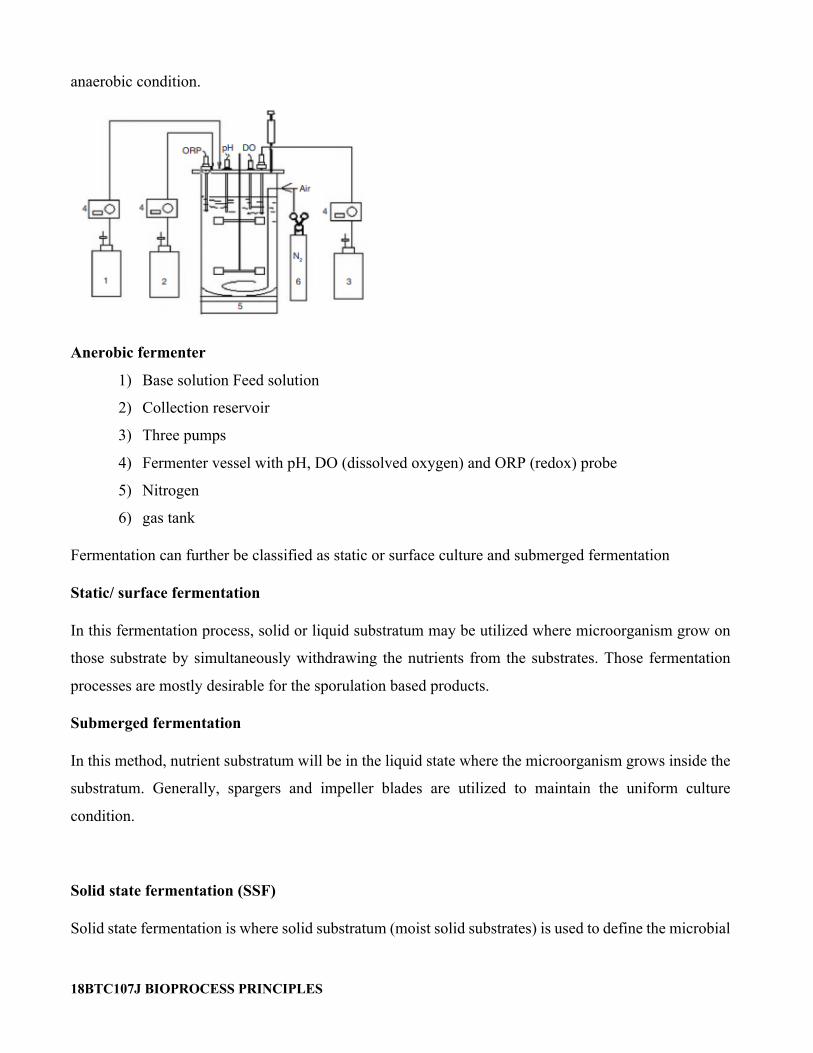
18BTC107J BIOPROCESS PRINCIPLES
anaerobic condition.
Anerobic fermenter
1) Base solution Feed solution
2) Collection reservoir
3) Three pumps
4) Fermenter vessel with pH, DO (dissolved oxygen) and ORP (redox) probe
5) Nitrogen
6) gas tank
Fermentation can further be classified as static or surface culture and submerged fermentation
Static/ surface fermentation
In this fermentation process, solid or liquid substratum may be utilized where microorganism grow on
those substrate by simultaneously withdrawing the nutrients from the substrates. Those fermentation
processes are mostly desirable for the sporulation based products.
Submerged fermentation
In this method, nutrient substratum will be in the liquid state where the microorganism grows inside the
substratum. Generally, spargers and impeller blades are utilized to maintain the uniform culture
condition.
Solid state fermentation (SSF)
Solid state fermentation is where solid substratum (moist solid substrates) is used to define the microbial

18BTC107J BIOPROCESS PRINCIPLES
growth in the absence or near absence of free water. Recently, SSF has shown much promising
development in the several bioprocess products.
Significance of the experiment:
Critical thinking:
1) If you want to obtain the secondary metabolite from a microbial metabolism which type of fermenter
operation you opt?
2) For production low value high volume product which fermenter would be more suited?
3) Which geometry of the fermenter is suitable and efficient for aerobic process? Tall and narrow? Short and
shallow? Justify the answer.

18BTC107J BIOPROCESS PRINCIPLES
Experiment No: 2&3
Date:
BIOREACTOR OPERATION
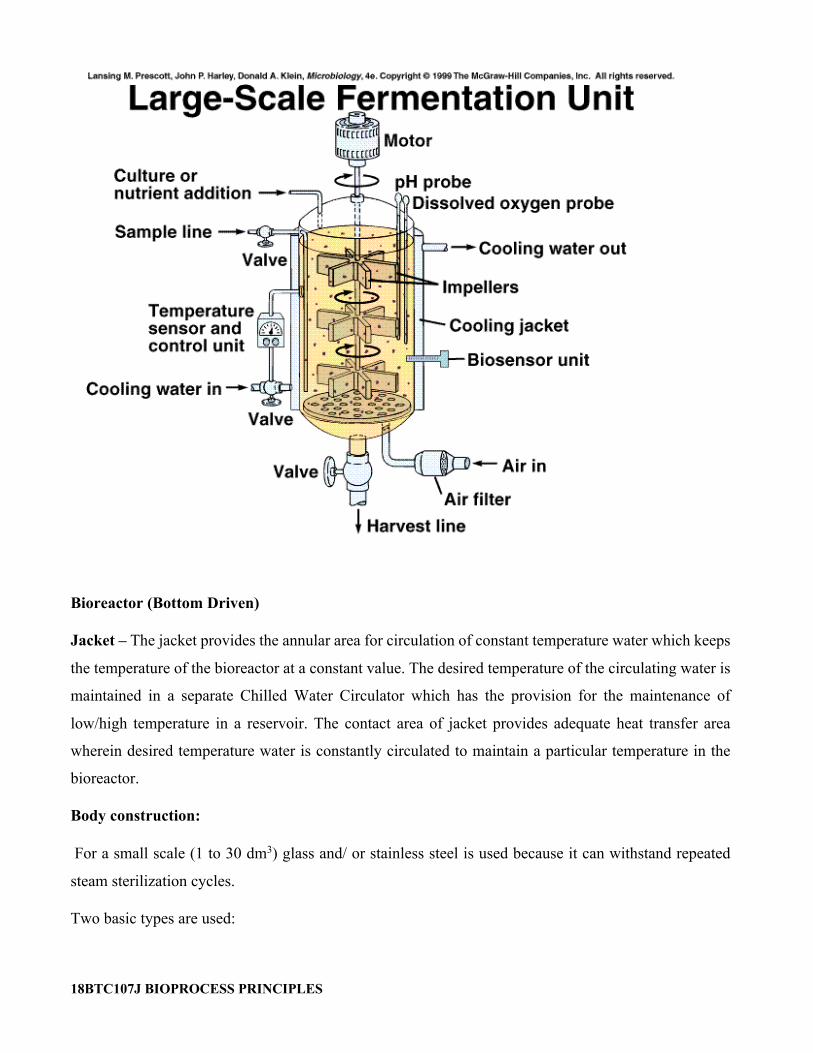
Aim: To study the design, construction and control systems of a bioreactor.
Principle:
A bioreactor is a device in which a substrate of low value is utilized by living cells or enzymes to generate
a product of higher value. Bioreactors are extensively used for food processing, fermentation, waste
treatment, etc. On the basis of the agent used, bioreactors are grouped into the following two broad
classes: (i) those based on living cells and, (ii) those employing enzymes. But in terms of process
requirements, they are of the following types: (i) aerobic, (ii) anaerobic, (iii) solid state, and (iv)
immobilized cell bioreactors.
All bioreactors deal with heterogeneous systems dealing with two or more phases, e.g., liquid, gas, solid.
Therefore, optimal conditions for fermentation necessitate efficient transfer of mass, heat and
momentum from one phase to the other. Chemical engineering principles are employed for design and
operation of bioreactors. But, in general, theoretical explanation usually lags behind technical
realization.
A bioreactor should provide for the following: (i) agitation (for mixing of cells and medium), (ii) aeration
(aerobic fermenters; for O2 supply), (iii) regulation of factors like temperature, pH, pressure, aeration,
nutrient feeding, liquid level, etc., (iv) sterilization and maintenance of sterility, and (v) withdrawal of
cells/medium (for continuous fermenters). Modern fermenters are usually integrated with computers for
efficient process monitoring, data acquisition, etc.
Basic Functions of a Fermenter:
1. It should provide a controlled environment for optimum biomass/product yields.
2. It should permit aseptic fermentation for a number of days reliably and dependably, and meet the

18BTC107J BIOPROCESS PRINCIPLES
requirements of containment regulations. Containment involves prevention of escape of viable cells from
a fermenter or downstream processing equipment into the environment.
3. It should provide adequate mixing and aeration for optimum growth and production, without
damaging the microorganisms/cells. The above two points (items 2 and 3) are perhaps the most important
of all.
4. The power consumption should be minimum.
5. It should provide easy and dependable temperature control.
6. Facility for sampling should be provided.
7. It should have a system for monitoring and regulating pH of the fermentation broth.
8. Evaporation losses should be as low as possible.
9. It should require a minimum of labour in maintenance, cleaning, operating and harvesting operations.
10. It should be suitable for a range of fermentation processes. But this range may often be restricted by
the containment regulations.
11. It should have smooth internal surfaces, and joints should be welded wherever possible.
12. The pilot scale and production stage fermenters should have similar geometry to facilitate scale-up.
13. It should be contrasted using the cheapest materials that afford satisfactory results.
Key parts of the bioreactor:
Agitator – This facilitates the mixing of the contents of the reactor which eventually keeps the “cells” in
the perfect homogenous condition for better transport of nutrients and oxygen for adequate metabolism
of cell to the desired product(s).
The agitator can be top driven or bottom which could be basically magnetic / mechanically driven. The
bottom driven magnetic /mechanical agitators are preferred as opposed to top driven agitators as it saves
adequate space on the top of the vessel for insertion of essential probes (Temperature, pH, dissolved
oxygen foam, CO2 etc) or inlet ports for acid, alkali, foam, fresh media inlet /exit gases etc. However
mechanical driven bottom impellers need high quality mechanical seals to prevent leakage of the broth.
Types of agitators:

18BTC107J BIOPROCESS PRINCIPLES
Disc turbine
Open turbines of variable patch.
Propellers
Baffle – The purpose of the baffle in the reactor is to break the vortex formation in the vessel, which is
usually highly undesirable as it changes the centre of gravity of the system and consumes additional
power.
• Baffles are metal stripes roughly 1/10th of the vessel diameter and are attached radially to the wall.
• Normally 4 baffles are used, but in vessel over 3 dm3 diameter 6-8 baffles may be used.
Sparger – In aerobic cultivation process thepurpose of the sparger is to supply oxygen to the growing
cells. Bubbling of air through the sparger not only provide the adequate oxygen to the growing cells but
also helps in the mixing of the reactor contents thereby reducing the power consumed to achieve a
particular level of (mixing) homogeneity in the culture.
Three basic types of sparger are used:
Porous sparger.
Orifice sparger.
Nozzle sparger
18BTC107J BIOPROCESS PRINCIPLES
Bioreactor (Bottom Driven)
Jacket – The jacket provides the annular area for circulation of constant temperature water which keeps
the temperature of the bioreactor at a constant value. The desired temperature of the circulating water is
maintained in a separate Chilled Water Circulator which has the provision for the maintenance of
low/high temperature in a reservoir. The contact area of jacket provides adequate heat transfer area
wherein desired temperature water is constantly circulated to maintain a particular temperature in the
bioreactor.
Body construction:
For a small scale (1 to 30 dm3) glass and/ or stainless steel is used because it can withstand repeated
steam sterilization cycles.
Two basic types are used:
18BTC107J BIOPROCESS PRINCIPLES
A glass vessel with a round or flat bottom and top flanged carrying plates.
A glass cylinder with stainless steel top and bottom plates. This bioreactor may be sterilized in situ.
(AISI graded steel are now commonly used in bioreactor construction).
Peripheral parts:
Reagent pumps
Pumps are normally part of the instrumentation system for pH and antifoam control.
Peristaltic pumps are used and flow rate is usually fixed with a timed shot and delay feed system of
control.
Medium feed pumps
and reservoir bottles
Medium feed pumps are often variable speed to give the maximum possible range of feed rates. The
reservoir bottles are usually larger, but are prepared in the same as normal reagent bottles.
Rotameter
A variable area flow meter indicates the rate of gas flow into a bioreactor. A pressure regulator valve
before the rotameter ensures safe operation.
Stirrer glands and bearings:
These are used for the sealing of the stirrer shaft assembly and can be operated aseptically for a long
duration. Four basic types of seal assembly have been used,
The stuffing box (packed gland seal)
The simple bush seal
The mechanical seal
Magnetic drive.
Basic control systems for the operation of the bioreactor are described below:
Temperature Measurement and control – The measurement of the temperature of the bioreactor is
done by a thermocouple or Pt -100 sensor which essentially sends the signal to the Temperature

18BTC107J BIOPROCESS PRINCIPLES
controller. The set point is entered in the controller which then compares the set point with the measured
value and depending on the error, either the heating or cooling finger of the bioreactor is activated to
slowly decrease the error and essentially bring the measured temperature value close to the set point.
pH measurement and control – The measurement of pH in the bioreactor is done by the autoclavable
pH probe. The measured signal is compared with the set point in the controller unit which then activates
the acid or alkali to bring the measured value close to the set point. However, before the pH probe is
used, it needs to be calibrated with two buffers usually in the pH range which is to be used in the
bioreactor cultivation experiment. The probe is first inserted in (let us say) pH 4 buffer and the measured
value is corrected by the zero knob of the controller. Thereafter the probe is put in pH 7 buffer and if
needed the measured value is corrected by the asymmetry knob of the controller. The pH probe is now
ready for use in the range 0-7 pH range.
Dissolved oxygen controller – The dissolved oxygen in the bioreactor broth is measured by a dissolved
oxygen probe which basically generates some potential corresponding to the dissolved oxygen diffused
in the probe. Before the measurement can be done by the probe it is to be calibrated for its zero and
hundred percent values. The zero of the probe is set by (zero knob) the measured value of the dissolved
oxygen when the broth is saturated with nitrogen purging. Similarly the hundred percent of the
instrument is calibrated by the measured value of dissolved oxygen when broth is saturated with purging
air in it. After calibration the instrument is ready for the measurement of the dissolved oxygen in the
broth. In the event of low oxygen in the fermentation broth, more oxygen can be purged in the bioreactor
&/or stirrer speed can be increased to enhance the beating of the bubbles which essentially enhances the
oxygen transfer area and net availability of oxygen in the fermentation broth.
Foam control – The fermentation broth contains a number of organic compounds and the broth is
vigorously agitated to keep the cells in suspension and ensure efficient nutrient transfer from the
dissolved nutrients and oxygen. This invariably gives rise to lot of foam. It is essential that control of
the foam is done as soon as possible.
Speed control- Speed control relies on the feedback from tachometer located with drive motor
determining the power delivered by the speed controller to maintain the speed set point valve set by the
user. A digital display shows the actual speed in rpm, as determined by the tachometer signals.
Table 1: Measurements of various parameters in a bioreactor

18BTC107J BIOPROCESS PRINCIPLES
Measurements
Methods Remarks
Agitator speed Frequency counter tacho generator More precise less reliable.
Agitator power Torque sensor. Electrical power.
Difficult. Recommended.
Temperature Resistance Thermometer Thermistor Thermocouple
Probably best Fragile Satisfactory Not recommended
Flow rate Rota meter Orifice meter Thermal mass flow meter
Satisfactory Less accurate Set-point control
Dissolved oxygen Galvanic probe Polarographic probe
Widely used Widely used
pH pH electrode Widely used
Foam Conductivity probe Widely used
Redox Redox electrode Empirical valve
Turbidity Turbidity sensor Complex
Liquid feed rate Peristaltic pump Syringe pump Magnet flow meter
Widely used Limited capacity Large
Pressure Pressure transducer Satisfactory
Significance of the experiment:
Critical thinking:
When do you expect an uncontrolled foam formation during fermentation?
Is virus a contaminant during fermentation? If so in which type of culture you would expect its
contamination?
Enlist the components of fermenter required for efficient aeration? Justify its purpose.

18BTC107J BIOPROCESS PRINCIPLES
Experiment No: 4
Date:
ESTIMATION OF GLUCOSE BY DINITRO SALICYLIC ACID (DNS) ASSAY
METHOD
Aim :
To estimate the concentration of Glucose by DNS method
Principle: The DNS method for estimating the concentration of reducing sugars in a sample was originally invented
by G. Miller in 1959. Reducing sugars have the property to reduce many of the reagents. A reducing sugar
is one that in a basic solution forms an aldehyde or ketone.
This method tests for the presence of free carbonyl group in reducing sugars. This involves the oxidation
of the aldehyde functional group present in glucose. Simultaneously, 3, 5-dinitrosalicylic acid (DNS) is
reduced to 3-amino, 5-nitrosalicylic acid under alkaline conditions:
Oxidation
Aldehyde group ------------------ > carboxyl group
Reduction
3, 5-dinitrosalicylic acid ------------------------------------- > 3-amino, 5-nitrosalicylic acid

18BTC107J BIOPROCESS PRINCIPLES
Because dissolved oxygen can interfere with glucose oxidation, sulfite, which itself is not necessary for the color
reaction, is added in the reagent to absorb the dissolved oxygen. The above reaction scheme shows that one mole
of sugar will react with one mole of 3, 5-dinitrosalicylic acid. However, it is suspected that there are many side
reactions, and the actual reaction is more complicated than that previously described. The type of side reaction
depends on the exact nature of the reducing sugars. Different reducing sugars generally yield different color
intensities; thus, it is necessary to calibrate for each sugar. In addition to the oxidation of the carbonyl groups in
the sugar, other side reactions such as the decomposition of sugar also competes for the availability of 3,5-
dinitrosalicylic acid. The absorbance measured using a spectrophotometer is directly proportional to the amount
of reducing sugar.
The chemistry of the reaction is complicated since standard curves do not always go through the origin and
different sugars give different color yields. The method is therefore not suitable for the determination of a complex
mixture of reducing sugar.
List of reagents required: Glucose stock solution (1 mg /ml of deoionized water)
Dinitrosalicylic Acid Reagent Solution
Dinitrosalicylic acid: 10 g
Sodium sulfite: 0.5 g
Sodium hydroxide: 10 g
Potassium sodium tartrate solution, 40%
Deionized water : 1 lit
Procedure: • Prepare glucose standards ranging from 0.1 to 1 ml by using dry clean and labelled test tubes
(Refer table)
• Make it up to 1 ml with deionized water
• 1 ml of deionized water alone serves as a blank
• Add 3 ml of Dinitro Salicylic Acid reagent to all the test tubes
• Place all the test tubes in water bath at 90º C for 10-15 minutes to develop red- brown color
• Add 1 ml of 40% potassium sodium tartrate (Rochelle salt) solution to all the test tubes
• Cool the test tubes thoroughly and read the extinction (Optical density) of the colored solutions

18BTC107J BIOPROCESS PRINCIPLES
at 540 nm using the solution in tube 1 as a blank (control).
(Note: All the tubes must be cooled to room temperature before reading since the extinction is sensitive
to temperature change)
Plot the standardcurve of the absorbance (Y- axis) against the glucose concentration(mg/ml) ( X-
axis)
Tabulation:
S.No
Vol. of
standard solution
(ml)
Conc. Of standard solution
(mg/ml)
Vol. of Distilled
water
(ml)
Vol. of DNS
reagent
(ml)
Incubate the tubes at 90ºC for 10
- 15
minutes.
Vol. of 1%Na-K Tartrate
(ml)
O.D at 540 nm
1
Blank
-
1
1
1
2 0.1 0.9 1 1 3
0.2
0.8 1
1
4 0.3 0.7 1 1 5 0.4 0.6 1 1 6 0.5 0.5 1 1 7
0.6
0.4 1
1
8
0.7
0.3
1 1
9 0.8 0.2 1 1
10
0.9
0.1 1
1
11
1.0
0
1 1
Result and Interpretation:
Graph: Concentration of Glucose (mg/ml) vs Optical Density (@540 nm)
Significance of the experiment:

18BTC107J BIOPROCESS PRINCIPLES
Experiment No: 5 & 6
Date:
MEDIA OPTIMIZATION BY PLACKETT AND BURMAN
Aim To optimize the concentration and composition of various nutrients in the media using the Plackett and
Burman method
Theory Detailed investigation is needed to establish the most suitable medium for an individual fermentation
process, but certain basic requirements must be met by any such medium. All micro-organisms require
water, sources of energy, carbon, nitrogen, minerals elements and possibly vitamins plus oxygen (if
aerobic). On a small scale it is relatively simple to devise a medium containing pure compounds, but
the resulting medium, although supporting satisfactorily growth may be unsuitable for use in a large
scale process. On a large scale one must normally use sources of nutrients to create a medium which
will meet as many possible of the following criteria:
It will produce the maximum yield of product or biomass per gram of substrate used.
It will produce the maximum concentration of product or biomass.
It will permit the maximum rate of product formation.
There will be the minimum yield of undesired products.
It will be of consistent quality and be readily available throughout the year.
It will cause minimal problems during media making and sterilization.
It will cause minimal problem in other aspects of the production process particularly aeration and
agitation, extraction, purification and waste treatment.
Medium optimization by the classical method of changing one independent variable (nutrient,
antifoam, pH, temperature etc.) while fixing all the other at a certain level can be extremely time

18BTC107J BIOPROCESS PRINCIPLES
consuming and expensive for a large number of variables. To make a full factorial search which
will examine each possible combination of independent variable at appropriate levels will require
a large number of experiments Xⁿ, where X is the number of levels and n is the number of variables.
This may be quite approximate for the three nutrients at two concentrations (2" trails) but not for
six nutrients at three concentrations, in this instance 3' (729) trials would be needed. Industrially
the aim is to perform minimum number of experiments to determine optimal conditions. Other
alternative strategies must be considered which allow more than one variable to be changed at a
time.
When more than one variable are to be investigated, the Plackett-Burman design may be used to
find the most important variable in the systems, which are then optimized in further studies,
(Plackett and Burman, 1946). These authors gave a series of design for up to hundred experiments
using an experimental rationale known as balanced incomplete blocks. This technique allows all
the evaluation of X – 1 variable by X experiments. X must be a multiple of 4, e.g. 8, 12, 16, 20,
24, etc. Normally one determines how many experimental variables needed to be included in an
investigation and then selects the Plackett-Burman design which meets the requirements in most
closely in a multiple of 4. Any factors not assigned to variable can be designated as a dummy
variable. Alternatively, factors known to have no effect may be included and designated as dummy
variables. The incorporation of dummy variables into an experiment makes it possible to estimate
the variance of an effect (experimental error).
Table -1 show a Plackett-Burman design for seven variables (A-G) at high and low levels in which
two factors, E and G, are designed as dummy variables. These can be used in design to obtain an
estimate of error. However, more can be studied if fewer real variables need to be studied in an
investigation (Stowe and Mayer, 1966). Each horizontal represents a trail and each vertical column
represents an L (low) and H (high) values of one variable in all the trails. This design (Table)
requires that the frequency of each level of a variable in a given column should be equal. Consider
the variable A; for the trials in which A is high, B is high in two of the trials and low in the other
two. Similarly, C will be high in the either two trials and low in the two as will all the remaining
variables. For those trials in which A is low B will be high two times and low two times. This will
also apply to all the other variables.

18BTC107J BIOPROCESS PRINCIPLES
Plackett-Burman design for seven variables
Tria
l
Variables
A B C D E F G
1 H H H L H L L
2 L H H H L H L
3 L L H H H L H
4 H L L H H H L
5 L H L L H H H
6 H L H L L H H
7 H H L H L L H
8 L L L L L L L
H denotes a high level value; L denotes a low level value
Thus, the effects of changing the other variables cancel out when determining the effect of A. The
same logic then applies to each variable. However, no changes are made to the high and low values
for the E and G columns. Gresham and Inamine (1986) state that although the difference between
the levels of each variable must be large enough to ensure that the optimum response will be
included, caution must be taken when setting the level differential for sensitive variables, since a
differential that is too large could mask the other variables. These trails are carried out in a
randomized sequence.
The effects of the dummy variables are calculated in the same way as the effects of the
experimental variables. If there are no interactions and no error in measuring the response, the
effect shown by a dummy variable should be 0. If the effect is not equal to 0, it is assumed to be a
measure of lack of experimental precision plus any analytical error in measuring the response
(Stowe and Mayer, 1966).
The stages in analyzing the data (Table 1 and 2) using Nelson’s (1982) example are as follows:
18BTC107J BIOPROCESS PRINCIPLES
Determine the difference between the average of H (high) and L (low) responses for each
independent and dummy variable.
Therefore the difference = ∑ A (H) - ∑ A (L)
The effect of an independent variable on the response is the difference between the average
response for the four experiments at the high level and the average value for the four experiments
at the low levels.
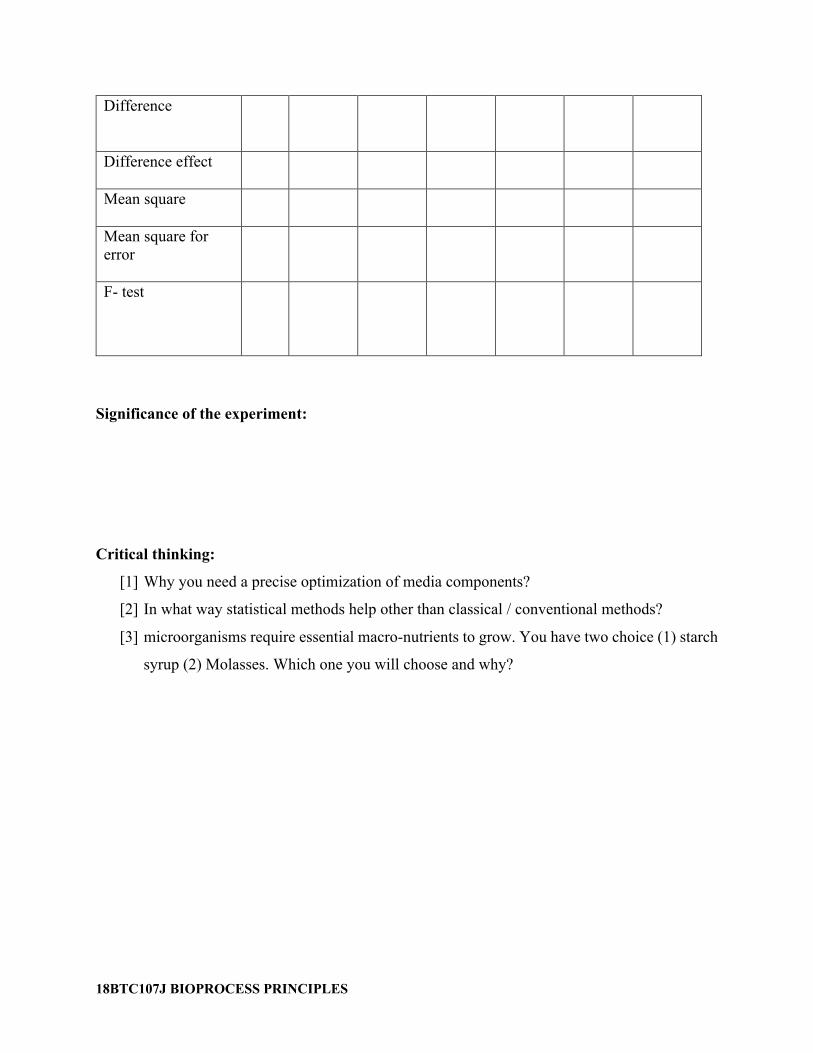
Analysis of the yield shown in Plackett-Burman Table
∑ (H)
∑ (L)
Difference effect
Mean square
Mean square for error
F- Test
Thus the effect of
𝐴4 =
∑ 𝐴(𝐻) − ∑ 𝐴(𝐿)4 =
2∑ 𝐴(𝐻) − ∑ 𝐴(𝐿)8
This value should be near zero for the dummy variables.
Estimate the mean square of each variable (the variance of effect).
𝐹𝑜𝑟𝐴𝑡ℎ𝑒𝑚𝑒𝑎𝑛𝑠𝑞𝑢𝑎𝑟𝑒𝑤𝑖𝑙𝑙𝑏𝑒 =O∑ 𝐴(𝐻) − ∑ 𝐴(𝐿)P
5
8
The experimental error can be calculated by averaging the mean square of the dummy
effects of E and G.
𝑚𝑒𝑎𝑛𝑠𝑞𝑢𝑎𝑟𝑒𝑓𝑜𝑟𝑒𝑟𝑟𝑜𝑟 =∑ (𝑚𝑒𝑎𝑛𝑠𝑞𝑢𝑎𝑟𝑒𝑜𝑓𝑑𝑢𝑚𝑚𝑦𝑣𝑎𝑟𝑖𝑎𝑏𝑙𝑒𝑠)
𝑁𝑢𝑚𝑏𝑒𝑟𝑜𝑓𝑑𝑢𝑚𝑚𝑦𝑣𝑎𝑟𝑖𝑎𝑏𝑙𝑒𝑠

18BTC107J BIOPROCESS PRINCIPLES
The final stage is to identify the factors which are showing large effects. This is done using a
F-Test which is given by :
Factor mean square
Error mean square
The factor which is having highest F-Test value is identified as the most important factor.
If dummy variable is zero consider Error mean square value as one
PROCEDURE
Prepare the medium according to the Plackett-Burman design for each trial of appropriate high
and low concentrations.
Medium variables Low (L) g/l High (H) g/l
A. Glucose 0.5 4.0
B. Fructose 0.5 4.0
C. Glycine 0.1 1.0
D. Xylose 0.5 4.0
E. Sucrose 0.5 4.0
F. Yeast extract 0.01 1.0
G. Casamino acid 0.05 0.5
Ammonium Chloride 2.0
KH2PO4 3.0
MgSO4 (IM) 1 ml
Medium was inoculated with 1 ml of E. coli in each medium.
Zero time optical density reading was noted.
The culture was incubated in 37ºC in a shaker.

18BTC107J BIOPROCESS PRINCIPLES
Optical density was measured at regular time intervals and recorded.
The highest optical density reading was taken as its response.
RESULT:
1. The optimized concentration of the media was found to be in ______________
2. The component___________ influences the production of biomass.
TABLE 2: PLACKETT-BURMAN RESPONSE TABLE
Trial A B C D E F G Response(OD
) at 540 nm
1 H H H L H L L
2 L H H H L H L
3 L L H H H L H
4 H L L H H H L
5 L H L L H H H
6 H L H L L H H
7 H H L H L L H
8 L L L L L L L
TABLE 3: ANALYSIS OF YIELD SHOWN IN TABLE 2.
variables calculated values
A
B C D E F G
∑H
∑L
18BTC107J BIOPROCESS PRINCIPLES
Difference
Difference effect
Mean square
Mean square for error
F- test
Significance of the experiment:
Critical thinking:
[1] Why you need a precise optimization of media components?
[2] In what way statistical methods help other than classical / conventional methods?
[3] microorganisms require essential macro-nutrients to grow. You have two choice (1) starch
syrup (2) Molasses. Which one you will choose and why?

18BTC107J BIOPROCESS PRINCIPLES
Experiment No: 7
Date:
BATCH HEAT STERILIZATION AND THERMAL DEATH KINETICS
Aim
To study the sterilization kinetics of the given sample of microorganism and determine the holding
time at 121°C for the medium.
Introduction
A fermentation product is produced by the culture of a certain organism, or organisms, in a
nutrient medium. If a foreign microorganism invades the fermentation, the following
consequences may occur.
i.The medium would have to support the growth of both the production organism and the
contaminant, thus resulting in a loss of productivity,
ii.If the fermentation is a continuous one then the contaminant may 'outgrow' theproduction organism
and displace it from the fermentation,
iii.The foreign organism may contaminate the final product, e.g., single-cell proteinwhere the cells,
separated from the broth, constitute the product,
iv.The contaminant may produce products which make subsequent extraction of thefinal product is
difficult.
v.The contaminant may degrade the desired product,
vi.Contamination of a bacterial fermentation with phage could result in lysis of the culture.
Avoidance of contamination may be achieved by
i.Using pure inoculums to start the fermentation.
ii.Sterilizing the medium and the fermentor vessel, and all the materials employed in the process.

18BTC107J BIOPROCESS PRINCIPLES
iii.Maintaining aseptic conditions during the fermentation.
Liquid medium is most commonly sterilized in batch in the vessel where it will be used. The liquid
is heated to sterilization temperature by introducing steam into the coils or the jacket of the vessel;
alternatively, steam is bubbled into the medium or the vessel is heated electrically. If direct steam
injection is used allowance must be made for dilution of the medium by condensate which typically
adds 10-20% to the liquid volume; quality of the steam just also is high to avoid contamination of
the medium by metal ions or organics.
Depending upon the rate of heat transfer from the steam or electrical element, raising the
temperature of the medium in large fermentors can take a significant period or time. Once the
holding or sterilization temperature is reached the temperature is held constant for a period of time
thd. Cooling water in the coils or jacket of the fermentor is then used to reduce the medium
temperature to the required value.
For operation of batch sterilization also destroys nutrients in the medium. To minimize this loss,
holding times at the sterilization temperature must be kept as short as possible. Cell death occurs
at all time during batch sterilization, including heating up and cooling down periods. The holding
time thd can be minimized by taking into account cell death during these periods
KINETICS OF CELL DEATH:
The destruction of microorganisms by steam is described as a first order chemical reaction and
represented by the equation and represented by the equation,
-dN/dt = KN………….(1)
Where, N= Number of viable organism
t = time of sterilization treatment
K = reaction rate constant of the reaction or specific death rate
∫ -dN/dt = ∫ KN
Upon rearragement and differentiating with time limit of t=0 and ‘t’ h,
∫ -dN/N = ∫ K . dt
Nt/No = e-Kt
Where,

18BTC107J BIOPROCESS PRINCIPLES
No = Number of viable organisms present at the start of sterilization treatment,
Nt = Number of viable organisms present after the treatment period, t.
K = Kd (specific death rate constant) (Time-1)
On taking natural logarithm of equation,
ln (Nt/No) = -Kt………….(2)
Specific Death Rate
In the first order reaction the reaction rate increases with increase in temperature due to increase
in the reaction rate constant, which in the case of destruction of microorganism is the specific death
rate (K).
Relation between temperature and reaction rate constant is given by Arrhenius equation:
∫ d ln K/dt = E / RT2
K = A e -E/RT .................(3)
Where, E = Activation energy (cal⋅mol−1)
R = gas constant (cal⋅mol−1⋅K−1)
T= absolute temperature (K)
A = Arrhenius constant
The term ln(No/Nt) is called as Del factor or Nabla factor and the sterilization criterion is
represented by the term ∆.
Del factor:
It is a measure of fractional reduction in viable organism count produced by certain heat and time
regime.
∆ = ln(No/Nt) = A*t*e (-E/RT)
ln(No/Nt) = A*t*e (-E/RT)
∆ = A*t*e (-E/RT)

18BTC107J BIOPROCESS PRINCIPLES
𝑡!" =𝑙𝑛 𝑁0𝑁𝑡𝐾
K = Kd (specific death rate constant)
thd – hold time (time)
No – initial number of cells
Nt – number of cells at time ‘t’
PROCEDURE
The batch fermentor was filled with 7L distilled water.
Then the temperature was raised from 300C onwards. Increase in temperature per minute was noted
till it reaches 1210C.
The exhaust valve was closed at 950C.
At 1210C, the outlet valve was opened to drawn out the condensed water so as to prevent from any
contamination.
After 20 minutes, the cooling process was started (i.e.) temperature cooling down from 1210C to
300C. Then the decrease in temperature per minute was noted.
The graph was plotted between Temperature vs. Time and the holding time was calculated.
RESULT:
The holding time for the medium at 121oC was found to be ________
TABLE 1: STERILIZATION KINETICS
S.no Time (min) Temperature
(˚C)
Temperature
(K)
k(1/min)
1
2

18BTC107J BIOPROCESS PRINCIPLES
3
4
5
6
7
8
9
10
11
12
13
14
15
16
17
18
19
20
21
22
23

18BTC107J BIOPROCESS PRINCIPLES
TABLE 2: HEATING PERIOD DETERMINATION
Time
interval
Heating
temperature
(K)
Heating
Ae-Ed/RT
COOLING
TEMPERATURE
(K)
COOLING
Ae-Ed/RT
Significance of the experiment:
Critical thinking questions
[1] Whether excessive sterilization of nutrient media has critical effect on fermentation
process?
[2] How will you sterilize the thermally unstable compounds?
[3] Calculate the time required to kill 99% of spores present in the sample at 100 °C. Provided
specific death rate is 0.23 min-1 and it follows the first order kinetics.
[4] If pasteurization is also a kind of sterilization technique why it is not heated to 121 °C
rather it is heated at ~63 for 30 °C min

18BTC107J BIOPROCESS PRINCIPLES
Experiment No: 8-10
Date:
BATCH GROWTH KINETICS OF BACTERIA
Aim
To study the growth of E.coli strain (bacteria) in batch culture using Glucose yeast extract medium
and to find the specific growth rate and yield coefficient.
Principle
Batch culture systems represent growth in a closed system. This can either use a flask or fermentor
containing a suitable growth supporting medium operated under optimum conditions of
temperature, pH and redox potential, which is inoculated with the cells grown until some essential
component of the medium is exhausted or the environment changes because of the accumulation
of a toxic product, pH change etc. In general microbial growth is determined by cell dry weight
measurement. The growth curve can be divided into three phases:
Lag phase: During this period the cell adapts to the new environment by
synthesizing necessary enzymes for the utilization of available substrates.
Exponential phase: The cell constituents in this phase increase at a constant rate
so that the cell population doubles and continues to double at regular intervals.
Stationary phase: In this phase, cell death occurs because of depletion of
essential the rate of growth, hence there is no net growth or increase in cell
number. This is followed by a death phase.

18BTC107J BIOPROCESS PRINCIPLES
The growth rate typically changes in a hyperbolic fashion, if the concentration of the essential
medium component is varied while the concentration of the other medium components are kept
constant and it follows the Monod growth kinetics.
𝜇 =𝜇𝑚𝑎𝑥. 𝑆𝐾𝑠 + 𝑆
Where S (g/L)- concentration of the essential medium component, μ - specific growth rate hr-1,
μMax- Maximum specific growth rate achievable when S>>KS, KS - Monod constant and is equal
to the concentration of the essential medium component at which the specific growth rate is half
of its maximum value. Specific growth rate is linearly dependent on the concentration of the
essential medium component at lower concentration and it is independent at higher the
concentration of the essential medium component.
The growthof the microbial cells is autocatalytic.
The General mass balance is
Input + Formation = Output + Accumulation + Disappearance
The Cell mass Balance is
Cell mass Input + Cell Growth = Cell mass Output + Cell mass Accumulation + Cell death
Here we neglect cell death and no cells are removed in a batch reactor.
𝑑𝑥𝑑𝑡 = 𝜇𝑥 ……(1)
where, X = biomass conc (g/L), t = time
On integrating eqn (1)
𝑋3 = 𝑋$. 𝑒63 …..(2)
This is the equation for microbial growth in the exponential phase,
Where, Xo = initial biomass concentration (g/L), Xt = biomass concentration after time t (g/L)
On taking “ln”,
𝑋3 =𝑙𝑛 𝑙𝑛𝑋$ + µ𝑡 …… . . (3)
A plot of ln x versus t gives straight line with slope μ.
Specific growth rate during the exponential can also be calculated by using the formula
µ = 78789:;<78789:535<3;
(Time-1)

18BTC107J BIOPROCESS PRINCIPLES
where ,OD1 is the optical density at time t1 and OD2 is optical density at time t2.
Doubling time of the strain,
𝑇= =787856
(Time)
Following log phase is the decelerating phase and stationary phase, where the growth is almost
constant with respect to time. Depletion of nutrients leads to declining growth phase where growth
occurs but the death rate is greater.
The yield coefficient:
𝑌"/# =∆!∆"=0#<0$
-$<-# ------(5)
Xo - initial concentration of biomass (g/L) Xt = concentration of biomass at time‘t’ (g/L), S0 =
initial substrate concentration (g/L), St = Residual substrate concentration at time‘t’ (g/L).
Materials required
Shake flasks, Shaker, pipette, spectrophotometer and E. coli strain.
Glucose Yeast extract medium:
Glucose 3- 15 g/L
Yeast extract 5 g/L
NH4Cl 1 g/L
NaCl 0.5 g/L
K2HPO4 5g/L
MgSO4 0.5g/L
Trace metal solution: (1ml / liter of solution)
FeSO4 50mg/L
Al2(SO4)3.7H2O 10 mg/L
CuSO4 4H2O 2 mg/L
H3BO3 l mg/L
MnCl3.4H2O 20 mg/L
NiCl2.6H2O 1 mg/L
Na2MoO4.2H2O 50 mg/L
18BTC107J BIOPROCESS PRINCIPLES
ZnSO4.7H2O 5mg/L
pH: 7.0
Temp: 37º C
After inoculation, readings were taken at regular time intervals and tabulated. The values of O.D,
residual glucose, and dry weight were thus recorded.
Procedure
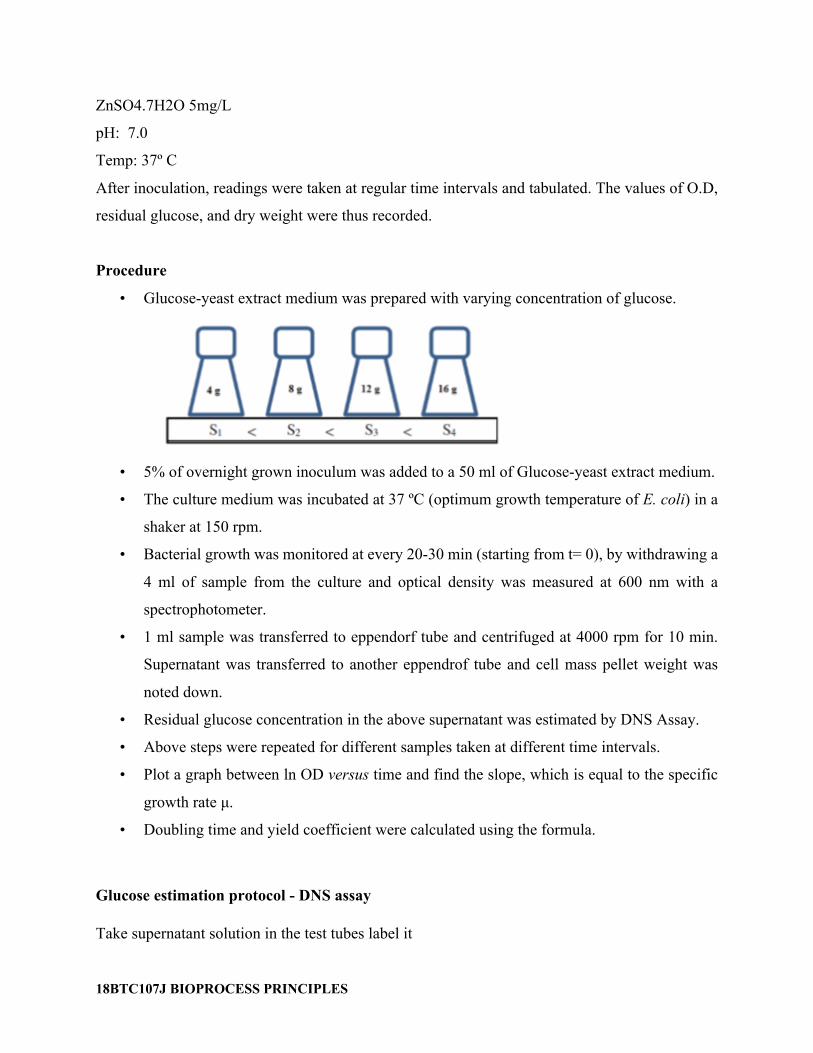
• Glucose-yeast extract medium was prepared with varying concentration of glucose.
• 5% of overnight grown inoculum was added to a 50 ml of Glucose-yeast extract medium.
• The culture medium was incubated at 37 ºC (optimum growth temperature of E. coli) in a
shaker at 150 rpm.
• Bacterial growth was monitored at every 20-30 min (starting from t= 0), by withdrawing a
4 ml of sample from the culture and optical density was measured at 600 nm with a
spectrophotometer.
• 1 ml sample was transferred to eppendorf tube and centrifuged at 4000 rpm for 10 min.
Supernatant was transferred to another eppendrof tube and cell mass pellet weight was
noted down.
• Residual glucose concentration in the above supernatant was estimated by DNS Assay.
• Above steps were repeated for different samples taken at different time intervals.
• Plot a graph between ln OD versus time and find the slope, which is equal to the specific
growth rate μ.
• Doubling time and yield coefficient were calculated using the formula.
Glucose estimation protocol - DNS assay
Take supernatant solution in the test tubes label it

18BTC107J BIOPROCESS PRINCIPLES
3 ml of distilled water alone serves as blank.
Add 3 ml of DNS reagent to all test tubes. Incubate at 90°C for 15 minutes in water bath.
Add 1 ml 40 % Sodium Potassium tartrate solution.
Read the OD at 575 nm.
Time
(min)
OD for cell mass at 600 nm ln OD Specific growth rate (µ) min -1
3
g/L
6
g/L
9
g/L
12
g/L
15
g/L
3
g/L
6
g/L
9
g/L
12
g/L
15
g/L
3
g/L
6
g/L
9
g/L
12
g/L
15
g/L

18BTC107J BIOPROCESS PRINCIPLES
Time
(min)
OD for residual substrate at 575
nm
Residual substrate (S), mg/ml Yield coefficient (Yx/s) mg cell / mg
sub.
3
g/L
6
g/L
9
g/L
12
g/L
15
g/L
3
g/L
6
g/L
9
g/L
12
g/L
15
g/L
3
g/L
6
g/L
9
g/L
12
g/L
15 g/L
18BTC107J BIOPROCESS PRINCIPLES
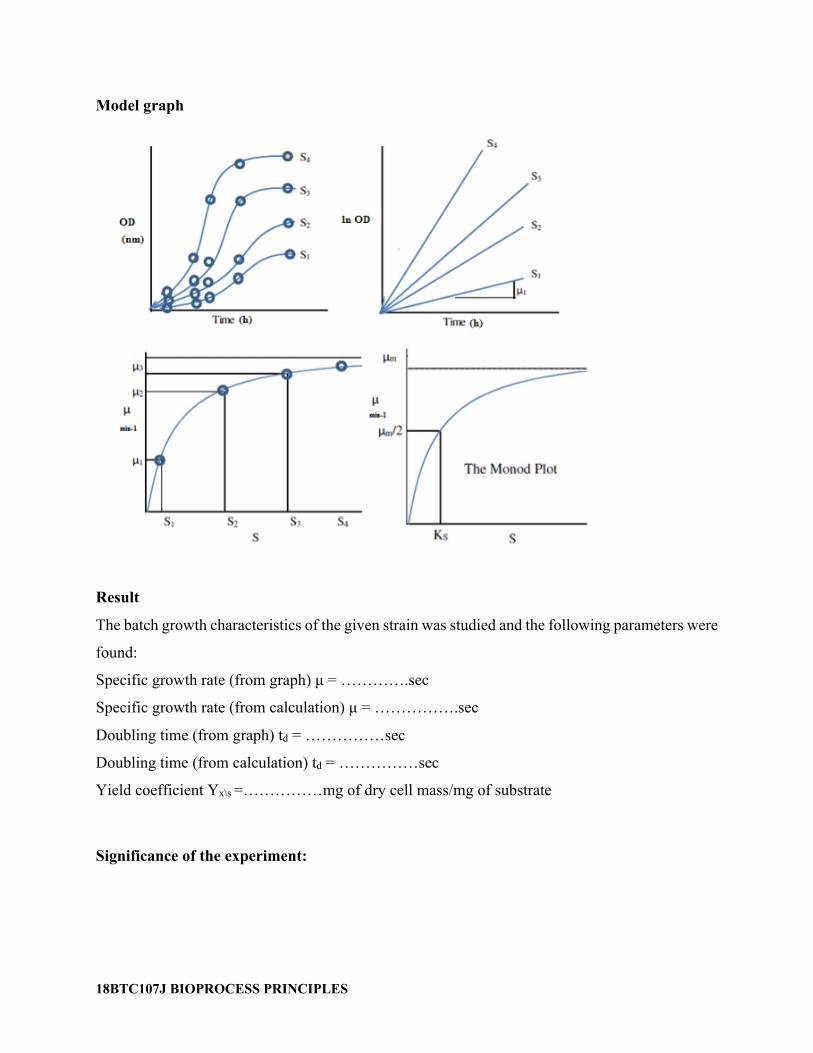
Model graph
Result
The batch growth characteristics of the given strain was studied and the following parameters were
found:
Specific growth rate (from graph) μ = ………….sec
Specific growth rate (from calculation) μ = …………….sec
Doubling time (from graph) td = ……………sec
Doubling time (from calculation) td = ……………sec
Yield coefficient Yx\s =……………mg of dry cell mass/mg of substrate
Significance of the experiment:

18BTC107J BIOPROCESS PRINCIPLES
Critical thinking questions
How does a microbe metabolize a mixture of carbon source?
Is there any advanced techniques employed to find the population of bacterial consortia rather than
using a traditional microscopy?
Assume if lactose has been provided as a carbon source for the bacteria initially, after which the
culture has been transferred to another flask containing glucose. What kind of growth curve would
you expect? Draw and explain.

18BTC107J BIOPROCESS PRINCIPLES
Experiment No: 11
Date:
ENZYME IMMOBILIZATION
Aim:
To immobilize the alpha amylase enzyme by gel entrapment method and to determine the radius
of the immobilized bead.
Principle:
Immobilized enzymes have a wide range of applications, among which we can highlight food
processing and industrial chemistry. The use of immobilized enzymes for chemical analysis has
generated considerable interest in recent years. Any process or technique based on the use of
immobilized enzymes involves the choice of the support type and the immobilization method,
together with the description and later optimization of other numerous variables specific to each
process. The supports used are often of a polymeric character, being networks of high molecular
weight which can adsorb solvent, mainly water, but are themselves insoluble. The interactions
responsible for the solvent adsorption are, among others, capillary forces, osmosis and
polymer/solvent molecular interactions, resulting in a porous structure where the enzymes can
lodge.
The enzymes are found in a new state, in which their properties are very much influenced by a
number of factors, in particular, those related with the chemical and physical nature of the support.
Immobilization can alter the distribution of the substrate, reaction products or hydrogen ions
between the microenvironment and the macro environment of the enzyme, all of this as
consequence of the electrostatic or hydrophilic/hydrophobic interactions between the base and the
components of the surroundings. Diffusional restrictions may also appear, in particular, on the
diffusion of the substrate and products between the interior of the support and the macro
environment. Finally, immobilization may cause changes in the structure of the enzyme and even
steric impediments, depending on how the enzyme links to the support. These effects are reflected

18BTC107J BIOPROCESS PRINCIPLES
in the activity and kinetics of the action of the enzyme and stability, and mainly affect its
interactions with the substrate and, consequently, its specific features of enzymatic action.
Sodium alginate is a natural polysaccharide obtained from kelp and seaweed, brown algae
belonging to the phylum Phaeophyta. It is mainly composed of thousands of oxidized sugar “units”
joined together to form an ionic polymer The repeating units are six-membered rings containing
negatively charged –CO2– groups. The C-1 carbon atom of one ring is connected via an oxygen
atom to iouthe C-4 carbon atom of the next ring in the polymer chain (Fig.1).
Fig.1 Sodium alginate
The presence of ionic –CO2 – side chains, as well as numerous –OH groups, make this natural
polymer extremely hydrophilic or “water-loving.” The resulting solution is thick, viscous, and
smooth. Replacing the sodium ions in sodium alginate with calcium ions leads to cross-linking
between the polymer chains and gives an insoluble gel, calcium alginate. Each Ca2+ ion can bind
to at least two carboxylate groups in the polymer. If the two –CO2– groups are on different
(adjacent) polymer molecules, then the effect of adding divalent cations is to tie together or cross-
link individual polymer molecules into a large, three-dimensional network. The cross-linked
polymer swells up in contact with water to form an insoluble gel. Studies have shown that the
polymer behaves like a giant chelating ligand (similar to EDTA), and that each Ca2+ ion is bound
to four –CO2 – groups.

18BTC107J BIOPROCESS PRINCIPLES
2 Na(Alginate) + Ca++ -------> Ca(Alginate)2 + 2 Na+
The ionically linked gel structure is thermostable over the range of 0-100ºC; therefore heating will
not liquefy the gel. However, the gel can be easily re-dissolved by immersing the alginate.
Preparation of immobilized enzymes by entrapping by an insoluble support matrix:
Materials required:
Sodium Alginate (3%)
0.2 M CaCl2
Alpha amylase enzyme (1%)
Procedure:
Add 3g of sodium alginate slowly to 100 ml of distilled water by employing magnetic stirrer to
prepare sodium alginate solution.
Mix approximately 50 mg of enzyme with 5 ml of 3% (wt.) sodium alginate solution.
Dispense the enzyme and sodium alginate solution into an excess (100 ml) of stirred 0.2 M CaCl2
solution by using peristaltic pump or a syringe and needle at room temperature.
The bead size can be controlled by pump pressure and the needle gauge. A typical hypodermic
needle produces beads of 0.5-2 mm in diameter.
Leave the beads in the calcium chloride solution to cure for 0.5-3 hours.
Determination of bead radius:
Take known number of immobilized beads (N) in the measuring jar up to a certain height (for ex.
10 ml).
Add water to the same height in the measuring jar to find out the void volume
Decant the water completely into another measuring jar, and this volume is void volume, Vv
Volume of each bead = (Vtotal – Vv)/N
From the volume of the bead, radius can be calculated.

18BTC107J BIOPROCESS PRINCIPLES
Calculation:
Number of beads taken in the measuring jar (N) =
Height of the immobilized beads = x ml
Volume of water added to the same height = y ml
Volume of N beads = (x-y) ml
Volume of 1 bead = (x-Y)/N ml = z
4/3 π r 3 = z cm3
r = ?
Calculate the radius of the bead
Result:
The enzyme α – amylase was immobilized and radius of the immobilized bead was calculated.
Radius of the immobilized bead =…………… cm
Significance of the experiment:
Critical thinking questions
[1] Whether nanoparticles/ nano fibers can be used for immobilization of enzyme? How? Does
the material feature improves the enzyme immobilization?
[2] What happens if high molecular weight ionic polymer is exposed to highly charged
cations?
[3] What would happen if you add potassium or magnesium chloride solution instead of
calcium chloride to interact with sodium alginate?

18BTC107J BIOPROCESS PRINCIPLES
Experiment No: 12
Date:
ENZYME IMMOBILIZATION KINETICS
Aim:
To study the effect of immobilization of α-amylase enzyme by gel entrapment method and to find
out the kinetic parameters for both free and immobilized enzyme.
Principle:
Entrapment is the physical enclosure of enzymes in a small space. Matrix entrapment and
membrane entrapment, including micro-encapsulation are the two major methods of entrapment.
Matrices used for enzyme entrapment are usually polymeric materials such as calcium alginate,
agar, carangeenin, polyacrylamide and collagen.
Sodium alginate + Enzyme + Calcium chloride
↓
Calcium alginate beads entrapped with enzyme.
Unlike polyacrylamide gels, gelation of calcium alginate does not depend on the formation of more
permanent covalent bonds between polymer chains. Rather, polymer molecules are cross-linked
by calcium ions. Because of this, calcium alginate beads can be formed in extremely mild
conditions, which ensure that enzyme activity yields of over 80% can be routinely achieved.
However, just as easily as calcium ions can be exchanged for sodium ions, they can also be
displaced by other ions. This property can both be advantageous and disadvantageous. If needed,
enzymes or microbial cells can be easily recovered by dissolving the gel in a sodium solution. On
the other hand, proper caution must be exercised to ensure that the substrate solution does not
contain high concentrations of those ions that can disintegrate the gel.

18BTC107J BIOPROCESS PRINCIPLES
Materials required:
Alpha-amylase
Calcium chloride
Sodium alginate
0.5 to 2.5% Starch solution.
Procedure:
• Dissolve 3g of sodium alginate in 100 ml distilled water to make a 3% (w/v) solution. After
sodium alginate is completely dissolved, leave the solution undisturbed for 30 minutes to
eliminate the air bubbles that can later be entrapped and cause the beads to float. The
concentration of sodium alginate can be varied between 6-12 % (w/v) depending on the
desired hardness.
• Prepare 100ml of 0.2M calcium chloride solution in a beaker.
• Mix approximately 5 mg of α-amylase enzyme with 5 ml of 3% sodium alginate solution.
Add the sodium alginate and α-amylase mixture drop wise to the calcium chloride solution
using peristaltic pump or syringe and needle at room temperature.
• Allow the beads in calcium chloride solution for 20 min to deplete the excess calcium.
• Use equal quantity of α-amylase enzyme solution (5 mg of alpha amylase in 5 ml of
deionized water) for studying free enzyme kinetics.
• Take 50 ml of 0.5 to 2.5% starch solution in 10 conical flasks (both for free and immobilized
enzyme)
• Add immobilized enzyme (prepared beads – 5 mg of alpha amylase with 5 ml of sodium
alginate) and free enzyme solution (5 mg/5ml) to the respective conical flasks
• Incubate the conical flasks in rotary shaker (100 rpm, 40 °C) for 10 minutes..
• After 10 minutes, withdraw 1 ml of sample from all the conical flasks and dilute it with 2 ml
of distilled water.
• Add 3 ml of DNS reagent to calculate the amount of glucose [P] (mmol/ml) released.
• Calculate the reaction rate (V) is equal to d[P]/dt.

18BTC107J BIOPROCESS PRINCIPLES
• Draw the graphs for [S] vs V (Michaelis Menten) and 1/[S] vs 1/[V] (Lineweaver Burk plot)
for both free and immobilized enzyme systems.
• Find the values of Vmax and Km for both free and immobilized enzyme system from Michaelis
Menten and Lineweaver Burk plots.
TABULATION:
Table1. Free enzyme
Substrate
concentration
(mg/ml)
OD at
540 nm
Conc. of
glucose [P]
mg/ml
Conc. of
glucose [P]
mmol/ml
V
mmol/m
l.min
1/V 1/[S]

18BTC107J BIOPROCESS PRINCIPLES
Table 2. Immobilized enzyme
Susbtrate
concentration
(mg/ml)
OD at 540
nm
Conc. of
glucose [P]
mg/ml
Conc. of
glucose [P]
mmol/ml
V
mmol/ml.min 1/V 1/[S]
RESULT
Effect of immobilization of α-amylase enzyme by gel entrapment method was studied.
Maximum reaction rate (Vmax) for free enzyme = ……………… mmol/ml.min
Rate constant (Km) for free enzyme = ……………… min-1
Maximum reaction rate (Vmax) for immobilized enzyme = ……………… mmol/ml.min
Rate constant (Km) for immobilized enzyme = ……………… min-1

18BTC107J BIOPROCESS PRINCIPLES
SIGNIFICANCE OF THE EXPERIMENT:
Critical thinking questions
(1) As you discussed the advantages of immobilization, list the disadvantages of the immobilization of enzymes and whole cell. (2) Why immobilization is formed in the shape of sphere? Why not rectangle / triangle or any geometric shape? (3) Elucidate different immobilization techniques employed commercially?
18BTC107J BIOPROCESS PRINCIPLES
Experiment No: 13-15
Date:
PRODUCTION OF ETHANOL BY YEAST
Aim
To produce ethanol from grape fruit juice by the yeast fermentation process
Principle
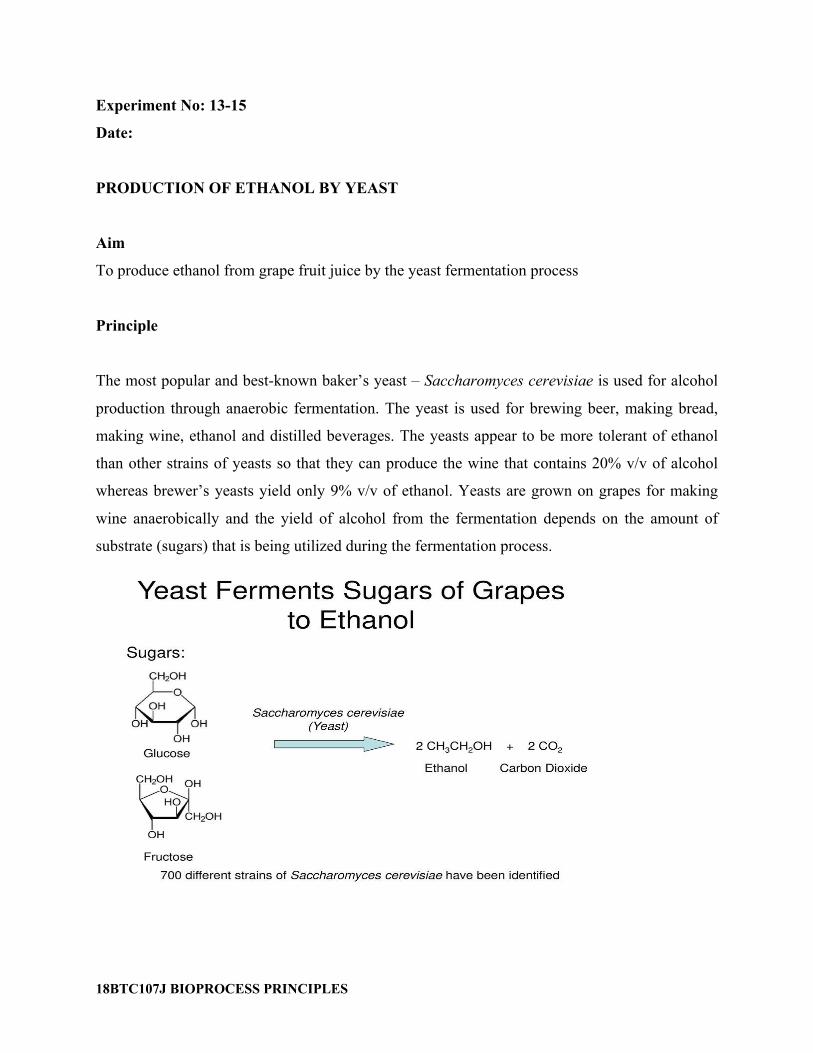
The most popular and best-known baker’s yeast – Saccharomyces cerevisiae is used for alcohol
production through anaerobic fermentation. The yeast is used for brewing beer, making bread,
making wine, ethanol and distilled beverages. The yeasts appear to be more tolerant of ethanol
than other strains of yeasts so that they can produce the wine that contains 20% v/v of alcohol
whereas brewer’s yeasts yield only 9% v/v of ethanol. Yeasts are grown on grapes for making
wine anaerobically and the yield of alcohol from the fermentation depends on the amount of
substrate (sugars) that is being utilized during the fermentation process.

18BTC107J BIOPROCESS PRINCIPLES
PROCEDURE:
Add fresh and healthy black grapes in a glass beaker and squeeze them to collect the juice
Filter the collected juice
Transfer the filtered juice to a sterile Erlenmeyer flask and close tightly
Add 1.5 g of brewer’s yeast and 200 g of sugar per kg of grapes
Incubate the flask at 15 – 20°C for 8-15 days
REAGENT PREPARATION:
Potassium dichromate solution (K2 Cr2O7):
Weigh 34 g of Potassium dichromate and dissolve in 500 mL of distilled water in a one-liter
standard measuring flask.
Concentric sulphuric acid (Conc. H2SO4 – 5 M):
Measure 325 mL of concentric sulphuric acid and slowly add to the potassium dichromate solution
by keeping it in an ice bucket.
DNS Solution
Dinitrosalicylic Acid Reagent Solution
Dinitrosalicylic acid: 10 g
Sodium sulfite: 0.5 g
Sodium hydroxide: 10 g
Deionized water : 1 liter
Potassium sodium tartrate solution, 40%
QUANTIFICATION OF BIOMASS:
1 mL of the fermented culture was collected at regular time intervals and centrifuged at 8000 rpm
for 10 minutes
Supernatant was transferred to another eppendrof tube and air dried cell pellet weight was noted
down

18BTC107J BIOPROCESS PRINCIPLES
𝑊𝑒𝑖𝑔ℎ𝑡𝑜𝑓𝑡ℎ𝑒𝑏𝑖𝑜𝑚𝑎𝑠𝑠(𝑐𝑒𝑙𝑙𝑝𝑒𝑙𝑙𝑒𝑡) = ((𝑊𝑒𝑖𝑔ℎ𝑡𝑜𝑓𝑡ℎ𝑒𝑒𝑝𝑝𝑒𝑛𝑑𝑟𝑜𝑓𝑤𝑖𝑡ℎ𝑝𝑒𝑙𝑙𝑒𝑡) −
(𝑊𝑒𝑖𝑔ℎ𝑡𝑜𝑓𝑡ℎ𝑒𝑒𝑚𝑝𝑡𝑦𝑒𝑝𝑝𝑒𝑛𝑑𝑟𝑜𝑓))
PREPARATION OF STANDARD CURVE FOR ETHANOL ESTIMATION:
Prepare 2 % (v/v) Ethyl alcohol as a stock solution
Take 0.1, 0.2, 0.3, 0.4 and 0.5 ml of this 2 % alcohol and add it to the test tubes and makeup to
10.0 ml using distilled water
Take 0.5 mL of wine sample collected at regular time intervals and make it up to 10.0 mL using
distilled water
Add 1.0 mL of potassium dichromate solution to all the test tubes
Incubate the test tubes at 90 ˚C for 15 minutes
Measure optical density at 590 nm
Plot the standard graph between the concentration of ethanol and optical density
Calculate the concentration of ethanol in the wine sample at different time intervals from the
standard graph (mg/mL)
PREPARATION OF STANDARD CURVE FOR GLUOSE ESTIMATION:
Prepare glucose standards ranging from 0.1 to 1 mL by using dry clean and labelled test tubes
(Refer table)
Take 0.5 mL of wine sample collected at regular time intervals
Make all the samples to 3 mL with deionized water
3 mL of deionized water alone serves as a blank
Add 3 mL of Dinitro Salicylic Acid reagent to all the test tubes and vortex them for few seconds
Place all the test tubes in water bath at 90º C for 10-15 minutes to develop red-brown color
Cool the test tube in the running tap water and add 1 mL of 40% potassium sodium tartrate
(Rochelle salt) solution to all the test tubes and vortex them for few seconds (Note: All the tubes
must be cooled to room temperature before reading since the extinction is sensitive to temperature
change)
Read the Optical density of the colored solutions at 540 nm using the solution in tube 1 as a blank
18BTC107J BIOPROCESS PRINCIPLES
Plot the standard curve of the absorbance (Y- axis) against the glucose concentration (mg/mL) (
X-axis )
Calculate the concentration of glucose in the wine sample at different time intervals from the
standard graph (mg/mL)
Evaluation of ethanol yield and productivity
The Stoichiometric equation from reducing sugars to ethanol can be written as
C6 H12 O6 2 C2H5 OH + 2 CO2
The yield of ethanol can be calculated from the below equation
Fermentation efficiency: Ratio between the theoretical and observed yield of ethanol
𝐹𝑒𝑟𝑚𝑒𝑛𝑡𝑎𝑡𝑖𝑜𝑛𝑒𝑓𝑓𝑖𝑐𝑖𝑒𝑛𝑐𝑦 = (𝑂𝑏𝑠𝑒𝑟𝑣𝑒𝑑𝑒𝑡ℎ𝑎𝑛𝑜𝑙𝑦𝑖𝑒𝑙𝑑𝑇ℎ𝑒𝑜𝑟𝑒𝑡𝑖𝑐𝑎𝑙𝑒𝑡ℎ𝑎𝑛𝑜𝑙𝑦𝑖𝑒𝑙𝑑) × 100
TABULATION
Table: 1 Biomass estimation
S. No Hours Weight of the cell biomass (g)
1 0
2 12
3 24
4 36
5 48
6 60
7 72
8 84

18BTC107J BIOPROCESS PRINCIPLES
9 96
10 108
Estimation of Ethanol
Table: 2 Standard table
S. No Conc. of
ethanol
(mg/mL)
Volume
of sample
(mL)
Volume
of water
(mL)
Volume
of
chromic
acid (mL)
Incubate
at 90°C
for 15
mins
O.D at 590 nm
Table:3
S.
No
Hours Vol. of
sample
(mL)
Vol. of
water
(mL)
Vol. of
chromi
c acid
(mL)
Incubate
at 90°C
O.D at
590 nm
Conc. of ethanol
(mg/mL)
0
12
24
48

18BTC107J BIOPROCESS PRINCIPLES
60 for 15
mins
72
84
96
108
Estimation of Glucose
Table: 4 Standard table
S. No
Vol. of
standard
solution
(mL)
Conc. Of
standard
solution
(mg/mL)
Vol. of
Distilled
water
(mL)
Vol. of
DNS
reagent
(mL)
Incubate
the tubes at
90ºC for 10
- 15
minutes.
Vol. of
1%Na-
K
Tartrate
(mL)
O.D at
540 nm
1 Blank - 3 3 1
2 0.1 2.9 3 1
3
0.2 2.8 3 1
4
0.3 2.7 3 1
5
0.4 2.6 3 1
6 0.5 2.5 3 1
18BTC107J BIOPROCESS PRINCIPLES
7
0.6 2.4 3 1
8 0.7 2.3 3 1
9 0.8 2.2 3 1
10 0.9 2.1 3 1
11 1.0 2.0 3
1
Table: 5
S. No Hours
Vol. of standard solution (mL)
Vol. of Distilled water (mL)
Vol. of DNS reagent (mL)
Incubate the tubes at 90ºC for 10 - 15 minutes.
Vol. of 1% Na-K Tartrate (mL)
O.D at 540 nm
Conc. of glucose (mg/mL)
1 0 3 1
2 12 3 1 3 24 3 1
4 36 3 1
5 48 3 1
6 60 3 1
7 72 3 1
8 84 3 1 9 96 3 1 10 108 3 1

18BTC107J BIOPROCESS PRINCIPLES
Graph: Concentration of standard ethanol (mg/mL) vs Optical Density (@590 nm)
Concentration of ethanol (wine sample) (mg/mL) vs Optical Density (@590 nm)
Concentration of Standard Glucose (mg/mL) vs Optical Density (@540 nm)
Concentration of Glucose (wine sample) (mg/mL) vs Optical Density (@540 nm)
RESULT:
Significance of the experiment:
Critical thinking questions
[1] Does the accumulation of glucose, ethanol and CO2 levels during fermentation become
toxic to yeast?
[2] If S.cerevisiae is capable of utilizing glucose (C6) sugar, what will be the fate of C5 sugar
if it is present in the mixture of sugar? Is there any possible to utilize all the sugars
simultaneously?
[3] Do human gut microbes produce ethanol? How? Does it have impact on human health?