19- 02 final report: analyzing development costs for low
TRANSCRIPT

19-02 Final Report | Analyzing Development Costs for Low-Income Housing 1
1 9 - 0 2 F I N A L R E P O R T :
Analyzing Development Costs for Low-Income Housing
L E G I S L A T I V E A U D I T O R ' S C O N C L U S I O N :Development costs for six projects are consistent with independent
estimates. Commerce can improve cost controls, and the Housing Finance
Commission has opportunities to lower costs by examining for-profit
developer involvement.
January 2019
In 2017, the Legislature directed JLARC to analyze the costs of developing low-income housing (i.e.,
affordable to households making less than 80 percent of the area median income). JLARC staff reviewed
the two largest programs in Washington.
Low-Income Housing Tax Credit (LIHTC) Housing Trust Fund (HTF)
Managing agency Washington State Housing Finance Commission (Commission)
Department of Commerce (Commerce)
Type of subsidy Federal tax credits and tax-exempt bonds
State grants and low-interest loans
Multifamily housing financing awarded (2017)
$644 million in tax credits and $732 million in bonds $54 million
Multifamily units financed (2017)* 7,049 1,785
* Some projects may have received both LIHTC and HTF funds and units are included in both counts.
Source: Washington State Housing Finance Commission and Department of Commerce.

19-02 Final Report | Analyzing Development Costs for Low-Income Housing 2
Six case studies found development costs were within or below estimates expected by independent experts
JLARC worked with professional cost estimators who
calculated retrospective estimates for six LIHTC projects
completed between 2014 and 2016. JLARC staff found
that the costs were within or below the estimated cost
ranges.
Commerce does not collect final development costs for
Housing Trust Fund projects, so it was not possible to
conduct a similar analysis for that program.
Analysis shows location, developer type, and project characteristics affect costs. Program restrictions and population needs can limit the ability to change some of these factors.
Statistical analysis of 241 LIHTC projects showed that location, developer type, and project characteristics
are factors most likely to affect development costs. There was insufficient information to determine how
prevailing wage and environmental building requirements affect costs.
• The ability to alter some factors may be limited. For example, having more bedrooms per unit may
not be appropriate for housing that serves single adults.
• Influencing the type of developer raises broader policy issues beyond development costs.
Stakeholders noted nonprofit and housing authority developers may be best suited to serve more
vulnerable populations once developments are operational. As a result, those developers may
fulfill more scoring criteria than for-profit developers when competing for certain funding.
Commission policy encourages for-profit developers and nonprofit organizations to develop
projects as co-owners. This has not occurred.
The Commission follows key best practices for monitoring and controlling costs, while Commerce can improve its cost controls
19-02 Final Report | Analyzing Development Costs for Low-Income Housing 3
The Commission follows most best practices published by the National Council of State Housing Agencies.
Commerce does not collect final development costs, limiting its ability to analyze and monitor cost data
over time.
Legislative Auditor Recommendations • The Commission should identify and evaluate options for increasing the involvement of for-profit
developers in the 9% tax credit program and report their findings to the Legislature.
• Commerce should collect final development cost data from Housing Trust Fund recipients to
improve cost controls.
• Commerce and the Commission should report development cost data to the Legislature annually.
The Commission and Commerce concur with these recommendations. You can find additional information
on the Recommendations tab.
Committee Addendum The Committee agrees with the recommendations of the Legislative Auditor, but wishes to caution readers
against drawing unsupported conclusions from the study.
We emphasize that the analysis of factors affecting development costs, with details in Appendix B,
establishes correlation, but not causation. This retrospective study shows that, on average, for-profit
developers are involved with less costly developments. However, the analysis does not establish that this
correlation is caused by less costly projects attracting more for-profit developers; neither does it establish
that for-profit developers cause the projects to become less costly.
In the committee hearing on the preliminary report, we heard testimony that some housing projects focus
on serving the needs of specific populations by integrating space for service providers or other
amenities. Further analysis of these amenities might clarify significant cost components and further
illuminate differences between developer types. Additionally, as shown in Exhibit B1, most units built by
for-profit developers allow income levels up to 60% of Area Median Income (AMI), while units restricted
to 50%, 40%, or 30% AMI are almost entirely built by governmental or non-profit developers. This again
suggests that different developer types are serving different populations, which may have a significant
impact on costs.
Committee Action to Distribute Report On January 10, 2019 this report was approved for distribution by the Joint Legislative Audit and Review
Committee.
Action to distribute this report does not imply the Committee agrees or disagrees with Legislative Auditor
recommendations.

19-02 Final Report | Analyzing Development Costs for Low-Income Housing 4
R E P O R T D E T A I L S
1. Two programs finance low-income housing The Washington State Housing Finance Commission and the Department of Commerce manage programs that finance low-income housing development Two main programs offer incentives for the development of low-income housing Two programs provide the majority of funding and have financed the most units in Washington: the Low-
Income Housing Tax Credit program and the Housing Trust Fund. Most of this housing serves low-wage
workers, farm workers, people experiencing homelessness, persons with disabilities, seniors, and other
populations.
Washington State Housing Finance Commission offers federal tax credits (LIHTC
program)
The Washington State Housing Finance Commission (Commission) administers the Low-Income Housing
Tax Credit program, commonly called LIHTC (pron. "lie-tech"). The program finances construction of low-
income housing through federal tax incentives.
Housing financed by LIHTC must be affordable to households with incomes at 60 percent or less than the
area median (26 US Code § 42 (g)(1)(B)). Once built, housing must remain affordable to low-income tenants
for at least 30 years.
Developers use credits to secure funding from investors
The program provides an indirect subsidy to housing developers.
1. The Internal Revenue Service (IRS) provides federal tax credits for the development of low-income
housing. The tax credits are allocated at the state level.
2. The Commission awards the state's tax credits to developers. Developers may receive a 9% tax
credit or a combination of a 4% tax credit and tax-exempt bonds (see below).
3. A developer transfers the credits to an investor that funds the housing. The investor becomes a
majority owner of the housing, and uses the credit to reduce its federal income tax liability.
4. The developer uses the money received from the investor to build low-income housing.
19-02 Final Report | Analyzing Development Costs for Low-Income Housing 5
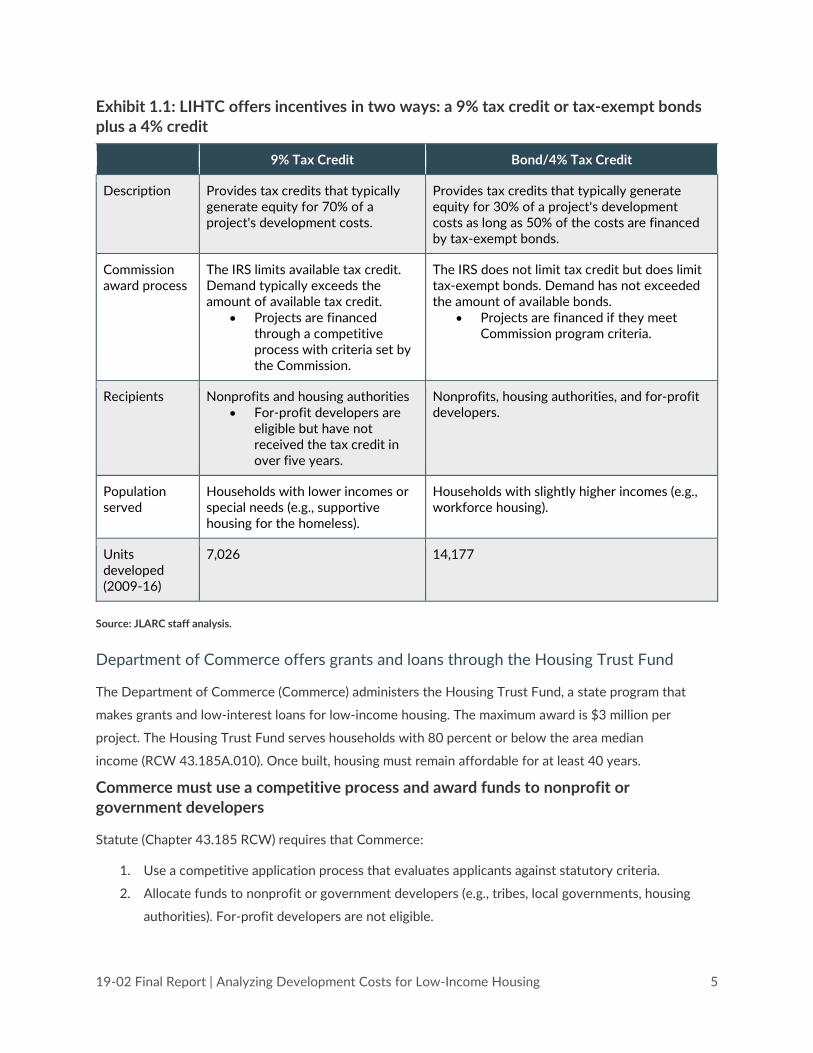
Exhibit 1.1: LIHTC offers incentives in two ways: a 9% tax credit or tax-exempt bonds plus a 4% credit 9% Tax Credit Bond/4% Tax Credit
Description Provides tax credits that typically generate equity for 70% of a project's development costs.
Provides tax credits that typically generate equity for 30% of a project's development costs as long as 50% of the costs are financed by tax-exempt bonds.
Commission award process
The IRS limits available tax credit. Demand typically exceeds the amount of available tax credit.
• Projects are financed through a competitive process with criteria set by the Commission.
The IRS does not limit tax credit but does limit tax-exempt bonds. Demand has not exceeded the amount of available bonds.
• Projects are financed if they meet Commission program criteria.
Recipients Nonprofits and housing authorities • For-profit developers are
eligible but have not received the tax credit in over five years.
Nonprofits, housing authorities, and for-profit developers.
Population served
Households with lower incomes or special needs (e.g., supportive housing for the homeless).
Households with slightly higher incomes (e.g., workforce housing).
Units developed (2009-16)
7,026 14,177
Source: JLARC staff analysis.
Department of Commerce offers grants and loans through the Housing Trust Fund
The Department of Commerce (Commerce) administers the Housing Trust Fund, a state program that
makes grants and low-interest loans for low-income housing. The maximum award is $3 million per
project. The Housing Trust Fund serves households with 80 percent or below the area median
income (RCW 43.185A.010). Once built, housing must remain affordable for at least 40 years.
Commerce must use a competitive process and award funds to nonprofit or government developers
Statute (Chapter 43.185 RCW) requires that Commerce:
1. Use a competitive application process that evaluates applicants against statutory criteria.
2. Allocate funds to nonprofit or government developers (e.g., tribes, local governments, housing
authorities). For-profit developers are not eligible.

19-02 Final Report | Analyzing Development Costs for Low-Income Housing 6
3. Give preference to applications based on criteria such as commitment to serve populations with
the greatest need, providing housing for people with the lowest incomes, and leveraging other
funding sources.
Although statutory direction to prioritize costs when evaluating applications expired in 2013, Commerce
continues to consider costs when awarding funds. The Legislature can allocate Housing Trust Fund dollars
to specific developments. R E P O R T D E T A I L S
2. Costs are within estimated ranges Six case studies found development costs were within or below estimates expected by independent experts JLARC staff reviewed six completed Low-Income Housing Tax Credit (LIHTC) projects to evaluate costs The Legislature directed JLARC to compare the costs of developing subsidized low-income and market-
rate housing. Like other researchers and entities such as the Government Accountability Office that have
reviewed this question, JLARC was unable to obtain comparable data from market-rate developers. In the
absence of this data, JLARC contracted with a team of independent cost estimating professionals to
develop retrospective estimates for six projects that received LIHTC funding. The retrospective estimates
enabled a comparison of expected costs with actual costs.
Each project was funded by the Low-Income Housing Tax Credit (LIHTC) program (either the 9% tax credit
or a combination bond/4% tax credit). These case studies reflect various regions, developer types (e.g.,
nonprofit, for-profit), populations served, and construction years. More detail about the sites used in the
case studies is available in Appendix A.
Total development costs were within or below ranges calculated by professional cost estimators JLARC staff hired professional cost estimators to calculate a retrospective cost estimate for each housing
development. The estimators:
• Reviewed architectural drawings.
• Considered market conditions, wage requirements, and other federal, state, and local
requirements in place during development.

19-02 Final Report | Analyzing Development Costs for Low-Income Housing 7
• Considered construction conditions that affected cost or time (e.g., labor supply, site
contamination).
• Considered the cost effect of the state's green building performance standard (the Evergreen
Sustainable Development Standard), 1required by RCW 39.35D.080.
• Completed site visits and interviews with industry professionals.
The estimators provided a range of estimated total development costs for each case study. The costs
include materials, labor, architect fees, loan fees, and other costs. JLARC staff compared the cost estimates
to actual total development costs reported to the LIHTC program. The actual costs are within or below the
estimated ranges.
Exhibit 2.1: Case studies of six LIHTC projects found actual development costs are within or below estimated ranges
Source: JLARC staff depiction of six LIHTC projects, the retrospective estimates of costs, and actual costs.
LIHTC development costs are reviewed during and after development The Commission requires the owner of the LIHTC-financed property to monitor costs during development.
In addition, lenders and investors often monitor costs to ensure that funds are spent appropriately.
Monitoring may include site visits and use of third-party architects to ensure construction quality.
After a project is built, the Commission requires the developer to submit a final cost certification prepared
by an independent Certified Public Accountant.
Analysis of a small sample of Seattle sites indicates challenges in comparing LIHTC developments with market-rate projects With the assistance from the Department of Housing and Urban Development (HUD), JLARC staff
compared LIHTC and market-rate development costs for a sample of multifamily projects that participated
1 Washington's green building performance standard required of all low-income housing projects financed through LIHTC or the Housing Trust Fund.

19-02 Final Report | Analyzing Development Costs for Low-Income Housing 8
in a HUD-insured mortgage program. In a comparison of 13 market-rate and 11 LIHTC projects in Seattle,
LIHTC projects cost 8 percent more per unit than market-rate projects.
The comparison highlighted some differences between the market-rate and LIHTC housing developments
that may contribute to cost differences:
• LIHTC projects include the developer's compensation in the development costs. In contrast,
market-rate developers are compensated through the rental or sale of the development. By
excluding the developer's profit in the development costs, market-rate costs may appear lower
than LIHTC costs.
• The LIHTC developments had fewer units, but units typically had more bedrooms and more
square footage than the market-rate developments.
Outside of this sample, it is unknown how LIHTC development costs compare with market-rate costs
because comprehensive and verifiable market-rate data is unavailable for a full comparison.
3. Analysis identifies factors that affect development costs Statistical analysis of all 241 LIHTC project sites from 2009-2016 shows location, developer type, and project characteristics affect costs. The Housing Finance Commission has opportunities to lower cost by examining for-profit involvement. JLARC staff used a regression analysis to
assess factors that may affect development
costs. These costs include materials, labor,
architect fees, and other costs, but exclude
land costs and reserves. The analysis
included 241 sites built between 2009 and
2016 with funding from the Low-Income
Housing Tax Credit (LIHTC) program (for
project data, see Exhibit B1 in Appendix B).
JLARC staff used data from the Washington
State Housing Finance Commission
(Commission) and the U.S. Census. This is
What is a regression analysis?
Regression analysis is a commonly accepted statistical
tool that estimates the relationship between a factor
(explanatory variable) and an outcome (dependent
variable). The analysis holds other factors constant so
the researcher can evaluate one at a time.
Regression analysis helps identify which factor(s) have a
high likelihood of affecting costs. It also helps estimate
the size of each factor's impact.
See Appendix B for more information about
interpreting regression results.

19-02 Final Report | Analyzing Development Costs for Low-Income Housing 9
the first complete analysis of Washington’s LIHTC data and helps identify cost drivers and actions that
may be available to control costs.
Regression approach: Many factors may affect development costs. JLARC staff modeled the relationship
between development costs and factors such as construction year, developer type, location, and size. The
models analyzed cost per unit, cost per square foot, and cost per bedroom. The cost per bedroom model
had the greatest explanatory power and was generally consistent with the other models, so it is presented
here. Additional information and results for the cost per unit and per square foot models are in Appendix
B.
For-profit and vertically integrated developers are associated with lower costs The regression analysis suggests for-profit developers and vertically integrated developers are associated
with lower costs (see Exhibit 3.2). For this analysis, vertically integrated is defined as developers also
serving as their own general contractor or having a shared interest with the project's general contractor.
These findings are consistent with similar research. However, influencing the type of developer raises
broader policy issues beyond development costs.
For-profit companies developed 38 percent of the projects financed with the bond/4% tax credit program
from 2009-2016. However, Commission scoring criteria favor nonprofit developer and housing authority
participation in the 9% tax credit program (see Exhibit 3.1). The 9% tax credit is intended for housing
projects that serve the lowest income populations or those with specific service needs. Nonprofits and
housing authorities with missions to serve these populations fulfill more scoring criteria than for-profit
developers. For-profit developers may be more competitive for the 9% tax credit if they partner with a
nonprofit or housing authority as co-owners. This has not occurred. JLARC staff found that for-profit
developers have not received the 9% tax credit since 2013.
Exhibit 3.1: 241 LIHTC projects placed in service from 2010-2017 by developer type
Source: JLARC staff statistical analysis of LIHTC data.
According to the Government Accountability Office and Oregon’s housing finance agency, for-profits have
developed projects using the 9% tax credit in other states.
19-02 Final Report | Analyzing Development Costs for Low-Income Housing 10
Developers with a high level of development activity are more likely to be vertically integrated.
Stakeholders noted that nonprofits and housing authorities may not have enough construction work to
afford becoming vertically integrated.
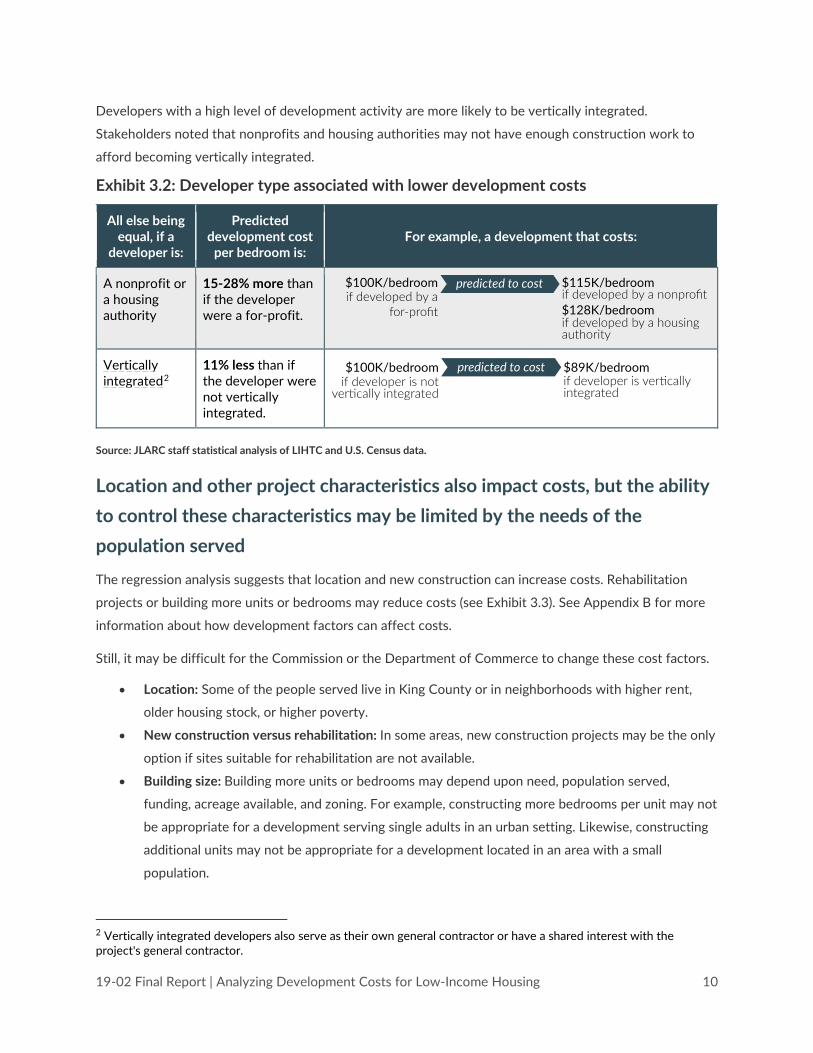
Exhibit 3.2: Developer type associated with lower development costs
All else being equal, if a
developer is:
Predicted development cost
per bedroom is: For example, a development that costs:
A nonprofit or a housing authority
15-28% more than if the developer were a for-profit.
Vertically integrated2
11% less than if the developer were not vertically integrated.
Source: JLARC staff statistical analysis of LIHTC and U.S. Census data.
Location and other project characteristics also impact costs, but the ability to control these characteristics may be limited by the needs of the population served The regression analysis suggests that location and new construction can increase costs. Rehabilitation
projects or building more units or bedrooms may reduce costs (see Exhibit 3.3). See Appendix B for more
information about how development factors can affect costs.
Still, it may be difficult for the Commission or the Department of Commerce to change these cost factors.
• Location: Some of the people served live in King County or in neighborhoods with higher rent,
older housing stock, or higher poverty.
• New construction versus rehabilitation: In some areas, new construction projects may be the only
option if sites suitable for rehabilitation are not available.
• Building size: Building more units or bedrooms may depend upon need, population served,
funding, acreage available, and zoning. For example, constructing more bedrooms per unit may not
be appropriate for a development serving single adults in an urban setting. Likewise, constructing
additional units may not be appropriate for a development located in an area with a small
population.
2 Vertically integrated developers also serve as their own general contractor or have a shared interest with the project's general contractor.

19-02 Final Report | Analyzing Development Costs for Low-Income Housing 11
Exhibit 3.3: Location and project characteristics associated with changes to development costs
All else being equal, if a
development is:
Predicted development cost per bedroom is: For example, a development that costs:
Located in Seattle/King County
More than a project in the Non-Metro region3. (The regression found no significant relationship when comparing costs for the Metro region and the Non-Metro regions.)
Located in a neighborhood with higher rent
More than a project in an area with lower rent.
Located in a neighborhood with older housing stock
More than a project in an area with newer housing stock.
Located in a neighborhood with higher poverty rates
More than a project in an area with a lower poverty rate.
New construction
More than a rehabilitation project.
A project with more units
Less than a project with fewer units.
A project with more bedrooms per unit
Less than a project with fewer bedrooms per unit.
Source: JLARC staff statistical analysis of LIHTC and U.S. Census data.
3 The Commission divides the state into three geographic regions: Seattle/King County, Metro (Clark, Pierce, Snohomish, Spokane, and Whatcom counties), and Non-Metro (all other counties).

19-02 Final Report | Analyzing Development Costs for Low-Income Housing 12
Consultants and stakeholders identified other factors that may affect development
costs but were not possible to isolate in the analysis
Wage requirements: State, local, and federal laws require that prevailing wages be paid for developments
that receive certain state, local, or federal funds. Developers suggested that wage requirements may
increase development cost by increasing labor rates or limiting the number of general contractors willing
to bid on the project. However, it was not possible to evaluate this statement with statistical analysis due
to a lack of reliable data. Further, a review of the wage requirements in six case studies of LIHTC projects
was inconclusive (see Appendix A).
Legislation passed in 2018 may affect the future impact of wage requirements. SB 5493, which took effect
September 2018, changed how prevailing wage rates are calculated. Staff at the Department of Labor and
Industries thought the change might increase the overall minimum prevailing wage rates for construction
projects, including low-income housing projects. Labor and Industries notes the level of increase depends
on many factors, such as specific trades involved in a project and local collective bargaining agreements.
JLARC staff analyzed a selection of wage rates and found that average wage rates increase with the new
method.
Environmental requirements: Projects funded by the LIHTC or the Housing Trust Fund must comply with
the state's Evergreen Sustainable Development Standard (ESDS)4. Since all projects in this study must
comply with the standard, JLARC staff had no comparison group for a statistical analysis of the standard's
impact on costs. For six case studies of LIHTC projects, cost estimators believe that compliance with the
standards increased costs by up to 4 percent (see Appendix A).
Legislative Auditor Recommendation • The Commission should identify and evaluate options for increasing the involvement of for-profit
developers in the 9% tax credit program and report their findings to the Legislature.
The Commission concurs with this recommendation. You can find additional information on the
Recommendations tab.
4 Washington's green building performance standard required of all low-income housing projects financed through LIHTC or the Housing Trust Fund.
19-02 Final Report | Analyzing Development Costs for Low-Income Housing 13
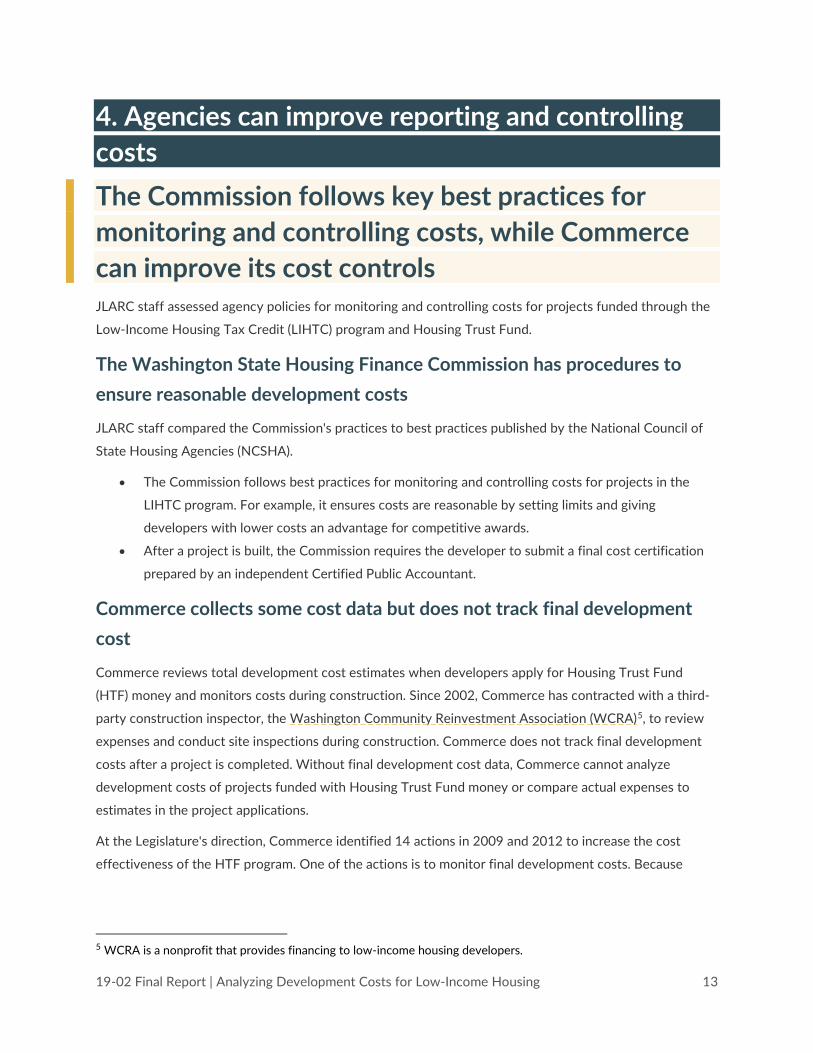
4. Agencies can improve reporting and controlling costs The Commission follows key best practices for monitoring and controlling costs, while Commerce can improve its cost controls JLARC staff assessed agency policies for monitoring and controlling costs for projects funded through the
Low-Income Housing Tax Credit (LIHTC) program and Housing Trust Fund.
The Washington State Housing Finance Commission has procedures to ensure reasonable development costs JLARC staff compared the Commission's practices to best practices published by the National Council of
State Housing Agencies (NCSHA).
• The Commission follows best practices for monitoring and controlling costs for projects in the
LIHTC program. For example, it ensures costs are reasonable by setting limits and giving
developers with lower costs an advantage for competitive awards.
• After a project is built, the Commission requires the developer to submit a final cost certification
prepared by an independent Certified Public Accountant.
Commerce collects some cost data but does not track final development cost Commerce reviews total development cost estimates when developers apply for Housing Trust Fund
(HTF) money and monitors costs during construction. Since 2002, Commerce has contracted with a third-
party construction inspector, the Washington Community Reinvestment Association (WCRA)5, to review
expenses and conduct site inspections during construction. Commerce does not track final development
costs after a project is completed. Without final development cost data, Commerce cannot analyze
development costs of projects funded with Housing Trust Fund money or compare actual expenses to
estimates in the project applications.
At the Legislature's direction, Commerce identified 14 actions in 2009 and 2012 to increase the cost
effectiveness of the HTF program. One of the actions is to monitor final development costs. Because
5 WCRA is a nonprofit that provides financing to low-income housing developers.

19-02 Final Report | Analyzing Development Costs for Low-Income Housing 14
Commerce does not collect this data, it is unable to implement its own recommendation to document and
monitor development cost data over time.
Legislative Auditor Recommendations • Commerce should collect final development cost data from Housing Trust Fund recipients to
improve cost controls.
• Commerce and the Commission should report total development cost data to the Legislature
annually.
The Commission and Commerce concur with these recommendations. You can find additional information
on the Recommendations tab.
5. Subsidized programs limit developers' options While construction is similar to market-rate housing, low-income housing program requirements limit flexibility in financing, operating incomes, and ability to sell While comparing development costs of subsidized low-income and market-rate housing was not possible,
JLARC staff compared life cycle processes for both types of housing.
There are four life cycle processes that developers of low-income or market-rate housing must consider:
financing, construction, operations, and sale. As directed by the Legislature, this report focuses on
development (financing and construction). Financial differences at later stages may limit a developer's
ability to generate income through rental or sale of the property.
Exhibit 5.1: There are important differences in regulatory requirements for developing and managing low-income and market-rate housing
Source: JLARC staff analysis.

19-02 Final Report | Analyzing Development Costs for Low-Income Housing 15
Low-income financing is more complicated and time-consuming
Low-income housing programs require multiple funding sources. A single development may receive a loan
from a bank, an equity contribution from a private investor, and public funding at the local, state, and
federal levels.
This financing structure complicates low-income housing development:
• Application, public participation, and distribution of funds from multiple sources may slow the
timing of site acquisition, permitting, and construction.
• Each funding source may require separate applications, inspections, monitoring, and legal services.
• Each funding source may require compliance with additional federal, state, and local policies and
priorities. This includes prevailing wage requirements, public works requirements, and
environmental building standards.
In contrast, market-rate projects have a simpler financing structure. Often a single bank loan and an equity
contribution can fund the development.
The construction process is similar for low-income and market-rate housing development The construction process is largely the same for both types of housing developments. Both may use the
same contractors, buy the same materials, and utilize the same labor pool. They are subject to the same
local regulations, such as design review and permitting. All housing developments are subject to the same
building codes and must pass inspections. As noted above, when prevailing wages apply, there may be
additional compliance requirements.
State and federal rent caps limit future operating income for low-income housing Low-income housing projects are limited in their ability to raise operating income because rent is restricted
to levels set by federal and state agencies. The restrictions are in place for 30 years or more. In addition,
projects that serve extremely low-income populations, such as supportive housing for the homeless, may
incur the cost of providing necessary tenant services. Due to these operating income limits, investors may
require and regulate the use of operating reserves by developers to pay for future repairs or unexpected
costs.
In contrast, developers of market-rate housing can adjust rents to market conditions and use rental
revenue for operating costs and profit.

19-02 Final Report | Analyzing Development Costs for Low-Income Housing 16
Subsidized low-income developers have more sale restrictions Sale or transfer of ownership of subsidized low-income housing developments are subject to funding
program approvals and procedures. Projects must comply with rent restrictions for 30 years or more. Sale
prices reflect the requirements for long-term rental restrictions.
In contrast, market-rate developers can sell at any time at market price.
Appendix A: Case studies JLARC staff reviewed six case studies from the Low-Income Housing Tax Credit program JLARC staff selected six Low-Income Housing Tax Credit (LIHTC) developments for analysis of the
development process and costs. The case studies represent a variety of LIHTC developer types and project
sites. All projects were completed within the last four years and many are intended for specific low-income
populations, such as homeless young adults, farmworkers, seniors, and people with disabilities. The six
case studies include:
• Two from each funding region (Seattle/King County, Metro, and Non-Metro).
• Two from each developer type (nonprofit, for-profit, and housing authority).
• Three from each type of tax credit (9% tax credit and bond/4% tax credit).
JLARC's professional cost estimator calculated a retrospective cost estimate for each housing
development (tab 2). A second cost estimator reviewed the estimates and found them to be thorough and
reasonable. More details about each project are below.
Copper Landing, Airway Heights
Source: Photo courtesy of Inland Group.
• Developer type: For-profit, vertically integrated • Developer name: Inland Group • LIHTC type: Bond/4% tax credit • Average tenant income: 53% of area median income
(AMI) • Population served: Households earning 60% or below
AMI • Number of units: 216 • Year placed in service: 2014 • Total development costs (millions): $22.7 • Cost estimate range (millions): $26.8-$36.2 • Wage requirement: Davis-Bacon (federal) residential 6
6 As required by the Davis-Bacon Act of 1931, federally funded construction projects must pay a minimum wage determined by the US Department of Labor to laborers and mechanics. In general, wage rates for residential construction are lower than wage rates for non-residential construction.

19-02 Final Report | Analyzing Development Costs for Low-Income Housing 17
Copper Landing is located on Kalispel Tribal Trust Land. The developer entered into a ground lease
agreement with the Kalispel tribe for the right to build on the property. The development was financed
using bond/4% tax credits and bank and business loans. The development consists of nine buildings with
one-, two-, and three-bedroom garden-style walk-up apartments The development also has a clubhouse,
playground, and pool.
15 West, Vancouver
Source: Photo courtesy of DBG Properties LLC.
• Developer type: For-profit, vertically integrated • Developer name: DBG Properties LLC • LIHTC type: Bond/4% tax credit • Average tenant income: 51% of area median income
(AMI) • Population served: Households earning 60% or below
AMI • Number of units: 120 • Year placed in service: 2016 • Total development costs (millions): $19.1 • Cost estimate range (millions): $19.1-$25.8 • Wage requirement: None
15 West was financed using bond/4% tax credits, loans, and developer equity. The developer also
received a multifamily tax exemption7. 15 West is a mid-rise building with studio, one-, two-, and three-
bedroom units. The units are restricted to tenants who earn 60% or below the area median income.
Marion West, Seattle
Source: Photo courtesy of Low Income Housing Institute.
• Developer type: Nonprofit • Developer name: Low Income Housing Institute • LIHTC type: 9% tax credit • Average tenant income: 30% of area median income
(AMI) • Population served: 20 units reserved for homeless
young adults, the rest of the units are for households earning below 30%, 40% or 60% AMI
• Number of units: 49 • Year placed in service: 2014 • Total development costs (millions): $15.1 • Cost estimate range (millions): $12.4-$16.7 • Wage requirement: State commercial 8
7 A 12-year property tax exemption offered by cities to qualifying projects that provide low-income housing. 8 By state law, construction contractors must pay workers prevailing wages on state-funded projects. Wage rates are established by the Department of Labor and Industries. In general, commercial wage rates are higher than residential wage rates. A commercial wage rate may be required on housing construction if there are non-residential spaces (such as a food bank) in an otherwise residential building.

19-02 Final Report | Analyzing Development Costs for Low-Income Housing 18
Marion West, originally called University Commons, is a mixed-use building located in Seattle's University
District. The development was funded using 9% tax credits, low-interest loans from the City of Seattle,
King County, and the Housing Trust Fund, developer equity, capital campaign proceeds, and the State
Building Communities Fund. The residential portion of the development has on-site caseworkers and full-
time staff and provides 47 studio and two one-bedroom units. The University District Food Bank is located
on the first floor and includes a nonprofit coffee shop that provides job training for youth. There is a
rooftop garden that supplements the food bank.
Rio de Vida, Prosser
Source: Photo courtesy of Office and Rural Farmworker Housing.
• Developer type: Nonprofit • Developer name: Catholic Charities Housing Services
of Yakima • LIHTC type: 9% tax credit • Average tenant income: 30% of area median income
(AMI) • Population served: Units are reserved for households
earning 30% or 50% AMI. 38 units are reserved for farmworkers.
• Number of units: 51 • Year placed in service: 2016 • Total development costs (millions): $11.0 • Cost estimate range (millions): $10.6-$14.4 • Wage requirement: Mix of Davis-Bacon (federal)
residential9 and commercial
Rio de Vida, originally called Prosser Family Housing, is a 51-unit townhouse development built by the
Catholic Charities Housing Services Yakima with assistance from the Office of Rural and Farmworker
Housing. The development was funded using 9% tax credits, low-interest loans from the United States
Department of Agriculture Rural Development, and Benton County 2060 funds. There are two- and three-
bedroom units. The development also features a common room, kitchen, recreation area, and computer
lab.
9 As required by the Davis-Bacon Act of 1931, federally funded construction projects must pay a minimum wage determined by the US Department of Labor to laborers and mechanics. In general, wage rates for residential construction are lower than wage rates for non-residential construction.

19-02 Final Report | Analyzing Development Costs for Low-Income Housing 19
Vantage Point Apartments, Renton
Source: Photo courtesy of King County Housing Authority.
• Developer type: Housing Authority • Developer name: King County Housing Authority • LIHTC type: 9% tax credit • Average tenant income: 18% of area median income
(AMI) • Population served: Seniors or non-elderly disabled
households earning less than 30% or 50% of the AMI • Number of units: 77 • Year placed in service: 2015 • Total development costs (millions): $26.7 • Cost estimate range (millions): $24.7-$33.4 • Wage requirement: Davis-Bacon (federal) residential 10
Vantage Point Apartments was developed by the King County Housing Authority (KCHA) on an existing
KCHA property. The development was financed using 9% tax credits, with additional funds from the state,
county, and developer. The KCHA developed the project after it secured operating assistance from the
Department of Housing and Urban Development. The development has 77 units: 72 one-bedroom and 5
two-bedroom units.
Lariat Gardens, Walla Walla
Source: Photo courtesy of Walla Walla Housing Authority.
• Developer type: Housing Authority • Developer name: Walla Walla Housing Authority • LIHTC type: Bond/4% tax credit • Average tenant income: 23% of area median income
(AMI) • Population served: Households earning 60% or below
AMI • Number of units: 43 • Year placed in service: 2015 • Total development costs (millions): $8.2 • Cost estimate range (millions): $7.5-$10.2 • Wage requirement: State residential 11
Originally a motel built in 1961, Lariat Gardens was converted into housing in 2001. The Walla Walla
Housing Authority (WWHA) acquired the site in 2009 to preserve affordable housing near the downtown
core. The WHHA renovated the existing building and constructed new buildings. The development was
10 As required by the Davis-Bacon Act of 1931, federally funded construction projects must pay a minimum wage determined by the US Department of Labor to laborers and mechanics. In general, wage rates for residential construction are lower than wage rates for non-residential construction. 11 By state law, construction contractors must pay workers prevailing wages on state-funded projects. Wage rates are established by the Department of Labor and Industries. In general, residential wage rates are lower than commercial wage rates.

19-02 Final Report | Analyzing Development Costs for Low-Income Housing 20
financed using bond/4% tax credits, low-interest loans from the Housing Trust Fund, HUD HOME funds,
and developer equity. Lariat Gardens has 43 units: 23 one-bedroom and 20 two-bedroom.
Appendix B: Detailed statistical analysis Regression analysis identified variables associated with changes in development costs JLARC staff conducted linear regression analysis to identify how certain factors affect the costs of
developing low-income housing. The model included 241 low-income housing projects financed using
Low-Income Housing Tax Credits (LIHTC) that were placed in service in the period 2010-2017.
What is regression analysis? Regression analysis is a statistical
technique used to estimate the
quantitative relationships between
multiple factors (independent
variables) and a particular outcome
(dependent variable). For example,
regression analysis can measure how
a building's size affects its
development costs. When there are
many factors that affect an
outcome, researchers can use
regression to "control for," or take into consideration, those other factors. In this case, regression analysis
can measure how a building's size affects its development costs while separately taking into consideration
other factors such as the building's location, and its developer type.
Regression analysis estimates the variance accounted for in the outcome given the independent variables.
The outcome is called the "dependent variable." In this study, JLARC staff conducted several regression
analyses using different dependent variables, including a project's total development cost (TDC) per unit,
TDC per square foot, and TDC per bedroom. Ultimately, we decided to use TDC per bedroom for three
reasons:
1. The regression analysis with TDC per bedroom was generally consistent with other models and
showed the greatest explanatory power of all the dependent variables we considered.
2. TDC per bedroom serves as a reasonable proxy for the number of people served by low-income
housing programs as compared to per unit or per square foot.

19-02 Final Report | Analyzing Development Costs for Low-Income Housing 21
3. A regression analysis of TDC per bedroom offers a unique contribution to research on low-income
housing development costs.
Most studies do not analyze TDC per bedroom because adequate data is rarely available. To make our
research accessible to researchers that use TDC per unit, we have also included our regression analysis of
TDC per unit and TDC per square foot below.
We also developed a series of regression models based on different regions of the state (King County,
Metro, and Non-Metro areas). These models are generally consistent with the initial models, so for the
sake of brevity the models are not displayed in this appendix.
Source data Data for the regression analyses came primarily from two sources: the Washington State Housing Finance
Commission (WSHFC) and the U.S. Census.
WSHFC: LIHTC Project Data - WSHFC provided JLARC staff with project cost data for Low-Income
Housing Tax Credit (LIHTC) projects placed in service between 2010 and early 2017. This is the most
recent data available. WSHFC staff indicated that the most reliable sources of cost data for LIHTC projects
are the cost certifications that all projects must submit, pursuant to requirements from the Internal
Revenue Service. JLARC staff received final cost certifications for 241 LIHTC projects, compiled this data,
and developed additional variables based on this data (see Neighborhood Characteristic Data).
U.S. Census: Neighborhood Characteristic Data - JLARC staff compiled selected characteristic data for the
census tracts in which LIHTC projects are located. These data include the median contract rent, the
median housing stock age, and the percentage of the population with income below the poverty line for
the years in which the project applied for the LIHTC allocation.
The final analyses use the characteristic data from the application year, rather than the placed-in-service
year, because these variable are a reasonable proxy for property values and infrastructure condition prior
to the start of construction. If the model had used data from the year the LIHTC projects were placed in
service, potential improvements from the LIHTC development to the neighborhood could have biased the
estimates.
Dependent variables
JLARC staff considered multiple model specifications to assess the relationship between project
characteristics and inflation-adjusted total development cost (TDC) per bedroom, per unit, and per square
foot.
The TDC calculation does not include land acquisition and reserves. JLARC staff omitted land cost from
total development costs because it varies widely due to geography and other factors that are extraneous
to housing development. Doing otherwise could offer a misleading comparison of development costs. In

19-02 Final Report | Analyzing Development Costs for Low-Income Housing 22
some cases, land may be donated, leased, or acquired at below market rates. For example, in one project a
nonprofit developer acquired a 0.8 acre property in Redmond for $75. At the time of the acquisition, a
neighboring property of nearly identical size had an appraised land value of nearly $2 million.
JLARC staff also omitted reserve amounts because they, too, could offer a misleading comparison of
development costs. Reserves are not uniformly required of all LIHTC projects. Lenders, investors, or public
funders may decide whether a reserve is required and establish the amount.
Since projects were built in different years, JLARC staff adjusted development costs for inflation. JLARC
staff used the chained price deflator for multi-family residential construction estimated by IHS-Global
Insight to index the construction costs to 2017.
The data included some projects with per-bedroom development costs well above those of most other
projects. JLARC staff statistically adjusted for the skew caused by these projects by calculating the
logarithm of the development costs. This is a typical technique to adjust for a skewed population in
regression analysis methods. Regression coefficients are typically interpreted as a unit change in an
independent variable being associated with a unit change in the dependent variable. However, the log
transformation of the original dependent-variable data requires a conversion of the regression coefficients
such that the interpretation of each unit change in the independent variable is associated with a percent
change in the dependent variable.

19-02 Final Report | Analyzing Development Costs for Low-Income Housing 23
Exhibit B1: Distribution of total development cost by developer type
Click on image to enable interactive data filtering (clicking on image will take you to another website called Tableau Public).

19-02 Final Report | Analyzing Development Costs for Low-Income Housing 24
Exhibit B2: Descriptive statistics of the dependent variables for the regression models
Dependent Variable Mean Median Standard Deviation Range Minimum Maximum Count
Natural log of TDC minus land and reserves per bedroom
11.8 11.7 0.5 1.9 10.9 12.8 241
Natural log of TDC minus land and reserves per unit
12.3 12.3 0.3 2.0 11.2 13.2 241
Natural log of TDC minus land and reserves per square foot
5.4 5.4 0.4 2.0 4.6 6.6 241
Source: JLARC staff statistical analysis of LIHTC data.
Independent variables
JLARC staff identified independent variables based on a review of existing research and interviews with
stakeholders. Explanations of the independent variables used in the regression are below and the
descriptive statistics are displayed in Exhibit B2. Many of the independent variables are binary. These
variables have a value of 1 if the condition they describe is true, and the value is 0 if the condition does
not apply. The neighborhood characteristics variables were created using the U.S. Census’ American
Community Survey data.
• Construction years are seven binary variables for the respective years 2009-2016. Construction
year is an estimated value and defined as the year prior to a project being placed in service. In the
analysis, 2015 is omitted and serves as the comparison category for each included year.
• Two binary variables capture developer type and identify projects as having been developed by
nonprofit or government entities. For-profit developers are factored into the analysis by serving
as the comparison category.
• Two binary regional variables capture projects located in King County or Metro areas12. The
comparison category is for projects located in Non-Metro areas.
• New construction is a binary variable identifying new construction projects. Rehabilitation projects
are the comparison category.
• 9% tax credit LIHTC is a binary variable identifying developments participating in the 9% tax credit
program and bond/4% tax credit program. The bond/4% tax credit program is the comparison
category.
• Number of units captures the total number of units built for each LIHTC development.
12 The Commission divides the state into three geographic regions: Seattle/King County, Metro (Clark, Pierce, Snohomish, Spokane, and Whatcom counties), and Non-Metro (all other counties).

19-02 Final Report | Analyzing Development Costs for Low-Income Housing 25
• Average square foot per unit captures the average square footage of residential space, common
areas, and structured parking per unit in the LIHTC development.
• Average number of bedrooms per unit provides an alternate measure of unit size for each LIHTC
development. This variable also allows for estimates of the number of people potentially served by
each development.
• Four stories or more is a binary variable indicating whether each project is four stories or more.
This variable was estimated by counting the projects that listed mid- or high-rise units on the cost
certifications, rather than single-family, townhouse, or walk-up units.
• Structured parking is a binary variable identifying housing developments that included any
structured parking stalls.
• Vertical integration is a binary variable identifying whether the developer was vertically integrated
for the project. Vertical integration means the developer also serves as their own general
contractor or has a shared interest with the project's general contractor. JLARC staffed relied on
information included in the cost certification documents to identify developments where the
developer also served as the general contractor.
• Homeless units is a binary variable identifying whether the project has any units dedicated for
people experiencing homelessness.
• Median contract rent is a continuous variable identifying the median rent in the census tract
where the project is located, in the year in which the application for the LIHTC was submitted.
• Median housing stock age is a continuous variable identifying the age of the neighborhood
housing in the year the application for the LIHTC was submitted. The variable was estimated as
the difference between the application year and the median build year.
• Percent below poverty is a continuous variable identifying the percentage of individuals with
income below the poverty line in the year the application for LIHTC was submitted.
Exhibit B3: Descriptive statistics of independent variables for the regression models
Descriptive Statistics - Independent Variables Mean Median Standard
Deviation Range Minimum Maximum Count
2009 construction year 0.09 0.00 0.29 1 0 1 241
2010 construction year 0.14 0.00 0.34 1 0 1 241
2011 construction year 0.10 0.00 0.31 1 0 1 241
2012 construction year 0.15 0.00 0.35 1 0 1 241
2013 construction year 0.15 0.00 0.35 1 0 1 241
2014 construction year 0.17 0.00 0.38 1 0 1 241
2015 construction year 0.20 0.00 0.40 1 0 1 241

19-02 Final Report | Analyzing Development Costs for Low-Income Housing 26
Descriptive Statistics - Independent Variables Mean Median Standard
Deviation Range Minimum Maximum Count
2016 construction year 0.01 0.00 0.09 1 0 1 241
Nonprofit 0.48 0.00 0.50 1 0 1 241
For-profit 0.23 0.00 0.42 1 0 1 241
Government 0.29 0.00 0.45 1 0 1 241
Vertical integration 0.20 0.00 0.40 1 0 1 241
King County 0.32 0.00 0.47 1 0 1 241
Metro 0.33 0.00 0.47 1 0 1 241
Non-metro 0.35 0.00 0.48 1 0 1 241
New construction 0.65 1.00 0.48 1 0 1 241
Rehabilitation of existing building
0.35 0.00 0.48 1 0 1 241
Bond/4% tax credit 0.49 0.00 0.50 1 0 1 241
9% tax credit program 0.51 1.00 0.50 1 0 1 241
Number of units 87.98 60.00 75.92 439 10 449 241
Avg. beds per unit 1.8 1.7 0.7 3 1 4 241
Residential square feet per unit
963 949 302 2,847 252 3,099 241
4 or more stories 0.3 0.00 0.5 1 0 1 241
Structured parking 0.2 0.00 0.4 1 0 1 241
Homeless units 0.2 0.00 0.4 1 0 1 241
Median contract rent (App. Yr.)
$980 $951 $327 $1,891 $195 $2,086 241
Median housing stock age (App. Yr.)
43.2 42.0 16.6 64 14 78 241
% Individuals below poverty line (App. Yr.)
21.5% 20.3% 11.9% 52.3% 1.0% 53.2% 241
Source: JLARC staff statistical analysis of LIHTC and U.S. Census data.
A correlation matrix showing the bivariate associations between each of the independent variables is
located here.

19-02 Final Report | Analyzing Development Costs for Low-Income Housing 27
Results The model with the most explanatory power used the natural logarithm of total development cost (TDC)
per bedroom, excluding reserves and land costs. The adjusted r-squared statistic is 0.765 and represents
the amount of variation in the dependent variable that is accounted for by the full regression model. The
regression analysis showed the following independent variables had a statistically significant relationship
to development cost:
• Nonprofit – predicts an average cost increase of 15 percent compared to for-profit developers.
• Government Housing Authority – predicts an average cost increase of 28 percent compared to
for-profit developers.
• King County – predicts an average cost increase of 23 percent compared to Non-Metro counties.
• New construction – predict an average cost increase of 31 percent compared to rehabilitation
projects.
• Number of units – predicts an average cost reduction of 0.1 percent per bedroom for each
additional unit. This likely reflects economies of scale for development with more units.
• Average bedrooms per unit – predicts an average cost reduction of 31 percent per bedroom for
each one-bedroom increase in the average number of bedrooms per unit. This likely reflects
economies of scale for developments with more bedrooms per unit.
• Vertical integration – predicts an average cost reduction of 11 percent compared to developments
run by non-vertically integrated developers.
• Median contract rent – predicts an average 0.03 percent cost increase per bedroom for each $1
increase in rent.
• Median housing stock age – each one-year increase in the age of housing stock predicts a 0.4
percent increase in the per bedroom cost.
• Percent individuals below poverty line – predicts an average 0.5 percent increase in the per
bedroom cost for each percentage-point increase in the poverty rate.
Other dependent variables were not statistically significant predictors of total development cost. Full
model results are shown in Exhibit B3.
Exhibit B4: Regression model results - inflation-adjusted TDC (minus land & reserves) per bedroom, natural log
Independent Variable % change
Significance (p=)
% Change Minus Std. Error
% Change Plus Std. Error
2009 construction year 5.2 0.417
-1.2 11.9
2010 construction year -4.9 0.387
-10.2 0.8
2011 construction year 1.7 0.780
-4.1 7.8

19-02 Final Report | Analyzing Development Costs for Low-Income Housing 28
Independent Variable % change
Significance (p=)
% Change Minus Std. Error
% Change Plus Std. Error
2012 construction year -2.9 0.589
-8.0 2.5
2013 construction year -0.1 0.987
-5.2 5.3
2014 construction year 2.3 0.661
-2.8 7.6
2016 construction year 11.22 0.529
-6.1 31.7
Nonprofit 15.4 0.004 ** 9.9 21.1
Government 28.4 0.000 *** 21.9 35.3
King County 22.9 0.000 *** 16.7 29.5
Metro 6.5 0.141
2.1 11.2
New construction 30.8 0.000 *** 25.8 36.0
9% tax credit program 3.2 0.489
-1.4 8.0
Number of units -0.1 0.000 *** -0.12 -0.07
Avg. beds per unit -30.8 0.000 *** -32.8 -28.8
4 or more stories 4.9 0.273
0.4 9.6
Structured parking 3.3 0.538
-2.0 8.8
Vertical integration -10.6 0.016 * -14.7 -6.4
Homeless units 3.0 0.513
-1.5 7.7
Median contract rent (App. Yr.) 0.03 0.000 *** 0.02 0.04
Median housing stock age (App. Yr.)
0.4 0.000 *** 0.3 0.5
% Individuals below poverty line (App. Yr.)
0.5 0.009 ** 0.3 0.6
Adj. R Sqr. .765
F 36.529
Sig. .000
N = 241
Note: Yellow highlights denote statistical significance - ^p≤0.10, *p≤0.05, **p≤0.01, ***p≤0.001.

19-02 Final Report | Analyzing Development Costs for Low-Income Housing 29
Source: JLARC staff statistical analysis of LIHTC and U.S. Census data.
Total development cost (excluding land and reserves) per unit
Other studies of LIHTC development costs use the total development cost (TDC) per unit as their
dependent variable, including reports by the Government Accountability Office, the National Council of
State Housing Agencies (prepared by Abt Associates), Jean Cummings and Denise Di Pasquale (economists
who conducted the first major regression analysis on LIHTC development costs for City Research, an
urban economics consulting firm, and formerly affiliated with the Joint Center for Housing Studies at
Harvard University), and the state of California (prepared by Blue Sky Consulting). In order to compare our
findings with this other research, JLARC staff conducted a regression analysis using the TDC per
unit. Although there is some variation in model specifications, JLARC staff findings are generally consistent
with other research, including the findings regarding developer type, economies of scale, and
neighborhood characteristics. The adjusted r-squared statistic indicates that this model specification
accounts for 59 percent of the variance in the natural logarithm of the TDC per unit.
Exhibit B5: Regression results - inflation adjusted TDC (excluding land & reserves) per unit, natural log
Independent Variables % change Significance % Change Minus
Std. Error % Change Plus Std.
Error
2009 construction year 3.7 0.543
-2.3 10.2
2010 construction year -4.1 0.459
-9.3 1.5
2011 construction year 2.1 0.710
-3.5 8.1
2012 construction year -3.8 0.470
-8.7 1.5
2013 construction year 2.0 0.699
-3.1 7.3
2014 construction year 5.1 0.317
0.0 10.5
2016 construction year 13.5 0.443
-3.7 33.7
Nonprofit 9.0 0.065 ^ 4.1 14.2
Government 26.1 0.000 *** 19.8 32.7
King County 21.5 0.000 *** 15.5 27.8
Metro 0.9 0.825
-3.1 5.1
New construction 29.5 0.000 *** 24.5 34.6
9% tax credit program 0.1 0.975
-4.2 4.7

19-02 Final Report | Analyzing Development Costs for Low-Income Housing 30
Independent Variables % change Significance % Change Minus
Std. Error % Change Plus Std.
Error
Number of units -0.1 0.001 *** -0.1 -0.1
Residential square feet per unit 0.04 0.000 *** 0.03 0.04
4 or more stories 0.4 0.930
-3.8 4.7
Structured parking -6.8 0.171
-11.5 -1.9
Vertical integration -9.6 0.024 ** -13.6 -5.5
Homeless units 4.3 0.349
-0.3 9.0
Median contract rent (App. Yr.) 0.03 0.001 *** 0.02 0.03
Median housing stock age (App. Yr.)
0.3 0.002 ** 0.2 0.5
% Individuals below poverty line (App. Yr.)
0.2 0.285
0.01 0.35
Adj. R Sqr. .587
F 16.535
Sig. .000
N = 241
Note: Yellow highlights denote statistical significance - ^p≤0.10, *p≤0.05, **p≤0.01, ***p≤0.001.
Source: JLARC staff statistical analysis of LIHTC and U.S. Census data.
Total development cost (less land and reserves) per square foot
JLARC staff also analyzed costs on a square foot basis. Results are similar to the per unit model, but with
less explanatory power than the per bedroom model used in the report.
Exhibit B6: Regression results - inflation adjusted TDC (excluding land & reserves) per square foot, natural log
Independent Variables % change Significance % Change Minus
Std. Error % Change Plus Std.
Error
2009 construction year 4.8 0.443
-1.4 11.5
2010 construction year -6.7 0.226
-11.9 -1.2
2011 construction year 2.1 0.722
-3.7 8.2

19-02 Final Report | Analyzing Development Costs for Low-Income Housing 31
Independent Variables % change Significance % Change Minus
Std. Error % Change Plus Std.
Error
2012 construction year -2.0 0.709
-7.1 3.4
2013 construction year 1.5 0.769
-3.6 6.9
2014 construction year 7.4 0.161
2.1 13.0
2016 construction year 16.3 0.366
-1.6 37.5
Nonprofit 7.2 0.144
2.2 12.4
Government 19.2 0.001 *** 13.1 25.5
King County 24.8 0.000 *** 18.5 31.4
Metro 2.3 0.585
-1.9 6.7
New construction 25.2 0.000 *** 20.3 30.2
9% tax credit program 2.5 0.592
-2.1 7.2
Number of units -0.07 0.005 ** -0.10 -0.05
Residential square feet per unit -0.06 0.000 *** -0.06 -0.05
4 or more stories -0.8 0.847
-5.0 3.5
Structured parking -3.7 0.470
-8.7 1.5
Vertical integration -13.3 0.002 ** -17.1 -9.3
Homeless units 6.4 0.173
1.7 11.3
Median contract rent (App. Yr.) 0.02 0.006 ** 0.01 0.03
Median housing stock age (App. Yr.)
0.4 0.000 *** 0.3 0.5
% Individuals below poverty line (App. Yr.)
0.2 0.205
0.1 0.4
Adj. R Sqr. .586
F 16.427
Sig. .000
N = 241
Note: Yellow highlights denote statistical significance - ^p≤0.10, *p≤0.05, **p≤0.01, ***p≤0.001.
19-02 Final Report | Analyzing Development Costs for Low-Income Housing 32
Source: JLARC staff statistical analysis of LIHTC and U.S. Census data.
JLARC staff interpret the regression results to be robust as all three models show similar patterns in the
estimated relationships between the independent variables and each respective dependent variable. While
the magnitude of the relationships (measured as the percent change) between each independent variable
and different measures of the total development cost depends on the model specifications, the overall
pattern is consistent using this data.
Appendix C: Applicable Statutes RCW 39.35D.080, RCW 43.185.050, RCW 43.185.070, RCW 43.185.130, RCW 43.185A.010 Affordable Housing Projects - Exemption
RCW 39.35D.080
Except as provided in this section, affordable housing projects funded out of the state capital budget are
exempt from the provisions of this chapter. On or before July 1, 2008, the *department of community,
trade, and economic development shall identify, implement, and apply a sustainable building program for
affordable housing projects that receive housing trust fund (under chapter 43.185 RCW) funding in a state
capital budget. The *department of community, trade, and economic development shall not develop its
own sustainable building standard, but shall work with stakeholders to adopt an existing sustainable
building standard or criteria appropriate for affordable housing. Any application of the program to
affordable housing, including any monitoring to track the performance of either sustainable features or
energy standards or both, is the responsibility of the *department of community, trade, and economic
development. Beginning in 2009 and ending in 2016, the *department of community, trade, and economic
development shall report to the department as required under RCW 39.35D.030(3)(b).
[ 2005 c 12 § 12.]
NOTES:
*Reviser's note: The "department of community, trade, and economic development" was renamed the
"department of commerce" by 2009 c 565.
Use of moneys for loans and grant projects to provide housing—Eligible activities.
RCW 43.185.050

19-02 Final Report | Analyzing Development Costs for Low-Income Housing 33
(1) The department must use moneys from the housing trust fund and other legislative appropriations to
finance in whole or in part any loans or grant projects that will provide housing for persons and families
with special housing needs and with incomes at or below fifty percent of the median family income for the
county or standard metropolitan statistical area where the project is located. At least thirty percent of
these moneys used in any given funding cycle must be for the benefit of projects located in rural areas of
the state as defined by the department. If the department determines that it has not received an adequate
number of suitable applications for rural projects during any given funding cycle, the department may
allocate unused moneys for projects in nonrural areas of the state.
(2) Activities eligible for assistance from the housing trust fund and other legislative appropriations include,
but are not limited to:
(a) New construction, rehabilitation, or acquisition of low and very low-income housing units;
(b) Rent subsidies;
(c) Matching funds for social services directly related to providing housing for special-need tenants in
assisted projects;
(d) Technical assistance, design and finance services and consultation, and administrative costs for eligible
nonprofit community or neighborhood-based organizations;
(e) Administrative costs for housing assistance groups or organizations when such grant or loan will
substantially increase the recipient's access to housing funds other than those available under this chapter;
(f) Shelters and related services for the homeless, including emergency shelters and overnight youth
shelters;
(g) Mortgage subsidies, including temporary rental and mortgage payment subsidies to prevent
homelessness;
(h) Mortgage insurance guarantee or payments for eligible projects;
(i) Down payment or closing cost assistance for eligible first-time home buyers;
(j) Acquisition of housing units for the purpose of preservation as low-income or very low-income housing;
(k) Projects making housing more accessible to families with members who have disabilities; and
(l) Remodeling and improvements as required to meet building code, licensing requirements, or legal
operations to residential properties owned and operated by an entity eligible under RCW 43.185A.040,
which were transferred as described in RCW 82.45.010(3)(t) by the parent of a child with developmental
disabilities.
(3) Preference must be given for projects that include an early learning facility.

19-02 Final Report | Analyzing Development Costs for Low-Income Housing 34
(4) Legislative appropriations from capital bond proceeds may be used only for the costs of projects
authorized under subsection (2)(a), (i), and (j) of this section, and not for the administrative costs of the
department.
(5) Moneys from repayment of loans from appropriations from capital bond proceeds may be used for all
activities necessary for the proper functioning of the housing assistance program except for activities
authorized under subsection (2)(b) and (c) of this section.
(6) Administrative costs associated with application, distribution, and project development activities of the
department may not exceed three percent of the annual funds available for the housing assistance
program. Reappropriations must not be included in the calculation of the annual funds available for
determining the administrative costs.
(7) Administrative costs associated with compliance and monitoring activities of the department may not
exceed one-quarter of one percent annually of the contracted amount of state investment in the housing
assistance program.
[ 2018 c 223 § 4; 2017 3rd sp.s. c 12 § 13; 2013 c 145 § 2; 2011 1st sp.s. c 50 § 953; 2006 c 371 § 236.
Prior: 2005 c 518 § 1801; 2005 c 219 § 1; 2002 c 294 § 6; 1994 c 160 § 1; 1991 c 356 § 4; 1986 c 298 §
6.]
NOTES:
Findings—2018 c 223: See note following RCW 82.45.010.
Findings—Intent—Effective date—2017 3rd sp.s. c 12: See notes following RCW 43.31.565.
Effective dates—2011 1st sp.s. c 50: See note following RCW 15.76.115.
Effective date—2006 c 371: See note following RCW 27.34.330.
Severability—Effective date—2005 c 518: See notes following RCW 28A.500.030.
Findings—2002 c 294: See note following RCW 36.22.178.
Notice of grant and loan application period—Priorities—Criteria for evaluation.
RCW 43.185.070
(1) During each calendar year in which funds from the housing trust fund or other legislative
appropriations are available for use by the department for the housing assistance program, the department
must announce to all known interested parties, and through major media throughout the state, a grant and
loan application period of at least ninety days' duration. This announcement must be made as often as the
director deems appropriate for proper utilization of resources. The department must then promptly grant

19-02 Final Report | Analyzing Development Costs for Low-Income Housing 35
as many applications as will utilize available funds less appropriate administrative costs of the department
as provided in RCW 43.185.050.
(2) In awarding funds under this chapter, the department must:
(a) Provide for a geographic distribution on a statewide basis; and
(b) Until June 30, 2013, consider the total cost and per-unit cost of each project for which an application is
submitted for funding under RCW 43.185.050(2) (a) and (j), as compared to similar housing projects
constructed or renovated within the same geographic area.
(3) The department, with advice and input from the affordable housing advisory board established in RCW
43.185B.020, or a subcommittee of the affordable housing advisory board, must report recommendations
for awarding funds in a cost-effective manner. The report must include an implementation plan, timeline,
and any other items the department identifies as important to consider to the legislature by December 1,
2012.
(4) The department must give first priority to applications for projects and activities which utilize existing
privately owned housing stock including privately owned housing stock purchased by nonprofit public
development authorities and public housing authorities as created in chapter 35.82 RCW. As used in this
subsection, privately owned housing stock includes housing that is acquired by a federal agency through a
default on the mortgage by the private owner. Such projects and activities must be evaluated under
subsection (5) of this section. Second priority must be given to activities and projects which utilize existing
publicly owned housing stock. All projects and activities must be evaluated by some or all of the criteria
under subsection (5) of this section, and similar projects and activities shall be evaluated under the same
criteria.
(5) The department must give preference for applications based on some or all of the criteria under this
subsection, and similar projects and activities must be evaluated under the same criteria:
(a) The degree of leveraging of other funds that will occur;
(b) The degree of commitment from programs to provide necessary habilitation and support services for
projects focusing on special needs populations;
(c) Recipient contributions to total project costs, including allied contributions from other sources such as
professional, craft and trade services, and lender interest rate subsidies;
(d) Local government project contributions in the form of infrastructure improvements, and others;
(e) Projects that encourage ownership, management, and other project-related responsibility
opportunities;
(f) Projects that demonstrate a strong probability of serving the original target group or income level for a
period of at least twenty-five years;

19-02 Final Report | Analyzing Development Costs for Low-Income Housing 36
(g) The applicant has the demonstrated ability, stability and resources to implement the project;
(h) Projects which demonstrate serving the greatest need;
(i) Projects that provide housing for persons and families with the lowest incomes;
(j) Projects serving special needs populations which are under statutory mandate to develop community
housing;
(k) Project location and access to employment centers in the region or area;
(l) Projects that provide employment and training opportunities for disadvantaged youth under a
youthbuild or youthbuild-type program as defined in RCW 50.72.020;
(m) Project location and access to available public transportation services; and
(n) Projects involving collaborative partnerships between local school districts and either public housing
authorities or nonprofit housing providers, that help children of low-income families succeed in school. To
receive this preference, the local school district must provide an opportunity for community members to
offer input on the proposed project at the first scheduled school board meeting following submission of
the grant application to the department.
(6) The department may only approve applications for projects for persons with mental illness that are
consistent with a behavioral health organization six-year capital and operating plan.
[ 2015 c 155 § 2; (2015 c 155 § 1 expired April 1, 2016); 2014 c 225 § 62; 2013 c 145 § 3; 2012 c 235 § 1.
Prior: 2005 c 518 § 1802; 2005 c 219 § 2; 1994 sp.s. c 3 § 9; prior: 1991 c 356 § 5; 1991 c 295 § 2; 1988 c
286 § 1; 1986 c 298 § 8.]
NOTES:
Effective date—2015 c 155 § 2: "Section 2 of this act takes effect April 1, 2016." [ 2015 c 155 § 4.]
Expiration date—2015 c 155 § 1: "Section 1 of this act expires April 1, 2016." [ 2015 c 155 § 3.]
Effective date—2014 c 225: See note following RCW 71.24.016.
Severability—Effective date—2005 c 518: See notes following RCW 28A.500.030.
Application process—Distribution procedure.
RCW 43.185.130
The application process and distribution procedure for the allocation of funds are the same as the
competitive application process and distribution procedure for the housing trust fund, described in this
chapter and chapter 43.185A RCW, except for the funds applied to the *homeless families services fund
created in RCW 43.330.167, dollars appropriated to weatherization administered through the energy

19-02 Final Report | Analyzing Development Costs for Low-Income Housing 37
matchmaker program, dollars appropriated for housing vouchers for homeless persons, victims of domestic
violence, and low-income persons or seasonal farmworkers, and dollars appropriated to any program to
provide financial assistance for grower-provided on-farm housing for low-income migrant or seasonal
farmworkers.
[ 2006 c 349 § 3.]
NOTES:
*Reviser's note: The "homeless families services fund" was renamed the "Washington youth and families
fund" by 2015 c 69 § 24.
Finding—2006 c 349: "The legislature finds that Washington is experiencing an affordable housing crisis
and that this crisis is growing exponentially every year as the population of the state expands and housing
values increase at a rate that far exceeds most households' proportionate increase in income.
The fiscal and societal costs of the lack of adequate affordable housing are high for both the public and
private sectors. Current levels of funding for affordable housing programs are inadequate to meet the
housing needs of many low-income Washington households." [ 2006 c 349 § 1.]
Affordable Housing Program
RCW 43.185A.010
Definitions.
Unless the context clearly requires otherwise, the definitions in this section apply throughout this chapter.
(1) "Affordable housing" means residential housing for rental occupancy which, as long as the same is
occupied by low-income households, requires payment of monthly housing costs, including utilities other
than telephone, of no more than thirty percent of the family's income. The department must adopt policies
for residential homeownership housing, occupied by low-income households, which specify the
percentage of family income that may be spent on monthly housing costs, including utilities other than
telephone, to qualify as affordable housing.
(2) "Contracted amount" has the same meaning as provided in RCW 43.185.020.
(3) "Department" means the department of commerce.
(4) "Director" means the director of the department of commerce.
(5) "First-time home buyer" means an individual or his or her spouse or domestic partner who have not
owned a home during the three-year period prior to purchase of a home.
(6) "Low-income household" means a single person, family or unrelated persons living together whose
adjusted income is less than eighty percent of the median family income, adjusted for household size, for
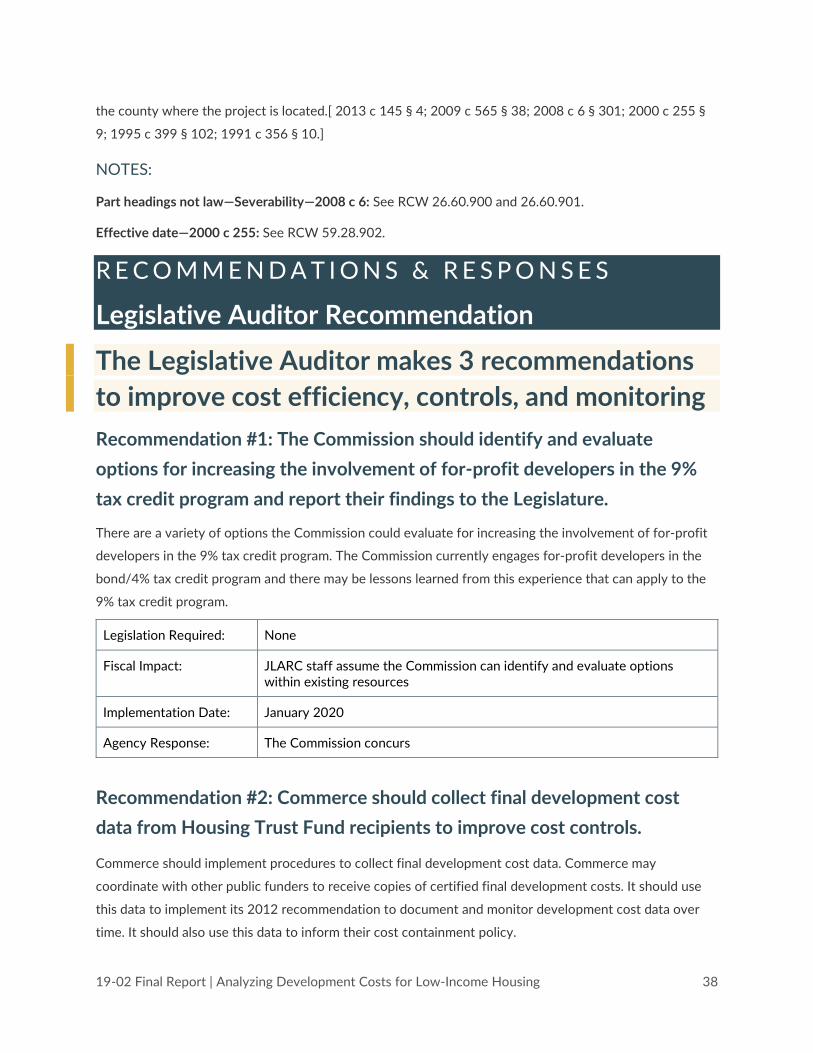
19-02 Final Report | Analyzing Development Costs for Low-Income Housing 38
the county where the project is located.[ 2013 c 145 § 4; 2009 c 565 § 38; 2008 c 6 § 301; 2000 c 255 §
9; 1995 c 399 § 102; 1991 c 356 § 10.]
NOTES:
Part headings not law—Severability—2008 c 6: See RCW 26.60.900 and 26.60.901.
Effective date—2000 c 255: See RCW 59.28.902.
R E C O M M E N D A T I O N S & R E S P O N S E S
Legislative Auditor Recommendation The Legislative Auditor makes 3 recommendations to improve cost efficiency, controls, and monitoring Recommendation #1: The Commission should identify and evaluate options for increasing the involvement of for-profit developers in the 9% tax credit program and report their findings to the Legislature. There are a variety of options the Commission could evaluate for increasing the involvement of for-profit
developers in the 9% tax credit program. The Commission currently engages for-profit developers in the
bond/4% tax credit program and there may be lessons learned from this experience that can apply to the
9% tax credit program.
Legislation Required: None
Fiscal Impact: JLARC staff assume the Commission can identify and evaluate options within existing resources
Implementation Date: January 2020
Agency Response: The Commission concurs
Recommendation #2: Commerce should collect final development cost data from Housing Trust Fund recipients to improve cost controls.
Commerce should implement procedures to collect final development cost data. Commerce may
coordinate with other public funders to receive copies of certified final development costs. It should use
this data to implement its 2012 recommendation to document and monitor development cost data over
time. It should also use this data to inform their cost containment policy.

19-02 Final Report | Analyzing Development Costs for Low-Income Housing 39
Legislation Required: None
Fiscal Impact: JLARC staff assume Commerce can implement data collection procedures within existing resources
Implementation Date: July 1, 2019
Agency Response: Commerce concurs
Recommendation #3: Commerce and the Commission should report development cost data to the Legislature annually.
Data should include the total development cost per unit for each project, descriptive statistics (such as
average and median per unit costs), regional cost variation, and other cost data that agencies deem
necessary to improve cost controls and enhance the Legislature's understanding of development costs.
Commerce and the Commission should coordinate to identify relevant development cost data and ensure
that measures are consistent across the agencies. The costs should be published in a format that allows
the Legislature and the agencies to track development costs over time.
Legislation Required: None
Fiscal Impact: JLARC staff assume Commerce and the Commission can report cost data within existing resources
Implementation Date: December 2019
Agency Response: Commerce and the Commission concur

19-02 Final Report | Analyzing Development Costs for Low-Income Housing 40
Washington State Housing Finance Commission

19-02 Final Report | Analyzing Development Costs for Low-Income Housing 41
Department of Commerce

19-02 Final Report | Analyzing Development Costs for Low-Income Housing 42

19-02 Final Report | Analyzing Development Costs for Low-Income Housing 43
Other Responses The Office of Financial Management (OFM) was given an opportunity to comment on this report. OFM
responded that it does not have any comments.
Committee Addendum Addendum approved at January 10, 2019 JLARC meeting The Committee agrees with the recommendations of the Legislative Auditor, but wishes to caution readers
against drawing unsupported conclusions from the study.
We emphasize that the analysis of factors affecting development costs, with details in Appendix B,
establishes correlation, but not causation. This retrospective study shows that, on average, for-profit
developers are involved with less costly developments. However, the analysis does not establish that this
correlation is caused by less costly projects attracting more for-profit developers; neither does it establish
that for-profit developers cause the projects to become less costly.
In the committee hearing on the preliminary report, we heard testimony that some housing projects focus
on serving the needs of specific populations by integrating space for service providers or other
amenities. Further analysis of these amenities might clarify significant cost components and further
illuminate differences between developer types. Additionally, as shown in Exhibit B1, most units built by
for-profit developers allow income levels up to 60% of Area Median Income (AMI), while units restricted
to 50%, 40%, or 30% AMI are almost entirely built by governmental or non-profit developers. This again
suggests that different developer types are serving different populations, and these different populations
may have a significant impact on costs.
M O R E A B O U T T H I S R E V I E W
Audit Authority The Joint Legislative Audit and Review Committee (JLARC) works to make state government operations
more efficient and effective. The Committee is comprised of an equal number of House members and
Senators, Democrats and Republicans.
JLARC's non-partisan staff auditors, under the direction of the Legislative Auditor, conduct performance
audits, program evaluations, sunset reviews, and other analyses assigned by the Legislature and the
Committee.
The statutory authority for JLARC, established in Chapter 44.28 RCW, requires the Legislative Auditor to
ensure that JLARC studies are conducted in accordance with Generally Accepted Government Auditing
Standards, as applicable to the scope of the audit. This study was conducted in accordance with those

19-02 Final Report | Analyzing Development Costs for Low-Income Housing 44
applicable standards. Those standards require auditors to plan and perform audits to obtain sufficient,
appropriate evidence to provide a reasonable basis for findings and conclusions based on the audit
objectives. The evidence obtained for this JLARC report provides a reasonable basis for the enclosed
findings and conclusions, and any exceptions to the application of audit standards have been explicitly
disclosed in the body of this report.
Committee Action to Distribute Report On January 10, 2019 this report was approved for distribution by the Joint Legislative Audit and Review
Committee.
Action to distribute this report does not imply the Committee agrees or disagrees with Legislative Auditor
recommendations.
Study Questions Study to compare costs of developing subsidized low-income housing and market-rate housing In 2017, the Legislature directed the Joint Legislative Audit and Review Committee (JLARC) to compare
the costs of developing subsidized low-income housing to the costs of developing market-rate housing.
The comparison may include costs such as land acquisition, design, construction, financing, and
maintenance and operations.
State-managed subsidies include grants, loans, and federal tax credits The Department of Commerce and the Washington State Housing Finance Commission manage two key
programs that subsidize low-income housing development. Together, the programs have funded over
21,000 units since 2010.
• Housing Trust Fund (Commerce): Provides grants and loans, primarily with state funds.
• Low-Income Housing Tax Credit (Commission): Provides federally funded tax credits.
Low-income housing developers include for-profit businesses, nonprofit organizations, local housing
authorities, and tribal housing entities. Projects typically involve multifamily housing.
Study will focus on development costs for multifamily housing and address three questions
1. What types of data and analysis could be used to compare development costs of subsidized low-
income housing and market-rate housing?

19-02 Final Report | Analyzing Development Costs for Low-Income Housing 45
2. How do development costs compare between different developers of subsidized low-income
housing projects?
3. What are the major cost drivers for subsidized low-income housing development? What cost
controls does the state implement and are there additional measures that could be exercised?
The study will not address subsidies for rental payments or subsidies that are not administered by state
agencies.
Study Timeframe Staff will present the preliminary report in December 2018 and the final report in January 2019.
Methodology The methodology JLARC staff use when conducting analyses is tailored to the scope of each study, but
generally includes the following:
• Interviews with stakeholders, agency representatives, and other relevant organizations or
individuals.
• Site visits to entities that are under review.
• Document reviews, including applicable laws and regulations, agency policies and procedures
pertaining to study objectives, and published reports, audits or studies on relevant topics.
• Data analysis, which may include data collected by agencies and/or data compiled by JLARC staff.
Data collection sometimes involves surveys or focus groups.
• Consultation with experts when warranted. JLARC staff consult with technical experts when
necessary to plan our work, to obtain specialized analysis from experts in the field, and to verify
results.
The methods used in this study were conducted in accordance with Generally Accepted Government
Auditing Standards.
More details about specific methods related to individual study objectives are described in the body of the
report under the report details tab or in technical appendices.

19-02 Final Report | Analyzing Development Costs for Low-Income Housing 46
C O N T A C T
Authors Amanda Eadrick, Team Lead, 360-786-5174
Aaron Cavin, Research Analyst, 360-786-5194
Geoff Cunningham, Project Research Analyst, 360-786-5183
Pete van Moorsel, Research Analyst, 360-786-5185
Eric Whitaker, Research Analyst, 360-786-5618
Eric Thomas, Audit Coordinator
Keenan Konopaski, Legislative Auditor
JLARC Members as of publication date Senators Joe Fain
Bob Hasegawa
Mark Miloscia
Mark Mullet, Assistant Secretary
Rebecca Saldaña
Shelly Short
Dean Takko
Lynda Wilson, Vice Chair
Representatives Jake Fey
Larry Haler
Christine Kilduff
Vicki Kraft
Ed Orcutt, Secretary
Gerry Pollet
Derek Stanford, Chair
Drew Stokesbary
Washington Joint Legislative Audit and Review Committee
106 11th Avenue SW, Suite 2500
PO Box 40910
Olympia, WA 98504-0910
Phone: 360-786-5171
Fax: 360-786-5180
Email: [email protected]