19 - intech - opencdn.intechopen.com/pdfs/13201/...transfer_to_supercritical_fluids.pdfheat transfer...
TRANSCRIPT

19
Heat Transfer to Fluids at Supercritical Pressures
Igor Pioro and Sarah Mokry University of Ontario Institute of Technology
Canada
1. Introduction
Prior to a general discussion on parametric trends in heat transfer to supercritical fluids, it is
important to define special terms and expressions used at these conditions. Therefore,
general definitions of selected terms and expressions, related to heat transfer to fluids at
critical and supercritical pressures, are listed below. For better understanding of these terms
and expressions a graph is shown in Fig. 1. General definitions of selected terms and
expressions related to critical and supercritical regions are listed in the Chapter
“Thermophysical Properties at Critical and Supercritical Conditions”.
Axial Location, m
0.0 0.5 1.0 1.5 2.0 2.5 3.0 3.5 4.0
Tem
per
atu
re,
o C
300
350
400
450
600
550
500
Bulk Fluid Enthalpy, kJ/kg
1400 1600 1800 2000 2200 2400 2600 2800
HT
C, k
W/
m2
K
2
4
8
12
1620
2836
Heated length
Bulk fluid temperature
tin
tout
Inside wall temperature
Heat transfer coefficient
pin=24.0 MPa
G=503 kg/m2 sQ=54 kW
qave= 432 kW/m2
C381.1t opc =
Hpc
Dittus - Boelter correlation
DHT Improved HT
Normal HTNormal HT
Fig. 1. Temperature and heat transfer coefficient profiles along heated length of vertical circular tube (Kirillov et al., 2003): Water, D=10 mm and Lh=4 m.
www.intechopen.com

Heat Transfer - Theoretical Analysis, Experimental Investigations and Industrial Systems
482
General definitions of selected terms and expressions related to heat transfer at critical
and supercritical pressures
Deteriorated Heat Transfer (DHT) is characterized with lower values of the wall heat
transfer coefficient compared to those at the normal heat transfer; and hence has higher
values of wall temperature within some part of a test section or within the entire test
section.
Improved Heat Transfer (IHT) is characterized with higher values of the wall heat transfer
coefficient compared to those at the normal heat transfer; and hence lower values of wall
temperature within some part of a test section or within the entire test section. In our
opinion, the improved heat-transfer regime or mode includes peaks or “humps” in the heat
transfer coefficient near the critical or pseudocritical points.
Normal Heat Transfer (NHT) can be characterized in general with wall heat transfer
coefficients similar to those of subcritical convective heat transfer far from the critical or
pseudocritical regions, when are calculated according to the conventional single-phase
Dittus-Boelter-type correlations: Nu = 0.0023 Re0.8Pr0.4.
Pseudo-boiling is a physical phenomenon similar to subcritical pressure nucleate boiling,
which may appear at supercritical pressures. Due to heating of supercritical fluid with a
bulk-fluid temperature below the pseudocritical temperature (high-density fluid, i.e.,
“liquid”), some layers near a heating surface may attain temperatures above the
pseudocritical temperature (low-density fluid, i.e., “gas”) (for specifics of thermophysical
properties, see Chapter “Thermophysical Properties at Critical and Supercritical
Conditions”). This low-density “gas” leaves the heating surface in the form of variable
density (bubble) volumes. During the pseudo-boiling, the wall heat transfer coefficient
usually increases (improved heat-transfer regime).
Pseudo-film boiling is a physical phenomenon similar to subcritical-pressure film boiling,
which may appear at supercritical pressures. At pseudo-film boiling, a low-density fluid (a
fluid at temperatures above the pseudocritical temperature, i.e., “gas”) prevents a high-
density fluid (a fluid at temperatures below the pseudocritical temperature, i.e., “liquid”)
from contacting (“rewetting”) a heated surface (for specifics of thermophysical properties,
see Chapter “Thermophysical Properties at Critical and Supercritical Conditions”). Pseudo-
film boiling leads to the deteriorated heat-transfer regime.
Water is the most widely used coolant or working fluid at supercritical pressures. The
largest application of supercritical water is in supercritical “steam” generators and
turbines, which are widely used in the power industry worldwide (Pioro and Duffey,
2007). Currently, upper limits of pressures and temperatures used in the power industry
are about 30 – 35 MPa and 600 – 625ºC, respectively. New direction in supercritical-water
application in the power industry is a development of SuperCritical Water-cooled nuclear
Reactor (SCWR) concepts, as part of the Generation-IV International Forum (GIF)
initiative. However, other areas of using supercritical water exist (Pioro and Duffey,
2007).
Supercritical carbon dioxide was mostly used as a modelling fluid instead of water due to
significantly lower critical parameters (for details, see Chapter “Thermophysical Properties
at Critical and Supercritical Conditions”). However, currently new areas of using
supercritical carbon dioxide as a coolant or working fluid have been emerged (Pioro and
Duffey, 2007).
www.intechopen.com

Heat Transfer to Fluids at Supercritical Pressures
483
The third supercritical fluid used in some special technical applications is helium (Pioro and Duffey, 2007). Supercritical helium is used in cooling coils of superconducting electromagnets, superconducting electronics and power-transmission equipment. Also, refrigerant R-134a is being considered as a perspective modelling fluid due to its lower critical parameters compared to those of water (Pioro and Duffey, 2007). Experiments at supercritical pressures are very expensive and require sophisticated equipment and measuring techniques. Therefore, some of these studies (for example, heat transfer in bundles) are proprietary and hence, were not published in the open literature. The majority of studies (Pioro and Duffey, 2007) deal with heat transfer and hydraulic resistance of working fluids, mainly water, carbon dioxide and helium, in circular bare tubes. In addition to these fluids, forced- and free-convection heat-transfer experiments were conducted at supercritical pressures, using liquefied gases such as air, argon, hydrogen; nitrogen, nitrogen tetra-oxide, oxygen and sulphur hexafluoride; alcohols such as ethanol and methanol; hydrocarbons such as n-heptane, n-hexane, di-iso-propyl-cyclo-hexane, n-octane, iso-butane, iso-pentane and n-pentane; aromatic hydrocarbons such as benzene and toluene, and poly-methyl-phenyl-siloxane; hydrocarbon coolants such as kerosene, TS-1 and RG-1, jet propulsion fuels RT and T-6; and refrigerants. A limited number of studies were devoted to heat transfer and pressure drop in annuli, rectangular-shaped channels and bundles. Accounting that supercritical water and carbon dioxide are the most widely used fluids and
that the majority of experiments were performed in circular tubes, specifics of heat transfer
and pressure drop, including generalized correlations, will be discussed in this chapter
based on these conditions1.
Specifics of thermophysical properties at critical and supercritical pressures for these fluids
are discussed in the Chapter “Thermophysical Properties at Critical and Supercritical
Conditions” and Pioro and Duffey (2007).
2. Convective heat transfer to fluids at supercritical pressures: Specifics of supercritical heat transfer
All2 primary sources of heat-transfer experimental data for water and carbon dioxide
flowing inside circular tubes at supercritical pressures are listed in Pioro and Duffey (2007).
In general, three major heat-transfer regimes (for their definitions, see above) can be noticed
at critical and supercritical pressures (for details, see Figs. 1 and 2):
1. Normal heat transfer;
2. Improved heat transfer; and
3. Deteriorated heat transfer.
Also, two special phenomena (for their definitions, see above) may appear along a heated
surface:
1. pseudo-boiling;
2. pseudo-film boiling.
1Specifics of heat transfer and pressure drop at other conditions and/or for other fluids are discussed in Pioro and Duffey (2007). 2 “All” means all sources found by the authors from a total of 650 references dated mainly from 1950 till beginning of 2006.
www.intechopen.com

Heat Transfer - Theoretical Analysis, Experimental Investigations and Industrial Systems
484
These heat-transfer regimes and special phenomena appear to be due to significant variations of thermophysical properties near the critical and pseudocritical points (see Fig. 3) and due to operating conditions.
Axial Location, m
0.0 0.5 1.0 1.5 2.0 2.5 3.0 3.5 4.0
Tem
per
atu
re,
oC
350
375
400
HT
C, k
W/
m2
K
20
30
40
50
60
70
80
Bulk Fluid Enthalpy, kJ/kg
1700 1800 1900 2000 2100 2200
Heated length
Bulk fluid temperature
Inside wall temperature
Heat transfer c
oefficient
p in=24.0 MPa, G=1494 kg/m2s,
Q=61 kW, q ave=489 kW/m2
Hpc
tpc= 381.3 oC
tin
tout
Dittus - Boelter correlation
Normal HT
Improved HT
(a)
Axial Location, m
0.0 0.5 1.0 1.5 2.0 2.5 3.0 3.5 4.0
Tem
per
atu
re,
oC
325
350
400
375
425
450
300
Bulk Fluid Enthalpy, kJ/kg
1400 1600 1800 2000 2200 2400
HT
C, k
W/
m2
K
6
8
12
16
2024
32
404856
Heated length
Bulk fluid temperature
tin
tout
Inside wall temperature
Heat transfer coefficient
pin=23.9 MPa, G=997 kg/m2s
Q=74 kW, qave= 584 kW/m2
C380.8t opc =
Hpc
Dittus - Boelter correlation
DHT
Normal HT
Axial Location, m
0.0 0.5 1.0 1.5 2.0 2.5 3.0 3.5 4.0
Tem
per
atu
re,
oC
300
350
400
450
550
500
Bulk Fluid Enthalpy, kJ/kg
1600 1800 2000 2200 2400 2600 2800
HT
C, k
W/
m2
K
6
8
12
1620
28
3644
56
Heated length
Bulk fluid temperature
tin
toutInside wall temperature
Heat transfer coefficient
pin
=24.0 MPa
G=1000 kg/m2sQ=103 kWqave= 826 kW/m2
C381.3t opc =
Hpc
Dittus - Boelter correlation
DHT
(b) (c)
Fig. 2. Temperature and heat transfer coefficient profiles along heated length of vertical circular tube (Kirillov et al. 2003): Water, D=10 mm and Lh=4 m.
Therefore, the following cases can be distinguished at critical and supercritical pressures (for details, see Figs. 1 and 2): a. Wall and bulk-fluid temperatures are below a pseudocritical temperature within a part
or the entire heated channel; b. Wall temperature is above and bulk-fluid temperature is below a pseudocritical
temperature within a part or the entire heated channel;
www.intechopen.com
Heat Transfer to Fluids at Supercritical Pressures
485
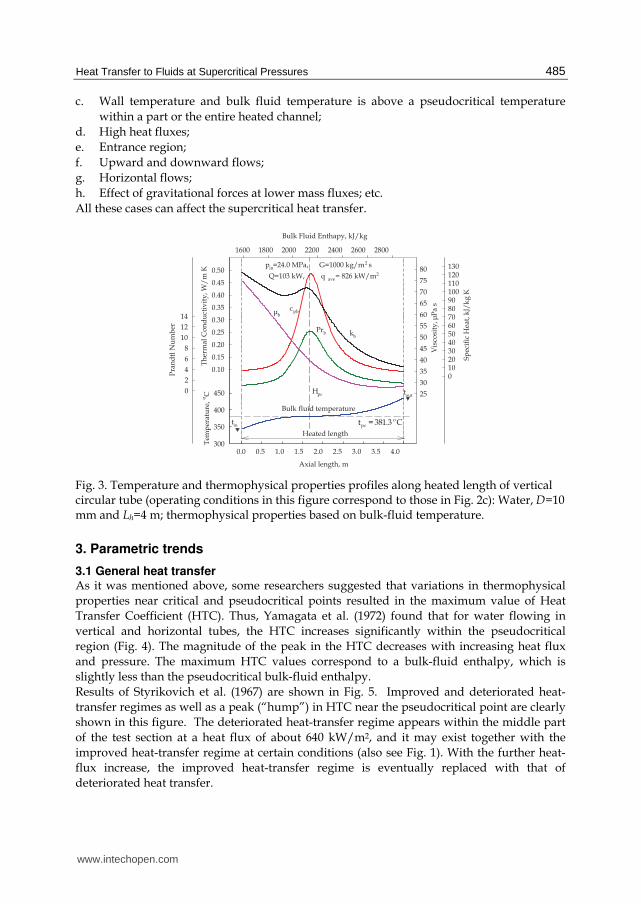
c. Wall temperature and bulk fluid temperature is above a pseudocritical temperature
within a part or the entire heated channel;
d. High heat fluxes;
e. Entrance region;
f. Upward and downward flows;
g. Horizontal flows;
h. Effect of gravitational forces at lower mass fluxes; etc.
All these cases can affect the supercritical heat transfer.
Axial length, m
0.0 0.5 1.0 1.5 2.0 2.5 3.0 3.5 4.0
Tem
per
atu
re,
oC
300
350
400
450
Sp
ecif
ic H
eat,
kJ/
kg
K
0102030405060708090100110120130
Pra
nd
tl N
um
ber
0
2
4
6
8
10
12
14
Vis
cosi
ty, μ
Pa
s
25
30
35
40
45
50
55
60
65
70
75
80
Bulk Fluid Enthapy, kJ/kg
1600 1800 2000 2200 2400 2600 2800
Th
erm
al C
on
du
ctiv
ity
, W/
m K
0.10
0.15
0.20
0.25
0.30
0.35
0.40
0.45
0.50
Heated length
C381.3t opc =
Hpc
Bulk fluid temperature
kb
μb
Prb
cpb
tin
tout
pin=24.0 MPa, G=1000 kg/m2 s
Q=103 kW, q ave= 826 kW/m2
Fig. 3. Temperature and thermophysical properties profiles along heated length of vertical circular tube (operating conditions in this figure correspond to those in Fig. 2c): Water, D=10 mm and Lh=4 m; thermophysical properties based on bulk-fluid temperature.
3. Parametric trends
3.1 General heat transfer As it was mentioned above, some researchers suggested that variations in thermophysical
properties near critical and pseudocritical points resulted in the maximum value of Heat
Transfer Coefficient (HTC). Thus, Yamagata et al. (1972) found that for water flowing in
vertical and horizontal tubes, the HTC increases significantly within the pseudocritical
region (Fig. 4). The magnitude of the peak in the HTC decreases with increasing heat flux
and pressure. The maximum HTC values correspond to a bulk-fluid enthalpy, which is
slightly less than the pseudocritical bulk-fluid enthalpy.
Results of Styrikovich et al. (1967) are shown in Fig. 5. Improved and deteriorated heat-
transfer regimes as well as a peak (“hump”) in HTC near the pseudocritical point are clearly
shown in this figure. The deteriorated heat-transfer regime appears within the middle part
of the test section at a heat flux of about 640 kW/m2, and it may exist together with the
improved heat-transfer regime at certain conditions (also see Fig. 1). With the further heat-
flux increase, the improved heat-transfer regime is eventually replaced with that of
deteriorated heat transfer.
www.intechopen.com

Heat Transfer - Theoretical Analysis, Experimental Investigations and Industrial Systems
486
p=22.6 MPaG=1177-1189 kg/m2 sD=10 mm
Bulk Fluid Enthalpy, kJ/kg
1000 1500 2000 2500 3000
Hea
t T
ran
sfer
Co
effi
cien
t, k
W/
m2
K
0
10
20
30
40
50
60
70
80
Tem
per
atu
re,
oC
200300400500
q=233 kW/m2
q=465 kW/m2
q=698 kW/m2
q=930 kW/m2
Hp
c=21
03.6
kJ/
kg
tpc=376.0 oC
Bulk Fluid TemperatureH
ea
t T
ran
sfe
r C
oe
ffic
ien
ts
(a)
p=24.5 MPaG=1156-1235 kg/m2sD=10 mm
Bulk Fluid Enthalpy, kJ/kg
1000 1500 2000 2500 3000
Hea
t T
ran
sfer
Co
effi
cien
t, k
W/
m2K
0
10
20
30
40
50
60
70
80
Tem
per
atu
re,
oC
200300400500
q=233 kW/m2
q=465 kW/m2
q=698 kW/m2
q=930 kW/m2
Hpc=2148.2 kJ/kg
tpc=383.1 oC
Bulk fluid temperature
He
at
tra
nsf
er
coe
ffic
ien
ts p=29.4 MPaG=1114-1126 kg/m2sD=10 mm
Bulk Fluid Enthalpy, kJ/kg
1000 1500 2000 2500 3000
Hea
t T
ran
sfer
Co
effi
cien
t, k
W/
m2
K
0
10
20
30
40
50
60
70
80
Tem
per
atu
re,
oC
200300400500
q=233 kW/m2
q=465 kW/m2
q=698 kW/m2
q=930 kW/m2
Hpc=2199.2 kJ/kg
tpc=400.0oC
Bulk fluid temperature
Heat transfer c
oefficients
(b) (c)
Fig. 4. Heat transfer coefficient vs. bulk-fluid enthalpy in vertical tube with upward flow at various pressures (Yamagata et al., 1972): Water – (a) p=22.6 MPa; (b) p=24.5 MPa; and (c) p=29.4 MPa.
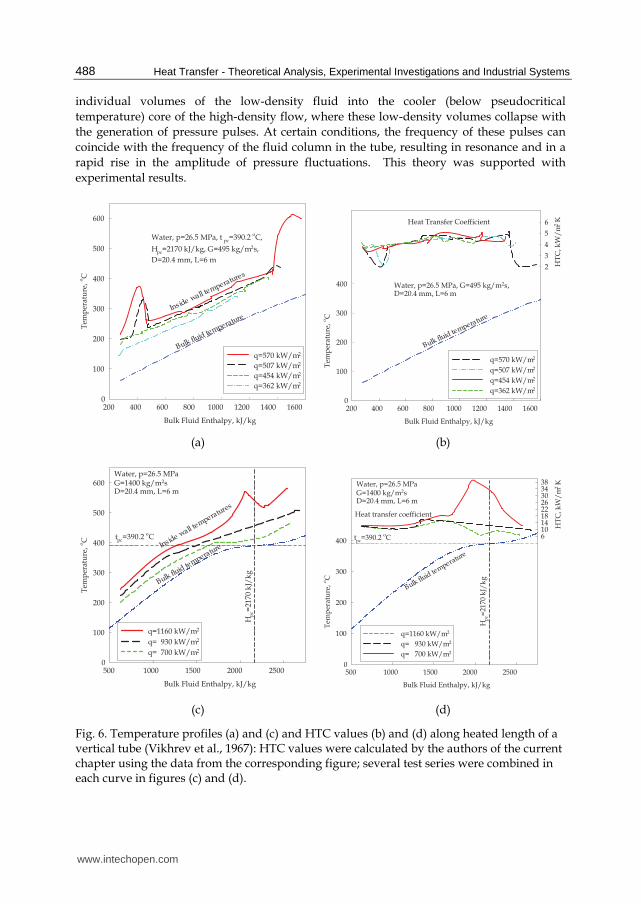
Vikhrev et al. (1971, 1967) found that at a mass flux of 495 kg/m2s, two types of deteriorated
heat transfer existed (Fig. 6): The first type appeared within the entrance region of the tube L
/ D < 40 – 60; and the second type appeared at any section of the tube, but only within a
certain enthalpy range. In general, the deteriorated heat transfer occurred at high heat
fluxes.
The first type of deteriorated heat transfer observed was due to the flow structure within the
entrance region of the tube. However, this type of deteriorated heat transfer occurred
mainly at low mass fluxes and at high heat fluxes (Fig. 6a,b) and eventually disappeared at
high mass fluxes (Fig. 6c,d).
www.intechopen.com

Heat Transfer to Fluids at Supercritical Pressures
487
Bulk Fluid Enthalpy, kJ/kg
1200 1400 1600 1800 2000 2200 2400 2600
Hea
t T
ran
sfer
Co
effi
cien
t, k
W/
m2K
40
60
80
100
120
140
160
180
200
Tem
per
atu
re,
oC
270300330360390
348
523
640
756
872
Heat flux in kW/m2p=24.0 MPaG=700 kg/m2 s
Hpc=2138.1 kJ/kg
Impr
oved
Hea
t Tra
nsfe
r
Deteriorated Heat TransferTpc=381.2oC
Bulk Fluid Temperature
Fig. 5. Variations in heat transfer coefficient values of water flowing in tube (Styrikovich et al., 1967).
The second type of deteriorated heat transfer occurred when the wall temperature exceeded
the pseudocritical temperature (Fig. 6). According to Vikhrev et al. (1967), the deteriorated
heat transfer appeared when q / G > 0.4 kJ/kg (where q is in kW/m2 and G is in kg/m2s).
This value is close to that suggested by Styrikovich et al. (1967) (q / G > 0.49 kJ/kg).
However, the above-mentioned definitions of two types of deteriorated heat transfer are not
enough for their clear identification.
3.2 Pseudo-boiling and pseudo-film boiling phenomena Ackerman (1970) investigated heat transfer to water at supercritical pressures flowing in
smooth vertical tubes with and without internal ribs within a wide range of pressures, mass
fluxes, heat fluxes and diameters. He found that pseudo-boiling phenomenon could occur
at supercritical pressures. The pseudo-boiling phenomenon is thought to be due to large
differences in fluid density below the pseudocritical point (high-density fluid, i.e., “liquid”)
and beyond (low-density fluid, i.e., “gas”). This heat-transfer phenomenon was affected
with pressure, bulk-fluid temperature, mass flux, heat flux and tube diameter.
The process of pseudo-film boiling (i.e., low-density fluid prevents high-density fluid from
“rewetting” a heated surface) is similar to film boiling, which occurs at subcritical pressures.
Pseudo-film boiling leads to the deteriorated heat transfer. However, the pseudo-film
boiling phenomenon may not be the only reason for deteriorated heat transfer. Ackerman
noted that unpredictable heat-transfer performance was sometimes observed when the
pseudocritical temperature of the fluid was between the bulk-fluid temperature and the
heated surface temperature.
Kafengaus (1986, 1975), while analyzing data of various fluids (water, ethyl and methyl
alcohols, heptane, etc.), suggested a mechanism for “pseudo-boiling” that accompanies heat
transfer to liquids flowing in small-diameter tubes at supercritical pressures. The onset of
pseudo-boiling was assumed to be associated with the breakdown of a low-density wall
layer that was present at an above-pseudocritical temperature, and with the entrainment of
www.intechopen.com
Heat Transfer - Theoretical Analysis, Experimental Investigations and Industrial Systems
488
individual volumes of the low-density fluid into the cooler (below pseudocritical
temperature) core of the high-density flow, where these low-density volumes collapse with
the generation of pressure pulses. At certain conditions, the frequency of these pulses can
coincide with the frequency of the fluid column in the tube, resulting in resonance and in a
rapid rise in the amplitude of pressure fluctuations. This theory was supported with
experimental results.
Bulk Fluid Enthalpy, kJ/kg
200 400 600 800 1000 1200 1400 1600
Tem
per
atu
re,
oC
0
100
200
300
400
500
600
q=570 kW/m2
q=507 kW/m2
q=454 kW/m2
q=362 kW/m2
Bulk fluid temperature
Inside wall temperatures
Water, p=26.5 MPa, t pc=390.2 oC,
Hpc=2170 kJ/kg, G=495 kg/m2s,
D=20.4 mm, L=6 m
Bulk Fluid Enthalpy, kJ/kg
200 400 600 800 1000 1200 1400 1600
Tem
per
atu
re,
oC
0
100
200
300
400
HT
C, k
W/
m2
K
2
3
4
5
6
q=570 kW/m2
q=507 kW/m2
q=454 kW/m2
q=362 kW/m2
Bulk fluid temperature
Water, p=26.5 MPa, G=495 kg/m2s,D=20.4 mm, L=6 m
Heat Transfer Coefficient
(a) (b)
Bulk Fluid Enthalpy, kJ/kg
500 1000 1500 2000 2500
Tem
per
atu
re,
oC
0
100
200
300
400
500
600
q=1160 kW/m2
q= 930 kW/m2
q= 700 kW/m2
Water, p=26.5 MPaG=1400 kg/m2sD=20.4 mm, L=6 m
Hp
c=21
70 k
J/k
g
tpc
=390.2 oC
Bulk fluid te
mperatureInside wall temperatures
Bulk Fluid Enthalpy, kJ/kg
500 1000 1500 2000 2500
Tem
per
atu
re,
oC
0
100
200
300
400
HT
C, k
W/
m2
K
61014182226303438
q=1160 kW/m2
q= 930 kW/m2
q= 700 kW/m2
Water, p=26.5 MPaG=1400 kg/m2sD=20.4 mm, L=6 m
Hp
c=21
70 k
J/k
g
tpc=390.2 oC
Bulk fluid te
mperature
Heat transfer coefficient
(c) (d)
Fig. 6. Temperature profiles (a) and (c) and HTC values (b) and (d) along heated length of a vertical tube (Vikhrev et al., 1967): HTC values were calculated by the authors of the current chapter using the data from the corresponding figure; several test series were combined in each curve in figures (c) and (d).
www.intechopen.com

Heat Transfer to Fluids at Supercritical Pressures
489
Bulk Fluid Enthalpy, kJ/kg
1200 1400 1600 1800 2000
Tem
per
atu
re,
oC
250
300
350
400
450
HT
C,
kW
/m
2K
4
8
12
16
Bulk fluid temperature
Inside wall temperature
q=252 kW/m2
tpc
=381.6 oC
Normal heat transfer
Heat transfer coefficient
(a)
q=378 kW/m2
Enthalpy, kJ/kg
1200 1400 1600 1800 2000
Tem
per
atu
re,
oC
250
300
350
400
450
HT
C, k
W/
m2K
4
8
12
16
20
Pseudocritical temperature
Bulk fluid te
mperature
Inside wall temperature
Entrance region
Normal heat transfer
Heat transfer coefficient
q=1101 kW/m2
Bulk Fluid Enthalpy, kJ/kg
1400 1500 1600 1700 1800 1900 2000 2100
Tem
per
atu
re,
oC
200
300
400
500
600 HT
C, k
W/
m2
K
4
8
12
16
Inside wall temperature
Bulk fluid temperature
Pseudocritical temperature
Entrance region
Heat transfer coefficient
Deteriorated heat transfer
(b) (c)
Fig. 7. Temperature and heat transfer coefficient profiles along 38.1-mm ID smooth vertical tube at different mass fluxes (Lee and Haller, 1974): Water, p=24.1 MPa, and Hpc=2140 kJ/kg; (a) G=542 kg/m2s, (b) G=542 kg/m2s, and (c) G=1627 kg/m2s; HTC values were calculated by the authors of the current chapter using data from the corresponding figure; several test series were combined in each curve.
3.3 Horizontal flows All3 primary sources of experimental data for heat transfer to water and carbon dioxide
flowing in horizontal test sections are listed in Pioro and Duffey (2007).
3 “All” means all sources found by the authors from a total of 650 references dated mainly from 1950 till
beginning of 2006.
www.intechopen.com

Heat Transfer - Theoretical Analysis, Experimental Investigations and Industrial Systems
490
Krasyakova et al. (1967) found that in a horizontal tube, in addition to the effects of non-isothermal flow that is relevant to a vertical tube, the effect of gravitational forces is important. The latter effect leads to the appearance of temperature differences between the lower and upper parts of the tube. These temperature differences depend on flow enthalpy, mass flux and heat flux. A temperature difference in a tube cross section was found at G = 300 – 1000 kg/m2s and within the investigated range of enthalpies (Hb = 840 – 2520 kJ/kg). The temperature difference was directly proportional to increases in heat-flux values. The effect of mass flux on the temperature difference is the opposite, i.e., with increase in mass flux the temperature difference decreases. Deteriorated heat transfer was also observed in a horizontal tube. However, the temperature profile for a horizontal tube at locations of deteriorated heat transfer differs from that for a vertical tube, being smoother for a horizontal tube compared to that of a vertical tube with a higher temperature increase on the upper part of the tube than on the lower part.
3.4 Heat-transfer enhancement Similar to subcritical pressures, turbulization of flow usually leads to heat-transfer enhancement at supercritical pressures. Shiralkar and Griffith (1970) determined both theoretically (for supercritical water) and experimentally (for supercritical carbon dioxide) the limits for safe operation, in terms of the maximum heat flux for a particular mass flux. Their experiments with a twisted tape inserted inside a test section showed that heat transfer was improved by this method. Also, they found that at high heat fluxes deteriorated heat transfer occurred when the bulk-fluid temperature was below and the wall temperature was above the pseudocritical temperature. Findings of Lee and Haller (1974) are shown in Fig. 7. They combined several test series into one graph. Due to the deteriorated heat-transfer region at the tube exit (one set of data) and the entrance effect in another set of data, experimental curves discontinue (see Fig. 7b,c). In general, they found heat flux and tube diameter to be the important parameters affecting minimum mass-flux limits to prevent pseudo-film boiling. Multi-lead ribbed tubes were found to be effective in preventing pseudo-film boiling.
3.5 Heat transfer in bundles SCWRs will be cooled with a light-water coolant at a pressure of about 25 MPa and within a range of temperatures from 280 – 350°C to 550 – 625°C (inlet and outlet temperatures). Performing experiments at these conditions and bundle flow geometry is very complicated and expensive task. Therefore, currently preliminary experiments are performed in modelling fluids such as carbon dioxide and Freons (Richards et al., 2010). Their thermophysical properties are well known within a wide range of conditions, including the supercritical-pressure region (for details, see in Pioro and Duffey (2007) and in Chapter “Thermophysical Properties at Critical and Supercritical Conditions”). Experimental data obtained in a bare bundle with 7 circular elements, installed in a hexagonal flow channel located inside a ceramic insert surrounded by a pressure tube (Fig. 8) and cooled with R-12, are shown in Fig. 9 for reference purposes. The bundle has a 6 + 1 bare-element arrangement with each element being held at the ends to eliminate the use of spacers. Each of the 7 heating elements has a 9.5-mm outer diameter, and they are spaced one from another with a pitch of 11.29 mm. The total flow area is 374.0 mm2, wetted perimeter – 318.7 mm, and hydraulic-equivalent diameter – 4.69 mm.
www.intechopen.com

Heat Transfer to Fluids at Supercritical Pressures
491
(a) (b) (c)
Fig. 8. Flow-channel cross sections: (a) with dimensions; (b) with elements numbering, and (c) with thermocouple layout.
(a) (b)
Fig. 9. Bulk-fluid and sheath-temperature profiles along bundle heated length: (a) normal heat-transfer regime; and (b) normal and deteriorated heat-transfer regimes.
The main test-section components are cylindrical heated elements installed tightly in the vertical hexagonal shell (downward flow). The entire internal setup is contained by a cylindrical 40 × 4 mm pressure tube with welded flanges at the edges that form the upper (inlet) chamber and lower (outlet) chamber, with a total heated length of 1000 mm. Four thermocouples installed into the top and bottom chambers were used to measure Freon-12 inlet and outlet temperatures. Basic parameters of the experimental setup are listed in Table 1. The experiments showed that at certain operating conditions the deteriorated heat-transfer regime is possible not only in bare tubes, but also in “bare” bundles. This is the important statement, because previously deteriorated heat-transfer regimes have not been encountered in supercritical water-cooled bundles with helical fins (Pioro and Duffey, 2007).
www.intechopen.com

Heat Transfer - Theoretical Analysis, Experimental Investigations and Industrial Systems
492
Pressure Up to 5.0 MPa (equivalent to 25.5 MPa for water) Temperature of Freon-12 Up to 120°С (400°С heating elements) Maximum flow rate 20 + 20 m3/h Maximum pump pressure head 1.0 + 1.0 MPa
Experimental test-section power Up to 1 MW Experimental test-section height Up to 8 m Data Acquisition System (DAS) Up to 256 channels
Table 1. Main parameters of 7-element bare bundle cooled with R-12.
4. Practical prediction methods for convection heat transfer at supercritical pressures
4.1 Circular vertical tubes Unfortunately, satisfactory analytical methods have not yet been developed due to the difficulty in dealing with steep property variations, especially, in turbulent flows and at high heat fluxes. Therefore, generalized correlations based on experimental data are used for HTC calculations at supercritical pressures. There are a lot of various correlations for convection heat transfer in circular tubes at supercritical pressures (for details, see in Pioro and Duffey (2007)). However, an analysis of these correlations showed that they are more or less accurate only within a particular dataset, which was used to derive the correlation, but show a significant deviation in predicting other experimental data. Therefore, only selected correlations are listed below. In general, many of these correlations are based on the conventional Dittus-Boelter-type correlation (see Eq. (1)) in which the regular specific heat is replaced with the cross-section
averaged specific heat within the range of (Tw – Tb); w b
w b
H H
T T
⎛ ⎞−⎜ ⎟−⎝ ⎠ , J/kg K (see Fig. 8). Also,
additional terms, such as: ; ;
k m n
b b b
w w w
k
k
μ ρμ ρ
⎛ ⎞ ⎛ ⎞ ⎛ ⎞⎜ ⎟ ⎜ ⎟ ⎜ ⎟⎝ ⎠ ⎝ ⎠ ⎝ ⎠ ; etc., can be added into correlations to
account for significant variations in thermophysical properties within a cross section, due to a non-uniform temperature profile, i.e., due to heat flux. It should be noted that usually generalized correlations, which contain fluid properties at the wall temperature, require iterations to be solved, because there are two unknowns: 1) HTC and 2) the corresponding wall temperature. Therefore, the initial wall-temperature value at which fluid properties will be estimated should be “guessed” to start iterations. The most widely used heat-transfer correlation at subcritical pressures for forced convection is the Dittus-Boelter (1930) correlation (Pioro and Duffey, 2007). In 1942, McAdams proposed to use the Dittus-Boelter correlation in the following form, for forced-convective heat transfer in turbulent flows at subcritical pressures:
0.8 0.4b b bNu 0 0243 Re Pr.= . (1)
However, it was noted that Eq. (1) might produce unrealistic results within some flow conditions (see Figs. 1 and 2), especially, near the critical and pseudocritical points, because it is very sensitive to properties variations. In general, experimental heat transfer coefficient values show just a moderate increase within the pseudocritical region. This increase depends on flow conditions and heat flux:
www.intechopen.com

Heat Transfer to Fluids at Supercritical Pressures
493
higher heat flux – less increase. Thus, the bulk-fluid temperature might not be the best characteristic temperature at which all thermophysical properties should be evaluated. Therefore, the cross-sectional averaged Prandtl number (see below), which accounts for thermophysical properties variations within a cross section due to heat flux, was proposed to be used in many supercritical heat-transfer correlations instead of the regular Prandtl number. Nevertheless, this classical correlation (Eq. (1)) was used extensively as a basis for various supercritical heat-transfer correlations. In 1964, Bishop et al. conducted experiments in supercritical water flowing upward inside bare tubes and annuli within the following range of operating parameters: P=22.8 – 27.6 MPa, Tb= 282 – 527ºC, G = 651 – 3662 kg/m2s and q = 0.31 – 3.46 MW/m2. Their data for heat transfer in tubes were generalized using the following correlation with a fit of ±15%:
0.43
0.660.9Nu 0.0069Re Pr 1 2.4wbb b
b
D
x
ρρ
⎛ ⎞ ⎛ ⎞= +⎜ ⎟ ⎜ ⎟⎝ ⎠⎝ ⎠ . (2)
Equation (2) uses the cross-sectional averaged Prandtl number, and the last term in the correlation: (1+2.4 D/x), accounts for the entrance-region effect. However, in the present comparison, the Bishop et al. correlation was used without the entrance-region term as the other correlations (see Eqs. (1), (3) and (4)). In 1965, Swenson et al. found that conventional correlations, which use a bulk-fluid temperature as a basis for calculating the majority of thermophysical properties, were not always accurate. They have suggested the following correlation in which the majority of thermophysical properties are based on a wall temperature:
0.2310.6130.923ww wNu 0.00459 Re Pr w
b
ρρ
⎛ ⎞= ⎜ ⎟⎝ ⎠ . (3)
Equation (3) was obtained within the following range: pressure 22.8 − 41.4 MPa, bulk-fluid temperature 75 − 576ºC, wall temperature 93 − 649ºC and mass flux 542 − 2150 kg/m2s; and predicts experimental data within ±15%. In 2002, Jackson modified the original correlation of Krasnoshchekov et al. from 1967 for forced-convective heat transfer in water and carbon dioxide at supercritical pressures, to employ the Dittus-Boelter-type form for Nu0 as the following:
0.3
0.82 0.5b b bNu 0.0183 Re Pr
n
pw
b pb
c
c
ρρ
⎛ ⎞⎛ ⎞ ⎜ ⎟= ⎜ ⎟ ⎜ ⎟⎝ ⎠ ⎝ ⎠, (4)
where the exponent n is defined as following:
n = 0.4 for Tb < Tw < Tpc and for 1.2 Tpc < Tb < Tw;
0.4 0.2 1w
pc
Tn
T
⎛ ⎞⎜ ⎟= + −⎜ ⎟⎝ ⎠ for Tb < Tpc < Tw; and
0.4 0.2 1 1 5 1w b
pc pc
T Tn
T T
⎡ ⎤⎛ ⎞ ⎛ ⎞⎢ ⎥⎜ ⎟ ⎜ ⎟= + − − −⎜ ⎟ ⎜ ⎟⎢ ⎥⎝ ⎠ ⎝ ⎠⎣ ⎦ for Tpc < Tb < 1.2 Tpc and Tb < Tw.
www.intechopen.com

Heat Transfer - Theoretical Analysis, Experimental Investigations and Industrial Systems
494
An analysis performed by Pioro and Duffey (2007) showed that the two following correlations: 1) Bishop et al. (1964) and 2) Swenson et al. (1965); were obtained within the same range of operating conditions as those for SCWRs. The majority of empirical correlations were proposed in the 1960s – 1970s, when experimental techniques were not at the same level (i.e., advanced level) as they are today. Also, thermophysical properties of water have been updated since that time (for example, a peak in thermal conductivity in critical and pseudocritical points within a range of pressures from 22.1 to 25 MPa was not officially recognized until the 1990s). Therefore, recently a new or an updated correlation, based on a new set of heat-transfer data and the latest thermophysical properties of water (NIST, 2007) within the SCWRs operating range, was developed and evaluated (Mokry et al., 2009):
0.564
0.6840.904b b bNu 0 0061 Re Pr w
b
.ρρ
⎛ ⎞= ⎜ ⎟⎝ ⎠ . (5)
Figure 10 shows scatter plots of experimental HTC values versus calculated HTC values according to Eq. (5), and calculated and experimental values for wall temperatures. Both plots lie along a 45-degree straight line with an experimental data spread of ±25% for the HTC values and ±15% for the wall temperatures.
300
Tw
calc
300
400
500
600
700
400
G= 500 kg/m2s
G=1000 kg/m2s
G=1500 kg/m2s
Tw
500
+15%
600 700
-15%
exp (a) (b)
Fig. 10. Comparison of data fit through Eq. (5) with experimental data: (a) for HTC and (b) for wall temperature.
Figures 11 and 12 show a comparison of Eq. (5) with the experimental data. Figure 13 shows a comparison between experimentally obtained HTC and wall-temperature values and those calculated with FLUENT CFD code and Eq. (5). It should be noted that all heat-transfer correlations presented in this chapter are intended only for the normal and improved heat-transfer regimes. The following empirical correlation was proposed for calculating the minimum heat flux at which the deteriorated heat-transfer regime appears:
58.97 0.745dhtq G= − + ⋅ , kW/m2. (6)
www.intechopen.com
Heat Transfer to Fluids at Supercritical Pressures
495
Axial Location, m
0.0 0.5 1.0 1.5 2.0 2.5 3.0 3.5 4.0
Tem
per
atu
re,
oC
350
400
375
Bulk-Fluid Enthalpy, kJ/kg
1600 1700 1800 1900 2000 2100
010203040506070
Heated length
Bulk-fluid temperature
Tin
Tout
Inside-wall temperature
Heat transfer coefficient
P in = 24.1 MPa
G = 504 kg/m2sqave= 141 kW/m2
qdht = 317 kW/m2
Hpc=2138.1 kL/kg
Proposed corr.
Tpc = 382 oC
Axial Location, m
0.0 0.5 1.0 1.5 2.0 2.5 3.0 3.5 4.0
Tem
per
atu
re,
oC
300
350
400
450
325
375
425
475
500
Bulk-Fluid Enthalpy, kJ/kg
1600 1800 2000 2200 2400 2600
HT
C, k
W/
m2K
4
8
12
0
Heated lengthBulk-fluid temperatureT
in
Tout
Inside-wall temperature
Heat transfer coefficient
Pin
= 24.1 MPa
G = 499 kg/m2sq
ave= 334 kW/m2
qdht = 313 kW/m2
Hpc
Tpc
= 381 oC
Proposed corr.
(a) (b)
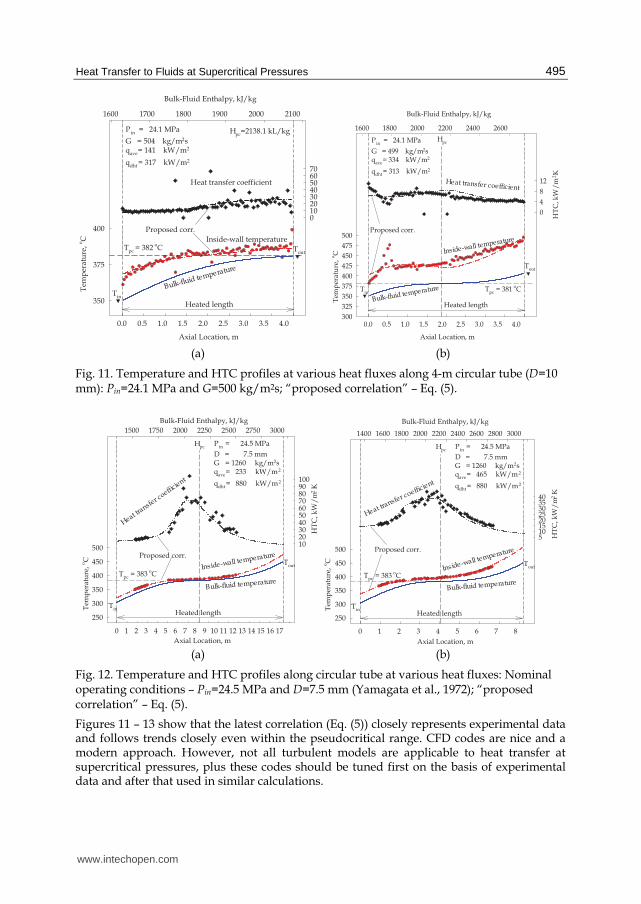
Fig. 11. Temperature and HTC profiles at various heat fluxes along 4-m circular tube (D=10 mm): Pin=24.1 MPa and G=500 kg/m2s; “proposed correlation” – Eq. (5).
Axial Location, m
0 1 2 3 4 5 6 7 8 9 10 11 12 13 14 15 16 17
Tem
per
atu
re,
oC
250
300
350
400
450
500
Bulk-Fluid Enthalpy, kJ/kg
1500 1750 2000 2250 2500 2750 3000
HT
C, k
W/
m2
K
102030405060708090100
Heated length
Bulk-fluid temperature
Tin
ToutInside-wall temperature
Heat transfer c
oefficient
P in = 24.5 MPa
D = 7.5 mmG = 1260 kg/m2sqave= 233 kW/m2
qdht = 880 kW/m2
Hpc
Tpc = 383 oC
Proposed corr.
Axial Location, m
0 1 2 3 4 5 6 7 8
Tem
per
atu
re,
oC
250
300
350
400
450
500
Bulk-Fluid Enthalpy, kJ/kg
1400 1600 1800 2000 2200 2400 2600 2800 3000
HT
C, k
W/
m2
K
510152025303540
Heated length
Bulk-fluid temperature
Tin
ToutInside-wall temperature
Heat transfer coeffic
ient
Pin
= 24.5 MPa
D = 7.5 mmG = 1260 kg/m2sq
ave= 465 kW/m2
qdht
= 880 kW/m2
Hpc
Tpc = 383 oC
Proposed corr.
(a) (b)
Fig. 12. Temperature and HTC profiles along circular tube at various heat fluxes: Nominal operating conditions – Pin=24.5 MPa and D=7.5 mm (Yamagata et al., 1972); “proposed correlation” – Eq. (5).
Figures 11 – 13 show that the latest correlation (Eq. (5)) closely represents experimental data and follows trends closely even within the pseudocritical range. CFD codes are nice and a modern approach. However, not all turbulent models are applicable to heat transfer at supercritical pressures, plus these codes should be tuned first on the basis of experimental data and after that used in similar calculations.
www.intechopen.com

Heat Transfer - Theoretical Analysis, Experimental Investigations and Industrial Systems
496
Axial Location, m
0.0 0.5 1.0 1.5 2.0 2.5 3.0 3.5 4.0
350
400
450
Bulk-Fluid Enthalpy, kJ/kg
1600 1800 2000 2200 2400 2600 2800
HT
C, k
W/
m2
K
6
10
14
18
22
2
26
30
34
Proposed corr.
k-ε model (wall function)
k-ε model (low Reynolds)
k-ω model (SST)
Heated length
Bulk-fluid temperature
Tin
Tout
Heat transfer coefficient
P in = 23.9 MPa
G = 1002 kg/m2sqave = 681 kW/m2
qdht = 688 kW/m2
Hpc
Tpc = 381 oC
Tem
per
atu
re,
oC
Axial Location, m
0.0 0.5 1.0 1.5 2.0 2.5 3.0 3.5 4.0
Tem
per
atu
re,
oC
350
400
450
500
Proposed corr.
k-ε model (wall function)
k-ε model (low Reylonds)
k-ω model (SST)
Heated length
Bulk-fluid temperatureTin
ToutInside-wall t
emperature
P in = 23.9 MPa
G = 1002 kg/m2sqave = 681 kW/m2
qdht = 688 kW/m2
Hpc
Tpc = 381 oC
(a) (b)
Fig. 13. Comparison of HTC and wall temperature values calculated with proposed correlation (Eq. (5)) and FLUENT CFD-code (Vanyukova et al., 2009) with experimental data along 4-m circular tube (D=10 mm): Pin=23.9 MPa and G=1000 kg/m2s.
Supercritical Region Region
Liquid-Like Gas-Like Critical or
Pseudocritical
Errors, %
Correlation*
Average RMS Average RMS Average RMS
Bishop et al. (1965) 6.3 24.2 5.2 18.4 20.9 28.9
Swenson et al. (1965) 1.5 25.2 -15.9 20.4 5.1 23.0
Krasnoshchekov et al. (1967) 15.2 33.7 -33.6 35.8 25.2 61.6
Watts & Chou (1982) 4.0 25.0 -9.7 20.8 5.5 24.0
Chou (1982) 5.5 23.1 5.7 22.2 16.5 28.4
Griem (1996) 1.7 23.2 4.1 22.8 2.7 31.1
Jackson (2002) 13.5 30.1 11.5 28.7 22.0 40.6
Mokry et al. (2009) -3.9 21.3 -8.5 16.5 -2.3 17.0
Kuang et al. (2008) -6.6 23.7 2.9 19.2 -9.0 24.1
Cheng et al. (2009) 1.3 25.6 2.9 28.8 14.9 90.6
Hadaller & Benerjee (1969) 7.6 30.5 10.7 20.5 - -
Sieder & Tate (1936) 20.8 37.3 93.2 133.6 - -
Dittus & Boelter (1930) 32.5 46.7 87.7 131.0 - -
Gnielinski (1976) 42.5 57.6 106.3 153.3 - -
In bold – the minimum values. * many of these correlations can be found in Pioro and Duffey (2007).
Table 2. Overall weighted average and RMS errors within three supercritical sub-regions (Zahlan et al., 2010).
www.intechopen.com

Heat Transfer to Fluids at Supercritical Pressures
497
A recent study was conducted by Zahlan et al. (2010) in order to develop a heat-transfer
look-up table for the critical/supercritical pressures. An extensive literature review was
conducted, which included 28 datasets and 6663 trans-critical heat-transfer data. Tables 2
and 3 list results of this study in the form of the overall-weighted average and Root-Mean-
Square (RMS) errors: (a) Within three supercritical sub-regions for many heat-transfer
correlations, including those discussed in this chapter (Table 2); and (b) For subcritical liquid
and superheated steam (Table 3). In their conclusions, Zahlan et al. (2010) determined that
within the supercritical region the latest correlation by Mokry et al. (Eq. (5)) showed the best
prediction for the data within all three sub-regions investigated. Also, the Mokry et al.
correlation showed quite good predictions for subcritical liquid and superheated steam
compared to other several correlations.
Subcritical liquid Superheated steam
Error, %
Correlation
Average RMS Average RMS
Sieder & Tate (1936) 27.6 37.4 83.8 137.8
Gnielinski (1976) -4.3 18.3 80.3 130.2
Hadaller & Banerjee (1969) 27.3 35.9 19.1 34.4
Dittus & Boelter (1930) 10.4 22.5 75.3 127.3
Mokry et al. (2009) -1.1 19.2 -4.8 19.6
In bold – the minimum values.
Table 3. Overall average and RMS error within subcritical region (Zahlan et al., 2010).
Fig. 14. Tested 7-element helically-finned bundle cooled with supercritical water and heated with electrical current (drawing prepared by W. Peiman, UOIT).
www.intechopen.com

Heat Transfer - Theoretical Analysis, Experimental Investigations and Industrial Systems
498
4.2 Bundles As it was mentioned above, experiments in bundles cooled with supercritical water are very
complicated and expensive. Therefore, only one empirical correlation is known so far in the
open literature which predicts heat transfer coefficients in a special bundle design (Fig. 14).
This correlation was developed by Dyadyakin and Popov (1977), who performed
experiments in a tight 7-rod bundle with helical fins cooled with supercritical water. They
have correlated their data for the local heat transfer coefficients as:
0.45 0.2 0.10.70.8xx xNu 0.021 Re Pr 1 2.5
hyw b b
b in inx x x
D
x
ρ μ ρρ μ ρ
⎛ ⎞⎛ ⎞ ⎛ ⎞ ⎛ ⎞= +⎜ ⎟⎜ ⎟ ⎜ ⎟ ⎜ ⎟ ⎜ ⎟⎝ ⎠ ⎝ ⎠ ⎝ ⎠ ⎝ ⎠ , (9)
where x is the axial location along the heated length in meters, and Dhy is the hydraulic-
equivalent diameter (equals 4 times the flow area divided by the wetted perimeter) in
meters. This correlation fits the data (504 points) to within ±20%. The maximum deviation
of the experimental data from the correlating curve corresponds to points with small
temperature differences between the wall temperature and bulk temperature. Sixteen
experimental points had deviations from the correlation within ±30%.
5. Hydraulic resistance
In general, the total pressure drop for forced convection flow inside a test section, installed
in a closed-loop system, can be calculated according to the following expression:
fr ac gp p p p pΔ = Δ + Δ + Δ + Δ∑ ∑ ∑ ∑`
, (10)
where Δp is the total pressure drop, Pa.
Δpfr is the pressure drop due to frictional resistance (Pa), which defined as
2 2
2 2fr fr fr
uL L Gp
D D
ρξ ξ ρ⎛ ⎞ ⎛ ⎞Δ = =⎜ ⎟ ⎜ ⎟⎜ ⎟⎜ ⎟ ⎝ ⎠⎝ ⎠ , (11)
where frξ is the frictional coefficient, which can be obtained from appropriate correlations
for different flow geometries. For smooth circular tubes frξ is as follows (Filonenko, 1954)
( )210 b
1
1.82 log Re 1.64frξ ⎛ ⎞⎜ ⎟= ⎜ ⎟−⎝ ⎠ . (12)
Equation (12) is valid within a range of Re = 4·103 – 1012.
Usually, thermophysical properties and the Reynolds number in Eqs. (11) and (12) are based
on arithmetic average of inlet and outlet values.
Δpℓ is the pressure drop due to local flow obstruction (Pa), which is defined as
2 2
2 2
u Gp
ρξ ξ ρ⎛ ⎞ ⎛ ⎞Δ = =⎜ ⎟ ⎜ ⎟⎜ ⎟⎜ ⎟ ⎝ ⎠⎝ ⎠` ` ` , (13)
www.intechopen.com

Heat Transfer to Fluids at Supercritical Pressures
499
where ξ` is the local resistance coefficient, which can be obtained from appropriate correlations for different flow obstructions. Δpac is the pressure drop due to acceleration of flow (Pa) defined as
( )2 2 2 1 1ac out out in in
out in
p u u Gρ ρ ρ ρ⎛ ⎞Δ = − = −⎜ ⎟⎝ ⎠ . (14)
Δpg is the pressure drop due to gravity (Pa) defined as
sin2
out ingp g L
ρ ρ θ+⎛ ⎞Δ = ± ⎜ ⎟⎝ ⎠ , (15)
where θ is the test-section inclination angle to the horizontal plane, sign “+” is for the upward flow and sign “–“ is for the downward flow. The arithmetic average value of densities can be used only for short sections in the case of strongly non-linear dependency of the density versus temperature. Therefore, in long test sections at high heat fluxes and within the critical and pseudocritical regions, the integral value of densities should be used (see Eq. (16)). Ornatskiy et al. (1980) and Razumovskiy (2003) proposed to calculate Δpg at supercritical pressures as the following:
sinout out in ing
out in
H Hp g L
H H
ρ ρ θ⎛ ⎞+Δ = ± ⎜ ⎟+⎝ ⎠ . (16)
In general, Equation (10) is applicable for subcritical and supercritical pressures. However, adjustment of this expression to conditions of supercritical pressures, with single-phase dense gas and significant variations in thermophysical properties near the critical and pseudocritical points, was the major task for the researchers and scientists.
Re 10 -3
250 300 350 400 450 500 550
Pre
ssu
re D
rop
, kP
a
0
5
10
15
20
25
30
Hea
t F
lux,
kW
/m
2
0
100
200
300
400
500
Δpmeas
Δpcal
Δpfr
Δpg
Heat flux
Δpac
Re 10 -3
450 500 550 600 650 700 750 800
Pre
ssu
re D
rop
, kP
a
0
10
20
30
40
50
60
70
Hea
t F
lux
, kW
/m
2
0
150
300
450
600
Δpmeas
Δpcal
Δpfr
Δpg
Heat flux
Δpac
(a) (b)
Fig. 15. Effect of Reynolds number on total pressure drop (measured and calculated) and its components (calculated values) in supercritical carbon dioxide flowing in vertical circular tube: pout=8.8 MPa; (a) G=2040 kg/m2s, tin=32ºC; and (b) G=3040 kg/m2s, tin=31ºC.
www.intechopen.com

Heat Transfer - Theoretical Analysis, Experimental Investigations and Industrial Systems
500
In general, two major approaches to solve this problem were taken: an analytical approach (including numerical approach) and an experimental (empirical) approach. Unfortunately, satisfactory analytical and numerical methods have not yet been developed, due to the difficulty in dealing with the steep property variations, especially in turbulent flows and at high heat fluxes. Therefore, empirical correlations are usually used. For reference purposes, selected results obtained at Chalk River Laboratories (Pioro and Duffey, 2007; Pioro et al. 2004) are shown in Fig. 15. In these experiments, the local pressure drop due to obstructions along the heated length was 0, because of a smooth test section. Therefore, the measured pressure drop consists only of three components:
meas fr ac gp p p pΔ = Δ + Δ + Δ . (17)
Other details of pressure drop at supercritical pressures are listed in Pioro and Duffey (2007). Another important issue at supercritical and subcritical pressures is uncertainties of measured and calculated parameters. Pioro and Duffey (2007) dedicated a separate Appendix D to this important issue in their book.
6. Nomenclature
A flow area, m2 cp specific heat at constant pressure, J/kg K
pc averaged specific heat within the range of (tw – tb); w b
w b
H H
T T
⎛ ⎞−⎜ ⎟−⎝ ⎠ , J/kg K
D inside diameter, m
G mass flux, kg/m2s; fl
m
A
⎛ ⎞⎜ ⎟⎜ ⎟⎝ ⎠
g gravitational acceleration, m/s2 H specific enthalpy, J/kg h heat transfer coefficient, W/m2K k thermal conductivity, W/m K L heated length, m
m mass-flow rate, kg/s; ( )Vρ
P, p pressure, MPa Q heat-transfer rate, W
q heat flux, W/m2; h
Q
A
⎛ ⎞⎜ ⎟⎝ ⎠
T, t temperature, ºC u axial velocity, m/s V volume-flow rate, m3/kg x axial coordinate, m Greek letters
α thermal diffusivity, m2/s; p
k
c ρ⎛ ⎞⎜ ⎟⎜ ⎟⎝ ⎠
www.intechopen.com

Heat Transfer to Fluids at Supercritical Pressures
501
Δ difference θ test-section inclination angle, degree μ dynamic viscosity, Pa s ξ friction coefficient ρ density, kg/m3 υ kinematic viscosity, m2/s Non-dimensional numbers
Nu Nusselt number; h D
k
⎛ ⎞⎜ ⎟⎝ ⎠
Pr Prandtl number; pc
k
μ υα
⎛ ⎞ ⎛ ⎞=⎜ ⎟ ⎜ ⎟⎜ ⎟ ⎝ ⎠⎝ ⎠
Pr averaged Prandtl number within the range of (tw – tb); pc
k
μ⎛ ⎞⎜ ⎟⎜ ⎟⎝ ⎠
Re Reynolds number; G D
μ⎛ ⎞⎜ ⎟⎝ ⎠
Symbols with an overbar at the top denote average or mean values (e.g., Nu denotes
average (mean) Nusselt number).
Subscripts or superscripts
ac acceleration ave average b bulk cal calculated cr critical dht deteriorated heat transfer exp experimental fl flow fr friction g gravitational h heated hy hydraulic-equivalent in inlet ℓ local meas measured out outlet or outside pc pseudocritical w wall Abbreviations and acronyms widely used in the text
DHT Deteriorated Heat Transfer GIF Generation-IV International Forum HT Heat Transfer HTC Heat Transfer Coefficient ID Inside Diameter IHT Improved Heat Transfer NHT Normal Heat Transfer
www.intechopen.com
Heat Transfer - Theoretical Analysis, Experimental Investigations and Industrial Systems
502
NIST National Institute of Standards and Technology (USA) SCWR SuperCritical Water-cooled Reactor
7. Reference
Ackerman, J.W., 1970. Pseudoboiling heat transfer to supercritical pressure water in smooth
and ribbed tubes, Journal of Heat Transfer, Transactions of the ASME, 92 (3), pp.
490–498, (Paper No. 69-WA/HT-2, pp. 1–8).
Bishop, A.A., Sandberg, R.O., and Tong, L.S., 1965, Forced Convection Heat Transfer to
Water at Near-critical Temperatures and Supercritical Pressures, A.I.Ch.E.-I.Chem.E
Symposium Series No. 2, pp. 77−85.
Bishop, A.A., Sandberg, R.O. and Tong, L.S., 1964. Forced convection heat transfer to water
at near-critical temperatures and super-critical pressures, Report WCAP-2056,
Westinghouse Electric Corporation, Atomic Power Division, Pittsburgh, PA, USA,
December, 85 pages.
Cheng, X., Yang, Y.H., and Huang, S.F., 2009, A Simple Heat Transfer Correlation for SC
Fluid Flow in Circular Tubes, (NURETH-13), Kanazawa City, Ishikawa Prefecture,
Japan, September 27-October 2.
Dittus, F.W. and Boelter, L.M.K., 1930. University of California, Berkeley, Publications on
Engineering, Vol. 2, p. 443.
Dyadyakin, B.V. and Popov, A.S., 1977. Heat transfer and thermal resistance of tight seven-
rod bundle, cooled with water flow at supercritical pressures, (In Russian),
Transactions of VTI (Труды ВТИ), No. 11, pp. 244–253.
Filonenko, G.K., 1954. Hydraulic resistance of pipelines, (In Russian), Thermal Engineering,
No. 4, pp. 40–44.
Gnielinski, V., 1976, New Equation for Heat and Mass Transfer in Turbulent Pipe and
Channel Flow, Intern. Chem. Eng., Vol. 16, No. 2, pp. 359-366.
Griem, H., 1996, A New Procedure for the at Near-and Supercritical Prediction Pressure of
Forced Convection Heat Transfer, Heat Mass Trans., Vol. 3, pp. 301–305.
Hadaller, G. and Banerjee, S., 1969, Heat Transfer to Superheated Steam in Round Tubes,
AECL Report. Jackson, J.D., 2002. Consideration of the heat transfer properties of supercritical pressure
water in connection with the cooling of advanced nuclear reactors, Proceedings of the 13th Pacific Basin Nuclear Conference, Shenzhen City, China, October 21–25.
Kafengauz, N.L., 1986. About some peculiarities in fluid behaviour at supercritical pressure in conditions of intensive heat transfer, Applied Thermal Sciences, (Промышленная Теплотехника, стр. 6–10), 8 (5), pp. 26–28.
Kafengaus, N.L., 1975. The mechanism of pseudoboiling, Heat Transfer-Soviet Research, 7 (4), pp. 94–100.
Kirillov, P.L., Lozhkin, V.V. and Smirnov, A.M., 2003. Investigation of borders of deteriorated regimes of a channel at supercritical pressures, (In Russian), State Scientific Center of Russian Federation Institute of Physics and Power Engineering by the name of A.I. Leypunskiy, FEI-2988, Obninsk, Russia, 20 pages.
Krasnoshchekov, E.A., Protopopov, V.S., Van, F. and Kuraeva, I.V., 1967. Experimental investigation of heat transfer for carbon dioxide in the supercritical region, Proceedings of the 2nd All-Soviet Union Conference on Heat and Mass Transfer,
www.intechopen.com
Heat Transfer to Fluids at Supercritical Pressures
503
Minsk, Belarus’, May, 1964, Published as Rand Report R-451-PR, Edited by C. Gazley, Jr., J.P. Hartnett and E.R.C. Ecker, Vol. 1, pp. 26–35.
Krasyakova, L.Yu., Raykin, Ya.M., Belyakov, I.I. et al., 1967. Investigation of temperature regime of heated tubes at supercritical pressure, (In Russian), Soviet Energy Technology (Энергомашиностроение), No. 1, pp. 1–4.
Kuang, B., Zhang, Y., and Cheng, X., 2008, A New, Wide-Ranged Heat Transfer Correlation of Water at Supercritical Pressures in Vertical Upward Ducts, NUTHOS-7, Seoul, Korea, October 5–9.
Lee, R.A. and Haller, K.H., 1974. Supercritical water heat transfer developments and applications, Proc. 5th International Heat Transfer Conference, Tokyo, Japan, September 3–7, Vol. IV, Paper No. B7.7, pp. 335–339.
McAdams, W.H., 1942. Heat Transmission, 2nd edition, McGraw-Hill, New York, NY, USA, 459 pages.
Mokry, S., Farah, A., King, K., Gupta, S., Pioro, I. and Kirillov, P., 2009. Development of Supercritical Water Heat-Transfer Correlation for Vertical Bare Tubes, Proceedings of the Nuclear Energy for New Europe 2009 International Conference, Bled, Slovenia, 2009 September 14 – 17, Paper #210, 13 pages.
National Institute of Standards and Technology, 2007. NIST Reference Fluid Thermodynamic and Transport Properties-REFPROP. NIST Standard Reference Database 23, Ver. 8.0. Boulder, CO, U.S.: Department of Commerce.
Ornatskiy, A.P., Dashkiev, Yu.G. and Perkov, V.G., 1980. Supercritical Steam Generators, (In Russian), VyshchaShkola Publishing House, Kiev, Ukraine, 287 pages.
Pioro, I., Duffey, R. and Dumouchel, T., 2004. Hydraulic resistance of fluids flowing in channels at supercritical pressures (survey), Nuclear Engineering and Design, 231 (2), pp. 187–197.
Pioro, I.L. and Duffey, R.B., 2007. Heat Transfer and Hydraulic Resistance at Supercritical Pressures in Power Engineering Applications, ASME Press, New York, NY, USA, 328 pages.
Razumovskiy, V.G., 2003. Private communications, State Technical University “KPI”, Kiev, Ukraine.
Richards, G., Milner, A., Pascoe, C. et al., 2010. Heat Transfer in a Vertical 7-Element Bundle Cooled with Supercritical Freon-12, Proc. 2nd Canada-China Joint Workshop on Supercritical Water-Cooled Reactors (CCSC-2010), Toronto, Ontario, Canada, April 25-28, 10 pages.
Seider, N. M., and Tate, G. E., 1936, Heat Transfer and Pressure Drop of Liquids in Tubes, Ind. Eng. Chem. 28 (12), pp. 1429–1435.
Shiralkar, B.S. and Griffith, P., 1970. The effect of swirl, inlet conditions, flow direction, and tube diameter on the heat transfer to fluids at supercritical pressure, Journal of Heat Transfer, Transactions of the ASME, 92 (3), August, pp. 465–474.
Swenson,H.S., Carver, J.R. and Kakarala, C.R., 1965.Heat transfer to supercritical water in smooth-bore tubes, Journal of Heat Transfer, Transactions of the ASME, Series C, 87 (4), 1965, pp. 477–484.
Styrikovich, M.A., Margulova, T.Kh. and Miropol’skii, Z.L., 1967. Problems in the development of designs of supercritical boilers, Thermal Engineering (Теплоэнергетика, стр. 4–7), 14 (6), pp. 5–9.
www.intechopen.com

Heat Transfer - Theoretical Analysis, Experimental Investigations and Industrial Systems
504
Vanyukova, G.V., Kuznetsov, Yu.N., Loninov, A.Ya., Papandin, M.V., Smirnov, V.P. and Pioro, I.L., 2009. Application of CFD-Code to Calculations of Heat Transfer in a Fuel Bundle of SCW Pressure-Channel Reactor, Proc. 4th Int. Symp.on Supercritical Water-Cooled Reactors, March 8-11, Heidelberg, Germany, Paper No. 28, 9 pages.
Vikhrev, Yu.V., Barulin, Yu.D. and Kon’kov, A.S., 1967. A study of heat transfer in vertical tubes at supercritical pressures, Thermal Engineering (Теплоэнергетика, стр. 80–82), 14 (9), pp. 116–119.
Vikhrev, Yu.V.,Kon’kov, A.S., Lokshin, V.A. et al., 1971. Temperature regime of steam generating tubes at supercritical pressure, (In Russian), Transactions of the IVth All-Union Conference on Heat Transfer and Hydraulics at Movement of Two-Phase Flow inside Elements of Power Engineering Machines and Apparatuses, Leningrad, Russia, pp. 21–40.
Watts, M. J., and Chou, C-T., 1982, Mixed Convection Heat Transfer to Supercritical Pressure Water, Proc. 7th International Heat Transfer Conference, Munich, Germany, pp. 495–500.
Yamagata, K., Nishikawa, K., Hasegawa, S. et al., 1972. Forced convective heat transfer to supercritical water flowing in tubes, International Journal of Heat & Mass Transfer, 15 (12), pp. 2575–2593.
Zahlan, H., Groeneveld, D., & Tavoularis, S. (April 25-28, 2010). Look-Up Table for Trans-Critical Heat Transfer. The 2nd Canada-China Joint Workshop on Supercritical Water-Cooled Reactors (CCSC-2010). Toronto, Ontario, Canada: Canadian Nuclear Society.
www.intechopen.com
Heat Transfer - Theoretical Analysis, Experimental Investigationsand Industrial SystemsEdited by Prof. Aziz Belmiloudi
ISBN 978-953-307-226-5Hard cover, 654 pagesPublisher InTechPublished online 28, January, 2011Published in print edition January, 2011
InTech EuropeUniversity Campus STeP Ri Slavka Krautzeka 83/A 51000 Rijeka, Croatia
InTech ChinaUnit 405, Office Block, Hotel Equatorial Shanghai No.65, Yan An Road (West), Shanghai, 200040, China
Phone: +86-21-62489820
Over the past few decades there has been a prolific increase in research and development in area of heattransfer, heat exchangers and their associated technologies. This book is a collection of current research inthe above mentioned areas and discusses experimental, theoretical and calculation approaches and industrialutilizations with modern ideas and methods to study heat transfer for single and multiphase systems. Thetopics considered include various basic concepts of heat transfer, the fundamental modes of heat transfer(namely conduction, convection and radiation), thermophysical properties, condensation, boiling, freezing,innovative experiments, measurement analysis, theoretical models and simulations, with many real-worldproblems and important modern applications. The book is divided in four sections : "Heat Transfer in MicroSystems", "Boiling, Freezing and Condensation Heat Transfer", "Heat Transfer and its Assessment", "HeatTransfer Calculations", and each section discusses a wide variety of techniques, methods and applications inaccordance with the subjects. The combination of theoretical and experimental investigations with manyimportant practical applications of current interest will make this book of interest to researchers, scientists,engineers and graduate students, who make use of experimental and theoretical investigations, assessmentand enhancement techniques in this multidisciplinary field as well as to researchers in mathematical modelling,computer simulations and information sciences, who make use of experimental and theoretical investigationsas a means of critical assessment of models and results derived from advanced numerical simulations andimprovement of the developed models and numerical methods.
How to referenceIn order to correctly reference this scholarly work, feel free to copy and paste the following:
Igor Pioro and Sarah Mokry (2011). Heat Transfer to Supercritical Fluids, Heat Transfer - Theoretical Analysis,Experimental Investigations and Industrial Systems, Prof. Aziz Belmiloudi (Ed.), ISBN: 978-953-307-226-5,InTech, Available from: http://www.intechopen.com/books/heat-transfer-theoretical-analysis-experimental-investigations-and-industrial-systems/heat-transfer-to-supercritical-fluids
www.intechopen.com

Phone: +385 (51) 770 447 Fax: +385 (51) 686 166www.intechopen.com
Phone: +86-21-62489820 Fax: +86-21-62489821