19. stoletje - university of...
TRANSCRIPT

19. StoletjeG. Mendel odkrije vzorce dedovanja
20. StoletjeJ. Watson in F. Crick leta 1953 razkrijeta strukturo DNA
21. StoletjeEra funkcijske genomike in globalnih raziskav genoma

We are persuaded that the ability to observe the behavior of many genes at a time is the main immediate benefit of genome sequencing. Indeed, we believe that ability to study, in ordinary laboratories, thousands of genes simultaneously using genome–scale methods such as microarray hybridization will be the hallmark of post–genome biological research.
Patrick O. Brown & David BotsteinStanford University
Nature Genetics, Vol. 21, Suppl., January, 1999
DNA arrays

Functional genomics(From Wikipedia, the free encyclopedia)
http://en.wikipedia.org/
Functional genomics is a field of molecular biology that is attempting to make use of the vast wealth of data produced by genome sequencing projects to describe genome function.
Functional genomics uses high-throuput techniques like DNA microarrays, proteomics, metabolomics and mutation analysis to describe the function and interactions of genes.
Because of the large quantity of data and the desire to be able to find patterns and predict gene functions and interactions, bioinformatics is crucial to this type of analysis. Comparative genomic analyses can also help determine gene function.

Systems biology(From Wikipedia, the free encyclopedia)
http://en.wikipedia.org/
Systems biology is an academic field that seeks to integrate different levels of information to understand how biological systems function.
By studying the relationships and interactions between various parts of a biological system (e.g., gene and protein networks involved in various pathways, in different cell types and organelles, it is hoped that eventually an understandable model of the whole system can be developed.
-study of genes and proteins in an organism using high-throughput techniques to quantify changes in the genome (Microarrays) and proteome (Mass spectrometry) in reponse to a given perturbation.
-In contrast to much of molecular biology, systems biology does not seek to break down a system into all of its parts and study one part of the process at a time, with the hope of being able to reassemble all the parts into a whole.

- Accusation of systems biologists of setting vague and poorly articulated goals without proposing concrete strategies which leads in insignificant conclusions
-Using knowledge from molecular biology, the systems biologist can propose hypotheses that explain a system's behavior.
- these hypotheses can be used to mathematically model the system. Models are used to predict how different changes in the system's environment affect the system and can be iteratively tested for their validity.
-New approaches are being developed by quantitative scientists, such as computational biologists, statisticians, mathematicians, computer scientists, engineers, and physicists, to improve our ability to make these high-throughput measurements and create, refine, and retest the models until the predicted behavior accurately reflects the phenotype seen.
-Systems biology – where biology and informatics meet.
Systems biology(From Wikipedia, the free encyclopedia)
http://en.wikipedia.org/

acetat
LDL
Steroidni hormoniandrogeni, estrogeni,
progestini, kortikosteroidi
Žolčne kislineVitamin D
membrane
hemA, ubikinon, FPP, MAS
BIOSINTEZA
PRIVZEM
METABOLIZEM
123
4 5 6 78
910
11 12 1314 15
161719
18 2021 22
2324
2526
27
HOholesterol
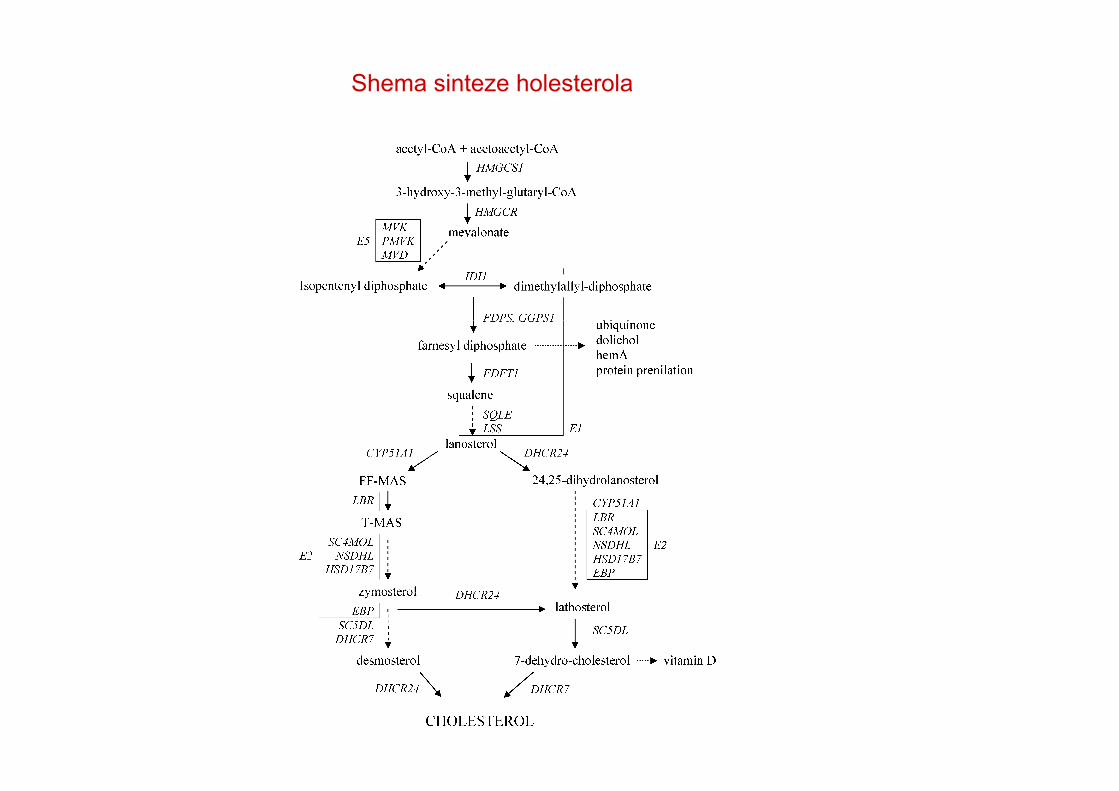
Shema sinteze holesterola

Matematični model sinteze holesterola
A. Belič, Fakulteta za elektrotehniko UL
A simplified mathematical model of cholesterol biosynthesis. Black blocks represent metabolites (squares), enzyme reactions (circles) and metabolite sources (triangles). Dark grey blocks represent enzymes (large squares), their biochemical control (triangles and small squares), and enzyme production regarding gene expression (circles). White blocks represent gene expressions (squares) and their control (triangles). Light grey blocks represent transcription factors (squares), their production regarding gene expression (circles), and their activation/inactivation (squares). Gene names are listed in Table 1 in Supplement.

Complexity of organisms
http://www.mun.ca/biology/scarr/Fg17_15smc.gif

... living organisms are very complicated aggregations of elementary parts, and by any reasonable theory of probability or thermodynamics highly improbable. That they should occur in the world at all is a miracle of the first magnitude; the only thing which removes, or mitigates, this miracle is that they reproduce themselves. Therefore, if by any peculiar accident there should ever be one of them, from there on the rules of probability do not apply, and there will be many of them, at least if the milieu is reasonable.
John von Neumann, Theory of Self-Reproducing Automata.

Some functional genomics approaches
transcriptome proteome metabolome
-Expression microarrays-RT-PCR-siRNA
- 2D proten maps /MS-LC/MS(n)
- metabolite profiling-Metabolic fluxes

DNA – RNA – proteins (enzymes) - metabolites
metabolites

Before starting the experiment – define your system!
subcellular fraction
individual cell
tissue
organ
physiological state
time
etc........

DNA microarays
- probes for DNA microarrays (oligonucleotides, cDNA)
- expression profiling microarrays: manufacturing of low density microarrays, hybridization and scanning, high density microarrays;
- genomic microarrays: comparative gene hybridization chips, SNP chips, tailing microarrays for re-sequencing;
- the role of bioinformatics in microarray analysis: experiment planning, data acquisition and storage, standardization, gene onthology, discovery of information in the data (intelligent data mining);
- the perspectives of microarrays analysis in medicine, pharmacogenomics and new drug development
- DNA microarray technology in Slovenia (Thursday 19. 6. 2008 at 9:00, Faculty of Medicine UL, celebration of the 3st anniversary of CFGBC http://cfgbc.mf.uni-lj.si/)
Other RNA analyses: real time PCR, siRNA, differential display, subtractive hybridization
Systems metabolomics – introduction to analytical and bioinformatic techniques and databases

Uporaba DNA mikromrež
• Bazične raziskave – globalni pogled na izbrani biološki proces
• Farmacevtska industrija - globalni pristop k testiranju potencialnih zdravilnih učinkovin
- kreiranja tematskih DNA mikormrežza diagnosticiranje kompleksnih obolenj
• Klinika – genotipizacija, odkrivanje normalnih in okvarjenih alelov- določanje enojnih nukleotidnih polimorfizmov (SNP)
razvoj “osebne medicine”- odkrivanje genov, vključenih v bolezenski fenotip
poligenskih obolenj

Tehnologija DNA čipov
1. Definicije osnovnih pojmov.
2. Različni pristopi tehnologije DNA čipov.
• Analiza genomske DNA (genotpizacija enojnih nukleotidnih polimorfizmov SNP, analiza variance števila kopij CNV oz. CGH, resekvenciranje).
• Analiza izražanja genov (ekspresijsko profiliranje: 3' ekspresijski, eksonski ali genski čipi, čipi za sledenje izražanja miRNA).
• Študije uravnavanja izražanja genov (kromatinska imunoprecipitacija na čipu ChIP-on-Chip, mapiranje prepisov).
3. Nova generacija metod za sekvenciranje DNA.
4. Zasnova bioloških poskusov z upoštevanjem standardov.

A DNA microarray (also commonly known as gene chip, DNA chip, or biochip) is a collection of microscopic DNA spots attached to a solid surface, such as glass, plastic or silicon chip forming an array for the purpose of monitoring of expression levels for thousands of genes simultaneously.
The affixed DNA segments are known as probes (although some sources will use different nomenclature), thousands of which can be used in a single DNA microarray.
Microarray technology evolved from Southern blotting, where fragmented DNA is attached to a substrate and then probed with a known gene or fragment.
Measuring gene expression using microarrays is relevant to many areas of biology and medicine, such as studying treatments, disease, and developmental stages. For example, microarrays can be used to identify disease genes by comparing gene expression in disease and normal cells.
A DNA microarray

Studying the nature and extent of structural variation in the human genome. The recent discovery of widespread copy number variation (CNV) in the human genome has ignited a new interest in this class of genomic variation, which is amenable to discovery using array comparative genome hybridization.
The relationship between structural variation and human disease. It has long been known that human disease can be caused by gene amplification or deletion, but it is only recently that genome-scale approaches have revealed the high frequency of de novo CNV and its potential association with autism.
The role of gene amplification in human evolution. Recently, it has been discovered that CNV at the AMY1 locus, encoding the salivary enzyme, amylase, has been under selective pressure through human history. It is likely that selection for or against CNV of particular loci will be a general theme in the human genome as it is in other organisms.
Genomic changes associated with cancers. Typically, genome-wide studies of somatic point mutations that are associated with cancers in humans have used Sanger sequencing approaches. Microarray-based approaches have the potential to address the various genomics events, including base pair changes, structural variation and possibly insertion variation, that are associated with cancers far more rapidly and efficiently.
The role of insertion sequences (for example, long interspersed nuclear elements, or LINEs) in generating cellular diversity and disease. A study has reported the potential role of LINE1 elements in generating neuronal diversity. This presents the tantalizing possibility that somatic mosaicism might be facilitated by mobile elements in the genome — a question that is readily amenable to microarray-based approaches.
The extent of insertional variation in humans. Mobile elements constitute most of the human genome. However, little is known about their variation throughout the human population. It is reasonable to expect that this variation is at least comparable to that observed for CNV.
Gresham D. et al., Nature Reviews Genetics 9, 291-302 (April 2008)
Applications of microarray-based approaches to studying human genome

Principle of expression profilingVrste DNA mikromrežglede na vrsto DNA molekul, ki predstavljajo določen gen
DNA čipi: Kemična sinteza kratkih, do 20 bp dolgih oligonukelotidovna matrici in situ (npr. tehnologija Affimetrix)
Vsak gen je predstavljen z večimi različnimi oligonukleotidi
DNA mikromreže z dolgimi oligonukleotidi: na podlago nanešeni 50 – 80 bp dolgi oligonukleotidiVsak gen je predstavljen z enim do tremi različnimi oligonukleotidi
1.
2.
3. cDNA mikromreže : na podlago nanešene delne ali popolne cDNA dolžin 300 – 5000 bp (tehnologija Patt Brown)Vsak gen je predstavljen z eno cDNA

Approaches to manufacturing microarrays carrying oligonucleotides
• Oligonucleotides are synthesized and spotted by an automated device.
• DNA can be synthesized directly on the surface.
• Oligonucleotides are synthesized and loaded onto discrete particles that are finally immobilized on chips.
The first approach has been classically used to produce home-made oligonucleotide microarrays.
The second approach provides wide flexibility in design of custom arrays without preliminary synthesis of modified oligonucleotides (e.g. Affymetrix, Nimblegen, febit).
However, in situ synthesis does not allow quality control and purification of individual array features, and incomplete phosphoramidite coupling prevents high yields of full-length oligonucleotide probes, especially for longer oligos.
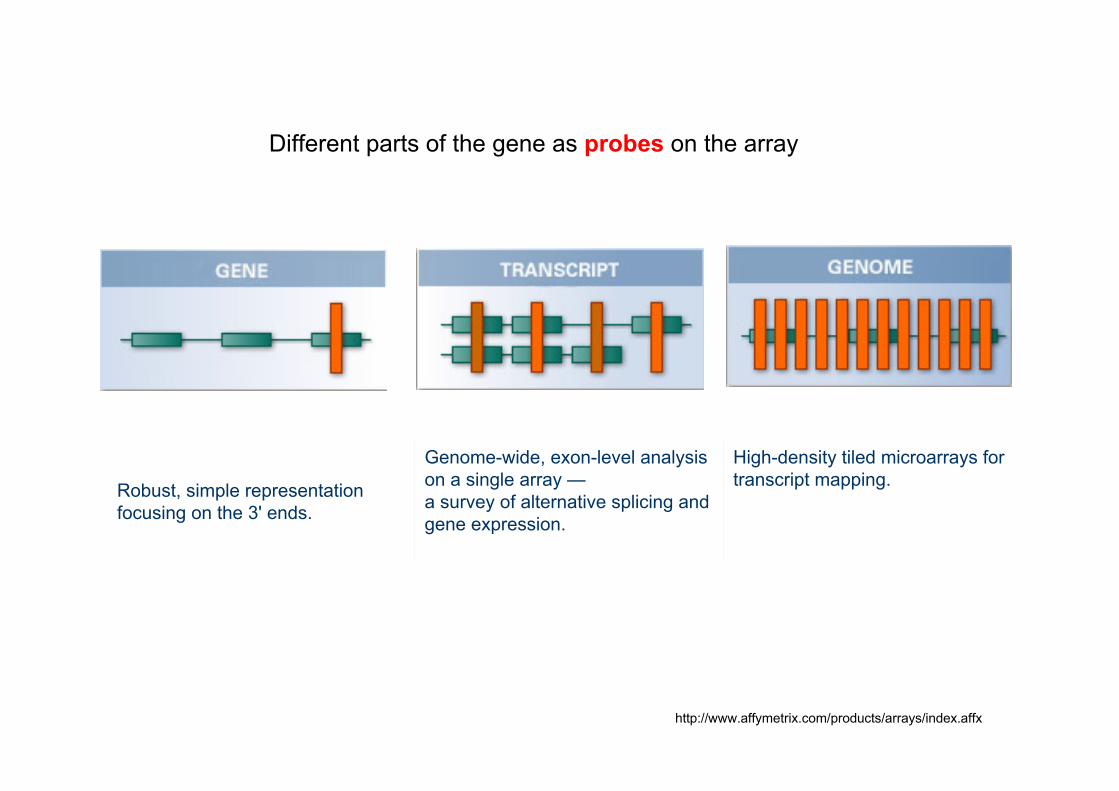
High-density tiled microarrays for transcript mapping.
Genome-wide, exon-level analysis on a single array —a survey of alternative splicing and gene expression.
Robust, simple representation focusing on the 3' ends.
Different parts of the gene as probes on the array
http://www.affymetrix.com/products/arrays/index.affx

Parts of a gene represented in different types of microarrays

Hybridization: Watson-Crick base pairing; AT(U), GC

http://www.ieee.org/portal/cms_docs_sscs/sscs/07Fall/HamFig1s.jpg
Hybridization on the microarray

Probes/Targets
...Probes: are the tethered nucleic acids with known sequence (ASO or cDNA),– the DNA on the array,
...Target: is the free nucleic acid sample whose identity/abundance is being detected,
– the labeled nucleic acid that is washed over the chip.
Probe
target

Double versus single colour labeling

In a two-colour experiment DNA (RNA) from individuals of the same species or different tissue from a single individual is extracted and differentially labelled with compatible fluorophores (Cy3 and Cy5). Equal amounts of labelled DNA/cDNA is hybridized to the microarray, and the hybridization reaction is allowed to come to equilibrium over a period of >12 hours.
In one-colour experiment the DNA is labelled with a single colour and hybridized to a microarray without a reference sample. For Affymetrix microarrays, DNA is labeled with biotin, adding streptavidin conjugated to phycoerythrin after hybridization. Rather than a ratio, an absolute value of hybridization is determined; following normalization, this value is compared with other experiments to detect genomic variation.
The difference between two-colour and one-colour experiments is that in the former case two samples are compared within an experiment whereas in the latter case two separate experiments are required to compare the samples.
A single two-colour hybridization gives less variation at each probe than twoindependent one-colour hybridizations because the detailed conditions at every probe, such as salt concentration and temperature, are identical in the two-colour experiment but are not necessarily identical in the two independent one-colour experiments.
Gresham D. et al., Nature Reviews Genetics 9, 291-302 (April 2008)


Genotyping microarrays
DNA microarrays can be used to read the sequence of a genome in particular positions.
SNP microarrays are a particular type of DNA microarrays that are used to identify genetic variation in individuals and across populations.
Short oligonucleotide arrays can be used to identify the single nucleotide polymorphisms (SNPs) that are thought to be responsible for genetic variation and the source of susceptibility to genetically caused diseases.
Amplifications and deletions can also be detected using comparative genomic hybridization in conjuction with microarrays.
Resequencing arrays have also been developed to sequence portions of the genome in individuals. These arrays may be used to evaluate germlinemutations in individuals, or somatic mutations in cancer.Genome tiling arrays include overlapping oligonucleotides designed to blanket an entire genomic region of interest. Many companies have successfully designed tiling arrays that cover whole human chromosomes.

Methods of detection of differences at the genome level
• Mendelian Genetics,
• Direct DNA Sequencing,
• RFLP analysis,
– Restriction Fragment Length Polymorphism,
• Allele Specific Oligonucleotides,
• DNA Microarrays
• Novel generation of high-throughput sequencing

The complete human genome sequence announced in June 2000 is a "representative" genome sequence based on the DNA of just a few individuals.
Over the longer term, scientists will study DNA from many different people to identify where and what variations between individual genomes exist. Sequencing a genome is such a Herculean task that capturing its person-to-person variability on the first pass would be next to impossible.
www.genomenewsnetwork.org/.../ Chp4_1.shtml
If every human genome is different, what does it mean to sequence "the" human genome?
Since every person's genome is unique, no one person is any more or less "representative" than any other and it hardly matters whose genome is sequenced first.
The vast majority of the genome's sequence is the same from one person to the next, with the same genes in the same places.

Why is every human genome different?
Where are genome variations found?
What kinds of genome variations are there?

DNA Polymorphism
…a DNA locus that has two or more sequence variations, each present at a frequency of 1%or more in a population,
– 1 in 700 frequency common in most species,
– less than 1 million loci in humans (1 in 3,000).
Most SNPs have only two alleles
The human genome contains more than 2 million SNPs.

DNA polymorphisms
• Single Base Pair Differences,
– Single Nucleotide Polymorphisms (SNPs),
• Microsatellites (short sequence repeats),
• Minisatellites (long sequence repeats),
• Deletions,
• Duplications.

Allele-Specific Oligonucleotides (ASO)
…short synthetic DNA probes able to differentiate between sequences differing
by as little as 1 base pair,
--AGTAGCTGTAGCT--
--TCATCGACATCGA--
Probe with fluorescent or radioactive dCTPs.
--AGTAGCTGTAGCT--
--TCATCGAaATCGA--
mismatchno binding
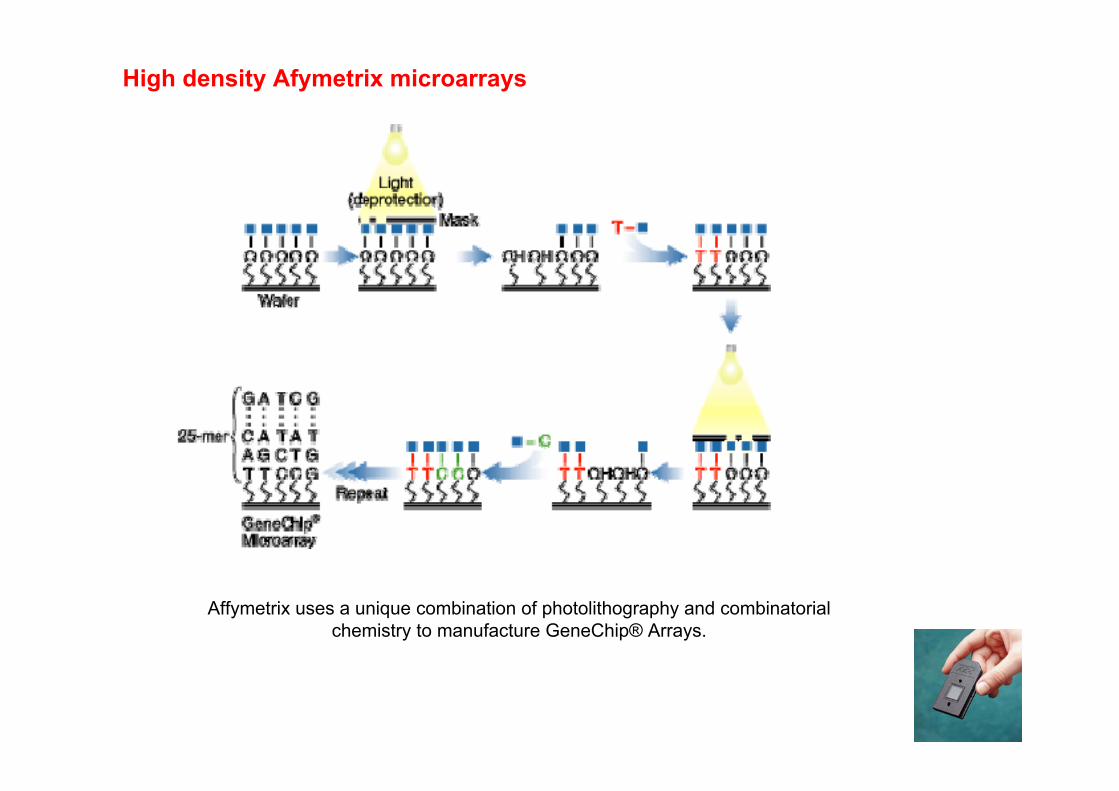
Affymetrix uses a unique combination of photolithography and combinatorialchemistry to manufacture GeneChip® Arrays.
High density Afymetrix microarrays

SNP array design
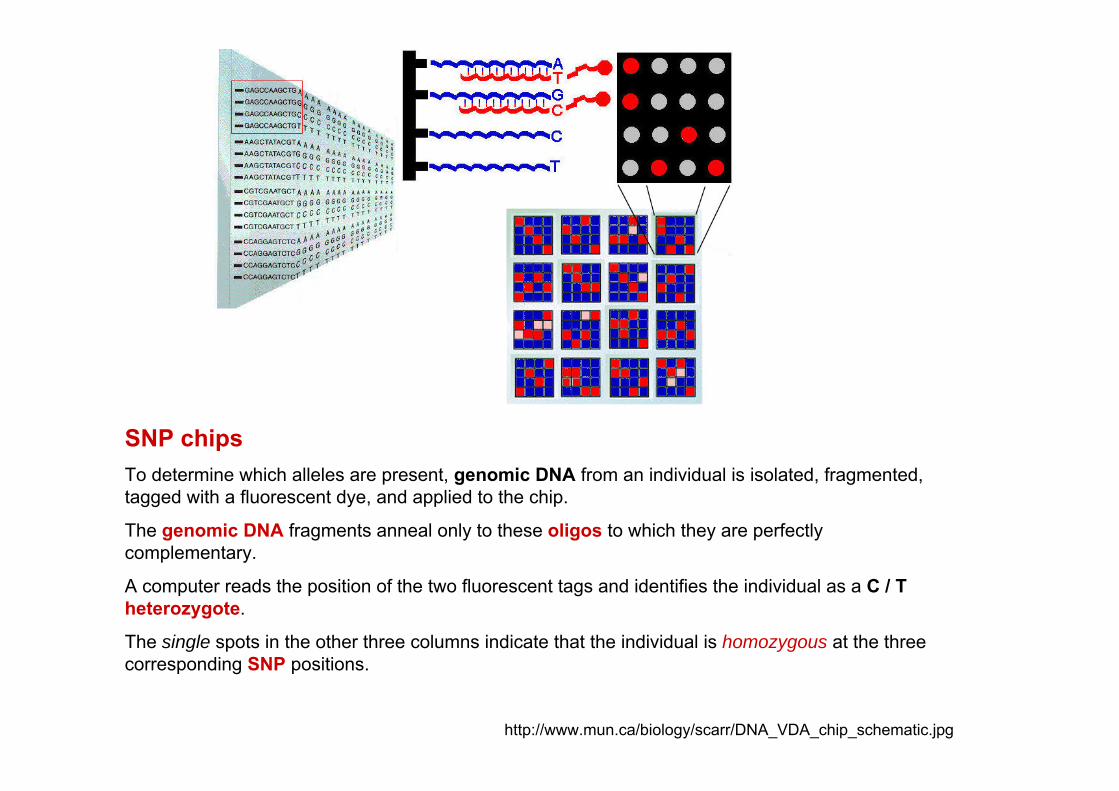
http://www.mun.ca/biology/scarr/DNA_VDA_chip_schematic.jpg
SNP chipsTo determine which alleles are present, genomic DNA from an individual is isolated, fragmented, tagged with a fluorescent dye, and applied to the chip.
The genomic DNA fragments anneal only to these oligos to which they are perfectly complementary.
A computer reads the position of the two fluorescent tags and identifies the individual as a C / T heterozygote.
The single spots in the other three columns indicate that the individual is homozygous at the three corresponding SNP positions.

http://flysnp.imp.ac.at/images/microarray_principle.jpg

Targeted genotyping

Array comparative genomic hybridization (CGH) is a tool for the assessment of DNA copy number variation (CNV) within any given DNA sample.
The technique is derived from the concept of conventional CGH where patient and reference DNA (the latter derived from a normal male/female) is differentially labelled and co-hybridized to a normal metaphase spread.
Comparative genomic hybridization

Some diseases are associated with sections of chromosomes that are erroneously replicated or deleted.
The technique of array-based genomic hybridisation (array-comparative genomic hybridization CGH or copy number variation CNV) allows high-throughput, rapid identification and mapping of these genomic DNA copy number changes, with higher resolution than is possible using traditional, non-array methods.
http://www.nature.com/labinvest/journal/v85/n9/images/3700312f2.jpg

Array-based Comparative genome hybridization (CGH)
http://www.sanger.ac.uk/HGP/Cytogenetics/gfx/cgh_300.jpg
In array-based CGH, large insert clones like BACs , containing human DNA, replace the metaphase spread as target.
The clones are spotted in three- four- or fivefold on a microscope slide. Depending on the contents ofthe array, the collection of clones that is printed on the slide, specific chromosome parts or even the entire genome can be analyzed in one experiment.

Comparative genome hybridization chip

THE SNP ARRAY 6.0 HAS NEAR-SATURATED COVERAGE OF SNP VARIATION. WITH EMPIRICALLY TESTED COPY NUMBER PROBES WITH MORE EXTENSIVE COVERAGE OF CNVS, THE SNP ARRAY 6.0 CAN DETECT 10 TIMES THE AMOUNT OF COPY NUMBER VARIATION THAN COMPETING PRODUCTS. FIGURE 1 AND 2 DEMONSTRATES THE POWER OF THE SNP 6.0 ARRAY FOR CNV MAPPING AND CNV ASSOCIATION STUDIES. THE ULTRA HIGH COPY NUMBER RESOLUTION OF 1.8 MILLION MARKERS ALLOWS TO FINE MAP CNV REGIONS AND DEFINES ACCURATE CNV MAPS FOR CNV ASSOCIATION STUDIES.
CNV arrays based on SNP oligonucleotides


SNP-CGH arrays collect both intensity and allelic information, allowing two different genomic profiles (plot of SNP parameter as a function of genomic location) to be generated. The log2 intensity (LI) ratio measures the intensity of a sample relative to a reference intensity and the allele frequency (AF) measures the allele frequency at a particular SNP along the genome. Loss of heterozygosity (LOH) can easily be observed using the AF plot by noting an absence of heterozygotes (A/B).
Genomic profiles of LI and AF are shown for genomic DNA from the HL-60 leukaemia cell line using a high-density SNP-CGH array (109,000 loci). The heterozygous deletion on chromosome 14 and the duplication of chromosome 18 can both be seen in the LI and AF profiles. The deletion appears as loss of heterozygotes in the AF plot, and the duplication splits the heterozygous cluster in the AF plot (the two clusters correspond to 2:1 and 1:2 allele ratios). The dotted line in the LI plot represents a 300 kb moving average
SNP-CGH (comparative genomic hybridization) arrays

http://www.genomictree.com/images/bioimg09.jpg
Expression profiling and CGH
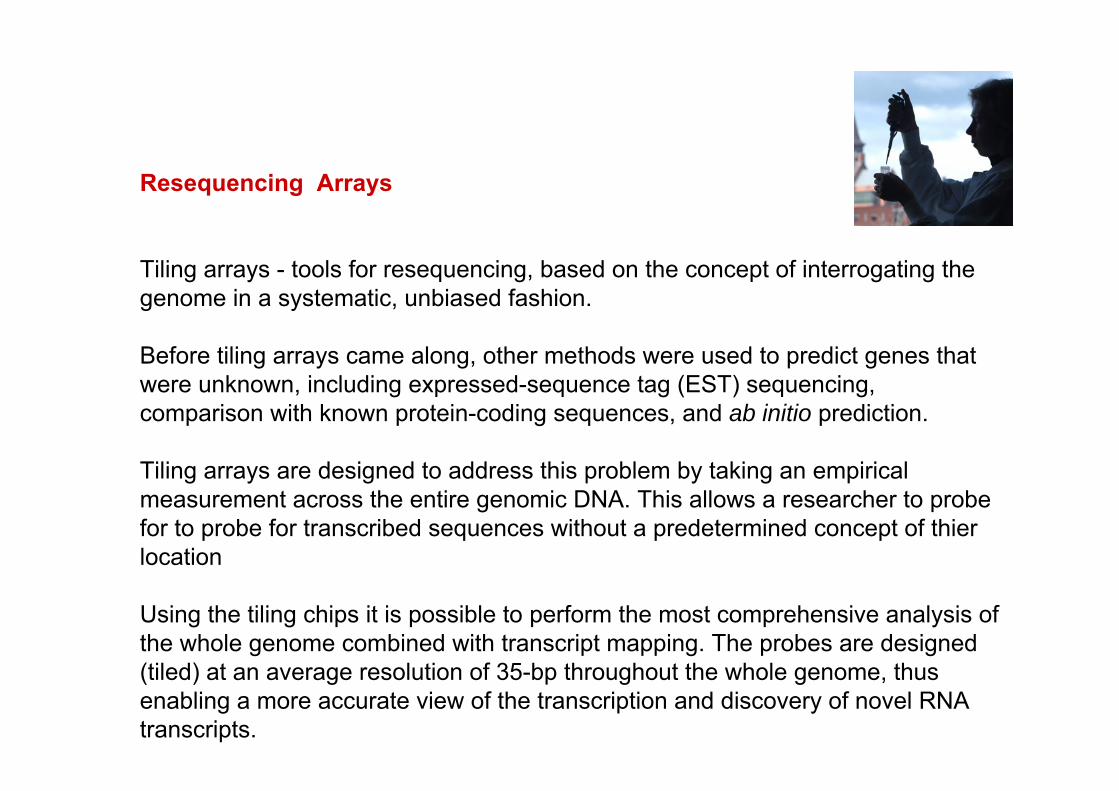
Resequencing Arrays
Tiling arrays - tools for resequencing, based on the concept of interrogating the genome in a systematic, unbiased fashion.
Before tiling arrays came along, other methods were used to predict genes that were unknown, including expressed-sequence tag (EST) sequencing, comparison with known protein-coding sequences, and ab initio prediction.
Tiling arrays are designed to address this problem by taking an empirical measurement across the entire genomic DNA. This allows a researcher to probe for to probe for transcribed sequences without a predetermined concept of thier location
Using the tiling chips it is possible to perform the most comprehensive analysis of the whole genome combined with transcript mapping. The probes are designed (tiled) at an average resolution of 35-bp throughout the whole genome, thus enabling a more accurate view of the transcription and discovery of novel RNA transcripts.

http://www.mun.ca/biology/scarr/Iterative_sequencing_schematic.jpg


Principle of expression profilingčitalec
označevanje
Obratno prepisovanje
Emisija
Prekrivanje
Računalniška analiza
Laser 1Test Referenca
Laser 2
ko-hibridizacija
Ekspresijsko profiliranje z DNA mikromrežami – dvojno označevanje
Geni zastopani scDNA ali z oligonukleotidi
Robot-nanašalec(spotter)
mikromreže s cDNA in dolgimi oligonukleotidi s 3’-konca

APPROXIMATELY FOUR PROBES PER EXON AND ROUGHLY 40 PROBES PER GENE, THE GENECHIP® HUMAN EXON 1.0 ST ARRAY ENABLES TWO COMPLEMENTARY LEVELS OF ANALYSIS—GENE EXPRESSION AND ALTERNATIVE SPLICING.
MULTIPLE PROBES PER EXON ENABLE "EXON-LEVEL" ANALYSIS AND ALLOW YOU TO DISTINGUISH BETWEEN DIFFERENT ISOFORMS OF A GENE.
THIS EXON-LEVEL ANALYSIS ON A WHOLE-GENOME SCALE OPENS THE DOOR TO DETECTING SPECIFIC ALTERATIONS IN EXON USAGE THAT MAY PLAY A CENTRAL ROLE IN DISEASE MECHANISM AND ETIOLOGY.THE SECOND LEVEL IS "GENE-LEVEL" EXPRESSION ANALYSIS, IN WHICH MULTIPLE PROBES ON DIFFERENT EXONS ARE SUMMARIZED INTO AN EXPRESSION VALUE OF ALL TRANSCRIPTS FROM THE SAME GENE.
EXON ARRAYS PROVIDE THE MOST COMPREHENSIVE COVERAGE OF THE GENOME, INCLUDING EMPIRICALLY SUPPORTED AND PREDICTED TRANSCRIBED SEQUENCES, ENABLING THE DISCOVERY OF PREVIOUSLY UNIDENTIFIED NOVEL EVENTS.
Exon arrays

GeneChip Exon Arrays provide the most comprehensive coverage of the genome and enable two complementary levels of analysis: gene expression and alternative splicing. Multiple probes per exon enable "exon-level" analysis and allow you to distinguish between different isoforms of a gene. This exon-level analysis on a whole-genome scale opens the door to detecting specific alternative splicing events that may play a central role in disease mechanism and etiology. You can also perform "gene-level" analysis, in which multiple probes on different exons are summarized into a single expression value of all transcripts from the same gene, enabling similar analysis workflows to 3'-gene expression.
Exon arrays


The exon array labeling protocol

Complex organisation and structure of the ghrelin antisense strand gene GHRLOS, a candidate non-coding RNA geneSeim I et al., BMC Molecular Biology 2008, 9:95
Exon arrays – example I

http://www.bcgsc.ca/people/malachig/htdocs/alexa_platform/images/Figures/ExperimentalOverview.jpg
Exon arrays – example II
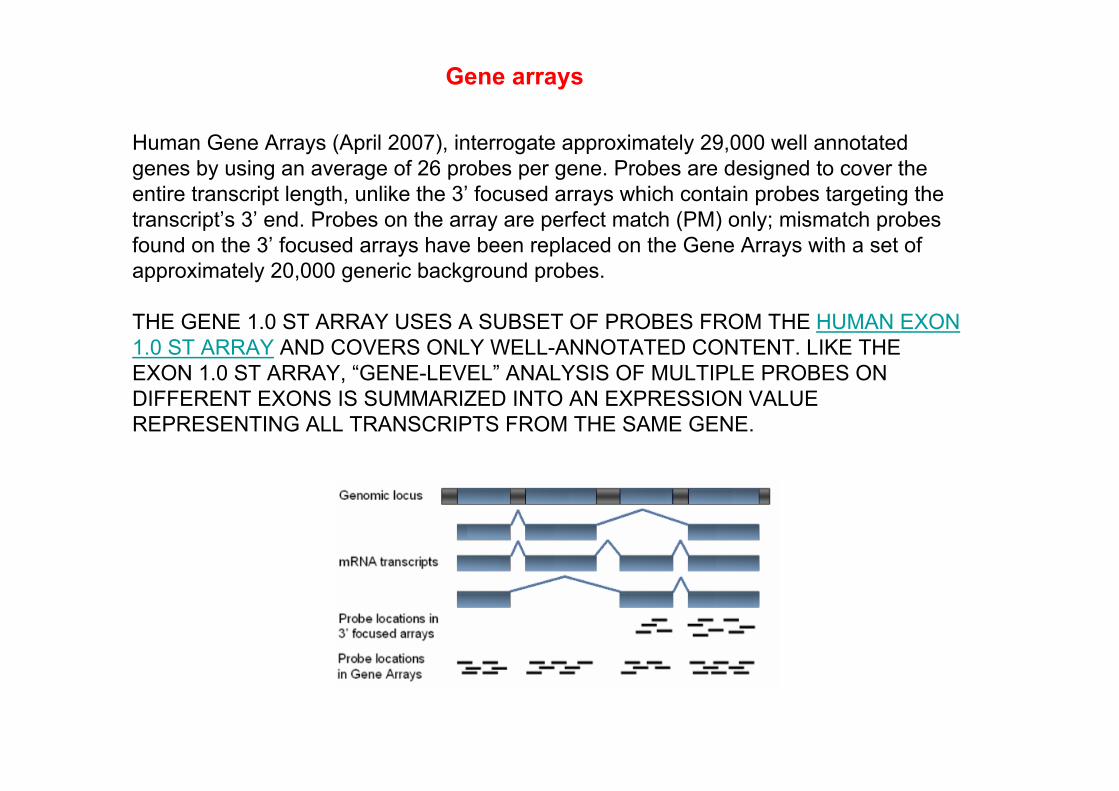
Human Gene Arrays (April 2007), interrogate approximately 29,000 well annotated genes by using an average of 26 probes per gene. Probes are designed to cover the entire transcript length, unlike the 3’ focused arrays which contain probes targeting the transcript’s 3’ end. Probes on the array are perfect match (PM) only; mismatch probes found on the 3’ focused arrays have been replaced on the Gene Arrays with a set of approximately 20,000 generic background probes.
THE GENE 1.0 ST ARRAY USES A SUBSET OF PROBES FROM THE HUMAN EXON 1.0 ST ARRAY AND COVERS ONLY WELL-ANNOTATED CONTENT. LIKE THE EXON 1.0 ST ARRAY, “GENE-LEVEL” ANALYSIS OF MULTIPLE PROBES ON DIFFERENT EXONS IS SUMMARIZED INTO AN EXPRESSION VALUE REPRESENTING ALL TRANSCRIPTS FROM THE SAME GENE.
Gene arrays

Number of Genes covered 28,869 Total number of probes 764,885
Number of probes per gene (median) 26
Feature (spot) size 5 µm Oligonucleotide probe length25mer
Number of arrays per sample 1 Starting amount of total RNA 100
ng
Labeling protocol for gene arrays

Comparison of the workflow for 3’ and gene expression arrays

miRNA Profiling
MicroRNAs (miRNAs) are 21-23 nucleotide long non-coding RNA molecules that have been shown to regulate the stability or translational efficiency of target messenger RNAs. They have been shown to regulate diverse processes such as Fragile X , cancer proliferation and fat metabolism. At present over 530 different miRNA sequences have been validated in the human (Sanger Institute mirBase database) although recent research suggests that the number of unique miRNAs could exceed 800. It is also thought that miRNA genes regulate protein production for 10% or more of all human genes making them an increasingly important area of research

Agilent offer arrays designed for human, mouse and rat miRNA expression profiling. Each array contains probes for the validated miRNAs contained in the mirBase repository (Release 10.1, December 2007). Note: The Human (V1) microarray is based on a previous release (9.1, February 2007) of mirBase and hence contains probes for fewer transcripts. miRBASE is a recognised data repository of validated miRNA sequences and allows users to obtain, where available, annotation of individual miRNAs and search for species homologs. Also included on the array are probes for a number of viral miRNAs. No predicted miRNA sequences are included on the array. Because of the sequence homology between species, Agilent have decided not to create a multispecies array, believing that cross hybridisation between probes could influence signal intensity for the species of interest.
Each 1" x 3" glass slide contains 8 individual arrays, each containing ~15,000 empirically designed probes. Each slide can only be hybridised once, so the 8 arrays must be run simultaneously. Every miRNA is interrogated with between 20 and 40 duplicate probes distributed randomly across the array. This means the arrays are very robust to any hybridisation artifacts, as outliers can be identified and excluded when summarising probe-level data into transcript level data.
Agilent miRNA Array Design

The 5' hairpin on each probe provides excellent size discrimination. Source: Agilent
Agilent's novel approach to probe design provides discrimination based on sequence specificity and on sequence length. Incorporation of a hairpin at the 5' end of each probe provides valuable discrimination for target size specificity, as it destabilizes probe hybridization to larger, non-target RNAs.
The labeling protocol adds a Cy3-Cytosine residue to the 3' end of miRNAs. This, coupled with the inclusion of Guanine residue at the 5' end of the probe, increases the stability of binding to labeled target miRNAs.
Every 40-60mer oligonucleotide probe is 65µm in diameter and synthesised directly onto the array surface using the Agilent proprietary SurePrint™ ink-jet technology.
Hybridiation of miRNA microarrays

miRNA isolation
The starting material for Agilent miRNA Arrays is total RNA (not small RNA) by isolated with i.e. TRIZOL still containing small RNA molecules. As such, they should not have been cleaned up using columns as this will invariably remove the small RNAs which the arrays are trying to measure. Just 100ng of total RNA is required for labelling. Once isolated, samples can be quantified using the Nanodrop Spectrophotometer. Because miRNAs are so short, they are less prone to degradation then mRNAs and it has been tentatively shown that good data can be obtained from Formalin Fixed ParafinEmbedded (FFPE) tissue. Total RNA quality can be checked on the Agilent 2100 Bioanalyser to ensure no degradation of larger RNA molecules has occurred.
Screen capture of Agilent 2100 Bioanalyzer electropherograms of a TRIZOL Reagent isolated total RNA. Note the pronounced peak of RNA at <200nt, typically not seen in column cleaned-up samples. Source: Microarray Centre

miRNA Labelling Strategies
Samples are 3' end labelled with a pCp-Cy3 dye utilising a T4-Ligase after dephosphorylation. Arrays can only be run as single colour and Cy3 has been shown to be much more resistant to ozone degradation than Cy5.
miRNA labelling is carried out by the user with full Microarray Centre support. Users are asked to arrange a time to drop off their labelled samples, arrays, backing gasket slides and the Agilent miRNA Hybridisation Kit (2X Hybridisation Buffer and 10X Blocking Reagent are supplied with the Agilent labelling kit). The labelled samples are hybridised, washed, stained and scanned by members of the centre.
After scanning with the Agilent G2567BA spotted scanner, feature extraction is carried out using Agilent Technologies Feature Extraction 9.1, which reads and processes the raw microarray image to provide accurate data for statistical analysis.

An Agilent 8x15k gasket slide in a SureHyb™ Hybridisation Chamber.
miRNA Samples are 3' end labelled with a pCp-Cy3 dye utilising a T4 Ligase after dephosphorylation. Arrays can only be run as single colour and Cy3 has been shown to be much more resistant to ozone degradation than Cy5.
miRNA Labelling Strategies

Chromatine immunoprecipitation on a chip (CHIP-Chip)

Transcription complex

The Chip protocol
proteomics.swmed.edu

Conventional ChIP and RT-PCR analysis of selected C/EBPδ ChIP-chip target genes. a. C/EBPδ ChIP-chip target gene promoters. C/EBPδ target gene promoters are shown with gene-specific primers (→) and computer predicted C/EBP consensus sites (�). Conventional ChIP assays performed with anti-v5 and IgG (negative control) antibodies. Input lane is derived from direct PCR amplification of genomic DNA. c. C/EBPδ target gene expression: RT-PCR analysis. Total RNA was isolated from MCF-12A cells transfected with pCDNA3.1-hC/EBPδ-v5 and cultured under exponentially growing (GR) or contact inhibition conditions. Total RNA was reverse transcribed and PCR amplified using gene-specific primers. No RT = PCR amplification of RNA samples without RT. GAPDH was used as a non-C/EBPδ inducible RNA expression control.Zhang et al. BMC Molecular Biology 2008 9:83 doi:10.1186/1471-2199-9-83
Conventional chromatin immunoprecipitation

The "ChIP to Chip" Assay
The DNA fragments co-immunoprecipitated with the protein of interest are amplified by ligating linkers to the ends of the DNA fragments.
The amplified material is then annealed to a DNA microarray containing the appropriate probes.
This is often done with two colors, the other being the total DNA as a control.
Any DNA enriched in the immunoprecipitation above the level of the total is scored as a site of protein binding.
proteomics.swmed.edu


ChIP-chip microarray analysis as seen from the ChIP Analytics software (from Agilent). A transcription factor binding site is identified by measuring redundant hybridization to microarray probes specific for contiguous genomic segments
Chip-chip readout

Detection of Nkx2-5 binding to the Actc1 promoter and intron 1 (A) and the Nppa promoter (B) using the Integrated Genome Browser
Chip-chip – example I
www.nimr.mrc.ac.uk/devbiol/mohun/cardiacdiff/

The Mouse PromoterChip BCBC-5A and BCBC-5B allow for the rapid screening of over 30,000 promoter regions and regulatory elements using the powerful ChIP-on-Chip assay. The BCBC-5A chip contains over 18,000 proximal and distal promoter regions. Promoter regions were determined from full length cDNA libraries and Reference Sequences (RefSeqs). Over 12,000 well characterized genes were chosen and are represented by either a 1 kb or 2 kb tile, PCR amplified from genomic material. The BCBC-5B contains over 18,000 potential regulatory regions such as enhancers, microRNA regions, highly conserved genomic regions, and an additional 5,100 promoter regions not included on the BCBC-5A chip. Each of these arrays contain over 18,000 proximal and distal promoter regions. Together these chips provide a powerful new tool that can be used for location analysis of global histone modification as well as specific binding by transcription factors.
ChIP-Chip example II
http://www.med.upenn.edu/idom/cores_fgc_arrays.html

ChIP-on-Chip has also been adapted for analysis of DNA methylation patterns by performing immunoprecipitation of methylated cytosine bases (MeDIP). Cytosine methylation is required for mammalian development and is often perturbed in human cancer. In mammals, cytosine methylation occurs almost exclusively at CpG dinucleotides, which are under-represented in the genome with the exception of CpG islands. For this reason, CpG Island biased arrays are specifically used for epigenetic methylation studies.
ChIP-on-Chip and Methylation Analysis
wikipedia

Simulated data to visualize typical analysis using MeDIP-chip
A fraction of the input DNA obtained after the sonication step above is labeled with cyanine-5 (Cy5; red) dexoy-cytosine-triphosphate while the methylated DNA, enriched after the immunoprecipitation step, is labeled with cyanine-3 (Cy3; green). The labeled DNA samples are cohybridized on a 2-channel, high-density genomic microarray to probe for presence and relative quantities. The purpose of this comparison is identify sequences that show significant differential expression, thereby confirming the sequence of interest is enriched. Array-based identification of MeDIP sequences are limited to the array design. As a result, the resolution is restricted to the probes in the array design. There are additional standard steps required in signal processing to correct for hybridization issues such as noise, as is the case with most array technologies.
wikipedia
DNA čipi so zbirka mikroskopskih “DNA točk”, cDNA ali oligonukleotidov, pritrjenihna trdo podlago.
Uporabljajo se za:
• Analizo genomske DNA (genotipizacija, SNP analiza, CHG, sekvenciranje).
• Analizo izražanja genov (ekspresijsko profiliranje) , kjer probe lahkopredstavljajo 3'–konce genov, eksone ali različne dele genov. Posebni čipi pa so za sledenje izražanja miRNA.
• Študije uravnavanja izražanja genov (določanje vezavnih mesttranskripcijskih faktorjev, metilacija kromatina), kjer probe predstavljajo 5’-neprevedene dele in nerepetitivne dele genov.
Povzetek