(1951) coefficient alpha and the internal structure of tests
TRANSCRIPT
PSYCHOMETRIKA--VOL. 16, NO. 3 S~.FrF.M B~, 1951
C O E F F I C I E N T A L P H A AND T H E I N T E R N A L S T R U C T U R E OF TESTS*
LF~ J . CRONBACH UNIVERSITY OF ILLINOIS
A general formula (a) of which a special case is the Kuder- Richardson coefficient of equivalence is shown to be the mean of all split-half coefficients resulting from different splittings of a test. is therefore an estimate of the correlation between two random sam- ples of items from a universe of i tems like those in the test. ~ is found to be an appropriate index of equivalence and, except for very short tests, of the first-factor concentration in the test. Tests di- visible into distinct subtests should be so divided before using the formula. The index ~ j , derived from a , is shown to be an index of inter-item homogeneity. Comparison is made to the Guttmau and Loevinger approaches. Parallel split coefficients are shown to be un- necessary for tests of common types. In designing tests, maximum interpretability of scores is obtained by increasing the firat-facter concentration in any separately-scored subtest and avoiding sub- stantial group-factor clusters within a subtest. Scalability is not a requisite.
I. Historical Resum~ Any research based on measurement must be concerned with the
accuracy or dependabili ty or, as we usually call it, reliability of meas- urement. A reliability coefficient demonstrates whether the tes t de- s igner was correct in expecting a certain collection of i tems to yield interpretable s ta tements about individual differences (25).
Even those invest igators who regard reliability as a pale shadow of the more vital ma t te r of validity cannot avoid considering the re- liability of their measures. No validity coefficient and no factor analy- sis can be interpreted wi thout some appropr ia te est imate of the mag- nitude of the er ror of measurement . The prefer red way to find out how accurate one's measures are is to make two independent measure- ments and compare them. In practice, psychologists and educators have often not had the opportuni ty to recapture their subjects for a second test. Clinical tests, or those used for vocational guidance, a re generally worked into a crowded schedule, and there is a lways a de-
*The assistance of Dora Damrin and Willard Warrington is gratefully ac- knowledged. Miss Damrin took major responsibility for the empirical studies re- ported. This research was supported by the Bureau of Research and Service, Col- lege of Education.
297
298 PSYCHOMETRIKA
sire to give additional tests if any extra time becomes available. Purely scientific investigations fare little better. It is hard enough to schedule twenty tests for a factorial study, let alone scheduling another twenty just to determine reliability.
This difficulty was first circumvented by the invention of the split- hail approach, whereby the test is rescored, half the items at a time, to get two estimates. The Spearman-Brown formula is then applied to get a coefficient similar to the correlation between two forms. The split-half Spearman-Brown procedure has been a standard method of test analysis for forty years. Alternative formulas have been devel- oped, some of which have advantages over the original. In the course of our development, we shall review those formulas and show rela- tions between them.
The conventional split-half approach has been repeatedly criti- cized. One line of criticism has been that split-half coefficients do not give the same information as the correlation between two forms given at different times. This difficulty is purely semantic (9, 14) ; the two coefficients are measures of different qualities and should not be iden- tified by the same unqualified appellation "reliability." A retest after an interval, using the identical test, indicates how stable scores are and therefore can be called a coefficient of stability. The correlation between two forms given virtually at the same time, is a coefficient of equivalence, showing how nearly two measures of the same general trait agree. Then the coefficient using comparable forms with an in- terval between testings is a coefficient of equivalence and stability. This paper will concentrate on coefficients of equivalence.
The split-half approach was criticized, first by Brownell (3), later by Kuder and Richardson (26), because of its lack of unique- ness. Instead of giving a single coefficient for the test, the procedure gives different coefficients depending on which items are grouped when the test is split in two parts. If one split may give a higher co- efficient than another, one can have little faith in whatever result is obtained from a single split. This criticism is with equal justice ap- plicable to any equivalent-forms coefficient. Such a coefficient is a property of a pair of tests, not a single test. Where four forms of a test have been prepared and intercorrelated, six values are obtained, and no one of these is the unique coefficient for Form A; rather, each is the coefficient showing the equivalence of one form to another spe- cific form.
Kuder and Richardson derive a series of coefficients using data from a single trial, each of them being an approximation to the inter-

IJEP, j . CRONBACH 299
form coefficient of equivalence. Of the several formulas, one has been justifiably preferred by test workers. In this paper we shall be espe- cially concerned with this, their formula (20) :
°( , rtt(~,,,~ - - - - 1 - - ; (i--l,2,...n). (I)
Here, i represents an item, p~ the proport ion receiving a score of 1, and q~ the proport ion receiving a score of zero on the item.
We can wri te the more general formula
n i a - - - - i---- . (2)
n--1 Vt
Here Vt is the variance of tes t scores, and lz~ is the variance of i tem scores af ter weighting. This formula reduces to (1) when all i tems are scored 1 or zero. The var iants reported by Dressel (10) for cer- tain weighted scorings, such as Rights-minus-Wrongs, are also spe- cial cases of (2) , but for most data computat ion directly f rom (2) is simpler than by Dressel 's method. Hoyt ' s derivation (20) arr ives a t a formula identical to (2) , although he draws at tention to its ap- plication only to the case where i tems are scored 1 or 0. Following the pa t te rn of any of the other published derivations of (1) (19, 22), making the same assumptions but imposing no limit on the scoring pattern, will permit one to derive (2).
Since each wr i te r offering a derivation used his own set of as- sumptions, and in some cases criticized those used by his predeces- sors, the precise meaning of the formula became obscured. The origi- nal derivation unquestionably made much more s tr ingent assumptions than necessary, which made it seem as if the formula could properly be applied only to ra re tests which happened to fit these conditions. I t has generally been s tated that a gives a lower bound to "the t rue re l iabi l i ty"--whatever tha t means to tha t part icular wri ter . In this paper, we take formula (2) as given, and make no assumptions re- garding it. Instead, we proceed in the opposite direction, examining the propert ies of a and thereby ar r iv ing a t an interpretation.
We introduce the symbol a par t ly as a convenience. "Kuder- Richardson Formula 20" is an awkward handle for a tool tha t we ex- pect to become increasingly prominent in the test l i terature. A second reason for the symbol is tha t a is one of a set of six analogous coeffi- cients (to be designated /~, r , 8 , etc.) which deal with such other

300 PSYCHOMETRIKA
concepts as like-mindedness of persons, s tabil i ty of scores, etc. Since we are concentrat ing in this paper on equivalence, the first of the six properties, description of the five analogous coefficients is reserved for later publication.
Critical comments on the Kuder-Richardson formula have been primari ly directed to the fact tha t when inequalities are used in de- r iving a lower bound, there is no way of knowing whether a part icu- lar coefficient is a close es t imate of the desired measure of equivalence or a gross underestimate. The Kuder-Richardson method is an over- all measure of internal consistency, bu t a test which is not internally homogeneous may nonetheless have a high correlation with a care- fully-planned equivalent form. In fact, i tems within each tes t may correlate zero, and yet the two tests may correlate perfect ly if there is item-to-item correspondence of content.
The essential problem set in this paper is: How shall a be inter- preted ? a , we find, is the average of all the possible split-half coeffi- cients for a given test. Juxtaposed with fu r the r analysis of the varia- tion of split-half coefficients f rom split to split, and with an examina- tion of the relation of a to item homogeneity, this relation leads to recommendations for es t imat ing coefficients of equivalence and homo- geneity.
II. A Comparison of Split-Half Formulas The problem set by those who have worked out formulas for split-
half coefficients is to predict the correlation between two equivalent whole tests, when data on two half- tests are a t hand. This requires them to define equivalent tests in mathematical terms.
The first definition is tha t introduced by Brown (2) and b y Spearman (33), namely, tha t we seek to predic t correlation wi th a tes t whose halves are c and d , possessing da ta f rom a tes t w h o s e
halves are a and b , and that
V~ ~- Vb ~-~ V~ - - V~; and r ~ - ~ r ~ - - r d ~ r ~ - - r ~ - - r ~ . (3)
This assumption or definition is far from general. For many splittings V~ # Vb, and an equivalent form conforming to this definition is im- possible.
A more general specification of equivalence credited to FIanagan [see (25) ] is that
Vc~,b~ -- Vc~ ; and r ~ b ~ b ~ r o ~ ¢ ~ ~ ~ - - - r o ~ - - . . . . ( 4 )

LEE J . CRONBACH 301
This assumption leads to various formulas which are collected in the first column of Table 1. All formulas in Column A are mathematical ly identical and interchangeable.
TABLE 1 Formulas for Spli t -Half Coefficients
Formulas Assuming Equal Enter ing Data* Covariances Between Formulas Assuming
Half-Tests aa ~ ab
ZAt" ZB~ Tab ag gb 4uaab~ab 2~¢~
OaZ -t- ~b 2 "Jr 2aaab'rab 1 + zab
o{ o" a o b
9.A§
2 ( 1 %2+%~)u,. 3All
ut2
4A¶ 4B (=--4A) ff$ o' d o'd2 Ud2
1 - - - - l - - - u| 2 ~t 2
5A 5B % .~ ~ 4 (%~ ~ %udr~) 2 (2% 2 - - add
4aa~ -]- a d 2 - - 4 % o d~'ad 4 a a 2 - - U d 2
*In th is table, a and b are the ha l f - ru t ~ . t=~.b .d=a, -b .
rafter Flanagan (ZS) $S~arman-Browa (Z, | I )
| Guttman (19) ]lAfter Mosier (18) ¶Rulon (al)
When a par t icular split is such tha t ~ - - ~ , the Flanagan re- qui rement reduces to the original Spearman-Brown assumption, and in tha t case we ar r ive at the formulas in Column B. Formulas 1B and 5B are not identical, since the assumption enters the formulas in different ways. No short formula is provided opposite 2A or 3A, since these exact formulas are themselves quite simple to compute.
Because of the wide usage of Formula 1B, the Spearman-Brown, it is of interest to determine how much difference it makes which assumption is employed. I f we divide 1B by any of the formulas in Column A we obtain the rat io
2mr + m 2 + 1 1 / 1 + m ~ + r \
k , = 2m(1 + r ) (1 + r ) 2m ' (5) )

302 PSYCHOMETRIKA
in which m = Cb/~, u, < ~b, and r signifies r ~ . The ratio when 5B is divided by any of the formulas in the first column is as follows:
(2mr -- m ~ + 1) (1 + 2mr + m s) k ~ - (6)
2 m r ( 2 m r - - m s + 3)
When m equals 1, tha t is, when the two s tandard deviations are equal, the formula in Column B is identical to tha t in Column A. As Table 2 shows, there is increasing disagreement between Formula 1B and those in Column A as m depar ts f rom unity. The estimate by the Spearman-Brown formula is a lways slightly larger than the coeffi- cient of equivalence computed by the more tenable definition of com- parabili ty.
TABLE 2 Ratio of Spearman-Brown Estimate to More Exact Spli t-Half Estimate of
Coefficient of Equivalence when S.D.'s are Unequal
Ratio of Half-Test
S.D.'s (greater/ lesser)
Correlation Between Half-Tests
.00 .20 .40 .60 .80 1.00
1 1 1 I 1 I 1 I.I 1.005 1.004 1.003 1.003 1.003 1.002 1.2 1.017 1.014 1.012 1.010 1.009 1.008 1.3 1.035 1.029 1.025 1.022 1.020 1.017 1.4 1.057 1.048 1.041 1.036 1.032 1.029 1.5 1.083 1.069 1.060 1.052 1.046 1.042
Formula 5B is not so close an approximat ion to the results f rom formulas in Column A. When m is 1.1, for example, the values of k5 are as folIows: for r = .20, .62 ; for r = .60, .70 ; for r :-- 1.00, .999.
It is recommended that the interchangeable formulas 2A and 4A be used in obtaining split-half coefficients. These formulas involve no assumptions contradictory to the data. They are therefore prefer- able to the Spearman-Brown formula. However, if the rat io of the s tandard deviations of the half-tests is between .9 and 1.1, the Spear- man-Brown formula gives essentially the same result. This finding agrees with Kelley's earlier analysis of much the same question (2, 3).
III. a as the Mean of Split-Half Coefficients
To demonstrate the relation between a and the split-half formu- las, we shall need the following notat ion:

LEE J. CRONBACH 303
Let n be the number of items. The test t is divided into two half-tests, a and b. i' will desig-
nate any item of half-test a, and i" will designate any item of half- test b. Each half-test contains ~z' items, where ~' -~ ~/2.
Vt, V=, and Vb are the variances of the total test and the respec- tive half-tests.
C~j is the covariance of two items i and j.
C= is the total covariance for all items in pairs within half-test a, each pair counted once; Cb is the corresponding "within-test" co- variance for b.
Ct is the total covariance of all item pairs within the test.
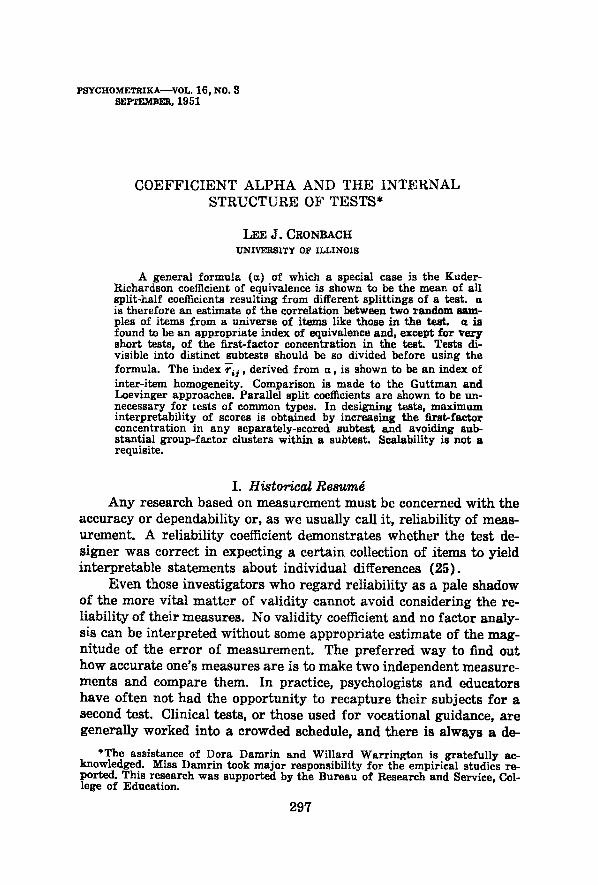
DETAILED PORTION OF MATRIX ITEMS IN FIRST HALF
i a FIRST HALF SECOND HALF 2 4 '" ! . . . . .
i V~ C~ C~ C,~ FIR S T HALF i ~ _~ Ct
" ~,, ~,. w s~co~ I ~ \ \
C~
V~
C~
F~QUaE 1
C. ,,, ,,
V~
Schematic Division of the Matrix of Item Variances and Covariances.

304 PSYCHOMETRIKA
C~b is the total covariance of all item pairs such that one item is within ~ and the other is within b ; it is the "between halves" covari- anee.
Then C~ = r~b~b ; (7)
C, ---- C~ + C~ + C~ ; (8)
V, ---- V. + Vb + 2C.b ---- ~V, + 2C, ; and (9)
V~=~Vi +2C~ and Vb~-~Vi..+2Cb. (I0) ~, ~,,
These identities are readily visible in the sketches of Figure 1, which is based on the matr ix of item covariances and variances. Each point along the diagonal represents a variance. The sum of all entries in the square is the test variance.
Rewrit ing split-half formula 2A, we have
( V. + V~ ) V,-- V,-- Vb r.-----2 1 - - --2 (ii)
V, V,
4C~ ~',, ----- (12)
V,
This indicates tha t whether a part icular split gives a high or low co- efficient depends on whether the high inter i tem covariances are placed in the "between halves" covariance or whether the items having high correlations are placed instead within the same half.
Now we rewri te a:
Therefore
(vt 1 n - 1 Vt ~ - - 1 Vt
n 2C,
-- 1 V,
- C~ Cij
,,(,~- I)/2"
v,
(13)
(i4)
(15)
(16)
LEE J. CRONBACH 3 0 5
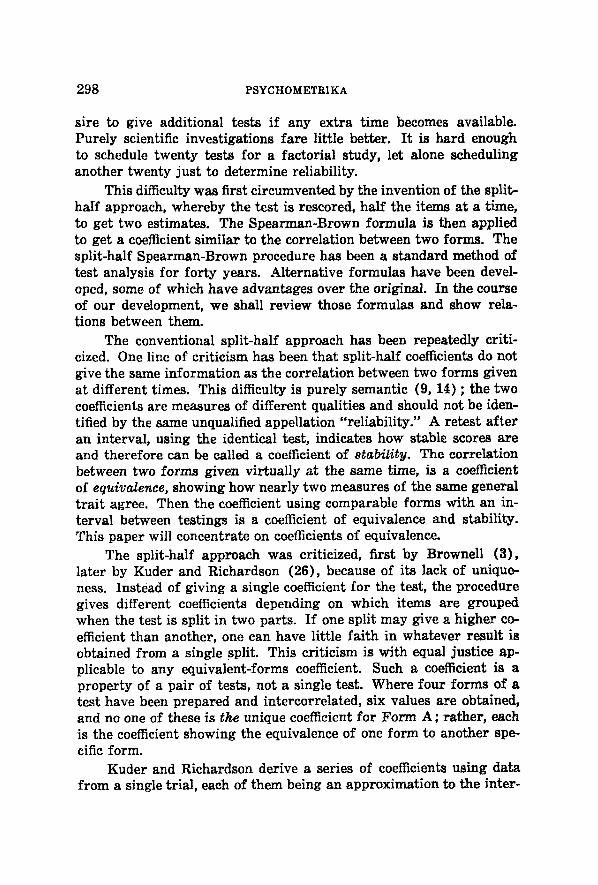
We proceed now by de t e rmin ing the m e a n coefficient f r o m all (2n ' ) ! /2 (n' l) 2 possible spl i ts of the test . F r o m (12) ,
4 ' (Jab rt~ - - ( 1 7 )
V,
In any sp l i t , a p a r t i c u l a r C~; has a p robab i l i ty of 2 ( n - - 1)
into the between-halves covariance C~b. Then over all splits,
(2n ' ) ! n E C,b - - - - E E C(j ; (i = 1 , 2 , - - - n - - 1 ;
2 ( n ' ! ) ~ 2 ( n ~ 1 ) i s 1 - - i + 1 , . . - ; n ) .
But
of fa l l ing
(18)
n ( n - - 1) -
~F. C~j :- C~j. (19) ~j 2
(2n') ! n ~-- Cab -- - - C~, (20)
2(n'!)~4
and
F r o m (17) ,
T h e r e f o r e
__ n2__ C~ ~ - - Cij . (21)
4
r - - ,
4n 2 - n 2 Cij "r,, - - C,t - - ( 2 2 )
4V, V,
@,t ~ a . ( 2 3 )
F r o m (14) , we can also wr i t e a in the f o r m
Z Z C,i
a-- ; ( i , j = l , 2 , . . . n ; i ~ : D . (24) n - - 1 Vc
Th i s i m p o r t a n t r e l a t ion s t a t e s a c lear m e a n i n g f o r a as n / ( n - - l ) t imes the ratio of interitem covariance to total variance. The multiplier n/(n--1) allows for the proportion of variance in any item which is due to the same dements as the covariance.

306 PSYCHOMETRIKA
, as a spec ia l case o f t he s p l i t - h a l f coe f f i c i en t . Not only is a a funct ion of all the split-half coefficients fo r a tes t ; it can also be shown to be a special case of the spli t-half coefficient.
i f we assume tha t the tes t is divided into equivalent halves such
tha t Cry,, (i.e., C,~/n ' 2) equals C~j, the assumptions fo r fo rmula 2A still hold. We may designate the spli t-half coefficient f o r this spl i t t ing a s "l't t l .
4 C~b r . - - ~ (12)
V,
Then
F rom (16) ,
r u ~ - - - - - - - - - - - (25) ~- - Vt --V, V,
rt~o ~ a. (26)
This amounts to a p roof tha t a is an exact de te rmina t ion of the paral- lel-form correlat ion when we can assume tha t the mean covariance between parallel i tems equals the mean covariance between unpai red items. This is the least res t r ic t ive assumption usable in "p rov ing" the Kuder-Richardson formula.
a as t he e q u i v a l e n o e o f r a n d o m s a m p l e s o f i t e m s . T h e foregoing demonst ra t ions show tha t a measures essential ly the same th ing as the split-half coefficient. I f all the splits f o r a tes t were made, the mean of the coefficients obtained would be a . When we make only one split, and make tha t split at random, we obtain a value somewhere in the distr ibution of which a is the mean. I f spli t-half coefficients are dis t r ibuted more or less symmetrical ly, an obtained spli t-half coeffi- cient will be h igher than a about as of ten as it is lower than a. This average tha t is a is based on the ve ry best splits and also on some very poor splits where the i tems going into the two halves are quite unlike each other.
Suppose we have a universe of i tems fo r which the mean covari- ance is t h e same as the mean covariance wi thin the given test . Then suppose two tests a re made by twice sampling n i tems at r andom f r o m this universe wi thout replacement , and adminis tered a t the same sit t ing. The i r corre la t ion would be a coefficient of equivalence. The mean of such coefficients would be the same as the computed a . a is t he r e fo r e an es t imate of the corre la t ion expected between two tes ts d r awn a t r andom f r o m a pool of i tems like the i tems in this test . I tems

LEE J . CRONBACH 3 0 7
are not selected at random for psychological tests where any differen- t iation among the items' contents or difficulties permits a planned selection. Two planned samplings may be expected to have higher correlations than two random samplings, as Kelley pointed out (25). We shall show tha t this difference is usually small.
IV. A n Examination of Previous Interpretations and Criticisms of a
1. Is a a conservative estimate of reliability? The findings jus t presented call into question the frequently repeated state- ment tha t a is a conservative estimate or an underestimate or a lower bound to " the reliability coefficient." The source of this conception is the original derivation, where Kuder and Richardson set up a def- inition of two equivalent tests, expressed their correlation algebra- ically, and proceeded to show by inequalities tha t a was lower than this correlation. Kuder and Richardson assumed tha t corresponding items in test and parallel test have the same common content and the same specific content, i.e., t ha t they are as alike as two trials of the same item would be. In other words, they took the zero-interval re- test correlation as their standard. Guttman also began his derivation by defining equivalent tests as identical. Coombs (6) offers the some- what more sat isfactory name "coefficient of precision" for this index which reports the absolute minimum error to be found if the same ins t rument is applied twice independently to the same subject. A co- efficient of stability can be obtained by making the two observations wi th any desired interval between. A rigorous definition of the co- efficient of precision, then, is tha t it is the limit of the coefficient of stability, as the t ime between testings becomes infinitesimal.
Obviously, any coefficient of equivalence is less than the coeffi- cient of precision, for one is based on a comparison of different items, the other on two trials o f t h e same items. To put i t another way: a
or any other coefficient of equivalence t rea ts the specific content of an item as error, but the coefficient of precision t reats it as par t of the thing being measured. I t is very doubtful if testers have any practi- cal need for a coefficient of precision. There is no practical test ing problem where the items in the test and only these items constitute the t ra i t under examination. We may be unable to compose more items because of our limited skill as tes tmakers but any group of items in a test of intelligence or knowledge or emotionality is regarded as a sam- ple of items. I f there weren ' t "plenty more where these came f rom," performance on the test would not represent performance on any more significant variable.

3 0 8 PSYCHOMETRIKA
We therefore turn to the question, does a underestimate appro- priate coefficients of equivalence? Following Kelley's argument, the way to make equivalent tests is to make them as similar as possible, similar in distribution of item difficulty and in item content. A pair of tests so designed that corresponding items measure the same fac- tors, even if each one also contains some specific variance, will have a higher correlation than a pair of tests drawn at random from the pool of items. A planned split, where items in opposite halves are as similar as the test permits, may logically be expected to have a higher between-halves covariance than within-halves covariance, and in that case, the obtained coefficient would be larger than a. a is the same type of coefficient as the split-half coefficient, and while it may be low- er, it may also be higher than the value obtained by actually splitting a particular test at random. Both the random or odd-even split-half coefficient and a will theoretically be lower than the coefficient from parallel forms or parallel splits.
2. Is a less than the coefficient of stabil i ty ? Some wr i te r s ex- pect a to be lower than the coefficient of stability. Thus Gut tman says (34, p. 311) :
F o r the case of scale scores, t hen , . . . we h a v e t he a s s u r a n c e t h a t i f t he i t ems a r e a p p r o x i m a t e l y sca lable [ in wh ich case a wil l be h i g h ] , t h e n they necessa r i ly h a v e v e r y s u b s t a n t i a l t e s t - r e t e s t re l i ab i l i ty .
Guilford says (16, p. 485) : T h e r e can be v e r y low i n t e r n a l cons i s t ency a n d ye t s u b s t a n t i a l o r
h i g h r e t e s t re l iab i l i ty . I t is p r o b a b l y no t t r u e , however , t h a t t h e r e c an be h i g h i n t e r n a l cons i s t ency a n d a t t he s ame t i m e low r e t e s t re l iab i l i ty , ex- cept a f t e r v e r y long t i m e in t e rva l s . I f t he t wo indices of r e l i ab i l i ty dis- ag ree fo r a tes t , we can place some confidence in t he in fe rence t h a t the t e s t is he te rogeneous .
The comment by Guttman is based on sound thinking, provided we re interpret tes t - re tes t coefficient on the basis of the context of the comment to re fe r to the instantaneous re tes t (i.e., coefficient of pre- cision) ra ther than the re tes t a f t e r elapsed time. Guilford's s ta tement is acceptable only if viewed as a summary of his experience. There is no mathematical necessi ty for his r emarks to be true. In the co- efficient of stability, var iance in total score be tween tr ia ls (within per- sons) is regarded as a source of error, and var iance in specific fac- tors (between i tems within persons) within tr ials is regarded as t rue variance. In the coefficient of equivalence, such as a, this is j u s t re- versed: variance in specific factors is t rea ted as error. Var ia t ion be tween trials is non-existent and does not reduce t rue variance (9) . Whether the coefficient of s tabi l i ty is higher or lower than the co-
LEE J. CRONBACH 309
efficient of equivalence depends on the relative magni tude of these variances, both of which are likely to be small for long tests of stable variables. Tests are also used for unstable variables such as mood, morale, social interaction, and daily work output, and studies of this sort are becoming increasingly prominent. Suppose one builds a homogeneous scale to obtain students ' evaluations of each day's class- work, the students marking the checklist at the end of each class hour. Homogeneous items could be found for this. Yet the scale would have marked instability f rom day to day, if class activities varied or the topics discussed had different interest value for different students.
The only proper conclusion is tha t a may be either higher or low- er than the coefficient of stability over an interval of time.
3. Are coefficients from ~arallel splits appreciably l~igher than random-split coefficients or a? The logical presumption is s t rong that planned splits as proposed by Kelley (25) and Cronbach (7) would yield coefficients nearer to the equivalent-tests coefficient than random splits do. There is still the empirical question whether this advantage is large enough to be considered seriously. This raises two questions: Is there appreciable variation in coefficients f rom split to split? I f so, does the judgment made in spli t t ing the test into a priori equivalent halves raise the coefficient? Brownell (3), Cronbach (8), and Clark (5) have compared coefficients obtained by split t ing a test in many ways. There is doubt that the variation among co- efficients is ordinarily a serious mat te r ; Clark in part icular found that variation f rom split to split was small compared to variation arising from sampling of subjects.
Empirical evidence. To obtain fur ther data on this question, two analyses were made. One employs responses of 250 ninth-grade boys who took Mechanical Reasoning Test Form A of the Differential Abilities Tests. The second study uses a ten-item morale scale, adapted f rom the Rundquist-Sletto General Morale Scale by Donald M. Sharpe and administered by him to teachers and school administrators.*
The Mechanical Reasoning Test seem~ to contain items requir- ing specific knowledges regarding pulleys, gears, etc. Other items seem to be answerable on the basis of general experience or reason- ing. The items seemed to represent sufficiently heterogeneous content tha t grouping into parallel splits would be possible. We found, how- ever, tha t items grouped on a pr/ori grounds had no higher correla- tions than items believed to be unlike in content. This finding is con-
*Thanks are expressed to Dr. A. G. Wesrnan and the Psychological Corpora- tion, and to Dr. Sharpe, for making available the data for the two studies, re- spectively.
310 PSYCHOMETRIKA
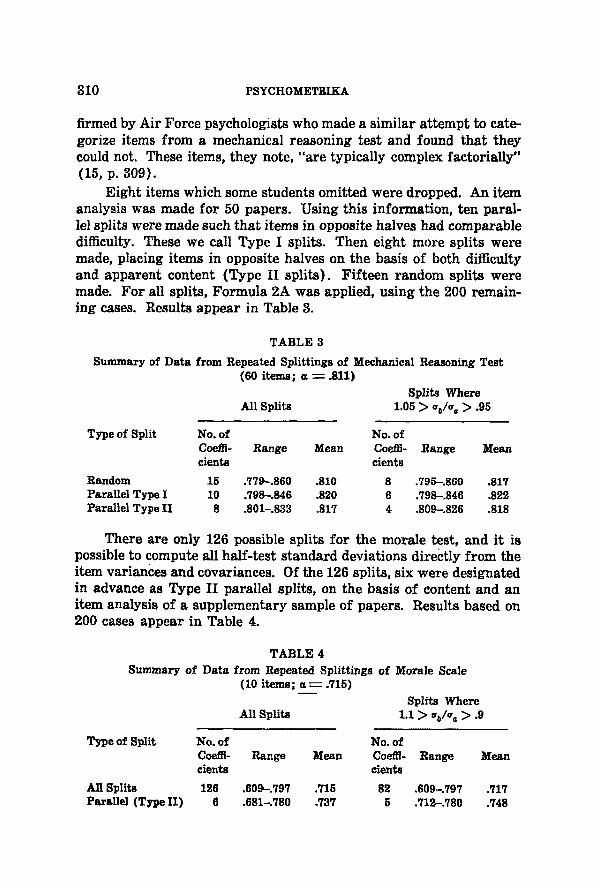
firmed by Air Force psychologists who made a similar attempt to cate- gorize items from a mechanical reasoning test and found that they could not. These items, they note, "are typically complex factorially" (15, p. 309).
Eight items which some students omitted were dropped. An item analysis was made for 50 papers. Using this information, ten paral- lel splits were made such that items in opposite halves had comparable difficulty. These we call Type I splits. Then eight more splits were made, placing items in opposite halves on the basis of both difficulty and apparent content (Type II splits). Fifteen random splits were made. For all splits, Formula 2A was applied, using the 200 remain- ing cases. Results appear in Table 3.
TABLE 3
Summary of Data from Repeated Spli t t ings of Mechanical Reasoning Test (60 it,~-; a ~ .811)
Splits Where All Splits 1.05 > %/% > .95
Type of Split No. of No. of Coefli- Range Mean Coeifi- Range Mean cients eients
Random 15 .779,-.860 .810 8 .795-.860 .817 Para l le l Type I 10 .798--.846 .820 6 .798-,846 ~22 Paral le l Type I I 8 .801-.833 .817 4 .809-.826 ,818
There are only 126 possible splits for the morale test, and it is possible to compute all half-test standard deviations directly from the item variances and covariances. Of the 126 splits, six were designated in advance as Type II parallel splits, on the basis of content and an item analysis of a supplementary sample of papers. Results based on 200 cases appear in Table 4.
TABLE 4 Summary of Data from Repeated Spli t t inge of Morale Scale
(I0 items; a ~-" .715)
Splits Where All Splits 1.1 > %/% > .9
Type of Split No. of No. of Coefli- Range Mean Coeftl- Range cients cienlm
All Splits 126 .609-.797 .715 82 ,609-.797 Paral lel (Type I I ) 6 .681-.780 .737 5 ,712-.780
~e~n
.717
.748

LEE J. CRONBACH 311
The highest and lowest coefficients for the mechanical test differ by only .08, a difference which would be important only when a very precise estimate of reliability is needed. The range for the morale scale is greater (.20), but the probability of obtaining one of the ex- treme values in sampling is slight. Our findings agree with Clark, that the variation from split to split is less than the variation expected from sample to sample for the same split. The standard error of a Spearman-Brown coefficient based on 200 cases using the same split is .03 when rtt = .8, .04 when r~t -- .7. The former value compares with a standard deviation of .02 for all random-split coefficients of the me- chanical test. The standard error of .04 compares with a standard deviation of .035 for the 126 coefficients of the morale test.
This bears on Kelley's comment on proposals to obtain a unique estimate: "A determinate answer would result if the mean for all possible spilts were gotten, but, even neglecting the labor involved, this would seem to contravene the judgment of comparability." (25, p. 79). As our tables show, the splittings where half-test standard deviations are unequal, which "contravene the judgment of compar- ability," have coefficients about like those which have equal standard deviations.
Combining our findings with those of Clark and Cronbach we have studies of seven tests which seem to show that the variation from split to split is too small to be of practical importance. Brownell finds appreciable variation, however, for the four tests he studied. The ap- parent contradiction is explained by the fact that the former results applied to tests having fairly large coefficients of equivalence (.70 or over). Brownell worked with tests whose coefficients were much low- er, and the larger range of r's does not represent any greater varia- tion in z values at this lower level.
In Tables 3 and 4, the values obtained from deliberately equated half-tests differ slightly, but only slightly, from those for random splits. Where a is .715 for the morale scale, the mean of parallel splits is .748--a difference of no practical importance. One parallel split reaches .780, but this split could not have been defended a priori as more logical than the other planned splits. In Table 3, we find that neither Type I nor Type II splits averaged more than .01 higher than a . Here, then, is evidence that the sort of judgment a tester might make on typical items, knowing their content and difficulty, does not, contrary to the earlier opinion of Kelley and Cronbach, permit him to make more comparable half-tests than would be obtained by random splitting. The data from Cronbach's earlier study agree with this. This conclusion seems to apply to tests of any length (the morale scale has
312 PSYCttOMETRIKA
only ten items). Where items fall into obviously diverse subgroups in ei ther content or difficulty, as, say, in the California Test of Mental Maturi ty, the tester 's judgment could provide a bet ter- than-random split. I t is dubious whether he could improve on a random division wi th in subtests.
It should be noted tha t in this empirical s tudy no a t tempt was made to divide items on the basis of r , , as Gulliksen (18, p. 207-210) has recently suggested. Provided this is done on a large sample of cases other than those used to estimate r , , Gulliksen's plan might indeed give parallel-split coefficients which are consistently at least a few points higher than a.
The failure of the data to support our expectation led to a fu r the r s tudy of the problem. We discovered tha t even tests which seem to be heterogeneous are often highly sa tura ted with the first factor among the items. This forces us not only to extend the interpretat ion of a , but also to reexamine certain theories of test design.
Factorial composition of the test variance. To make fully clear the relations involved, our analytic procedure will be spelled out in detail. We postulate tha t the variance of any item can be divided among k + 1 orthogonal factors (k common with other items and one unique). Of these, we shall refer to the first, f l , as the general factor, even though it is possible tha t some items would have a zero load- ing on this factor.* Then if f.-~ is the loading of common factor z on item i ,
1.00 = N ' (f21, + f"2~ + P,~ + . . . + f ' v , ) . (27)
C~j : N' ~ ~,. (f~i flj + f,~ f,j +-" + fk~ fkj). (28)
C, - - Y.~,C,j : N' ~.. ~. ~, ~j f~i f , + " " + N ' Y. Y~ ,n (rj f . , fkj ;
( i = l , 2 , . . . n - - 1 ; i = i + 1 , . . . , n ) . (29)
V, ---- N" Y. o~, ( f ' , + . . . f '~, + f'~,, ) + ~ " Y. ~.. ,,, ~j L , f~j
+ . . . + 2N 2 F. ~ .~ uj f ~ f~ j . ( 3 0 ) 4 i
I f n~ items contain non-zero loadings on factor 1, and n~ items contain factor 2, etc., then Vt consists of
*This factor may be a so-called primary or reference factor like Verbal, but it is more likely to be a composite of several such elements which contribute to every item.

LEE J . CRONBACH 313
~h ~ terms of the form N ~ w j f l d , , plus
z~ ~ terms of the form N'~jf2~f2j, plus (31)
ns ' terms of the form N'~jfsJs~, plus and so on to
~,~ terms of the form N ~ j f~dkj, plus
n terms of the form N ~ .~; ' J U i •
We rarely know the values of the factor loadings for an actual test, but we can substitute values representing different kinds of test s t ructure in (30) and observe the proportionate influence of each factor in the total test.
F i r s t we shall examine a test made up of a general factor and five group factors, in effect a test which might be a r ranged into five cor- related subtests, k ~ 6 . Let ~ ~ n , so fl is t ruly general, and let z~ -- na ~- n, ~ n~ - - ne ---- 1/5 n . To keep the illustration simple, we shall assume tha t all items have equal variances and tha t any factor has the same loading (f,) in all i tems where it appears. Then
1 n2 ~2 ,'~2 ~ V , = n ~ A ' + /,~ + ~ / , ~ + . . . + ~ / , ~ + E fu:. (39.) NJa~ ' 25 25 25
I t follows tha t in this part icular example, there are n ' general factor terms, n~/5 group factor terms, and only n unique fac tor terms. There are, in all, 6n~/5 + ~ terms in the variance. Let p** be the proportion of tes t variance due to each factor. Then if we assume tha t all the terms making up the variance are of the same approximate m~gni- tude,
5n' 5n -- = ~ . (33)
P~' 6n'+5~z 6 ~ + 5
5 Lira f ' . - - --.83. (34)
f"' ----"" --f;' 6~' + 5n" (35)
L i m f ; , - - .03. (36)
5 ~Pv~' 6n + 5" (37)
L~ E I' 5 , ---- __ O. (38)
314 PSYCHOMETRIKA
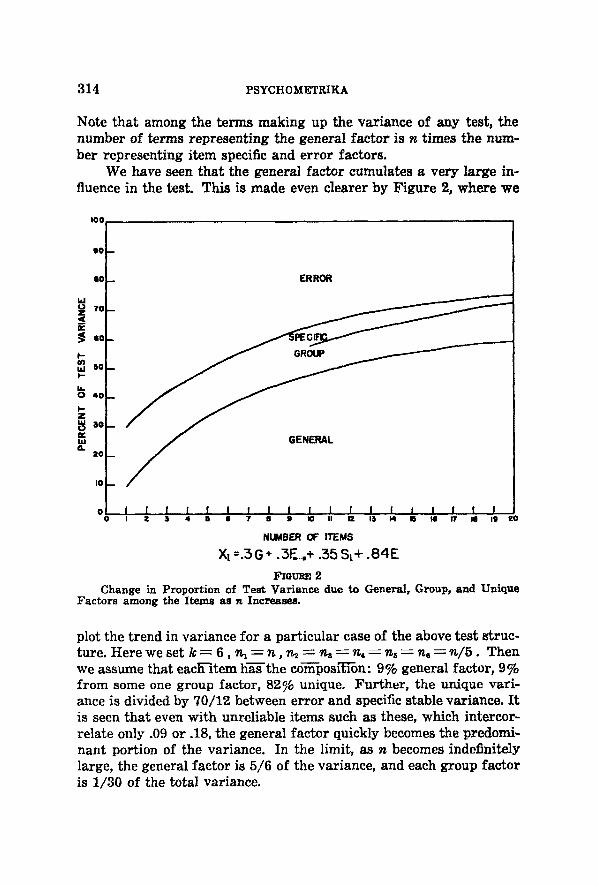
Note that among the te rms making up the variance of any test, the number of terms represent ing the general fac tor is n t imes the num- ber represent ing item specific and er ror factors.
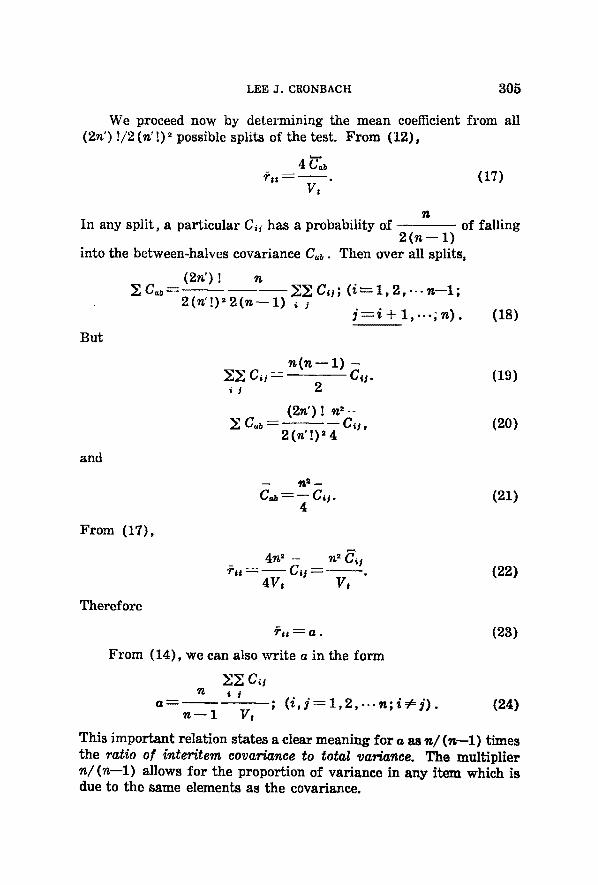
We have seen tha t the general factor cumulates a very large in- fluence in the test. This is made even clearer by Figure 2, where we
I 0 0
4 0
| 0
tlJ
X 4o
4o
a. 2 o
io
- ERROR
E
o I I .... I .................... I I I I I I I I I I I i I I I I o ~ ~ 4 4 4 s ? 4 s ~ ~ m ~4 M • ~ ~ m ts zo
NUMBER OF I'IIEMS
Xt : . 3 G + .3F....,+ .35 $~+ .84E Fm~ms 2
Change in Proportion of Test Variance due to General, Group, and Unique Factors among the Items as n Increases,
plot the trend in variance for a par t icular case of the above tes t struc- ture. Here we set k - 6 , n ~ - - n , n 2 = n a - - n , = n ~ = n 6 - - n / 5 . Then we assume that each-item h-~Ethe composl%Ton: 9% general factor, 9% f rom some one group factor, 827~ unique. Fur ther , the unique vari- ance is divided by 70/12 between er ror and specific stable variance. I t is seen tha t even wi th unreliable i tems such as these, which intercor- relate only .09 or .18, the general fac tor quickly becomes the predomi- nant portion of the variance. In the limit, as n becomes indefinitely large, the general factor is 5,/6 of the variance, and each group fac tor is 1/30 of the total variance.
LEE J . CRONBACH 315
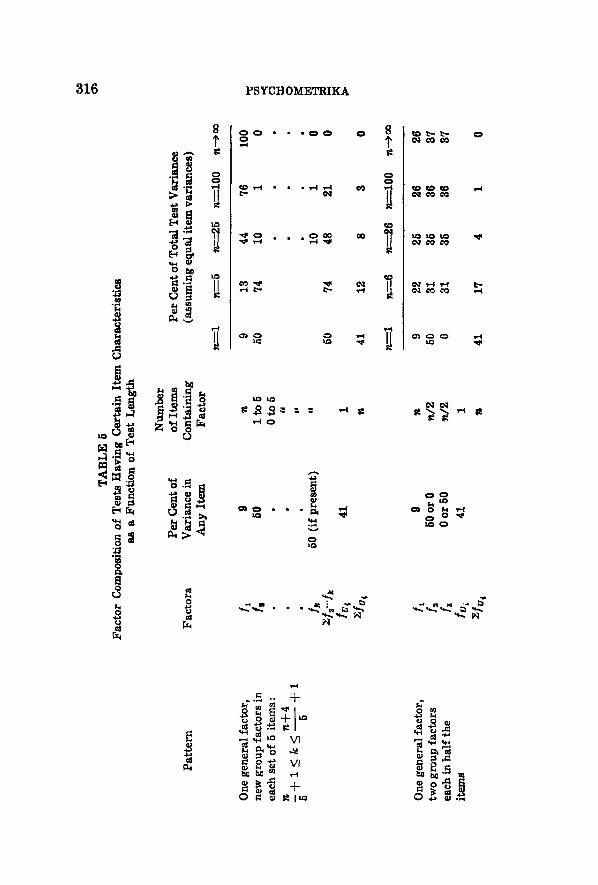
This relation has such important consequences that we. work out two more illustrative substitutions in Table 5. We first consider the test which is very heterogeneous in one sense, in that each group of five items introduces a different group factor. No factor save factor 1 is found in more than 5 items. Here great weight in each item is given to the group factor, yet even so, the general factor quickly cumulates in the covariance terms and outweighs the group factors.
The other illustration involves a case where the general factor is much less important in the items than two group factors, each pres- ent in half the items. In this type of test, the general factor takes on some weight through cumulation, but the group factors do not fade into insignificance as before. We can generalize that when the pro- portion of items containing each common factor remains constant as a test is lengthened (factor loadings being constant also), the ratio of the variances contributed by any two common factors remains con- stant. That is, in such a test pattern each item accounts for a nearly constant fraction of the non-unique variance.
While our description has discussed number of terms, and has simplified by holding constant both item variances and factor load- ings, the same general trends hold if these conditions are not imposed. The mathematical notation required is intricate, and we have not attempted a formal derivation of these general principles:
I f the magnitude of item intercorrelations is the same, on the average, in successive groups of items as a test is lengthened,
(a) Specific factors and unreliability of responses on single items account for a rapidly decreasing proportion of the variance if the added items represent the same factors as the original items. Roughly, the contribution is inversely proportional to test length.
(b) The ratio in which the remaining variance is divided among the general factor and group factors
(i) is constant if these factors are represented in the added items to the same extent as in the original items ;*
(ii) increases, if the group factors present in the original items have less weight in the added items.
As a test is lengthened, the general factor accounts for a larger and larger proportion of the total variance. In the case where only a few group factors are present no matter how many items are added,
*This is the case discussed in the recent paper of Guilford and Michael (17). Our conclusion is identical to theirs.
TA
BL
E 5
F
acto
r C
ompo
siti
on o
f T
ests
Hav
ing
Cer
tain
Ite
m C
har
acte
rist
ics
as a
Fu
nct
ion
of
Tes
t L
eng
th
Pat
tern
F
acto
rs
Number
Per Cen
t of
of Ite
ms
Vari
ance
in
Containing
Any I
tem
Fact
or
Per
Cen
t of
To
tal
Tes
t V
aria
nce
(a
ssu
min
g e
qu
al i
tem
var
ian
ces)
~-~-
1 7~-----5 ~-~--2
5 n-
~--
100
n--
~
One
gen
eral
fac
tor,
n
ew g
rou
p f
acto
rs i
n
each
set
of
5 it
ems:
n
n-~
4 ~
+ z
_< k
_<-
--g-
+ z
fl /, /k
~/,..
./~
.fu~
>:.fu
~
9
n
50
lto
5
• O
to5
Ji
50 (
if p
rese
nt)
41
1 n
9 13
44
76
10
0 50
74
10
1
0
• •
O
10
1 0
50
74
48
21
0
41
12
8 $
0
n.~
- I
~-----6
~---
-~ 6
.---
-10
0
..-~
oo
One
gen
eral
fac
tor,
fl
9
n tw
o g
rou
p f
acto
rs
f2
50 o
r 0
n/2
ea
ch i
n h
alf
the
fa
0 o
r 50
n
/2
item
s fo
, 41
1
~'f
o i
n
9 22
25
26
26
50
31
35
36
37
0
31
3fi
36
87
41
17
4 1
0

LEE J . CRONBACtl 317
these also account for an increasing and perhaps substantial portion of the variance. But when each factor other than the first is present in only a few items, the general factor accounts for the lion's share of the variance as the test reaches normal length. We shall return to the implications of this for test design and for homogeneity theory.
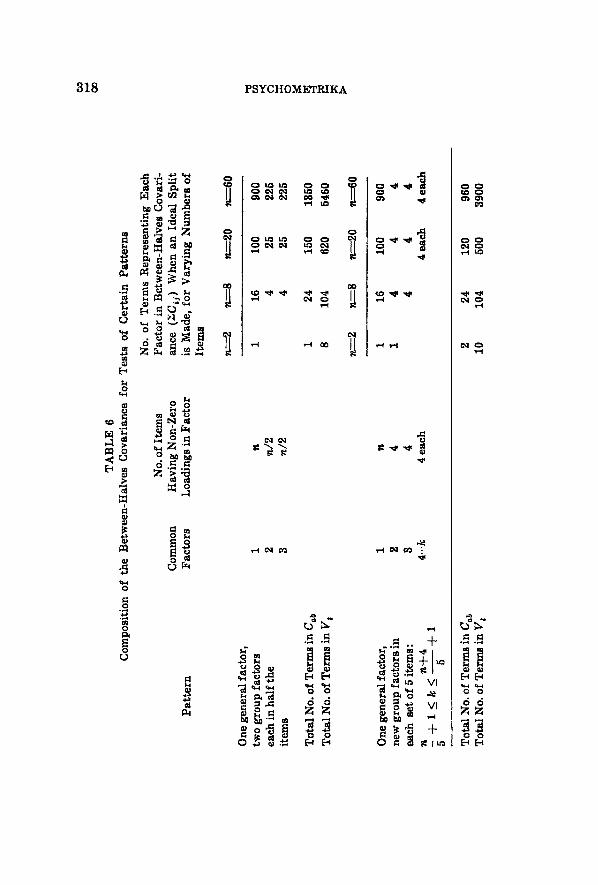
Next, however, we apply this to coefficients of equivalence. We may study the composition of half-tests just as we have studied the total test. And we may also examine the composition of C,~, the be- tween-halves covariance. In Table 6, we consider first the test where there is a general factor and two group factors. If the test is divided into halves such that every item is factorialty identical to its opposite number, save for the unique factor in each, the covariance C~b none- theless depends primarily upon the general-factor terms. Note, for example, the twenty-item test. Two-thirds of the covariance terms are the result of item similarity in the general factor. Suppose that these general factor terms are about equal in size. Then, should the test be split differently, the covariance would be reduced to the extent that more than half the items loaded with (say) factor 2 fall in the same half, but even the most drastic possible departure from the par- allel split would reduce the covariance by only one-third of its terms. In the event that the group-factor loadings in the items are larger than the general-factor loadings, the size of the covariance is reduced by more than one-third. I t is in this case that the parallel split has special advantage: where a few group factors are present and have loadings in the items larger than the general factor does.
The nature of the split has even less importance for the pattern where each factor is found in but a few items. Suppose, for exam- ple, that we are dealing with the 60-item test containing 15 factors in four items each. Then suppose that it is so very "badly" split that items containing 5 of the factors were assigned only to one of the half- tests, and items containing the second 5 factors were assigned to the other half-test. This would knock out 40 terms from the between- halves covariance, but such a shift would reduce the covariance only by 40/960 of its terms. Only in the exceptional conditions where gen- eral factor loadings are miniscule or where they vary substantially would different splits of such a test produce marked differences in the covariance.
It follows from this analysis that marked variation in the coef- ficients obtained when a test is split in several ways can result only when
Pat
tern
TA
BL
E 6
C
om
po
siti
on
of
the
Bet
wee
n-H
alv
es C
ov
aria
nce
fo
r T
ests
of
Cer
tain
P
atte
rns
No.
of
Ter
ms
Rep
rese
nti
ng
E
ach
N
o. o
f It
ems
Fac
tor
in B
etw
een
-Hal
ves
Co
var
i-
Com
mon
H
avin
g N
on
-Zer
o
ance
(:
C~
j)
Wh
en a
n
Idea
l S
pli
t F
acto
rs
Lo
adin
gs
in F
acto
r is
Mad
e, f
or
Var
yin
g N
um
ber
s o
f It
ems
OO
One
gen
eral
fac
tor,
tw
o g
rou
p f
acto
rs
1 n
each
in
hal
f th
e 2
n/2
it
ems
3 n
/2
To
tal
No.
of
Ter
ms
in C
~b
To
tal
No.
of
Ter
ms
in V
t
r.--~
-8
P.-
~2
0
~6
0
1 16
10
0 90
0 4
25
225
4 25
22
5
1 24
15
0 13
50
8 10
4 62
0 54
60
~-~-
2 ~
.:8
~-
~-20
n-
~--
60
0
One
gen
eral
fac
tor,
1
n n
ew g
rou
p f
acto
rs i
n
2 4
each
se
t o
f 5
item
s:
3 4
n n
~-4
4.
..k
4 ea
ch
1 16
10
0 90
0 1
4 4
4 4
4 4
4 ea
ch
4 ea
ch
To
tal
No.
of
Ter
ms
in C
ab
To
tal
No.
of
Ter
ms
in V
t 2
24
120
960
10
104
500
3900

LEE J. CRONBACH 319
(a) a few group factors have substantial loadings in a large fraction of the items or
(b) when first-factor loadings in the items tend to be very small or where they vary considerably. Even these conditions are likely to produce substantial variations only when the variance of a test is con- tributed to by only a few items.
In the experimental tests studied by Clark, by Cronbach, and in the present study, general-factor loadings were probably greater, on the whole, than group-factor loadings. Moreover, none of the tests seems to have been divisible into large blocks of items each represent- ing one group factor. (Such large "lumps" of group factor content are most often found in tests broken into subtests, viz., the Number Series, Analogies, and other portions of the ACE Psychological ex- amination.)
This establishes on theoretical grounds the fact that for certain common types of test, there is likely to be negligible variation among split-half coefficients. Therefore a , the mean coefficient, represents such tests as well as any parallel split.
This interpretation differs from the Wherry-Gaylord conclusion (38) that "the Kuder-Richardson formula tends to underestimate the true reliability by the ratio (n ~ K ) / ( n ~ 1) when the number of factors, K , is greater than one." They arrive at this by highly restric- tive assumptions: that all factors are present in an equal number of items, that no item contains more than one factor, that there is no general factor, and that all items measuring a factor have equal vari- ances and covariances. This type of test would never be intended to yield a psychologically interpretable score. For psychological tests where the intention is that all items include the same factor, our de- velopment shows that the quoted statement does not apply.
The problem of differential weighting has been studied repeated- ly, the clearest mathematical analyses being those of Richardson (30) and Burr (4). This problem is closely related to our own study of test composition. Making different splits of a test is essentially the same as weighting the component items differently. The conditions under which split-half coefficients differ considerably are identical to those where differential weighting of components alters a total score appre- ciably: few components, lack of general factor or variation in its load- ings, large concentrations of variance in group factors. The more for- mal mathematical studies of weighting lead to the same conclusions as our study of special cases of test construction.
4. How is a related ~o ~he homogeneity, internal consistency, o~
~J20 PSYCHOMETRI1CA
saturation of a test?* During the last ten years, var ious wr i te rs (12, 19, 27) directed at tention to a proper ty they re fe r to as homogeneity, scalability, internal consistency, or the like. The concept has not been sharply defined, save in the formulas used to evaluate it. The gen- eral notion is clear: In a homogeneous test, the i tems measure the same things.
I f a test has substantial internal consistency, i t is psychologically interpretable. Two tests, composed of different i tems of this type, will ordinari ly give essentially the same report . If, on the other hand, a test is composed of groups of items, each measur ing a different fac- to,', it is uncertain which factor to invoke to explain the meaning of a single score. For a test to be interpretable, however, it is not es- sential that all i tems be factorially similar. What is required is tha t a large proport ion of the tes t var iance be a t t r ibutable to the principal factor running through the tes t (37).
a est imates the proport ion of the tes t var iance due to all common factors among the items. That is, it repor ts how much the tes t score depends upon general and group, ra ther than i tem specific, factors. I f we assume that the mean variance in each item at t r ibutable to corn-
equals the mean in ter i tem covariance mon factors (~ ,,~" f,~')
21 (-, ~, f., f.,), ;E
1 2 2
n , ~ n ( n - - l ) ~ , n ( n - - l )
2 Y. ~. ~' f.~ - - - - C , , (40) , ~ n--1
and the total variance (item variance plus covarianee) due to com-
mon factors is 2 - - C,. Therefore, from (14), a is the proportion n--1
of test variance due to common factors. Our assumption does not hold true when the interitem correlation matrix has rank higher than one. Normally, therefore, a underestimates the common-factor variance, but not seriously unless the test contains distinct clusters.
The proportion of the test variance due to the first factor among the items is the essential determiner of the interpretability of the
*Several of the comments made in the following sections, particularly re- garding Loevinger's concepts, were developed during the 1949 APA meetings in a paper by Humphreys (21) and in a symposium on homogeneity and reliability. The thinking has been aided by subsequent discussions with Dr. Loevinger.

LEE J . C R O N B A C H 3 2 1
scores, a is an upper bound for this. For those test pat terns described in the last section, where the first factor accounts for the preponder- ance of the common-factor variance, a is a close estimate of first-fac- tor concentration.
a applied to batteries of tests or subtests. Instead of regarding a as an index of i tem consistency, we may apply it to questions of sub- test consistency. If each subtest is regarded as an "i tem" composing the test, formula (2) becomes
a - - - - 1 . ( 4 1 )
Here n is the number of subtests . I f this formula is applied to a tes t or ba t te ry composed of separate subtests, it yields useful inform-t ion about the interpretabi l i ty of the composite. Under the assumption that the variance due to common factors within each subtest is on the average equal to the mean covariance between subtests, a indi- cates what proportion of the variance of the composite is due to com- mon factors among the subtests. In many instruments the subtests are positively correlated and intended to measure a general factor. I f the matr ix of intercorrelations is approximately hierarchical, so that group factors among subtests are small in influence, a is a meas- ure of first-factor concentration in the composite.
Sometimes the variance of the test is not immediately known, but correlations between subtests are known. In this case one can compute covariances (Cab : ~, ~b r~u), or the variance of the com- posite (Vt is the sum of subtest variances and covariances), and ap- ply formula (41). But if subtest variances are not at hand, an in- ference can be made directly f rom correlations. I f all subtests a re assigned weights such that their variances are equal, i.e., they make equal contributions to the total,
( 2 ~..r,i ) (42)
a - - - - ; ( i = l , 2 , . . . n - - l ; ] = i + l , . . . n ) .
i 1
Here i and ] are subtests, of which there are n . This formula tells wha t pa r t of the total variance is due to the first factor -mong t h e
subtests, when the weighted subtest variances are equal. A few applications will suggest the usefulness of this analysis.
The California Test of Mental Maturi ty, Pr imary , has two pa r t scores, Language and Non-Language. Fo r a group of 725, according to the
322 PSYCHOMETRIKA
tes t authors, these scores correlate .668. Then, by (42), a , the com- mon-factor concentration, is .80. Turning to the P r imary Mental Abilities Tests, we have a set of moderate positive correlations re- ported when these were given to a group of eighth-graders (35). The question may be asked: How much would a composite score on these tests reflect common elements ra ther than a hodgepodge of elements each specific to one subtest ? The intercorrelat ions suggest tha t there is one general fac tor ~mong the tests. Computing a on the assump- tion of equal subtes t variances, we get .77. The total score is loaded to this extent with a general intellective factor . Our third illustra- tion relates to four Air Force scores related to carefulness. Each score is the count of number w r o n g on a plott ing test. The four scores have ra ther small intercorrelat ions (15, p. 687), and each score has such l o w reliability tha t i ts use alone as a measure of carefulness is not advisable. The question therefore arises whe ther the tes ts a re enough intereorrelated tha t the general fac tor would cumulate in a preponderant way in thei r total. The sum of the six intercorrela- t ions is 1.76. Therefore a is .62. I.e., 62% of the variance in the equally weighted composite is due to the common fac tor among the tests.
F rom this approach comes a suggestion for obtaining a superior coefficient of equivalence for the " lumpy" test. I t was shown tha t a tes t containing distinct clusters of i tems might have a parallel-split coefficient appreciably higher than a . I f so, we should divide the tes t into subtests, each containing what appears to be a homogeneous group of items. ~ is computed for each subtest separately by (2) . Then ~ a gives the covariance of each cluster with the opposite clus- ter in a parallel form, and the eovariance between subtests is an esti- mate of the covariance of similar pairs '%etween forms." Hence
t j r , t = ; ( i = l , 2 , . . . n ; j = l , 2 , . . . n ) , (43)
x 2 V t
where a~ is entered for ~ ' , , i and 3" being subtests. To the extent tha t
, , is h igher than the mean correlat ion be tween subtests, the parallel- forms coefficient will be higher than a, computed f rom (2).
The relat ionships developed are summarized in F igure 3. a fal ls somewhere between the proport ion of var iance due to the first fac tor and the proport ion due to all common factors . The blocks represent- ing "o ther common fac tors" and " i tem specifics" are small, fo r tes ts not containing clusters of i tems wi th distinctive content.

LEE J . CRONBACH 323
Mean s p l i t - h a l f coe f f i c ien t about here-
P r i n c i p a l common f a c t o r
, ~ about he re '
0
Parallel-£orms coef f ic ient
~ r e a t e a t split-half c o e f £ i - c i e n t
i Coeffic lent of precision
. C h = e 1 0 ~ E C! e r r o r
r l l based on c t , r l t h i n c l u s t e r s
Pe r c e n t 100
FIOUeE 3 Cer ta in Coefficients re la ted to the Composit ion of the Tes t Var iance.
An index unrelated to test length. Conceptually, it seems as if the "homogeneity" or "internal consistency" of a test should be in- dependent of its length. A gallon of homogenized milk is no more homogeneous than a quart, a increases as the test is lengthened, and so to some extent do the Loevinger-Ferguson homogeneity indices. We propose to obtain an indication of interitem consistency by apply- ing the Spearman-Brown formula to a, , thereby estimating the mean correlation between items. The formula is entered with the recipro- cal of the number of items as the multiple of test length. The formula can be simplified to
{I ~,~¢..t, -- (44)
n + (l--n)a
or (cf. 24, p. 213 and 30, p. 387),
1 V, -- ~V, #,j,..t, -- - - (45)
-- n - - 1 :~V4
P,#(.t~ (r bar) is the correlation required, among items having equal variances and equal covariances, to obtain a test of length n having
common-factor concentration a . r , jc~t, or its special case ~ for di- chotomously-scored items is recommended as an overall index of in- ternal consistency, if one is needed. It is independent of test length. It is not, in my opinion, important for a test to have a high P if a is high. Woodbury's "standard length" (39) is an index of internal con- sistency which can be derived from @,j and has the same advantages
324 FSYCHOMETRIKA
and limitations, n,, the standard length, is the number of items which yields an a of .50. Then
i -- ~ n~ - - - - . ( 4 6 )
I f # is high, a is high. But a may be high even when i ~ m a have small intercorrelations. I f ~ is low, the tes t may be a smooth mixture of items all having low intercorrelations. In this case, each i tem would have some loading with the general fac tor and if the tes t is long a could be high. Such items are i l lustrated by very difficult psy- chophysical discriminations such as a series of near-threshold speech signals to be interpreted; with enough of these items we have a high- ly sa t is factory measur ing instrument. In fact, save for random er- ror of performance, it may be unidimensional. A low value of P may instead indicate a lumpy tes t composed of discrete and homogeneous subtests. Guttman (34, p. 176n.) describes a questionnaire of this type. The concept of homogeneity has no particular meaning for a "lumpy" test. It is logically meaningless to inquire whether a set of ten measures of physical size plus ten intercorrelated vocabulary items is more homogeneous than twenty slightly correlated biographi- cal questions. A high ~ is sufficient but not necessary evidence that the test lacks important group factors. When ~ is low, only a study of correlations among items or trial clusters of items shows whether the test can be broken into more homogeneous subtests.
Comparison with the index of ~eproducibility. Guttman's coeffi- cient of reproducibil i ty has appeared to some reviewers (Loevinger, 28; Fest inger, 13) as an ad hoc index with no mathematical rationale. I t may therefore be worthwhi le to note tha t this coefficient can be approximated by a mathematical form which makes clear wha t i t measures. The correlation of any two-choice i tem wi th a total score on a tes t may be expressed as a phi coefficient, and this is common in conventional i tem analysis. Gut tman dichotomizes the test scores a t a cut t ing point selected by inspection of the data. We will get s imilar results i f we dichotomize scores a t tha t point which cuts off the same proport ion of cases as pass the i tem under study. (Our ~ t will be less in some cases than it would be if determined by Guttman's inspec- tion procedure.) Simple subst i tut ion in Gut tman 's definition (34, p. 1 1 7 ) leads to
R - - 1 - - 2 ~ ' ( 1 - - ~ , ) , ( 4 7 )
where the approximation is introduced by the difference in ways of
I00 8C
6C
(~J 4c
2C
"~rt
,t .
..3o
0 I
I I
I 0
20
40
80
80
~ m
I I
I I
I00
0 20
40
60
80
80
0 0
FIG
UE
~ 4
Rel
atio
n o
f ¢
ij t
o P
l an
d p
j fo
r S
ever
al L
evel
s of
Co
rrel
atio
n.
~. 8o
//~
r~, t
=.3o
-'
"
I I
! 20
40
60
81
0
o
~0o

3 2 6 PSYCHOMETRIKA
dichotomizing. The actual R obtained by Guttman will be larger than that from (47). For multiple-alternative items, a similar but more complex formula involving the phi coefficient of the alternative with the test is required to approximate Guttman's result. R is independ- ent of test length; if a Guttman scale is divided into equivalent por- tions, the two halves will have the same R as the original test. In this respect, R is most comparable to our ~. Both ~, and ~ are low, so long as items are unreliable or contain substantial specific factors.
5. Is the usefulness of a limited by properties of the ~hi coef- ficient between items having unequal difficulties ? The criticism has been made, most vehemently by Loevinger (27), that a is a poor in- dex because, being based on product-moment correlations, it cannot attain unity unless all items have distributions of the same shape. For the pass/fail item, this requires that all p~ be equal. The infer- ence is drawn that since the coefficient cannot reach unity for such items, a and @ do not properly represent homogeneity.
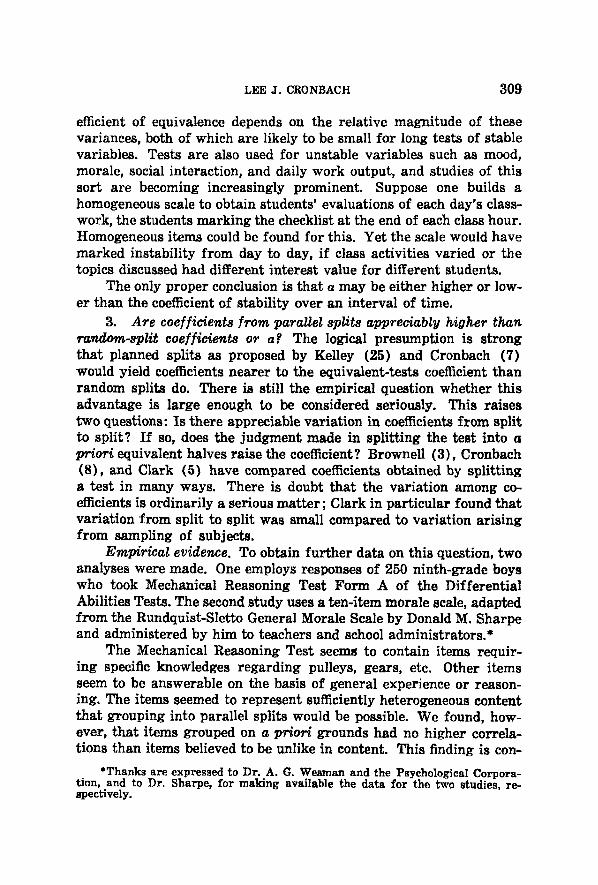
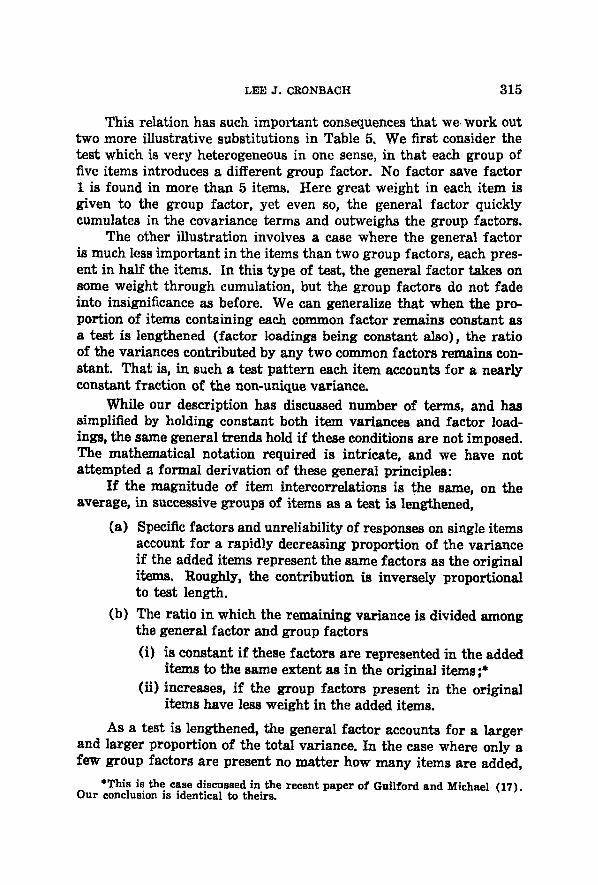
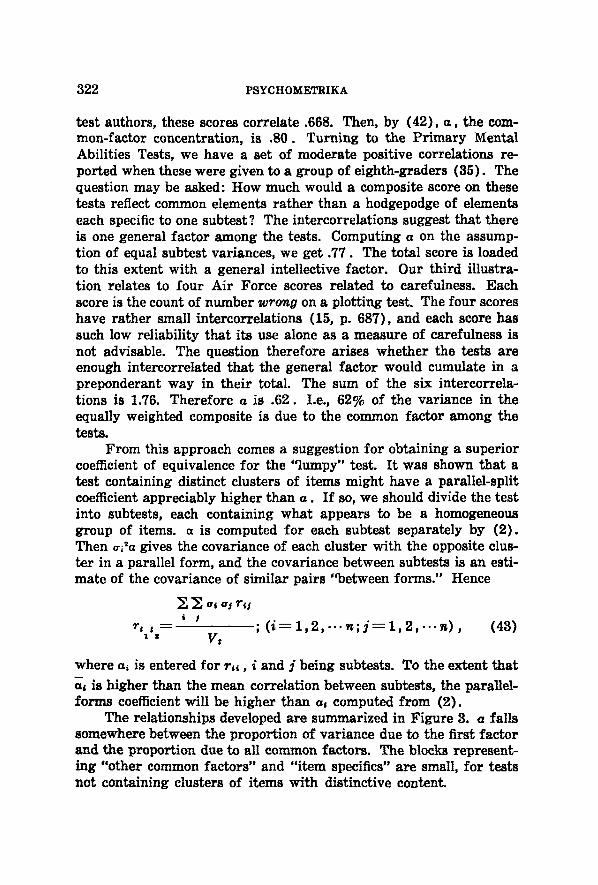
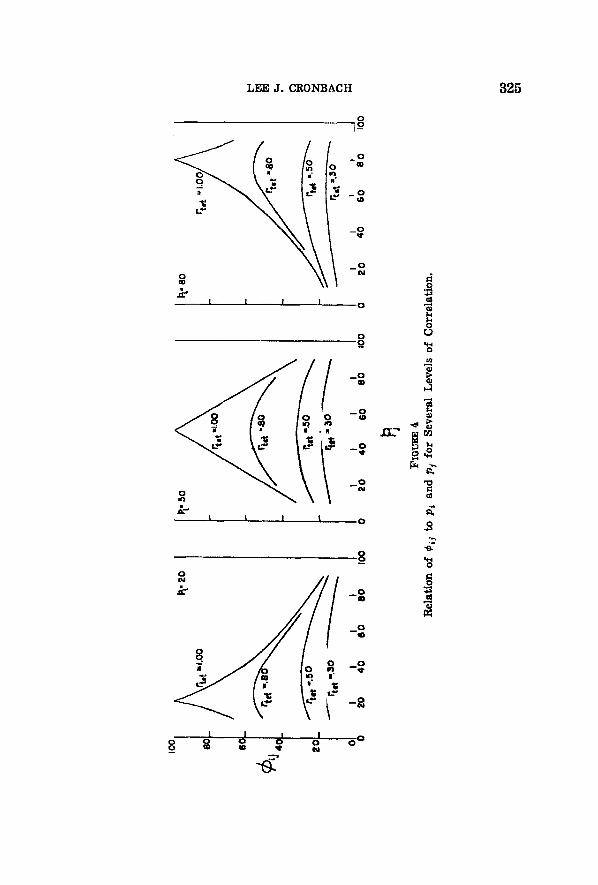
There are two ways of examining this criticism. The simpler is empirical. The alleged limitation upon the product-moment coefficient has no practical effect upon the coefficient, for items of the sort cus- tomarily employed in psychological tests. To demonstrate this, we consider the change in ~ with changes in item difficulty. To hold con- stant the relation between the "underlying traits," we fix the tetra- choric correlation. When the tetrachoric coefficient is .30, p~ ~ .50 and pj ranges from .10 to .90, @~j ranges only from .14 to .19. Figure 4 shows the relation of ~,j to ~, and pj for three levels of correlation: rt.t -- .30, rt.t ~ .50, and r~o~ -- .80. The correlation among items in psychometric tests is ordinarily below .30. For example, even for a
five-grade range of talent, the ~'~j for the California Test of Mental Maturity subtests range only from .13 to .25. That is, for tests hav- ing the degree of item intercorrelation found in present practice, is very nearly constant over a wide range of item difficulties.
TABLE 7 Variation in Certain Indices of Interitem Consistency with Changes in Item
Difficulty (Tetrachorie Correlation Held Constant)
p~ .50 .50 .50 .50 .50 .50 .50 .50 .50 pj -->.00 .10 .20 .40 .50 .60 .80 .90 --~1.00
rijte t .30 .30 .30 .30 .30 .30 .80 .30 .30
~j "-'~.00 .14 .17 .19 .19 .19 .17 .14 -'-.00
Hij ---~1.00 .42 .34 .23 .19 .23 .~4 .42 -->1.00

PSYCHOMETRIKA 327
Examining Loevinger's proposed coefficient of homogeneity (29),
H, j = ~ . / ~ , j ( ~ . ) , (48)
we find that it is markedly affected by variations in item difficulty. One example is worked out in Table 7. As many investigators includ- ing Loevinger have noted, Guttman's R is drastically affected by item difficulty. For any single item, R must be greater than p~ or qj, which- ever is greater. Evidently the indices of homogeneity which might re-
place ~ suffer more from the effects of differences in difficulty than does the phi coefficient.
Further evidence on the alleged limitation of a is obtained by preparing four hypothetical 45-item tests. In each case, all r~jct.t) are fixed at .30. Phi coefficients reflect both heterogeneity in content and heterogeneity in difficulty. To assess the effect of the latter hetero-
geneity upon ~ and a, we compared one test of uniform item difficulty, where all heterogeneity is in content, with another where '"netero= geneity due to difficulty" was allowed to enter. As Table 8 indicates,
even when extreme ranges of item difficulty are allowed, neither nor a is affected in any practically important way. For tests where item difficulties are higher, or correlations are lower, the effect would be even more negligible.
TABLE
Comparison of ~ and u for Hypothetical
8
45-Item Tests With and Without "Heterogeneity Due to I tem Difficulty"
Distribution of Range of Test Difficulties Pt p~ ~ Diff. a Diff.
A Normal .20 to .80 .50 .181 .909 .011 .005 A' Peaked .50 .50 .192 .914
B Normal .10to.90 .50 .176 .016 .906 .008 B' Peaked .50 .50 .192 .914
C Normal .50 to .90 .70 .170 ,902 .011 .007 C' Peaked .70 .70 .181 .909
D Rectangular .10 to .90 .50 .153 .892 .039 .02°~ D' Peaked .50 .50 .192 .914
Still another small study leading to the same essential conclusion was made by examining a "perfect scale," where all p~j equal ~ j ( . . . ) . Items were placed at five difficulty levels, the p, being .50, .58, .71, .80, and .89. Then the correlations (phis) of items range from 1.00 (at same level) to .85 (highest between levels) to .36. In a test of

328 PSYCHOMETRIKA
only five items, a reaches .86. This is the maximum a could have, for this set of 5 items and specified p~. As the number of items increases, a rises toward 1.00. Thus, for 10 items, two at each level a ~ = .951 ; for 20 items, .977. I t follows that even if i tems are much more ho- mogeneous in content than present tests and much f reer f rom error, the cumulative propert ies of covariance terms make the fai lure of all #'s to reach unity of next-to-no importance, a~= would be lower if difficulties range over the full scale, but the same principle holds, a is a good measure of common-factor concentration, for tests of rea- sonable length, in spite of the fact tha t it falls short of 1.00 if i tems vary in difficulty.
In the case of the perfect scale, of course, ~ does fall well short of unity and for such tests it does not reflect the homogeneity in con-
tent. F rom the five-item case jus t considered, ~ is .54. The second way to analyze this criticism is to examine the nature
of redundancy (using a te rm from Shannon's information theory, 32). I f two items repeat the same information, they are total ly re- dundant. Thus, if one item divides people 50/50, and the second item does also, the two items always placing exactly the same people to- gether, the second item gives no new informat ion about individual differences. (Cf. Tucker, 36). Suppose, though, tha t the second item is passed by 60 per cent of the subjec__ts. Even if r~jctet~ - - 1.00, this second item conveys new information because it discriminates among the fifty people who failed the first item. A five-item test where all i tems have perfect te trachoric intercorrelations, and the p~ are .40, .45, .50, .55, .60, is perfect ly homogeneous (a la Guttman, Loevinger, et al) . So is a ten-item test composed of these items plus five others whose p's are .30, .35, .65, .70, .75. The two tests are not equiva- lent in measur ing power, however ; the second makes a much grea ter number of discriminations. Because there is less redundancy, the
longer test has a lower ~ . F rom the viewpoint of information theory, we should be equally
concerned with heterogenei ty in content and heterogenei ty in difficulty. We get one bit of information when we place the person as above the mean in (say) pitch discrimination. Now with another item or set of items, we might place him relative to the mean in visual acuity. The two tests together place him in one of four categories. I f our sec- ond test had been a fu r ther measure of pitch, placing the subject above or below the 75th percentile, then the two tests would have placed him in one of four categories. E i ther set of tests gives the same amount of information. Which informat ion we most wan t de-

LEE J. CRONBACH 329
pends on practical considerations. The phi coefficient reports whether a second item gives new in-
format ion that the first does not. Then a tetrachoric v must be com- puted to determine if the new information relates to a new content dimension or to a finer discrimination on the same content dimension. I f the phi coefficient between t rue scores is 1.00, redundancy is com- plete and there is no new information. Redundancy is desirable when accuracy of a single item is low. To test whether men can hear a 10- cycle difference, the best way is to use a large number of i tems of jus t that difficulty. Such items usually also discriminate to some de- gree at other points on the scale, but cannot give information about ability at the 5-cycle level if a single i tem is extremely reliable. With very accurate items a pitch test which is not homogeneous will be bet ter for differentiation all along the scale. The "fac tors" found by Ferguson (11) due to the higher correlation (redundancy) of i tems with equal difficulty need not be regarded as ar t i fac ts (38).* These "difficulty factors" are factors on which the tes t gives information and on which the tester may well want information. They are not "content factors," but they must be considered in tes t analysis. Fo r example, if one regards pitch tests in this light, it is seen that a tes t containing 5-cycle items, 10-cycle items, and 15-cycle items will be slightly influenced by undesired factors, when the criterion requires discrimination only at the 15-cycle level. (Problems of this type oc- cur in validating tests for selecting mil i tary personnel using detec- tion appara tus ) . One would maximize the loading in the test of the group factor among 15-cycle items, to maximize validity. This factor is of course a mathematical factor, and not a proper ty of the audi tory machinery. While the mathematics is not clear, it seems very likely tha t the group factors found among phi coefficients are interchange- able wi th Guttman's "components of scale analysis" to which he gives serious psychological interpretat ion.
F rom this point of view, the phi coefficient which tells when items do and do not duplicate each other is a bet ter index lust because it does not reach unity for items of unequal difficulty. Phi and ~'tet are both useful in test analysis. Brogden (1, pp. 199, 201) makes a simi- lar point, although approaching the problem from another tack.
*It is not ~zecesea~.y, as Ferguson seems to think, for difficulty factors to emerge if product-moment correlations are used with multi-category variates. On a Fr/o~/grounds, difficulty factors will appear only if the shapes of the dis- tributions of the variates are different. In Ferguson's data it appears likely that the hardest and easiest tests were skewed in opposite directions.

330 PSYCHOMETRIKA
Implications for Tes~ Design In view of the relations detailed above, we find it unnecessary to
create homogeneous scales such as Guttman, Loevinger, and others have urged.
It is true tha t a test where all items represent the same content factor with no error of measurement is maximally interpretable. Everyone a t ta ining the same score would mark items in the same way. Yet the question we really wish to ask is whether the individual dif- ferences in test score are at tr ibutable to the first factor within the test. I f a large proportion of the score variance relates to this factor, the residue due to specific characteristics of the items little handicaps interpretabili ty. I t has been shown tha t a high first-factor sa turat ion indicated by a high a can be at tained by cumulat ing many items which have low correlations. The s tandard proposed by Ferguson, Loeving- er, and Guttman is unreasonably severe, since it would rule out tests which do have high first-factor concentrations.
These wri ters seem to wish to infer the person's score on each item from his total score. This appears unimportant , but even if i t were important, the interest would at tach to predicting his ~rue stand- ing on the item, not his fallible obtained score. For the unreliable items used in psychological and educational tests, the aim of Gut tman et ah will not be approached in practice. Perhaps sociological data have such greater reliability tha t prediction of obtained scores is tan- tamount to predicting t rue scores.
Increasing interpretabi l i ty by lengthening a test is not without its disadvantages. Using more and more t ime to get a t the same in- formation employs the principle of redundancy (32). When a mes- sage is repeated over and over, it is easier to infer the t rue message even when there is substantial interference (item unreliabil i ty). But the more you repeat messages already t ransmit ted , the less t ime is allowed for conveying other information. A set of redundant items can carry much less informat ion than a set of independent items. In other words, when we lengthen certain tests or subtests to make their scores more interpretable, we sacrifice the possibility of obtaining separate measures of additional factors in the same time.
From the viewpoint of both interpretabi l i ty and efficient predic- tion of criteria, the smallest element on which a score is obtained should be a set of items having a substantial a and not capable of division into discrete item clusters which themselves have high a . Such separately interpretable tests can sometimes be combined into an interpretable composite, as in the case of the PMA tests. Although

LEE J. CRONBACH 331
i t is be l ieved t h a t the t e s t de s igne r should seek i n t e r i t e m consis tency, a n d j u d g e the e f fec t iveness of h is e f for t s b y the coefficient a , t he p u r e scale should no t be v i ewed as a n ideal. I t should be r e m e m b e r e d t h a t T u c k e r (36) and B r o g d e n (1) h a v e d e m o n s t r a t e d t h a t inc reases in i n t e rna l cons i s tency m a y lead to dec reases in the p r o d u c t - m o m e n t va l i d i t y coefficient w h e n the s h a p e of the t e s t - sco re d i s t r i bu t i on d i f - f e r s f r o m t h a t o f t he c r i t e r i o n d i s t r ibu t ion .
1. F o r m u l a s f o r sp l i t -ha l f coefficients of equiva lence a r e com- pa red , a n d those of Rulon a n d G u t t m a n a r e a d v o c a t e d f o r p r ac t i ca l use r a t h e r t h a n the S p e a r m a n - B r o w n f o r m u l a .
2. a , the g e n e r a l f o r m u l a of wh ich K u d e r - R i c h a r d s o n f o r m u l a 20 is a special case, is f o u n d to h a v e the fo l lowing i m p o r t a n t m e a n - ings :
(a ) a is t he m e a n of all poss ib le sp l i t -ha l f coefficients. (b) a is the value expected when two ral,tdom samples of
items from a pool like those in the given test are correlated. (c) a is a lower bound for the coefficient of precision (the
instantaneous accuracy of this test with these particular items), a is also a lower bound for coefficients of equivalence obtained by simul- taneous a d m i n i s t r a t i o n o f t w o t e s t s h a v i n g m a t c h e d i tems. B u t f o r r e a s o n a b l y long t e s t s no t d ivis ible in to a f e w f a c t o r i a l l y - d i s t i n c t sub- tes t s , a is n e a r l y equal to "pa r a l l e l - s p l i t " and " p a r a l l e l - f o r m s " coeffi- c ien ts of equivalence.*
(d) a e s t ima te s , and is a l ower bound to, t he p r o p o r t i o n of t e s t v a r i a n c e a t t r i b u t a b l e to c o m m o n f a c t o r s a m o n g the i tems . T h a t is, i t is a n index o f c o m m o n - f a c t o r concen t r a t i on . T h i s i ndex s e rve s p u r p o s e s c la imed f o r indices of homogene i t y , a m a y be app l ied b y a modif ied t echn ique to d e t e r m i n e the c o m m o n - f a c t o r c o n c e n t r a t i o n a m o n g a b a t t e r y of sub tes t s .
*w. G. Madow suggests that the amount of disagreement between two ran- dom or two planned samples of items from a larger population of items could be anticipated from sampling theory. The person's score on a test is a sample mean, intended to estimate the population mean or "true score" over all items. The vari- ance of such a mean from one sample to another decreases rapidly as the sample is enlarged by lengthening the test, whether samples are drawn at random or are drawn after stratifying the universe as to difIlculty and content. The conditions under which the radom splits correlate about as highly as parallel splits are those in which stratified sampling has comparatively little advantage. Madows comment has implications also for the preparation of comparable forms of tests and for developing objective methods of selecting a sample of items to represent a larger set of items so that the variance of the difference between the score based on th e sample and the score based on the universe of items is as small as possible.

332 PSYCHOMETRIKA
(e) a is an upper bound to the concentration in the test of the first factor among the items. For reasonably long tests not divis- ible into a few factorially-distinct subtests, a is very little grea te r than the exact proport ion of variance due to the first factor.
3. Parallel-splits yield coefficients little larger than random splits, unless tests contain large blocks of items representing group factors. For such tests, a computed for separate blocks and combined by a special formula gives a satisfactory estimate of first-factor con- centration.
4. Interpretability of a test score is enhanced if the score has a high first-factor concentration. A high a is therefore to be desired, but a test need not approach a perfect scale to be interpretable. Items with quite low intercorrelations can yield an interpretable scale.
5. A coefficient r~j (or ~-~j) is derived which is the intercorrela- tion required, among items wi th equal intercorrelat ions and variances, to reproduce a test of n i tems having common-factor concentration a .
~ , as a measure of i tem interdependence, d raws at tention to hetero- geneity in both d i~cu l ty and content factors . Heterogenei ty in tes t difficulty meri ts the at tent ion of the tes t designer, since the validity of the tes t may be increased by capitalizing on "difficulty factors" pres- ent in the criterion.
6. To obtain subtest scores for in terpreta t ion or to be weighted in an empirical composite, the ideal set of i tems is one having a sub- stantial a and not fu r the r divisible into a few discrete smaller blocks of items.
R E F E R E N C E S 1. Brogden, H. E. Varia t ion in test val idi ty with var ia t ion in the distr ibution
of i tem difficulties, number of items, and degree of their intercorrelation. Psychomet~'ika, 1946, 11, 197-214.
2. Brown, W. Some experimental results in the correlation of mental abilities. Brit. J. PsychoL, 1910, 3, 296-322.
3. Brownell, W. A. On the accuracy with which re~iability may be measured by correlat ing test halves. J. e~'pe~'. Edus., 1933, 1, 204-215.
4. Burr, C. The influence of differential weighting. Brit . J . Psychol., Star. Sect., 1950, $, 105-128.
5. Clark, E. L. Methods of spl i t t ing vs. samples as sources of instabi l i ty in test-rel iabil i ty coefficients. Hwrvazd educ. Rev., 1949, 19, 178-182.
6. Coombs, C. H. The concepts of rel iabi l i ty and homogeneity. Educ. ~sychol. Meas., 1950, 10, 43-56.
7. Cronbach, L. J. On estimates of test reliabili ty. J. ed~. Psychol., 1943, 34, 485-494.

LEE J . CRONBACH 333
8. Cronbach, L. J. A case study of the split-half rel iabil i ty coefficient. J. educ. Psychol., 1946, 37, 473-480.
9. Cronbach, L. J . Test "re l iabi l i ty" : its meaning and determination. P~ryCho- ~net~/ka, 1947, 12, 1-16.
10. Dressel, P. L. Some remarks on the Kuder-Richardson reliabili ty coefficient. Psychom6t~ika, 1940, 5, 305-310.
11. Ferguson, G. The factorial interpretat ion of test difficulty. Ps¥chomst~'ika, 1941, 6, 323-329.
12. Ferguson, G. The rel iabil i ty of mental tests. London: Univ. of London Press, 1941.
13. Festinger, L. The t reatment of qualitative data by "scale analysis." Psy- chol. Bull., 1947, 44, 149-161.
14. Goodenough, F. L. A cri t ica | note on the use of the term "rel iabil i ty" in mental measurement. J. educ. PsychoL, 1936, 27, 173-178.
15. Guilford, J. P., ed. Pr inted classification tests. Report No. 5, Army Ai r Forces Aviation Psychology Program. Washington: U. S. Govt. Print. Off., 1947.
16. Guilford, J. P. Fundamental s tat ist ics in psychology and education. Second ed. New York: McGraw-Hill, 1950.
17. Guilford, J. P., and Michael, W. B. Changes in common-factor loadings as tests are altered homogeneously in length. Psychomct~'ika, 1950, 15, 237-249.
18. Gulliksen, H. Theory of mental tests. :New York: Wiley, 1950. 19. Guttman, L. A basis for analyzing test-retest reliabili ty. Psychomet~ika,
1945, 10, 255-282. 20. Hoyt, C. Test rel iabil i ty estimated by analysis of variance. Psychometr~l~,
1941, 6, 153-160. 21. Humphreys, L. G. Test homogeneity and its measurement. Ame~'. Psycholo-
gist, 1949, 4, 245. 22. Jackson, R. W., and Ferguson, G .A. Studies on the rel iabi l i ty of tests. Bull.
No. 12, Dept. of Educ. Res., Universi ty of Toronto, 1941. 23. Kelley, T. L. Note on the rel iabil i ty of a tes t : a reply to Dr. Crum's criti-
cism. J. educ. Psychol., 1924, 15, 193-204. 24. Kelley, T. L. Statist ical method. New York: Macmillan, 1924. 25. Kelley, T. L. The rel iabil i ty coefficient. Psychomet~ika, 1942, 7, 75-83. 26. Kuder, G. F., and Richardson, M. W. The theory of the estimation of test
reliability. Psychometrika, 1937, 2, 151-160. 27. Loevinger, J. A systematic approach to the construction and evaluation of
tests of ability. Psychol. Monogr., 1947, 61, No. 4. 28. Loevinger, J. The technic of homogeneous tests compared with some aspects
of "scale analysis" and factor analysis. Psychol. Bull., 1948, 45, 507-529. 29. Mosier, C . I . A short cut in the estimation of split-halves coefficients. Educ.
psychol. Meas., 1941, 1; 407-408. 30. Richardson, M. Combination of measures, pp. 379-401 in Horst, P. (Ed.)
The prediction of personal adjustment. New York: Social Science Res. Council, 1941.
31. Rulon, P. J. A simplified procedure for determining the rel iabil i ty of a test by split-halves. HaPvard ed~w. Rev., 1939, 9, 99-103.
32. Shannon, C. E. The mathematical theory of communication. Urbana : Univ. of Ill. Press, 1949.

334 PSYCHOMETRIKA
33. Spearman, C. Correlation calculated with faul ty data. B~'iL .L Psychol., 1910, 3, 271-295.
34. Stouffer, S. A., et. al. Measurement and prediction. Princeton: Princeton Univ. Press, 1950.
35. Thurstone, L. L., and Thurstone, T. G. Fac tor ia l studies of intelligence, p. 37. Chicago: Univ. of Chicago Press, 1941.
36. Tucker, L. R. Maximum val idi ty of a test with equivalent items. Psycho- me~ 'ka , 1946, 11, 1-13.
37. Vernon, P. E. An application of factorial analysis to the study of test items. B~it. J. Ps"yehol., Star. See., 1950, 3, 1-15.
38. Wherry , R. J., and Gaylord, R. H. The concept of test and item rel iabi l i ty in relation to factor pattern. Psychomet~'ik~, 1943, 8, 247-264.
39. Woodbury, M. A. On the s tandard length of a test. Res. Bu l l 50-53, Edue. Test. Service, 1950.
Manuscript received 12/28/50 R e d e d man usczipt received £/£8/51