1983-11_hp journal papers
TRANSCRIPT

7/24/2019 1983-11_HP Journal Papers
http://slidepdf.com/reader/full/1983-11hp-journal-papers 1/32
REGION L S LES REPORT
© Copr. 1949-1998 Hewlett-Packard Co.
7/24/2019 1983-11_HP Journal Papers
http://slidepdf.com/reader/full/1983-11hp-journal-papers 2/32
H E W L E T T P A C K A R D J O U R N A L
T e c h n i c a l I n f o r m a t i o n f r o m t h e L a b o r a t o r i e s o f H e w l e t t - P a c k a r d C o m p a n y
NOVEMBER 1983 Volume 34 • Number 11
Contents
D e v i c e - I n d e p en d e n t S o f t w a r e f o r B u s i n e s s G r a p h i cs , b y Y v o n n e T e m p l e H P 3 0 0 0
Computer users can c reate bus iness graph ics wi thout regard to the type o f output dev ice
they l l eventual ly use.
A D e c i s i o n S u p p o r t C h a r t m a k e r , b y J a n e t E l i c h M o r r i s a n d R i c h a r d J . S i m m s , J r . T w o
u s e r t h e s a t i s f y t h e n e e d s o f b o t h t h e n o n p r o g r a m m e r a n d t h e s o p h i s t i c a t e d u s e r .
An Easy - to -Use Char tmaker , by Mar tha Seaver , Rober t W. Dea , and R i cha rd J . S imms ,
J r . I t s the s imples t way for a nonprogrammer to get a pro fess iona l - look ing char t .
Conven ien t Crea t i on and Man ipu la t i on o f P resen ta t i on A ids , by Chayaboon Purnave ja
and Jane t Sw i f t D raw f i gu res f reehand o r choose them f rom a l i b ra ry , t hen ed i t t hem by
poin t -and-push methods .
Graph i cs Capab i l i t ies on a Lase r P r i n te r , by Támara C . Baker , W i l l i am J . Toms , James
C . B r a t n o b e r , a n d G e r a l d T . W a d e P r i n t e r s d o t e x t d o c u m e n t s a n d p l o t t e r s p r o d u c e
graphics? This pr inter can do the whole job.
Spec ia l Repor t : The Cen te r f o r I n teg ra ted Sys tems , by F reder i c k H . Gardner I t s a new
approach to industry support of univers i ty research.
Authors
In this Issue
Graphs, charts, and pictures are wonderful things to have when you're required to give
I a business presentation. They prompt the speaker, they help the audience understand (i f
they're In made), and they make it s l ightly less l ikely that the audience wil l fa l l asleep. In
a report, a single graph can summarize pages of data. A picture can be worth a lot of words.
One of the major benefits of computers for business is that they've made it r id iculously
easy even complicated transparencies and hard copy of charts, graphs, even relatively complicated
pictures. You, the ult imate user of a chart, can produce it yourself. No longer do you have
I to take your idea to a graph ic ar t is t or i l lus tra tor , who app l ies spec ia l sk i l ls to generate
a r two rk , s i t mus t then go to a p r in te r o r pho to lab to be tu rned in to t he th ing you wan t . Now you can s i t
down at chart, simply terminal, and if your needs are simple, like a pie, bar, or line chart, you can simply select
items you a menu and type in some numbers. If you have a littl e more skill, you can get remarkably professional
custom in to remarkab ly eas i ly . With a graph ics tab le t , you can put f reehand sketches in to your computer-
gene ra ted to Co lo r i s no p rob lem, e i the r . A l l i t takes i s the r igh t k ind o f p lo t te r o r camera hooked up to
the computer — and, of course, the right kind of software.
It 's that software that makes the machinery user-fr iendly, so that an ordinary person without programming
skills graphics. in a relatively short time, learn to produce high-quality graphics. And that's what most of this issue
is about— software graphics software for the HP 3000 Business Computer. In four of the articles, HP software
designers describe a pair of Chartmaker software packages called DSG/3000 and HP EASYCHART, a general
p ic ture c reator ca l led HPDRAW, and a sof tware package that makes i t poss ib le to merge tex t and graph ics
on an the discussing Laser Printer. The article on page 3 starts off the issue by discussing some common features
of these four packages.
The special report on page 23 is a fi rst for the HP Journal — we commissioned it. Unlike most of our articles,
i t ' s n o t f o r t h e r e s u l t s o f H P R & D e f f o r t s . H P i s o n e o f s e v e ra l c o m p a n i e s s u p p o r t i n g t h e C e n t e r f o r
Integrated Systems at Stanford, an innovative approach to industry support of university research. The subject
is taken seriously by HP management, and HP President John Young and Vice President for Research John
Doy le were ins trumenta l in get t ing CIS s tar t ed. The art ic le te l ls how quest ions o f patent r i ghts , academic
freedom, and other tough issues were resolved in this pioneering effort.
-R. P. Dolan
Editor, Richard P. Dolan • Associate Editor. Kenneth A. Shaw • Assistant Editor, Charles J. Lisherness • Art Director, Photographer, Arvid A. Danielson •
I l lustrators, Nancy S. Vanderbloom. Susan E Wright • Administrat ive Services, Typography, Anne S, LoPrest i , Susan E Wright
European Product ion Supervisor, Henk Van Lammeren
2 H E W L E T T - P A C K A R D J O U R N A L N O V E M B E R 1 9 8 3 Â © H e w l e t t - P a c k a r d C o m p a n y 1 9 8 3 P r i n t e d i n U . S . A .
© Copr. 1949-1998 Hewlett-Packard Co.
7/24/2019 1983-11_HP Journal Papers
http://slidepdf.com/reader/full/1983-11hp-journal-papers 3/32
Device Independent Software for Business
Graphics
New programs fortify the electronic office with a choice of
graphics interfaces.
by Yvonne Temple
TO BRING THE POWER of computer graphics to a
broad range of office workers — from the novice pro
grammer to the management information systems
(MIS) specialist — Hewlett-Packard has developed a set of
business graphics software packages for the HP 3000 Com
puter System. The new software products include DSG/
3000, a decision support chartmaker with data file han
dling, HPEASYCHART, an interactive chartmaker designed
for the nonprogrammer, HPDRAW, a figure design system
that can be used with the HP 17623A Graphics Tablet for
sophisticated data entry and digitizing, and the HP 2680A
Graphics Package, which allows graphics to be printed on
the HP 2680A Laser Printer at 45 pages per minute.
DSG/3000 (see article, page 5) is a sophisticated chart-
making package that can be used with either computer-
stored or manually entered data to manipulate and visually
convey information.
HPEASYCHART (see article, page 10) uses a follow-the-
example data entry method to produce pie charts, bar
charts, line charts, and scattergrams.
HPDRAW (see article, page 13) contains a library of fre
quently used graphic images which can be combined with
freehand drawings to create customized visual aids.
The HP 2680A Graphics Package (see article, page 17)
contains a set of programmatic intrinsics and an interactive
interpreter so that graphics created with DSG/3000,
HPEASYCHART, and HPDRAW can be converted to raster
images and printed on the HP 2680A Laser Printer.
Device Independence
Not all graphics devices have similar operating
capabilities or constraints. Information about physical de
vice limits, device type (e.g. terminal, printer, or plotter),
or color capabilities can vary greatly. Since the new HP
business graphics software supports so many devices
(seven different terminals, twenty plotters, and several
printers), maximum operating efficiency is achieved by
relegating all device-dependent activity to a low level in
the program structure and by restricting device-dependent
information in the code to as few locations as possible. A
high degree of device independence is further realized by
having all supported graphics devices identify themselves
and respond to status requests for graphics input and/or
output. The software uses a powerful set of query routines
to determine the operating characteristics of an identified
device. This variable information is then used to fill capa
bility parameters in the business graphics software inter
face. The upshot of this device independence for users is
that it allows them to access many different graphics de
vices without knowing the specifics of the devices operat
ing characteristics.
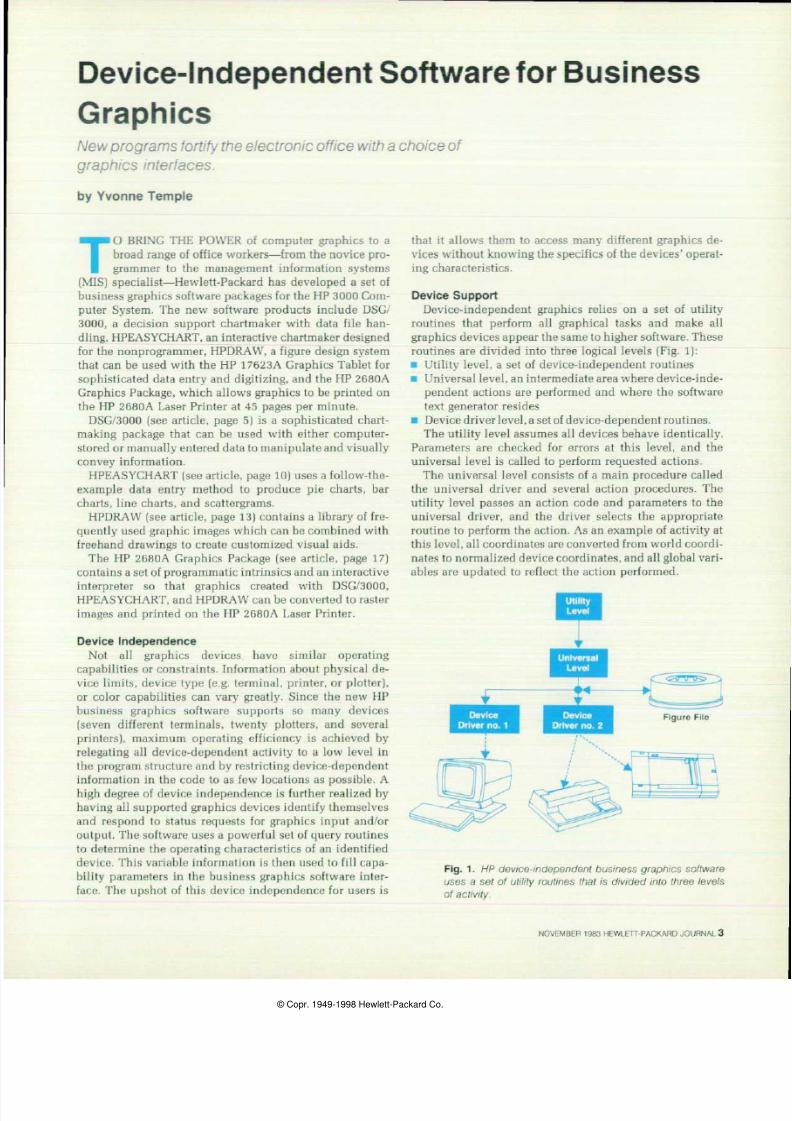
Device Support
Device-independent graphics relies on a set of utility
routines that perform all graphical tasks and make all
graphics devices appear the same to higher software. These
routines are divided into three logical levels (Fig. 1):
• Utility level, a set of device-independent routines
• Universal level, an intermediate area where device-inde
pendent actions are performed and where the software
text generator resides
• Device driver level, a set of device-dependent routines.
The utility level assumes all devices behave identically.
Parameters are checked for errors at this level, and the
universal level is called to perform requested actions.
The universal level consists of a main procedure called
the universal driver and several action procedures. The
utility level passes an action code and parameters to the
universal driver, and the driver selects the appropriate
routine to perform the action. As an example of activity at
this level, all coordinates are converted from world coordi
nates to normalized device coordinates, and all global vari
ables are updated to reflect the action performed.
Universal
Level
F - Ã
Device
Driver no. 1
Device
Driver no. 2
Figure File
Fig. 1 . HP device independent business graphics sof tware
uses a set o l u t i l i ty rout ines that is d iv ided in to three levels
of activity.
NOVEMBER 1983 HEWLETT PACKARD JOURNAL 3
© Copr 1949 1998 Hewlett Packard Co

7/24/2019 1983-11_HP Journal Papers
http://slidepdf.com/reader/full/1983-11hp-journal-papers 4/32
Device Driver Feature Set
Move
Draw (8 l ine styles)
Digitize
Text (3 levels of quality)
Set pen speed
Select pen (0-64)
Marker (8 types)
Polygon f i l l (8 f i l l styles)
Figure File Header
F i g u r e 1
Fig 2 A l l g raph ics dev ice dr i ver rout ines have s im i la r f ea
tures
On the device driver level, there is a different driver for
each class of devices. For example, one device driver gen
erates HP-GL commands for RS-232-C/V.24 plotters (HP
7220, HP 7580, etc.), while another generates escape se
quences for a graphics terminal. All device drivers support
a similar set of features (Fig. 2). The utility routines take
advantage of device intelligence whenever possible, but if
a device class does not support a necessary feature in resi
dent firmware (e.g. , polygon f ill) , then the task is performed
with the aid of software helper routines (e.g., a polygon
fill generator).
Figure Files
Device-independent graphics software packages also rely
on three data structures — figure files, font files, and color
palettes.
Initially developed for HPDRAW as a means of storing
frequently needed graphic design images, figure files are
keyed access files used by all HP business graphics soft
ware to store and transfer graphical data. They can hold
several individual figures which can be drawn separately
or included in other drawings.
A figure file consists of a figure file header and one or
more figures. The figure file header contains the file s cre
ation date and the version of graphic utility routines used.
Each figure is composed of a figure header and figure data.
The figure header holds a comment field, information on
the size of the figure, and the date the figure was created.
The figure data consists of action codes and the data as
sociated with each action code. For example, a draw com
mand consists of the draw action code and an (x,y) coordi
nate pair designating where the action will stop. Figure
file action codes are read by a figure file translator and
passed directly to the universal driver. The rotation or scal
ing of a figure file occurs in the universal level.
Drawing to a figure file is almost the same as drawing
to any other graphics device. In fact, the figure file gener
ation routines are implemented as a device driver since
they logically fit the functional structure of other device
drivers.
Figure 2
created: 3/6/83
version: A. 00. 00
figure header Figure 1 '
begin figure
move 5,5
draw 5,10
text 8 Hi there
end figure
f igure header f igure 2
begin f igure
move 0,0
draw 10,0
draw 10,10
draw 0,10
draw 0,0
move 5,5
text 3 Box
end f igure
Fig 3 Example of a f igure f i le
time during the graphics session. A new font is selected
by specifying the font file name and the character set de
sired. To optimize performance, the data for the four active
fonts is stored in separate extra data segments. When a new
font is specified, the font information is read from the font
file and stored in an extra data segment. When the text
utility is called, the data for the current font is moved onto
the user s stack and the appropriate text generator draws
the text. New fonts are easy to support by creating a new
font file.
Color Palette
With the introduction of the HP color terminals (HP 2700
and HP 2627A) and the advent of programmatic color selec
tion, it became evident that a more sophisticated method
of color support was needed. Selecting a pen number just
isn t sufficient when a device has the capability of defining
a pen color.
HP device-independent graphics software uses color
palettes that recognize a device s color specification capa
bility and direct a user toward attractive color mixtures on
plotters and terminals. The various palettes available are
located in a palette file containing the definition of each
palette pen in terms of its red, green, and blue content.
When a color terminal is used, the palette is referenced
and the pen colors are set accordingly. Since the 262 7A
does not support the definition of pen colors, the full range
of palette values is supported only during solid fill by using
the 2627A s dither patterns.
Each palette was designed with colors that appear aes
thetically pleasing together. The default palette colors
match HP plotter pen colors, so a drawing produced on a
color terminal will look similar to one produced on a
plotter.
Text
Two software text generators provide HP business
graphics products with a choice of several different fonts
for high-quality text. The data used to produce the fonts
is stored in a font file. Four software fonts are active at a
given time, and any of the four can be redefined at any
Hewle t t -Packard G raph i cs Language
4 HEW LETT-PACKARD JO URNAL NO VEM BER 1983
© Copr. 1949-1998 Hewlett-Packard Co.

7/24/2019 1983-11_HP Journal Papers
http://slidepdf.com/reader/full/1983-11hp-journal-papers 5/32
A Decision Support Chartmaker
by Janet El ich Morr is and Richard J. Simms, Jr .
TRENDS ARE SPOTTED more easily on a chart than
in a table of values. A large table of sales data for
the past three years would be tedious to read, but
a chart of the data might quickly show that sales at the
beginning of each quarter are higher than at other times.
With Decision Support Graphics/3000 (DSG/3000), data
stored in any data file, including a file taken from a data base,
can be charted to convey the stored information visually.
DSG/3000 is a comprehensive business graphics software
package that produces bar, line, and pie charts, and slides.
It is one of a family of graphics packages designed for the
HP 3000 Computer System.
DSG/3000 allows the user to design, produce, and save
charts generated from information kept in a data file. It is
a versatile software tool used for creating several charts on
a periodic basis or single charts for one-time applications.
DSG/3000 features include: interactive and programmatic
interfaces, data manipulation by projection, restriction,
sorting, or transformation, chart layouts that conform to HP
corporate design standards, integration with and access to
other subsystems, and easy adaptation (localization) to a
user s native language.
Interface and Intrinsics
The user has two ways of accessing the design features
of DSG/3000. The first is through an interactive interface
program called GRAPH, and the second is through a set of
routines known as the DSG/3000 intrinsics. Each interface
addresses a different type of user.
The interactive interface, GRAPH, appeals largely to non-
programmers. GRAPH is a series of menus that guide the
user through the chartmaking process. Menu and data dis
play are handled through VPLUS/3000 intrinsics, while
*VPLUS/3000 is a software system that implements and contro ls source dat a entry and
prov ides an in terface between terminals or f i les and any t ransact ion-process ing appl ica
tions.
low-level plotting and device control are handled through
the graphics utility routines {see article, page 3).
From the main menu (Fig. 1) the user can choose one of
ten selections. Electing to create or edit a chart causes the
chart design control menu to be displayed on the screen.
Subsequent menus define the data file, choose the chart
type, enhance the chart, and select the output device
characteristics.
The menus are chained together in a logical sequence so
the user may press PREVIOUS MENU and NEXT MENU func
tion keys to step through the various menus needed to
create a chart. A typical sequence is as follows:
• Enter main menu and select CREATE NEW CHART
• Select CREATE DATA FILE from chart design control
menu
• Enter data and variable names, press NEXT MENU
• Define data and missing data values, press NEXT MENU
1 Choose chart type, enter dependent and independent
variables, press NEXT MENU
• Define axes scaling, ticks, and grids, press NEXT MENU
• Supply legends, colors, and textures, press NEXT MENU
• Enter titles, press NEXT MENU
• Add annotations to chart, press NEXT MENU
• Select graphics device and characteristics, press NEXT
MENU
• Choose text characteristics, press NEXT MENU
• Define font characteristics
• Press PLOT to see the output of your chart.
Alternatively, the programmer may prefer to use the in
trinsic interface. The intrinsics can be accessed from five
programming languages: Pascal, COBOL, SPL, BASIC, and
FORTRAN. The intrinsic interface provides the same
capabilities as GRAPH and is especially useful when data
files are created programmatically for periodic charts. The
à œ K H K H I H . O 1 . U 1 M a i n L o n t r
O p e r a t i o n C h a r t N a m e
Char t F I le Name
fi Hdd new chart
M Modify or recall chart
P Purge chart
I Display/supply chart Information
C J - N o p a u s e s )
- D r a m c h a r t s ) :
D e v i c e I D . .
H P - I B t t .
B Browse chart file
0 QUERY. PUB. SYS
F Bu i 1 d/mod i f y data file
CF Create f igure file
E E x i t
C Copy chart from:
Chart name
Chart file
F i g 1 T he m a i n m enu o f DS G /
3000
NOVEMBER 1983 HEWLETT-PACKARD JOURNALS
© Copr 1949 1998 Hewlett Packard Co
7/24/2019 1983-11_HP Journal Papers
http://slidepdf.com/reader/full/1983-11hp-journal-papers 6/32

7/24/2019 1983-11_HP Journal Papers
http://slidepdf.com/reader/full/1983-11hp-journal-papers 7/32
Dataf i le
New
Dataf i le
Dataf i le
New
Dataf i le
Project A B F
Fig. 3. Select ing var iables A and B to p lot against F causes
the projection of A B and F and creates a new fi le containing
only those variables.
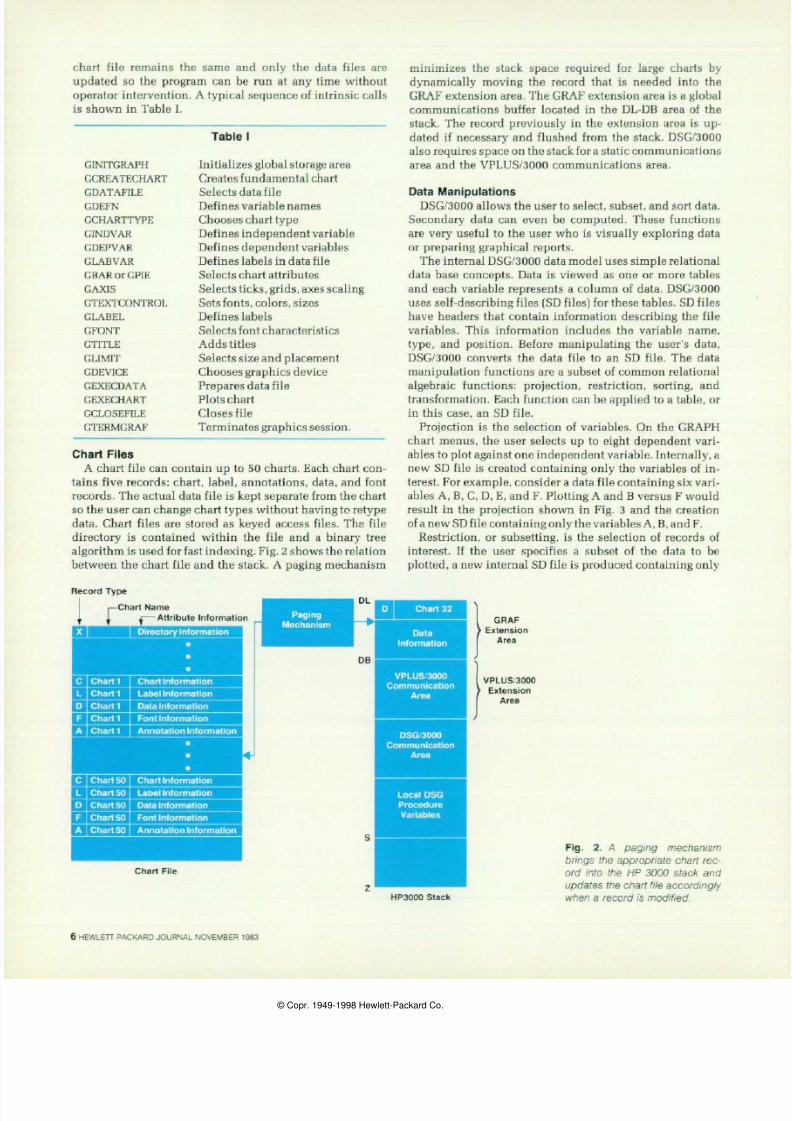
the records of interest. For example, consider a data file
containing the variables A, B, and C. The subset of A greater
than 3 would result in the restriction shown in Fig. 4. This
operation would create an SD file containing three variables
and only two records.
Sorting is used mainly to arrange records in relation to
an independent variable so that the data for a line chart
can be plotted in positive X-axis increments (the indepen
dent variable). An example (Fig. 5) demonstrates the sort
ing of a table containing the variables A and B by increasing
values of B.
Transformation allows new columns of data to be calcu
lated from currently existing columns. An example of this
function might take a data file with variables A and B and
create a new variable C which is the sum of A and B (Fig. 6) .
In DSG/3000, the restriction and transformation opera
tions are optimized. This means that scanning and parsing
are done only once per plot. The relational or arithmetic
expression specified is parsed and converted to a small
program which can be quickly executed when applied to
a particular record. To visualize how the process works,
consider the following example. The user has a data file
that contains values for orders, shipments, and year. If the
user wants to compute and chart a new variable, back
log, to display as a bar chart for the years 1975-1978, the
actions shown in Fig. 7 would occur. Assume the user then
wanted to change the subset expression and replot the chart
looking only at the years 1979 and 1980. DSG/3000 would
optimize data manipulation by performing only the neces
sary restriction.
Design Standards
Computer engineers are good at designing software, and
graphic artists are good at making presentation quality
charts. DSG/3000 makes use of both their talents. All of
the DSG/3000 chart layouts were designed by graphic art
ists at HP Corporate Industrial Design. The layout
guidelines include text size and positioning, line thickness.
Dataf i le
Restr ict A>3
Fig . 5 . Sor t ing rea r ranges the records o f a da ta f i le based
on a speci f ied var iable.
placement of bars, grids, and tick marks, cross-hatch pat
terns, and the positioning of multiple charts on the same
page. For example, legends are positioned at the top of the
chart for up to five variables, and on the left side of the
chart for six to eight variables, so the chart will appear
balanced. DSG/3000 also has default axis values that leave
approximately 10 white space between the highest data
point and the top of the axis frame. Default cross-hatch
and line patterns are selected to yield maximum visual
separation, making it easier for the eye to differentiate pat
terns. These design standards make it easy to produce nice
looking charts consistently.
Integration
Last year HP released several new office products includ
ing graphics, word processing, and personal data base sys
tems. Two separate file types enable these products to com
municate with each other. Self-describing files (SD files)
ease the transportation of data between DSG/3000 and other
data bases. Figure files (see article, page 3) allow charts
and drawings to be transported easily between HP software
products.
SD files are created by QUERY/3000 and HPLIST, and
are planned for future products as well. They can also be
created by GRAPH in the data prompt menu. Once created,
the information stored in the SD file header can be accessed
by DSG/3000 to alleviate the task of typing in the variable
descriptions again. The user just types in the SD file name
and the rest of the information appears on the menu.
A figure file created with DSG/3000 can be included in
an HPDRAW slide or merged with text and printed on the
HP 2680A Laser Printer system or the HP 2608S Graphics
Printer. Figure files allow the user to design charts with
DSG/3000 and enhance them with figures or text using
HPDRAW (see article, page 13). They also enable users to
rotate and adjust their charts. The figure file is composed
of relative moves and draws. No application-dependent
information is stored in the figure file. Consequently, the
figure file can easily be moved from one application pack-
Dataf i le
Fig . 4 . Da ta man ipu la t ion by res t r i c t ion c rea tes a new f i le
with only the records that comply with the restricted variable.
Fig. 6. Transformat ion permits the creat ion of new data col
umns f rom current ly exist ing columns.
NOVEMBER 1983 HEWLETT PACKARD JOURNAL 7
© Copr 1949 1998 Hewlett Packard Co

7/24/2019 1983-11_HP Journal Papers
http://slidepdf.com/reader/full/1983-11hp-journal-papers 8/32
Business Presentation ids
M o s t f o u r p re se n t a t i o n a i d s ca n b e ca t e g o r i ze d i n t o o n e o f f o u r g e n e r i c t yp e s . E a ch ca t e g o ry h a s a d i f f e re n t p u rp o se .
TYPEWRITER S LES
E S T E R N B E G K Â »
D O L L A R S I N T H O U S A N D S
Bar char t s a re appropr ia te fo r char t ing d iscre te da ta .
DESIGNING ND PRODUCING GR PHS
GR PH
SCREEN MENUS
L ine char t s a re used fo r char t ing cont inuous data .
S LES FORCE TIME M N GEMENT STUDY
O F F I CE M EET I NG S
Pie charts i l lust rate the percentage composi t ion of a subject .
C M E M N U F C T U R I N G I N C O R P O R T E D
T O T A L E X P E N S E S W E S T E R N S A L E S E AS TE RN S AL ES
S E P O C T M O V D E C
Sl ides a l l ow a user to d i sp lay tex t box s t ruc tures ar rows or
circles.
age to another.
Another aspect of integration relies on a common set of
interface standards for all office products. These standards
outline menu conventions, function key placement and
wording, message handling, and banner format. With all
office product interfaces looking the same, the user isn t
burdened with mastering several syntaxes and the learning
time for new products is shortened.
Localization
The user interface of DSG/3000 can be adapted to another
language by modifying the message catalog. The message
catalog contains error and warning messages, language and
paper size defaults, device coordinates, command strings,
font file names, and general messages and prompts. By
using EDIT/3000, a user can change the message catalog
entries to reflect a native language.
Menus can also be translated to other languages. The
FORMSPEC utility available in VPLUS/3000 makes it pos
sible to change the wording on menus. The actual field
lengths cannot be changed.
Although DSG/3000 is not fully localized, efforts have
been made to simplify use of the product in countries other
than the United States. For instance, all selection fields are
two characters long, except those of a yes/no nature. This
eliminates ambiguities that may arise when field labels are
not easily translated.
Characters can be output in seven different languages.
The characters are generated through a 7-bit International
Standards Organization (ISO) substitution which maps the
7-bit character code sent by the terminal to the 8-bit Roman
extension set. An 8-bit solution for foreign characters is
currently being proposed to replace the temporary 7-bit
8 HEW LETT-PACKARD JO URNAL NO VEM BER 1983
© Copr. 1949-1998 Hewlett-Packard Co.

7/24/2019 1983-11_HP Journal Papers
http://slidepdf.com/reader/full/1983-11hp-journal-papers 9/32
Datafi le New
Datafi le
O r d e r s S h i p m e n t s Y e a r B a c k l o g
923
Trans Backlog Restrict Year
1899
195
1875
ISO substitution.
Flexibility
DSG/3000 has both data presentation (hard copy) and
data display (terminal) capabilities. With the option to plot
on transparencies, the user can produce high-quality charts
for presentations. Best results are achieved by reducing the
movement of the plotter pen to 10 cm/s from its top speed
of 36 cm/s or higher. A new, quick-drying transparency
medium developed by HP s San Diego Division eliminates
the need for a pause between pen changes to prevent colors
from running together.
Initially DSG/3000 supported only a stick character font.
The second release added gothic, script, and roman fonts.
The user was also given control over text size and color.
The third release introduces three new fonts based on
spline curves. These new fonts can be scaled to any size
and will retain their smooth curves. They can also be filled
to make solid characters. Each of the new fonts includes
bold, italic, and outline faces in any combination. They
correspond to the faces that typesetters use.
Every good chartmaking package should have a variety
of basic capabilities, but it is flexibility that makes a pack
age powerful. Sometimes our product engineers are sur
prised by an unusual chart created by DSG/3000. The chart
1445 1975 478
162 1976 279
169
1977 26
1495 1978 38
Fig 7 A new f i le con ta in ing the
var iab le back log is c rea ted w i th
records tha t comp ly to a year re
striction
in Fig. 8 is a frequently used type that is easily created by
DSG/3000.
The Interactive Office
Hewlett-Packard developed the Interactive Office to meet
the changing needs of business professionals. The Interac
tive Office consists of an integrated set of tools for docu
ment management, organizational communication, per
sonal support, and decision support. As an element of this
system, DSG/3000 was designed to aid office workers in
decision making by accessing, interpreting, analyzing, and
presenting the information they need to get their job done.
Acknowledgments
The authors would like to thank Sue Crane, Karen Chez,
Robert Dea, and all of the other people involved in the
development of the three releases of DSG/3000.
O R D E R B A C K L O G
H A P P Y T O Y C O M P A N Y F Y 1 9 8 3
N E T S H I P M E N T S B K L G M O S . /
A C T U A L A C T U A L
B K L G M O S . /
T A R G E T
MONTHS 9.0
6.0
3.0
M 9 0
75
60
45
30
15
0
B A C K L O G M O N T H S
B A C K L O G
A C T U A L N E T O R D E R S / A C T U A L N E T S H I P M E N T S
N O V D E C
JAN FEE M A R A P R MAY J UN J UL AUG S E P O C T
F i g 8 Th i s c h a r t c o mb i n e s s e v
eral DSG/3000 design capabilities
N O V E M B E R 1 9 8 3 H E W L E T T - P A C K A R D J O U R N A L 9
© Copr 1949 1998 Hewlett Packard Co

7/24/2019 1983-11_HP Journal Papers
http://slidepdf.com/reader/full/1983-11hp-journal-papers 10/32
An Easy-to-Use Chartmaker
by Martha Seaver Robert W. Dea and Richard J. Simms Jr .
HPEASYCHART is an interactive chartmaker de
signed to be used with the HP 3000 family of com
puters. HPEASYCHART is a simplified alternative
to the more sophisticated DSG/3000 business graphics
package see article, page 5). It allows nonprogrammers to
create visually pleasing charts without understanding all
of the details behind design decisions or file control.
HPEASYCHART does not use a file for data entry. In
stead, the user selects a chart type and then enters indi
vidual data values to construct the desired output. This
data entry method makes HPEASYCHART well suited for
one-time applications, such as charts needed as illustra
tions in a text document or as presentation aids. Periodic
charts with unchanging design specifications are more ef
ficiently prepared using data files and a chartmaker like
DSG/3000.
HPEASYCHART began as an experimental prototype de
signed to put graphics capabilities at the fingertips of a
variety of office workers. The prototype became such a
popular internal tool that a decision was made to expand
the program and offer it as a product. To appeal to the
nontechnical user in particular, the typical menu-driven
interface was modified by adding features that make certain
default design decisions so a user can produce handsome
charts by responding to just a few simplified menus.
Menu Design
The infrequent computer user may not know the names
of chart types or specifications. HPEASYCHART eliminates
this problem by displaying icons pictures) on its main
menu to provide the user with an easily identifiable sum
mary of capabilities. Chart type names appear alongside
the icons so HPEASYCHART can be used on both graphics
and nongraphics terminals. There are no fields to fill in or
boxes to check on the main menu Fig. 1). Function keys
control the selection of options and the flow of subsequent
menus. Once the user selects a chart type from the main
menu, HPEASYCHART displays a design menu containing
the icon of the chart to be created. A standard design menu
format for all chart types allows the user to create many
types of charts without having to learn new concepts. Pie
chart data is collected differently from other types but the
general flavor of the standard design menu is still pre
served.
Instead of presenting a confusing array of options,
HPEASYCHART menus are uncluttered. A help menu is
available with examples. Operating instructions are
minimized by including sample data with each menu op
tion. These samples not only instruct the user on correct
data entry, but also serve as default values that allow the
user to preview the output. New data overrides the sample
values and the previewing function can illustrate how the
chart has been altered. The technique of learning by exam
ple is used extensively throughout HPEASYCHART to
simplify graphics for the inexperienced user.
F i g . 1 . H P E A S Y C H A R T s m a i n
menu with char t type icons.
10 HEW LETT PACKARD JOURNAL NOVEMBER 1983
© Copr 1949 1998 Hewlett Packard Co

7/24/2019 1983-11_HP Journal Papers
http://slidepdf.com/reader/full/1983-11hp-journal-papers 11/32
S A L U E S S W E E T S H O P
1 9 8 2 S A L E S B Y P R O D U C T
( I N T H O U S A N D S O F D O L L A R S )
Fig 2 A sample char t prepared with HPEASYCHART
HPEASYCHART makes option selection simple. For
example, on the pie chart design menu a combination of
three options may be entered. A standard entry method
would involve labeled boxes (fields) for each option. T he
user would make several keystrokes to reach the appro
priate field position and enter an X to indicate an included
option. To minimize the number of fields to be filled and
the keystrokes to be made, HPEASYCHART designates a
SELECT OPTIONS function key that consecutively highlights
all eight conbinations. The user simply presses SELECT
OPTIONS until the desired combination is highlighted.
HPEASYCHART uncomplicates business graphics by
making certain design decisions, but i t is also f lexible
enough to be useful to a broad range of office workers and
professionals. It allows the user a choice of output medium,
page size, chart positioning, and space for binding, without
the need to specify a lot of details about plotting devices,
paper dimensions, or exact chart posit ion coordinates.
HPEASYCHART menus include simplified parameter op
tions that make it easy to tailor an output format. For in
stance, to plot a chart on the left side of a page, leaving
space for ring binder holes, the user enters L (left) for both
chart position and space for binding. This friendly method
of design frees the user from remembering syntax and coor
dinates while encouraging creativity by anticipating man}
typically encountered format alterations.
The pie chart i l lustrated in Fig. 2 was produced with
HPEASYCHART using the following sequence of steps.
• From the main menu (Fig. 1), press SELECT CHART until
the PIE is highlighted
• Press CREATE CHART to arrive at the pie chart menu
(Fig.3)
• Enter the necessary titles, labels, and values (the chart
could then be previewed on a terminal screen by pressing
PLOT TO SCREEN)
• To create the chart, press PLOT TO PLOTTER, which causes
the plot menu (Fig. 4) to appear
• Enter the appropriate data for device, page size, etc.
• Press DONE.
Default Fi les and Parameters
Each time HPEASYCHART is executed a temporary copy
of a default DSG/3000 chart file and a default sample data
file are created.
The DSG chart file is made up of ten charts: one for each
of the eight chart types provided by HPEASYCHART, one
for the chart currently being designed, and one for extrane
ous information. When a user selects a chart type from the
main menu, HPEASYCHART replaces the old current chart
with a copy of the default chart of the selected type. The
default chart is actually a DSG/3000 chart with default
options set for such things as font, text size, and axis scal
ing. The values for these parameters have been chosen to
produce a pleasing standard chart. As the user designs the
current chart by selecting pen color, line or area texture,
and titles, the associated chart in the chart file is modified
via calls to DSG/3000 intrinsics. This current chart is where
all the user-selected design information is stored. If the
chart is saved, the current chart is simply copied to a new
P i e C h a r t D e s i q n
To make a pie chart, fill in the -fields below and press Plot to Screen.
Press He Ip for examples and more information.
Title
Subt i 1 1 e
Footnote
.RLLIE S SHEET SHOP
1982 SHLES BY PRODUCT
(IN THOUSANDS OF 11(11 I UK .)
Pie SI ice
Labe Is Values
E x p l o d e T e x t u r e P e n
CY/NJ (1 -8) ( 1 -16 )
Options
a
l
rint Percentages
Sort Pie SI Ã ces
Fig 3 Pie char t menu contain ing
the data used to create F ig 2
N O V E M B E R 1 9 8 3 H E W L E T T P A C K A R D J O U R N A L 1 1
© C 1949 1998 H l tt P k d C

7/24/2019 1983-11_HP Journal Papers
http://slidepdf.com/reader/full/1983-11hp-journal-papers 12/32
To plot for chart, fill in the -fields below and press ENTER. Press Help for
more information.
Device Model Number
Title Boldness L - Light
M - Mediurr
P a g e M e d i u m P - P a p e r S - S c r o l l a b l e P a p e r
T - Transparency TP - Transparency with pauses)
P a g e S i z e H - 8 . 5 x 1 1 i n B - 1 1 x 1 7 i n D - 2 2 x 3 4 i n
R4 - 210x297 mm H3 - 280x420 mm blank - 8.5x10.5 in
Space For Holes L - Lef t R - Right T - Top
Char t Pos i t i on
B - Bottom
Fig 4 P lo t menu con ta in ing the
data used to create Fig 2
chart file. Although transparent to the user, DSG/3000 han
dles the internal structuring of the chart.
The default data file supplies the sample data displayed
on chart design menus. This sample data and all user-
supplied data are stored internally in a table. There are
seven columns in the table: one for textual X-axis values,
one for numeric X-axis values, and one for each of five
available Y-axis values. When the user saves a chart, the
data table is stored in a separate data file that is used in
conjunction with the saved chart file to recreate the chart.
Use wi th Other Off ice Systems
HPEASYCHART is useful as a stand-alone graphics pre
sentation software system. It is fully compatible with all
HP graphics terminals, plotters, and graphics products.
It can even be used on nongraphics HP terminals to design
and plot charts on an attached plotter. But HPEASYCHART
can also be considered as a component of the powerful
electronic office system that includes DSG/3000, TDP/3000,
HPDRAW, and HPWORD. A chart designed with
HPEASYCHART can be enhanced using the expanded de
sign capabilities of DSG/3000. Many experienced graphics
designers prefer to make a quick, initial des ign with
HPEASYCHART and then take the files into DSG/3000 to
make special embellishments. HPEASYCHART s save fea
ture can be used to create a figure file that can be incorpo
rated into an HPDRAW drawing or an HPWORD document.
Figure files allow text and graphics to be merged on the
HP 2680A Laser Printer. HPEASYCHART permits interac
tion between sophisticated and novice users and it makes
graphics and document preparation simpler, less time-con
suming, and more cost-efficient.
cknowledgments
The authors would like to thank everyone who helped
make HPEASYCHART a released product. We thank San
dro Recchione for throughly testing the product, John Deck
for writing an excellent manual under time pressure, Mari
lyn Johnson and Chris Kocher for handling the marketing
and promotional efforts, Kim Sasko for her on-line support
assistance, Ellen Brigham for training assistance and con
tinued off-line support, and Ann Koehler for quality assur
ance finishing and testing.
12 HEWLETT-PACKARD JOURNAL NOVEMBER 1983
© Copr. 1949-1998 Hewlett-Packard Co.
7/24/2019 1983-11_HP Journal Papers
http://slidepdf.com/reader/full/1983-11hp-journal-papers 13/32
Convenient Creation and Manipulation of
Presentation Aids
by Chayaboon Purnaveja and Janet Swif t
THE USE OF COMPUTERS to assist in the production
of visual aids has increased significantly in recent
years. As a result, graphics users have begun to de
velop specialized needs that extend beyond simple tasks
such as adding an arrow to a chart or modifying an anno
tation. They want products that can create customized
drawings and simplify graphical data manipulations.
HPDRAW and the HP 3000 Computer System fulfill those
needs.
HPDRAW is a highly interactive graphics design system
that allows data to be entered through direct graphics or
menu interfaces. The editing and manipulation of freehand
drawings, symbols, and signatures is accomplished by
point and push operations using a graphics cursor instead
of the typical coordinate point designation method. When
HPDRAW is used in conjunction with the HP 17623A
Graphics Tablet, figures can be created by moving a stylus
across the tablet. Signatures can be digitized and entered
into letters and documents. Figures generated with
HPDRAW can be saved, enhanced with area fill, rotated or
scaled, and even combined with a drawing, which can be
merged with text.
Figure files contain graphic data (see article, page 3).
They are a convenient means of interchanging graphical
information between HP business graphics software prod
ucts. During the initial development of HPDRAW there
were no plans for figure files and much of the integrated
text and graphics strategy had not been determined, so the
interface was designed to allow for the addition of large
new sets of capability at a later date. This design permitted
the support of figure files and new capabilities that weren t
originally foreseen. There were no immediate plans during
the design phase for use of the 2680A Laser Printer as an
output device or for use of a tablet like the 17623 A in menu
picking and object placement. The modular structure of
the software made it easy to add new features in parallel
while other parts of the product were still under develop
ment or being tested. The design (a basic functional outline
is shown in Fig. 1) is a combination of top-down and
bottom-up structures that allowed the design team to get
the high-level portions of the user interface up and running
while simultaneously developing the low-level screen and
file handling capabilities. This methodology allowed the
engineers to identify and respond to some serious perfor
mance and user interface issues early in the product de
velopment cycle.
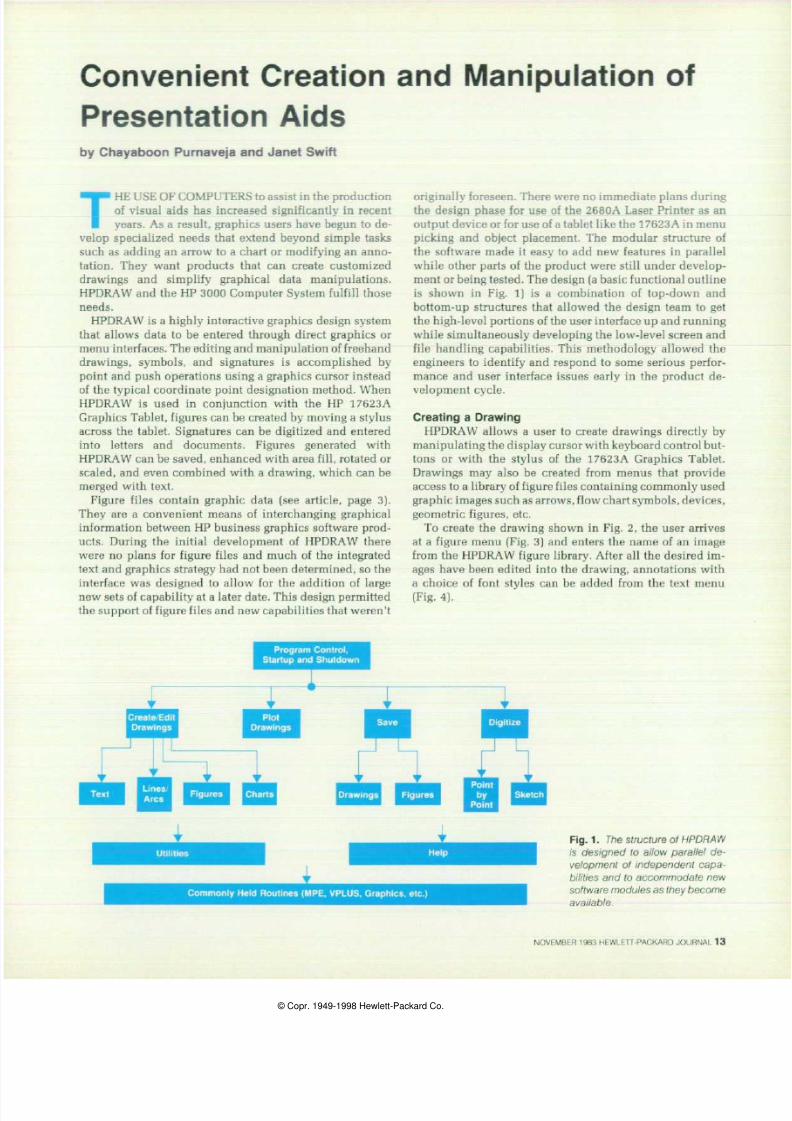
Creat ing a Drawing
HPDRAW allows a user to create drawings directly by
manipulating the display cursor with keyboard control but
tons or with the stylus of the 17623A Graphics Tablet.
Drawings may also be created from menus that provide
access to a library of figure files containing commonly used
graphic images such as arrows, flow chart symbols, devices,
geometric figures, etc.
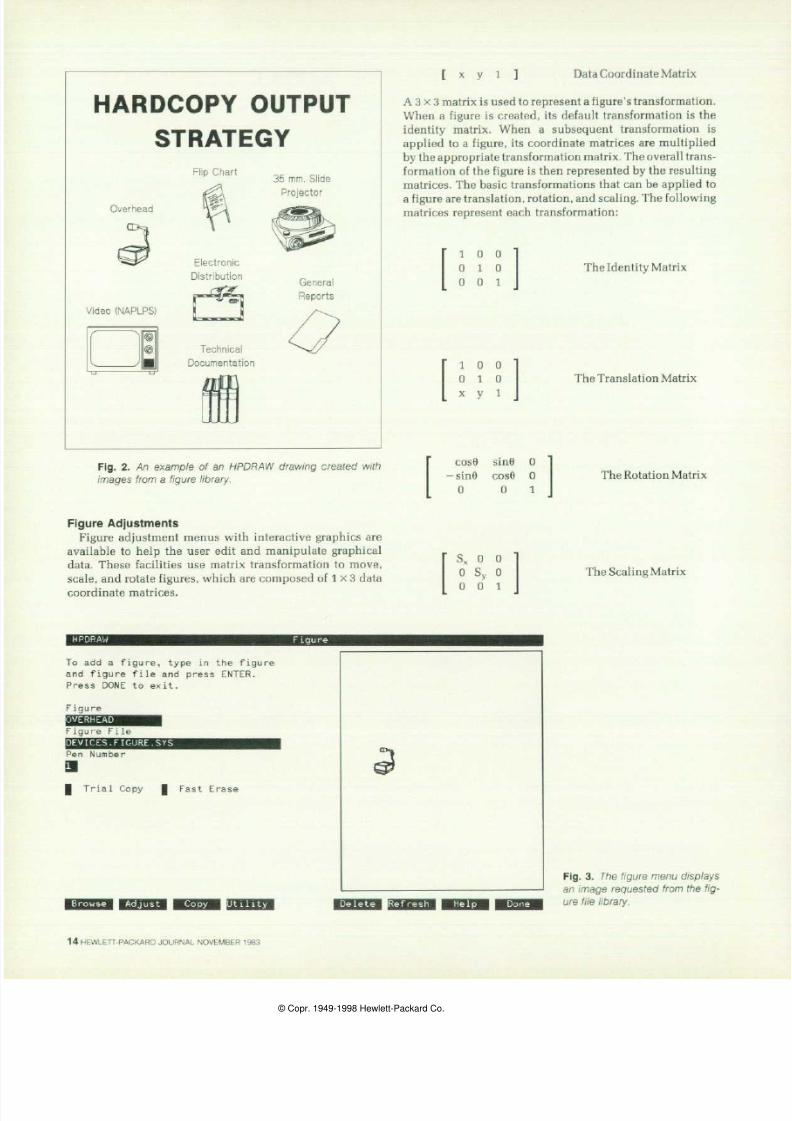
To create the drawing shown in Fig. 2, the user arrives
at a figure menu (Fig. 3) and enters the name of an image
from the HPDRAW figure library. After all the desired im
ages have been edited into the drawing, annotations with
a choice of font styles can be added from the text menu
(Fig. 4).
Program Control,
Startup and Shutdown
Create/Edit
Drawings
Plot
Drawings
Drawings
Commonly Held Routines MPE, VPLUS, Graphics, etc.)
Fig 1 The structure of HPDRAW
is des igned to a l low para l le l de
ve lopment o f independen t capa
bi l i t ies and to accommodate new
software modules as they become
available
NOVEMBER 1983 HEWLETT PACKARD JOURNAL 13
© C 1949 1998 H l tt P k d C
7/24/2019 1983-11_HP Journal Papers
http://slidepdf.com/reader/full/1983-11hp-journal-papers 14/32
H R D C O P Y O U T P U T
S T R T E G Y
F l i p C har t
35 mm. S l i de
Pr o j ec to r
O v er head
E l ec t r on i c
D i s t r i bu t i on
Video NAPLPS)
General
R e p o r t s
T ec hn i c a l
D o c u m e n t a t i o n
F i g 2 An e x a mp l e o f a n H PD R AW d r a w i n g c r e a t e d w i t h
images f rom a f igure l ibrary
[ x y 1 ] D a t a C o o r d i n a t e M a t r i x
A 3 x 3 matrix is used to represent a figure s transformation.
When a figure is created, its default transformation is the
ident i ty matr ix . When a subsequent t ransformat ion i s
applied to a figure, its coordinate matrices are multiplied
by the appropriate transformation matrix. The overall trans
formation of the figure is then represented by the resulting
matrices. The basic transformations that can be applied to
a figure are translation, rotation, and scaling. The following
matrices represent each transformation:
1 0 0
0 1 0
0 0 1
The Identity Matrix
The Translation Matrix
c o s 6 s i n 6 0
- s i n 9 c o s 6 0
0 0 1
The Rotation Matrix
Figure djustments
Figure adjustment menus with interactive graphics are
available to help the user edit and manipulate graphical
data. These facilities use matrix transformation to move,
scale, and rotate figures, which are composed of 1 x 3 data
coordinate matrices.
S x 0 0
0 S y 0
0 0 1
The Scaling Matrix
T o a d d a f i g u r e , t y p e i n t h e f i g u r e
a n d f i g u r e f i l e a n d p r e s s E N T E R .
P r e s s D O N E t o e x i t .
F i g u r e
F i g u r e F i l e
IGURE. SYS
P e n N u m b e r
T r i a l C o p y | F a s t E r a s e
Fig 3 The f igu re menu d isp lays
an image reques ted f rom the f ig
ure f i le l ibrary
14 HEWLETT-PACKARD JOURNAL NOVEMBER 1983

7/24/2019 1983-11_HP Journal Papers
http://slidepdf.com/reader/full/1983-11hp-journal-papers 15/32
To add text, type in the text and
its characteristics and press
ENTER. Press DONE to exit.
Text Page
ont
Position C, L, R, CL, M)
Pen Number 1 to 6U)
Type Style L, M, B; I; 0)
S i z e 1 t o 5 0 0 )
A n g l e 0 t o 3 6 0 )
H A R D C O P Y O U T P U T
S T R A T E G Y
The translation matrix can be used to move a figure x
units along the X axis and y units along the Y axis. The
rotation matrix represents a rotation of 6 radians counter
clockwise from the positive X axis. The scaling matrix
scales a figure by the factors of Sx in the X direction and
Sy in the Y direction.
When visual scaling or rotation is specified, a reference
guide is drawn at the origin of the transformation. In the
case of scaling, a reference rubberband arrow is drawn
showing the size of the intermediate figure Fig. 5a). The
user moves the cursor along the direction of the arrow to
indicate how much the figure should be expanded or
shrunk. The length of the arrow is used as the scaling
reference.
In the case of rotation Fig. 5b), a reference circle appears
around the intermediate figure and a reference arrow is
drawn to indicate the current angle of rotation specified
for the figure. The user moves the cursor along the circum
ference of the circle to indicate the angle through which
the figure should be rotated.
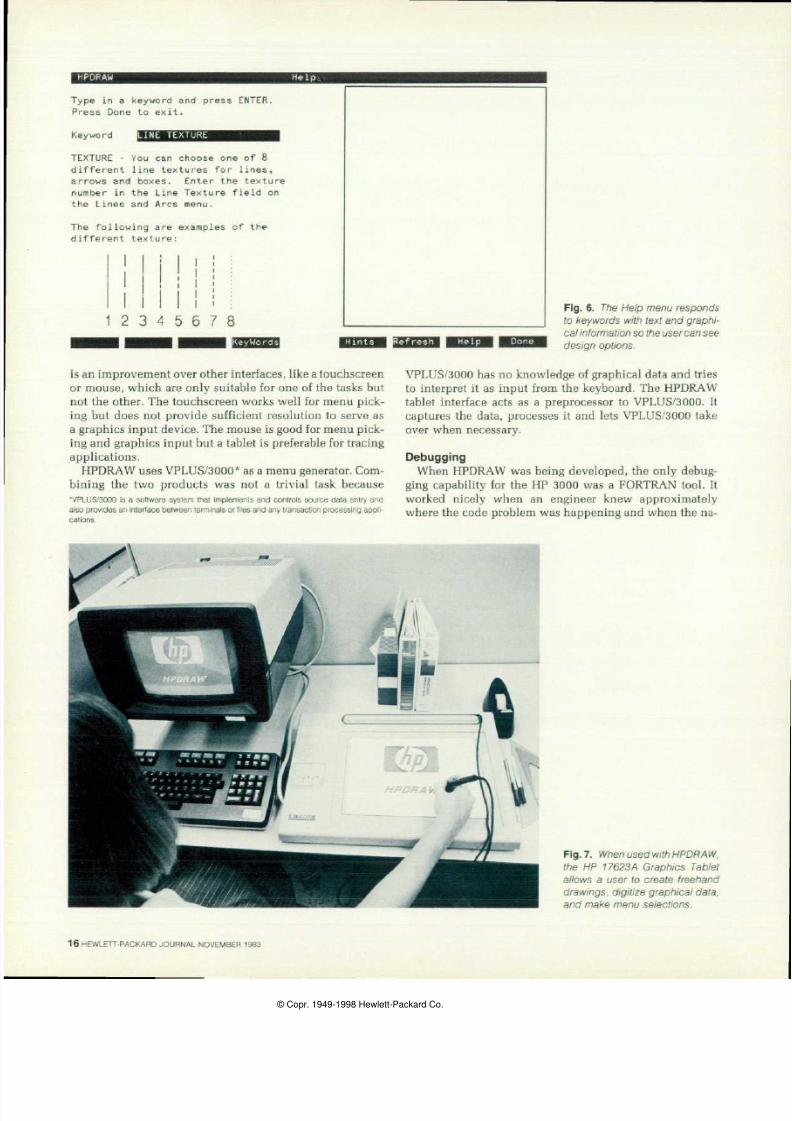
Help Facil i ty
A Help facility is available to give the user information
and answer commonly asked questions. A novel aspect of
this facility is the use of graphics to illustrate options
and convey information. A user is presented with visual
F i g . 4 . T h e t e x t m e n u p e r m i t s
t h e u s e r t o a d d a n n o t a t i o n s t o
a drawing.
examples of font styles, line textures Fig. 6), and other
options so the computer graphics designer can actually see
the capabilities of the medium. The Help facility is or
ganized much like an index in a reference manual. Users
can look at a list of topics both global and local to the last
used menu) and receive information about the topic by
entering a keyword on the Help menu.
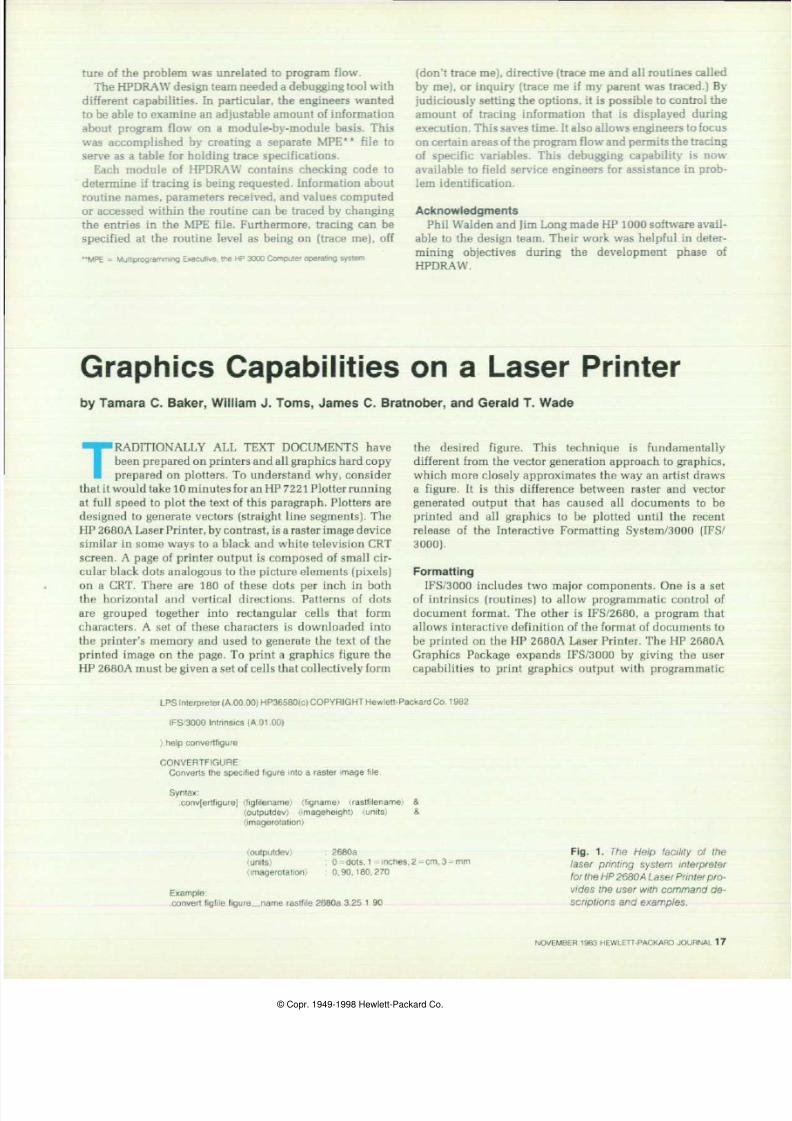
Graphics Tablet
One of the special capabilities of HPDRAW is support
of the 17623A Graphics Tablet on the HP 2623A and HP
2627A Terminals. With this device, the user can track the
cursor by moving the stylus across the tablet instead of
using the four cursor movement keys on the keyboard. To
use the tablet as a graphics input device, the user moves
the cursor to the desired location and presses the stylus
down. It is an easy and natural way for a person to select
a location.
The tablet is also capable of transferring continuous coor
dinate data from a sketch Fig. 7). A digitization facility
allows the user to trace a sketch and convert it into a figure
file. The figure can then be included on a drawing. This
unusual capability gives users access to custom-designed
figures, logos, and complex decorative features.
The tablet interface technology used in HPDRAW for
cursor tracking and tracing and/or menu picking functions
Cursor Cursor
Rubberband Line
Outline of
the Figure
to Be
Scaled
a)
Rubberband Line
Outline of
the Figure
to Be
Rotated
b)
Reference Arrow
Fig. 5. Examples of graphic man
i p u l a t i o n s o n t h e f i g u r e s c a l i n g
and rotation menus, a) Visual sca -
ing of a f igure is accomplished by
expanding or contract ing the rub
berband line, b) The angular place
ment of the rubberband l ine f rom
the re fe rence a r row de te rmines
the rotation of the outl ined f igure.
NOVEMBER 1983 HEWLETT PACKARD JOURNAL 15
© Copr 1949 1998 Hewlett Packard Co
7/24/2019 1983-11_HP Journal Papers
http://slidepdf.com/reader/full/1983-11hp-journal-papers 16/32
Type in a keyword and press ENTER.
Press Done to exit.
Keyword LINE TEXTURE
TEXTURE - You can choose one of 8
different line textures for lines
arrows and boxes. Enter the texture
number in the Line Texture field on
the Lines and Arcs menu.
The following are examples of the
different texture:
I I
1 2 3 4 5 6 7 8
Fig . 6 . The He lp menu responds
to keywords wi th text and graphi
cal information so the user can see
design options.
is an improvement over other interfaces like a touchscreen
or mouse which are only suitable for one of the tasks but
not the other. The touchscreen works well for menu pick
ing but does not provide sufficient resolution to serve as
a graphics input device. The mouse is good for menu pick
ing and graphics input but a tablet is preferable for tracing
applications.
HPDRAW uses VPLUS/3000 as a menu generator. Com
bining the two products was not a trivial task because
VPLUS/3000 is a software system that implements and contro ls source data entry and
also transaction an interface between terminals or files and any tr ansaction processing appli
cations.
VPLUS/3000 has no knowledge of graphical data and tries
to interpret it as input from the keyboard. The HPDRAW
tablet interface acts as a preprocessor to VPLUS/3000. It
captures the data processes it and lets VPLUS/3000 take
over when necessary.
ebugging
When HPDRAW was being developed the only debug
ging capability for the HP 3000 was a FORTRAN tool. It
worked nicely when an engineer knew approximately
where the code problem was happening and when the na-
Fig.7. When used with HPDRAW
the HP 17623 A Graph ics Tab le t
a l lows a user to create f reehand
drawings d ig i t ize graphical data
and make menu select ions.
1 6 HEWLETT-PACKARD JOURNAL NOVEMBER 1983
© Copr 1949 1998 Hewlett Packard Co
7/24/2019 1983-11_HP Journal Papers
http://slidepdf.com/reader/full/1983-11hp-journal-papers 17/32
ture of the problem was unrelated to program flow.
The HPDRAW design team needed a debugging tool with
different capabilities. In particular, the engineers wanted
to be able to examine an adjustable amount of information
about program flow on a module-by-module basis. This
was accomplished by creating a separate MPE file to
serve as a table for holding trace specifications.
Each module of HPDRAW contains checking code to
determine if tracing is being requested. Information about
routine names, parameters received, and values computed
or accessed within the routine can be traced by changing
the entries in the MPE file. Furthermore, tracing can be
specified at the routine level as being on (trace me), off
M P E = M u l t i p rogram m ing E xecu t i ve , t he H P 3000 C om puter opera t i ng sys tem
(don t trace me), directive (trace me and all routines called
by me), or inquiry (trace me if my parent was traced.) By
judiciously setting the options, it is possible to control the
amount of tracing information that is displayed during
execution. This saves time. It also allows engineers to focus
on certain areas of the program flow and permits the tracing
of specific variables. This debugging capability is now
available to field service engineers for assistance in prob
lem identification.
Acknowledgments
Phil Walden and Jim Long made HP 1000 software avail
able to the design team. Their work was helpful in deter
mining objectives during the development phase of
HPDRAW.
Graphics Capabilities on a Laser Printer
by Támara C. Baker Wi l l iam J. Toms James C. Bratnober and Gerald T. Wade
TRADITIONALLY ALL TEXT DOCUMENTS have
been prepared on printers and all graphics hard copy
prepared on plotters. To understand why, consider
that it would take 10 minutes for an HP 7221 Plotter running
at full speed to plot the text of this paragraph. Plotters are
designed to generate vectors (straight line segments). The
HP 2680A Laser Printer, by contrast, is a raster image device
similar in some ways to a black and white television CRT
screen. A page of printer output is composed of small cir
cular black dots analogous to the picture elements (pixels)
on a CRT. There are 180 of these dots per inch in both
the horizontal and vertical directions. Patterns of dots
are grouped together into rectangular cells that form
characters. A set of these characters is downloaded into
the printer s memory and used to generate the text of the
printed image on the page. To print a graphics figure the
HP 2680A must be given a set of cells that collectively form
the desired figure. This technique is fundamentally
different from the vector generation approach to graphics,
which more closely approximates the way an artist draws
a figure. It is this difference between raster and vector
generated output that has caused all documents to be
printed and all graphics to be plotted until the recent
release of the Interactive Formatting System/3000 (IFS/
3000).
Formatting
IFS/3000 includes two major components. One is a set
of intrinsics (routines) to allow programmatic control of
document format. The other is IFS/2680, a program that
allows interactive definition of the format of documents to
be printed on the HP 2680A Laser Printer. The HP 2680A
Graphics Package expands IFS/3000 by giving the user
capabilities to print graphics output with programmatic
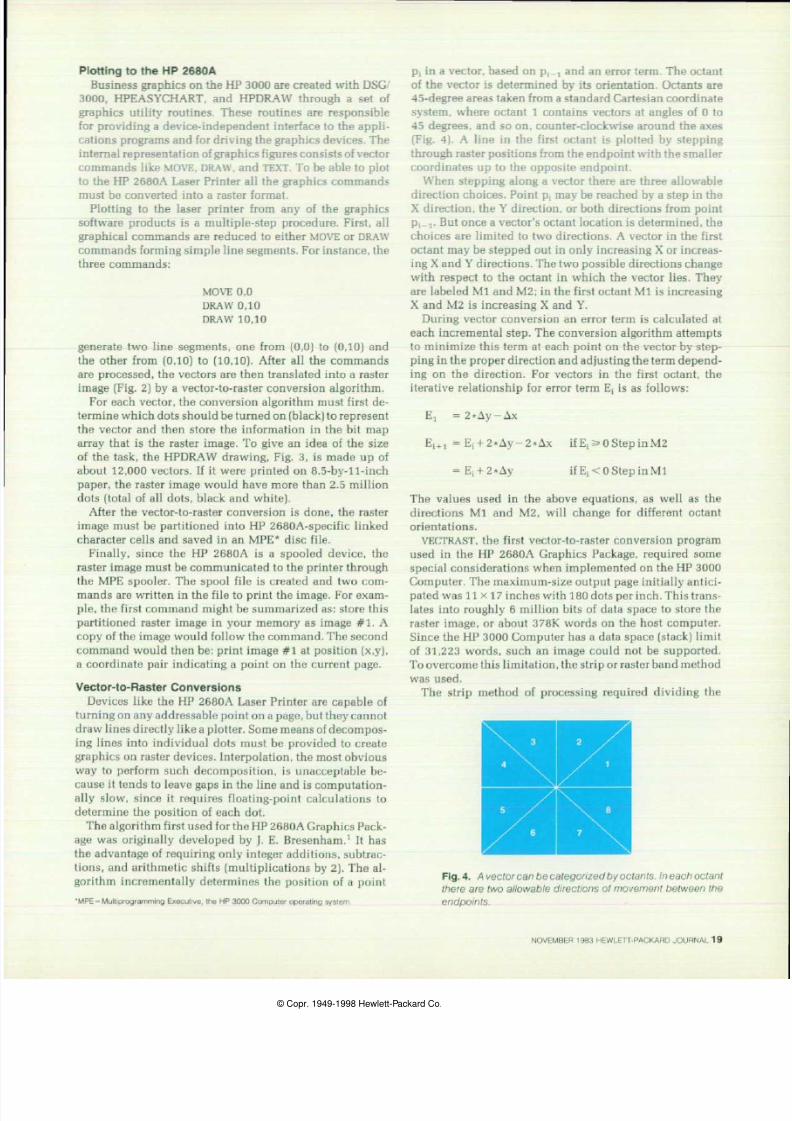
LPS Interpreter (A.00.00) HP36580(c) COPYRIGHT Hewlett-Packard Co. 1 982
IFS/3000 Intrinsics (A.01 .00)
i. help convertfigure
CONVERTFIGURE:
Converts the speci f ied f igure into a raster image f i le.
Syntax:
. c onv [e r t f i gu re ] ( f i g f i l ename) ( f i gname) ( ras t f l l ename) &
(ou tpu tdev ) ( i magehe i gh t ) (un i t s )
(¡magerotation)
' o u t p u t d e v ) : 2 6 8 0 a
 « u n i t s . : 0 = d o t s , 1 = i n c h e s , 2 = c m , 3 = m m
' i m a g e r o t a t i o n ) : 0 , 9 0 , 1 8 0 . 2 7 0
Example:
.convert f igf i le f igure name rastf i le 2680a 3.25 1 90
F i g 1 Th e H e l p f a c i l i t y o f t h e
laser p r in t ing sys tem in te rp re te r
for the HP 2680 A Laser Printer pro
v ides the user w i th command de
scr ipt ions and examples
NOVEMBER 1983 HEWLETT-PACKARD JOURNAL 17
© Copr 1949 1998 Hewlett Packard Co

7/24/2019 1983-11_HP Journal Papers
http://slidepdf.com/reader/full/1983-11hp-journal-papers 18/32
intrinsics or through the laser printing system interpreter.
To print graphics on the HP 2680A Laser Printer,
graphical information from a figure file must be converted
to a raster image and stored in a raster image file. Then the
user loads a copy of the raster image into the memory of
the HP 2680A and issues a print command to place the
graphics on the page. The seven new graphics intrinsics
that add this capability are:
PCONVERTFIGURE converts a figure in a figure file to a
raster image. Since it is much faster to
print a raster image than a figure,
PCONVERTFIGURE can be used to ready
the graphics, possibly during off hours,
for printing later.
PLOADRASTER loads an existing raster image into the
HP 2680A memory. Once a raster image
has been created with PCONVERTFIGURE,
it must be loaded into the printer before
it can be printed.
PPRINTRASTER prints a raster image that is loaded in the
HP 2 680 A memory on the current page.
PDELETERASTER deletes a raster image from the HP
2680A memory. The HP 2680A can hold
no more than 32 raster images at one
time in its memory. PDELETERASTER is
used to make room for more images.
PFLASHRASTER loads an existing raster image into the
HP 2680A memory, prints it on the cur
rent page, and deletes the raster image
from the HP 2680A memory. To make
one print of a raster image, the user can
combine the three steps PLOADRASTER,
PPRINTRASTER, and PDELETERASTER in
this intrinsic.
PPRINTFIGUKE takes a figure in a figure file, converts it
if necessary, then loads it and prints it.
The conversion decision is based on
whether there is an existing raster image
of the right size and orientation, and
whether the figure has been modified
since the raster image s creation. All
the previous intrinsics are low-level;
they provide direct access to printer
features. PPRINTFIGURE, on the other
hand, combines low-level features with
some printer memory management and
conversion optimization. This intrinsic
is used by TDP/3000 and HPWORD.
PFIGUREINFO returns the size, creation date, and
other information about figures and
raster images.
These intrinsics provide a flexible way of printing figures
and the ability to store several raster images in printer
memory. The HP 2680A can be configured with up to two
megabytes of memory. This large amount of storage can be
used to eliminate the repeated loading time, of a raster
image if it will be printed more than once in a job.
The laser printing system (LPS) interpreter provides a
nonprogrammatic interface to most of the IFS/3000 intrin-
1 180 inch
b)
F ig . 2 . The HP 2680A Graph ics Package uses a vector - to -
raster conversion algor i thm to simulate convent ional graphic
vectors a) wi th pr inted raster images b).
sics and gives the user access to the features of the HP
2680A through commands embedded in a text file or en
tered interactively on a line-by-line basis. If the interactive
mode is used, the user receives an error message whenever
a command is entered incorrectly. The user also has the
benefit of an interactive Help facility (Fig. 1), which lists
each command with an example. A description of the com
mand and its parameters appears with the examples. These
commands allow the user to control such things as the
character font or form being printed, the creation and place
ment of raster images, or the location and orientation of
printing. The user can print data in a form using named
fields and can also merge text and graphics at print time.
The LPS interpreter sends the text file to the HP 2680A
and executes formatting commands by calling IFS/3000
intrinsics.
N e w P l a n t S a f e t y R u l e s
Cal l your O f f i ce Coord ina to r
ex t . 292 fo r de ta i l s
And remember . . .
i n C lass i f i ed Areas
H E W L E T T
P A C K A R D
F i g . 3 . T h i s H P D R A W d r a w i n g c o n t a i n s 1 2 , 0 0 0 v e c t o r s ,
which would t ranslate to 2.5 mi l l ion dots i f the raster image
were pr inted on 8.5 x 11 - inch paper.
18 HEW LETT-PACKARD JO URNAL NO VEM BER 1983
© Copr. 1949-1998 Hewlett-Packard Co.
7/24/2019 1983-11_HP Journal Papers
http://slidepdf.com/reader/full/1983-11hp-journal-papers 19/32
Plo t t ing t o t he HP 2680A
Business graphics on the HP 3000 are created with DSG
3000, HPEASYCHART, and HPDRAW through a set of
graphics utility routines. These routines are responsible
for providing a device-independent interface to the appli
cations programs and for driving the graphics devices. The
internal representation of graphics figures consists of vector
commands like MOVE, DRAW, and TEXT. To be able to plot
to the HP 2680A Laser Printer all the graphics commands
must be converted into a raster format.
Plotting to the laser printer from any of the graphics
software products is a multiple-step procedure. First, all
graphical commands are reduced to either MOVE or DRAW
commands forming simple line segments. For instance, the
three commands:
MOVE 0 0
DRAW 0,10
DRAW 10 10
generate two line segments, one from (0,0) to (0,10) and
the other from (0,10) to (10,10). After all the commands
are processed, the vectors are then translated into a raster
image (Fig. 2) by a vector-to-raster conversion algorithm.
For each vector, the conversion algorithm must first de
termine which dots should be turned on (black) to represent
the vector and then store the information in the bit map
array that is the raster image. To give an idea of the size
of the task, the HPDRAW drawing, Fig. 3, is made up of
about 12,000 vectors. If it were printed on 8.5-by-ll-inch
paper, the raster image would have more than 2.5 million
dots (total of all dots, black and white).
After the vector-to-raster conversion is done, the raster
image must be partitioned into HP 2680A-specific linked
character cells and saved in an MPE disc file.
Finally, since the HP 2680A is a spooled device, the
raster image must be communicated to the printer through
the MPE spooler. The spool file is created and two com
mands are written in the file to print the image. For exam
ple, the first command might be summarized as: store this
partitioned raster image in your memory as image #1. A
copy of the image would follow the command. The second
command would then be: print image #1 at position (x,y),
a coordinate pair indicating a point on the current page.
Vector to Raster Conversions
Devices like the HP 2680A Laser Printer are capable of
turning on any addressable point on a page, but they cannot
draw lines directly like a plotter. Some means of decompos
ing lines into individual dots must be provided to create
graphics on raster devices. Interpolation, the most obvious
way to perform such decomposition, is unacceptable be
cause it tends to leave gaps in the line and is computation
ally slow, since it requires floating-point calculations to
determine the position of each dot.
The algorithm first used for the HP 2680A Graphics Pack
age was originally developed by J. E. Bresenham.1 It has
the advantage of requiring only integer additions, subtrac
tions, and arithmetic shifts (multiplications by 2). The al
gorithm incrementally determines the position of a point
•MPE = Multiprogramming Executive the HP 3000 Computer operating system.
Pi in a vector, based on p¡_] and an error term. The octant
of the vector is determined by its orientation. Octants are
45-degree areas taken from a standard Cartesian coordinate
system, where octant 1 contains vectors at angles of 0 to
45 degrees, and so on, counter-clockwise around the axes
(Fig. 4). A line in the first octant is plotted by stepping
through raster positions from the endpoint with the smaller
coordinates up to the opposite endpoint.
When stepping along a vector there are three allowable
direction choices. Point p¡ may be reached by a step in the
X direction, the Y direction, or both directions from point
PÃ-J. But once a vector's octant location is determined, the
choices are limited to two directions. A vector in the first
octant may be stepped out in only increasing X or increas
ing X and Y directions. The two possible directions change
with respect to the octant in which the vector lies. They
are labeled Ml and M2; in the first octant Ml is increasing
X and M2 is increasing X and Y.
During vector conversion an error term is calculated at
each incremental step. The conversion algorithm attempts
to minimize this term at each point on the vector by step
ping in the proper direction and adjusting the term depend
ing on the direction. For vectors in the first octant, the
iterative relationship for error term E¡ is as follows:
E = 2 * A y - A x
Ei+1 =E¡ + 2*Ay-2*Ax if E¡ 2= 0 Step in M2
= E¡ + 2*Ay
ifE¡<OStepinMl
The values used in the above equations, as well as the
directions Ml and M2, will change for different octant
orientations.
VECTRAST, the first vector-to-raster conversion program
used in the HP 2680A Graphics Package, required some
special considerations when implemented on the HP 3000
Computer. The maximum-size output page initially antici
pated was 11X17 inches with 1 80 dots per inch. This trans
lates into roughly 6 million bits of data space to store the
raster image, or about 378K words on the host computer.
Since the HP 3000 Computer has a data space (stack) limit
of 31,223 words, such an image could not be supported.
To overcome this limitation, the strip or raster band method
was used.
The strip method of processing required dividing the
Fig 4 A vector can be categor ized by octants Ineachoctant
there are two a l lowable d irect ions of movement between the
endpoints
NOVEMBER 1983 HEWLETT-PACKARD JOURNAL 19
© Copr 1949 1998 Hewlett Packard Co
7/24/2019 1983-11_HP Journal Papers
http://slidepdf.com/reader/full/1983-11hp-journal-papers 20/32
raster image into strips of a size that would fit into available
memory. Each strip was processed only once, then all vec
tor portions falling within the strip were plotted. Since the
input vectors were not sequenced in the same order as the
strip processing, some type of processing hierarchy had to
be imposed. For the first release, a scheme based on sorting
the input was developed.
Vectors received from the input file were sorted accord
ing to the smallest Y component of their endpoints. These
vectors were then input and plotted in the current raster
band. If a vector continued out of the strip, it was placed
in a list for processing in the next raster band along with
the coordinates of the last point plotted in the previous
band. This scheme had the advantage of being useful for
any image size. The complexity of the drawing was gov
erned by how large the active vector list grew. As the draw
ing of each vector on the list was completed, the space it
occupied on the vector list was removed and returned to
the free area.
Data space limitations caused the VECTRAST program to
be run as a separate process. On the HP 3000, each process
is given its own maximum 31 ,223-word limit of stack space.
If the subsystem is not spawned separately, its data area
is decreased by the amount used by its callers.
Conversion Refinements
The Bucket Brigade is the name of the conversion
technique used to improve the VECTRAST program; it de
creases the time spent sorting vectors and simplifies Bre-
senham s conversion algorithm without significant loss of
accuracy in the placement of dots.
To produce an arbitrary-size raster image with limited
data space, a conversion method must sort the input vec
tors, divide the raster image into bands, and finally convert
each band, one at a time. The Bucket Brigade technique
reduces the time spent in vector sorting without increasing
the time spent in conversion. The method is based on the
observation that input vectors need to be sorted into sepa
rate bands, but not sorted within each band. The Bucket
Brigade eliminates the full sort of input vectors, replacing
it with a specialized two-phase bucket sort.
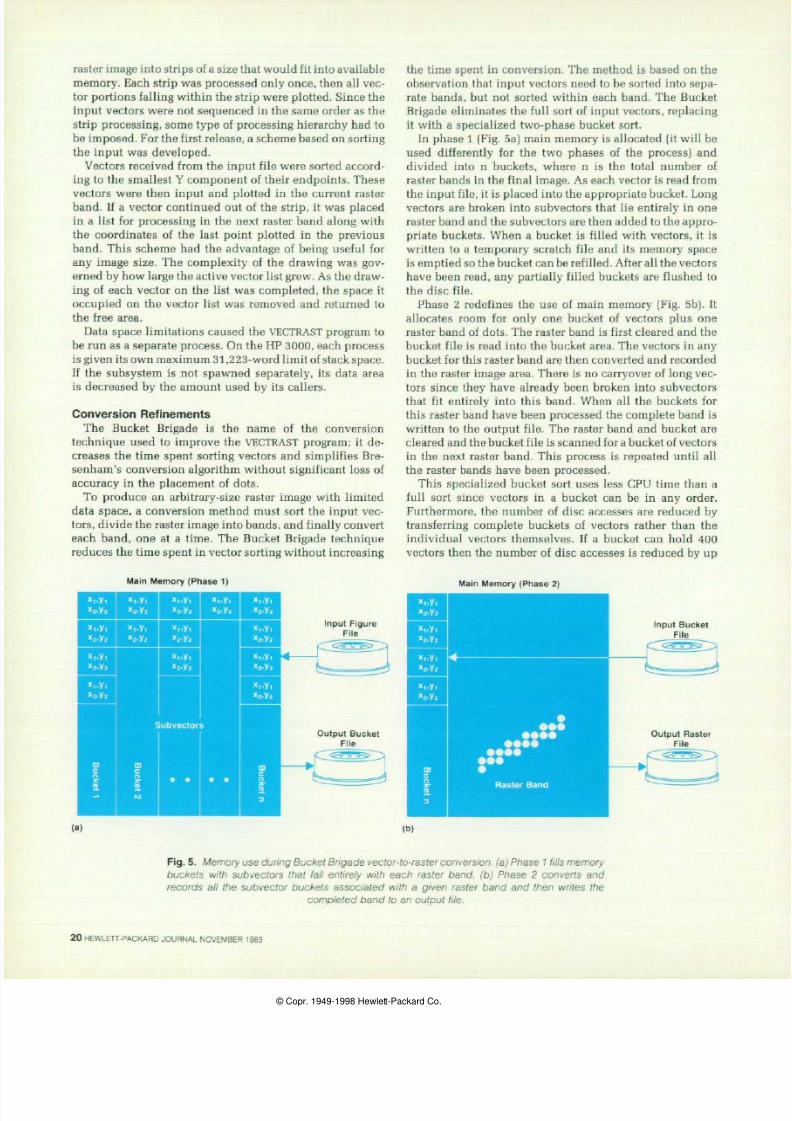
In phase 1 (Fig. 5a) main memory is allocated (it will be
used differently for the two phases of the process) and
divided into n buckets, where n is the total number of
raster bands in the final image. As each vector is read from
the input file, it is placed into the appropriate bucket. Long
vectors are broken into subvectors that lie entirely in one
raster band and the subvectors are then added to the appro
priate buckets. When a bucket is filled with vectors, it is
written to a temporary scratch file and its memory space
is emptied so the bucket can be refilled. After all the vectors
have been read, any partially filled buckets are flushed to
the disc file.
Phase 2 redefines the use of main memory (Fig. 5b). It
allocates room for only one bucket of vectors plus one
raster band of dots. The raster band is first cleared and the
bucket file is read into the bucket area. The vectors in any
bucket for this raster band are then converted and recorded
in the raster image area. There is no carryover of long vec
tors since they have already been broken into subvectors
that fit entirely into this band. When all the buckets for
this raster band have been processed the complete band is
written to the output file. The raster band and bucket are
cleared and the bucket file is scanned for a bucket of vectors
in the next raster band. This process is repeated until all
the raster bands have been processed.
This specialized bucket sort uses less CPU time than a
full sort since vectors in a bucket can be in any order.
Furthermore, the number of disc accesses are reduced by
transferring complete buckets of vectors rather than the
individual vectors themselves. If a bucket can hold 400
vectors then the number of disc accesses is reduced by up
Main Memory Phase 1)
Main Memory Phase 2)
F ig . 5 . f i l l s use dur ing Bucket B r igade vector - to - ras ter convers ion , a ) Phase 1 f i l l s memory
b u cke t s a n d su b ve c t o r s t h a t f a l l e nt i r e l y w i t h e a ch ra s t e r b a n d , b ) P h a se 2 co n ve r t s a n d
records the the subvector buckets assoc ia ted w i th a g iven raster band and then wr i t es the
completed band to an output f i le.
20 HEWLETT PACKARD JOURNAL NOVEMBER 1983
© Copr. 1949-1998 Hewlett-Packard Co.
7/24/2019 1983-11_HP Journal Papers
http://slidepdf.com/reader/full/1983-11hp-journal-papers 21/32
V E C T O R T O R A S T E R C O N V E R S I O N
R e d u c t i o n  » I n S y c t e n R e t o u r e e d t i g e
Ct«e 2
2 8 3 8 2 v e c t o r s
100
M
P e r c e n t a g e s u s e d b y t h e n e w V E C T R A S T u c o m p e r e d t o t h e o r i g l n e J V E C T R A S T .
4 0
2 0
CPU Time Elapsed Time Dlac lO a
Disc Spice
Resource
Cs s e 1 Is « n a v e r a g e o f DSG p ie s n d b t r p lo ts . C ts e 2 I s s b u s y HPDRAW p lo t .
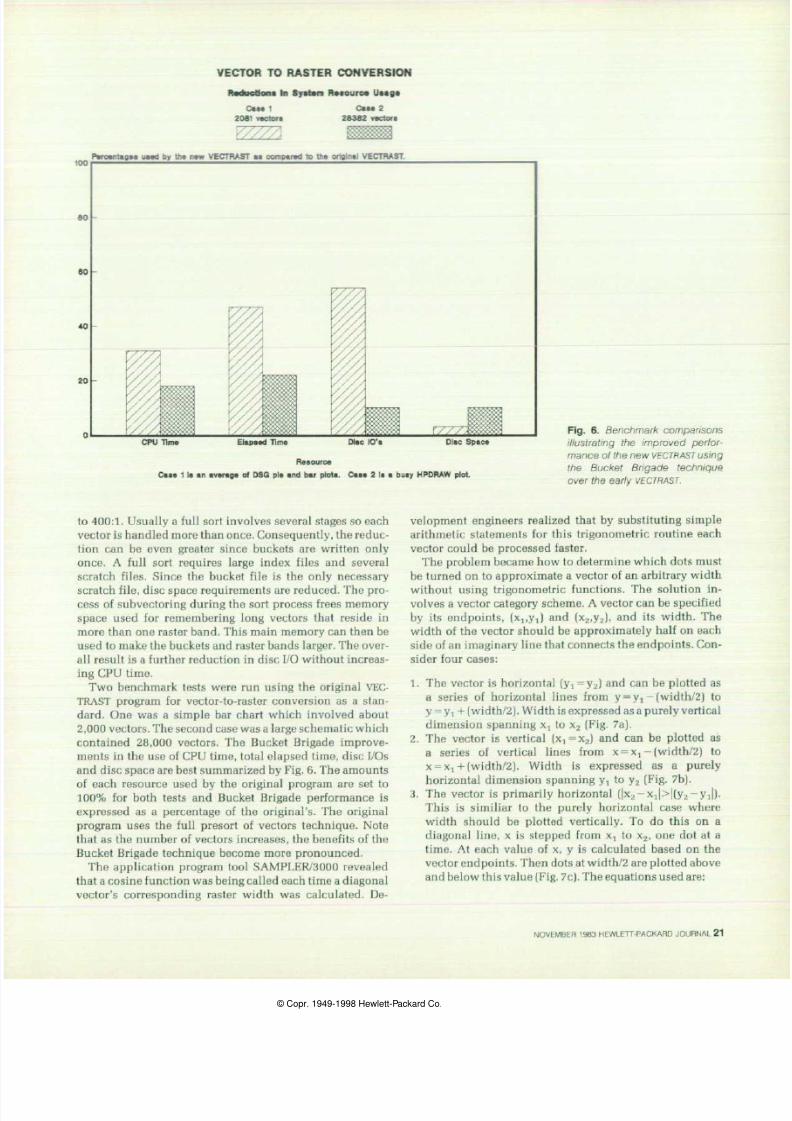
Fig 6 Benchm ark compar isons
i l l u s t r a t i n g t h e i mp r o v e d p e r f o r
mance of the new VECTRAST using
t h e B u c k e t B r i g a d e t e c h n i q u e
over the early VECTRAST
to 400:1. Usually a full sort involves several stages so each
vector is handled more than once. Consequently, the reduc
tion can be even greater since buckets are written only
once. A full sort requires large index files and several
scratch files. Since the bucket file is the only necessary
scratch file, disc space requirements are reduced. The pro
cess of subvectoring during the sort process frees memory
space used for remembering long vectors that reside in
more than one raster band. This main memory can then be
used to make the buckets and raster bands larger. The over
all result is a further reduction in disc I/O without increas
ing CPU time.
Two benchmark tests were run using the original VEC
TRAST program for vector-to-raster conversion as a stan
dard. One was a simple bar chart which involved about
2,000 vectors. The second case was a large schematic which
contained 28,000 vectors. The Bucket Brigade improve
ments in the use of CPU time, total elapsed time, disc I/Os
and disc space are best summarized by Fig. 6. The amounts
of each resource used by the original program are set to
100 for both tests and Bucket Brigade performance is
expressed as a percentage of the original's. The original
program uses the full presort of vectors technique. Note
that as the number of vectors increases, the benefits of the
Bucket Brigade technique become more pronounced.
The application program tool SAMPLER/3000 revealed
that a cosine function was being called each time a diagonal
vector's corresponding raster width was calculated. De
velopment engineers realized that by substituting simple
arithmetic statements for this trigonometric routine each
vector could be processed faster.
The problem became how to determine which dots must
be turned on to approximate a vector of an arbitrary width
without using trigonometric functions. The solution in
volves a vector category scheme. A vector can be specified
by its endpoints, (xj.yj) and (x2,y2), and its width. The
width of the vector should be approximately half on each
side of an imaginary line that connects the endpoints. Con
sider four cases:
1. The vector is horizontal (yi = y2) and can be plotted as
a series of horizontal lines from y = yt — (width/2) to
y = Yi + (width/2) . Width is expressed as a purely vertical
dimension spanning Xj to x2 (Fig. 7a).
2. The vector is vertical (x1=x2) and can be plotted as
a series of vertical lines from x = x1 — (width/2) to
x = xt + (width/2). Width is expressed as a purely
horizontal dimension spanning y-¡ to y2 (Fig. 7b).
3. The vector is primarily horizontal (|x2-x., >|(y2 — Yi|)-
This is similiar to the purely horizontal case where
width should be plotted vertically. To do this on a
diagonal line, x is stepped from xt to X2, one dot at a
time. At each value of x, y is calculated based on the
vector endpoints. Then dots at width/2 are plotted above
and below this value (Fig. 7c). The equations used are:
NOVEMBER 1983 HEWLETT PACKARD JOURNAL 21
© Copr 1949 1998 Hewlett Packard Co

7/24/2019 1983-11_HP Journal Papers
http://slidepdf.com/reader/full/1983-11hp-journal-papers 22/32
The slope of a line is m=(y2 — yi)/x2-xa)
The Y intercept is b = ya - (m*x1)
For any x, y = m*x + b
4. The vector is primarily vertical (|x2 — x1|«|y2 — y.,|). This
is similiar to the purely vertical case where width should
be plotted horizontally Values of y are stepped from y^
to y 2, one dot at a time. At each value of y, x is calculated,
and the points at width/2 to the left and right of this
value are plotted {Fig. 7d). The equations used are:
The slope of a line is m = (y2 — yi)/(x2 — xj
The Y intercept is b^y^ — (m*xa)
For any y, x = (y — b)/m
This technique eliminates all calls to trigonometric func
tions and their associated overhead. Only simple arithmetic
calculations are used. Bresenham's original algorithm
achieves greater accuracy, limited by the dot or pixel res
olution. This simpler algorithm produces comparable re
sults but uses significantly less CPU time.
The benchmark results in Fig. 6 were produced using
the arithmetically simplified replacement of the Bre-
senham algorithm. The new VECTRAST on the HP 3000
Computer can handle conversion of approximately two
billion vectors into a raster image of over 95 million pixels.
On the HP 2680A Laser Printer this translates into a plot
11 inches wide and over 22 feet long. It does this using
only 40,000 bytes of main memory.
Algorithm refinements and the Bucket Brigade technique
were incorporated into a new VECTRAST program that ex
tends a system's range of image processing and makes vec
tor-to-raster conversions with a significant reduction in all
system resource use with no loss of functionality.
Acknowledgments
Major contributions to the HP 2680A Graphics package
were made by Jim Stratton. The project was a coordinated
effort of several software project teams. We had almost
daily contact with other groups from the Information Sys
tems lab in Cupertino and the TDP/3000 project in
Horizontal
Vertical
b)
Mostly Horizontal
Width
Mostly Vertical
c)
Step x from x, to x2
y = m x + b
d ) W i d t h
Step y f rom y , to y2
x = y - b ) / m
m= y2-y , ) / x2-x , )
b=y1-mx,
Fig. 7. Vector width calculat ions are simpl i f ied by ident i fy ing
direct ions: a hor izontal b vert ical c pr imari ly hor izontal d
primari ly vert ical.
Pinewood, England. By far the most outside communica
tion occurred with our colleagues in the Boise Division
where the HP 2680A Laser Printer is manufactured. New
firmware was developed and tested in Boise to allow
graphics to be printed on the laser printer. They also wrote
the initial vector-to-raster conversion program based on
Bresenham's algorithm.
Reference
1. J.E. Bresenham, Algorithm for Computer Control of a Digital
Plotter, IBM Systems journal, Vol. 4, no. 1, 1965.
22 HEWLETT PACKARD JOURNAL NOVEMBER 1983
© Copr. 1949-1998 Hewlett-Packard Co.

7/24/2019 1983-11_HP Journal Papers
http://slidepdf.com/reader/full/1983-11hp-journal-papers 23/32
Special Report
The Center for Integrated Systems
Hewlett Packard is helping to launch a new research facility
at Stanford — and a new approach to industry university
relations in the U.S.A.
by Frederick H Gardner
THERE WAS A GROUNDBREAKING at Stanford Uni
versity last May 19. Its purpose was to celebrate
more than the construction of a $14 million building
that will house the Center for Integrated Systems (CIS).
The speakers and guests were really saluting a new willing
ness on the part of major U.S. industrial companies and
the academic community to conduct their basic research
cooperatively. William Hewlett stressed the broadest impli
cations in his keynote speech: CIS is a clear and distinct
answer to three of the major problems that face the United
States — the failure of our national programs of basic re
search to keep pace with the needs of our universities and
industries, the need to strengthen our system of education,
and the challenge to U.S. trade and technology posed by
foreign countries.
What answer does CIS provide and why does Hewlett-
Packard consider it so important that President John Young
and Vice-President for Research John Doyle have, during
the last four years, devoted considerable time and energy
to helping it get established?
CIS is a new teaching and research institution on the
Stanford campus, funded in large part by a group of 19
high-technology companies, each of which will have a rep
resentative working there full time. As its name implies,
the Center defines integrated systems as a primary field of
study — encompassing computer science, integrated circuit
engineering, solid state physics, and other disciplines —
and brings together investigators who have traditionally
operated in separate settings — the hardware and software
people on the faculty, and scientists from competing indus
trial companies such as HP, IBM, and Texas Instruments.
CIS will train 100 Masters and 30 PhD candidates a year,
conduct research on every aspect of the semiconductor/
computer systems relationship, and produce materials to
serve the ongoing educational needs of engineers in private
industry. The new building and some CIS research is being
funded by the sponsoring companies. Various agencies of
the United States Government will underwrite most of the
equipment and research. The Commerce Department has
recently revised its antitrust policies to sanction the collec
tive basic research efforts of competing private-sector com
panies.
How i t Began
The idea for such a center was being discussed as early
as 1977 by a number of professors at the Stanford School
of Engineering, notably John Linvill, James Meindl and
James Gibbons. We perceived, Linvill explains, that
integrated circuit design was by its nature interdiscipli
nary. You can't design custom integrated circuits without
knowing a lot about computer systems — or having a co-
worker who does. We also perceived that, given a diminu
tion of Federal support for research, we would need a strong
collaboration with industry to build a state-of-the-art facil
ity for the design and fabrication of VLSI chips. A plan
was developed whereby industrial companies, in return
for sponsoring the center, would be offered facilitated
access to its research program.
Next step for the initiative-taking professors was a meet
ing with William Kays, Dean of the School of Engineering.
Linvill et al stressed that to stay at the forefront in integrated
circuit research, Stanford would need a quick turnaround
laboratory, a facility that would enable computer scientists
to put their ideas directly into silicon and test them. Kays
agreed and urged them to write a formal proposal to submit
to the Adminstration.
President Donald Kennedy of Stanford (who was Provost
at the time) foresaw certain complications. Clearly VLSI
was going to require a new facility, he reflects. But since
it would be too costly to fund in the mode in which we
usually support university research, and since there hasn't
been a line in a U.S. Government budget for that kind of
research facility since 1968, the money almost had to come
from private sources. And that would force us to work out,
in very precise terms, the boundary line between philan
thropy and corporate support of research. How would the
hard questions of 'intellectual property rights' be handled?
Would there be pressure on our faculty to do more applied
and less basic research? Would the sponsors try to restrict
access to the research for proprietary reasons? Could they
accept the openness that characterizes the academic re
search enterprise? How much special access could we offer
the sponsoring companies and still offer a fair degree of
access to everyone? CIS has given us a forward look at
these problems, which will inevitably arise as a conse
quence of consortium or single-corporation support of
major programs. And it has given us a great research facility
that Stanford simply could not have built by any other
means.
By the fall of 1979, two groups still had to be convinced
that CIS deserved their backing: the Stanford Board of Trus
tees and the hoped-for corporate sponsors. It was very
fortunate that we could turn to John Young, says Kennedy,
who at this point asked Young to head the CIS Development
NOVEMBER 1983 HEWLETT PACKARD JOURNAL 23
© Copr 1949-1998 Hewlett-Packard Co

7/24/2019 1983-11_HP Journal Papers
http://slidepdf.com/reader/full/1983-11hp-journal-papers 24/32
F ig . 1 . S tan ford drawings o f t he new home o f t he Center f o r I n tegra ted Systems a t S tan ford
Universi ty. Drawings provided by Erl ich-Rominger, Los A/ tos, Cal i fornia, U.S.A. , Archi tects. )
Committee. He had the foresight to see the significance
of CIS and the thrust to convince both his corporate peers
and the doubters on our Board.
To speed things along, Young, who is himself a Stanford
trustee, assured the Board — before he had begun fund-rais
ing in earnest — that corporate support would be forthcom
ing. On that basis they gave an official go-ahead, and in
January 1980, the Center for Integrated Systems became an
organizational entity with John Linvill as its director, re
porting to an Executive Committee headed by James Gib
bons, and to the Dean of the School of Engineering, William
Kays. James Meindl, director of the Stanford Electronics
Laboratory and the existing Integrated Circuits Laboratory,
was subsequently appointed codirector of CIS.
John Young s V iew o f C IS
What appeals to me most about CIS, says John Young,
is that it represents a new era in possible relationships
between the academic community and industrial com
panies in the pursuit of research. It's important in itself,
and in the long run, it will be much more important as a
model. What's at stake is the technological leadership to
which we owe the very wealth and well-being of our nation.
We've all seen the dramatic effect that the Japanese
have achieved using cooperative research vehicles and
planned technological development. I'm not suggesting
that we emulate any Japanese models, but we should ac
knowledge that cooperation and planning in the basic
phases of research is compatible with vigorous competition
in the marketplace.
Consider the Japanese approach to VLSI. Through their
Ministry of International Trade and Industry they target
microelectronics — just as they did with steel, autos, and
shipbuilding — and agree to pay half or two-thirds of the
basic R&D costs. To get things going they draft people from
various companies — the leading researchers in all the rele
vant fields — and send them someplace to spend the time
and money necessary to define the core elements of a VLSI
research strategy. Then they all go home, taking this shared
knowledge, which is a tremendous boost, and they proceed
to complete vigorously in developing action plans to make
products.
CIS is a version, in our own culture, drawing on our
own institutions, of that kind of cooperative-yet-competi-
tive model. It will enable U.S. electronics companies to
discuss and coordinate our research objectives and to gain
leverage on our expenditures. Even companies as large as
Hewlett-Packard, with half a billion dollars to spend on
R&D every year — and IBM, with much more — sense that
this kind of cooperative effort is going to be necessary for
us to succeed in the competitive international environment
between now and the end of the century. Support for edu
cation isn't altruism on our part; we recognize that without
a substantial research base, we're out of business.
Young cites a number of other strong selling points
for CIS:
• It provides a new bricks-and-mortar facility that will
undoubtedly have a substantial throughput in terms of
good, basic research. Sponsoring companies, through
their resident scientists, will have the earliest possible
access to that research. All CIS findings will also be
made available to the electronics industry through semi
nars and an open publication policy.
• CIS creates a channel for spending money that didn't
exist before. The U.S. Department of Defense has a lot
of R&D money they intend to spend on integrated circuit
development, but at one point there was no appropriate
place to spend it.
• It will give industrial companies a chance to influence
and help direct fundamental research — whereas now the
government gives grants, usually tied to Defense, that
don't always help university researchers focus their ob
jectives in a practical way.
• It will train 30 PhDs and 100 MSs a year — a big incre
ment in the total of available people. Graduate student
recruitment is undoubtedly an important part of the quid
pro quo for the sponsoring companies. Their researchers
in residence are going to have a close look at who the
students are and what they're doing, a chance to evaluate
them and establish rapport. That has to be helpful in the
recruiting process.
• CIS will also produce training materials and videotapes
24 HEWLETT PACKARD JOURNAL NOVEMBER 1983
© Copr. 1949-1998 Hewlett-Packard Co.

7/24/2019 1983-11_HP Journal Papers
http://slidepdf.com/reader/full/1983-11hp-journal-papers 25/32
that can be a great help to the sponsoring organizations.
HP people have made extensive use of tutored videotape
instruction (a technique developed by Gibbons) to take
graduate courses and get advanced degrees from Stan
ford. With the delivery systems improving — satellites
and electronic mail making two-way discussion easier —
we're on the edge of some marvelous advances in off-
campus education of the highest quality."
Raising the oney
The Development Committee that Young headed to raise
funds for CIS included Richard DeLauer, Executive Vice
President at TRW (and now Undersecretary of Defense for
Research and Engineering), George Pake, Vice-President f or
Research at Xerox, and Robert Noyce, Vice Chairman of the
Board at Intel. "We figured out what it would take to put
the facility in place and came up with a budget," Young
recounts. "We thought it would be best to have a small
group of sponsors, 15 or 20 at the most. The question was:
"How many people would it take putting up how much
money to make it happen?" Young also had to make a
tactical decision: how much could he ask the heads of other
companies to commit on their own without triggering time-
consuming internal debates? $750,000 spread out over
three years was the formula he settled on.
Then came the process of putting together prospect lists,
dividing the labor among members of the Development
Committee, and picking up the phone. Young says that
despite his list of selling points for CIS, "The project had
to sell itself through the faculty, through visits, through
the persuasion of an on-site coupling that says 'Okay, this
thing can really work.' '
By March 1981, 10 corporations had agreed to spend
$750,000 each towards the new CIS building: General Elec
tric, Hewlett-Packard, TRW, Northrop, Xerox, Texas Instru
ments, Fairchild, Honeywell, IBM, and Tektronix, signing
on in that order. They have since been joined by DEC, Intel,
ITT, GTE, Motorola, United Technologies, Monsanto,
Gould/AMI, and Philips/Signetics. The sponsors later
agreed that each would contribute $100,000 annually for
education, research, and adminstration.
The Question of Patent Rights
If there was a primary source of reluctance on the part
of the potential sponsors, it centered around unresolved
questions of patent ownership, licensing, and intellectual
property rights. These issues were also of great concern to
Stanford faculty members. (Recall that at the end of the
'70s, patented research in the area of biotechnology had
created several overnight stock market successes.) And in
addition to the sponsoring companies and individual fac
ulty members, the U.S. Government and the university ad
minstration had positions on these matters which the or
ganizers of CIS had to take into account. They found them
selves trying to work out a set of mutually acceptable
policies in what one negotiator calls "a pressure-cooker
atmosphere."
The two men who eventually took responsibility for ham
mering out the rules governing intellectual property rights
were James Gibbons, head of the CIS Executive Committee,
representing the interests of Stanford faculty members, and
John Doyle. Vice-President for Research at Hewlett-Packard
and Chairman of the CIS Sponsors Advisory Committee.
(Before Gibbons and Doyle asserted their leadership the
patent questions were being debated by lawyers. At one
point there was a meeting at Stanford attended by corporate
counsel from the sponsors. It ended, as one might expect,
with the major issues unresolved.)
Gibbons observes: "It was a difficult problem because
these companies don't have a lot of cross licenses with
each other, and they've grown up in an environment where
the belief is that it's your own proprietary technology that
gives you the competitive edge. The idea that one of your
people can invent something that will also be available to
your competitors creates serious problems. So the com
panies' first posture was 'We want exclusive rights to any
thing that's invented in CIS.' And they wanted exclusive
proprietary rights to anything that any of their own people
invented while here, saying, with some justification I sup
pose, that these people had been working for the company
for 10 or 15 years, and all the things they had learned and
the problems they'd been thinking about when they made
these inventions were related to the company, and the com
pany is paying them. Stanford's point of view was, 'You're
building a building, but almost everything that goes on in
that building is paid for with Federal money, and we al
ready have $12 million worth of Federal support, which
is going to grow to $20 million. You put up l/19th of the
money and want rights to everything '
"We finally resolved it by categorizing the patents in
terms of who the inventor was — whether it was a corporate
visiting scholar or a faculty member or a joint effort — and
on the source of funding. In effect, if a Stanford faculty
member invents something solely or jointly, Stanford pat
ent policy applies."
Stanford's policy is unusual in that it entitles a faculty
member or student who comes up with a patentable idea
to own the patent if the work wasn't funded by the govern
ment. (It is common for universities to own the patents on
inventions developed by their faculty members working at
campus facilities.) "So theoretically," Gibbons notes, "a
Stanford faculty member who invents something without
government sponsorship could grant a license to somebody
who wasn't a CIS sponsor — another company, say, even
one in another country — for an invention that was de
veloped at CIS." This was the worst-case scenario that
haunted corporate counsel for the sponsoring companies.
On all government-funded research, however, Stanford
has a legal obligation to make sure that any resulting patents
are brought into the stream of commerce as rapidly as pos
sible. This in effect means that any firm capable of commer
cially developing a patent has a right to bid on it and cannot
be excluded. "Realistically," says Gibbons, summing up
the situation, "since 98% of the work done here is under
government sponsorship, and we're obligated to get it into
the stream of commerce as rapidly as possible, all the spon
soring companies will have a chance to evaluate every
patent and bid if they want a license to develop it. Nobody
is going to get excluded. The sponsors finally realized that,
given Stanford's patent policy and the law of the land gov
erning grants for research, we hardly had any room to bar
gain."
NOVEMBER 1983 HEWLETT PACKARD JOURNAL 25
© Copr. 1949-1998 Hewlett-Packard Co.

7/24/2019 1983-11_HP Journal Papers
http://slidepdf.com/reader/full/1983-11hp-journal-papers 26/32
n Experiment in Mutual Interest
The negotiations may have been thorny, but they have
apparently gone a long way towards instilling competing
companies with a sense of their mutual interest. In addition
to the agreement the CIS sponsors have worked out with
Stanford, they have come up with a cross-licensing plan
whereby they agree to share any inventions developed at
CIS. These aren't agreements that you could get very ex
cited about, says John Doyle wryly, except that they hap
pen to make the whole thing possible. The final arrange
ment is that the faculty get most of what they want, but
there will be a patent advisory council that tries to prevent
an individual faculty member from doing something ab
surd, like licensing something exclusively to a foreign com
pany. I really don't believe that is likely to happen, so we're
not taking a large risk. In any case, because of the basic
nature of the research at CIS, it's unlikely that a highly
commercial mindbending application will come out of it
directly. Whenever the research reaches a point where com
mercial application is foreseen, the ideas will be pursued
back here (at the sponsors' research labs).
We've all had to cut them and shape them a little bit,
says Donald Kennedy, but I think we've come through
with a workable set of policies. There may be respects in
which they turn out in operation to be defective, and we'll
have to fix them, but this is an experiment, after all.
Doyle uses similar terms: CIS is an experiment — as
much a social experiment as a scientific one, actually. What
I'd like to see come out of it is a demonstration of effective
industry-university cooperation that can break down some
of the inefficiencies of research — the unnecessary duplica
tion and secrecy — and that can bring together people from
electrical engineering and integrated circuits and computer
science into a center, to work together under optimal con
ditions and really get some new technology into the stream
of commerce faster, to the benefit of the nation.
Speaking for the Government — and as a businessman in
on the founding of CIS — Richard LeLauer said recently:
In industry we make a forecast, look at the market, figure
out how much the investment is going to be, discount the
cash flow, and if it doesn't match interest rates or what
you can do with something else, forget it. That's terrific
for investors but not very good for getting long-range risky
projects into being. That's the reason we're so enthusiastic
about the Center for Integrated Systems. It's the first time
we really have a partnership.
Early Developments
Primary responsibility for overseeing the development
of the new CIS facility has gone to codirector James Meindl,
who in recent years has built Stanford's 1C lab into a first-
rate facility (it cannot be upgraded, however, to meet the
requirement of VLSI research). Meindl and his co workers
are devising, testing, and building equipment for the new
CIS lab in part under an $8 million, 3-year grant from the
U.S. Defense Advanced Research Projects Agency (ARPA),
to Establish a facility for fabrication of large-scale inte
grated circuits with a turnaround interval of less than 10
working days between a user-generated mask design pro
gram and completion of functionally tested and packaged
CIS P TENT POLICY
Disposition of Rights
1. Stanford takes title and inventor receives nonexclusive, fully paid license including right to sublicense.
2. Upon employers of inventors, Stanford will authorize a petition by inventor's employers to U.S. Government for greater
rights than 1.
26 HEWLETT PACKARD JOURNAL NOVEMBER 1983
© Copr. 1949-1998 Hewlett-Packard Co.
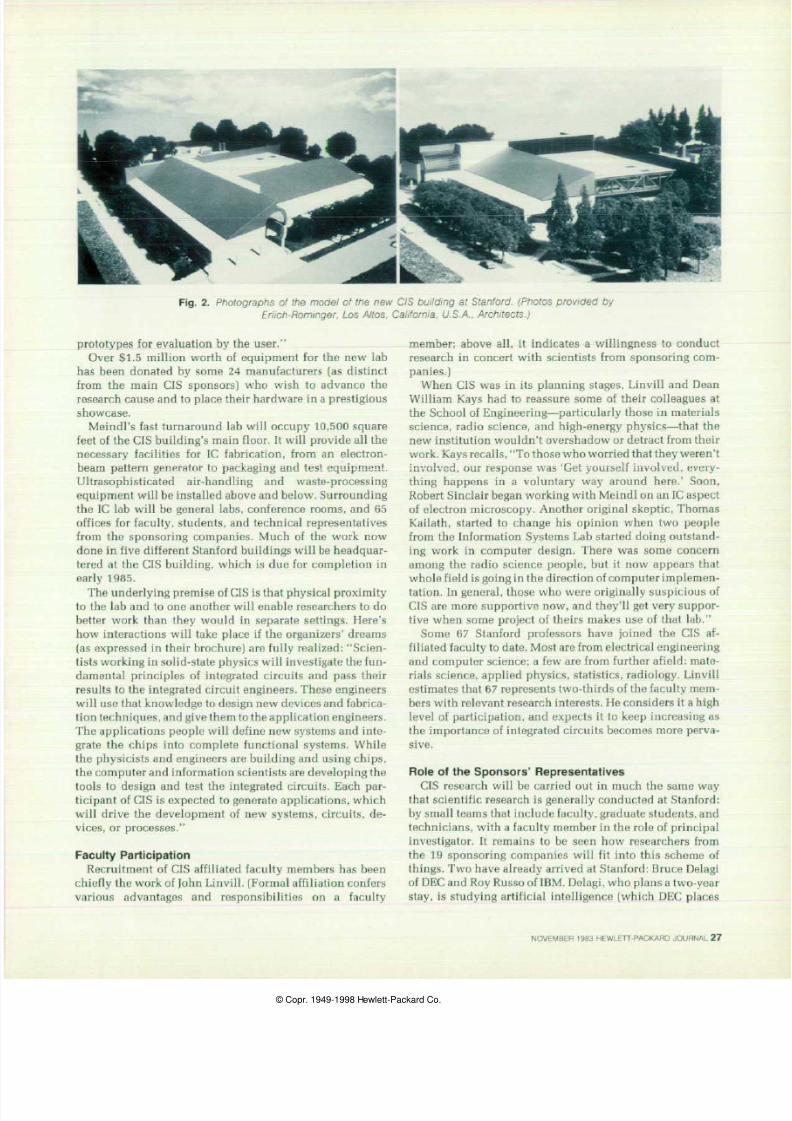
7/24/2019 1983-11_HP Journal Papers
http://slidepdf.com/reader/full/1983-11hp-journal-papers 27/32
F i g . 2 . b y o f t h e m o d e l o f t h e n e w C I S b u i l d i n g a t S t a n f o r d . P h o t o s p r o v i d e d b y
Erl ich-Rominger, Los Al tos, Cal i fornia, U.S.A. , Archi tects. )
prototypes for evaluation by the user.
Over $1.5 million worth of equipment for the new lab
has been donated by some 24 manufacturers (as distinct
from the main CIS sponsors) who wish to advance the
research cause and to place their hardware in a prestigious
showcase.
Meindl's fast turnaround lab will occupy 10,500 square
feet of the CIS building's main floor. It will provide all the
necessary facilities for 1C fabrication, from an electron-
beam pattern generator to packaging and test equipment.
Ultrasophisticated air-handling and waste-processing
equipment will be installed above and below. Surrounding
the 1C lab will be general labs, conference rooms, and 65
offices for faculty, students, and technical representatives
from the sponsoring companies. Much of the work now
done in five different Stanford buildings will be headquar
tered at the CIS building, which is due for completion in
early 1985.
The underlying premise of CIS is that physical proximity
to the lab and to one another will enable researchers to do
better work than they would in separate settings. Here's
how interactions will take place if the organizers' dreams
(as expressed in their brochure) are fully realized: Scien
tists working in solid-state physics will investigate the fun
damental principles of integrated circuits and pass their
results to the integrated circuit engineers. These engineers
will use that knowledge to design new devices and fabrica
tion techniques, and give them to the application engineers.
The applications people will define new systems and inte
grate the chips into complete functional systems. While
the physicists and engineers are building and using chips,
the computer and information scientists are developing the
tools to design and test the integrated circuits. Each par
ticipant of CIS is expected to generate applications, which
will drive the development of new systems, circuits, de
vices, or processes.
Faculty Participation
Recruitment of CIS affiliated faculty members has been
chiefly the work of John Linvill. (Formal affiliation confers
various advantages and responsibilities on a faculty
member; above all, it indicates a willingness to conduct
research in concert with scientists from sponsoring com
panies.)
When CIS was in its planning stages, Linvill and Dean
William Kays had to reassure some of their colleagues at
the School of Engineering — particularly those in materials
science, radio science, and high-energy physics — that the
new institution wouldn't overshadow or detract from their
work. Kays recalls, To those who worried that they weren't
involved, our response was 'Get yourself involved, every
thing happens in a voluntary way around here.' Soon,
Robert Sinclair began working with Meindl on an 1C aspect
of electron microscopy. Another original skeptic, Thomas
Kailath, started to change his opinion when two people
from the Information Systems Lab started doing outstand
ing work in computer design. There was some concern
among the radio science people, but it now appears that
whole field is going in the direction of computer implemen
tation. In general, those who were originally suspicious of
CIS are more supportive now, and they'll get very suppor
tive when some project of theirs makes use of that lab.
Some 67 Stanford professors have joined the CIS af
filiated faculty to date. Most are from electrical engineering
and computer science; a few are from further afield: mate
rials science, applied physics, statistics, radiology. Linvill
estimates that 67 represents two-thirds of the faculty mem
bers with relevant research interests. He considers it a high
level of participation, and expects it to keep increasing as
the importance of integrated circuits becomes more perva-
Role of the Sponsors Representatives
CIS research will be carried out in much the same way
that scientific research is generally conducted at Stanford:
by small teams that include faculty, graduate students, and
technicians, with a faculty member in the role of principal
investigator. It remains to be seen how researchers from
the 19 sponsoring companies will fit into this scheme of
things. Two have already arrived at Stanford: Bruce Delagi
of DEC and Roy Russo of IBM. Delagi, who plans a two-year
stay, is studying artificial intelligence (which DEC places
NOVEMBER 1983 HEWLETT PACKARD JOURNAL 27
© Copr. 1949-1998 Hewlett-Packard Co.
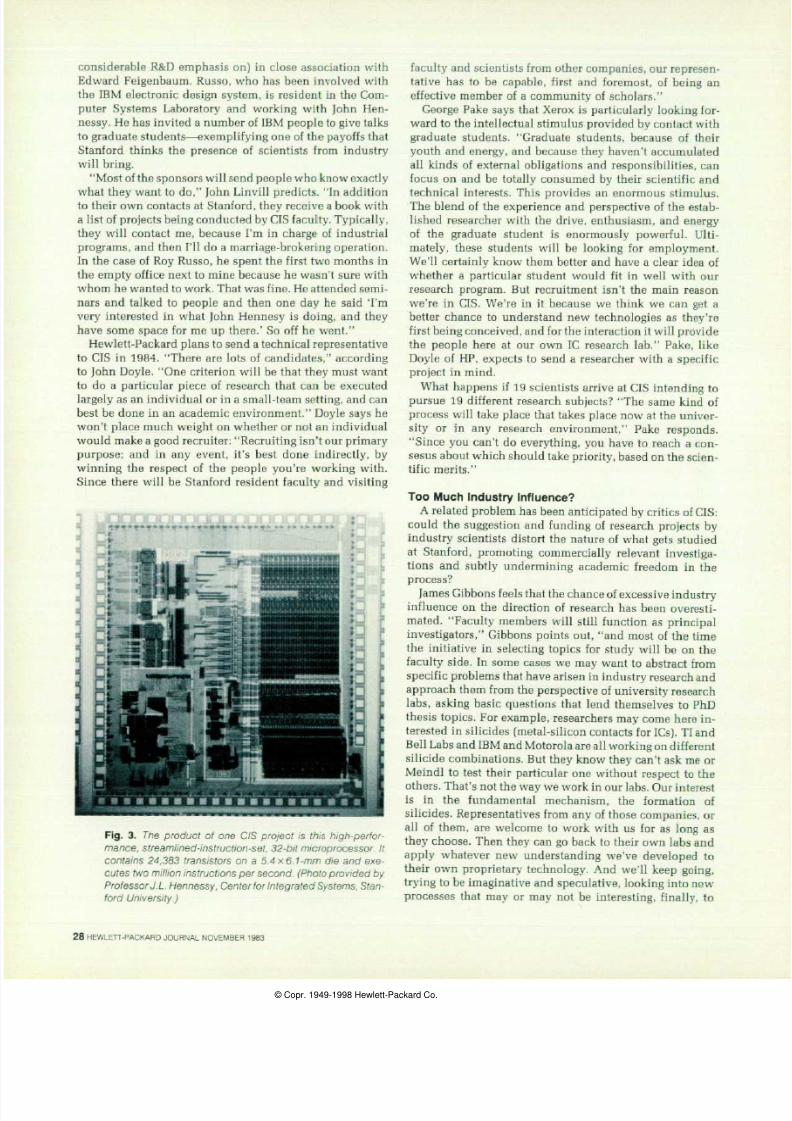
7/24/2019 1983-11_HP Journal Papers
http://slidepdf.com/reader/full/1983-11hp-journal-papers 28/32
considerable R&D emphasis on) in close association with
Edward Feigenbaum. Russo, who has been involved with
the IBM electronic design system, is resident in the Com
puter Systems Laboratory and working with John Hen-
nessy. He has invited a number of IBM people to give talks
to graduate students — exemplifying one of the payoffs that
Stanford thinks the presence of scientists from industry
will bring.
Most of the sponsors will send people who know exactly
what they want to do, John Linvill predicts. In addition
to their own contacts at Stanford, they receive a book with
a list of projects being conducted by CIS faculty. Typically,
they will contact me, because I'm in charge of industrial
programs, and then I'll do a marriage-brokering operation.
In the case of Roy Russo, he spent the first two months in
the empty office next to mine because he wasn't sure with
whom he wanted to work. That was fine. He attended semi
nars and talked to people and then one day he said 'I'm
very interested in what John Hennesy is doing, and they
have some space for me up there.' So off he went.
Hewlett-Packard plans to send a technical representative
to CIS in 1984. There are lots of candidates, according
to John Doyle. One criterion will be that they must want
to do a particular piece of research that can be executed
largely as an individual or in a small-team setting, and can
best be done in an academic environment. Doyle says he
won't place much weight on whether or not an individual
would make a good recruiter: Recruiting isn't our primary
purpose; and in any event, it's best done indirectly, by
winning the respect of the people you're working with.
Since there will be Stanford resident faculty and visiting
F i g . 3 . T h e p ro d u c t o f o n e C I S p ro j e c t i s t h i s h i g h -p e r f o r
m a n c e , I t 3 2 - b i t m i c r o p r o c e s s o r . I t
con ta ins 24 ,383 t rans is to rs on a 5 .4 x 6 .1 -mm d ie and exe
cutes by mi l l ion inst ruct ions per second. Photo provided by
Professor J.L. Hennessy, Center for Integrated Systems, Stan
ford Universi ty. )
faculty and scientists from other companies, our represen
tative has to be capable, first and foremost, of being an
effective member of a community of scholars.
George Pake says that Xerox is particularly looking for
ward to the intellectual stimulus provided by contact with
graduate students. Graduate students, because of their
youth and energy, and because they haven't accumulated
all kinds of external obligations and responsibilities, can
focus on and be totally consumed by their scientific and
technical interests. This provides an enormous stimulus.
The blend of the experience and perspective of the estab
lished researcher with the drive, enthusiasm, and energy
of the graduate student is enormously po werful. Ulti
mately, these students will be looking for employment.
We'll certainly know them better and have a clear idea of
whether a particular student would fit in well with our
research program. But recruitment isn't the main reason
we're in CIS. We're in it because we think we can get a
better chance to understand new technologies as they're
first being conceived, and for the interaction it will provide
the people here at our own 1C research lab. Pake, like
Doyle of HP, expects to send a researcher with a specific
project in mind.
What happens if 19 scientists arrive at CIS intending to
pursue 19 different research subjects? The same kind of
process will take place that takes place now at the univer
sity or in any research environment, Pake responds.
Since you can't do everything, you have to reach a con-
sesus about which should take priority, based on the scien
tific merits.
Too Much Industry Inf luence
A related problem has been anticipated by critics of CIS:
could the suggestion and funding of research projects by
industry scientists distort the nature of what gets studied
at Stanford, promoting commercially relevant investiga
tions and subtly undermining academic freedom in the
process?
James Gibbons feels that the chance of excessive industry
influence on the direction of research has been overesti
mated. Faculty members will still function as principal
investigators, Gibbons points out, and most of the time
the initiative in selecting topics for study will be on the
faculty side. In some cases we may want to abstract from
specific problems that have arisen in industry research and
approach them from the perspective of university research
labs, asking basic questions that lend themselves to PhD
thesis topics. For example, researchers may come here in
terested in suicides (metal-silicon contacts for ICs). TI and
Bell Labs and IBM and Motorola are all working on different
suicide combinations. But they know they can't ask me or
Meindl to test their particular one without respect to the
others. That's not the way we work in our labs. Our interest
is in the fundamental mechanism, the formation of
suicides. Representatives from any of those companies, or
all of them, are welcome to work with us for as long as
they choose. Then they can go back to their own labs and
apply whatever new understanding we've developed to
their own proprietary technology. And we'll keep going,
trying to be imaginative and speculative, looking into new
processes that may or may not be interesting, finally, to
28 HEWLETT PACKARD JOURNAL NOVEMBER 1983
© Copr. 1949-1998 Hewlett-Packard Co.

7/24/2019 1983-11_HP Journal Papers
http://slidepdf.com/reader/full/1983-11hp-journal-papers 29/32
CIS Research Topics
Although i ts bui lding won't be completed un t i l early 1985, the
Center for Integrated Systems is already coordinating a 1 2-mil-
l ion-a-year basic research program at Stanford, funded largely
by the Federal government . Here's a sampler of recent and cur
rent existing investigated by CIS affiliated faculty in various existing
labs:
omputers
• Research on streamlined-instruction-set microprocessor (fea
turing partnership of computer and 1C engineers)
• Research in VLSI systems
• Knowledge-based VLSI project
• Image understanding
• Intelligent task automation
• Network graphics
• Part it ionable computer systems
• Analys is and veri f icat ion of high-order language programs
• Study of very high-speed integrated circuits (VHSIC-PhaseS)
• Real-t ime communications systems: design, analysis, and im
plementation
• Structured design methodology for VLSI systems
• Logical methods for program analysis
• Ultra-concurrent computer systems
• Silicon compilation
• Data base theory
• Computer languages for VLSI fabrication
Information Systems
• Mult iple user channels and information theory
• Computat ional complex i ty , ef f ic iency, and accountabi l i ty in
large-scale teleprocessing systems
• Mul t iplexed holographic reconstruct ion methods for 3D st ruc
tures
• Information theory and data compression
• Signal processing and compression
• Statist ical data processing, system modeling, and reliabil i ty
• Real-t ime statist ical data processing
• Algori thms for locat ing and ident i fy ing mul t iple sources by a
dis t r ibuted sensor network
• Fast algorithms for improved speech coding and recognit ion
• Dual-energy digi tal subtract ion radiography for nonlnvasive
arter iography
Integrated i rcui ts
• Computer modeling of complete 1C fabrication process
• Integrated elect romechanical and opt ical sensor arrays for
Optacon I I (a reading aid for the bl ind)
• BME Center for Integrated Electronics in Medicine (to produce
implantable telemetry systems for biomedical research)
• Computer-aided design of 1C fabrication processes for VLSI
devices
• Submlcron device physics and technology
• Development of mult ichannel electrodes for an auditory pros
thesis
• Study of transdermal electronics for an auditory prosthesis
• Mult i level-metal Interconnection technology
• Biomedical si l icon sensors
• Fast turnaround laboratory for VLSI
Sol id S ta te
• Ion implantat ion and laser anneal ing in semiconductors and
related materials
• Laser and elect ron beam processing of semiconductors
• Characterizat ion of high-speed semiconductor device materi
als us ing advanced analy t ical techniques
• Ion implantat ion and laser pro cessing of 3-5 compound con
ductors
• Defects at electrode-oxide and electrode-sil icon interfaces In
submlcron device s t ructures
• Mic ros t ruc ture fabr i cat ion us ing e lec t ron beams of conven
t ional and very low energies
• Advanced concepts in VLSI metall ization
• Advanced packaging concepts for VLSI
• S tud ies o f sur faces and In ter faces o f 3-5 compounds and
Shsil lcldes
• Sil icon photocells in thermophotovoltaic energy conversion
• Investigation of metall ic Impurit ies introduced into SiO2 and Si
by various candidate VLSI metal l izat ion systems
• Modeling of emitters
• S t ruc tura l and bonding s tud ies o f prac t i ca l semiconduc tor
layers
Space Telecommunicat ions and Radioscience
• Establishment of a Center for Aeronautics and Space Informa
t ion Sciences at Stanford Univers i ty (Funded by the U.S. Na
t iona l Aeronaut i cs and Space Admin is t ra t ion. The focus w i l l
. be on apply ing VLSI techniques to develop new hardware and
firmware for space instrumentation and command and control.)
• Communication satell i te planning center
Material Science and Engineering
• Atomic-level physics model ing of the thermal ox idat ion pro
cess
• Fabrication and propert ies of mult i layer structures
• Computer simulation of surface and f i lm processes
• Photoelectronic propert ies of 2-4 heterojunctions
• Photoelect ronic propert ies of z inc phosphide crystals , f i lms,
and heterojunct ions
• Photovol taic heterodlodes based on indium phosphide
• Preparat ion and proper t ies o f CdTe evaporated f i lms com
pared wi th s ingle-crystal CdTe
Ginzton Laboratory
• Superconducting thin f i lms, composites, and junctions
• Acoustical scanning of optical ¡mages
• Research on nondestructive evaluation
• Evaluation of machining damage in brit t le materials
• Optical and acoustic wave research
• High-frequency transducers
• Research on acoustic microscopy with superior resolution
• Study of propert ies of material by channeling radiation
• Surface acoustic wave MOSFET signal processor
industry.
John Young thinks that industrial influence on university
research should be welcomed, not feared: Engineers tend
to be pragmatic, reasonable people. I think there's going to
be a synchronizing of interests through CIS, not a conflict.
The sponsors advisory committee will meet and discuss
in large terms what kinds of things we're all really thinking
about — photolithography, CMOS processing, silicon com
pilers, and other fundamental areas of current interest. That
should be enlightening to faculty members. It certainly
won't affect their academic freedom in a negative way.
There's a false image of academic freedom, Young adds
pointedly, — professors just pursuing whatever they want
to. In actuality, many times they do what they think they
can get money for. CIS may prove that it's a lot more effi
cient for a university researcher to have a common view
NOVEMBER 1983 HEWLETT-PACKARD JOURNAL 29
© Copr. 1949-1998 Hewlett-Packard Co.
7/24/2019 1983-11_HP Journal Papers
http://slidepdf.com/reader/full/1983-11hp-journal-papers 30/32
of what's important with some working company research
ers who are doing this business day in, day out, rather than
government or other people who only know about handing
out money. We'll see.
Some Hard Questions
Donald Kennedy, President of Stanford, has ultimately
had to deal with all the hard questions raised in connection
with the founding of CIS. Here are some of the major ones,
along with Kennedy's answers:
• Could industrial sponsorship distort the nature of
academic research? Faculty will work on the things
they want to work on. If the problems brought in by
industry are good problems, the faculty will be recep
tive.
• Will industrial representatives exert undue pressure on
graduate students to join their companies? The com
panies are already recruiting pretty intensely. The
graduate students at CIS will probably find it more com
fortable because it will be less frantic and they'll get a
better, longer look at prospective employers.
• Might there be pressure to conduct projects in an atmos
phere of secrecy? All research carried on at CIS will
come under the university's research policy, which
guarantees open publication and countenances only
brief delays to permit certain types of review. We didn't
make any exceptions for CIS.
• Will CIS sponsors gain an unfair advantage over less
affluent companies in the microelectronics field? All
companies, small and big, have access to the graduate
students and access to the research through meetings on
campus where we describe what's being done, through
publication, through their network of contacts and con
nections. And if a CIS faculty member wants to invite a
postdoctoral fellow from a nonparticipating company to
join his research team, he can do it. We had to fight that
battle hard. Some of the sponsors didn't like the idea of
'free riders,' but we persuaded them that Stanford
couldn't go into an agreement that would shut others
out. 'We can help you, but we can't do it by hurting
somebody else.' That's the principle we've operated on
in establishing CIS.
Similar enters
Kennedy calls the founding of CIS a watershed and
the difficulties he has encountered prototype problems.
He expects analogous centers to be created at Stanford and
other universities, in various disciplines, as private-sector
companies increase their support for academic research
and training. In the microelectronics field somewhat simi
lar institutional models are now being developed at MIT,
the University of Minnesota, the University of California
at Berkeley, and elsewhere. The University of Texas in
Austin and Texas A&M University in College Station are
upgrading their integrated circuits research programs and
facilities in conjunction with a consortium of 12 U.S. firms
known as the Microelectronics and Computer Technology
Corporation. In North Carolina researchers from private
industry and three universities are sharing a new facility,
the Microelectronics Center at Research Triangle Park near
Durham, supported largely by a $24.4 million appropria
tion from the state legislature. The Semiconductor Industry
Association, made up of 20 major computer and integrated
circuit companies, including Hewlett-Packard, has formed
the Semiconductor Research Cooperative and given it a
substantial budget for the sponsorship of university -based
research projects in IC-related fields.
All these undertakings are viewed with enthusiasm by
John Young, and Hewlett-Packard is directly involved in
two of them — the Semiconductor Research Cooperative
and the Microsystems Program at MIT. We're putting more
of our money into CIS, Young explains, because physical
proximity is a factor in how effectively you can relate to
an institution. We've been able to play a leadership role
in CIS. Another factor, of course, is the close relationship
Hewlett-Packard has had with Stanford throughout our 44
years. There's a long history of successful contacts and
contracts, progressive escalations of closeness. CIS is the
latest. Which is one of the reasons I'm confident it's going
to work.
30 HEWLETT PACKARD JOURNAL NOVEMBER 1983
© Copr. 1949-1998 Hewlett-Packard Co.

7/24/2019 1983-11_HP Journal Papers
http://slidepdf.com/reader/full/1983-11hp-journal-papers 31/32
uthors
November 1 983
degree in EE'CS and came to HP in 1979 w i th
experience as a software engineer. He is married,
l ives in Fremont, California, and is interested in
microcomputers and mar t ia l a r ts .
and algorithm refinements. He has also worked as
a p roduct specia l is t and as a systems eng ineer
fo r the HP 3000 Computer . He has coau thored
th ree pub l ished papers on laser techno logy.
Yvonne Temple
{ â € ¢ m ^ ^ ^ H Yvo n n e Te m p le re ce ive d a
^ ^ à š l  · ^ I B S d e g r e e i n c o m p u t e r
j t à à g ^ I s c i e n c e f r o m t h e U n i v e r s i t y
 £ 9 P ^ ^ B H o f M i n n e s o t a T e c h n i c a l
f ^ i , ^ ^ 9 I n s t i t u t e i n 1 9 8 1 . S h e j o i n e d
HP after graduat ion and
â € ¢ p V ' f g h a s b e e n i n v o l v e d i n b u s i -
} ~ ^ * ~ n e s s g r a p h i c s s o f t w a r e
/ , ' d e ve lo p m e n t f o r t h e H P
4 . 3000 Computer . A na t ive o f
St. Paul, Minnesota, she is married and now lives
in San Jose, California. Her hobbies are reading
and sewing.
R ich a rd J . S im m s, J r .
1 1 Rich Simms attended the
University of Michigan
w h e re h e e a rn e d a BS d e
gree in computer sc ience
and an MS in computer
eng ineer ing . A member o f
the Associa t ion fo r Com
put ing Mach inery(ACM),
he has taugh t c lasses in
co m p u t e r sc ie n ce a n d a u
thored papers on strat igraphic analysis and visual
information display systems. With HP since 1978,
R ich is a p ro ject manager fo r HP 3000 g raph ics
software. He is single, lives in Santa Cruz, Califor
n ia , and en joys runn ing and motorcyc l ing .
Ja n e t E l i ch M o r r i s
V vv
Janet Morris received a BS
d e g re e in co m p u t e r sc i
ence from California
Po ly techn ic Sta te Un iver
sity at San Luis Obispo in
1982. She part icipated in
HP's SEED studen t em
p loyment p rogram and
joined HP as a software
deve lopment eng ineer
after graduat ion. Recent ly married, she is a
member of ACM and is organizing a Cal Poly com
puter science alumni associat ion. Born in Duarte.
California, she now lives in Santa Clara and is
work ing on an MS in computer sc ience .
m
Rober t W. Dea
Bob Dea was invo lved in
the design o f DSG/3000
and HPEASYCHART. He is
current ly at HP
Laboratories working on
st ra teg ies fo r the deve lop
ment of software tools, a
sub ject on wh ich he has
pub l ished an a r t ic le . He
graduated from the Univer
sity of California at Berkeley in 1973 with a BS
Martha Sea ver
A na t ive o f Los Ange les,
California, Martha Seaver
earned a BS degree in
physica l sc ience f rom
Stanford University in 1976
and an MS in computer
science from the University
of North Carolina at Chapel
Hil l in 1981. She was a
systems eng ineer be fo re
jo in ing HP in 1981 as a so f tware deve lopment
engineer. She is engaged, l ives in Cupert ino,
Ca l i fo rn ia , makes sta ined g lass w indows, and
par t ic ipa tes in long-d is tance sw imming . She is
a lso a tap dancer w i th Broadway asp i ra t ions.
13;
Ja n e t Sw i f t
Janet Swif t part icipated in
the design o f HPDRAW
and is cu r ren t ly a p ro ject
leader fo r new HP 3000
software products. The
author of a paper published
in the Nat ional Computer
Graph ics Associa t ion Pro
ceed ings, she g raduated
f rom the Un ivers i ty o f Ore
gon in 1 977 with a BS degree in mathematics and
computer sc ience . Jane t is a member o f the San
Jose Jun io r Women 's C lub . She is engaged to
ano ther HP employee , and w i l l be moving to the
Boise Division soon. She enjoys running.
C h a ya b o o n Pu rn a ve ja
' )T Aud i Purnave ja was born in
Bangkok, Tha i land and
attended Rensselaer
Polytechnic Institute, where
he received an MS degree
| i n co m p u t e r sc ie n ce in
J1 978. He later attended the
University of Michigan for
t ra in ing in computer
g raph ics, comple t ing tha t
p rogram in 1981 . He is a so f tware deve lopment
engineer at HP and is a member of the ACM, SIG-
GRAPH, IEEE, and NCGA. He l ives in Sunnyvale,
California and his outside interests are ice skating,
volleyball, skiing, and ballet .
7
Ge ra ld T . Wa d e
Gerry Wade received a BS
degree in phys ics f rom
New Mexico Sta te Un iver
sity in 1971. He was a
physic is t fo r the U.S. At
m o sp h e r i c Sc ie n ce L a b o
ratory before jo in ing HP in
1974. Gerry contr ibuted
the new vector-to-raster
p rogram fo r the 2680A
Graph ics Package, inc lud ing the Bucke t Br igade
Wi l l i a m J . To m s
Bi l l Toms was a computer
specialist for the U.S. Army
;ers in
Frankfurt , West Germany
befo re coming to HP as a
deve lopment eng ineer in
1981. He ho lds a BS de
gree in mathematics
awarded by the Un ivers i ty
of Washington, where he
has also done graduate work in computer science.
Bil l l ives in Santa Clara, California, and enjoys
in te rna t iona l t rave l , sk i ing , scuba d iv ing , and co l
lect ing Steif f bears.
Ja m e s C . B ra t n o b e r
I A graduate of Stanford
University with a BS degree
in mathematical sciences
awarded in 1 979, Jim Brat
nober came to HP in 1981
a s a d e ve lo p m e n t e n
gineer. Born in Cotton-
wood, Ar izona , he is mar-
I ried, has two children, and
now lives in Boise, Idaho,
where he en joys sk i ing and French in tens ive gar
dening.
Támara C. Baker
t | T a m m y B a k e r g r a d u a t e d
•- * f rom Cornell University in
1981 w i th a BA degree in
computer sc ience . She
joined HP shortly thereafter
a development engineer
and con t r ibu ted to the de
sign of the 2680A Graphics
Package. Born in Jackson-
I vi l le, North Carolina, she
now lives in Mountain View, California, and enjoys
boardsail ing, cycling, and skiing.
F re d e r i ck H . Ga rd n e r
Fred Gardner is director of
Redwood Publicat ion
Specialists, a technical
writ ing service based in
Glen Ellen. California. A
fo rmer member o f the c i
ent i f ic Amer ican Magazine
Board of Editors, he has
writ ten professionally in
a lmost every med ium, in
cluding f ict ion, journalism, screenplays, children's
books, songs, and commerc ia l l i te ra tu re . He is
married and has four children. His le isure t ime
(Fred scoffs at the term) is devoted to putting part
o f a rocky Sonoma County mounta ins ide in to ag
ricultural product ion.
NOVEMBER 1983 HEWLETT-PACKARD JOURNAL 31
© Copr. 1949-1998 Hewlett-Packard Co.
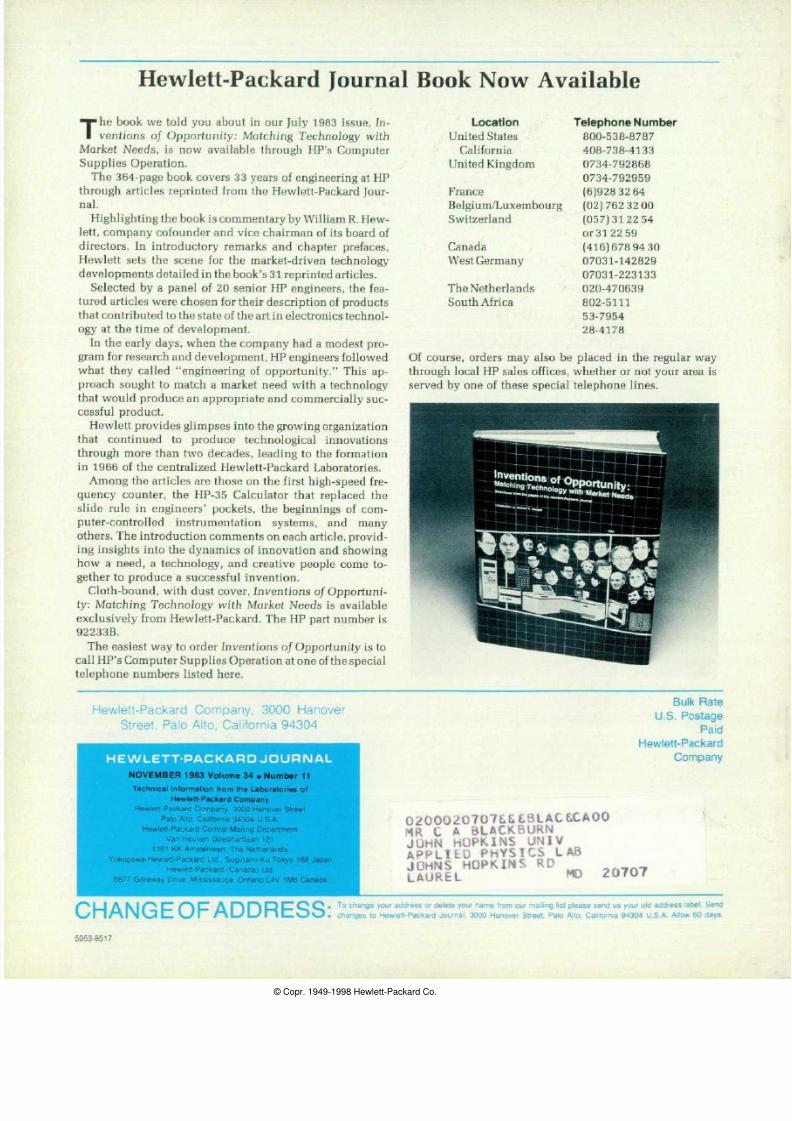
7/24/2019 1983-11_HP Journal Papers
http://slidepdf.com/reader/full/1983-11hp-journal-papers 32/32
Hewlett Packard Journal Book Now Available
The book we told you about in our July 1983 issue, in
ventions of Opportunity: Matching Technology with
Market Needs, is now available through HP's Computer
Supplies Operation.
The 364-page book covers 33 years of engineering at HP
through articles reprinted from the Hewlett-Packard Jour
nal.
Highlighting the book is commentary by William R. Hew
lett, company cofounder and vice chairman of its board of
directors. In introductory remarks and chapter prefaces,
Hewlett sets the scene for the market-driven technology
developments detailed in the book's 3 1 reprinted articles .
Selected by a panel of 20 senior HP engineers, the fea
tured articles were chosen for their description of products
that contributed to the state of the art in electronics technol
ogy at the time of development.
In the early days, when the company had a modest pro
gram for research and development, HP engineers followed
what they called engineering of opportunity. This ap
proach sought to match a market need with a technology
that would produce an appropriate and commercially suc
cessful product.
Hewlett provides glimpses into the growing organization
that continued to produce technological innovations
through more than two decades, leading to the formation
in 1966 of the centralized Hewlett-Packard Laboratories.
Among the articles are those on the first high-speed fre
quency counter, the HP-35 Calculator that replaced the
slide rule in engineers' pockets, the beginnings of com
puter-controlled instrumentation systems, and many
others. The introduction comments on each article, provid
ing insights into the dynamics of innovation and showing
how a need, a technology, and creative people come to
gether to produce a successful invention.
Cloth-bound, with dust cover, Inventions of Opportuni
ty: Matching Technology with Market Needs is available
exclusively from Hewlett-Packard. The HP part number is
92233B.
The easiest way to order Inventions of Opportunity is to
call HP's Computer Supplies Operation at one of the special
telephone numbers listed here.
Location
United States
California
United Kingdom
France
Belgium/Luxembourg
Switzerland
Canada
West Germany
The Netherlands
South Africa
Telephone Number
8 0 0 - 5 3 8 - 8 7 8 7
408-738-4133
0734-792868
0734-792959
(6)9283264
(02)7623200
(057)312254
or312259
(416)6789430
07031-142829
07031-223133
020 470639
802-5111
5 3 - 7 9 5 4
28-4178
Of course, orders may also be placed in the regular way
through local HP sales offices, whether or not your area is
served by one of these special telephone lines.
Hewl e t t -Packa rd Company , 3000 Hanove r
Street, Palo Al to, Cal i fornia 94304
H E W L E T T - P A C K A R D J O U R N A L
N O V E M B E R 1 9 8 3 V o l u m e 3 4 . N u m b e r 1 1
Technical Information from the Laboratories of
H ew le t t -P ackard C om pany
Hewlet t -Packard Company. 3000 Hanover S treet
Palo Alto. California 94304 U S. A
Hewlet t -Packard Central Mai l ing Department
Van Heuven Goedhart laan 121
1 1 8 1 K K A m s t e l v e e n , T h e N e t h e r l a n d s
Yokogawa-Hewlet t -Packard Ltd. . Suginami-Ku Tokyo 168 Japan
Hewlet t -Packard Canada) Ltd.
6877 Goreway Dr ive Mississauga. Ontar io L4V 1 MS Cañad
Bulk Rate
U.S. Postage
Paid
Hewlett-Packard
Company
0 2 0 0 0 2 0 7 0 7 B L A C C A O O
r t R C A B L A C K B U R N
J O H N H O P M N S U N 1 V
A P P L I E D P H Y S I C S L A B
J O H N S H O P K I N S R D
L A U R E L M
2 0 7 O 7