1990 - ipen · barc-1509 ob > 3d o research and development activities of the seismology sectjon...
TRANSCRIPT

BARC-1509
OB>3DO
RESEARCH AND DEVELOPMENT ACTIVITIES OF THESEISMOLOGY SECTJON
for the periodJanuary 1988 - December 1989
Edited by
Vijay Kumar and G. S. MurtySeismology Section
1990
B.A.R.C-1509
GOVERNMENT OF INDIAATOMIC ENERGY COMMISSION
S3
hI
o
RESEARCH AND DEVELOPMENT ACTIVITIES OP THESEISMOLOGY SECTION
for the periodJanuary 1988 - December 1989
Edited by
Vijay Kumar and G.S. Murty
Seismology Section
BHABHA ATOMIC RESEARCH CENTRE
BOMBAY, INDIA
1990

B.A.R.C-1509
10
BIBLIOGRAPHIC DESCRIPTION SHEET FOR TECHNICAL REPORT
(as per IS : 7400 - 1980)
01
02
03
04
05
06
O7
08
Security classification :
Distribution :
Report status s
Series :
Report type :
Report No. :
Part No. or Volume No. :
Contract No. :
Unclassified
External
New
B.A.R.C. External
Progress Report
B.A.R.C.-1509
Title and subtitle : Research and development activitiesof the Seismology Section for theperiod January 1988 - December 1989
11 Collation :
13 Project No. :
20 Personal author(s) s
119 p., 44 figs., 2 tabs.
Vijai Kumar; G.S. Hurty (eds.)
21 Affiliation of author(s) : Seismology Section, Bhabha AtomicResearch Centre, Bombay
22 Corporate author(s) Bhabha Atomic Research Centre,Bombay-400 085
23 Originating unit :
24 Sponsor(s) Name :
Type :
30 Date of submission :
31 Publication/Issue date
Seismology Section, B.A.R.C., Bombay
Department of Atomic Energy
Government
April 1990
May 1990
Con td... ( i i )
40
42
50
51
52
53
Publisher/Distributor :
Form of distribution :
Language of text :
Language of summary :
No. of references :
Gives data on :
(ii)
Head, Library and InformationDivision, Bhabha Atomic ResearchCentre, Bombay-400 0B5
Hard Copy
English
English
60 Abstract : This report summarises the research and developmentactivities of the Seismology Section during the period fromJanuary 1988 to December 1987. Apart from the ongoing work onForensic Seismology, Seismicity Studies, Rock Burst Monitoring,Elastic Wave Propagation, a new field system became operationalat Bhatsa, located about 100 km from Bombay, comprising 11station radio-telemetered seismic network with a centralrecording laboratory to study the reservoir induced seismicity.
70 Keywords/Descriptors :PR0GRESS REPORT; RESEARCH PROGRAMS;EARTHQUAKES; SEISMIC DETECTION; DATA ACQUISITION SYSTEMS;MONITORING; SEISMIC SURVEYS; REACTOR SITES; NUCLEAR EXPLOSIONS;UNDERGROUND EXPLOSIONS; SEISMIC WAVES; SITE SELECTION; RECORDINGSYSTEMS; SEISMIC NOISE; MICROPROCESSORS; TELEMETRY;SFISMOGRAPHS; EXPERIMENTAL DATA; SIGNALS; ROCK MECHANICS; WATERReSERVOIRS; SEISMOLOGY; INDIA
71 Class No. : INIS Subject Category : E14OO.OO; B31.4O
99 Supplementary elements :

CONTENTS
1 INTRODUCTION ... ... ... ... 1
2 FEATURE ARTICLE... ... ... ... 6
2.1 DISSIPATION AS A TOOL FOR NONDESTRUCTIVE EVALUATION...?
3 INSTRUMENTATION AND DATA ACQUISITION.. ... 14
3.1 UNDERGROUND 386 BASED ROCK BURST MONITORING SYSTEM
FOR KGF ... ... ... ... 15
3.2 SEISMIC DATA ACQUISITION SYSTEM FOR DELHI SET-UP. 17
3.3 SURVEY CONDUCTED FOR LOCATING A SITE FOR A SEISMIC
NETWORK NEAR TO THE PROPOSED SITE FOR NUCLEAR POWER
PLANT AT JAITAPUR, RATNAGIRI DISTT., MAHARASHTRA
STATE... ... ... ... ... 18
3.4 DEVELOPMENTS IN SEISMIC DATA ACQUISITION SYSTEMS. 22
3.5 INTERFACING SEISMIC DATA ACQUISITION SYSTEM TO
IBM/PC. ... ... ... ... 24
3.6 INSTRUMENTATION AND OPERATIONAL PERFORMENCE OF A
WIRELESS TELEMETERED SEISMIC NETWORK AT BHATSANAGAR 27
3.7 STRONG MOTION MONITORING OF ROCK BLASTINGS AT THE
RAPP 3 AND 4 EXCAVATIONS, KOTA. ... ... 38
3.8 SEISMIC DATA EXCHANGE USING INTERNATIONAL GATEWAY
PACKET SWITCHED COMMUNICATION SYSTEM.. ... 41
3.9 SEISMIC NOISE SURVEY IN PROVINCES AROUND THE ATOMIC
POWER PROJECT SITE AT KAIGA. ... ... 43
3.10 DATA COMMUNICATION BETWEEN GAURIBIDANUR AND TROMBAY
USING COMPUTER NETWORK. ... ... ... 47
3.11 INSTALLATION OF HORIZONTAL SHORT PERIOD SEISMOMETER
SYSTEMS AT GAURIBIDANUR. ... ... ... 49
3.12 A PC/XT-MICROPROCESSOR BASED EVENT DETECTION AND
DATA ACQUISITION SYSTEM. ... ... ... 51
3.13 OPERATION OF SEISMIC AND ACOUSTIC ARRAYS AT NEW
DELHI ... ... ... ... 53
3.14 BOREHOLE SEISMOMETRY ... ... ... 54
AIRCRAFT
. . .
...
SOURCE
. . .
ER STUDY
5557
69
60
62
62
3.15 GROUND VIBRATIONS FROM VEHICLES AND
FLIGHTS.
3.16 SEISMIC FIELD STATIONS
4 SEISMIC DISCRIMINATION STJDIES
4.1 DETECTION OF WEAK SIGNALS.
4.2 A KNOWLEDGE BASED SYSTEM FOR SEISMIC
IDENTIFICATION ...
4.3 SEISMIC SOURCE IDENTIFICATION BY PEF: FURTHER STUDY
4.4 TEMPORAL AND SPECTRAL CHARACTERISTICS OF EASTERN
KAZAKH EXPLOSION SEISMIC SIGNALS RECORDED AT
ESKDALEMUIR (SCOTLAND) AND YELLOWKNIFE (CANADA)
ARRAYS.. ... ... ... ... 63
4.5 RELATIVE ABUNDANCE OF PcP ENERGY COMPARED WITH P
ENERGY IN CASPIAN SEA EXPLOSION SEISMIC SIGNALS
AT EKA, YKA AND GBA ARRAYS.. ... ... 68
5 SKISMICITY AND SEISMIC RISK. ... ... 71
5.1 MICROSEISMIC NOISE SURVEYS.. ... ... 72
5.2 MICROEARTHQUAKE SURVEYS IN THE VICINITY OF NUCLEAR
POWER PLANT SITES. ... ... ... 76
5.3 ASSESSMENT OF HAZARD AT NUCLEAR POWER PLANT SITE
DUE TO SEISMICITY INDUCED DAM FAILURE. ... 77
5.4 DATA OF EARTHQUAKES FROM SOUTHERN PENINSULAR INDIA 78
5.5 SEISMICITY OF BHATSA DAM REGION IN WESTERN
MAHARASHTRA. ... ... ... ... 81
6 THEORETICAL AND EXPERIMENTAL STUDIES.. ... 87
6.1 THE CONCEPT OF ENSEMBLE OF EARTHQUAKE POPULATION 88
6.2 USE OF LATTICE FILTERS FOR SIGNALS AND IMAGE
PROCESSING ... ... ... ... 89
6.3 MODELLING SIGNALS IN HIGHER DIMENSION - THEORY AND
LIMITATIONS ... ... ... ... 90
6.4 ISOLATION OF SIGNALS ... ... ... 91
6.5 FISHER'S TEST OF SIGNIFICANCE IN HARMONIC ANALYSIS
WITH AN APPLICATION TO SIGNAL DETECTION ... 92

6.6 A PARAMETRIC MODEL AS A POTENTIAL TOOL FORIDENTIFICATION OF ELECTROENCEPHALOGRAMS ... 95
6.7 FOCAL MECHANISM SOLUTION OF NEPAL-BIHAR EARTHQUAKE
OF AUGUST 20,1988. ... ... ... 96
6.8 WAVE PROPAGATION WITH KINEMATIC DISCONTIN":TY ALONG
A NON-IDEAL INTERFACE BETWEEN TWO ISOTROPIC ELASTIC
HALF-SPACES ... ... ... ... 100
6.9 MEASUREMENT OF INTERFACIAL WAVES TRAVELLING ALONG
ADHESIVELY BONDED INTERFACE. ... ... 104
7 POBLICATIONS/SYHPOSIA ... ... ... 109
8 LECTDRES/TALKS/WORKSEIOPS ... ... ... 115
9 AWARD... ... ... ... ... 117
10 THESIS.. ... ... ... ... 117
11 SCIENTIFIC R & D BREAK UP... ... ... 118

\
1. IHTBODOCTION

- 2 -
Introduction
The seismological studies spanning both the
theoretical and experimental aspects wero directed towards
the development of reliable and state of the art techniques
for seismic data acquisition and analysis for application to
source discrimination, rock burst monitoring and reservoir
related seismicity. All the field systems at Gauribidanur
and Delhi were operated round the clock and the data
analysed regularly.
Source descriaination studies
The ongoing forensic seismological research has
acquired a new level of significance with the international
exchange of data among selected nations including India,
following the Six Nation Peace Initiative to monitor
moratorium on nuclear tests. We have successfully
transmitted our data and received seismic data over special
lines made available for this purpose.
New algorithms were successfully tested for source
discrimination on controlled set of earthquake and explosion
data.
Table 1.1 gives the break-up of presumed nuclear
explosions detected by Gauribidanur Seismic Array (GBA) and
Delhi Seismic Unit (DSU). An interesting feature observed is
that USSR conducted explosions only at one site, namely
Eastern Kazakh in 1989, while in the preceding year 1988,
the explosions were carried out at three other site3 in
USSR in addition to Eastern Kazakh.

- 3 -
1 ps"t-Uflf?ntat ion development
(a) Rock burst, monitoring
The data acquisition systems established at Bharat
Gold Mines Limited (BGML) were operating continuously. The
newly established institute at BGML called Kolar Institute
of Rock Mechanics and Ground Control has requested us to
help them for installation of further monitoring systems at
new places, in order to meet the requirement of the Ministry
of Mines. New collaborative research is initiated to develop
a real time monitoring system. A stand alone 386 based
system together with necessary electronic units is designed
and is being fabricated for installation at Mysore Northern
Fold region of Kolar Gold Field with 12 geophones between
101 and 108 levels. Technical help is given to the Institute
for planning and installation of necessary structures under-
ground for this purpose. All other systems established
earlier, have provided very useful data to mining engineers.
The proposed system is for extending rock burst monitoring
in new areas at Kolar Gold Fields.
(b) Bhatsa dam seismicity
The radio telemetered 11 seismic station network
installed at Bhatsa, 100 Km, north of Bombay operated
continuously. All the data tapes have been examined and
every tremor recorded by the system was analysed. It was
found that a majority of the signals detected are due to
local cultural sources and very few of them are due to
micro-tremors emanating from the ground. This problem is
being pursued to examine the seismicity associated with
impounding of the water and its variation with timo and
space.

- 4 -
(c) Local seis»ieity studies
All the events acquired at Gauribidanur and New Delhi
were processed and the epicentres of the local events are
estimated based upon our data. This study is throwing new
light on the Geo-tectonics of Indian continent.
Noise survey was carried out around Kaiga and Narora
in response to the request from Nuclear Power Corporation
for the choice of proper sites to locate new seismic
stations in the region.
The following pages give a broad outline of different
problems that were studied during the two year period
January 1988 to December 1989.
— Gurajada S.Murty

- 5 -
Table 1.1
Country
U. S. A
USSR
FRANCE
CHINA
Region
Southern Nevada
Eastern Kazakh
Novaya Zemlya
Western Siberia
European USSR
TOTAL (USSR)
Mururoa Atolls
Lop Nor
TOTAL
Number of underground explosions
Conducted* Detected(GBA/DSU)
1988 1989 1988 1989
11
12
2
1
1
16
8
1
36
11
7
7
8
26
5+ 5+
11® 7
2
1
1
15 7
7$ 8
1
28 20
Note: During 1989, no underground nuclear explosion was
conducted by China. USSR conducted nuclear explosions
only at Eastern Kazakh site.
* Total number of conducted explosions is based on
international data.
+ Other events were below threshold at GBA/DSU.
@ One event is too small to be detected at either GBA
or DSU.
$ Signals strength was below threshold at GBA. Due to
signal transmission problem at DSU, one event could
not be recorded.

2. FEATORE ARTICLE

«. 7 —
2.1 DISSIPATION AS A TOOL FOR NONDESTRDCTIVE EVALUATION
Introductton
One of the outstanding problems in mechanics of
material bodies is centred around the development of non-
destructive methods to predict failure of a material body
under an increasing state of stress. This question has
appeared in engineering, industry, metallurgy and geophysics
and in other fields. The non-linear nature of fracture
mechanism poses a difficult task in developing simple
criteria which can be applied to real heterogeneous cases to
forecast a mechanical failure. Recent study of wave
propagation in heterogeneous media offers an insight into
the problem of strength of materials, based on the
attenuation of the waves in the linear approximation.
In the context of prediction of earthquakes, a
criterion based on Vp/Vs ratio was found useful (Aggarwal
et.al,1975). Briefly, this criterion reflects the changes in
the macroscopic wave speed as a function of the changes in
the inclusions in the medium. Since such changes are
accompanied also by variation in dissipation properties of
the medium, one could al3o search for a criterion of failure
based on he changes in the dissipation properties. We,
therefore, examine a model of dissipation and discuss its
utility as a criterion of failure of the medium. The chief
motivation behind this search is the belief that if the
homogeneous medium characterised only by defects evolves
into a state of failure under externally imposed stress, it
is possible to represent its linear dynamical behaviour by
complex Lame "constants" whose values are function of time.
When a wave passes through such a medium, the speed of
propagation, as well as 1/Q, the specific attenutation, i.e.
relative loss of energy per unit cycle, become functions of

- 8 -
concentration of defects in the medium. Melander and
Strahlberg(1980) deduced a relation between the void volume
fraction and ductile fracture of a material. As the region
softens due to voids, the principal axis of stress rotates
in such a way that the region experiences compression
(Brady,1976) and the void region closes. A final joining of
voids occurs when sufticient shear i3 built around the
region. Such changes in void property are accompanied by
changes in the speed of longitudinal and transverse waves
(Aggarwal et.al.,1975).
The important point to investigate here is the
variation of void fraction preceding fracture and the
accompanying changes in the dissipation of waves propagating
in the medium.
Dissipation of Body waves
Following the studies of Toksoz et.al.(1979), and
O'Connel and Budiansky(1974), it was shown by Murty and Nair
(1981) that when the fractional volume of the inclusion is
varied, the specific attenuation factor 1/Q of a matrix of
dissipative inclusions in an elastic host medium will vary
significantly. As a matter of fact, a3 the fractional volume
of inclusion increases from zero to unity, 1/Q of the matrix
will pass through a peak value, being zero in the two
extreme cases. It is observed that the rate of change of
^Q/Q with void volume fraction shows a marked increase
close to failure of material (Fig.2.1) and also that this
rate variation is more sensitive than that of Vp/Vs
Therefore, observation of AQ/Q could be experimentally used
to anticipate catastrophic changes in the medium.
Dissipation of jntorfacial waves
In a series of recent experiments to measure the speed

- 9 -
and attenuation of interfacial waves propagating along the
boundary between two elastic half-spaces, as a function of
bonding which is varied by external load, Vijai Kumar and
Murty(1989) observed that the interfacial wave speed
increases monotonically with external load. However, the
dissipation as measured by 1/Q 3hows a peak value when
bonding is intermediate between the extreme values
corresponding to a smooth and welded contact at the
interface. A typical example is shown in Fig.2.2. This
variation is very similar to that of body wave speed and
dissipation as a function of void volume fraction.
Time dependent systems
If one measures attenuation, 1/Q, continuously as a
function of time, along with the speed of body waves for
heterogeneous medium or alternatively, 1/Q and interfacial
wave speed for layered medium, OTIQ would observe the
following possible combinations of time dependent properties
illustrated in Fig.2.3., and arrive at the responding
conclusion regarding stability of the medium.
Let us assume that, as a function of time, the wave
speed increases, reaches a peak value and finally decreases
with time. Such a behaviour suggests that the material is
evolving to a state of high strength from one of low
strength. Alternatively, if the wave speed decreases
monotonically with time while the attenuation passes a peak
value, one can conclude that the medium is evolving to a
state of failure.
Conclusion
From the foregoing, we see that measurement of
temporal behaviour of both speed of "elastic" waves and the
dissipation could be of diagnostic value to judge the

- 10 -
mechanical stability of the medium subjected to continuously
increasing load as a function of time.
References:
1. Aggarwal.Y.P., Sykes.L.R., Simpson,W. and Richards,P.G.
(1975).J.Geophys.Res.80,718.
2. Brady,B.T.(1976).Pure and Appl.Geophysics,114,1031.
3. Melander.A. and Strahlberg,V.(1980).Int. Journal of
Fracture,16,431.
4. Murty.Gurajada S. and Nair,G.J.(1981).Proc. Indo-German
Workshop on Rock Mechanics, NGRI, Hyderabad, p.43, (Eds)
T.N.Gowd and F.Rumroel.
5. Murty.Gurajada S. and Vijai Kumar.(1989).BARC-1491.
6. O'Connel.R.J. and Budiansky.B.(1974).J. Geophys. Res.,79,
5412.
7. Toksoz.M.N, Johnston,H. and Timur,A.T.(1979).Geophysics
44,692.
8. Vijai Kumar and Murty.Gurajada S.(1989).Thin Solid Films,
186 (in press).
— Gurajada S.Murty, Vijai Kumar and G.Jayachandran Nair

- 11 -
co
JCu
2-
void volume fraction
a-Variation of Vpb-VanatJon of Qc - Vp/Vs
Variation of Vp, Q and Vp/Vs with void volune
fraction.

- 12 -
3.2
CO
ALUMINIUM-AIR-STEELINTERFACE
| VELOCITY
ATTENUATION
LJ
iI
t
II 1
10
00 002i i
005 04 02 OS 10 2.0 50 10.0
LOAD (TON/SCXOOFig,2.2 Variation of experimentally observed interfacial
wave velocity and attenuation with external load at
aluminium-air-steel interface.Vertical bars indicate
the experimental scatter.Arrow indicates yield load.

I
1 2 3 4 5 0 1 2 3 ATIME (ARBITRARY UNITS) TIME (ARBITRARY UNITS)
Flfl..2.J Schematic illustration of temporal evolution of medium subjected to
slowly varying external load. (a) Evolution towards increasing
strength (b) Evolution towards failure.

3. INSTRUMENTATION AND DATA ACQUISITION
- 15 -
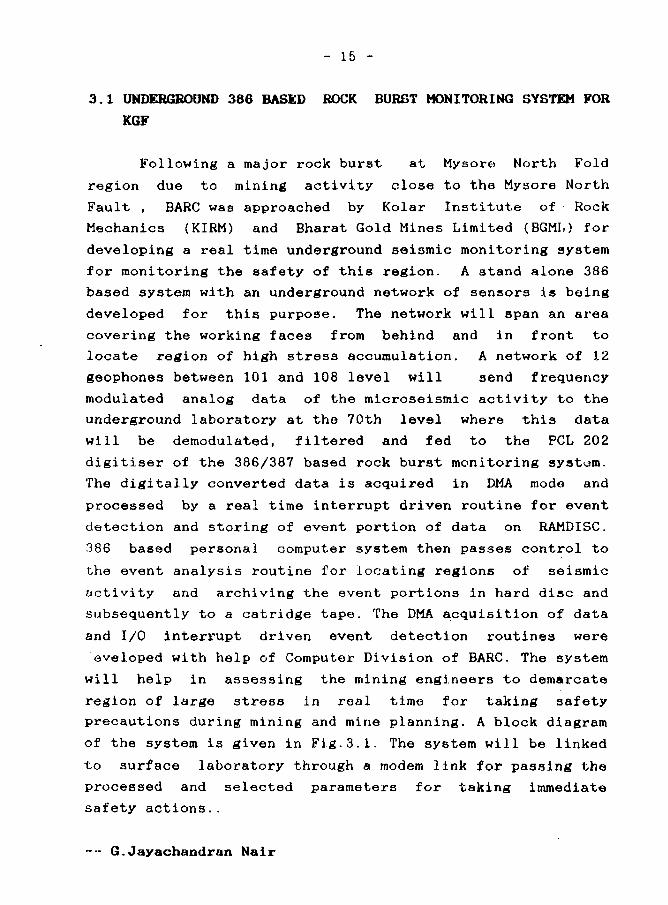
3.1 UNDERGROUND 386 BASED ROCK BURST MONITORING SYSTEM FOR
KGF
Following a major rock burst, at, Mysore North Fold
region due to mining activity close to the Mysore North
Fault , BARC was approached by Kolar Institute of Rock
Mechanics (KIRM) and Bharat Gold Mines Limited (BGML) for
developing a real time underground seismic monitoring system
for monitoring the safety of this region. A stand alone 386
based system with an underground network of sensors is being
developed for this purpose. The network will span an area
covering the working faces from behind and in front to
locate region of high stress accumulation. A network of 12
geophones between 101 and 108 level will 3end frequency
modulated analog data of the microseismic activity to the
underground laboratory at the 70th level where this data
will be demodulated, filtered and fed to the PCL 202
digitiser of the 386/387 based rock burst monitoring system.
The digitally converted data is acquired in DMA mode and
processed by a real time interrupt driven routine for event
detection and storing of event portion of data on RAMDISC.
386 based personal computer system then passes control to
the event analysis routine for locating regions of seismic
activity and archiving the event portions in hard disc and
subsequently to a catridge tape. The DMA acquisition of data
and I/O interrupt driven event detection routines were
eveloped with help of Computer Division of BARC. The system
will help in assessing the mining engineers to demarcate
region of large stress in real time for taking safety
precautions during mining and mine planning. A block diagram
of the system is given in Fig.3.1. The system will be linked
to surface laboratory through a modem link for passing the
processed and selected parameters for taking immediate
safety actions..
— G.Jayachandran Nair

FM
surface lab
1
FIoPPy .
RAMdisc
25 MB
MODEM
1
1RS232
Fig.3,1 Block diagram of subsurface rock burst monitoring system.

- 17 -
3.2 SEISMIC DATA ACQUISITION SYSTEM FOR DELHI SET-UP
An event data acquisition system was operated at New
Delhi network to separate event portions of the continuously
monitored online data. It was experienced that the data from
the triangular array is usually very noisy during the day
interval mainly caused by -the city traffic, which has
resulted in often false triggering and missing of very small
genuine events.
A continuous recording system was considered to be the
alternate solution to this problem. A system is now designed
and developed to record unedited data from the triangular
array.
This system utilises data from three low gain outputs
from sensors of the triangular array, another three ultra
low gain outputs of the same sensors, a fast time code (5
pps, 10 sec. time frame) and the existing time code
(equivalent to IRIG H, 1 pps and 60 sec time frame).
In the data acquisition system all these channels are
digitised at 25 samples per second and stored in two banks
of the memory alternately. The size of each bank is 64K
words (12 bit word) providing 8K words of memory for each
channel. Each bank of the memory accomodates data for six
nd a half minutes and this data is transferred to magnetic
tape in about 42 seconds, at 8 time3 the acquisition rate.
The data is recorded at 3-3/4 inch/sec tape speed. The tape
deck is thus operated in interrupt mode, which enables data
for nearly 24 hours duration to be recorded on a single
track of 3600 feet long tape. The four track tape deck (TEAC
X2000 deck) enables total four days of data to be stored on
a single tape spool.
A system is also developed to edit and transfer event

- 18 -
portions, to another tape, under manual control. When event
list is prepared from analog data monitored on a paper
chart recorder (run at 2.5mm/sec continuously), the event
data for 24 hour duration can be transcribed to the library
tape at 8 times the acquisition rate.
— V.G.Kolvankar, V.N.Nadre and D.S.Hao
3.3 SURVEY CONDUCTED FOR LOCATING A SITE FOR A SEISMIC
NETWORK NEAR TO THE PROPOSED SITE FOR NUCLEAR POWER
PLANT AT JAITAPUR, RATNAGIRI DISTRICT, MAHARASHTRA STATE
A seismic network to monitor microearthquake
occurrences is required to be established around Jaitapur,
to investigate the seismotectonic status of the region, to
study the properties of earthquake source zone, to study the
attenuation characteristics of the site region and based on
these observations, to assess seismic hazard to the proposed
nuclear power plant.
As per the specifications of the IAEA, an area of
about 1000 sq km is required to be monitored by the
microearthquake network around the proposed site, link these
stations to a central recording place and record this data
on a common time base in continuous fashion.
The terrain around the proposed nuclear plant site
consists of small hills and valleys. Hilly range of Sahyadri
mountains runs parallel to the coast about 50 km away.
Therefore, the selection of individual station sites in this
region is required to be done very carefully so fs to
achieve good communication (wireless) with master receiving
station on 24 hour basis. Bombay-Goa road (National Highway
no.17) which runs parallel to the coast, almost bisects this
region. Several small roads run from this highway into the

- 19 -
interior area providing access to various probable sites. A
preliminary survey conducted around the northern side of the
proposed project site, indicates that at least 8 to 10
suitable sites which satisfy minimum criterion of a seismic
station, can be located. A place named Nandivade about 35
km south east of Jaitapur and placed at a height of about
300 feet, can be considered for placing master receiving
station. Logistics of this place can be further explored.
The area required to be investigated, lies just about
80 km away from farely active seismic region of Koyna and
Warna and a good seismic network can provide data from the
earthquakes occurring in this region also.
A portable seismograph consisting of a one Hertz
natural frequency seismometer and microearthquake helical
drum recorder was utilised in the survey. The system was run
at the outskirts of Ratnagiri City. Samples of the records
obtained are illustrated in Figs.3.2-3.4. The filter bands
of DC to 2.5 Hz and DC to 5 Hz were chosen in order to cut
down cultural noise which is prominent above 5 Hz. When
seismometer is installed in the clamshell (a metal cylinder
with a lid, concreted to bedrock below ground level) much
away from artificial noise sources, the broad band (up to 25
Hz typically) noise level would be similar in nature to the
one obtained using 5 Hz bandwidth in this case. A well
"onditioned station in this region can be operated at around
100K or 200K displacement magnification (for signal
monitored on helicorder with background microseisms of 2 to
3 mm peak to peak) for signal bandwidth of DC to 25 Hz.
The seismic noise data obtained at Ratnagiri site is
compared with that obtained at Bhatsanagar using the same
set of instruments. Fig.3.5 provides a part of the record
obtained at Bhatsanagar where the system was operated at the

- 20 -
same magnification of 100K but at a wider bandwidth of DC to
12.5 Hz.
This survey waa carried out at the request from
Nuclear Power Corporation.
Reference:
1. Kolvankar,V.G.(1989).Report on a preliminary survey
conducted for locating a site for a seismic network and
on the seismic noise sample obtained near to the proposed
site for nuclear power plant at Jaitapur, Ratnagiri
District, Maharashtra State.
— V.G.Kolvankar

- 21 -
"*•"• -' '—t y*" ^^rZ^^^T^^^^^Zrr^iZ^^3??^^
**"""'^i^'*-*^'*^.** * * " ^ ^ i " S i (t fMl'itfc " ' -^^V^1*'"-*^-;- '
Fla.3, :> Seismic noise sample obtained on 2nd June 1989 at
Ratnajjlri. Recorder speed 4mia/a, Bandwidth Dc to 2.5 Hz Mat;-
uificatlon at 1 Hz is 200K aprox.
Seismic noise sample obtained on 3rd June 1969 at
. Recorder speed 4mm/s, Bandwidth Dc to 5 Hz Hagnifica-tlon at 1 Ha is 100K aprox.
3 ̂A Seismic noise sample obtained- on 3rd June 1989 at
Ratnugiri. Recorder speed 4mm/a, Bandwidth Dc to 2.5 Hz Mag-
nification at 1 Hz is 100K aprox.
^^^^^^^^3SC^^^^^^^
Fig.3, 5 Seismic noise sample obtained at Bhatsanagar. Recorder
.̂pctd 4mm/a, Bandwidth Dc to 125 Hz, Magnification at 1 He is
100K aprox

- 22 -
3.4 DEVELOPMENTS IN SEISMIC DATA ACQUISITION SYSTEMS
During the last six years, various seismic event
signal acquisition systems were designed, developed,
installed and operated at various field sites. The seismic
signals acquired belong to different signal bandwidthe in
the band from 0.02 Hz to 250 Hz. All these data acquisition
systems were built around a unique technique of recording
multichannel data on a single track of an audio tap© in
digital form. All these systems feature programmable
sampling rate and programmable number of input channels.
Table 3.1 provides the technical details of various
systems developed. Four of these systems acquire only edited
event portions of online data, whereas long period data
acquisition system at Gauribidanur and short period system
at New Delhi, acquire continuous, unedited data. Various
time indexing systems to suit different signal bandwidths,
are also developed.
Reference:
1. Kolvankar.V.G., Nadre.V.N. and Rao,D.S.(1989).Seismic
Data Acquisition System,Special issue on Instrumentation,
Indian Journal of Pure and Applied Physics, 1989.
(in press).
— V.G.Kolvankar, V.N.Nadre and D.S.Rao

- 23 -
U H t J.I I C C M I M L titIAH.5 Of YMIOUS SEJMJC MJA AMulSlllu* SV5IEIIS DEvELOf£0 Wit IEUG OHhMEO.
ifEUFIUJirrtS ciA SMUT PEilOv 66* LuliS PERIOD i.&f RuUiURSI IHAISA WlTSE.K DELHI SHOkl PtH. KOTA 6LriSI
lade of ipti. Interrupt Continuous Intirrupt Interrupt Continuous Interrupt
KD. ot sci t t i i 3l seistic 7 » m i ( 15 seism t! seisuc 7 setftic 34 v n w ccf.4intlii4.Kloj) • t u t coot • tu t cede > lite cole • Hie code * tiie code • t i x CDde
tut ir.ociin; i p;i, 10 sec. A pulse every 100 pps, 5pps, 10 sec. 5pps, It sec. 160 pps.l sec.iistrt. Uerul ine true ten see. 10 t i t . I iec. tiie tuf frue U»r inn l m iriietut coce) me tutt I nit
Ulw«i(iff , Di,s,dours,nni, G*rs,flours,«<«, D^ifi^ouri, <i in col. 2. ll I I COl.2. Diyt, houfi,
tnctaiai i>C0i lect.reir.eicnt <nd >e<r. •ini.secs. tint i tc i .no.ptUpsrii m e
Seii.>i{n<! i»no. ihj io |0 n; ,ol ri: to .2 M 8 hi to 250 h( I tit to 10 hi I hi to 10 hi. I hi to lOv hi.
(>i;it<] tcrxti. iS> itnliil 2 tuples/ 1000 tuples/ 10( sttples/ 25 m p l t s 500 t i t p l f t /
r j u i l T ens >oro) tn*n /sec. ciu« /sec. chin'sec. chin /tec. /chin 'sec. cA<ft/trc.
lnp»l OiU f i le 1600 .orils/se:. U •orts'sec. 16,000 •or«»/sec. 1600 «oris/su. 2C0 norSs/MC. 1,2500 »wfls/MC.
lou l D<WO rite IS.2 • t i t t 'sec. 1)2 bits/sec. 1)2 kii ls/tec. I f .2 ktits sec. 2.4 k i i l / iec . 150 k b i l s / m .
Dtu r icwJinj i f .2 kCils/iec. If .2 kt i t t ' tcc. 24 loi t i / tec. l f . 2 to i t i / i t c . 19.2 koi t t / t ic . IB.7 k l i t t / t i c .••}'«• Ueil tuel UOO tuev (I/Btk of input (reil t i u ) IB t j t t t r u l
input 0<u n t t l aa< r*t») l i te speed!
Kiccrluj >rdu 4 tr tci , I M ' spool iteci. Urco'din; n utnti out on i single trick it i t i ie uting biphise code.
'<pt stci u » l lit <ll i r ' t " iudio protfdioojl deck !cu nke 1-2000A is used, this : i (our trick, su held s>str»deck, I t i U r t i <gto record f i c i h t / mtlt eilcrnil control.
Ojer. tipe iptee 3.?5'/jec. 3.75'/»ef. 7.5Vsec. 3.75'/iec. J.75*/sec. J.75'/sec.
f*pe pjcunj «»ni. 5lT0 t m / m t i i 5l2o biti/incti 5200 bits/inch 5120 tits/inch 5120 kits/inch 4986 bits/inch/ U J I I /trick /trick /trick /trick /trick
Upt UJM ni»ell t i ie 3'J-160 b, 10.5 inch du. tipe spool, 0.25inch rndth, 3400 feet leoglh —
I i p i tif.iiX, li n .crCi 70 n >ords << n moiii 70 M aords W K lords it I) nerds
ti;. :l e.cnls C.tr 5w no. Lasts lor oO C<er 600 events Over 700evrncs U i t s lor 4 Over 1000 n.rntsrtcorjt l / t ipe ld»», ICustCiin.) diys, Idur. * 4 seel ' Uur« I t in . f in . I dips.
nttwy u:« 121 tor Si o4i aords MK »T I (S 32 K nords 128 K nords 64 I vor di.
i isis : l e<enl iriqttrmg Uo binis, eicn etent t f iq . rxot I f i j . tuo binks, eich eient tr ig.r t c c r i u ; l r SlA.LIn coip. D< !2 C aords d, STA.L7A t r SIA.LIA of 64K aords, by STA.LlA
trmsfers a^U tc coip. cotp. trinsier d i t i to coip.• i ] tipr, l i u r m t f l r ng Upe, i l t t r n i t t l f
C . t j . t i f«.L tni sisteis ;ro»iafi u l t ip le ied oigit i l ltd pi f i l l f ' , inilog outputs.
Tnr it cot, Jin. IW Jin. JSB7 Jin. H8« < April 1938 Jin. 1969 I Hired 1909
• iiscet c;enttgn m tertimted in June 1996.I £.<ot lt\t ic^.isiticn >,Ur« >i> i f i U l U d in G:t. 19B3 i.id this systei is repliced aith Continuous open tut one in 198

3.5 INTERFACING SEISKIC LA?.* ACQiiiiiiTIO^ SYSTEM TO IBM PC
A computer software is duviloped to make multisensor
seismic data recorded 0,1 a audio tape at various field
systems, IBM PC com no 1. ible. PC bssed software consists of
two parts. In part ona, x.h-e binary data replayed from tape
deck is read in to fV; using assembly routines, at real time
throughput rate of ,^.2. Kbaud ana later it is converted in
to ASCII format ;/x, ::':. :s made compatible for general
processing. In part two, selected portion of this data is
utilised to get the computer plot output. This part is
developed using PRGFOR? and JPLOT routines available for PC
systems.
Using this facility, seismic event signals recorded by
various daT,a acquisition systems at. Gauribidanur (LP and
SP), Bhcstna and at N:;w Dalhi can be extensively processed in
Fig. 3. 6 ;. r,(< .'."•' orc/idi computer plots of event data
froiii a .')2 channel &'-t.•,'»", •:...!..i Koquiisition system and another
recorded in 8 (}<~>-u.r •:''• '.• < .. ; ••'. ̂ J -Lath acquisition system at
G" .• ribidanur, respec: «.••.
».:. S.Rao, T.S..̂ a.:u.. .<..."•.... • • -:.\.d '. G, Kolvenkar;- N u c l e a r Physic.<; L.'i•-• i.::- • • -\

- 25 -
TC
R4
R4
KP
Kr"
XO
XO
BB
BB
BB
TC
B-
B-
B-
B-
B-
B-
B-
B-
B-
B-
K-
R-
R-
R-
h-
k--
H-
R--
R--
R--
- 1
E-W
N-S
E-W
N-S
N-S
E-W
VER
E-W
M-S
-II
-10
-09
-08
-07
-06
-05
-04
-03
-02
-01
-1U
-09
-08
-07
-06
-Ob
-04
03
02
01
-\/\\/\y\y^
0
I I L _!..._ 1_
10 15 S
fig.3.6 A computer plot obtained in PC of a teleseiamic event
recorded In event data acquisition system at Gauribldanur.
Arrival time at GBA.17:05:23 on 348th day of 1980. All 32
channels ore recorded on a single track of o magnetic tape.

TIME
MARK
BB
BB
BB
CODE
meVERT
• N-S
E-W
II
LP;
to
••-#-
^^M^^iiiH^ LP XOVER
^ v w ^ ^ W W ^ ^ ^ LP B~10
^ ^ MARK II1C B
10 15 MINFig.3.7 A computer plot obtained in PC of an event signal reoorded in LP
system at Gauribidanur. Arrival time is 19:18:54 on 257th day of 1989.

- 27 -
3.6 INSTROMENTATION AND OPERATIONAL PERFORMANCE OF AWIRELESS TELEMETERED SEISMIC NETWORK AT BHATSANAGAR
An indigenously built, eleven stations Wireless
Telemetered Seismic Network (WITSEN) is commissioned at
Bhatsa, Shahapur Taluka, Thane District, Maharashtra State,
early in 1988, to study the reservoir induced seismicity
(RIS) of the region.
This network consists of eleven stations spread over
an area of about 400 sq km covering catchment and
surrounding area of Bhatsa reservoir under study. Fig.3.8
provides the map of the locations of these stations. Of the
eleven stations, ten stations are operating with single
vertical component seismometers and the station at Khardi is
providing three-component seismic data.
Field 3V3teii
The system at each field station comprises a seismic
sensor acting as a velocity transducer followed by a signal
conditioner consisting of a balance amplifier with a gain of
1000, a band pass filter (1 to 30 Hz, 6 dB per octave roll
off beyond 10 Hz) and a frequency modulator ( Fc= 2160 Hz,
deviation 40 % for 2 Volts input). A calibrator is also
included which provides 2 Hz sinusoidal signal to the
calibration coil of the seismometer once every 24 hours. The
i?'M signal is given to an UHF transmitter operated at spot
frequency in the band of 461.5 to 462.0 MHz. The supply to
total field system is through a 12 V 90 AH lead acid battery
which is trickle charged by a 32 W solar panel. Typical
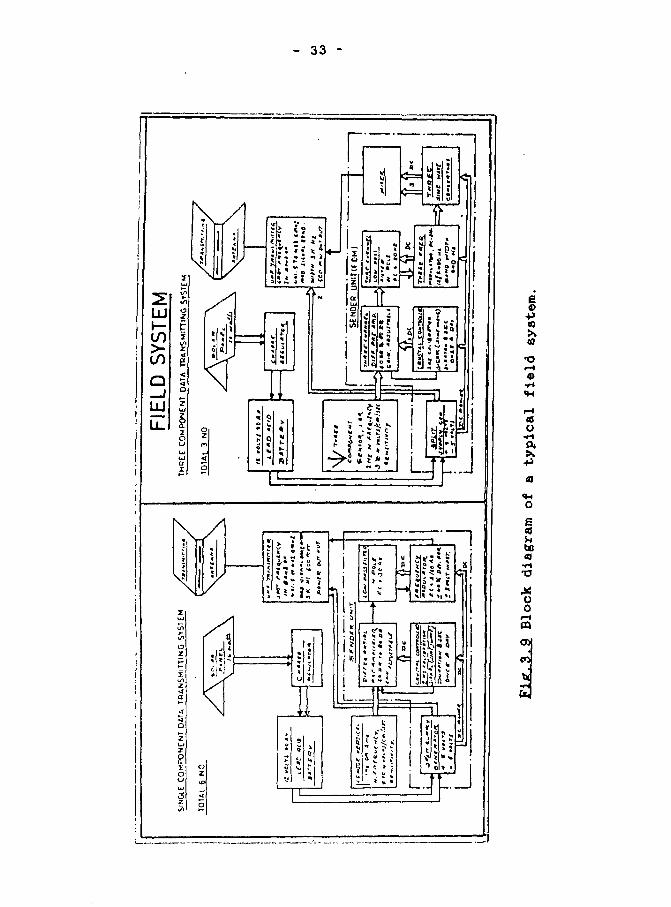
field system is illustrated in Fig.3.9.
The housing for tho sensor, sender unit, charge
regulator, is a clamshell which is concreted to the bedrock
below ground level whereas the solar panel, transmitter and
- 28 -
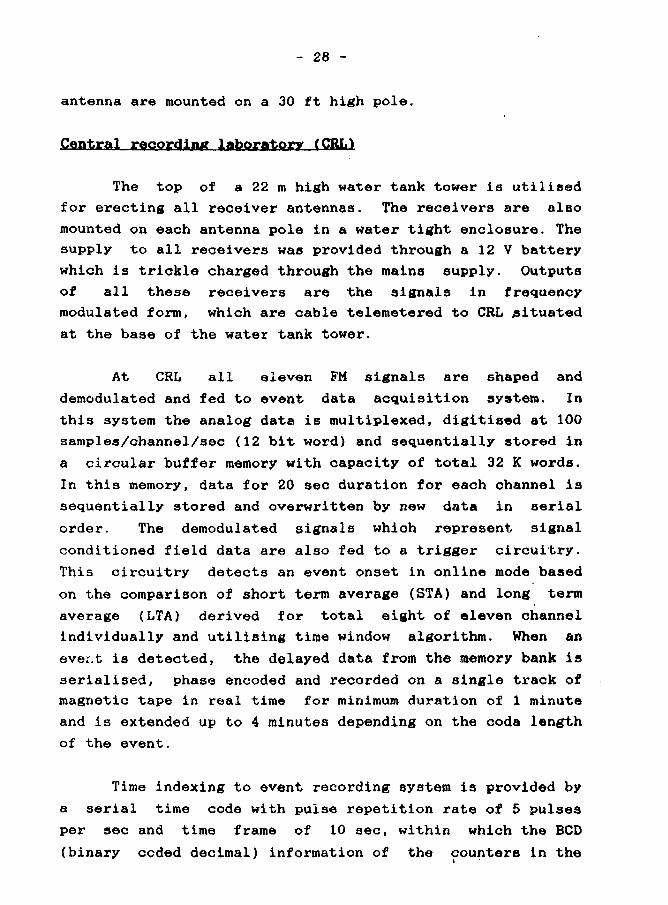
antenna are mounted on a 30 ft high pole.
Central recording laboratory (CRL)
The top of a 22 m high water tank tower is utilised
for erecting all receiver antennas. The receivers are also
mounted on each antenna pole in a water tight enclosure. The
supply to all receivers waa provided through a 12 V battery
which is trickle charged through the mains supply. Outputs
of all these receivers are the signals in frequency
modulated form, which are cable telemetered to CRL situated
at the base of the water tank tower.
At CRL all eleven FM signals are shaped and
demodulated and fed to event data acquisition system. In
this system the analog data is multiplexed, digitised at 100
samples/channel/sec (12 bit word) and sequentially stored in
a circular buffer memory with capacity of total 32 K words.
In this memory, data for 20 sec duration for each channel is
sequentially stored and overwritten by new data in serial
order. The demodulated signals which represent signal
conditioned field data are also fed to a trigger circuitry.
This circuitry detects an event onset in online mode based
on the comparison of short term average (STA) and long term
average <LTA) derived for total eight of eleven channel
individually and utilising time window algorithm. When an
ever.t is detected, the delayed data from the memory bank is
serialised, phase encoded and recorded on a single track of
magnetic tape in real time for minimum duration of 1 minute
and is extended up to 4 minutes depending on the coda length
of the event.
Time indexing to event recording system is provided by
a serial time code with pulse repetition rate of 5 pulses
per sec and time frame of 10 sec, within which the BCD
(binary ceded decimal) information of the counters in the

- 29
chronometer, i.e. for days of the year, hours, minutes,
seconds, year, event number and elapsed time, is encoded.
A multichannel waveform display system associated in
the total set-up provides display of 8 or 16 channel steady
waveforms on a general purpose single channel oscilloscope
screen which enables one to monitor the functioning of the
field channels in online mode and replay of event data in
online as well as in offline mode.
The online set-up comprises UHF receivers, FM
demodulators, event data editing and recording system, tape
deck (operated in interrupt mode) and timing system, which
is powered through 500 VA OPS (Uninterrupted Power Supply)
and is capable of providing power to the system for minimum
48 hour in continuous absence of mains power supply. The
rest of the system works on the mains power. The entire
system described above runs on 24 hour basis and is fully
automated and requires least maintenance. Block diagram of
CRL is illustrated in Fig.3.10-11.
Installation and operational performance of the telenet
The installation of seismic telenet at Bhatsanagar
began in last week of December. Bhatsa Dam Division No.l
(BDD1) provided good support particularly in the preparation
of civil structure in the field, in the form of installationri antenna pole and clamshell at each field site. Water tank
building which is utilised for erecting all receiving
antnnas, was also provided and conditioned by this
division. The central recording laboratory was completely
set up in early April 1988 and the last of the field station
at Kasti was installed in second week of May 1988.
All the telemetry system in general functioned very
well. No technical failure took place in any of the field

- 30 -
system. However, there were problems of non-technical
nature. In rainy season solar panels were unable to keep
field battery charged. The solar panel rated for 32 W
power, provided only about 30 to 40 % efficiency. It is
estimated that true 32 "W panel can provide sufficient charge
(5 VA/day) to keep battery running even during rainy season.
Due to cultivation and very poor road conditions, on an
average 7 to 8 stations were possible to operate during
rainy season. During nonmonsoon period, on an average 10
stations have functioned satisfactorily at a time and have
provided good data.
All the key systems at CRL which include signal
receiving system, data acquisition system, timing system,
display system and signal reproduce system has functioned
very well. No technical failure in any of the system has
been reported so far. However, due to erratic mains supply
position UPS system failed 5 to 6 times. Long interruptions
were encountered by deploying standby UPS into operation.
Time code generator was disturbed few times due to lizard
and rat movements.
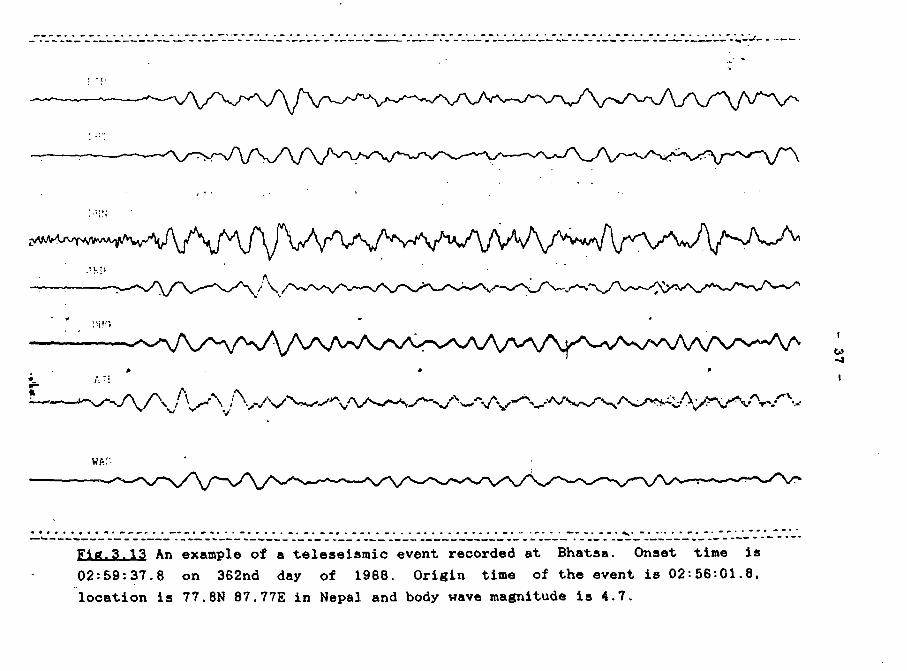
During the operation of the network in the last 18
months the system gathered data of hundreds of local and
teleseismic events. Two of these events are illustrated in
Figs.3.12-3.13. Fig.3.12 also illustrates the same event
signals recorded on helicorders (60 mms/sec), the type of
recording media used in the country in INDOSEN
(individually operated seismic network) and demonstrates the
superiority of WITSEN over INDOSEN in torms of resolution,
relative time accuracy, dynamic range etc.
The project underwent several changes in original
planned set-up as we gain more and more experience in the
operation of various field and laboratory instruments. An
operational and maintenance manual in which all aspects of

- 31 -
our experiences are included, is prepared to assist
different technical personnel and laboratory operators in
their day to day work.
A separate write-up is prepared to provide guidelines
based on our experience in Bhatsa for building a network of
similar specifications which can be systematically
commissioned in about four to eight weeks, at any place in
the country. This write-up also provides estimates of field
and laboratory system, manpower, cost structure and time
schedule for building similar network and also highlights
the advantages of WITSEN over INDOSEN system.
References-
1. Kolvankar.V.G., Nadre.V.N. and Rao,D.S.(1989).
Instrumentation for wireless telemetered seismic network
at Bhatsanagar, presented in the National Seminar on
Exploration Geophysics,Madras University, December 11-13.
2. Kolvankar,V.G.(1989).Operational and maintenance manual
for eleven station wireless telemetered seismic network
at Bhatsanagar.
3. Kolvankar,V.G.(1989).How to build a wireless telemetered
seismic network, BARC report (in press).
-- V.G.Kolvankar, V.N.Nadre and D.S.Rao

- 32 -
M It'UI71*10*
RAOtO TELEMETEREDSEISMIC NETWORK.8HATSANAGAR
•at }•<••>»
WttfilM'•*!/H.ro'I
S C » U . I.SO.(KM.
JTJO 33T
Fig.3.Q A map illustrating the location of field stations
and CRL of the telenet operating at Bhatsanaffar.
- 33 -
r
LU
CO
£/5Q
1
UJ
132
2
THA
f.O
ATA
ZUi
1
I C
OM
I
UJ
aX
fti
0
ak.
i
Bi
n
iS
I*T
i •* ?
LI
?
liii
oz
l«
x\
e4)
I—I
aa•Ha.>
o
«bo
Xoo
CD
CO
•H(X,

EVENT DMA ACQUISITION SYSTEM
mj/fL / 1 I I 4 AQ* TM**+ Cf
r/lT»A
of
fief Krr/tr Ml «p»»• O.II'Sri Thmrunit mtrr • t>*t
It C«LOfcV"Ttf
inp<rr zitoei*- voV. j .
S"fiZ
Mur. i l l
on nit M—
mm* a i ecu rfi v01 %y»lLT».
!//• rt $ mmt
TOTAL
1 r I'M rsi 7 «
P"tl*T •StotTMTf
ItOB *t
fllTt/t
>̂ f# eag# mwtptm
nut iMfoto »t/ d*r MOBM
JOOO/T
LtMt
ttnty
&••***
tmair /ouH CMAM.Ort/tlOMUM
»r l
r
u• •CO
r M*T*e- r*
air. Tan
ft ft*.
if*
ti*tt
UNINTTERRUPTEO POWER SUPPW 50CMRAnN0 FOR LAB INSTRUMENTS LAB SYSTEM!
\
co
Figr3.10 Block diagram of event data acquisition system in laboratory.

( EXJER^ML)SINGLE ANO THREE COMPONENT DATA
LAB SYSTEM L A B S Y S T E M ^ENT DATA REPLAY ANO PROCESSING SYSTEM
RECEIVING SYSTEM
TOTAL 9 NO
UHf If IfFt* JPOTIN e*»Bi f f S To0 SjU
SIVSK
OF
VOLTiSEHSITIV/Ty
T12 VOLTS FM ~SIC\iL
sc SUP fir TOFKOM LAB LAB
/ « TUT 4
1tHM
uro»r
Timsran
J »/, T**1 STIZI
0. i
VJi
l/JV'T_ T O -
UL
-r, *
4 *«
20 * #•
us C»i • /co
sM*z At y/ . * • MM
j e l l * ««f«w
st»*mft'SO* • J
INSTRUMENTATION SET UP BHATSA PROJECT
Fig.3.11 Block diagram of event data replay & processing system in laboratory.

^
'.•*<*v«**v*(\fmj \ J\vrf**'V»wW"1''
Fig.3.12 An example of a blast signal recorded at Bhatsa. Onset time of 02:09:61
on 142nd day of 1989. Corresponding signal traces on helicorders for three
monitored channels, are shown in circles. Note the weak signal traces from
Birwadi, Bhatsa and Lahe stations.
^ ^ ^ ^ ^ ^
Fie.3.13 An example of a teleseisraic event recorded at Bhatsa. Onset time is
02:59:37.8 on 362nd day of 1988. Origin time of the event is 02:56:01.8,
location is 77.8N 87.77E in Nepal and body wave magnitude is 4.7.

- 38 -
3.7 STRONG MOTION MONITORING OF ROCK BLASTINGS AT THE RAPP 3
AND 4 EXCAVATIONS, KOTA
At the Rajasthan Atomic Power Project (RAPP) 3ite at
Rawatbhata, Kota, a multichannel strong motion seismic
monitoring system was temporarily installed in March 1989 to
measure ground motion parameters due to rock blastings in
the RAPP 3-4 excavation area. This 18 channel experimental
system comprised four 3-component geophones, seismometer and
accelerometer field stations of which the nearest from the
centre of the excavation was located about 45 m away while
the farthest was about 600 m away, just outside the reactor
building RBI. Frequency division multiplexed (FDM) seismic
signals were transmitted through overhead cables to a
centralised interrupt mode (only triggered events) digital
recording system set up at the Nuclear Training Centre (NTC)
building at plant site. A multichannel analog waveform
display unit was also incorporated for visual inspection of
selected signals. The overall monitoring system had a flat
response upto a frequency of 100 Hz.
At the central recording laboratory, all FDM signals,
(installed 21 channels; 18 working channels) were
demodulated and routed to a data acquisition system where
the data channels were sampled at 500 samplea/soc/channel,
digitised (12 bit word) and stored in a circular buffer
providing 2K words/channel. These signals were also given to
a t lgger circuitry which detects an event onset based on a
comparison of short term average (STA) with long term
average (LTA). When an event is detected, the data
corresponding to four second duration with some pre-event
portion is recorded on a single channel of an audio tape.
Time indexing is provided by a serial time code (100 pps,
one second time frame) to get absolute time information from
10 millisec to a day of the year. The laboratory system was
automated to record seismic signals from blasts, performed

- 39 -
during early morning, afternoons and in the late evening.
The data from recorded tapes were displayed on a
multichannel waveform display system during non-blasting
hours and relative signal amplitude for all the blasts were
logged. Typical signals recorded are illustrated in
Fig.3.14.
Results
The experiment continued for 80 days (March 20-June 7,
1989) when 510 blast signals were recorded. From the data
obtained, the peak ground velocity (PGV) at all the four
field locations and peak ground acceleration (PGA) at one
important field location (NTC trench) were estimated. The
PGV ranged from 0.6 to 9.4 mm/sec while the maximum PGA was
estimated at 13.4 mm/sec2. From these set of estimates it is
seen that the largest blast seismic signal was feable enough
and well below the level at which any surface vibratory
effects could become noticable.
A detailed report on above investigation (Arora, 1989)
was communicated to the project authorities of Nuclear Power
Corporation.
References:
1. Arora,S.K.(1989).A report on the estimation of strong
ground motion parameters due to rock blastings at the
RAPP 3 and 4 excavations, Kota.
2. Kolvankar.V.G., Nadre.V.N. and Kulkarni,A.G.(1989).
Instrumentation for monitoring blast signals at RAPP,
Kota. BARC report (in press).
— S.K.Arora, V.G.Kolvankar, V.N.Nadre, Y.S.Bhadauria,
A.G.Kulkarni, P.C.Mitra, K.R.Subbarami and S.V.Sharaa.

O n s e t t i m e : 0 6 : 0 6 : 4 7 «2 on U O t h J a y o f J9B9
G6000 T ccmp . P t i ' O & V / c m
to
1 S6000 I co>( . Pit 2. 0 6 V/cm
E600Q' V coop . Pit 2. 0 5 V/cm " 1 ;T"7\~"•* '-"-• \ .' ' : * • ' \ ' V/ "
|, flcophona V coo?.. P U 2. 2.6 V/co. _!/._.!; JL_;ril_L.i_i._ . , _ _ _ _
- - - " :• - ; .••:- ^-...^..i^i.j—U :-- : : :-
"J . --
|Oeophono L ccop.. Pit 1. 2.6 V/ca. i
'-:::.:•.. li:i S6Q00 L comp.. Pit 3. 2.6V/ca. .
S6000 V cocp-. Pit 3. 2.6V/c».
E6000 L corp.. Pit 4. 2.5V/ca.
Fig.3.14 A typical illustration of a blast signal recorded at RAPP Kota. This
record shows 8 of the 21 channels providing three component velocity and
acceleration information of ground motion at different distances from source.
O
- 41 -
3.8 SEISMIC DATA EXCHANGE USING INTERNATIONAL GATEWAY PACKET
SWITCHED COMMUNICATION SYSTEM
Global seismic waveforms and parameter data play an
important role in the detection and identification of
seismic events worldwide. One of the major aspects of the
data exchange system is to establish and utilise a rapid and
reliable data communication links.
The commissioning of the International Gateway Packet
Switched System (GPSS) by Videsh Sanchar Nigam Limited
(VSNL), Bombay has opened up possibility of data
communication between computer and data terminals world
wide. The GPSS consists of state of art computer controlled
dedicated packet switch with provision for error detection
and retransmission to achieve almost error free data
transmisson with high network efficiency.
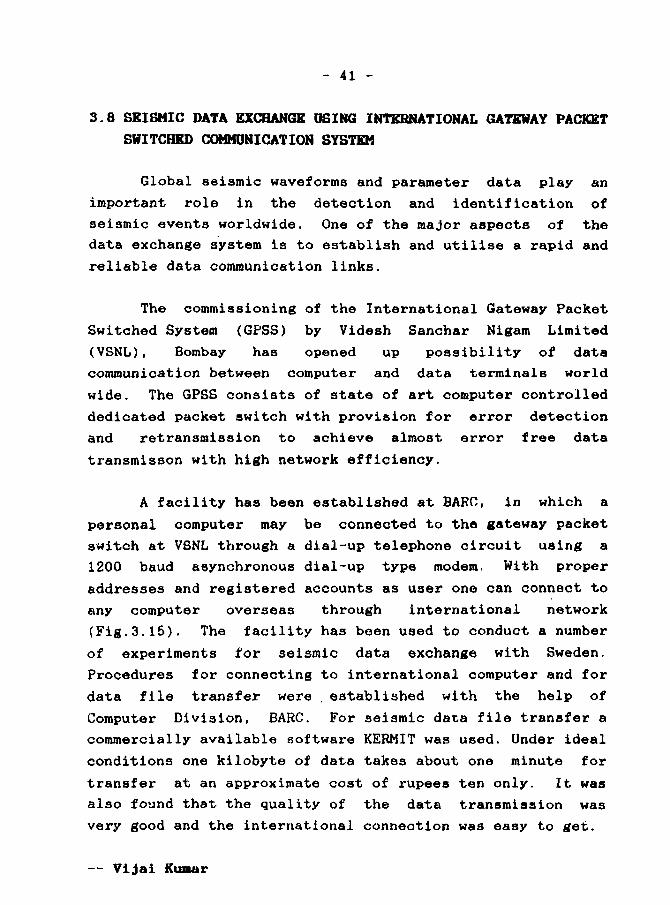
A facility has been established at BARC, in which a
personal computer may be connected to the gateway packet
switch at VSNL through a dial-up telephone circuit using a
1200 baud asynchronous dial-up type modem. With proper
addresses and registered accounts as user one can connect to
any computer overseas through international network
(Fig.3.15). The facility has been used to conduct a number
of experiments for seismic data exchange with Sweden.
Procedures for connecting to international computer and for
data file transfer were . established with the help of
Computer Division, BARC. For seismic data file transfer a
commercially available software KERMIT was used. Under ideal
conditions one kilobyte of data takes about one minute for
transfer at an approximate cost of rupees ten only. It was
also found that the quality of the data transmission was
very good and the international connection was easy to get.
— Vijai Kumar

PLOTTER -»
MODEM
PC
PRINTER
DIAL-UP TELEPHONE
CIRCUIT(3QKms)MOC(EM
6PSS
1TO INTER NAT IC
klCTUIAni/fN t
to
I
Fig. 3.15 Block diagram of set-up used for accessing
international networks through Gateway Packet Switched
system.

- 43 -
3.9 SEISMIC NOISE MEASUREMENT IN PROVINCES AROUND THE ATOMIC
POWER PROJECT SITE AT KAIGA
Measurement of background seismic noise has been made
in three provinces for setting up initially 3 or 4 sensitive
seismic stations around Kaiga atomic power project located
along the course of Kali river about 3.5 km east of Karwar
coast in Karnataka, where it is planned to monitor regional
seismicity as part of seismotectonic investigations in that
region. It is expected that these high gain seismic stations
at relatively noise free locations would detect within about
100 km all microtremors down to a local magnitude of two.
Several noise samples (analog waveforms) in Kulgi,
Idagundi and Kumbarwad provinces were obtained in the month
of May 1989, on cassette magnetic tapes, digitised at a rate
of 200 samples per second per channel and analysed at
Trombay. Fig.3.16 shows typical digital waveform of seismic
noise sample reproduced for 40 seconds from wide band tape
records obtained at three different sites, where the
vertical bars and corresponding numbers for each record
represent maximum relative signal amplitude in digital
counts. Spectral analysis of the noise data is represented
by Fig.3.17 where power spectral density as a function of
signal frequency is shown for all the three provinces.
The main conclusions of this study are as follows
(Arora et al., 1989):
(a) Among various sites in the three provinces the cultural
seismic noise is found to be lowest at Kulgi (3-5 nm in the
frequency band 4-12 Hz) and highest at Kumbarwad (12-25 nm)
(b) The average noise amplitude at nearly one second period
due to oceanic microsei3ms are comparable in all the three
provinces (15-20 nm).
- 44 -
(c) Due mainly to the presence of tall trees and thick
layers of uiiconsolidated material below the surface, the
wind generated high frequency noise in the frequency range
above 4 Hz, which seriously interferes with seismic event
detection, is prominently large at Kumbarwacl. At Idagundi,
such noise is comparatively small, diminishing gradually
with increase in frequency untill about 30 Hz, where it
builds up again and then tapers off. The hard rock area of
Kulgi is found to be practically free from the contaminating
high frequency noises.
Reference:
1. Arora.S.K., Bhat.M.K., Kulkarni,A.G., Basu,T.K. and
Subbaramu,K.R.(1989).Seismic noise measurement in the
region around Kaiga Atomic Power Project (Paper
communicated to Bull. Ind. Soc. Earthq. Tech.)
— S.K.Arora, M.K.Bhat, A.G.Kulkarni, T.K.Basu and K.R.
Subbaramu

\'j ? i r m i c \\ o i J e " K -3 i g o
0 I
950
886
K u r r , b a r w a d
I c a g u n d
Ku I g
3
2
0 10 20 30 40SecFig.3.16 Typical digital waveform of seismic noise sample reproduced for 40 sec
from wideband tape record of (l)Kulgi, (2)Idagundi and (3)Kumbarwad channels.
Vertical bars and the corresponding numbers for each channel represent maximum
relative signal amplitude in digital counts.

- 46 -
a.a
a.a .
a.ai.
10 am 9mmeoueNcv
30 3 0
Kul 0 1
Fig.3. ;7 Power ispectral density as a function of signal
frequency estimated from noise data of (a)Kumbarwad
(b)Idagundi and (c)Kulgi sites.

- 47 -
3.10 DATA COMMUNICATION BETWEEN GAURIBIDANUR AND TROHBAY
USING COMPUTER NETWORK
The availability of commercial computer-to-computer
communication network in the country has provided the
opportunity to obtain seismic waveform digital data from
Gauribidanur promptly for further processing at Trombay.
Required infrastructure was established and experiments were
carried out to establish the procedures for quick and
reliable exchange of seismic data between Gauribidanur and
Trombay. Fig.3.18 shows the block diagram of the data
communication set-up. For transf erring the data from
Gauribidanur a personal computer is connected to the
Banglore node of the commercial computer network through a
subscribers trunk dial-up telephone circuit using a 1200
baud asynchronous modem. The data is transferred to Bombay
computer of the network using file transfer software FTP.
The data is fetched at Trombay by connecting a personal
computer to the Bombay computer through a dial-up telephone
circuit using another similar modem. FTP software is again
used for the file transfer.
It was found that the data transfer rate is about 4-5
Kilobytes per minute and the quality of the transmission is
good. The whole system is quite reliable except that some
times it is difficult to obtain initial reliable connection
for dial-up telephone circuits at Gauribidanur and Trombay
to access the computer communication network.
— R.N.Bharthur, Vijai Kumar, A.G.V.Prasad, C.A.Kxishnan,
B.Chandrasekhar,E.Unnikrishnan,T.K.Basu and K.R.Subbaranu

C-AURI BIOAMURSEISMIC ARRAV
STATION
BARC, TROMBAV
PC- MODEM
D I AL -UP TELEPHOI-JE
C I RC U I T •, e O Kt 1S >
DIAL-UP TELEPHONE
CIRCUIT (4O KMS>
BANGALORE
"NODE or
COMPUTER-TO
COMPUTER
COMMUI^ I CAT I ON
NETWORK
BOMBAY
NODE OF
COMPUTER-TO
COMPUTER
COMMUNI CAT I ON
NETWORK
Fig .3 .18 Block diagram of data communication set-up.

- 49 -
3.11 FABRICATION AND INSTALLATION OF HORIZONTAL COMPONENT
SEISMOMETERS
A set of four one Hertz natural frequency seismometers
were fabricated and assembled for recording the horizontal
component of earth motion. These sensors were installed in
the LP vault at Gauribidanur and Kashapur for experimental
purposes. At present two each of these seismometers in N/S
and E/W mode are installed in the clamshell at about 12 Km
from the recording laboratory along two arms of the
Gauribidanur array. The outpit signals are recorded
alongwith other seismic channels of the array. Typical
recordings of the signals from these seismometers are shown
in Fig.3.19.
— Vijai Kumar, Y.S.Bhadauria, E.Unnikrishnan, M.K.Bhat and
K.R.Subbaranu

- 50 -
j• ••: •{••.••i-
1 ' ' HtJ/Uil'JV'iVL'-ltfllijlil'aJj'll'i.l-
^U4vi|i!j.iii;"i:i;-*!"H---;We)
•)•• i : : ' i ••;;:,: i . • i • ; i i
Fig.3.19 Typical recordings of seismic signals by the
horizontal component short period system at Gauribidanur.
Traces (a)-(d) are signals from Eastern Kazakh underground
nuclear explosion of magnitude 6.2 on Oct.19 1989 recorded
by Kashapura N/S, Kashapura E/W, LP Vault N/S and LP Vault
E/W components respectively. Trace (e) is signal from a
local source (Kudramukh) recorded by LP Vault E/W component.

- 51 -
3.12 A PC/XT-MICROPROCESSOR BASED DATA ACQUISITION SYSTEM
A PC/XT-microprocessor based event detection and data
acquisition system for seismic signals has been designed and
developed (Fig.3.20). The system can accept upto sixteen
analog channels including time channel for digitisation at
sampling rate which is selectable among 10, 20, 25 and 50
samples per second per channel. It uses 12 bit analog to
digital converter in successive approximation mode for
conversion of analog seismic signals into digital data. A
modular software to acquire and process the data has also
been developed for use with the system.
The system employs short term average and long term
average ratio (STA/LTA) based event detection logia with
selectable number of channels to participate in an event
detection and programmable STA/LTA ratio thresholds for
individual channels. When used at 20 samples per second per
channel conversion rate, a 21 second circular buffer is
maintained to provide 20 seconds pre-event data. Suitable
data stuctures for STAs and LTAs for all channels selected
to participate in the event detection process are maintained
on real time base. Upon the detection of an event, pre-event
and post-event data of specified duration are transferred to
PC/XT on hand shake basis for storage on a magnetic medium.
The system has re-triggerable event detection logic and
digital event data can be easily converted into analog form
for visual display.
— B.K.Gupta, T.V.Sridharan and Vijai Kumar

CHROt-iO! 1ETER
ANALOG
INPUTS
FREE
O
U
IP
R
TIMER Ml-iD
INTERRUPT LOG1 •
UNI TV C-AIN
AMPLIFIER
12BIT
ADC
so85yt*.p+
MEMORV
PARALLELI/O
PC/XTto
»
Fig.3.2Q Block diagram of PC/XT-microprocessor based seismic data
acquisition system.

- 53 -
3.13 OPERATION OF SEISMIC AND AOOUSTC ARRAYS AT NEW DELHI
The continuous recording of seismic signals from one
Hertz natural frequency seismometers located at three
different field stations around Delhi was carried out. The
seismic signals are transmitted over wireless telemetry to a
central recording laboratory in real time for recording on
paper chart alongwith absolute time signals from a
chronometer. Scanning of the reoords was done every 24 hours
throughout the period.
The 3eismic array recorded on an average 11 seismic
events per day and played an important role in monitoring
underground nuclear explosion activity worldwide as well as
the local seismicity. The detection and identification of
nuclear explosion signals is carried out by applying
different criteria like velocity of propagation, azimuth of
arrival, wave pattern, spectral composition and
identification of characteristic seismic phases like P, S,
PcP etc. The array detected and identified all the
underground explosions carried out by USSR, USA and France,
during the period of the report.
In addition the array monitored continuously the
ambient atmospheric pressure fluctuations in the pasaband of
3 seconds to 110 seconds period by tripartite microbarograph
array. No infrasonic signal characteristic of atmoopherio
nuclear explosion was detected during 1988-1989.
— T.V.Sridharan, Vijai Kumar, P.C.Hitra, D.Tewani and
Mahendra Singh

- 54 -
3.14 BORE BOLE SEISMOMETRY
Development of borehole seismic systai
A seismometer system for use in a cased borehole was
developed. This system consists of a pressure capsule for
housing the seismic sensor and a borehole lock assembly. The
upper portion of the pressure capsule has provision for
placing electronic amplifier/modulator printed circuit board
for conditioning the seismic signal. The borehole lock
assembly is attached to the bottom of the pressure capsule
and is used to make a rigid contaot of the seismic sensor
with the casing of the borehole. The lock assembly is
actuated by mechanical manoeuvring a rope or cable used for
lowering the whole seismometer assembly in the borehole. The
development and fabrication of this prototype borehole
seismic system was carried out with the help of Reactor
Engineering Division, BARC. The prototype system has been
tested in the field with satisfactory results and is ready
for installation in a cased borehole.
— Vijai Kumar and Y.S.Bhadauria
Borehole drillipg operation
For the purpose of installation of the borehole
seismic system a 5.5 inch diameter borehole was drilled at
one of the field stations of Delhi seismic array by diamond
core drilling rig by the Waste Management Division of BARC.
The entire length of 60 metres has been cased with 5.25 inch
diameter seamless carbon steel pipes each 3m long and having
flush joints. The verticality of the cased borehole was
mapped throughout the depth with a special borehole camera
with the help of the engineers of Atomic Minerals Division
of Department of Atomic Energy. It is found that deviation

- 55 -
of the borehole is within four degrees from the vertical.
The borehole is at present undergoing leak tightness tests
prior to the installation of borehole seismio system at the
bottom of the hole.
— T.V.Sridharan, Vijai Kumar and P.C.Mitra
3.15 GROUND VIBRATIONS FROM VEHICLES AND AIRCRAFT FLIGHTS
A feasibility study was made /or ,romot^ sensing of
aircraft flights and vehicle movements by using seismic
signals generated by them. Experimental reeordings of
seismic signals from aircraft flights and movements of
wheeled and tracked vehicles as well as from many other
sources, on rocky and sandy grounds, were made. a
multichannel analog magnetic tape recording system in
frequency modulation mode was used to record the output
signals from an array of seismic sensors.
Spectral analysis of these signals and ambient seismic
noise were made. It is found that the spectral features of
signals can be used to distinguish between various seismic
sources (Fig.3.21).
-- Vijai Kumar and Y.S.Bhadauria

60 r-
CDAOo
O3
<20LLJ
UJ
.-(a)
i
s /(d)
J_ 110 20 50
FREQUENCY (HZ)100 200 500
Fig,3.21 Typical spectra of seismic signals at 50 m from (a)tracked vehicle, (b)
aircraft flight, (c)wheeled vehicle (3-tonner) and (d)wheeled vehicle(l-tonner).

- 57 -
3.16 SINGLE SEISMIC FIELD STATIONS
Narora
A single seismic station was set up in Environmental
Survey and Miorometeorological Laboratory, NAPP, Narora. The
seismometer is installed underground approximately 5 metres
below the ground surface inside a clamshell. The signal is
sent to the recording laboratory through 200 metres long
multicore cable. The recording is carried out on a helical
drum recorder. A typical seismic signal recorded at this
station is given in Fig.3.22a.
Jodhpur
A vertical component short period seismic system was
installed at Jodhpur. The seismometer is located inside an
underground clam shell, about 1 kilometre away from the
recording laboratory. Seismic signals are amplified and
frequency modulated in the field electronic unit and sent to
the laboratory through underground cable. In the laboratory
the fm signal is demodulated, filtered, amplified and
recorded on a helical drum recorder. A typical recording of
a seismic signal by this set-up iu shown in Fig.3.22b.
Other single aeiaalc stations
Four single component Seismic stations installed
earlier at Micrometeorological Laboratory, TAPS, Tarapur,
Micrometeorological Laboratory, RAPS, Kota, High Altitude
Research Laboratory, Gulmarg and Nuclear Research
Laboratory, Srinagar have been maintained periodically.
These stations have been working satisfactorily and have
produced useful seismic data.
— Vijai Kumar and Y.S.Bhadauria

- 56 -
(a)
"•*•
2 MINS
• > •*•<
«f «« *«++
"»'••••«»
(b)1MIN
Fig.3.2? Typical recordings of seismic signal at (a) Narora
(b) Jodhpur. Double arrows represent the seiemic
displacements of 4_/im and 0.5 /*.m at one Hertz for
(a) and (b) respectively.

4. SEISMIC DISCRIMINATION ST0DIES

- 60 -
4.1 DETECTION OF WEAK SIGNALS
A basic problem in time series analysis is to
recognise weak signals in presence of ambient noise.
Prediction error filtering can play an important role in the
detection of such signals. In order to achieve maximum gain
in the signal to noise ratio while using an array data, it
will be advisable to sum the various sensors data first and
subsequently apply the prediction error filtering to the
beamed signal.
In a 3tudy, 35 weak signals as recorded at
Gauribidanur seismic array were subjected to the even'-
detection method based on a combination of beam forming and
prediction error filtering. Signals were detected
successfully yielding an overall gain in signal to noise
ratio of about 8. Fig.4.1 illustrates one of the examples of
signal detection.
— Falguni Roy and T.K.Basu

- 61 -
J
I
H
a
Fig.4.1 A is an unfiltered single channel soiemogram.
B is the filterad (0.5-3.0 H2) version of A.
C is the beamed signal corresponding to arm 1
of GBA and D ia the same for arm 2. E is the
sum of C and D. F ia the TAP of C and D. Q is
the prediction error output of E, H ia the
plot of zero lag values of moving auto
correlation function (MACF) of G taken over a
window of 2 sec. I is the complexity plot of
MACF. Time marks are indicated at one second
interval. Presence of a signal is manifested
in G to J.

- 62 -
4.2 A KNOWLEDGE BASED SYSTEM FOR SEISMIC SOURCE
IDENTIFICATION
A knowledge based system for seismic source
identification has been developed using ID3 algorithm
(Thompson and Thompson,1986) and a knowledge base which
consists of over 200 pre-analysed events with various
identification parameters corresponding to each event along
with the inference regarding the type of event viz. an
earthquake or an explosion.
i?cr a pciven event the conclusion derived by the system
is, itself documented in the knowledge base along with all
other parameters of the event . As the knowledge base builds
up with the analysis of more events it will be possible for
the system to come out with the identification of seismic
sources with a progressively greater degree of confidence.
Reference:
1. Thompson,B. and Thompson,W.(1986).Finding rules in data,
BYTE, November.
— Ravi Mathur* and Falguni Roy
•Computer Division, BARC
4.3 SEISMIC SOURCE IDENTIFICATION BY PEF: FURTHER STUDY
The work on autoregressive feature extraction (Roy,
1988,1989) for seismic source identification was further
continued. Analysis of 66 Eurasian events, in the magnitude
range 4.5 to 6.1, comprising 44 earthquakes and 22 presumed
explosions yielded the following results.
The prediction error filters (Roy, 1989) of explosions

- 63 -
when correlated with prediction error filter of a standard
explosion signal gave the correlation coefficient between
0.95 and 0.80. However, the same standard explosion filter
when correlated with prediction error filters of earthquakes
yielded the correlation coefficients between 0.77 and 0.03.
Refrerences:
1. Roy,Falguni.(1988).Autoregressive feature extraction for
the seismic source identification, in Research and
Development Activities of Seismolgy Section. January 86
to December 87, 81-84, BARC-1429.
2. Roy,Falguni.(1989).Autoregressive feature extraction for
seismic source identification, BARC-1475.
— Falguni Roy
4.4 TEMPORAL AND SPECTRAL CHARACTERISTICS OF EASTERN KAZAKH
EXPLOSION SEISMIC SIGNALS RECORDED AT ESKDALEMDIR
(SCOTLAND) AND YELLOWKNIFE (CANADA) ARRAYS
Multistation seismic data is found to give more reliable
identification of source compared to that based on single
station data. However, for small seismic signals which are
often not detected by many distant stations, one has to rely
on signal characteristics at only a few stations that detect
those signals. In this context, we have developed single
station discriminators by studying in detail temporal and
spectral characteristics of short-period P and PcP signals
from a large number of Soviet underground explosions and
shallow focus central Asian earthquakes detected at
Gauribidanur seismic array (GBA). These include CTMF {cube
root of complexity per unit TMF), NTENR(P.PcP) [normalized
ratio of PcP to P energy in specific time frame],
NSENR(P,PcP) [normalized spectral energy ratio of P and PcP

- 64 -
in selected frequency pass band] and SENR(PcP) [the spectral
energy ratio in two different preferred pass bands]. (For
details see references 1 to 3 in thi3 Section)
In the present study we further evaluate the above
diagnostic parameters using Eastern Kazakh explosion records
obtained at EKA (Eskadalemuir array) and YKA (Yellownife
array). A comparison is also made with the estimates of such
parameters obtained earlier using GBA data of the same test
explosion events.
Fig.4.2 shows the CTMF for EKA, YKA and GBA as a
function of bodywave magnitude (Mb) in the range 5.3 to 6.2.
It is noted that for relatively larger magnitudes the CTMF
scores at GBA are slightly higher as compared to those at
both EKA and YKA which are azimuthally opposite to GBA with
respect to the source at Eastern Kazakh.
The estimates of NTENR, NSENR and SENR as a function
of Mb are shown Figs.4.3a-c. The NTENR and NSENR scores
exhibit relatively larger spread towards the higher
magnitude side (as in the case of CTMF) but the SENR
behaviour based on the spectral features of PcP signal alone
is quite stable for all tho three stations and throughout
the magnitude range.
The above two results slow that the effect of azimuth
is predominantly on the characteristics of P signals from
strong explosions whereas the PcP signal is not so much
biased by azimuth.
References:
1. Arora.S.K. and Basu.T.K.(1985) . A seismic event on August
20, 1983: double explosion or a single earthquake, Phys.
Earth Planet. Inter., 40(4 ),309-315.

- 65 -
2. Arora.S.K. and Basu,T.K.(1987).Reply to "Comments from
R.C. Stewart on 'A sei ;mic event on August 20, 1983:
double explosion or a single earthquake' by S.K.Arora and
T.K.Basu" Phys. Earth Planet. Inter., 46(4), 384-387.
3. Basu.T.K. and Arora.S.K.(1987).Characteristics of seismic
sources of some Asian Earthquakes and Soviet underground
explosions from Gauribidanur array records, BARC-1348.
— S.K.Arora and T.K.Basu

- 66 -
u.zo
0.6
0.5
0.4L
oGBAx EKAA Y K A
A
0
0
0
XoA
AX
ooX
AA
0.3L
5.2 5.7Mb
6.2
Fig.4.2 Scaled complexity per unit TMF (CTMF) as a function
of bodywave magnitude Mb for Eastern Kazakh
explosion seismic signals at GBA(o), EKA(x) and YKA
(A) arrays.

(a) (b)
0-0Q-
a.azId
I
«GBAxEKA* YKA
5.2
Fig.4.3
5.7M b
6.2
• GBA*EKA* YKA
A
a.zId ,,CO .%Z "
t{ 8* . •
5.7Mb
CO
GBA
»YKA
G.2 5.2 5.7Mb
6.2
Relative scores of (a) temporal (NTENR parameter) and (b,c) spectral
(NSENR and SENR parameters) energy discriminants for P and PcP signals
from Eastern Kazekh nuclear explosion events recorded at GBA(o), EKA(x)
and YKA(A) arrays.
- 68 -
4.5 RELATIVE ABUNDANCE OF PcP ENERGY COMPARED WITH P ENERGY
IH THE CASPIAN SEA EXPLOSION SEISMIC SIGNALS AT KKA,
YKA AND GBA ARRAYS
In an earlier study (Arora and Basu, 1987) where we
tested three seismic source discriminants, namely
NTENR(P.PcP), NSENR(P.PcP) and SENR(PcP), exploiting PcP to
P energy ratio in a suitable time window and spectral band,
it was interesting to note that, among several Soviet and
central Asian regions, underground nuclear explosions in the
the Caspian Sea region in southwestern Russia gave
abnormally large PcP signals at Gauribidanur array (GBA;
distance=41<> , azimuth Z at source=134°)• In particular, test
sites at Astrakhan on the northern shore of Caspian Sea and
Orenburg situated slightly farther away seem to have a low Q
zone that influences absorption of P much more than that of
PcP over the transmission paths to GBA.
To examine the above noteworthy feature in other
azimuths and distance range with respect to southwestern
Russia (SWR), we processed seismic data of all SWR
explosions during 1980-1984 recorded at Eskdalemuir array
(EKA; distance=33«, Z=304°) and Yellowknife array (YKA;
distance=700, Z=3520). Figs.4.4a-c show the estimates of
NTENR, NSENR and SENR parameters respectively using EKA and
YKA data of SWR explosion seismic records. For comparison,
the results obtained using GBA data are also shown in
Figs.4.4a-c. It is seen that the normalised PcP energy is
substantially large at GBA, moderate at YKA and least at EKA
(Figs.4.4a,b). However, in a preferred frequency band, PcP
spectral energy at EKA is shown to be highest among the
three array stations (Fig.4.4c).
It is planned to extend the above study to seismic
data obtained at number of global seismic stations of

- 69 -
shallow focus earthquakes in many provinces in central Aaia
and other parts of the world.
1. Arora.S.K. and Basu.T.K.(1987).Reply to "Comments from
R.C. Stewart on 'A seismic event on August 20, 1983:
double explosion or a single earthquake, by S.K.Arora and
T.K.Basu", Phys. Earth Planet. Inter., 46(4), 384-387.
— S.K.Arora and T.K.Basu

< »)160.
120
0a
a.Id
«GBA
«EKA
il 5.0
Fig.4.4
A
5.2Hb
a.
UJ
oGBA
5.4 4.8
o
5.1
AA
A
5.2
A
X
1000,
a.oa.
60
40
200L
oGBA
5.4 4.8 5.0 5.2Mb
Scores representing (a) temporal (NTENR parameter) and (b,c) spectral
(NSENR and SENR parameters) energy of P and PcP signals of different
magnitudes Mb from Caspian sea explosion seismic signals at GBA(o),
EKA(x) and YKAU) arrays.
x
Ii
5.4
o

5. SEISMICITY AND SEISMIC RISK

- 72 -
5.1 MICROSEISHIC NOISE SURVEY
Narora
For locating suitable low seismic noiso sites around
Narora Atomic Power Project site, Narora for establishing a
microearthquake monitoring network, a seismiu noise survey
at 11 logistically selected sites was conducted with the
help of Nuclear Power Corporation. A seismic set-up
consisting of a vertical component 1 Hz natural frequency
seismometer and a battery operated portable microearthquake
helical drum ink pen paper chart recorder were used for the
seismic recordings. At all the sites a minimum of 24 hours
continuous recording of the ambient seismic noise background
was carried out at a chart speed of 4 mm/sec. Effective
frequency band of seismic recording was kept from dc to 35
Hz with a uniform velocity response within 3 dB.
The ambient seismic noise was found in general to be
high at all the sites, which is mainly due to the thick
population and the agricultural land in the region.
Turbulent flow of water in nearby river Ganga and two canals
also enhances the noise level. The day-time noise level was
found to be higher by 6-12 dB as compared to that of night-
time. The predominant frequency of the ambient seismic noise
was around 4 Hz during day-time and 3 Hz during night-time.
The analysis of the records showed that it is possible
to operate seismic station at two sites with displacement
magnification of 78 dB and at four sites with displacement
magnification of 72 dB continuously day and night.
Typical recordings of seismic noise at site Malakpur
during day-time and night-time are shown in Fig.5.la.
— Vijai Kumar, P.C.Mitra and Y.S.Bhadauria

- 73 -
The existing location of the seismometer at the field
station Kasan of Delhi seismic array is within 100 metres of
the road leading to the village Kasan. In the last few years
the heavy vehicle traffic on the road has increased
considerably. The frequency of movement of these vehicles is
4-5 per hour during day-time and 1-2 per hour during night-
time on an average. During the passage of the vehicle on the
road the noise level on the seismic record increases slowly
to a peak level which is 5-10 times the ambient seismic
noise level. Apart from this, the operation of two oil/flour
mills in the nearby market of the village produces
significant noise which is approximately three times the
ambient noise level over a period of time of operation of
the mills which may be a few hours per day. Both these
factors have affected the detection capability of the Delhi
Seismic Array significantly. For improving the signal* to
noise ratio it has become necessary to relocate the
seismometer to a place of less ambient seismic noise.
After selecting a new site logistically, about 1.5 kms
from the present site, a microseismic noise survey was
conducted. A helical drum recorder was used to record the
signals from a seismometer installed at about 100 metres
from the recorder at the new site. A continuous recording of
36 hours was carried out at 4mm/sec recording paper speed.
It is found that tho noise contribution due to vehicle
movements and operation of the mills is almost nil. Further
the seismic noise due to human and animal activity is
comparatively less at the new site.

- 74 -
Figs.5.1b-c show the day-time and night-time noise
levels at the present site as well as at the proposed site.
-- Vijai Kumar and P.C.Mitra
It is planned to install and operate a single
component seismic system near MAPS, Kalpakkam with the help
of Health Physics Division, BARC for monitoring the seismic
activity around MAPS. For locating the most suitable site
with respect to ambient seismic noise background, an
extensive noise survey was carried out at few sites near
MAPS. A vertical component seismometer and a helical drum
recorder was used for this purpose. A site was finally
selected and civil work for installation of a clamshell for
locating the seismometer underground has already been
completed. It is expected that the seismic recording at the
station would be possible at a displacement magnification of
16-32K only due to the high ambient seiamic noi3e level
continuously generated by sea waves in the Bay of Bengal.
-•- Vijai Kumar

- 75 -
1 MIN5n ̂ Typical recordings of ambient seismic noise at (a)
Malakpur near NAPP, Narora (b) pre3«nt site at Kasan
and (c) proposed site at Kasan. Double arrow
* represents the seismic displacements of 4/tun, 1 yum
and 0.5/un at 1 Hz for (a),(b) and (c) respectively.

- 76 -
5.2 MICROEARTHQDAKE SURVEYS IN THE VICINITY OF NUCLEAR POWER
PLANT SITES
In a selected region where an important structure auch
as nuclear power plant (NPP), high dam or a large industrial
complex is planned, it is necessary to carry out systematic
seismic investigations, particularly with regard to
seismicity, seismic hazard and seismotectonic status of the
region. Valuable inputs to this exercise come from
microearthquakes constituted by very small seismic signals
of relatively low magnitudes (not exceeding 3) but high
frequency of occurrence.
Collection of microearthquake data should be over an
adequately large period of time so as to generate an
exclusive catalogue needed for estimating severity pattern
of earthquake occurrence in the region. In cases of vital
installations such as NPP, for example, seismic monitoring
using small aperture telemetered microearthquake network
should span from few years before the construction phase of
the plant to the end of its operating life. Absence of
microseismicity or the lack of it over an extended period of
time, which may support inference of a so-called
spatiotemporal seismic gap or of a probably dormant fault,
is an important result that warrants careful consideration
in NPP siting problem.
Among numerous applications of microearthquaKe
surveys, we summarise here their main applications
highlighting the geophysical information they aro expected
to yield for a 3ite. (details can be seen in two papers
referenced below)
(a) Confirmatory evidence of the presence of (or absence of)
active geological fault, its depthwise extension, fault
plane geometry and nature of faulting.
- 77 -
(b) Return period of moderate to large earthquakes vis-a-vis
maximum earthquake potential of the seismogenic province
(c) Seismic wave attenuation characteristics.
(d) The problem of "floating earthquake" in relation to
unresolved lineaments or tectonic features.
(e) Explosion of geothermal sources and local crustal
structure.
(f) Keeping vigil (survillience) on any abnormal regional
seismic activity owing to either natural or induced
sources.
erences
1. Arora.S.K.(1989).Microearthquake surveys at nuclear power
plant sites. Communicated to Committee to Prepare
Guidelines for Seismic Studies (CPGSS), Atomic Energy
Regulatory Board, Bombay.
2. Arora.S.K.(1989).Planning raicroearthquake investigations
in regions of nuclear power plant sites, (paper
communicated to Bull. Ind. Soc. Earthq. Tech.).
-- S.K.Arora
5.3 ASSESSMENT OF HAZARD AT NUCLEAR POWER PLANT SITE DUE TO
SEISMICALLY INDUCED DAM FAILURE
In the context of the safety of a nuclear power plant
(NPP) site, one has to consider potential hazard arising
from seismically induced structural failure of dams,
situated both upstream and downstream, and of reservoir
sides due to possible landslide. This results in a loss of
reservoir retentive capacity which gives rise to surge and
/or overflow of the reservoir.
The reservoir induced earthquake (RIE) represents

- 78 -
maximum level of ground motion capable of being triggered at
dam site by filling, drawdown or the presence of the
reservoir. The RIE should be considered as a credible event
if the reservoir region is crossed by active faults and if a
potential for reservoir induced seismicity (RIS) is
established by regional seismic monitoring either during or
after some years of reservoir impoundment.
In the hydrogeologic regime, depending on the dam
location and neotectonic conditions, the RIE may represent
ground motion less than or equal to SI level (OBE, IAEA,
1979). Hence, if the design basis earthquake (DBE) parameter
is appropriately considered during site evaluation, the RIS
potential will not pose an extra hazard to plant and other
structures connected with it (Arora,1989).
References
1. IAEA.(1979).Earthquake and Associated Topics in relation
to Nuclear Power Plant Siting, Safety Series 50-SG-S1,
IAEA, Vienna.
2. Arora,S.K.(1989).Consideration of reservoir induced
seismicity in relation to Nuclear Power Plant siting,
Communicated to Committee to Prepare Guidelines for
Seismic Studies (CPGSS), Atomic Energy Regulatory Board,
Bombay.
— S.K.Arora
5.4 DATA OF EARTHQUAKES FROM SOUTHERN PENINSULAS INDIA
Arrival times of P and S signals recorded at the
Gauribidanur Seismic Array from earthquakes in peninsular
India have been used to estimate the locations (latitudes
and longitudes of the epicentre), duration magnitudes and

- 79 -
origin times (Gangarade et.al.,1987). Expected arrival times
of these signals at other seismic stations (Hyderabad,
Kodaikanal, New Delhi, Poona and Shillong) have also been
computed for identifying events at these stations (Gangarade
et.al.,1987). Seismic activity in peninsular India for a
period of two years i.e. 1987-1988 was plotted on the map
for visual representation of seismicity of peninsular region
(Gangarade et.al.,1989). Thi3 tabulation of earthquakes and
plotting of events is further continued. All the events,
whose locations and magnitudes are known, have been plotted
on the map for the data for a period 1968-1989 in Fig.5.2
(Sharma and Verghese,1979). Out of all these events which
are plotted, there are some reservoir induced earthquakes
from Koyna, some are rock bursts from Kolar Gold Fields area
and some are blasts from Hospet-Bellary and Kudremukh mines.
References:
1. Sharroa,H.S.S. and Verghese,T.G.(1979).The role of seismic
arrays in continuous monitoring of seismicity, Mausam,
(1979), 30, 2 and 3, 237-245.
2. Gangarade,B.K., Prasad,A.G.V. and Sharma,R.D.(1987).
Earthquakes from peninsular India: Data from Gauribidanur
seismic array. BARC-1347.
3. Gangarade,B.K., Prasad,A.G.V. and Sharma,R.D.(1987).
Earthquakes from peninsular India: Data from Gauribidanur
seismic array for the period January - December 1986,
BARC-1385.
4. Gangarade,B.K., Prasad,A.G.V., Unnikrishnan.E.,
Chandrasekhar.B., Subbaramu.K.R and Sharma,R.D.(1989).
Earthquakes from peninsular India: Data from Gauribidanur
seismic array for the period January 1987- December 1988,
BARC-1454.
— B.K.Gangarade,A.G.V.Prasad,E.Unnikrisnan,D.Chandraoekhar,
K.R.Subbaraau and R.D.Sharma

- 60 -
It J (t.O bi-0
o K M < 3o 5< M < 4Q ^<M « SO
yig.5.2 Saianic activity in peninsular Indi during the
period 1968-1989.

- 81 -
5.5 SEISMICITY OF BHATSA DAM REGION IN WESTERN MAHARASHTRA
After a spurt of seismic activity in the Bhatsa region
of western Maharashtra during 1983-84, which rocked the
nearby town of Khardi, BARC initiated efforts to
systematically investigate seismicity and seismotectonic
behaviour of the region where an important masonry dam is in
the final phases of construction. To meet this objective, a
UHF radio telemetered regional seismic network (Fig.5.3)
comprising 11 field stations (in all 17 seismic channels) in
an area' of about 20 km by 20 km with centralised
multichannel digital recording and replay facility was
established at Bhatsanagar in April 1988. Since then the
telenet has been monitoring continuously local seismic
events and generating high quality digital data for detailed
seismic investigations (Arora et.al.,1989).
During about a year's period between April 1988 and
February 1989 over two hundred events that gave clear P and
S signals in a few channels and 34 of them with clear
signals in at least five channels have been processed. While
a large number of seismic events in this region seem to be
due to rock blastings at places along a national highway
traversing the region, the decontaminated data show that
there do occur on the average a few microearthquakes
(probably reservoir induced seismicity; R1S) per month whose
coda duration magnitude are in the range -1<M<2. The sources
of these microearthquakes are located shallower than a depth
of 5 km and found clustered in and around the catchment area
upstream of the Bhatsa dam (Fig.5.4a,b). The RIS activity is
found to have indeed diminished considerably since its
outbreak in 1983.
The temporal variation in the seismic activity is
presented in Fig.5.5 which includes the hydro^raph data
(Fig..1). 5a) showing changes in water level in the Bhatsa

- 82 -
reservoir from March 1, 1988 onwards. Fig.5.5b shows the
number of events recorded daily since April 1, 1986 when
systematic seismic monitoring commenced. Fig.5.5c gives for
the daily event population estimates of maximum and minimum
magnitude whose difference is related to a severity
parameter in the seismic!ty pattern. The cumulative strain
energy released (E) as a function of time is plotted in
Fig.5.5d. The cumulative frequency of occurrence of seismic
events (N) and the energy density (E/N) profile deduced from
the above data are shown in Fig.5.6.
The preliminary seismicity patterns in Figs.5.5-5.6
suggest that the Bhatsa region exhibits at present a normal
seismotectonic behavior. The RIS component that initially
predominated seems to have been overtaken by the natural
neotectonic background owing to small but steady movements
along NW-SE trending Kalu-Surya fault system and the Kengri
Nadi lineament. It would be, however, interesting to examine
more seismic data from the telenet as the region undergoes
further cycles of water loading and unloading, particularly
when the dam height reaches the envisaged 146 m level and
the reservoir is impounded to its full capacity.
Reference
1. Arora.S.K., Gangrade,B.K., Krishnan.C.A. and Kolvankar.V.
G.(1989).Seismic investigations in the Bhatsa dam region
of western Maharashtra, Seminar on Earthquake Processes
and their Consequences-Seismological Investigations,
Kurukshetra, October 31-November 3.
— S.K.Arora and B.K.Gangrade

- 83 -
RADIO TELEMETEREDSflSMIC NETWORK.
!)'ȣ
Fic.5.3 A map of Bhatsa-Khardi region where atelemetered seismic network is installed.
radio

- 84 -
I a .
ra.UJ
o
>9.S
19.4
73.3 73.4 73.5 73.6
-2
-4
:
••
b
73.3 73.4 73.5 73.6
1 BIR
2 BAT
3 LAH
4 DAP
5 KAR
6 AJP
7 DKN
8 JAR
9 KAT
10 WAS
I I PAT
oOo
XCLONG., £)
FlgiS.4 (a)Eatimatod source locations and coda duration
magnitudes represented by circles of varying diameters;
shaded triangles represent eleven field seismic stations of
the network whose code names are mentioned alongside, and
(b)Focal depths of thirty four seismic events detected by
the Bhatsa seismic telenet.

- 85 -
I A ) .
*. «. 121. IH. 2W. Mi. 0M 4«. Hi. €». 660. 721.
Ml. 420. sat. ew. ?2».
2J.
.0 -
-2.$ -I. 61. 121. l«. Z4J. 36». 421. . 6U. 6». 66*. 721.
S, '••
UJ
d. «. \U. 10.
J 1988. 34). 3M. 421. «». W. tat. 6i». 72}.
Marl-1 )S'00 ' 19^^ 'DAYS
^,^ (a)Water level L in the Bhatsa reservoir, (b) numberof daily seismic detections, N, (c) maximum and minimum
value of magnitude M (cross and circle respectively)
corresponding to daily seismic detections, and (d)cumulative
strain energy E released as a function of time. Along the
time axis, the day number zero corresponds to March 1, 1966.

- 86 -
2
224. _
Iff. -
IS. -
1
2 J ,
LU
•IJ.
AMH1II [TI rr|1111 i|iiiii|
90 160
Mar l 1988DAYS
1111 [ 11 r
270111111
360
1989
Fig.5.6 Cumulative frequency of occurrence of aoismio eventsIN, and (b)energy density E/N, plotted as function of time.Calibration of the time scale is the sane as in Fig.5.5.

6. THEORETICAL AND EXPERIMENTAL STUDIES

- 88 -
6.1 THE CONCEPT OF ENSEMBLE OF EARTHQUAKE POPULATIONS
Considering an earthquake as an episode of a fracture
which is modelled to be a branching process, it was proved
mathematical1/ that the weighted probability of episodes is
Pm(n,p) = W»(n)pn(l-p)tn
where p is the probability of a node with m branches at each
node, n is the number of nodes, Wm(n) = (mn)!/ n!.tn! is the
number of episodes and tn = n(m-l)+l is the number of
terminal points in the branching process (Murty, 1983,1984).
It was also shown that the survival function
00
Sm(N,p) = 2. Pm(n,p)
is such that, as N —
log Sm(N,l/m) = Constant - 0.5 log N
If N is identified with signal strength, then log N will
correspond to magnitude of earthquake in the seiamological
contest and the quantity Sm(N,l/m) corresponds to number of
earthquakes whose magnitude is equal or greater than log N.
We, therefore, get relation similar to that of Gutenberg-
Ritcher with a 'b value' equal to 0.5.
A population with a given value of p will be called a
pure population in the sense that all the events are
generated by the same process. Let us consider a mixture of
such pure populations with all values of p, 0<p<l, being
equally likely. We shall call such a mixture an ensemble of
pure popu1at i ons.
The function Sm(N,p) computed earlier will now be
modified for the ensemble as 4>m(N) = |S*(N,p) dp

- 89 -
which will be called survival function for the ensemble. One
can verify that for an ensemble, as N -—•> oo
log <£»»(N) = Constant - log N
Thus an ensemble leads to Gutenerg-Ritcher relation with 'b
value' equal to 1.
These results show that a microscopic model of a
fracture can be used to describe an earthquake process and
arrive at a characteristic 'b value' which may depend on
whether the population of earthquakes is pure or an
ensemble. This is an interesting result and is expected to
be useful in understanding why different regions of earth
are known to yield different 'b values'. This model enables
one also to understand why some earthquake data do not fit
into a model with a constant value of 'b'.
References:
1. Murty.G.S.(1983).Phy. Earth & Planet. Inter., 32, 160.
2. Murty.G.S.(1984).Sixth Int. Conf. on Fracture, Delhi,
Poster Session, 200-202.
— Gurajada S.Murty
6.2 USE OF LATTICE FILTERS FOR SIGNAL AND IMAGE PROCESSING
The processing of digital signals and images involves
manipulation of one dimensional or two dimensional array of
numbers to extract information content from them by removing
noi^e or distortion of the basic signal or image. Image
processing has adapted many offshoots of one dimensional
signal processing methods, by extending them to higher
dimensional analysis. Though the physics of picture

- 90 -
formation may be different from that of evolution of time
series where past values of the time series can be used to
predict its future values., use of spatial regression of
image pixels has found application in this area due to
formation of the picture by convolution of point spread
function and convolved noise with the basic picture. Thus
it is possible to formulate the intensity or gray level at
given point as linear combination of weighted intensities
with constant coefficients from its neighbourhood and these
coefficients represent the whole picture in a concise
manner. Though estimation of these coefficients and their
stationarity in space are difficult to achieve objectively,
the expertise available in one dimensional analysis can be
extended to these problems. One such method of computation
of these coefficients even when the process is
nonstationary, is the lattice filter algorithm. The
formulation of this algorithm in one dimension and how to
extend it to the case of two dimensions were worked out. The
implementation of this algorithm in hardware is simple and
effective as the basic block involves only shifters,
multipliers and adders. It may be possible to pipe line such
blocks for image processing for data compression, modelling,
signal enhancement, feature extraction and many other
applications.
— G.Jayachandran Nair
6.3 MODELLING SIGNALS IN HIGHER DIMENSION - THEORY AND
LIMITATION
Various theoretical approaches used in modelling
signals in one dimension and its extension to higher
dimension were studied for practical apllications of signal
and image processing. The sample models used are mainly
autoregressive, autoregressive moving average and adaptive

- 91 -
models. The methods of computation of the model parameters
and choice of appropriate order and class of the model pose
major hurdle in selecting an optimal model. There is no
universal criterion which will tell whether a given model is
"better" than all other models. Many times it is difficult
to formulate a figure of merit of various qualities of the
model and combine them with proper weight to arrive at a
single criterion for choice of the model. Usually it is the
expertise and experience which will be used to prune out the
"acceptable" model. This leaves us with a question. Is there
an objective way of quantifying figure of merit?
— G.Jayachandran Hair
6.4 ISOLATION OF SIGNALS
Methods of classification of signals and noise based
on several characteristics are carried out along with
methods of subjectively and objectively describing models,
algorithms or schemes of separating signals and noise from a
given sample of record. Obviously such a task will pose
following constraints. (1) Signal fully specified in time or
frequecny domain noise totally known, (2) Noise fully known
or predictable but signal characteristics unknown, (3)
Signal .characteristics partially known noise random or
unkwon, (4) Noise partially known but signal unkown, (5)
Signal and noise partially known and (6) Signal and noise
unknown. The cases where signal or noise is known, methods
like filtering, matching, correlation, maximum likelyhood
methods, phased addition, deconvoltion, predictive filtering
etc are useful and these methods use the known
characteristics of the noise or signal. If signal or noise
characteristics are partially known, methods like maximising
entropy, model building, extrapolation and interpolation,
simulation studies on controlled samples etc. will offer

- 92 -
methods of extracting or separating signals from the
interfering noise. The last case where the signal or noise
characteristics are not known, then only modelling and
adjusting the parameters of various models and modelling
methods and then using statistical criteria for finding the
best model is only possibel way of arriving at the final
result. However, in such cases controlled experiments
simulating the real samples, and other methods of assessing
the acceptability and reliability of the results should be
established before the method could be applied in real world
data.
— G.Jayachandran Nair
6.5 FISHER'S TEST OF SIGNIFICANCE IN HARMONIC ANALYSIS WITH
AN APPLICATION TO SIGNAL DETECTION
In the harmonic analysis of a time series, the
inference regarding the periodicities is usually drawn on
the basis of the dominant spectral amplitudes. However, a
set of random numbers when subjected to harmonic analysis
will, in general, give rise to amplitudes such that some are
larger than the others merely by chance.
A decision regarding the relative significance of the
spectral amplitudes can be made by a comparison of the
estimated spectral amplitudes of the time series with those
which are produced by purely random time series. One
objective way of performing this task is to subject the time
series to Fisher's test which determines the probability
that the largest of the amplitudes, given in normalised form
with respect to data, is the result of the randomness of the
data.
A white noise series when subjected to Fisher's test

- 93 -
will not show any spectral amplitudes with a high level of
significance. On the other hand presence of ona or more
spectral amplitudes with high level of significance will
indicate the departure of the time series from whiteness.
A prediction error filter with unit prediction
distance is identical to an autoregressive model for the
data. Such an operator when used for filtering the time
series yields an error series or a vrhite noise sequence,
provided the time series happens to be stationary. With
presence of a signal in the time series, the corresponding
error series will no longer be white. The whiteness of the
error series or the departure from the whiteness can be
found by subjecting the error series to Fisher'a test thus
facilitating the detection of any non-stationary behaviour
(i.e. a signal) in time series. In Fig.6.1 a typical example
of signal detection has been illustrated.
— Falguni Roy and T.K.Baau

- 94 -
£ 10 '
FREQUENCY (Hz)10 ORDEREO SPECTRAL AMPLITUDE
%m
TIME (sec)
12TIME (seel
F l g . 6 . l A I t i seiaaograa. B i s the prediction error s e r i e sof A. C ia the apeotrua of B and D la the ordered spectruaamplitudes along with the c r i t l o a l values (*) of F isher 'st e s t for IX leve l of s igni f icance . Several s ign i f i cantamplitudes indicate the presence of a s ignal in theseisaograa.

- 95 -
6.6 A PARAMETRIC MODEL AS POTENTIAL TOOL FOR THE
INTERPRETATION OF ELECTROENCEPHALOGRAM
Modern spectral estimation methods are based upon
modelling of time series by small number of parameters. When
the model happens to represent the time series fairly
accurately, spectral estimates can be obtained whose
performance exceeds that of classical periodogram or
Blackraan and Tuckey (BT) spectral estimates. Characteristic
features of such models are lack of side lobes, unlike what
is observed in the periodogram and BT spectra, together with
high resolution of spectral peaks, even for short data
lengths. One of such models viz. autoregressive (AR) model
has been found to be of immense value in the analysis of the
time series of geophysical interest.
There is a reasonable degree of similarity in terms of
spectral contents between a seismogram and an
electroencephalogram (EEG). Under normal conditions these
time series can be assumed to be stationary. Therefore it
will be natural to expect that EEG like a seismogram, can be
represented fairly well by an AR model, which can be
subsequently used to interpret the corresponding EEG.
Compressed spectral array (CSA) of EEG signals is
effectively used for finding the depth of anesthesia,
monitoring the sleep stages and neurological diagnosis. An
AR model due to its superiority over the periodogram and BT
methods, in particular for short data lengths, can be
effectively employed for CSA estimation. AR model can also
be used as signal detector by making use of its capability
to predict the time series one or more steps ahead. This
property of the AR model can be utilised for detecting the
signals in the EEG which are generated during epilepsy.
These capabilities of the AR model have been demonstrated

- 96 -
through the analysis of some synthetic time series. Efforts
are now made to acquire and analyse the real EEG data.
— Falguni Roy and V.G.Kolvankar
6.7 FOCAL MECHANISM SOLUTION OF NEPAL-BIHAR EARTHQUAKE OF
AUGUST 20, 1986
Focal mechanism solution was investigated for an
earthquake that occured at Nepal-Bihar border region on
August 20,1988. This was the major event of this region
since the Nepal-Bihar earthquake of January 1934. Fig.6.2
shows the locations of the events reported here (solid
circle) and that of 1934 (open circle). This event has a
focal depth of 71 km whereas the focal depth of Nepal-Bihar
earthquake of 1934 was 14.8 km. Use was made of the first
motions of P-waves and polarisation (or first motions) of S-
waves. The radiation pattern Fig.6.2 of the first motions of
P-waves and the polarisation or first motions of S-waves for
this event fit well with the radiation pattern expected from
the source of double couple type (or the shear dislocation)
acting at the focus. The mechanism solution is characterised
by a large component of strike-slip faulting. One of the
nodal planes of this mechanism solution (Fig.6.3) has a
strike similar to the trend of the Himalayas, whereas, the
strike of other nodal plane is transverse to this trend in
the epicentral region. This event is located in a region,
(Fig.6.2) in the vicinity of which, there are several left-
lateral and right-lateral transverse faults (Dasgupta et.
al.,1987). For example Dudkosi and Arun faults are located
to the left and right of this event. Hence, the nodal plane
striking 30 degree N and dipping 60 degree N-W is preferred
as the fault plane. Choice of this nodal plane as the fault
indicates left lateral sense of motion along the fault. The
inferred orientation of slip vector is nearly North-east.

- 97 -
The occurrence of this event at focal depth of 71 km
suggests that transverse faults extend to deeper depths in
this region. Thrust and strike-slip faulting solution was
deduced (Singh and Gupta,1980) for Bihar-Nepal earthquake of
January 15, 1934. Hence, the mechanism solution of August
20, 1988 event is much different than that of the event of
January 15, 1934.
References:
1. Dasgupta.S., Mukhopadhyaya.M. and Nandy,D.R.(1980).Active
transverse features in the central portion of Himalaya,
Tectonophysics, 136,253-254.
2. Singh,D.D and Gupta,H.K.(1980).Source dynamics of two
great earthquakes of Indian subcontinent: the Bihar-Nepal
earthquake January 15, 1934 and the Quetta earthquake of
May 30, 1935, Bull. Seism. Soc. Am.,70,757-773.
— A.R.Banghar

LEGENDTRAKS VERSEUXEAMENT t FAULT OR ITSSUPPOSED EXTENSION , ^
3EI: GRABEN STRUCTURE « 7.x^^ HORMAJ. FAULT- m - BASEMENT FAULT
BELOW RDREDEEP•—. LATERAL FAULTg? SWAUK SEOIMENTS^S? BASEMENT RIDGESMCT KAIN CENTRAL TViRUSTMBT KAlN BOUWDRY
THRUSTA MAJOR PEAKO IHPORTANT
PALCE
Fig.6.2 Tectonic map for the Nepal-Sikkim Himalayas and their foredeep (adopted
from Dasgupta et.al.,1987). Solid circle- epicentre of August 20, 1988
earthquake, open circle- epicentre of January 15,1934 earthquake. High peaks :
SP- Saipal, KB- Kanjiroba, DH- Dhaulagiri, AP- Annapurna, ML- Manshu, GH- Ganesh
Himal, GS- Gaurishankar, EV- Everest, KZ- Kanchendzonga, PH- Pauhunri, Prominent
towns : PN- Purnea, GT- Gantok, SS- Shegatse, KM- Kathmandu, MH- Motihari, PT-
Patna, LN- Lucknow, F- fault, LN- lineament, GN- graben.
to

- 99 -
= 122°6=88°NE
AUG. 20.1988
,3 Mechanism solution for Nepal-Bihar earthquake of
August 20,1968. Diagram is an equal area projection of lower
hemisphere of the radiation field. Solid cirole =
compressions, open circle = dilations and j> k & are the strike
and dip of nodal planes. T and P are the inferred axes of
maximum tension and compression respectively. Double arrows
indicate the sense of shear displacement on the plane that
was chosen as the fault piano. Lines at stations indicate
polarisation of S waves. Arrows are put at the stations
where the first motions of S waves are clear.

- 100 -
6.8 NAVE PROPAGATION WITH KINEMATIC DISCOMTIHOITY ALONG ANON-IDEAL INTERFACE BETWEEN TWO ISOTROPIC ELASTICHALF-SPACES
One of the outstanding problems in the study of
heterogeneous media is to develop a mathematical model in
the framework of linear theory of elasticity tc represent
phenomenologically the general conditions applicable at the
interface of two elastic, homogeneous and isotropic
materials. Such a model is needed to undei'stand the boundary
conditions at the interface which are not ideally bonded,
which has applications in the nondestructive evaluation of
materials.
This work deals with the problem of wave propagation
along interface of two elastic, isotropic and homogeneous
half-spaces when these are coupled through a vanishingly
thin layer of Voigt medium. It is assumed that the
separation, H, between the half-spaces, and the complex
rigidity modulus, ix., of the layer are both vanishingly
small, but the quantity A*-/H remains finite.
It is found that such an assumption leads to a finite
slip in the displacement parallel to the interface, which is
proportional to the local shear stress. However, the stress
and the displacement normal to the interface remain
continuous (Murty and Vijai Kumar,1989).
For periodic disturbance in a Voigt medium, the real
and imaginary part of complex shear modulus, M-~ €: + 1 ^ ^
represent respectively the elastic and viscous effects in
the wave propagation. For convenience we introduce two
parameters f and <T~ , defined as
= 1 ~nd = il-H" yW-H | -a- GO M HM

- 101 -
where i is (-1) '2p, A an<* /-^ a r e shear wave speed and
rigidity modulus of one of the media and 7J is coefficient
of viscosity of the Voigt medium and. CO is the angular
frequency of poriodic disturbance.
The usual boundary conditions at the welded interface
and smooth ir^erface are obtained by letting /^/H — >
infinity or zero.
The secular equation for the complex speed, C, of the
interfacial wave is solved numerically for different
combinations of and for aluminium-aluminium interface
as well as for aluminium-steel interface which does not
support Stoneley mode at welded contact. These results are
shown graphically in Fig.6.4 for aluminium-aluminium
interface and Fig.6.5 for aluminium-steel interface (Vijai
Kumar,1988).
The results show that the degree of bonding at the
interface represented by the pair of parameters ( ty, o~~ ) is
related uniquely with the speed and attenuation of an
interfacial wave. This theory promises to be useful to
quantify the boundary conditions at an imperfectly welded
interface of layered media.
References:
1. Vijai Kumar.(1988).Investigations on elastic interfacial
waves of relevance to seismology and other related
fields, Ph.D. thesis, Bombay University, Bombay.
2. Murty.Gurajada S. and Vijai Kumar.(1989).Wave propagation
with kinematic discontinuity along non-ideal interface of
two homogeneous elastic half-spaces, BARC-1491.
— Gurajada S.Murty and Vijai Kumar

IMAGINARY PART OP PHASE SPEEO CtKM/SEC)
P S S
REAL PART OF PHASE SPEtO C (KM/SEC)« • « 8.. .. s • S
. SOT -
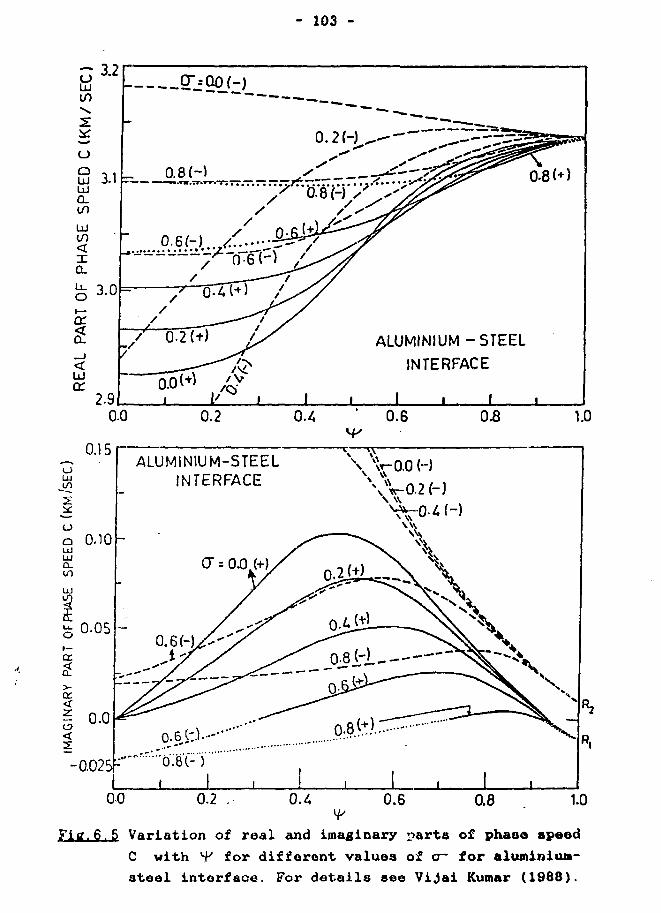
- 103 -
3UJ
u0.8 (•)
ALUMINIUM-STEEL
INTERFACE
I i I
0.4 0.6 1.0* f
0.15
oUl
ALUMINIUM-STEELINTERFACE \V0.2(-)
S N\
Fig.6. 5 Variation of real and imaginary *?arts of phaoa speed
C with f for different values of o~ for aluminium-
steel interface. For details see Vijai Kumar (1988).

- 104 -
6.9 MEASUREMENT OF INTERFAGIAL WAVES PROPAGATING ALONG
ADHESIVELY BONDED INTERFACE
Adhesively bonded layered structures are being used
nowadays extensively in many engineering industries, as they
provide uniform stress transfer, increased fatigue life and
reduction in overall weight. For evaluating the structural
integrity in bonded material nondestructively, a reliable
technique is needed in which the implied mechanism interact
significantly with the interface bond conditions. It is
observed experimentally that the speed and attenuation of
ultrasonic interfacial waves are affected significantly when
the bonding condition at the interface is varied by applying
an external load normal to the interface (Vijai Kumar,1983).
Similar measurements were carried out for interfacial
waves propagating along plane interfaces of two solids of
engineering interest, bonded together with a thin film of
adhesive. The schematic diagram of the experimental set-up
is shown in the Fig.6.6. A matched pair of piezoelectric
ultrasonic surface wave wedge transducer (Ti and T2) of
centre frequency 5 MHz is used to generate and detect the
interfacial waves via conversion from surface waves. The
transducers are affixed with the help of a couplant to the
upper surface of a rectangular block B of one material. A
smaller cubical block A of other material is placed in
between the tranducers at the centre of upper surface of the
lower block to form the interface. The mating surfaces of
the two blocks were prepared metallographically.
A pulser-receiver electronic unit is used to excite
the generating transducer and the resulting elastic waves
pulse train after propagation across the interface is
detected by the receiving transducer and amplified by a
broad-band amplifier. With the help of an oscilloscope the
- 105 -
detected pulses are observed and the change in amplitude and
velocity of propagation are accurately measured.
For measuring the interfacial wave properties in the
experiments the whole assembly alongwith the transducers
etc. were kept inside a thermostat. The mating surface of
the block A was coated with a thin film of adhesive, epoxy
resin mixed with hardner agent. The experimental
observations of the change in velocity of propagation and
attenuation were made at regular intervals of elapsed time
during the polymerisation of the adhesive film at the
interface. The measurements were done during the cooling
episode of the adhesive also. Finally the interface was
subjected to an external load of about one ton/sq cm normal
to the interface. The measurements were done before and
after the application of the load also.
Experimental measurements of velocity of propagation
and attenuation were carried out for aluminium-aluminium,
steel-steel and aluminium-steel interfaces (Vijai Kumar,
1988). Typical observations for aluminium-aluminium
interface are 3hown in Fig.6.7. The observed variation of
velocity of propagation and amplitude attenuation of
interfacial waves with increasing polymerisation is due to
gradual increase in the degree of bonding at the interface.
The observations also show that the adhesive further hardens
when it cools down but when the interface is subjected to an
external load the adhesive bond has a tendency to weaken
slightly.
Above observations show that the velocity oi!
propagation and attenuation of interfacial waves are
significantly affected by the interface bond conditions.
These properties may be exploited for evaluating the
interface bond strength, nondestructively.

- 106 -
References:
1. Vijai Kumar.(1983).Attenuation and velocity of waves
propagating along steel-steel interface, J. Appl. Phys.,
54, 1141-1143.
2. Vijai Kumar.(1988).Investigations on elastic interfacial
waves of relevance to seismology and other related
fields., Ph.D. thesis, Bombay University, Bombay.
— Vijai Kuaar

1Sync. Signal
PULSER
RECEIVER
OSCILLOSCOPE
2/jsec
ExternaltriggerInput
Verticalinput I
o
I
Fig.6.6 Schematic diagram of the experimental set-up used for measurements of
velocity of propagation and attenuation of ultrasonic interfacial waves.

3 0
- 108 -
ALUMINIUM- ARALDITE-ALUMINIUMINTERFACE
VELOCITY x
L ATTENUATION O
55°C 25°C
Io
o
§
oo
X
,L
XX X
XX
o o oo
' — ' i i
28 Q0 2
o
4 UJ
2.7
20 50 100 200 500 1000 2000TIME (MINUTES)
Fifl.6.7 Variation of experimentally observed
interfacial wave velocity and attenuation
during polymerisation episode of the
adhesive (araldite) for aluminium-araldite
-aluminium interface.
- 109 -
7 PUBLICATIONS/SYMPOSIA
1. Arora.S.K. and Krishnan,C.A.(1988).Evaluation of
hypocentral instability due to random arrival time errors
in a typical data set of Koyna earthquakes, BARC-1441.
2. Arora.S.K., Chandrasekhar,K. and Vorma,U.S.P.(1989).
Indiginous development of radio telemetered system for
microearthquake investigations, ISET Silver Jublee
National Symp., Roorkee, February 25-26.
3. Arora.S.K.(1989).Why it is difficult to predict the
earthquake, 2001 (incorporating Science Today),22(3), 94.
4. Arora.S.K.(1989).Planning microearthquake investigations
in the regions of nuclear power plant sites, Bull. Ind.
Soc. Earthq. Tech, (paper submitted)
5. Arora.S.K.(1989).Experimental seismological studies at
the Bhabha Atomic Research Centre-Acquisition, processing
and analysis of Bhatsa telenet data for studying regional
seismicity near Bhatsa reservoir, Conf. on Geophysical
Oceanographic Studies of the Seas around the Indian
Subcontinent, Goa, November 1-2.
6. Arora.S.K., Gangarade,B.K., Krishnan,C.A. and Kolvankar,
V.G.(1989).Seismic investigations in ;he Bhatsa dam
region of western Maharashtra, Seminar on Earthquake
Processes and their Consequences-Seismological
Investigations, Kurukshetra, October 31-November 3.
7. Arora.S.K., Bhat.M.K., Kulkarni,A.G., Basu.T.K. and
Subbaramu.K.R.(1989).Seismic noise measurement in the
region around Kaiga Atomic Power Project, Bull. Ind. Soc.
Earthq. Tech. (paper submitted).
- 110 -
8. Arora,S.K.(1989).Microearthguake surveys at nuclear power
plant sites. Communicated to Committee to Prepare
Guidelines for Seismic Studies (CPGSS), Atomic Energy
Regulatory Board, Bombay.
9. Arora,S.K.(1989).Consideration of reservoir induced
seismicity in relation to nuclear power plant siting.
Communicated to Committee to Prepare Guidelines for
Seismic Studies (CPGSS), Atomic Energy Regulatory Board,
Bombay.
10. Arora,S.K.(1989).A * iport on the estimation of strong
ground motion parameters due to rock blasting at RAPP 3
and 4 excavations, Kota.
11. Banghar,A.R.(1989).Mechanism solution of Nepal-Bihar
earthquake of August 20,1988, BARC-1459.
12. Banghar,A.R.(1989).Mechanism solution of Nepal-Bihar
earthquake of August 20,1988, J.Geo.Soc.India.(in press)
13. Gangarade.B.K., Prasad,A.G.V., Unnikrishnan.E.,
Chandrasekhar,B., Subbaramu.K.R. and Sharma,R.D.(1989).
Earthquakes' from peninsular India : Data from the
Gauribidanur seismic array for the period January 1987 -
December 1988, BARC-1454.
14. Kolvankar,V.G. and Rao,D.S.(1988).New serial time codes
for seismic short period and long period data
acquisition system, BARC-1433.
15. Kolvankar,V.G., Nadre,V.N. and Sivakumar,C.(1988).A
rock burst seismic data acquisition system at Kolar Gold
Fields, BARC-1393.

- Ill -
16. Kolvankar.V.G., Nadre.V.N. and Rao,D.S.(1989).
Instrumentation for wireless telemetered seismic network
at Bhatsanagar, presented in the National Seminar on
Exploration Geophysics,Madras University,December 11-13.
17. Kolvankar.V.G.(1989).Multichannel waveform display
system, Indian Journal of Pure and Applied Physics,
27,Sept.-Oct.,p 537-541.
18. Kolvankar.V.G., Nadre.V.N. and Rao,D.S.(1989).Seismic
data acquisition systems, Indian Journal of Pure and
Applied Physics, 27, Sept.-Oct., p542-547.
19. Murty.G.S., Subbaramu.K.R., Krishnamurty,R. and
Shringarputale.S.D.(1988).Multichannel data acquisition
and analysis system to monitor rockbursts for assessing
underground starta stability at Kolar Gold Fields,
Proceedings of International Symposium on Underground
Engineering, April 14-17, 1988, New Delhi.
20. Murty.G.S. and Vijai Kumar.(1989).Wave propagation with
kinematic discontinuity along non-ideal interface of two
homogeneous elastic half spaces, BARC-1491.
21. Nair.G.J.(1989).PDP-11/34 based microseismic monitoring
system for Kolar Gold Fields, World Meeting on Accoustic
Emission, Char Lohe, North California, USA.
22. Nair.G.J.(1989).Use of lattice filters for signal and
image processing, National symposium on image processing
in material science and other disciplines, March 3,
1989, BARC, Bombay.

- 112 -
23. Nair.G.J.(1989).Isolation of signals, Symposium on
Geomagnetics and Aeronomy in nineties, December 28-29,
1989, IIT, Bombay.
24. Nair.G.J.(1989).Modelling signals in higher dimensions-
theory and limitations, National symposium on recent
advances in digital signal processing and its impact on
the development of electronic instrumentation, BARC,
Bombay.
25. Nair,G.J. and Kamath.V.S.(1988).PDP-11/34 based
microseismic monitoring system for Kolar Gold Fields,
5th plenary scientific session of working group on
rockburst, The International Bureau of Starta Mechanics,
Hyderabad, February 1-6, 1988.
26. Nair.G.J., Murty.G.S., Srikant,B.S. and Krishnamurty,
R.(1988).Velocity of champion reef mines, Kolar,
India, below 98th level and implication on future
planning, 5th plenary scientific session of working
group on rockburst, The International Bureau of
Starta Mechanics, Hyderabad, February 1-6, 1988.
27. Roy.Falguni.(1989).Depth phase identification by
prediction error filtering, I-Analysis of synthetic
explosion signals, Phys. Earth, and Planet. Inter., 54,
210-230.
28. Roy,Falguni.(1989).Depth phase identification by
prediction error filtering, II-Analysis of some
presumed explosion signals, Phys. Earth, and Planet.
Inter., 54, 231-240.

- 113 -
29. Roy,Falguni.(1989).A parametric model as a potential
tool for the interpretation of Electroencephalograms.
BARC-1451.
30. Roy,Falguni.(1989).Autoregressive feature extraction for
seismic source identification, BARC-1475.
31. Roy.Falguni.(1989).Application of autoregressive
modelling in time series analysis, National symposium
on recent advances in digital signal processing and its
impact on the development of electronic instrumentation,
BARC, Bombay.
32. Roy,Falguni and Basu,T.K.(1989).Fisher's test of
significance in harmonic analysis with an application to
signal detection, National symposium on recent advances
in digital signal processing and its impact on the
development of electronic instrumentation, BARC, Bombay.
33. Sharma,R.D.(1988).Data base pertinent to earthquake
design basis, BARC-1420.
34. Sharma,R.D.(1989).Magnitudes and frequencies of
earthquakes in relation to seismic risk, BARC-1485.
35. Subbaramu,K.R. and Krishnamurty.R.(1988).Review of
working of seismic and microseismic network installed at
Kolar Gold Fields.
36. Unnikrishnan.E. and Subbaramu.K.R.(1989). Chinese
earthquake of 5th, 6th and 7th November 1988, BARC I-
983.

- 114 -
37. Vijai Kumar, Arora.S.K. and Raghavan.S.(1988).The role
of six nation peace initiative in Test Ban Verification-
Technical aspects,Proc.of Conference on Nuclear Test Ban
Verification, Linkpong, Sweden, May 17-19, 1988,27-33.
38. Vijai Kumar.(1988).Investigations on elastic interfacial
waves of relevance to seismology and other related
fields, Ph.D. Thesis, University of Bombay, Bombay.
39. Vijai Kumar and Johnson,P.(1988).Report on the seismic
noise survey around NAPP site , Narora.
40. Vijai Kumar and Murty.G.S.(1989).Effect of Coulumb
friction and viscous forces on interfacial waves at
sttel-steel boundary under external pressure. Thin solid
films (in press).
41. Vijai Kumar.(1989).Measurement of Ultrasonic waves
propagating along adhesively bonded interface of two
solids, J. of Pure and Applied Ultrasonics (in press).
42. Vijai Kumar.(1989).Acoustic and Seismic sensors with
their potential applications to remote sensing, Proc. of
Seminar on Camouflage, Defence Laboratory, Jodhpur,
October 20-21,1989. (in press).

- 115 -
8 LECTURES/TALKS/WORKSHOPS
S.K.Arora
1. Activities in the fields of seismic source discrimination
and seismicity investigations at Bhatsa, Review talk, 13-
6-1988, Physics Group Board, BARC, Bombay.
2. Current R&D activities in seismology at BARC with
particular emphasis on seismicity studies in selected
regions employing telemetered regional seismic networks,
five lectures in July 1988, at (a) Institute of Physics
of the Earth, Moscow, USSR. and (b) Institutes of
Seismology, Dushanbe, Tashkent,Alma Ata, and Frunze,USSR.
3. Monitoring earthquake precursory phenomena, 29-12-1988,
AMD Complex, New Delhi.
4. Overview of R&D programs in Seismology and some
projections for advanced seismic systems during 6th plan
period, 17-2-1989, Program Committee for Physical
Sciences, BARC, Bombay.
5. A star array at Gauribidanur for detailed processing of
data of regional earthquakes: A proposal, 30-6-1989,
Seminar talk at Gauribidanur.
jada... s, Murty
1. Earthquakes and Earth Tremors, Lecture-cum-demonstration
to school children, 12-11-1988, Bombay Association for
Science education, TIFR, Bombay.
2. Some Aspects of Modern Signal Processing, Aerospace
seminar, 13-7-1988, Indian Institute of Science,
Bangalore.

- 116 -
3. Monitoring Seismic Disaster, Public Lecture on
Visweswariah Day, 17-9-1988, I.E.E. and Indian Water
Works Association, Indore.
4. Boundary conditions at the interface of two elastic half-
spaces, 15-3-1989, Centre for Advanced Studies in Applied
Mathematics, Calcutta.
5. Recent R&D in Seismology at BARC, 19-3-1989, Geological
Survey of India, Nagpur.
6. Current developments in Theory and Experimental
Seismology, 1-11-1989, National Institute of
Oceanography, Goa.
R.D.Sharma
1. Course on Seismology for Trainees in advanced Civil
Engineering Topics and Construction Management, April
1988, The National Institute for Training in industrial
Engineering, Bombay.
2. Geological Aspects of Engineering Design, March 1989,
American Society of Civil Engineers (ASEC)- India
Section, Calcutta.
K.R.Subbaramu
1. Seismic Array Station, 17.9.1988, Sir M. Visveshwarayya
Technical Training Institute, Chickballapur.
yj.iai Kumar
1. Report on the 27th session of the Group of Scientific
Experts held at Geneva during March 1989, Presentation in
the TC/TSC meeting, 22-6-1989, BARC, Bombay.

- 117 -
9. AWARD
1. Gurajada S. Murty received Decennial Award (1989) by
Indian Geophysical Union which selects annually one
senior "Scientist / Geophysist who has established a
school of Geophysics in India with indigenous resources."
10. THESIS
1. Vijai Kumar.(1988).Investigations on elastic interfacial
waves of relevance to seismology and other related
fields, Ph.D. Thesis submitted to the Bombay University
in July.1988 and the degree awarded in December 1989.

- 118 -
11. SCIENTIFIC R & D BREAK DP
(a) Staff
Bombay Gauribidanur New Delhi
G.S.Murty
S.K.Arora
R.D.Sharma*
A.R.Banghar
G.J.Nair
Vijai Kumar
Falguni Roy
V.G.Kolvankar
B.S.S.Rao
B.K.Gangarade
T.K.Basu
C.A.Krishnan
V.N.Nadre
Y.S.Bhadauria
S.V.Sharma
K.R.Subbaramu
R.N.Bharthur
M.K.Bhat
D.S.Rao
V.S.Kamath
A.G.V.Prasad
A.G.Kulkarni
B.Chandrasekhar
Uma Shankar
Muddurama
E.Unnikrlshnan
T.V.Sridharan
P.C.Mitra
D.Tewani
Mahendra Singh
•Transferred to Nuclear Power Corporation.
fb> Research and Development
At Bombay
Analysis of seismic field data and collation with
international data. Research and development for digital
seismic systems for field use. Theoretical studies
pertaining to wave propagation, time series analysis and
detection of weak signals for seismic source discriminatoin.
Detailed analysis of seismic data for seismic risk estimate.
Instrumentation development for Kolar Institute of Rock
Mechanics.
- 119 -
At Gauribidanur
Continuous operation of acoustic and seismic data
systems. Processing of data on PDP 11/40 computer for
regular data bulletin and detailed analysis on IMPACT 8650
for source discrimination. Transmission of relevant data to
Trombay for further study. Technical help as and when needed
given to BGML for rockburst monitoring.
At Delhi
Continuous operation of acoustic and seismic units.
Preliminary data analysis and Transmission of relevant data
to Trombay and Gauribidanur for source discrimination
report. Preparation of data bulletins.
At Bha*tsa
Continuous operation of 11 station wireless
telemetered seismic network. Analysis of the records is done
at Trombay. No permanent staff stationed. Maintained by
periodic visits of technical staff from Trombay and
Gauribidanur.
Acknowledgement
We are thankful to Shri Y.S.Bhadauria for helping in
the preparation of the manuscript and to Shri K.N.N.Pillai
for typing help occasionally.

Published by : M. R. Balakrishnan Head, Library & Intormation ServicesBhabha Atomic Research Centre Bombay 400 085