1.which diagram best represents the regions of earth in 3
TRANSCRIPT
A)
B)
C)
D)
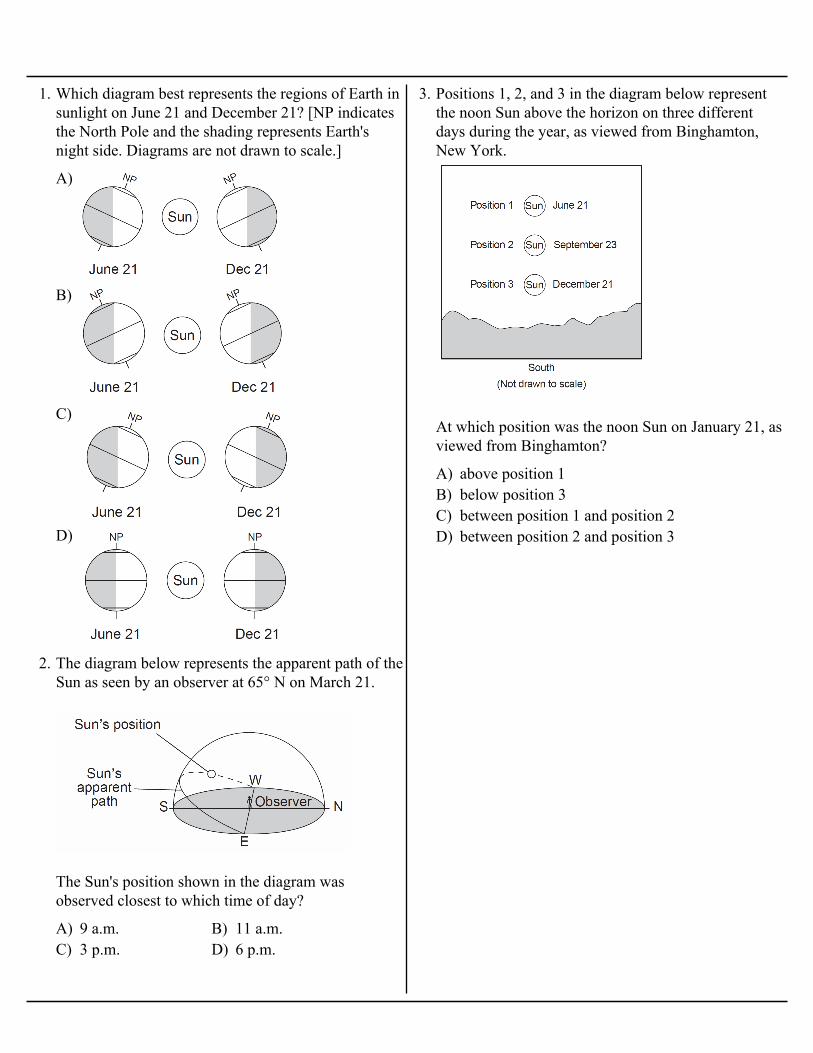
1. Which diagram best represents the regions of Earth insunlight on June 21 and December 21? [NP indicatesthe North Pole and the shading represents Earth'snight side. Diagrams are not drawn to scale.]
A) 9 a.m. B) 11 a.m.C) 3 p.m. D) 6 p.m.
2. The diagram below represents the apparent path of theSun as seen by an observer at 65° N on March 21.
The Sun's position shown in the diagram wasobserved closest to which time of day?
A) above position 1B) below position 3C) between position 1 and position 2D) between position 2 and position 3
3. Positions 1, 2, and 3 in the diagram below representthe noon Sun above the horizon on three differentdays during the year, as viewed from Binghamton,New York.
At which position was the noon Sun on January 21, asviewed from Binghamton?

A) A B) B C) C D) D
4. The map below shows four locations, A, B, C, and D, on the continent of South America.
Which location is the first to experience sunset on September 23?

5. Base your answer to the following question on the diagram below and on your knowledge of Earthscience. The diagram represents the Moon at different positions, labeled A, B, C, and D, in its orbitaround Earth.
A) A and B B) B and C C) C and A D) D and B
At which two Moon positions would an observer on Earth most likely experience the highest high tidesand the lowest low tides?
Base your answers to questions 6 and 7 on the diagram below and on your knowledge of Earthscience. The diagram represents eight numbered positions of the Moon in its orbit around Earth.
A) 1 B) 5 C) 3 D) 7
6. A solar eclipse might be observed from Earth when the Moon is at which position?

A) B) C) D)
7. Which phase of the Moon will be observed in New York State when the Moon is at position 8?
Base your answers to questions 8 through 10 on the graph below and on your knowledge of Earthscience.
The graph shows the tidal range (the difference between the highest tide and the lowest tide) recordedin Minas Basin, Nova Scotia, during November 2007. The phase of the Moon on selected days isshown above the graph. The dates that the Moon was farthest from Earth (apogee) and closest to Earth(perigee) are indicated under the graph.
A) December 9 B) December 14 C) December 17 D) December 24
8. The next first-quarter Moon after November 17 occurred closest to
A) apogee and a new-Moon phase B) apogee and a full-Moon phaseC) perigee and a new-Moon phase D) perigee and a full-Moon phase
9. The highest high tides and the lowest low tides occurred when the Moon was near
A) 11 m B) 2 m C) 13 m D) 15 m
10. The tidal range on November 8 was approximately

A) May 21: Scorpius and Taurus B) August 21: Libra and VirgoC) November 21: Gemini and Capricorn D) February 21: Leo and Cancer
11. The diagram below represents positions of Earth in its orbit around the Sun and twelve constellationsthat can be seen in the midnight sky by an observer in New York State at different times of the year.The approximate locations of the constellations in relation to Earth's orbit are shown.
Which date is correctly paired with two constellations that can be seen in the sky at midnight?
A) Spica, Rigel, Deneb, BetelgeuseB) Polaris, Deneb, 40 Eridani B, Proxima
CentauriC) Barnards Star, Alpha Centauri, Rigel, SpicaD) Procyon B, Sun, Sirius, Betelgeus
12. Which sequence of stars is listed in order ofincreasing luminosity?

A) 1 hour B) 6 hours C) 3 hours D) 4 hours
13. A camera was placed outside at night and pointed directly at Polaris and several other stars. The lenswas kept open and a time-exposure photograph was taken. The diagram below represents thatphotograph of Polaris and star trails, with an angular protractor to measure apparent motion.
How many hours was the lens kept open to create the star trails in this photograph?
A) shape of Earth's orbitB) shape of the Milky Way galaxyC) changes in the total yearly duration of
insolation at a location on EarthD) apparent changes in the direction of swing of a
Foucault pendulum
14. The best evidence of Earth's rotation is provided bythe

A) A B) B C) C D) D
15. The arrows in the diagram below show changes inthe direction of surface winds at four letteredlocations, A, B, C, and D, on Earth.
The arrow at which location correctly shows adeflection of the wind that could be due to theCoriolis effect?
A) shorter than 24 hoursB) longers than 24 hoursC) 24 hours, with a shorter nighttime periodD) 24 hours, with a longer nighttime period
16. If Earth's rate of rotation increases, the length of oneEarth day will be
A) the Moon B) the SunC) Venus D) Polaris
17. Which object orbits Earth in both the Earth-centered(geocentric) and Sun-centered (heliocentric) modelsof our solar system?

A) B)
C) D)
18. The graph below shows the varying amount of gravitational attraction between the Sun and anasteroid in our solar system. Letters A, B, C, and D indicate four positions in the asteroid's orbit.
Which diagram best represents the positions of the asteroid in its orbit around the Sun? [Note: Thediagrams are not drawn to scale.]

19. Base your answer to the following question on the diagram below, which shows positions of theMoon in its orbit and phases of the Moon as viewed from New York State.
A) 0.017 B) 0.055 C) 0.386 D) 0.723
What is the eccentricity of the Moon's orbit?

20. Base your answer to the following question on the diagram below and on your knowledge of Earthscience. The diagram represents the orbital paths of the four Jovian planets and Halley's comet aroundthe Sun. Halley's comet has a revolution period of 76 years. In 1986, Halley's comet was atperihelion, its closest point to the Sun. Letters A, B, C, and D represent locations of Halley's comet inits orbit. Location D represents Halley's comet at aphelion, its farthest point from the Sun. Thecomet's tail is shown at perihelion and at locations B and C.
A) always less B) always greaterC) always the same D) sometimes less and sometimes greater
Compared to the velocity of Jupiter in its orbit, the velocity of Halley's comet is
A) Mars B) MercuryC) Neptune D) Uranus
21. Which planet has completed less than one orbit ofthe Sun in the last 100 years?
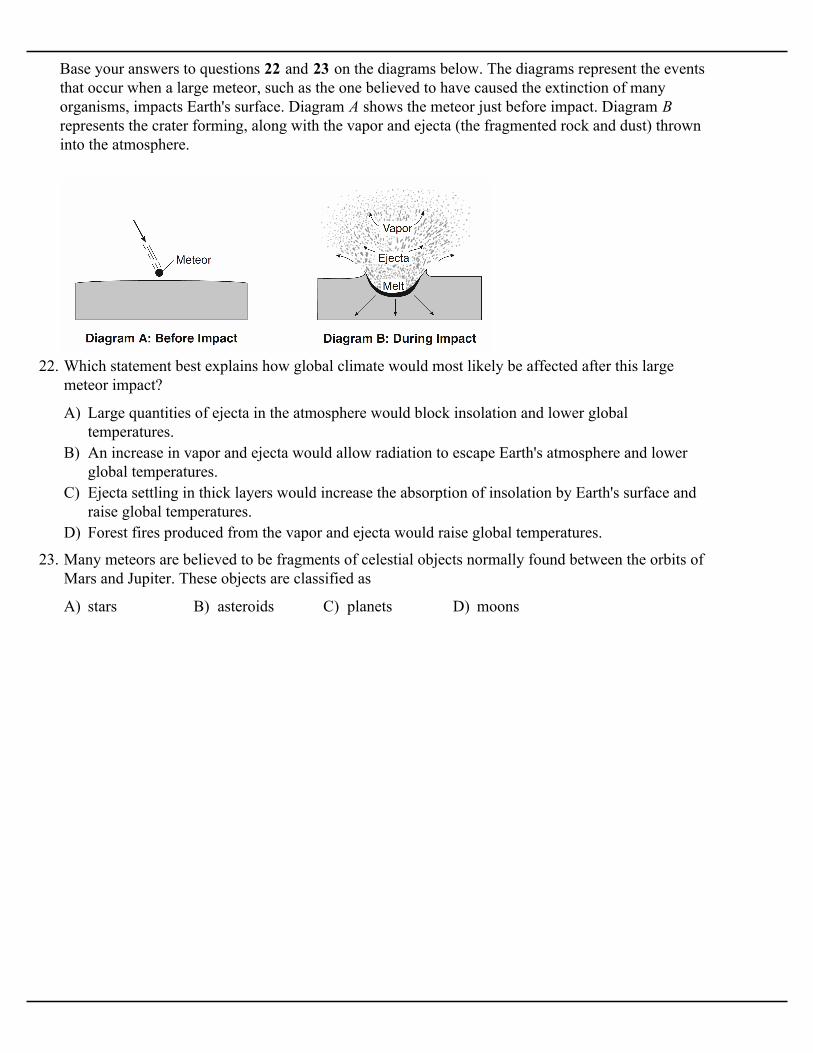
Base your answers to questions 22 and 23 on the diagrams below. The diagrams represent the eventsthat occur when a large meteor, such as the one believed to have caused the extinction of manyorganisms, impacts Earth's surface. Diagram A shows the meteor just before impact. Diagram B represents the crater forming, along with the vapor and ejecta (the fragmented rock and dust) throwninto the atmosphere.
A) Large quantities of ejecta in the atmosphere would block insolation and lower globaltemperatures.
B) An increase in vapor and ejecta would allow radiation to escape Earth's atmosphere and lowerglobal temperatures.
C) Ejecta settling in thick layers would increase the absorption of insolation by Earth's surface andraise global temperatures.
D) Forest fires produced from the vapor and ejecta would raise global temperatures.
22. Which statement best explains how global climate would most likely be affected after this largemeteor impact?
A) stars B) asteroids C) planets D) moons
23. Many meteors are believed to be fragments of celestial objects normally found between the orbits ofMars and Jupiter. These objects are classified as

Base your answers to questions 24 through 27 on the diagram below and on your knowledge of Earthscience. The diagram represents Earth's revolution around the Sun. Points A, B, C, and D representEarth's positions in its orbit on the first day of each of the four seasons. The major axis and the foci(the center of the Sun and the other focus) of Earth's orbit are shown.
A) A and B B) A and C C) B and C D) B and D
24. At which two positions will an observer in New York State experience approximately 12 hours ofdaylight during one rotation of Earth?
A) Betelgeuse B) PolarisC) the center of the Milky Way D) the center of our solar system
25. At positions A, B, C, and D, the north end of Earth's axis of rotation is pointing toward
A) distance between the Sun and Earth variesB) distance between the Sun and the other focus variesC) length of Earth's major axis variesD) length of Earth's period of revolution varies
26. Since Earth has an elliptical orbit, the
A) 91 d B) 182 d C) 274 d D) 365 d
27. Approximately how many days (d) does it take Earth to travel from position A to position C?
A) Earth B) Earth's MoonC) our solar system D) the universe
28. Fourteen billion years represents the approximateage of

A) B)
C) D)
29. According to the Big Bang theory, which graph best represents the relationship between time and thesize of the universe from the beginning of the universe to the present?

30. Base your answer to the following question on the diagram below and on your knowledge of Earthscience.
The diagram represents the inferred changes to the luminosity and color of the Sun throughout its lifecycle. The diagonal dashed line represents the main sequence stars. The numbers 1 through 5represent stages in the life cycle of the Sun.
A) white dwarf star B) gas cloud (nebula)C) main sequence star D) giant star
The Sun is inferred to be the most luminous when it is classified as a
A) 0° B) 23.5° N C) 23.5° S D) 90° N
31. The diagrams below represent the compass direction and altitude of the Sun's rays at noon for alocation on Earth on four different dates.
What is the latitude of this location?
A) A and B B) B and CC) C and D D) D and B
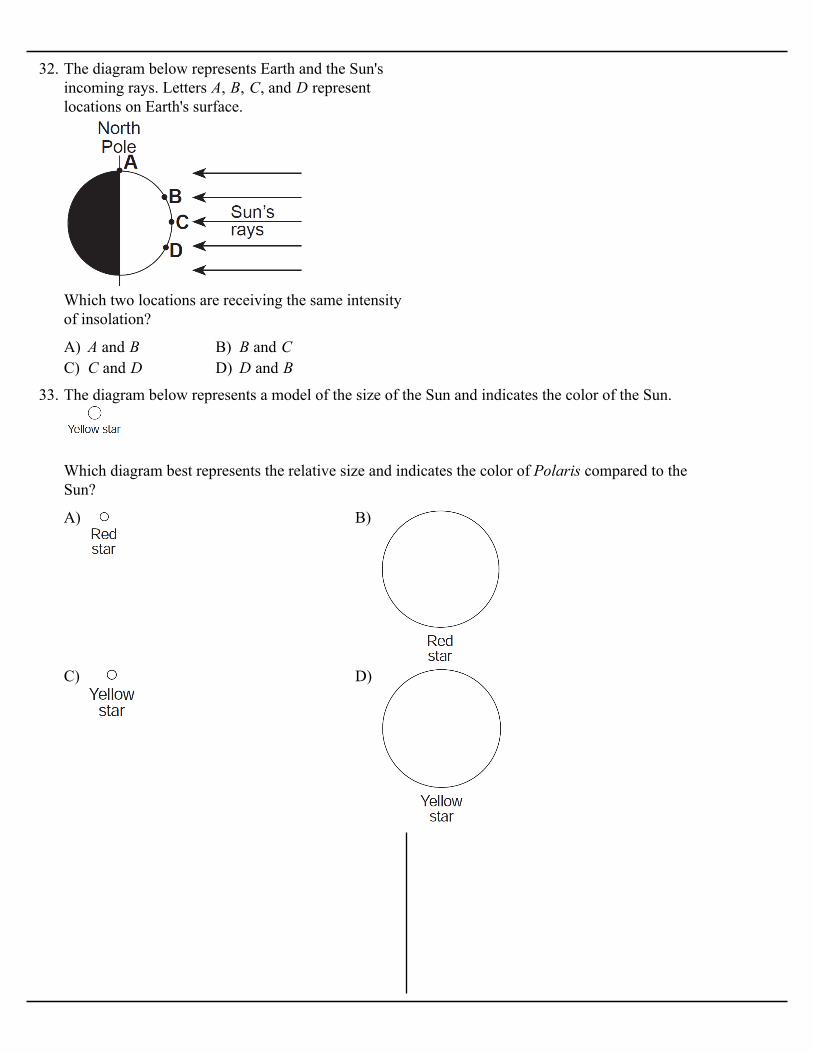
32. The diagram below represents Earth and the Sun'sincoming rays. Letters A, B, C, and D representlocations on Earth's surface.
Which two locations are receiving the same intensityof insolation?
A) B)
C) D)
33. The diagram below represents a model of the size of the Sun and indicates the color of the Sun.
Which diagram best represents the relative size and indicates the color of Polaris compared to theSun?

A) in the Sun by fusionB) when water condenses in Earth's atmosphereC) from the movement of crustal platesD) during nuclear decay
34. The reaction below represents an energy-producing process.
The reaction represents how energy is produced
A) March 21 B) June 21C) September 21 D) December 21
35. The shaded portion of the map below indicates areasof night and the unshaded portion indicates areas ofdaylight.
What day of the year is best represented by the map?
A) High tides at A and B; low tides at C and DB) high tides at B and D; low tides at A and CC) high tides at A and C; low tides at B and DD) high tides at C and D; low tides at A and B
36. The diagram below represents Earth and the Moonas viewed from above the North Pole. Points A, B,C, and D are locations on Earth's surface.
According to the diagram, where will high oceantides and low ocean tides most likely be located?

A) 12 midnight B) 1:30 a.m. C) 1:00 p.m. D) 6:00 p.m.
37. The graph below shows ocean tide height in feet (ft) over a 44-hour period for a coastal location inthe northeastern United States. The dots represent either high or low tides.
If the pattern shown continued, the next low tide occurred on Day 3 at approximately

38. Base your answer to the following question on the diagram below, which represents a model of theEarth-Moon system as viewed from above the North Pole. The numbers 1 through 8 representpositions of the Moon as it revolves around Earth. The parts of the diagram lettered A through D showhow the Moon's phases appear to an observer in New Jersey.
A) decrease, only B) increase, onlyC) decrease, then increase D) increase, then decrease
As the Moon's phase changes from first quarter to last quarter, the visible portion of the Moon asobserved from Earth will
A) Moon's orbit is tilted relative to the Earth'sorbit
B) new-moon phase is visible only at nightC) night side of the Moon faces toward the EarthD) apparent diameter of the Moon is greatest
during the new-moon phase
39. The new-moon phase occurs when the Moon ispositioned between the Earth and the Sun. However,these positions do not always cause an eclipse(blocking) of the Sun because the
A) smaller equatorial diameters and shorter periodsof revolution
B) smaller equatorial diameters and longer periodsof revolution
C) larger equatorial diameters and shorter periodsof revolution
D) larger equatorial diameters and longer periodsof revolution
40. Compared to terrestrial planets, Jovian planets have
Earth Science
Name _________________ Class _________________ Date _________
1.2.3.4.5.6.7.8.9.10.11.12.13.14.15.16.17.18.19.20.21.22.23.24.25.26.27.28.29.30.31.32.33.34.
35.36.37.38.39.40.