2 2007-2008 adopted title page & ada - seattle.gov home€¦ · the cip fulfills the budgeting...
TRANSCRIPT

C I T Y O F
S e a t t l e, W a s h i n g t o n
2007 Adopted and 2008 Endorsed Budget
Ordinance 122298
PRINTED ON RECYCLED PAPER

In response to the Americans with Disabilities Act (ADA), material from the budget is available from the City of Seattle Department of Finance in alternative formats. To make a request, or for more information, please call Linda Wokal at (206) 684-8089.

CITY OF SEATTLE 2007 ADOPTED AND
2008 ENDORSED BUDGET
MAYOR GREGORY J. NICKELS
SEATTLE CITY COUNCIL
Nick Licata, Council President
Sally J. Clark David J. Della Jean Godden Tom Rasmussen Richard Conlin Jan Drago Richard McIver Peter Steinbrueck
DEPARTMENT OF FINANCE
Dwight D. Dively, Director
Assistant Directors
Doug Carey Cameron Keyes Jan Oscherwitz Carolyn Iblings Glen Lee
2007-2008 Proposed Budget Process Coordinator: Karen Grove
Amanda Allen Greg Hill Jill Simmons Kristi Beattie Tom Kirn Karl Stickel Janet Credo Janet Krogh Aimee Strasko Carlisle
Jennifer Devore JoEllen Kuwamoto Kathy Sugiyama Greg Doss John McCoy Cheryl Swab
Thomas Dunlap Lisa Peyer Michael Van Dyck Mambo Emedi Janice Pratt Rajan Varadarajan
George Emerson Tyler Running Deer Linda Wokal Dave Hennes Katherine Schubert Knapp


Reader’s Guide
2007 Adopted and 2008 Endorsed Budget -1-
Readers Guide
This reader’s guide describes the structure of the 2007 Adopted and 2008 Endorsed Budget and outlines its contents. It is designed to help citizens, media, and City officials more easily understand and participate in budget deliberations. In an effort to focus on what is achieved through spending, the 2007 Adopted and 2008 Endorsed Budget includes funding levels and expected program outcomes, taking into consideration the current economic situation.
A companion document, the 2007-2012 Adopted Capital Improvement Program (CIP), identifies adopted expenditures and fund sources associated with the development and rehabilitation of major City facilities, such as streets, parks, utilities, and buildings, over the coming six years. The CIP also shows the City’s financial contribution to projects owned and operated by other jurisdictions or institutions. The CIP fulfills the budgeting and financing requirements of the Capital Facilities Element of Seattle’s Comprehensive Plan by providing detailed information on the capacity impact of new and improved capital facilities.
Seattle budgets on a modified biennial basis. See the “Budget Process” section for details.
The 2007 Adopted and 2008 Endorsed Budget
This document is a detailed record of the spending plan adopted for 2007-2008. It contains the following elements:
Selected Financial Policies – a description of the policies that govern the City’s approach to revenue estimation, debt management, expenditure projections, maintenance of fund balances, and other financial responsibilities;
Budget Process – a description of the processes by which the 2007 Adopted and 2008 Endorsed Budget and 2007-2012 Adopted Capital Improvement Program were developed;
Summary Tables – a set of tables that inventory and sum up expected revenues and planned spending for 2007-2008;
General Subfund Revenue Overview – a narrative describing the City’s General Subfund revenues, or those revenues available to support general government purposes, and the factors affecting the level of resources available to support City spending;
Departmental Budgets – City department-level descriptions of significant policy and program changes from the 2006 Adopted Budget, the services provided, and the spending levels adopted to attain these results;
Appendix – an array of supporting documents including Cost Allocation, a summary of cost allocation factors for internal City services; a Report of Position Modifications, listing all position modifications contained in the 2007 Adopted and 2008 Endorsed Budget; a glossary; and, Citywide statistics.
Reader’s Guide
2007 Proposed and 2008 Endorsed Budget -2-
Departmental Budgets: A Closer Look
The budget presentations for individual City departments (including offices, boards, and commissions) constitute the heart of this document. They are organized alphabetically within seven functional clusters:
Arts, Culture, & Recreation;
Health & Human Services;
Neighborhoods & Development;
Public Safety;
Utilities & Transportation;
Administration; and
Funds, Subfunds, and Other.
Each cluster, with the exception of the last, comprises several departments sharing a related functional focus, as shown on the organizational chart following this reader’s guide. Departments are composed of one or more budget control levels, which in turn may be composed of one or more programs. Budget control levels are the level at which the City Council makes appropriations.
The cluster “Funds, Subfunds, and Other” comprises General Fund Subfunds that do not appear in the context of department chapters, including the General Subfund Fund Table, General Subfund Revenue Table, Cumulative Reserve Subfund, Emergency Subfund, Judgment and Claims Subfund, and Parking Garage Fund. A summary of the City’s General Obligation debt is also included in this section.
As indicated, the Adopted Budget appropriations are presented in this document by department, budget control level, and program. At the department level, the reader will also see references to the underlying fund sources (General Subfund and Other) for the department’s budgeted resources. The City accounts for all of its revenues and expenditures according to a system of funds and subfunds. In general, funds or subfunds are established to account for specific revenues and permitted expenditures associated with those revenues. For example, the City’s share of Motor Vehicle Fuel taxes must be spent on road-related transportation activities and projects, and are accounted for in two separate subfunds in the Transportation Fund. Other revenues without statutory restrictions, such as sales and property taxes, are available for general purposes and are accounted for in the City’s General Subfund. For many departments, such as the Seattle Department of Transportation, several funds and subfunds, including the General Subfund, provide the resources and account for the expenditures of the department. For several other departments, the General Subfund is the sole source of available resources.
Budget Presentations
Most department-level budget presentations begin with information on how to contact the department, as well as a description of the department’s basic functions and areas of responsibility. There follows a narrative summary of the major policy and program changes describing how the department plans to conduct its business in light of the adopted budget. When appropriate, subsequent sections present budget control level and program level purpose statements, and program summaries detailing significant program changes from the 2006 Adopted Budget to the 2007 Adopted Budget.

Reader’s Guide
2007 Adopted and 2008 Endorsed Budget -3-
All department, budget control, and program level budget presentations include a table summarizing historical and adopted expenditures, as well as adopted appropriations for 2007 and endorsed appropriations for 2008. The actual historical expenditures are displayed for informational purposes only.
A list of all position changes adopted in the budget have been compiled in a separate report, the Report of Position Modifications. Position modifications include abrogations, additions, reclassifications, and status changes (such as a change from part-time to full-time status), as well as adjustments to departmental head counts that result from transfers of positions between departments.
For information purposes only, an estimate of the number of staff positions to be funded under the Adopted Budget appears in the departmental sections of the document at each of the three levels of detail: department, budget control, and program. These figures refer to regular, permanent staff positions (as opposed to temporary or intermittent positions) and are expressed in terms of full-time equivalent employees (FTEs). In addition to changes that occur as part of the budget document, changes may be authorized by the City Council or the Personnel Director throughout the year, and these changes may not be reflected in the estimate of staff positions presented for 2007 and 2008.
Where relevant, departmental sections close with additional pieces of information: a statement of actual or projected revenues for the years 2005 through 2008; a statement of fund balance; and a statement of 2007-2008 appropriations to support capital projects appearing in the 2007-2012 CIP. Explicit discussions of the operating and maintenance costs associated with new capital expenditures appear in the 2007-2012 Adopted Capital Improvement Program document.

City Organizational Chart
2007 Adopted and 2008 Endorsed Budget -4-
Municipal Judges City Attorney
Fire
Police
Public SafetyCivil ServiceCommission
Firemen'sPension Board
Police Relief& Pension Board
Law
MunicipalCourt
Public Safety
Office of Artsand Cultural
Affairs
Library
Parks &Recreation
Seattle Center
Arts, Culture,& Recreation
Human Services
Seattle-King CountyPublic Health
Health &Human Services
Planning &Development
Office ofEconomic
Development
Office ofHousing
Neighborhoods
Neighborhoods&
Development
City Light
Seattle PublicUtilities
SeattleTransportation
Utilities &Transportation
Office forCivil Rights
Office ofIntergovernmental
Relations
ExecutiveAdministration
Office ofthe Mayor
Fleets & Facilities Finance
Office of Policyand Managment
InformationTechnology
Personnel Office ofSustainability
&Environment
Ethics &Elections
Commission
Legislative
Civil ServiceCommission
Office ofthe City Auditor
Employees'Retirement
System
Office ofHearing Examiner
Administration
Mayor City Council
Citizens of Seattle
Selected Financial Policies
2007 Adopted and 2008 Endorsed Budget -5-
Debt Policies
The City of Seattle seeks to maintain the highest possible credit ratings for all categories of short- and long-term General Obligation debt that can be achieved without compromising delivery of basic City services and achievement of adopted City policy objectives.
The City will reserve $100 million of legal limited tax (councilmanic) general obligation debt capacity, or 12% of the total legal limit, whichever is larger, for emergencies. The 12% reserve is now significantly greater than $100 million.
Except in emergencies, net debt service paid from the General Subfund will not exceed 9% of the total General Fund budget. In the long run, the City will seek to keep net debt service at 7% or less of the General Fund budget.
General Fund Fund Balance and Reserve Policies
At the beginning of each year, sufficient funds shall be appropriated to the Emergency Subfund so that its balance equals 37.5 cents per thousand dollars of assessed value, which is the maximum amount allowed by state law.
Tax revenues collected during the closed fiscal year which are in excess of the latest revised estimate of tax revenues for the closed fiscal year shall automatically be deposited to the Revenue Stabilization Account of the Cumulative Reserve Subfund. At no time shall the balance of the Revenue Stabilization Account exceed 2.5% of the amount of tax revenues received by the City during the fiscal year prior to the closed fiscal year.
Other Citywide Policies
As part of the Mayor’s budget proposal, the Executive develops a revenue estimate that is based on the best available economic data and forecasts.
The City intends to adopt rates, fees, and cost allocation charges no more often than biennially. The rate, fee, or allocation charge structures may include changes to take effect at specified dates during or beyond the biennium. Other changes may still be needed in the case of emergencies or other unanticipated events.
In general, the City will strive to pay for general government current operating expenditures with current revenues, but may use fund balance or other resources to meet these expenditures. Revenues and expenditures will be monitored throughout the year.
In compliance with State law, no City fund whose purpose is restricted by state or local law shall be used for purposes outside of these restrictions.
Working capital for the General Fund and operating funds should be maintained at sufficient levels so that timing lags between revenues and expenditures are normally covered without any fund incurring negative cash balances for greater than 90 days. Exceptions to this policy are permitted with prior approval by the City’s Director of Finance.


Budget Process
2007 Adopted and 2008 Endorsed Budget
-7-
Budget Process
Washington state law requires cities with populations greater than 300,000, such as Seattle, to adopt balanced budgets by December 2 of each year for the fiscal year beginning January 1. The adopted budget appropriates funds and establishes legal expenditure limits for the upcoming fiscal year.
Washington state law also allows cities to adopt biennial budgets. In 1993, the City ran a pilot test on the concept of biennial budgeting for six selected departments. In 1995, the City moved from an annual to a modified biennial budget. Under this approach, the City Council formally adopts the budget for the first year of the biennium and endorses, but does not appropriate, the budget for the second year. The second year budget is based on the Council endorsement and is formally adopted by Council after a midbiennial review.
Budgetary Basis
The City budgets on a modified accrual basis. Property taxes, sales taxes, business and occupation taxes, and other taxpayer-assessed revenues due for the current year are considered measurable and available and, therefore, as revenues even though a portion of the taxes may be collected in the subsequent year. Licenses, fines, penalties, and miscellaneous revenues are recorded as revenues when they are received in cash because this is when they can be accurately measured. Investment earnings are accrued as earned.
Expenditures are considered a liability when they are incurred. Interest on long-term debt, judgments and claims, workers’ compensation, and compensated absences are considered a liability when they are paid.
Budget Preparation
Executive preparation of the budget generally begins in February and concludes no later than October 2 with the Mayor’s submittal to the City Council of proposed operating and capital improvement program (CIP) budgets. Operating budget preparation is based on the establishment of a Current Services or “baseline” budget. Current Services is defined as continuing programs and services the City provided in the previous year, in addition to previous commitments that will affect costs in the next year or two (when developing the two-year biennial budgets), such as voter-approved levy and bond issues for new library and park facilities, as well as labor agreements and changes in health care, insurance, and cost-of-living-adjustments for City employees. At the outset of a new biennium, Current Services budgets are established for both the first and second years. For the midbiennium budget process, the Executive may define the Current Services budget as the second year budget endorsed by the Council the previous November, or re-determine current service levels.
During the budget preparation period, the Department of Finance (DOF) makes two General Fund revenue forecasts, one in April and one in August. Both are used to determine whether the City’s projected revenues are sufficient to meet the projected costs of the Current Services budget. The revenue estimates must be based on the prior 12 months of experience. Proposed expenditures cannot exceed the reasonably anticipated and legally authorized revenues for the year unless the Mayor proposes new revenues. In that case, proposed legislation to authorize the new revenues must be submitted to the City Council with the proposed budget.
In March, at the outset of each new biennium, the Mayor asks departments to identify and prioritize the set of functions, defined as discrete services or activities, provided by the department and to estimate the dollars and full-time employees (FTEs) associated with each. The set of functions serves as a tool for the Mayor and his staff and DOF to review overall City priorities. In April, after updating the revenue forecast, DOF works with the Mayor’s Office to develop departments’ guideline budgets. In May, departments prepare Budget Issue Papers (BIPs), which are summary-level descriptions of suggested budget reductions or increases. The Mayor’s Office and DOF review the documents and provide direction to departments on the BIPs to include in their budget submittals in early June. In early July, DOF receives departmental operating budget and CIP submittals,

Budget Process
2007 Adopted and 2008 Endorsed Budget
-8-
including all position changes. Mayoral review and evaluation of department submittals takes place during July and August. DOF, in conjunction with individual departments, then finalizes the operating and capital budgets.
The process culminates in the proposed operating budget and CIP. Seattle’s budget and CIP also allocate Community Development Block Grant funding. Although this federally funded program has unique timetables and requirements, Seattle coordinates it with the annual budget and CIP processes to improve preparation and budget allocation decisions, and streamline budget execution.
In late September, the Mayor submits the proposed budget and CIP to the City Council. In addition to the budget documents, DOF prepares supporting legislation and other related documents.
Budget Adoption
After the Mayor submits the proposed budget and CIP, the City Council conducts public hearings. The Council also holds committee meetings in open session to discuss budget requests with department representatives and DOF staff. Councilmembers then recommend specific budget actions for consideration by their colleagues. After completing the public hearing and deliberative processes, and after making changes to the Mayor’s proposed budget, the City Council adopts the budget in late November through an ordinance passed by majority vote. The Mayor can choose to approve the Council’s budget, veto it, or let it become law without mayoral signature. The Mayor must veto the entire budget or none of it. There is no line-item veto in Seattle. Copies of budget documents are available for public inspection at the DOF offices, in branches of the Seattle Public Library, and on the Internet at http://www.seattle.gov/financedepartment.
During the budget review process, the City Council may choose to explain its budget actions further by developing statements of legislative intent and budget guidance statements for future budget action. Intent statements state the Council’s expectations in making budget decisions and generally require affected departments to report back to the Council on results. A chart summarizing the City’s budget process schedule is provided at the end of this section.
Legal Budget Control
The adopted budget generally makes appropriations for operating expenses at the budget control level within departments, unless the expenditure is from one of the General Fund reserve accounts, or is for a specific project or activity budgeted in the General Subfund category called Finance General. These projects and activities are budgeted individually. Capital projects programmed in the CIP are appropriated in the budget at the program or project level. Grant-funded activities are controlled as prescribed by law and federal or state regulations.
Budget Execution
Within the legally adopted budget authorizations, more detailed allocations, as approved by DOF, are recorded in the City’s accounting system, called SUMMIT, at the lowest levels of each department’s organizational structure and in detailed expenditure accounts. Throughout the budget year, DOF monitors revenue and spending performance against the budget to protect the financial stability of the City.
Budget Amendment
A majority of the City Council may, by ordinance, eliminate, decrease, or re-appropriate any unexpended appropriations during the year. The City Council, generally with a three-fourths vote, may also increase appropriations from available money to meet necessary expenditures that were not foreseeable earlier. Additional unforeseeable appropriations related to settlement of claims, emergency conditions, or laws enacted since passage of the annual operating budget ordinance require approval by a two-thirds vote of the City Council.

Budget Process
2007 Adopted and 2008 Endorsed Budget
-9-
The Finance Director may approve, without ordinance, appropriation transfers within a department or agency of up to 10%, and with no more than $500,000 of the appropriation authority for the particular budget control level or, where appropriate, line item, being increased. In addition, no transfers can reduce the appropriation authority of a budget control level by more than 25%.
In accordance with Washington state law, any unexpended appropriations for operating or ordinary maintenance expenditures automatically lapse at the close of the fiscal year, except for any appropriation continued by ordinance. Unexpended appropriations for capital outlays remaining at the close of the fiscal year are carried forward to the following year, except for any appropriation abandoned by ordinance. In developing guidelines for the transition to biennial budgeting, the City Council created a mechanism for allocating unexpended, non-capital, year-one appropriation authority. Resolution 28885 allows departments to carry forward into year two up to one-half of the unencumbered and unexpended non-capital appropriations remaining at the end of year one, with Council approval in year two’s budget. The City’s actual practices in this regard have varied over time due to fiscal conditions and policy priorities.

Budget Process
2007 Adopted and 2008 Endorsed Budget
-10-
BUDGET PROCESS DIAGRAM – 2007-2008 BUDGET
MAY Departments submit Budget Issue Papers (BIPs) to describe how they will arrive at their budget targets
MARCH - APRIL DOF prepares revenue projections for 2007-2008
JULY Departments submit budget and CIP proposals to DOF based on Mayoral direction DOF reviews departmental proposals for organizational changes
PHA
SE I
- BU
DG
ET
SU
BM
ITT
AL
PR
EPA
RA
TIO
N
APRIL DOF issues budget and CIP development instructions to departments
FEBRUARY DOF provides departments with the general structure, conventions and schedule for the 2007-2008 Budget
MAY-JUNE Mayor’s Office and DOF review the BIPs and provide feedback to departments
JULY-AUGUST The Mayor’s Office and DOF review department budget and CIP proposals
PHA
SE II
–
PRO
POSE
D
BU
DG
ET
PR
EPA
RA
TIO
N AUGUST-SEPTEMBER
Mayor’s Office makes final decisions on the Proposed Budget and CIP Proposed Budget and CIP documents are produced
SEPTEMBER Mayor presents the Proposed Budget and CIP to City Council
SEPTEMBER-OCTOBER Council develops list of issues for review during October and November DOF and departments prepare revenue and expenditure presentations for Council
PHA
SE II
I –
AD
OPT
ED
B
UD
GE
T
PRE
PAR
AT
ION
OCTOBER-NOVEMBER Council reviews Proposed Budget and CIP in detail Budget and CIP revisions developed, as are Statements of Legislative Intent and Budget Provisos
NOVEMBER-DECEMBERCouncil adopts operating budget and CIP Note: Budget and CIP must be adopted no later than December 2

Budget Overview
2007 Adopted and 2008 Endorsed Budget -11-
Mayor Greg Nickels established four priorities when he took office in January 2002: get Seattle moving, keep our neighborhoods safe, create jobs and opportunity for all, and build strong families and healthy communities. The City Council established a similar set of core budget goals in mid-2006, including maintaining the transportation infrastructure, supporting basic human needs, enhancing public safety, improving the environment, and ensuring budget sustainability. The City’s 2007 Adopted and 2008 Endorsed Budget continues to focus on these priorities. These Budgets were developed during a period of strong regional economic growth but with several looming issues that may affect the City’s finances during the biennium. Thus, the Budgets focus resources on a combination of one-time investments and high-priority programs. Strong Economy and Healthy Revenues As described in the General Subfund Revenue Overview, the Puget Sound area’s economy has rebounded strongly from the 2001 recession. Job growth in the region now exceeds that in the rest of the state and the nation as a whole. A major construction boom now under way includes office buildings, research and manufacturing facilities, housing, and public projects, such as Sound Transit light rail. This economic growth has bolstered many City revenues, including sales tax, Business and Occupation (B&O) tax, Real Estate Excise Tax (REET), electricity sales, and construction permits. It is important to put this recent revenue growth into a longer-term context. For example, sales tax revenues are projected to grow by 7.0% in 2006, 5.5% in 2007, and 4.6% in 2008. However, this follows a period of 10 consecutive quarters of declining revenues in 2001 through 2003. When the effects of inflation are removed, Seattle’s sales tax revenues did not return to 2000 levels until mid-2006. Similarly, the rapid growth in property values has not translated into large growth in property tax revenues. State law limits property tax revenue growth to 1% per year, plus the value of new construction. Because new construction has seen strong growth, overall property tax revenue has been growing by 2% to 3% per year, or about the rate of inflation. The strong recent economic performance gives the City the opportunity to add high-priority services. However, it has not yet been sufficient to fully offset the $120 million in General Fund budget reductions made in the first four years of this decade. Financial Challenges Most economic forecasters expect the national and regional economies to slow over the next few years in response to higher interest rates, a slumping housing market, higher energy prices, and other issues. This slowing is reflected in the revenue estimates used for the 2007 Adopted and 2008 Endorsed Budgets. In addition to these economic concerns, the City faces at least five significant financial challenges as it enters this biennium. B&O Tax Law Changes In 2003, the State Legislature passed House Bill 2030, which is now codified as Chapter 35.102 RCW. The main purpose of this law was to create more uniformity among city B&O taxes through a model ordinance. This purpose was supported by both cities and business organizations. However, Section 13 of the bill was added over the opposition of cities. This section, which becomes effective in 2008, changes how income for certain businesses is calculated for tax purposes. At the Legislature’s request, the State Department of Revenue (DOR) completed a study of the fiscal effects of this change in November 2005. Using 2004 figures, DOR estimated that Washington’s cities would lose approximately $23.3 million of revenue annually, with the effect on Seattle being a loss of $15.6 million. Projecting this to 2008 yields a loss to Seattle of about $20 million. Independent analyses by Seattle’s Department of Finance produce projected losses of the same magnitude, although there is a wide range of possible impacts depending on how businesses respond to the change in the law. DOR’s study also identified several options to mitigate the impact in full or in part. As of this writing, the Legislature had not acted on any of these mitigation measures.

Budget Overview
2007 Adopted and 2008 Endorsed Budget -12-
The 2008 Endorsed Budget assumes the projected revenue loss is fully mitigated. The City’s legislative agenda includes a request that the Legislature repeal modify or mitigate the effects of Section 13. If full mitigation is not provided, the 2008 Endorsed Budget will need to be modified in the midbiennium through increases in other taxes and/or reductions in spending. A $20 million revenue loss would account for about 3% of the General Subfund budget, once unavoidable costs, such as debt service and contractual commitments, are excluded. As part of the budget development process, departments were asked to provide preliminary proposals for what would be cut. These cuts focused on lower-priority services or elimination of proposed service expansions. Some of the proposed changes included:
Postponing or reducing the plan to add firefighters so that all engines have four-person crews;
Reducing the number of Police detectives;
Reducing the number of domestic violence victim advocates;
Slowing Police hiring, thereby reducing the number of officers on duty;
Reducing the Library’s operating hours, which were expanded in 2006;
Reducing maintenance of trees and other open spaces;
Reducing the Neighborhood Matching Fund, which provides support for citizen-initiated projects;
Closing the Animal Shelter one day per week; and
Reducing maintenance staff for City facilities, including community centers and Seattle Center. Health Care Costs The City faces rapid increases in health care costs for its employees, similar to the patterns experienced by other public- and private-sector employers. City health care expenditures are projected to grow by about $45 million between 2005 and 2008, or about 14.4% per year. This increase affects all the City’s operating departments, including General Fund agencies, the Department of Planning and Development, and the utilities. The increases are due to the health care market and changes in utilization as opposed to improvements in plan benefits. Similarly, industrial insurance expenditures are projected to grow by about 9.2% per year over the same period. This increase results from health care costs for treating injured workers, not from higher injury rates. The Adopted Budget includes new staff and programs to help manage these cost pressures. The Personnel Department will add a position to work on health care cost containment. Personnel will also work with other departments to identify possible wellness initiatives. Several departments have initiated efforts to reduce industrial insurance costs. However, these efforts alone cannot bring health care cost escalation down to minimal levels. Federal or state action may be needed if cost containment is going to be effective.

Budget Overview
2007 Adopted and 2008 Endorsed Budget -13-
Civic Center Space Rent In 1994, the City started the development of the new Civic Center. The City purchased Key Tower (now known as the Seattle Municipal Tower or SMT) as the future home for most departments. Construction began later on a new Justice Center for the Police Department and Municipal Court, and on a City Hall for the Mayor’s Office, Legislative Department, Law Department, and related agencies. These new facilities were completed by 2005 and replaced cramped, outmoded, and seismically unsafe buildings. Space rent for agencies with downtown facilities grew substantially between 2006 and 2007 for two reasons. First, the costs for the new facilities are higher than for the buildings they replaced. These higher costs include the debt service on the bonds issued to build or acquire the new structures, an asset preservation reserve to ensure the new buildings are maintained appropriately (unlike their predecessors), and the operations costing for the large plazas and public areas that did not exist previously. Second, most departments have significantly more space in the new buildings than in the old ones. For 2005 and 2006, the City held down space rents by using surpluses accumulated from private tenants in SMT. These tenants were replaced by City departments during the same period, so no surpluses remain to subsidize costs for City agencies in 2007 and beyond. Space rent changes are also complicated by how debt service on Civic Center facilities is recovered. Through 2006, debt service was allocated only to the “six funds” with significant dedicated revenue sources: General Fund, Light Fund, Seattle Public Utilities (SPU) Fund, Planning and Development Fund, Transportation Fund, and Retirement Fund. General Fund departments did not pay any of this debt service directly. For 2007 and beyond, Civic Center debt service is being charged to the Fleets and Facilities Department (FFD) and is recovered through space rents. A further complication is that City Light had its own SMT lease that predated the City’s ownership of the building. This lease expires at the end of 2006 and City Light will pay the same space rental rate as other departments starting in 2007. This set of issues means that individual departments will see very different changes in space rents between 2006 and 2007. Departments with no downtown facilities, such as Parks, will have little or no change. Departments that were already being charged debt service, such as SPU and the Seattle Department of Transportation (SDOT), will see net increases in space rent of about 12%, largely due to the loss of private tenant subsidy. Departments that were not being charged debt service, such as the Department of Executive Administration (DEA), the Department of Finance (DOF), the Legislative Department, and the Office of Housing (OH) will see net increases in space rent of about 175%, which is partially offset by savings in General Subfund debt service payments elsewhere in the budget. Finally, departments that were not being charged debt service and that increased their space usage, such as the Personnel Department, will see increases in excess of 200%. Space rent should not be a major budget driver after 2007. Subsidies have been completely eliminated and debt service is mostly a fixed cost, so space rents should grow more slowly than inflation in the future. Parks Levy Expiration In 2000, Seattle’s voters approved the Neighborhood Parks, Green Spaces, Trails, and Zoo Levy Lid Lift to provide eight years of funding for various parks-related acquisition, development, and maintenance projects. In addition, the Levy included funding for expanded programs and services at parks and community centers. The Levy expires at the end of 2008. The Mayor does not support renewal of this levy for operating purposes. About $9 million would need to be found starting in 2009 if all of these programs were continued. The Parks Department has identified options for terminating, modifying, or finding other funding sources for these programs. The 2007 Adopted and 2008 Endorsed Budget includes a plan to phase in the Levy termination

Budget Overview
2007 Adopted and 2008 Endorsed Budget -14-
gradually from 2008 through 2010 by using additional General Subfund resources to save some Levy resources for the following biennium. The City is also exploring other funding options for some programs, including support for the Woodland Park Zoo. This combination of efforts should reduce the effect of Levy termination in 2009. Community Development Block Grant (CDBG) CDBG is the federal government’s principal source of funding to support local community development and human services programs. Federal funding has been constant or slowly declining in recent years. The president’s budget for 2007 assumed a significant cut in CDBG, but it appears that Congress will at least maintain last year’s funding level. The 2007 Adopted and 2008 Endorsed Budget assumes federal CDBG funding will be similar to amounts received in 2006. As part of the Sound Transit light rail project, the City has committed CDBG funds to the Rainier Valley Community Development Fund (RVCDF). This commitment increases by $1.85 million between 2006 and 2007, necessitating reductions in other programs funded by CDBG. The Adopted Budget continues funding for many of these programs from other sources, including shifting costs of Housing Levy administration and some economic development programs to the General Fund. Similarly, a program that pays for parks maintenance projects and helps train homeless individuals is shifted to REET. Some lower-priority programs in the Human Services Department (HSD) are reduced in order to provide General Fund to cover CDBG cuts in high-priority human services programs serving homeless individuals. Future uses of CDBG depend on continuing federal funding for this program. It is not likely that the City’s other revenues will be able to fully offset significant cuts in CDBG funding if they occur. Making Nonrecurring Investments The strong economy has produced significant General Fund surpluses in 2005 and 2006. However, the challenges outlined above suggest that such surpluses will not continue indefinitely, so the City must be cautious in starting new, ongoing programs or expanding existing ones. The City therefore developed the 2007 Adopted and 2008 Endorsed Budget by focusing on one-time budget additions and high-priority programs. Many of the one-time investments focus on improving the City’s technological capabilities. These investments include:
Further developing the Seattle Justice Information System (SEAJIS), which improves data links among the Police Department, Law Department, and Municipal Court. This eliminates duplicate data entry and improves efficiency, thereby allowing position reductions in some agencies.
Expanding the program to install video cameras in Police cars. The Adopted Budget includes funding to
put a combined camera and mobile data computer in all Police Department patrol vehicles. In addition, each officer will be issued his/her own laptop computer to be used with the new Records Management System. This deployment of technologies will improve efficiency and increase accountability.
Purchasing and installing vehicle locators in each Police car. This system uses global positioning
technology so dispatchers can see the exact location of every patrol vehicle, thereby ensuring the fastest possible response and providing additional officer safety.
Providing regular funding for upgrading Library servers. Many of the systems supporting the Seattle
Public Library’s operations were purchased with capital funds through the Libraries for All ballot measure. The Adopted Budget provides a stable source of money to gradually replace and upgrade these systems.

Budget Overview
2007 Adopted and 2008 Endorsed Budget -15-
Replacing DEA’s cash receipting, tax collection, and payroll interface systems. These investments will improve customer service and increase reliability.
Constructing backup cooling systems for City data centers in SMT, which will ensure continued operation
in emergencies.
Upgrading FFD’s fleet and property management software.
Purchasing and customizing a departmental budget development system that will be shared by several midsized City agencies.
Supporting the Safe Harbors information management system, which helps improve service delivery to
homeless individuals.
Funding the Department of Information Technology (DoIT) to develop a business case for the Technology Infrastructure Optimization project (TIO). The purpose of TIO is to replace the City’s hardware and software that support electronic mail, filing and printing, and other internal operations. The current software may not be supported by the vendor in the future and TIO will assess the cost-effectiveness of various alternatives.
The City also took the opportunity to fund several other high-priority, nonrecurring items, including investments in “green” equipment and facilities (further described below), development of long-term plans for the Parks Department and Seattle Center, a housing needs assessment, and one-time equipment purchases for several departments. The City also added nonrecurring funding for several community facilities, as described below. Addressing Major Priorities Mayor Nickels established four major priorities when he took office five years ago. The Adopted Budget includes significant investments in each of these areas. Get Seattle Moving Transportation systems are a critical feature of urban areas. The City of Seattle has lost several major revenue sources devoted to transportation maintenance over the last decade as a result of court decisions or statewide initiatives. The City has expanded its support for transportation from the General Fund and REET significantly over the past five years, but still has a substantial transportation maintenance backlog. In addition, the state and region need to make investments in major corridors, including the Alaskan Way Viaduct and the Evergreen Point Bridge (SR 520). The Adopted Budget continues current transportation maintenance efforts and adds significant funding in two programs:
Bridging the Gap. In May, the Mayor proposed a 20-year transportation maintenance and development program to be supported by a combination of a property tax levy lid lift, a commercial parking tax, and a business transportation tax calculated on employee hours worked. The Council approved a modified version of this proposal in July with a somewhat lower property tax and a gradual phase-in of the other two taxes. In September, as this Budget was being completed, the Mayor and several Councilmembers decided to propose a modified property tax measure for the November ballot. The original proposal allowed the tax revenue to grow for the first six years to compensate for construction inflation. However, under state law, such a measure could not have a definite term. The new proposal would provide for a nine-year levy but cannot grow at the rate of construction inflation.

Budget Overview
2007 Adopted and 2008 Endorsed Budget -16-
The City’s voters approved this new approach in November, which will generate approximately $39.9 million and $51.5 million from the three revenue sources for transportation investments in 2007 and 2008, respectively. These investments include significant expansions of maintenance programs, such as street paving and bridge rehabilitation; new and expanded programs to build sidewalks and bicycle lanes; support for transit operations and related capital improvements; and the City’s share of the cost of four major facilities – the Spokane Street Viaduct, the Mercer Corridor, the Lander Street Overcrossing, and King Street Station.
Alaskan Way Viaduct and Seawall Replacement. The Alaskan Way Viaduct is approximately 50 years
old and has exceeded its useful life. Many parts of the structure are seismically unsafe and it sits on unstable soils. The neighboring Seawall was mostly built in the 1930s and has deteriorated under attack by marine organisms. The City has been working with the Washington State Department of Transportation (WSDOT) to develop plans for replacing these structures. The Mayor and Council have identified a tunnel as the City’s preferred replacement option. The 2007 Adopted Budget includes $24.0 million in City Light and $5.5 million in SPU to continue planning and design for utility relocation required by the project. Actual relocations are projected to begin in 2008. In addition, the Budget proposes a $4.0 million Councilmanic bond issue to cover a portion of SDOT’s costs in 2007-2008. These costs include design work and demonstration projects related to the North Seawall. Other costs will be covered by WSDOT.
Keep Our Neighborhoods Safe Public safety is the principal responsibility of local government. In the last three years, the City has made major new investments in public safety, including the addition of about 33 Police patrol officers and significant investments in Police technology and equipment. The City is in the process of adding firefighters so each engine has a four-person crew, which will improve safety and provide faster response to fires. This process is expected to be complete in early 2008. The Fire Facilities Levy is providing funds to replace or renovate neighborhood fire stations, build a new Fire Alarm Center and Emergency Operations Center (EOC), and purchase two new fireboats. The City has also stepped up its efforts to prepare for emergencies, including disaster caches, emergency generators, emergency water supplies, and equipment and supplies needed to respond to terrorist events or natural disasters. Two major new efforts are included in the 2007 Adopted and 2008 Endorsed Budget:
Emergency Preparedness. Several departments receive funding to expand emergency preparedness. Staff are added to the Fire Department and FFD to coordinate their departments’ emergency work. The Emergency Preparedness Bureau in the Police Department will study the City’s needs to respond to a medical emergency, such as pandemic flu. The 2008 Endorsed Budget includes $250,000 in Finance General to purchase equipment or supplies identified by this study. About $966,000 is included for DoIT to build a backup 911 dispatch center in the new EOC. In addition, the Department of Planning and Development (DPD) receives funding to conduct a study of unreinforced masonry buildings in Seattle.
New Officers, Technology, and Vehicles. The City has received grant funding from Sound Transit to
provide additional traffic control during construction of light rail in the Downtown Bus Tunnel. Some of this funding expires in 2007. The Adopted Budget continues current staffing levels using General Fund resources, which will add six positions to Patrol in 2007. In addition, funding is set aside in Finance General for 10 additional officers in 2007 and 20 more in 2008. Funding is also provided for four civilian support positions, whose assignments and job titles will be determined in 2007. As noted previously, the Adopted Budget makes major investments in Police Department technology, which will facilitate dispatching, recordkeeping, and accountability. These investments will improve efficiency and will support the geo-policing effort to assign officers to areas with the greatest need. Finally, the Budget provides funds to purchase 10 new patrol cars, which will provide more coverage through one-person rather than two-person vehicles.

Budget Overview
2007 Adopted and 2008 Endorsed Budget -17-
Create Jobs and Opportunity for All Economic development was a major focus of the City in the first part of this decade. The deep recession led the City to undertake major efforts to attract and retain employers, including lifting the development lid in the University District, changing development regulations and making public investments in the Northgate neighborhood, building infrastructure and supporting redevelopment in South Lake Union, and changing development regulations to support construction and housing downtown. The City also made a series of targeted investments in job training, business outreach, and neighborhood business districts. These efforts will continue and expand in 2007. In addition, the Adopted Budget includes two new economic development efforts:
Permit Processing Times. The recent boom in construction has led to delays in processing building-related permits, despite staff expansions and new systems that improve interdepartmental coordination. The Adopted Budget adds staff to DPD, Fire, and SDOT to ensure that permit processing time goals are met.
Apprenticeship. Apprenticeship programs are one of the best ways to provide access to well-paying jobs
in building trades, automotive professions, and other jobs. These programs are especially valuable for women and people of color. The City has been a leader in providing apprenticeship opportunities and a substantial expansion of these opportunities is planned for 2007. City Light will add 30 apprentice positions to begin preparing individuals to replace line workers and other electrical professionals, many of whom are expected to retire within the next decade. SPU will expand its apprentice programs in both the water and wastewater fields. FFD will restore its three auto apprentice positions. Finally, the Personnel Department’s budget will include 10 unfunded apprentice positions. These will be used in the same way as the successful program for supported employees. Departments that want to create or expand an apprenticeship program can borrow a position from Personnel and use it to hire a new apprentice. This provides more flexibility and allows programs to be started quickly and efficiently.
Build Strong Families and Healthy Communities The City of Seattle provides a wide range of services to its residents and to people from the surrounding region. The Adopted Budget includes significant expansions of efforts in many areas:
Environmental Action Agenda. The Mayor has proposed a three-part Environmental Action Agenda. “Green Seattle” focuses on expanding the City’s tree cover and ensuring that City-owned trees are maintained appropriately. The “Climate Protection Initiative” focuses on reducing greenhouse gas emissions and having Seattle achieve the goals of the Kyoto protocol by 2012. “Restore Our Waters” focuses on improving the City’s streams and shorelines, and reducing adverse impacts caused by City facilities. The 2007 Adopted Budget includes about $20.5 million of investments in these three areas, including about $14.8 million associated with the Bridging the Gap transportation initiative. Some of the most significant investments include:
• Adding a new tree crews to SDOT to maintain City-owned trees;
• Adding funds to improve tree maintenance in the City’s open space areas, including removing
invasive species;
• Purchasing “green” vehicles and equipment, including hybrid cars for Police nonpatrol uses and electric equipment for maintenance in Parks and Seattle Center, as well as further expansion of the City’s use of biodiesel;
• Reducing wastewater discharges from City facilities by covering material storage areas and
changing systems at fire stations;

Budget Overview
2007 Adopted and 2008 Endorsed Budget -18-
• Adding and maintaining sidewalks and bike lanes;
• Investing in transit operations and making capital investments that improve transit reliability; and
• Adding staff and capital funds to reduce energy and water use by City facilities.
Ten-Year Plan to End Homelessness and the Housing First Strategy. Seattle is one of the participants in
the 10-Year Plan, which calls for investments in affordable housing to move homeless individuals and families out of shelters and into supporting housing. One aspect of this is “Housing First,” a strategy that offers immediate long-term housing with support services for homeless individuals with the most significant challenges, including drug or alcohol abuse and mental health issues. The 2007 Adopted and 2008 Endorsed Budget includes annual funding of about $985,000 to continue and expand support services for Housing First. In addition, about $705,000 is included each year to continue the current level of shelter beds for this biennium until the investments in housing can begin to reduce demand. Finally, $2 million of General Fund resources are added to OH’s budget in 2007 to fund the City’s share of construction of about 40 units of supported housing. The Mayor is calling on King County, suburban cities, and nonprofit organizations to match Seattle’s efforts in the 10-Year Plan.
Neighborhood Investments. The Adopted Budget expands City programs in neighborhoods facing
economic uncertainty and social challenges. Three neighborhoods receive special attention:
• The 2007-2008 Budget includes approximately $1.7 million in targeted funds for the South Park neighborhood. This includes expansion of community center hours, with a particular focus on youth programs; continuation of very successful human services and economic development programs; paving of the major street in the business district; and continued efforts to reduce drainage problems.
• An initiative to revitalize the Broadway neighborhood began in 2005. The City provided funding
through a midyear supplemental ordinance in 2006. The 2007 Budget includes $200,000 in the Office of Economic Development (OED) to continue these efforts. Finance General is provided with $175,000 in 2008 to fulfill the City’s overall commitment of $500,000 to this neighborhood.
• Sound Transit light rail and other development pressures will have major effects on Southeast
Seattle. The 2007-2008 Budget continues funding for efforts in OED and the Office of Policy and Management to support this neighborhood. In addition, $75,000 is provided in Finance General each year for consultant support for a possible community revitalization effort.
Race and Social Justice. The Mayor started his Race and Social Justice Initiative (RSJI) four years ago.
The purposes of the Initiative are to ensure that City services are available to everyone and that the City works to eliminate the effects of racism within City government and the broader community. Many aspects of the 2007-2008 Budget were developed with an explicit focus on social justice issues, including the 10-Year Plan, South Park, and apprenticeship investments previously described. Other initiatives in this area include continued City support for the Contractor Development and Competitiveness Center, which helps small businesses develop skills to obtain public contracts, and funding for a new staff person in DEA to monitor compliance with wage laws by housing contractors. This responds to recent concerns that many workers on these projects, who are often immigrants and people of color, have not been paid appropriately.
Community Facilities. The City has provided financial support for several development projects by
nonprofit cultural or human services organizations in the last few years, including the Museum of History and Industry, the Seattle Children’s Museum, the Wing Luke Museum, the Colman School project, and

Budget Overview
2007 Adopted and 2008 Endorsed Budget -19-
the Asian Counseling and Referral Services project. This is done by purchasing services or property rights from the agencies involved. The Adopted Budget continues this practice. New investments include:
• $1 million for the Rainier Vista Boys and Girls Club, as called for in Resolution 30817; • $250,000 for part of the costs of a new facility for Family Services;
• $250,000 for the East Madison YMCA project;
• $300,000 for the Chief Seattle Club serving Native Americans;
• $250,000 for the Nisei Veterans project;
• $150,000 for the Seattle Heritage Shipyard; • $500,000 for the Seattle Housing Authority for a community facility at High Point; and • $333,333 in 2008 as the first payment of a projected $1 million for the Nordic Heritage Museum.
Seattle Center Financial Stability. Seattle Center experienced very difficult financial circumstances in the
early part of this decade due to the recession and relatively poor performances by KeyArena’s major tenant. Despite cutting staffing and reducing maintenance, the Center developed a $10 million deficit by 2005. This deficit has been filled by selling parking lots surplus to the Center’s needs, but the deficit will recur quickly without further action. The Mayor appointed a citizens committee to make recommendations on the Center’s future. The 2007-2008 Budget builds on these recommendations in several ways:
• Debt service on KeyArena and the revenues associated with it are removed from the Seattle
Center Fund and shifted to the General Fund. This creates a net annual obligation for the General Fund of about $2.6 million.
• Nine maintenance positions are restored to the Center’s budget at an annual General Fund cost of
almost $900,000. • The General Fund also provides money to offset revenue losses associated with the monorail. A
$4.5 million rehabilitation of the monorail is financed through Councilmanic debt to be repaid by the General Fund, operating revenues, and projected federal grants.
• Funding is provided from the sale of Lot 2 to pay for a 20-year plan for the Center’s facilities and
grounds. This will update existing plans that have supported the Center’s rehabilitation since the early 1990s.
Parks Improvements. The Adopted Budget includes several major initiatives in the Parks Department. In
addition to the “green” investments that have already been described, the Budget includes a downtown parks initiative of maintenance and program expansions. About $7 million of Councilmanic debt is provided to renovate Building 27 at Sand Point to house indoor recreation programs. This debt service is expected to be covered by tenant revenues after 2009. Funds are provided for partial payment for the Capehart property in Discovery Park. An agreement on this issue is expected in early 2007. The

Budget Overview
2007 Adopted and 2008 Endorsed Budget -20-
Cumulative Reserve Subfund will cover the costs for new artificial turf fields and replacement of lights with safer, more energy-efficient, and less obtrusive structures. Finally, the rapid growth of REET in recent years allows Parks to expand its major maintenance of existing facilities.
Library Collections and Technology. The Adopted Budget provides a $500,000 annual increase in the
Library collections budget. A recent patron survey found that users wanted more investment in collections rather than expansion of hours. As noted above, the Budget also includes ongoing funding to replace the Library’s major information processing systems.
Conclusion The Adopted 2007 and Endorsed 2008 Budgets reflect strong economic growth and the results of good fiscal management in the last few years. There are several major budget challenges likely in 2008 and 2009, so much of the current financial surplus focuses on one-time investments. In addition, funds are set aside for the City’s highest priorities and to offset some of the budget cuts that had to be made earlier in the decade.

Summary Tables
2007 Adopted and 2008 Endorsed Budget -21-
REVENUE SUMMARY BY SOURCE
(in thousands of dollars)*
GENERAL SUBFUND
Revenue Source 2005
Actual2006
Revised 2007
Adopted2008
Endorsed
Total Taxes 607,646 647,216 669,425 692,624
Licenses and Permits 15,303 12,979 12,684 12,400
Parking Meters/Meter Hoods 15,333 16,586 18,288 19,596
Court Fines 16,255 17,001 16,981 16,261
Interest Income 3,200 5,339 4,598 4,051
Revenue from Other Public Entities 22,312 8,950 9,728 9,512
Service Charges & Reimbursements 41,982 40,298 45,915 46,182
All Else 1,208 1,497 1,168 1,253
Total: Revenue & Other Financing Sources $723,239 $749,866 $778,786 $801,879
Interfund Transfers 4,455 1,037 6,483 4,555
Total, General Subfund $727,694 $750,903 $785,269 $806,434 *Totals may not add due to rounding.

Summary Tables
2007 Adopted and 2008 Endorsed Budget -22-
EXPENDITURE SUMMARY (in thousands of dollars)
2006 Adopted 2007 Adopted 2008 Endorsed General Total General Total General Total Department Subfund Funds Subfund Funds Subfund Funds Arts, Culture & Recreation Office of Arts and Cultural Affairs 2,013 4,186 2,382 6,561 2,340 6,354 The Seattle Public Library 40,409 43,164 44,283 47,111 45,745 48,624 Department of Parks and Recreation(1) 66,856 112,498 72,329(2) 117,525 75,088 122,478 2000 Parks Levy Fund 0 29,344 0 18,892 0 9,390 1999 Seattle Center/Community Centers Fund 0 0 0 0 0 0 Seattle Center 10,615 36,675 14,162 32,794 14,239 34,157 SubTotal 119,893 225,867 133,156 222,882 137,412 221,003 Health & Human Services Community Development Block Grant 0 15,362 0 13,695 0 13,540 Educational and Developmental Services Levy 0 14,765 0 16,534 0 17,575 Human Services Department 39,249 87,288 47,329 99,682 47,444 103,716 SubTotal 39,249 117,415 47,329 129,911 47,444 134,831 Neighborhoods & Development Office of Economic Development 5,932 5,932 6,996 6,996 6,967 6,967 Office of Housing 2,475 33,912 2,928 37,848 953 34,801 Department of Neighborhoods 7,342 7,342 8,296 8,296 8,259 8,259 Neighborhood Matching Subfund 3,271 3,271 3,184 3,596 3,568 3,699 Department of Planning and Development 8,931 55,357 10,043 61,748 10,043 63,266 SubTotal 27,951 105,814 31,447 118,484 29,790 116,992 Public Safety Criminal Justice Contracted Services 19,551 19,551 20,949 20,949 21,974 21,974 Fire Facilities Fund 0 19,344 0 44,015 0 2,377 Firemen's Pension 16,423 17,707 16,884 17,975 17,072 18,201 Law Department 14,486 14,486 16,888 16,888 17,342 17,342 Police Relief and Pension 15,807 16,772 16,244 16,855 16,706 17,317 Public Safety Civil Service Commission 120 120 125 125 129 129 Seattle Fire Department 123,107 123,107 135,812 135,812 141,555 141,555 Seattle Municipal Court 19,980 19,980 25,056 25,056 25,837 25,837 Seattle Police Department 190,270 190,270 208,345 208,345 212,616 212,616 SubTotal 399,744 421,337 440,304 486,019 453,231 457,348 Utilities & Transportation Seattle City Light 0 903,138 0 916,720 0 947,369 Seattle Public Utilities 2,405 581,311 1,109 658,510 1,214 687,544 Seattle Transportation 40,245 177,128 43,002 193,168 42,741 318,118 SubTotal 42,650 1,661,577 44,111 1,768,397 43,955 1,953,030

Summary Tables
2007 Adopted and 2008 Endorsed Budget -23-
2006 Adopted 2007 Adopted 2008 Endorsed General Total General Total General Total Department Subfund Funds Subfund Funds Subfund Funds Administration Civil Service Commission 168 168 202 202 209 209 Department of Executive Administration 29,407 29,407 33,577 33,577 32,889 32,889 Department of Finance 3,973 3,973 5,230 5,230 5,063 5,063 Department of Information Technology 3,362 36,932 3,901 52,387 3,306 52,487 Employees' Retirement System 0 7,509 0 8,527 0 9,469 Ethics and Elections Commission 563 563 597 597 616 616 Finance General 32,375 32,375 35,925 35,925 37,182 37,182 Fleets and Facilities Department 2,695 79,967 0 108,469 0 109,737 Legislative Department 9,526 9,526 11,313 11,313 11,680 11,680 Office of City Auditor 1,048 1,048 1,071 1,071 1,107 1,107 Office of Hearing Examiner 488 488 512 512 529 529 Office of Intergovernmental Relations 1,850 1,850 2,036 2,036 2,075 2,075 Office of Policy and Management 2,027 2,027 2,400 2,400 2,426 2,426 Office of Sustainability and Environment 612 612 930 930 958 958 Office of the Mayor 2,461 2,461 2,814 2,814 2,882 2,882 Personnel Compensation Trust Subfunds 0 116,401 0 139,837 0 154,863 Personnel Department 10,227 10,227 12,210 12,210 12,568 12,568 Seattle Office for Civil Rights 1,861 1,861 2,095 2,095 2,226 2,226 SubTotal 102,643 337,395 114,812 420,132 115,716 438,966 Funds, Subfunds and Other Bonds Debt Service(3) 32,677 58,882 25,423 51,769 18,510 39,823 Cumulative Reserve Subfund 678 61,199 0 66,921 0 54,448 Emergency Subfund 2,834 2,834 3,030 3,030 3,324 3,324 Judgment/Claims Subfund 485 15,050 1,379 15,000 1,379 15,000 Parking Garage Fund 0 6,964 0 7,185 0 7,420 SubTotal 36,674 144,929 29,832 143,905 23,213 120,015 Grand Total 768,804 3,014,334 840,991 3,289,730 850,761 3,442,186 *Totals may not add due to rounding. Notes: (1) General Subfund figures for the Department of Parks and Recreation reflect both the direct subsidy from the General
Subfund and Charter revenues. (2) Includes $400,000 General Subfund subsidy to Capital Improvement Program budget control level Building Component
Reservations. (3) The amounts in the “Total Funds” column reflect the combination of the General Subfund LTGO bond debt obligation
and the UTGO bond debt obligation. Resources to pay LTGO debt payments from non-General Subfund sources are appropriated directly in operating funds.


Revenue Overview
2007Adopted and 2008 Endorsed Budget -25-
City Revenue Sources – November 2006
City Revenue Sources and Fund Accounting System
The City of Seattle expends $2.6 billion annually on services and programs for Seattle residents. State law authorizes the City to raise revenues to support these expenditures. There are four main sources of revenues. First, taxes, license fees, and fines support activities typically associated with City government, such as police and fire services, parks, and libraries. Second, certain City activities are partially or completely supported by fees for services, regulatory fees, or dedicated property tax levies. Examples of City activities funded in whole or in part with fees include certain facilities at the Seattle Center, recreational facilities, and building inspections. Third, City utility services (electricity, water, drainage and wastewater, and solid waste) are supported by charges to customers for services provided. Finally, grant revenues from private, state or federal agencies support a variety of City services, including social services, street and bridge repair, and targeted police services.
The City accounts for all revenues and expenditures within a system of accounting entities called “funds” or “subfunds”. The City maintains dozens of funds and subfunds. The use of multiple funds is necessary to ensure compliance with state budget and accounting rules, and is desirable to promote accountability for specific projects or activities. For example, the City of Seattle has a legal obligation to ensure revenues from utility use charges are spent on costs specifically associated with providing utility services. As a result, each of the City-operated utilities has its own operating fund. For similar reasons expenditures of revenues from the City’s Families and Education Property Tax Levy are accounted for in the Educational and Development Services Fund. As a matter of policy, several City departments have separate funds or subfunds. For example, the operating revenues and expenditures for the City’s parks are accounted for in the Park and Recreation Fund. The City also maintains separate funds for debt service and capital projects, as well as pension trust funds, including the Employees’ Retirement Fund, the Firemen’s Pension Fund, and the Police Relief and Pension Fund. The City holds these funds in a trustee capacity, or as an agent, for current and former City employees.
The City’s primary operating fund is the General Fund. The majority of resources for services typically associated with the City, such as police and fire or libraries and parks are received into and spent from one of two subfunds of the City’s General Fund: the General Subfund for operating resources (comparable to the “General Fund” in budgets prior to 1996) and the Cumulative Reserve Subfund for capital resources.
All City revenue sources are directly or indirectly affected by the performance of the local, regional, national and even international economies. For example, revenue collections from sales, business and occupation, and utility taxes, which together account for 56.8% of General Subfund revenue, fluctuate significantly as economic conditions affecting personal income, construction, wholesale and retail sales and other factors in the Puget Sound region change. The following sections describe the current outlook for the local and national economies, and present greater detail on forecasts for revenues supporting the General Subfund, Cumulative Reserve Subfund, and the Transportation Fund.
The National and Local Economy
National Economic Conditions and Outlook
The current expansion is now in its fifth year. The decade of the 1990s saw the longest national economic expansion on record, one that lasted a full 10 years. The expansion was characterized by rising productivity, a booming stock market, an expanding high-tech sector, and strong investment. During the high-growth years of the late 1990s, optimists talked of the arrival of a “new economy,” which would usher in a future characterized by rapid economic growth, soaring incomes, and an end to the business cycle.
The dream of a “new economy” ended in early 2000, when the stock market bubble burst. With stock prices no longer rising, businesses cut back on investment spending. Consumer spending also slowed as falling stock prices led to a drop in household wealth. The slowing economy slipped into recession in March 2001, and was weakened

Revenue Overview
2007Adopted and 2008 Endorsed Budget -26-
further by the September 11 terrorist attacks. Due to aggressive interest rate cuts by the Federal Reserve, the recession was both short and mild.
The recovery, which began in December 2001, has been relatively weak by historical standards. During the recovery’s 4½ years, the U.S. economy added 4.5 million jobs, an increase of 3.4%. Wage growth has also been weak, and during the past year the growth rate of employee compensation, which includes salaries and benefits, has lagged the rate of inflation.
Housing has led the recovery. The housing market has been a key driver of the economy during the current expansion. The very low interest rates set by the Federal Reserve to soften the downturn and spur a recovery stimulated the housing market by enabling buyers to afford larger mortgages. As housing became more affordable, home sales increased, home ownership rose to record levels, and prices were pushed upward due to increased demand. In addition, the housing market received a further boost as many Americans decided that real estate was a more attractive investment than the stock market.
As the housing market flourished, it stimulated growth in industries involved in residential construction, the financing and sale of residential properties, and the sale of home furnishings, appliances, and building materials. In addition, rising home values supported an expansion of consumer spending via the wealth effect. Rising home values increase household wealth, and when people feel wealthier they tend to save less and spend more out of their current income. Rising home values also create an opportunity for home owners to extract some of their home equity via home equity borrowing or cash-out refinancing. Home equity extraction has risen sharply since the 2001 recession to an estimated 8% of disposable income in 2005, providing a further stimulus to consumer spending (see Figure 1).
Figure 1. Net Home Equity Extraction as a Percent of Disposable Income
0%
1%
2%
3%
4%
5%
6%
7%
8%
9%
1993
1994
1995
1996
1997
1998
1999
2000
2001
2002
2003
2004
2005
E
Source: Federal Reserve Board. 2005 est imate based on data from Moody's Economy.com.
In June 2004, the Federal Reserve began a campaign of interest rate increases by raising rates by 0.25% at each of its meetings. This led to a rise in mortgage rates, which, along with rapidly escalating house prices, caused housing affordability to decline. With affordability declining, the national housing market peaked in the third quarter of 2005, and has slowed sharply since then. As of June 2006, the number of home sales was down 8.9% from June of the previous year, and year-over-year price growth had fallen to 0.9%. Inventories of unsold homes were at their highest level since 1997, and single-family housing starts had dropped by 14% in the past year.

Revenue Overview
2007Adopted and 2008 Endorsed Budget -27-
The Seattle area housing market lagged the national market on the upswing and is lagging in the slowdown as well. During the first half of 2006, home sale prices increased at a double digit pace, but the number of sales dropped below the previous year’s level and the inventory of active listings began to grow.
The forecast is for slower national growth. As of mid-2006, there is growing evidence that the U.S. economy is slowing, as the housing market shifts from a source of growth to a drag on the economy. The growth rate of real Gross Domestic Product (GDP) fell to 2.5% in the second quarter, the rate of employment growth has weakened in recent months, and the unemployment rate posted a modest increase in July. Causes of the economy’s slowdown include the slowing housing market, rising interest rates, and high energy prices.
Most forecasters expect the economy to grow at a slower pace for the next several quarters. Global Insight, for example, forecasts that real GDP growth will range between 2% and 3% through the end of 2007.
As always, there are numerous risk factors that could cause growth to deviate from expectations. One major risk arises from the Federal Reserve’s attempt to contain inflation by raising interest rates in order to slow the economy. The Fed’s goal is to slow the economy enough to reduce inflation but not so much that a recession ensues. This balancing act is difficult to achieve in part because it takes 12 to 18 months for the effects of the Fed’s interest rate changes to work their way through the economy. Other risks to the economy include the housing market slowing too sharply and the potential for further energy price hikes or a supply disruption. With the economy slowing and the housing market decelerating, most economists believe that the chances of a recession occurring are rising.
Puget Sound Region Economic Conditions and Outlook
The region is now growing faster than the nation and the rest of the state. The Puget Sound region suffered more from the 2001 recession than almost any region in the nation because of its concentration of high-tech firms, which were hammered by the deflation of the stock market bubble, and the impact on Boeing of the September 11 terrorist attacks. The sharp drop in air travel that followed September 11 created financial distress for the world’s airlines and a decline in the demand for airliners. Forced to sharply reduce it production levels, Boeing eliminated 27,200 of its Washington state jobs over the next 2¾ years.
During the recession, the region lost 97,800 jobs, a 6.9% decline, between December 2000 and September 2003 (see Figure 2). The recovery started out slowly but growth has picked up steadily over time, reaching a 3.6% growth rate during the first half of 2006. The Puget Sound region is now growing at a faster pace than the nation and the rest of the state.

Revenue Overview
2007Adopted and 2008 Endorsed Budget -28-
Figure 2. Non-Agricultural Wage & Salary Employment (December 2000 = 100)
92
94
96
98
100
102
104
106
Jan-
99
Jul-9
9
Jan-
00
Jul-0
0
Jan-
01
Jul-0
1
Jan-
02
Jul-0
2
Jan-
03
Jul-0
3
Jan-
04
Jul-0
4
Jan-
05
Jul-0
5
Jan-
06
U.S.
Wash-ington
SeattleMD
NOT E: Data are seasonally adjusted. Seat t le MD = King & Snohomish Counties.
Contributing to the region’s healthy growth over the past 1½ years has been an upturn at Boeing, which added 12,800 jobs since June 2004, and continued growth at Microsoft. Boeing has been adding workers as it increases production rates for existing models and ramps up research and development activity for its popular new 787 model. In the year ending June 30, 2006, Microsoft added a record 10,081 employees worldwide and 3,938 in the Seattle area. Microsoft is preparing new versions of its Windows and Office software products to be released next year, and is investing heavily in online services. Other sources of growth in the local economy include construction and professional & business services, an industry in which Seattle specializes.
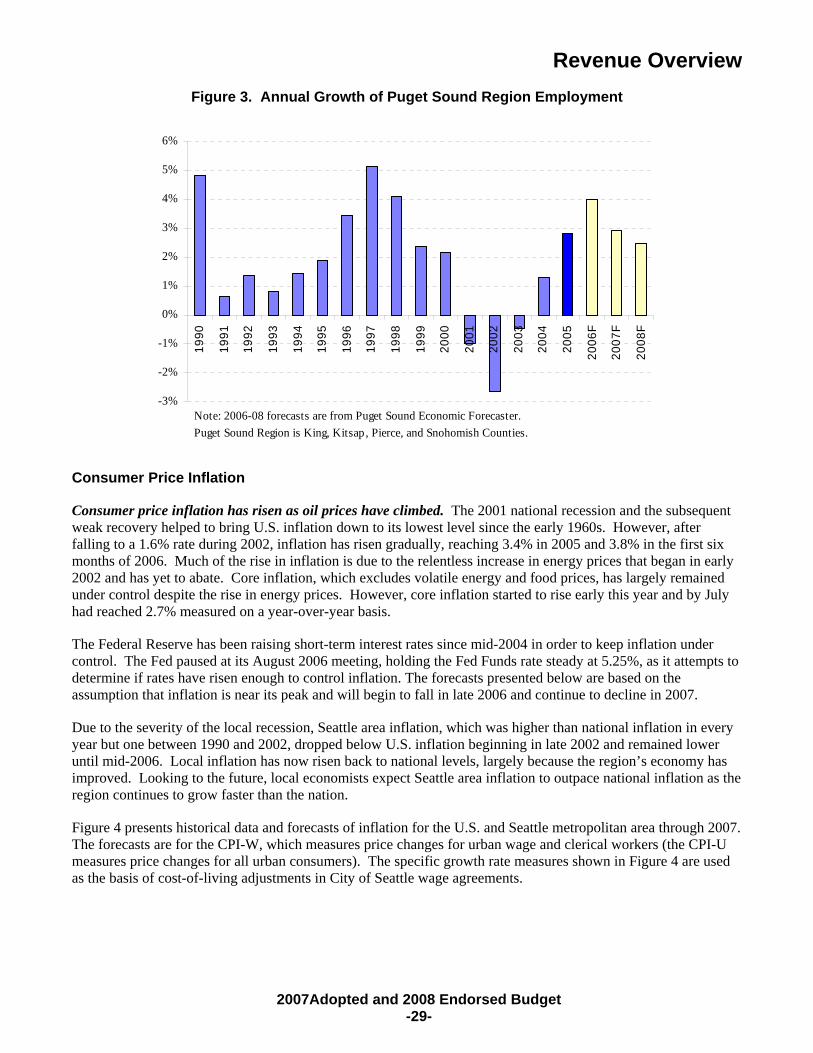
The region’s pace of growth is expected to slow. The region’s current expansion is expected to continue, but the rate of growth is expected to slow over time as the real estate market cools and the pace of national economic growth slows (see Figure 3). According to the Puget Sound Economic Forecaster, employment growth will peak at 4.0% this year, then decline to 2.9% in 2007 and 2.5% in 2008.
Revenue Overview
2007Adopted and 2008 Endorsed Budget -29-
Figure 3. Annual Growth of Puget Sound Region Employment
-3%
-2%
-1%
0%
1%
2%
3%
4%
5%
6%
1990
1991
1992
1993
1994
1995
1996
1997
1998
1999
2000
2001
2002
2003
2004
2005
2006
F
2007
F
2008
F
Note: 2006-08 forecasts are from Puget Sound Economic Forecaster. Puget Sound Region is King, Kitsap, Pierce, and Snohomish Counties.
Consumer Price Inflation
Consumer price inflation has risen as oil prices have climbed. The 2001 national recession and the subsequent weak recovery helped to bring U.S. inflation down to its lowest level since the early 1960s. However, after falling to a 1.6% rate during 2002, inflation has risen gradually, reaching 3.4% in 2005 and 3.8% in the first six months of 2006. Much of the rise in inflation is due to the relentless increase in energy prices that began in early 2002 and has yet to abate. Core inflation, which excludes volatile energy and food prices, has largely remained under control despite the rise in energy prices. However, core inflation started to rise early this year and by July had reached 2.7% measured on a year-over-year basis.
The Federal Reserve has been raising short-term interest rates since mid-2004 in order to keep inflation under control. The Fed paused at its August 2006 meeting, holding the Fed Funds rate steady at 5.25%, as it attempts to determine if rates have risen enough to control inflation. The forecasts presented below are based on the assumption that inflation is near its peak and will begin to fall in late 2006 and continue to decline in 2007.
Due to the severity of the local recession, Seattle area inflation, which was higher than national inflation in every year but one between 1990 and 2002, dropped below U.S. inflation beginning in late 2002 and remained lower until mid-2006. Local inflation has now risen back to national levels, largely because the region’s economy has improved. Looking to the future, local economists expect Seattle area inflation to outpace national inflation as the region continues to grow faster than the nation.
Figure 4 presents historical data and forecasts of inflation for the U.S. and Seattle metropolitan area through 2007. The forecasts are for the CPI-W, which measures price changes for urban wage and clerical workers (the CPI-U measures price changes for all urban consumers). The specific growth rate measures shown in Figure 4 are used as the basis of cost-of-living adjustments in City of Seattle wage agreements.

Revenue Overview
2007Adopted and 2008 Endorsed Budget -30-
Figure 4. Consumer Price Index Forecast
U.S. CPI-W (June-June
growth rate)
Seattle CPI-W (June-June
growth rate)
Seattle CPI-W (growth rate for 12
months ending in June) 2004 (actual) 3.2% 2.5% 1.3% 2005 (actual) 2.6% 2.3% 2.3% 2006 (actual) 4.5% 4.6% 3.4% 2007 2.6% 2.9% 3.5%
The first two forecasts in Figure 4 measure the change in consumer prices from June of one year to June of the following year. These changes are for the U.S. and the Seattle metropolitan area, respectively. The third forecast measures the growth rate of the Seattle CPI-W over a one year period ending in June (i.e., July – June). Because the Seattle CPI is published on a bimonthly basis, this growth rate reflects the average rate of inflation for August, October and December of one year and February, April and June of the following year.
City Revenues
The City of Seattle projects total revenues of approximately $2.57 billion in 2007 and $2.69 billion in 2008. As figure 5 shows, approximately 54 percent of these revenues are associated with the City’s utility services, Seattle City Light and Seattle Public Utilities’ Water, Wastewater and Solid Waste divisions. The remaining 46 percent are associated with general government services, such as police and fire, parks and libraries. The following sections describe forecasts for revenue supporting the City’s primary operating subfund, the General Subfund, its primary capital subfund, the Cumulative Reserve Subfund as well as specific revenues supporting the City’s Bridging the Gap Transportation program in the Transportation Fund.
Figure 5. Total City Revenue by Use – 2007 Adopted $2.57 Billion
Seattle City Light - 33.8%
Seattle Public Utilities - 20.1%General Governmental Uses -
46.1%

Revenue Overview
2007Adopted and 2008 Endorsed Budget -31-
General Subfund Revenue Forecasts
Expenses assigned to the General Subfund are supported primarily by taxes. As Figure 6 illustrates, the most significant revenue source is the property tax, which accounts for 27.8%, followed by sales taxes and the Business and Occupation (B&O) tax.
Figure 6. 2006-Revised General Subfund Revenue Forecast by Source - $750.3M
Property Taxes27.8%
Sales Taxes20.4%
B&O Taxes19.2%
Misc.2.7%
Fees & Charges9.3%
Traffic Fines2.3%
Gov't/Private Grants1.2%
Utility Taxes17.2%
Revenue Overview
In 2005, general government revenue into the General Subfund totaled approximately $727.7 million. General Subfund revenue is projected to total $750.9 million in 2006, $785.3 million in 2007, and $806.4 million in 2008. A portion of the growth from 2006 to 2007 is a result of reclassifying revenues to the General Subfund that previously were deposited in other funds.
Figure 7 shows General Subfund actual revenues for 2005, as well as the revised forecast for 2006, and the adopted forecasts for 2007 and 2008. Tax revenues are expected to grow by a robust 6.5% in 2006 and by 3.4% in both 2007 and 2008. The main drivers of these growth rates are the B&O and sales taxes. Revenues from the B&O tax for 2006 are expected to be 10.3% higher than 2005, with growth slowing to 4.7% in 2007. This forecast excludes the effect of changes in state law that could reduce City B&O tax revenues by $20 million in 2008. Sales tax revenues, led by construction, hotels and retail sales, should experience similar patterns with 7% growth in 2006, leveling off only slightly to a rate of 5.5% in 2007.
Other factors contributing to strong tax growth are sizable increases in drainage/wastewater rates charged by Seattle Public Utilities (SPU) to its customers. Because of these rate increases, 2007 tax revenues from the drainage/wastewater fund are forecast to grow by 7.8% over 2006. Natural gas revenues are forecast to continue positive growth due to anticipated increases in gas rates. Parking pay stations have seen strong growth in revenues and this trend is expected to continue. The City will install more pay stations over the next few years, particularly in the South Lake Union area where pay stations are expected to be operational by mid-2007. As a result, City revenue from parking fees will continue to grow.

Revenue Overview
2007Adopted and 2008 Endorsed Budget -32-
Finally, beginning in 2007 certain revenues the City receives from patrons of the Key Arena will be deposited in the General Subfund rather than the Seattle Center Fund. These revenues partially offset Key Arena debt service expenses which become the obligation of the General Subfund in 2007.
The City Council revised forecasts for General Subfund revenues during the budget deliberation process in November. The forecasts were revised up by $619,000 for 2006, $359,000 for 2007, and down by $198,000 for 2008.
The forecast for the B&O tax was increased by $576,000 in 2007 and $595,000 in 2008 to reflect Council action regarding the small business exemption. The Council adopted service charge rates for Seattle City Light which are lower than rates assumed in the Proposed Budget. Lower rates for electricity charges reduce the forecast for utility tax revenue by $1.0 million and $1.1 million in 2007 and 2008 respectively. The Council also adopted lower rates for the Drainage and Wastewater Utility fund culminating in a $76,000 revenue reduction to the General Subfund in 2007 and 2008. There were also changes to central service departments whose budgets are paid for in part by the utilities, Retirement System, and the Department of Planning and Development. These changes included the elimination of programs from Office of Sustainability and Environment and the Personnel Department, which will result in revenue decreases to the General Subfund of $208,000 in both 2007 and 2008.
The City Council revised the forecasts for interest income to reflect greater-than-anticipated earnings in the latter portion of 2006. These revisions include increases of $968,000 in 2006, $313,000 in 2007 and $474,000 in 2008. The forecasts for revenues from Solid Waste Utility taxes were reduced by $300,000 revenue reduction in 2006, 2007 and 2008 to reflect lower-than-anticipated revenue through 2006. Finally, the Council increased by $200,000 in each of 2006, 2007, and 2008 the forecasts for the Leasehold Excise tax to reflect strong performance in 2006.

Revenue Overview
2007Adopted and 2008 Endorsed Budget -33-
Figure 7. General Subfund Revenue, 2005 – 2008∗ (in thousands of dollars)
Revenue Source 2005
Actual2006
Revised 2007
Adopted2008
EndorsedGeneral Property Tax (1) 183,497 187,883 194,918 199,452Property Tax - Medic One Levy 20,109 20,669 21,185 21,856Retail Sales Tax 131,011 140,143 147,805 154,558Retail Sales Tax - Criminal Justice Levy 12,282 13,138 13,856 14,490B&O Tax (90%) (2) 130,471 143,886 150,582 158,932Utilities Business Tax - Telephone (90%) 26,591 26,856 26,035 25,733Utilities Business Tax - City Light (90%) 30,340 31,373 29,617 30,188Utilities Business Tax - SWU & priv.garb. (90%) 8,217 8,790 9,493 10,073Utilities Business Tax - City Water (90%) 12,783 15,473 15,514 16,346Utilities Business Tax - DWU (90%) 18,071 19,757 21,291 22,031Utilities Business Tax - Natural Gas (90%) 12,120 14,296 14,980 14,339Utilities Business Tax - Other Private (90%) 10,639 12,744 11,952 12,231Admission Tax 6,664 7,214 7,201 7,399Other Tax 4,851 4,995 4,995 4,995Total Taxes 607,646 647,216 669,425 692,624Licenses and Permits 15,303 12,979 12,684 12,400Parking Meters/Meter Hoods 15,333 16,586 18,288 19,596Court Fines (90%) 16,255 17,001 16,981 16,261Interest Income 3,200 5,339 4,598 4,051Revenue from Other Public Entities (3) 22,312 8,950 9,728 9,512Service Charges & Reimbursements 41,982 40,298 45,915 46,182All Else 1,208 1,497 1,168 1,253Total: Revenue and Other Financing Sources 723,239 749,866 778,786 801,879Interfund Transfers 4,455 1,037 2,739 937Key Arena Revenues (4) - - 3,743 3,618Total, General Subfund 727,694 750,903 785,269 806,434 NOTES:
(1) Includes property tax levied for the Firemen’s Pension Fund per RCW 41.16.060.
(2) The 2008 Endorsed figures for B&O tax assume that anticipated losses due to House Bill 2030 will be mitigated.
(3) Included in 2005 Actual are the pass-through revenues that are not appropriated in the 2005 Adopted Budget.
(4) New revenues to the General Subfund reflecting the change in debt service obligation for Key Arena from the Seattle Center Fund to the General Subfund.
A detailed listing of City General Subfund revenues is found in the Funds, Subfunds and Other section.
∗ Under the City Charter, 10% of certain revenues are deposited into the Park and Recreation Fund. These revenues are noted by the 90% figures above. This requirement also applies to certain license revenues.

Revenue Overview
2007Adopted and 2008 Endorsed Budget -34-
Figure 8 shows how tax revenue growth outpaced inflation for most of the 1990s and 2000 before the local recession took hold. Slow growth posted in 2001 is also attributable to Initiative 747, which reduced the statutory annual growth limit for property tax revenues from 6.0% to 1.0% beginning in 2002. Economic growth starting in 2004 led to very strong revenue growth in 2005 and 2006, staying well above inflation. Growth is expected to slow over the next biennium, but continue to outpace inflation through 2008.
Figure 8. City of Seattle Tax Revenue Growth, 1990-2008
0%
2%
4%
6%
8%
10%
1990
1991
1992
1993
1994
1995
1996
1997
1998
1999
2000
2001
2002
2003
2004
2005
2006
f20
07f20
08f
City Tax Revenue
Seattle Inf lation
Property Tax
Property tax is levied primarily on real property owned by individuals and businesses. Real property consists of land and permanent structures, such as houses, offices, and other buildings. In addition, property tax is levied on business machinery and equipment. In accordance with the Washington State Constitution and state law, property taxes paid by a property owner are determined by a taxing district’s rate applied to the value of a given property. Figure 9 shows the different jurisdictions whose rates make up the total property tax rate imposed on Seattle property owners. The assessed value (AV) of a property is determined by the King County Assessor and generally reflects 100% of the property’s market value.
In 2006, the total property tax rate from all jurisdictions paid by Seattle property owners is $9.63 per thousand dollars of AV. For an owner of a home with an assessed value of $400,000 (approximately the average AV for residences in Seattle), the 2006 tax obligation is approximately $3,850. The City of Seattle’s total 2006 tax rate is roughly one-third of the total rate at $3.16 -- an annual tax obligation of approximately $1,260 for the average valued home.
Figure 9 illustrates the components of the City’s property tax: the non-voted General Purpose levy (63%); the five voter-approved levies for specific purposes (28%) – known as lid lifts because the voters authorize taxation above the statutory lid or limit; and the levy to pay debt service on voter-approved bonds (9%). There were no proposed property tax measures (lid lifts or bonds) for Seattle in 2005 that added to the property tax in 2006. Voters did approve in November 2006 a transportation lid lift that will generate approximately $36.2 million in 2007. These revenues will be accounted for in the Transportation Fund and are discussed later in this section.
Statutory growth limits and new construction. The annual growth in property tax revenue is restricted by state statute in two ways. First, state law limits growth in the amount of tax revenue a jurisdiction can collect. Beginning in 1973, state law limited the annual growth of the City’s regular levy (i.e., General Purpose plus voted

Revenue Overview
2007Adopted and 2008 Endorsed Budget -35-
lid lifts) to 6%. However, in November 2001, voters statewide approved Initiative 747, which changed the 6% limit to the lesser of 1% or the Implicit Price Deflator, effective for the 2002 collection year. In addition to the 1% revenue growth limit, state law permits the City to increase its regular levy in the current year by an amount equivalent to the previous year’s tax rate times the value of property constructed or remodeled within the last year.
The second limitation in state law caps the maximum tax rate that can be imposed. For the City of Seattle, this cap is $3.60 per $1,000 of assessed value and covers the City’s general purpose levy and lid lifts. The City tax rate has been well below this cap for many years.
The 2007 and 2008 Adopted Budgets implement 1% growth plus new construction. New construction revenues have exceeded $2 million since 1999, with a high of over $5 million in 2002. The forecast for 2007 and 2008 reflects continued strong construction activity. It is projected that approximately $3.8 million is added to the property tax base in both 2007 and 2008 due to new construction.
Additionally, a court settlement led to a multi-jurisdiction refund to Qwest in 2006. The City of Seattle’s General Subfund share of this refund is approximately $1.2 million. State law allows the City to recoup this refund in the following year (2007), but then deducts it from the City’s base levy in the subsequent year (2008).
The forecast for the General Subfund (General Purpose) portion of the City’s property tax is $194.9 million in 2007 and $199.5 million in 2008.
No Change Assumed for Medic 1/Emergency Medical Services Levy. The Medic 1/EMS levy, which generates approximately $20 million annually, is slated for a renewal vote in 2007. County and City officials are working on a proposal to put before the voters, but at this time no firm proposal regarding rates and levy amounts has been made. This forecast assumes that voters approve a new levy to generate the same amount of revenue that the current levy yields, as if the current levy were extended to 2008.

Revenue Overview
2007Adopted and 2008 Endorsed Budget -36-
Figure 9.

Revenue Overview
2007Adopted and 2008 Endorsed Budget -37-
Retail Sales and Use Tax
The retail sales and use tax (sales tax) is imposed on the sale of most goods and certain services in Seattle. The tax is collected from consumers by businesses that, in turn, remit the tax to the state. The state provides the City with its share of these revenues on a monthly basis.
The sales tax rate is 8.8% for most taxable transactions. The rate was increased from 8.6% in April 2001, following approval by King County voters of a proposal to raise the sales tax rate by 0.2% to provide additional funding for transit. County voters approved another increase of 0.1% in the November 2006 general election, which will take effect in mid-2007 and is not reflected in the totals shown below. Revenue from this increase will be used on additional transit services.
The exception to the 8.8% rate is a 9.3% rate that is applied to food and beverages sold in restaurants, taverns, and bars throughout King County. The extra 0.5% was imposed in January 1996 to help pay for the construction of a new professional baseball stadium in Seattle.
The basic sales tax rate of 8.8% is a composite of separate rates for several jurisdictions as shown in Figure 10. The City of Seattle’s portion of the overall rate is 0.85%. In addition, Seattle receives a share of the revenue collected by the King County Criminal Justice Levy.
Figure 10. Sales and Use Tax Rates in Seattle, 2006
Sales tax revenue has grown and contracted with the region’s economy. The robust economy of the late 1990s resulted in very strong growth in taxable retail sales in Seattle. As illustrated in Figure 11, taxable sales growth accelerated rapidly in 1996-1997, driven by a strong economy led by aggressive expansion at Boeing, and surged again in 1999 when the stock market and technology booms reached their peaks. Growth began to slow in 2000, when the stock market bubble burst and technology firms began to falter. The slowdown continued into 2001 and 2002, with growth rates turning sharply negative beginning in early 2001. Year-over-year growth rates were negative for 10 consecutive quarters beginning in first quarter 2001, and revenue growth remained weak through third quarter 2004. Beginning in fourth quarter 2004, taxable sales growth accelerated rapidly, and has averaged a robust 11.7% over the most recent four quarters (2005 Q2 – 2006 Q1), led by construction which increased by 25.4%. Construction has maintained its rapid pace of growth thus far in 2006, but slower growth in other
State of Washington
6.5%
King County 0.15%
Metro 0.8%
City of Seattle 0.85%
Criminal Justice Levy 0.1%
Sound Transit 0.4%
Total Rate = 8.8%
NOTE: Rate is 9.3% for food and beverages sold in restaurants and bars.

Revenue Overview
2007Adopted and 2008 Endorsed Budget -38-
industries and a falloff in non-current revenue have reduced sales tax revenue growth to 8.3% for the first six months of the year.
Figure 11. Quarterly Taxable Retail Sales: Year-Over-Year Growth
-8%
-4%
0%
4%
8%
12%19
96 Q
1
1997
Q1
1998
Q1
1999
Q1
2000
Q1
2001
Q1
2002
Q1
2003
Q1
2004
Q1
2005
Q1
2006
Q1
Retail sales tax revenue is forecast to increase by 7.0% in 2006 and then grow more slowly in 2007-08. The forecast of sales tax revenue reflects the expectation that the national and regional economies will grow more slowly in the second half of 2006 and in 2007-2008. Sales tax revenue is expected to increase by 7.0% in 2006, then drop to 5.5% and 4.6% in 2007 and 2008, respectively.
Business and Occupation Tax
The Business and Occupation (B&O) tax is levied by the City on the gross receipts of most business activity occurring in Seattle. Under some conditions, gross receipts of Seattle businesses are excluded from the tax if the receipts are earned from providing products or services outside of Seattle.
The City levies the B&O tax at different rates on different types of business activity, as indicated in Figure 13 at the end of this section. Most business activity, including manufacturing, retailing, wholesaling, and printing and publishing, is subject to a tax of 0.215% on gross receipts. Activities taxed at the 0.415% rate include services and transporting freight for hire. Included in the forecast of B&O tax revenue are projections of tax refund and audit payments and estimates of tax penalty and interest payments for past-due tax obligations.
Other things being equal, the B&O tax base is more stable than the retail sales tax base. The B&O base is broader than the sales tax base, is less reliant on the construction and retail trade sectors, and is more dependent upon the service sector (most services are not subject to the sales tax).
After rising strongly in the second half of the 1990s, B&O revenue growth stalled from 2001 to 2004. Beginning in 1995, the City made a concerted effort to administer the B&O tax more efficiently, educate taxpayers, and enforce tax regulations. As a result of these efforts, unlicensed businesses were added to the tax rolls, businesses began reporting their taxable income more accurately, and audit and delinquency collections increased significantly – all of which resulted in very strong B&O revenue growth during the period 1995-1997. Growth slowed somewhat in 1998, as these efforts began to yield diminishing returns once the most obvious and productive techniques for identifying unlicensed or under-reporting businesses had been put into practice. In 2000, B&O revenue was boosted by changes the State of Washington made in the way it taxes financial institutions. These changes affected the local tax liabilities of financial institutions.

Revenue Overview
2007Adopted and 2008 Endorsed Budget -39-
When the region’s economy slipped into recession in early 2001, B&O revenue growth slowed abruptly (see Figure 12). Revenue from current year tax obligations declined by 2.5% in 2001 and 2.1% in 2002. However, in both years the declines were more than offset by large gains in non-current revenue, which includes revenue from audits and other enforcement activity, refunds, and penalty and interest payments. As a result, both 2001 and 2002 saw very small increases in B&O receipts. The strong growth in non-current revenue reversed in 2003 and 2004, but overall revenue growth remained positive because revenue from current tax year obligations increased by 4.0% in 2003 and 5.4% in 2004. Following four years growth below 2%, in 2005 revenue growth jumped to 12.0%, led by growth in construction, services, finance, insurance, and real estate.
Figure 12. Annual Growth of B&O Tax Revenue
-2%
0%
2%
4%
6%
8%
10%
12%
1990
*
1991
*
1992
1993
1994
1995
1996
1997
1998
1999
2000
2001
2002
2003
2004
2005
2006
F
2007
F
2008
F
B&O Revenue
Seattle CPI
*1990 and 1991 figures have been adjusted to remove the effects of tax rate increases. Note: Revenue figures reflect current accrual methods; 2006-08 are forecasts.
B&O revenue is forecast to grow strongly in 2006, then slow to a moderate pace in 2007 and 2008. B&O revenue is forecast to post a strong 10.3% gain in 2006, due to a healthy economy and an unusually large increase in penalty and interest payments during the first half of the year. Growth is expected to drop to 4.7% in 2007 as the economy slows and penalty and interest payments return to normal levels. A modest rebound to 5.5% growth is forecast for 2008.
The forecast for 2008 does not incorporate any loss of revenue due to Section 13 of the State of Washington’s House Bill 2030, subsequently codified as RCW 35.102.130, which becomes effective on January 1, 2008. It is assumed that any loss from the implementation of Section 13 of HB 2030 is fully mitigated.
The B&O revenue forecast incorporates revisions the City Council made to the Executive’s B&O forecast in November 2002 and November 2004 to provide additional funding for auditing.

Revenue Overview
2007Adopted and 2008 Endorsed Budget -40-
Utility Business Tax - Private Utilities The City levies a tax on the gross income derived from sales of utility services by privately owned utilities within Seattle. These services include telephone, steam, cable communications, natural gas, and refuse collection for businesses.
Natural gas utility tax forecast is revised upward. The City levies a 6% utility business tax on gross sales of natural gas. The bulk of revenue from this tax is received from Puget Sound Energy (PSE). PSE’s natural gas rates are approved by the Washington Utilities and Transportation Commission.
While natural gas prices were fairly stable for 2004 and the early part of 2005, PSE was granted permission to increase their rates effective October 1, 2005 to mitigate the impact of significant wholesale price increases in the spring and summer of 2005. However, PSE’s request for rate increases was made prior to the major hurricanes in the Gulf of Mexico that severely affected the natural gas market. PSE is expected to request another set of rate increases to mitigate the impact of the hurricane-related price spikes which occurred in the late summer and early fall of 2005. This request would be in addition to another PSE request made in February of 2006 to recover higher delivery costs. Together, these rate requests should raise natural gas rates by roughly 10% in January 2007. Revenue forecasts for City utility tax in 2007 and 2008 reflect these rate increases.
Telephone utility tax forecast is overshadowed by federal legislation. The utility business tax is levied on the gross income of telecommunication firms at a rate of 6%. After extraordinary growth over several consecutive years in the late 1990s, telecommunication tax revenue growth halted completely in 2002, and began declining in the fourth quarter of that year. A variety of forces – the lackluster economy, industry restructuring, and heightened competition – all served to force prices downward and reduce gross revenues. Additionally, recent technological changes, particularly Voice-over Internet Protocol (VoIP), which enables local and long-distance calling through broadband Internet connections, contribute to the uncertainties in this revenue stream.
The technological risks are magnified due to a strong interest by U.S. legislators to keep access to Internet connections and many forms of Internet communication free from regulation and taxation. Current federal legislation, which expires in November 2007, permits state and local jurisdictions like Seattle to levy taxes on internet access if the tax existed prior to October 1998.
Although the economic outlook is currently optimistic, revenue from telecommunication utility taxes are not expected to increase through 2008. There are two principle reasons for a modest forecast. First, wireless services (tax revenue from which have grown dramatically) have shown little growth since their heyday in the late 1990s. Second, providers of broadband internet and telecommunications services are gaining market share from traditional network providers, and the ability of the City to levy its telecommunication tax is being disputed in court. Adverse legal findings may result in a reduction of the City’s tax base as broadband telecommunication providers continue to grow.
Cable revenue tax growth should be stable. The City has franchise agreements with cable television companies operating in Seattle. Under the current agreements, the City levies a 10% utility tax on the gross subscriber revenues of cable TV operators, which accounts for about 90% of the operators’ total revenue. The City also collects B&O taxes on miscellaneous revenues not subject to the utility tax. The imposition of a 4.2% franchise fee makes funds available for cable-related public access purposes. This franchise fee, which does not go to the General Subfund, increased from 3.5% in June 2006.
There have been ongoing efforts in Congress to limit the authority local governments have over cable franchising. Current bills before the House and Senate do not necessarily alter a city’s ability to impose a utility tax, but would limit the revenue base to which franchise fees are applied.
Cable revenues have been growing and are expected to continue to do so through 2008. Revenues for 2006 have been augmented by a late payment from 2005, yielding a total of $11.6 million. The forecasts for 2007 and 2008 are $10.9 and $11.2 million respectively. Amid growing competition from satellite TV, the cable industry has increased its services, including additional channels, pay-per-view options, and digital reception in order to remain competitive.

Revenue Overview
2007Adopted and 2008 Endorsed Budget -41-
Utility Business Tax - Public Utilities
The City levies a tax on most revenue collected by City-owned utilities (Seattle City Light and Seattle Public Utilities). In 2004, tax rates were 6.0% for electricity and 10.0% for the other public utility services (see Figure 13). Tax rate increases on various public utilities were passed by the Council in November 2004. These rate increases led to sizable increases in revenues to the General Subfund. As of now there are no planned tax rate increases, therefore the revenues from the utilities are projected to remain fairly stable with the exception of those utilities with changes in rate structure.
Less tax revenue from City Light due to rate proposal. Following the west coast energy crisis of 2000, City Light was granted the right to charge significantly higher rates to customers to make up for the severe shortfall in cash flow that affected the utility at the time. The Council reduced City Light rates in the fall of 2006 for 2007 and 2008. Lower rates result in a nearly $2 million decline in utility tax revenue for 2007, with modest growth in 2008.
Modest growth from water tax revenue. The utility tax rate on water service increased to 14.04% in January 2005, and 15.54% on May 15, 2005. As a result, water tax revenues rose sharply in 2005. Revenues are expected to grow modestly between 2006 and 2008.
Higher Drainage and Wastewater rates mean higher tax revenue growth. Effective January 2005, the utility tax rate increased to 12.0% for wastewater service and 11.5% for drainage service. Largely as a result of these tax rate increases, revenue from drainage and wastewater service increased dramatically in 2005. The drainage and wastewater utility is expected to implement increased rates for 2007 resulting in a tax revenue increase of 7.8% over 2006.
Higher Solid Waste rates mean higher tax revenue growth. The utility tax rate on both City of Seattle and commercial solid waste service increased to 11.5% on April 1, 2005. Largely as a result of these tax rate increases, revenue from solid waste service increased in 2005. Increases in commercial collection rates result in an increase in tax collection of 8.8% for 2007 compared to 2006, even though total revenue projections have been revised downward by $300 thousand for all three years.
Admission Tax
The City imposes a 5% tax on admission charges to most Seattle entertainment events, the maximum allowed by state statute. This revenue source is highly sensitive to unanticipated swings in attendance at athletic events. It is also dependent on economic conditions, as people’s ability and desire to spend money on entertainment is influenced by the general prosperity in the region.
By City ordinance, 20% of admissions tax revenues, excluding men’s professional basketball, are dedicated to programs supported by the Office of Arts and Cultural Affairs. This set-aside had been reduced to 10% for 2003 and 2004 and 15% for 2005 in response to the recession. The forecasts in Figure 7 for admission taxes reflect the full amount of tax revenue. The Office of Arts and Cultural Affairs budget provides detail on the Office’s use of Arts Account revenue from the admission tax.
Licenses and Permits
The City requires individuals and companies conducting business in Seattle to obtain a City business license. In addition, some business activities, such as taxi cabs and security systems, require additional licenses referred to as professional and occupational licenses. The City also assesses fees for public-safety purposes (e.g., pet ownership and fire hazard inspection) and charges a variety of fees for the use of public facilities and rights-of-way.
The City instituted a two-tier business license fee structure beginning with licenses for 2005. The cost of a license, which had been $80 per year for all businesses, was raised to $90 for businesses with worldwide revenues

Revenue Overview
2007Adopted and 2008 Endorsed Budget -42-
of more than $20,000 per year and lowered to $45 for businesses with worldwide revenues less than $20,000 per year. The shift to the two-tier structure was expected to result in a small decline in revenue, of approximately $90,000 per year.
The transition to the two-tier business license, which occurred in late 2004, caused a delay in the mailing of license renewals for 2005. As a result, business license fee revenue fell 14.9% short of forecast in 2004 as payments that would normally have been received in 2004 slipped into 2005, boosting 2005 revenue.
As part of the City's Bridging the Gap transportation funding initiative, effective July 1, 2007 the Commercial Parking License fee paid by commercial parking operators is reduced from $90 per 1,000 square feet of floor space to $6 per 1,000 square feet. As a result of this change, license revenues decline by $760,000 in 2007 and $1.025 million in 2008.
Parking Meters/Meter Hoods
In spring 2004, the City of Seattle began removing traditional parking meters and replacing them with pay stations in various areas throughout the city. Pay stations are parking payment devices offering the public a more convenient array of payment options, including credit cards and debit cards, to pay for hourly street parking. Along with this switch, the City increased parking rates from $1 to $1.50 per hour. Finally, as part of the pay station program, Seattle Department of Transportation (SDOT) increased the total number of parking spaces in the street right-of-way which are subject to fees.
In 2007 SDOT plans to extend pay station control over 2,160 previously non-paid spaces in the South Lake Union area. Under an experimental approach, the rates for these spaces will vary as frequently as quarterly to achieve a desired occupancy rate for the area. Revenues for this area are estimated to be approximately $710,000 in 2007 and $1.5 million in 2008. Total parking revenues are anticipated to be $17.3 million in 2007 and $18.6 million in 2008. More information about the pay station technology program is provided in the SDOT section of this document.
Meter Hood Service revenues are anticipated to remain stable at approximately $1.0 million in both 2007 and 2008.
Court Fines
Historically, between 70% and 85% of fine and forfeiture revenues collected by the Seattle Municipal Court are from parking citations and fines resulting from enforcement efforts by Seattle Police Department parking enforcement and traffic officers. An additional 8% to 10% comes from traffic tickets. Overall trends indicate decreases in citation volume in the 2006 through 2008 forecast period. This is in part due to enforcement and compliance changes stemming from the parking pay station technology. Despite this trend, revenues are anticipated to increase in 2006 to $17.0 million from $16.3 million in 2005, due to increased collections revenues and administrative changes in the Municipal Court related to filing unpaid citation information with the State Department of Licensing.
The downward trend in parking citations are offset in part beginning later in 2007 when, as part of the South Lake Union parking pay station extension (described above in the Parking Meter section), three additional Parking Enforcement Officers are added. In 2007 the City anticipates receiving $17.0 million in court fines and forfeitures and $16.3 million in 2008.
Interest Income
Through investment of the City’s cash pool in accordance with state law and the City’s own financial policies, the General Subfund receives interest earnings on cash balances attributable to several of the City’s funds or subfunds that are affiliated with general government activities. Many other City funds are independent, retaining their own

Revenue Overview
2007Adopted and 2008 Endorsed Budget -43-
interest earnings. Interest income to the General Subfund varies widely, subject to significant fluctuations in cash balances and changes in interest rates dictated by economic and financial market conditions.
Positive growth in interest rates combined with improved cash balances through 2005 and 2006 resulted in increased interest earnings over this period: $1.9 million in 2004, $3.2 million in 2005, and an estimated $5.3 million in 2006. Current estimates for General Subfund interest earnings anticipate lower cash balances but slightly higher interest rates in 2007, producing earnings of $4.6 million. In 2008, cash balances are anticipated to decline further along with marginal decreases in interest rates, producing interest earnings of $4.0 million.
Revenue from Other Public Entities
Washington state shares revenues with Seattle. The State of Washington distributes a portion of tax and fee revenue directly to cities. Specifically, portions of revenues from the State General Fund, liquor receipts (both profits and excise taxes), and motor vehicle fuel excise taxes are allocated directly to cities. Revenues from motor fuel excise taxes are dedicated to street maintenance expenditures and are deposited into the City’s Transportation Fund. Revenues from the other taxes are deposited into the City’s General Subfund.
Little Change in Criminal Justice revenues. The City receives funding from the state for criminal justice programs. The state provides these distributions out of its general fund. These revenues are allocated on the basis of population and crime rates relative to statewide averages. The City should receive approximately $2.3 million in 2007 and 2008.
Liquor Board profits and excise tax revenue declining. The City’s share of Liquor Board profits increased dramatically from $3.1 million in 2002 to $4.1 million in 2004. There were $4.1 million in revenues for 2005 as well. 2006 revenues have been revised downwards to $3.6 million. This drop is the result of new initiatives and programs the Liquor Board has undertaken in the aim of increasing revenues, decreasing costs and therefore increasing profits later on. Some of these benefits are anticipated to be seen in Liquor Board revenues beginning in 2007, with a forecast of $3.8 million. Liquor excise taxes, which are levied on the sale of liquor, have been growing consistently and this trend is expected to continue. The 2007 and 2008 forecasts for the liquor excise taxes are $2.45 million and $2.50 million respectively.
City General Subfund receives additional resources from Sound Transit. The construction of Link Light Rail by Sound Transit will continue to require City services. Sound Transit reimburses the City for these additional services. The General Subfund will receive money in both 2007 and 2008 for police and fire support services. City revenues will decline in 2008 as the work on the Metro Tunnel nears completion. Revenue from Sound Transit for these services is expected to be $1.1 million in 2007 and $237,000 in 2008.
Service Charges and Reimbursements
Internal service charges reflect current administrative structure. In 1993, the City Council adopted a resolution directing the City to allocate a portion of central service expenses of the General Subfund to City utilities and certain other departments not supported by the General Subfund. The intent of this allocation is to allocate a fair share of the costs of centralized general government services to the budgets of departments supported by revenues that are largely self-determined. These allocations are executed in the form of payments to the General Subfund from these independently supported departments.
Central Service departments have seen their budgets change significantly for the 2007-2008 biennium due to a large increase in the allocation of space rent charges from the Fleets and Facilities Department. This increase has led to increases in central service allocations charged to the revenue-generating funds, and therefore significantly higher revenues from internal service charges to the General Subfund. More details about these cost allocations and methods are in the back of the budget book under the cost allocation tab.

Revenue Overview
2007Adopted and 2008 Endorsed Budget -44-
Interfund Transfers
Interfund transfers increase significantly. Interfund transfers are payments from the balances of department-specific funds and capital project funds to the General Subfund. For 2006, the Parks Department will transfer $155,000 to the General Subfund because of larger-than-forecasted charter revenues. In 2007 approximately $1.1 million of fund balance from the Department of Information Technology (DoIT) is transferred to the General Subfund in order for the Department of Executive Administration (DEA) to develop a cash receipting system and an employee self-service module, both of which are described in more detail in DEA’s section of the budget.
A detailed list of these transfers is included in the General Subfund revenue table found in the Funds, Subfunds, and Other section. In ratifying the 2007 Adopted Budget, it is the intent of the Council and Mayor to authorize the transfer of unencumbered, unreserved fund balances from the funds listed in the General Subfund revenue table to the General Subfund.
Cumulative Reserve Subfund – Real Estate Excise Tax
The Cumulative Reserve Subfund resources are used primarily for the maintenance and development of City capital facilities. These purposes are supported mainly by revenues from the Real Estate Excise Tax (REET), but also, to a lesser degree, by the proceeds from certain property sales and rents, a portion of street vacation revenues, General Subfund transfers, and interest earnings on subfund balances. Total revenues to the subfund are projected at approximately $52.8 million in 2007 and $54.7 million in 2008. Of these total amounts approximately $4.3 million in 2007 and $4.4 million in 2008 are derived from non-Real Estate Excise Tax sources.
The REET is levied by the City at a rate of 0.5% on sales of real estate measured by the full selling price. Because the tax is levied on transactions, the amount of revenue that the City receives from REET is determined by both the volume and value of transactions.
Over time, 60.6% of the City’s REET tax base has come from the sale of residential properties, which include single-family homes, duplexes, and triplexes. Commercial sales, which include apartments with four units or more, account for a quarter of the tax base, and condominiums constitute the remaining 13.8% (see Figure 14).
Figure 14. Value of Seattle Real Estate Transactions by Property Type, 1982 - 2005
Commercial, 25.6%
Condominium, 13.8%
Residential, 60.6%

Revenue Overview
2007Adopted and 2008 Endorsed Budget -45-
Historically REET revenue growth has been both strong and volatile. The value of Seattle real estate transactions (the REET tax base) increased at an average annual rate of 11.5% between 1982 and 2005, a period when Seattle area inflation averaged only 3.2% per year. Growth has been particularly strong during the past four years as the housing market has boomed in response to very low interest rates and the recent upturn in the region’s economy. In addition, 2004 and 2005 were exceptional years for commercial real estate activity.
The volatility of REET is reflected by the fact that despite an 11.5% annual growth rate, the REET tax base declined in six years out of 23 during the period 1982 – 2005 (see Figure 15). The most recent decline was a drop of 15.6% in 2001. Volatility results largely from changes in sales volumes, which are sensitive to shifts in economic conditions and movements in interest rates; average prices tend to be more stable over time. Commercial activity is more volatile than residential, in part because the sale of a handful of expensive properties can result in significant swings in the value of commercial sales from one year to the next. REET revenue is forecast to fall in 2007. The real estate market is beginning to slow both nationally and locally, with the nation leading and the Puget Sound area lagging behind. Nationally, housing starts and home sales are down significantly from a year ago, the inventory of unsold homes is expanding, and in recent months sales prices for homes have been growing at less than the rate of inflation. Locally, home prices are still increasing at double digit rates, but sales volumes have been declining in recent months and the inventory of active listings is beginning to increase. Given how quickly the national real estate market has cooled and the fact that the region’s economy has begun to slow, the local real estate market is expected to continue to cool. The forecast expects REET revenue to peak in 2006, decline by 5.5% in 2007, and then grow slowly in 2008. The downturn in 2007 will be led by an anticipated drop in commercial activity and a modest decline in the value of condominium sales.
Figure 15. Real Estate Excise Tax: Value of Sales
0
2,000
4,000
6,000
8,000
10,000
1982
1984
1986
1988
1990
1992
1994
1996
1998
2000
2002
2004
2006
F
2008
F
Mill
ions
of d
olla
rs
Condominium
Residential
Commercial
Transportation Fund -- Bridging the Gap revenue sources The Transportation Fund is the primary operating fund whose resources support the management, maintenance and the design and construction of the City’s transportation infrastructure. The fund receives revenues from a variety of sources: General Subfund transfers, distributions from the State’s Motor Vehicle Fuel tax, State and

Revenue Overview
2007Adopted and 2008 Endorsed Budget -46-
Federal Grants, service charges, use fees, and several other revenue sources more fully presented in the Transportation Department section of this budget document. The Transportation Fund is projected to receive approximately $176.0 million in operating revenues in 2006, $196.7 million in 2007 and $323.1 million in 2008. The large increases are due to the addition of three new revenue sources, described below, and projected increases in federal, state and interlocal grants. These grant opportunities are made possible because of the additional revenues available to provide matching support for the grants. In September 2006, in order to fund the 20-year “Bridging the Gap” program of transportation maintenance and improvements, the City established three additional revenue sources dedicated to these purposes: a levy lid lift (Ordinance 122232), a commercial parking tax (Ordinance 122192) and a business transportation tax (Ordinance 122191) The transportation lid lift is a 9 year levy authorized under RCW 84.55.050 to be collected from 2007 through 2015. The lid lift is forecast to raise $36.2 million in 2007 and $38.6 million in 2008. The commercial parking tax is a tax on the act or privilege of parking a motor vehicle in a commercial parking lot within the City that is operated by a commercial parking business. Effective July 1, 2007 the tax rate is initially established at 5 percent. The rate will increase annually on July 1 to 7.5 percent in 2008 and 10 percent in 2009. Current forecast anticipates $3.7 million in 2007 (partial year effective July 1, 2007) and $8.9 million in 2008. The business transportation tax or employee hours tax is a tax levied and collected from every person for the act or privilege of engaging in business activities within the City of Seattle. The amount of the tax can be calculated using hours worked or on a full time equivalent employee basis. The tax rate per hour is $0.01302, which is equivalent to $25 per full time employee working at least 1,920 hours annually. Several exemptions and deductions were provided in the authorizing ordinance. Most notably a deduction is offered for those employees who regularly commute to work by some other means other than driving a motor vehicle alone. This tax is effective July 1, 2007, but the City will not receive tax payments for 2007 liabilities until January 2008. Thus, no revenues are forecast in 2007 and $5.5 million in 2008.

Revenue Overview
2007Adopted and 2008 Endorsed Budget -47-
Figure 13. Seattle City Tax Rates
2003 2004 2005 2006 Property Taxes (Dollars per $1,000 of Assessed Value) General Property Tax $2.20 $2.16 $2.12 $2.01 Families & Education 0.04 0.04 0.19 0.18 Seattle Center/Parks Comm. Ctr. 0.10 0.10 0.02 0.02 Parks and Open Space 0.31 0.30 0.30 0.28 Low Income Housing 0.05 0.04 0.04 0.04 Fire Facilities 0.00 0.30 0.28 0.26 Emergency Medical Services 0.24 0.24 0.23 0.22 Low Income Housing (Special Levy) 0.11 0.10 0.10 0.28 City Excess GO Bond 0.36 0.31 0.31 0.28 Retail Sales and Use Tax 0.85% 0.85% 0.85% 0.85% Business and Occupation Tax Retail/Wholesale 0.2150% 0.2150% 0.2150% 0.2150% Manufacturing/Extracting 0.2150% 0.2150% 0.2150% 0.2150% Printing/Publishing 0.2150% 0.2150% 0.2150% 0.2150% Service, other 0.4150% 0.4150% 0.4150% 0.4150% City of Seattle Public Utility Business Taxes City Light 6.00% 6.00% 6.00% 6.00% City Water 10.00% 10.00% 14.04-15.54%* 15.54% City Drainage 10.00% 10.00% 11.50% 11.50% City Wastewater 10.00% 10.00% 12.00% 12.00% City Solid Waste 10.00% 10.00% 10-11.50%** 11.50% City of Seattle Private Utility B&O Tax Rates Cable Communications (not franchise fee) 10.0% 10.0% 10.0% 10.0% Telephone 6.0% 6.0% 6.0% 6.0% Natural Gas 6.0% 6.0% 6.0% 6.0% Steam 6.0% 6.0% 6.0% 6.0% Commercial Solid Waste 10.0% 10.0% 10-11.5%** 11.5% Franchise Fees Cable Franchise Fee 2.5% 2.5% 2.5% 3.5-4.2%*** Admission and Gambling Taxes Admissions tax 5.0% 5.0% 5.0% 5.0% Amusement Games (less prizes) 2.0% 2.0% 2.0% 2.0% Bingo (less prizes) 10.0% 10.0% 10.0% 10.0% Punchcards/Pulltabs 5.0% 5.0% 5.0% 5.0% *The 15.54% rate was effective May 15, 2005 **The 11.5% rate was effective April 1, 2005 ***The 4.2% rate was effective June 3, 2006
