nordic heritage museum - web6.seattle.gov
TRANSCRIPT

- 1 -
TECHNICAL MEMORANDUM Project: Nordic Heritage Museum
Subject: Attendance, Trip Generation, and Parking Demand
Date: September 23, 2015
Author: Marni Heffron, P.E., P.T.O.E. Julie A. Bussing
This memorandum presents trip generation and parking demand estimates for the proposed Nordic Heritage Museum, which will be relocated to a new building on NW Market Street between 26th and 28th Avenues NW. These estimates are based on information about attendance and activities held at the existing Nordic Heritage Museum, which is currently located at 3014 NW 67th Street. The sections below present existing attendance and activity information for the museum, and then describe how they would change at the proposed facilities. Trip generation and parking demand are estimated for an average day, a peak season day, and a peak event day.
1. Existing Museum Information
1.1. Existing Attendance
The Nordic Heritage Museum offers three different types of activities: general admission, tour groups, and events/rentals. Attendance data for all activities for the existing museum were obtained for 2014.
General Admission and Tours
The museum is open Tuesday through Sunday for general admission and tour groups. The museum’s hours are 10:00 A.M. to 4:00 P.M. on Tuesday through Saturday, and 12:00 P.M. to 4:00 P.M. on Sunday. The first Thursday of each month is free all day for visitors. Monthly attendance data for general admission and tours were compiled and are shown on Figure 1. In 2014, the museum’s general admission attendance was 10,987 people. These data show that the highest attendance for both activities occurred during August. August was also the highest month of attendance for general admission. The highest attendance for tours occurred between November and June.

Nordic Heritage Museum Attendance, Trip Generation, and Parking Demand
- 2 - September 23, 2015
Figure 1. Nordic Heritage Museum General Admission and Tours by Month - 2014
Source: Nordic Heritage Museum. Compiled by Heffron Transportation, Inc., May 2015
The average monthly attendance in October was 1,073 persons, which is very close to the average monthly attendance for all of 2014 (1,076 attendees). Additional data were obtained for October to show how attendance fluctuates by day of week (see Figure 2). As shown, the average weekday attendance (28) is lower than on the weekend days (76 on Saturday). During the month of October there were four tour groups with an average attendance of 32 persons per tour.

Nordic Heritage Museum Attendance, Trip Generation, and Parking Demand
- 3 - September 23, 2015
Figure 2. General Admission and Tours
Source: Nordic Heritage Museum. Compiled by Heffron Transportation, Inc., May 2015.
Museum Events
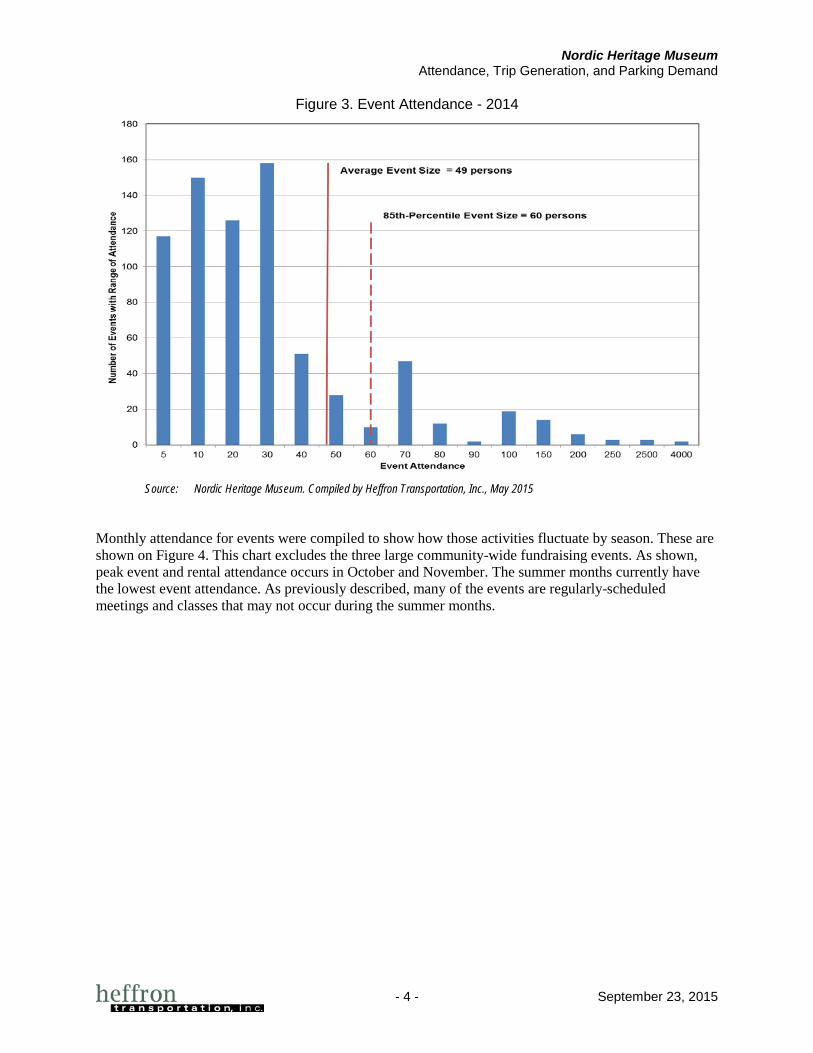
There were a total of 749 events, which includes both museum events and rental events, in 2014. Museum-sponsored events included lectures, training workshops, language classes, craft school, and other adult and children’s programs. Rentals to other groups comprised approximately 20% of the activities. Figure 3 shows the number of events with a range of attendance. The average size event had an attendance of 49 people, while the 85th-percential event had 60 attendees. Most of the events that had an attendance of 60 persons or less included regularly scheduled events such as craft school, language classes, children’s programs, and museum-related meetings. The events with attendance greater than 60 persons were usually one time happenings or annual events. In 2014, the Museum hosted three large fundraising events that have become community traditions. These events are the 17th of May, Viking Days (in August), and Yulefest (in November). Both Viking Days and Yulefest are held for two consecutive days. These annual community events had an attendance between 2,000 to 4,000 people per day.
Nordic Heritage Museum Attendance, Trip Generation, and Parking Demand
- 4 - September 23, 2015
Figure 3. Event Attendance - 2014
Source: Nordic Heritage Museum. Compiled by Heffron Transportation, Inc., May 2015
Monthly attendance for events were compiled to show how those activities fluctuate by season. These are shown on Figure 4. This chart excludes the three large community-wide fundraising events. As shown, peak event and rental attendance occurs in October and November. The summer months currently have the lowest event attendance. As previously described, many of the events are regularly-scheduled meetings and classes that may not occur during the summer months.

Nordic Heritage Museum Attendance, Trip Generation, and Parking Demand
- 5 - September 23, 2015
Figure 4. Event Attendance by Month for 2014 (Not Including Fundraiser Events)
Source: Nordic Heritage Museum. Compiled by Heffron Transportation, Inc., May 2015
Further analysis was performed for events and rentals that occurred in October 2014 to better understand their schedule by day of week and time of day. As shown on Figure 5, daily event and rental attendance ranged from zero to 266 people per day. Tuesdays and Thursdays are typically the highest days followed by Sunday due to the facility being rented by church groups. The October events were further evaluated to determine start and end times on weekdays, which are shown on Figure 6. Most weekday events start after 6:00 P.M. or occur during midday time periods. During the course of the month, four out of 57 events started or ended during the afternoon commuter peak period. Three of the four events had fewer between 8 and 15 attendees. One of the events was the annual Volunteer Appreciation Dinner for 110 people.

Nordic Heritage Museum Attendance, Trip Generation, and Parking Demand
- 6 - September 23, 2015
Figure 5. Event Attendance – October 2014
Source: Nordic Heritage Museum. Compiled by Heffron Transportation, Inc., May 2015
Figure 6. Event by Start and End Time – October 2014
Source: Nordic Heritage Museum. Compiled by Heffron Transportation, Inc., May 2015

Nordic Heritage Museum Attendance, Trip Generation, and Parking Demand
- 7 - September 23, 2015
1.2. Vehicle Occupancy
Information related to vehicle occupancy was obtained from Museum staff. General attendance generally occurs in groups of two people; however, some arrive alone. To be conservative, the vehicle occupancy for general admission is assumed to be 1.5 persons per vehicle. There were a total of 77 tours in 2014 with an average of five tours per month. The mode split for transportation to the tours was 43% by car, 38% by private bus, and 19% by Metro and walking. To be conservative, it was assumed that all attendees arrived by car with an occupancy of 4.0 persons per vehicle. Vehicle occupancy for events is based on data for a variety of land uses in Institute of Transportation Engineers (ITE) Parking Generation.1 Rates that relate parked vehicles to number of seats or attendees range from 2.2 attendees per vehicle for a church to 2.6 attendees per vehicle for a live theater. For events at the Nordic Heritage Museum, an average vehicle occupancy of 2.4 persons per vehicle was assumed. Staff were assumed to have a vehicle occupancy of 1.2 persons per vehicle.
1.3. Existing Parking Demand
Detailed analysis was performed for all Tuesdays in October 2014 to determine the number of attendees who would be on the site simultaneously as part of the three types of activities. Vehicle occupancy rates for each group were then applied to derive the cumulative parking demand by time of day. As previously described, October was an average month for general admission attendance and the highest month for event and rental use. Figure 7 shows the attendance and parking demand for the average Tuesday in October; Figure 8 shows the peak Tuesday in October. For both conditions, the peak parking demand occurred mid-morning. On an average day, the peak parking demand was 61 vehicles, and on the peak day it was 91 vehicles. It is noted that during the peak Tuesday in October there were six events at the museum, and three that occurred simultaneously: the Soup and Cinema adult program (76 attendees) and a Norwegian language class (62 attendees), and a children’s storytelling (21 attendees).
1 4th Edition, 2010.

Nordic Heritage Museum Attendance, Trip Generation, and Parking Demand
- 8 - September 23, 2015
Figure 7. Existing Attendance and Parking Demand by Time of Day Average Tuesday in October 2014
Source: Nordic Heritage Museum. Compiled by Heffron Transportation, Inc., June 2015
Figure 8. Attendance and Parking Demand by Time of Day Peak Tuesday in October 2014
Source: Nordic Heritage Museum. Compiled by Heffron Transportation, Inc., June 2015

Nordic Heritage Museum Attendance, Trip Generation, and Parking Demand
- 9 - September 23, 2015
1.4. Existing Trip Generation
Traffic analysis is typically performed for the weekday morning and afternoon commuter peak hours, which in Seattle occur from 7:00 A.M. to 9:00 A.M. and from 4:00 P.M. to 6:00 P.M., respectively. Since the museum is only open from 10:00 A.M. to 4:00 P.M. on weekdays, it generates little to no traffic during the AM peak hour. In the afternoon, there are very few general admission, tour attendees, and staff on the site after 3:00 P.M., and zero after 5:00 P.M. Therefore, attendees who arrive at evening events between 5:00 P.M. and 6:00 P.M. would represent the highest volume during the PM peak hour. Based on the attendance data for all events in 2014 (see Figure 3), the 85th-percentile event had 60 people. If that event were to start at 6:30 P.M., then an estimated 30% of the attendees could arrive during the PM peak hour. The average and 85th-percentile attendance was derived for all of the types of activities. Daily trips were then derived using the vehicle occupancy values previously described, and assuming that each vehicle would make two trips to the site (one trip to arrive and other to depart). Peak hour trips were then based on the schedules described above. Table 1 summarizes the average and 85th-percentile trip generation for the existing Nordic Heritage Museum. The current museum generates 122 trips per day with 6 trips arriving at the site during the PM peak hour. On the 85th-percentile day, the site generates 178 trips with 8 during the PM peak hour.
Table 1. Trip Generation for Existing Nordic Heritage Museum - 2014
Vehicle PM Peak Hour Trips (5:00 to 6:00 P.M.)
Type of Activity Occupancy # of People Daily Trips a In Out Total
Average Day
General Admission 1.5 37 50 0 0 0
Tours 4.0 27 14 0 0 0
Events and Rentals b 2.4 49 42 6 0 6
Staff 1.2 10 16 0 0 0
Total 122 6 0 6
85th-Percentile Day
General Admission 1.5 57 76 0 0 0
Tours 4.0 37 18 0 0 0
Events and Rentals b 2.4 60 50 8 0 8
Staff 1.2 20 34 0 0 0
Total 178 8 0 8 Source: Nordic Heritage Museum. Compiled by Heffron Transportation, Inc., June 2015. a. Assumes two trips per vehicle (one trip enter and one trip exit). b. Assumes that 30% of evening event attendees arrive during the PM peak hour.

Nordic Heritage Museum Attendance, Trip Generation, and Parking Demand
- 10 - September 23, 2015
2. Proposed Nordic Heritage Museum
The proposed museum will be located on NW Market Street between 26th and 28th Avenues NW. The new space includes enhanced exhibit space as well as a multi-purpose auditorium that could be set in a theater or banquet configuration. Based on discussions with museum staff and the project design team, the new facility is being designed to accommodate the following future functions:
• The proposed facility would approximately 10,640 square feet (sf) of public areas associated with the museum (e.g., exhibit spaces, lobbies, and circulation) plus a 3,269-sf auditorium. It would also have a 717-sf museum store and 759-sf café that are expected to serve museum visitors. The project would provide 77 on-site parking spaces.
• General admission and tour attendance is expected to increase similar to the rate of regional population growth, at 2% per year. At that rate, general admission is expected to grow from 10,987 people in 2014 to about 14,800 people by the year 2030.
• No change in tour attendance is expected.
• The new multi-purpose auditorium is estimated to accommodate 150 people when set with tables in a banquet configuration, and up to 250 people when set in a theater configuration (for a performance or lecture). This is similar to the capacity of the auditorium at the existing museum building, which did accommodate events of up to 250 people.
• Regularly-scheduled events that occur at the existing museum— craft school, language classes, children’s programs, and museum-related meetings—are expected to remain the same in both frequency and attendance at the new facility.
• Rental events such as banquets and receptions could increase in frequency at the new facility. It is estimated that the facility could host another 30 banquets per year compared to the existing facility. Of those, five may have more than 150 people.
• The proposed museum would have fewer classrooms and auditorium spaces than the existing facility, which would reduce the potential for peak cumulative attendance such as that shown on Figure 8 for the peak October day. Some activities may have to be shifted to other time slots in the new facility, which would tamper the peak periods.
• The new facility would be closer to the core area of Ballard, which has better transit service than the existing museum. Parking demand and trip generation estimates for the existing museum assumed that all attendees and staff would commute by vehicle. At the new facility, it is expected that up to 5% of the attendees, including those to events, could use transit.
• The three large fundraising events each year—17th of May, Viking Days, and Yulefest—would not change. These are neighborhood events that attract large numbers of attendees over the course of a full weekend. The 17th of May, for example, currently has many activities at Bergen Place in the heart of downtown Ballard, with a shuttle from there to the Nordic Heritage Museum. The event also involved a parade along 24th Avenue NW, NW Market Street, and Ballard Avenue NW. The new facility would allow a more proximate location to the core of downtown Ballard, but is not expected to substantially change traffic and parking impacts associated with such events. The proposed museum would have on-site parking for 80 vehicles.

Nordic Heritage Museum Attendance, Trip Generation, and Parking Demand
- 11 - September 23, 2015
2.1. Parking Demand
Peak parking demand was determined for an average and a peak day assuming that general admission would grow by about 35% through the year 2030, but events, tours and staffing would remain constant. As previously discussed, the new museum would have fewer classroom spaces and will have to spread out classes during the week or by time of day at the new facility; therefore, the peak daytime condition assumes that cumulative attendance in the space could reach 130 people. In addition, two evening event conditions were evaluated: one with a maximum capacity banquet with 150 people and the other with a maximum capacity auditorium event with 250 people. The future parking demand estimates assume that 5% of the users could arrive by transit. Figure 9 shows the parking demand associated with an average daytime condition overlaid with an evening capacity banquet. Figure 10 shows the parking demand associated with a peak daytime conditions overlaid with a maximum capacity evening auditorium event.
Figure 9. New Museum Parking Demand by Time of Day Average Attendance Day with 150-Person Evening Banquet
Source: Heffron Transportation, Inc., June 2015

Nordic Heritage Museum Attendance, Trip Generation, and Parking Demand
- 12 - September 23, 2015
Figure 10. New Museum Parking Demand by Time of Day Peak Attendance Day with 250-Person Evening Auditorium Event
Source: Heffron Transportation, Inc., June 2015
As shown, the average day’s parking demand (61 vehicles) and a 150-person event (71 vehicles) would be accommodated by the on-site parking.. A capacity event, however, would exceed the on-site parking supply by up to 40 vehicles. The proposed supply would be able to accommodate events with up to about 180 attendees (plus about 10 staff). Events in excess of this size, including the three large community-wide events, are expected to occur about 10 times per year. It is possible that a large auditorium event could occur in the daytime when the museum is open. However, if that were to occur, it would be when there are no other events or activities at the site. A 150-person banquet plus regular museum admission and staff would be accommodated by the on-site parking supply. If a larger event were to occur, some parking management measures, such as securing off-street parking near the site would be needed. This condition would be rare and is likely be limited to a Saturday when off-street parking at nearby businesses could be available.
2.2. Trip Generation
The estimated attendance parameters described above were also used to derive the average and 85th-percentile trips for the proposed facility. These estimates assume that 5% of the general admission, event attendees and staff would use transit to access the site due to the proposed facilities location adjacent to several major bus routes. Table 2 summarizes the proposed museum’s trip generation. It is estimated to generate 138 vehicle trips on an average day, and 208 trips on the 85th-percentile day. PM peak hour trip generation is estimated to be 7 and 9 trips for these conditions, respectively.

Nordic Heritage Museum Attendance, Trip Generation, and Parking Demand
- 13 - September 23, 2015
Table 2. Average and 85th Percentile Attendance for Nordic Heritage Museum - 2014
Vehicle PM Peak Hour Trips (5:00 to 6:00 P.M.)
Type of Activity Occupancy # of People Daily Trips a In Out Total
Average Day
General Admission 1.5 50 64 0 0 0
Tours 4.0 27 14 0 0 0
Events and Rentals b 2.4 55 44 7 0 7
Staff 1.2 10 16 0 0 0
Total 138 7 0 7
85th-Percentile Day
General Admission 1.5 77 98 0 0 0
Tours 4.0 37 18 0 0 0
Events and Rentals b 2.4 75 60 9 0 9
Staff 1.2 20 32 0 0 0
Total 208 9 0 9 Source: Nordic Heritage Museum. Compiled by Heffron Transportation, Inc., June 2015. a. Assumes two trips per vehicle (one trip enter and one trip exit). Also assumes that 5% of general admission, event
attendees and staff use transit to access the proposed site. b. Assumes that 30% of evening event attendees arrive during the PM peak hour. MCH/jab