2 2010 bip parceria para indicadores de biodiversidade
DESCRIPTION
www.twentyten.net Dr Damon Stanwell-‐Smith Ecosystem Assessment Programme UNEP World ConservaLon Monitoring Centre Cambridge, UK Ministry of the Environment, Brazil Workshop on Biodiversity Monitoring Brasilia 23-‐25 August 2010 www.twentyten.netTRANSCRIPT
The 2010 Biodiversity Indicators Partnership
Ministry of the Environment, Brazil Workshop on Biodiversity Monitoring
Brasilia 23-‐25 August 2010
Dr Damon Stanwell-‐Smith
Ecosystem Assessment Programme UNEP World ConservaLon Monitoring Centre
Cambridge, UK
www.twentyten.net
www.twentyten.net

www.twentyten.net
"to achieve by 2010 a significant reduc7on of the current rate of biodiversity loss at the global, regional
and na7onal level as a contribu7on to poverty allevia7on and to the benefit of all life on Earth"
The 2010 Biodiversity Target – the challenge of the wording

www.twentyten.net
Generic 2010 index
• At least 3 Lme series events required
• Rate of change slows as Zero approached
Adapted from Mace (2009)
The 2010 Biodiversity Target – the challenge of the wording
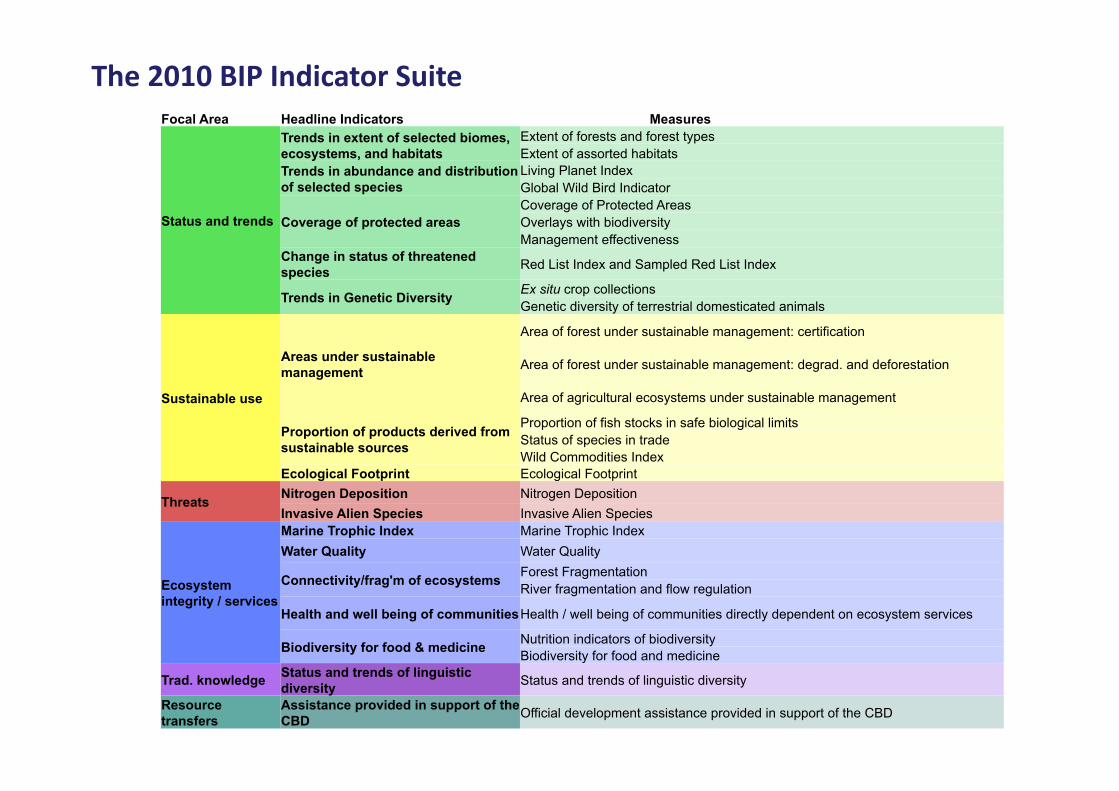
The 2010 BIP Indicator Suite Focal Area Headline Indicators Measures
Status and trends
Trends in extent of selected biomes, ecosystems, and habitats
Extent of forests and forest types Extent of assorted habitats
Trends in abundance and distribution of selected species
Living Planet Index Global Wild Bird Indicator
Coverage of protected areas Coverage of Protected Areas Overlays with biodiversity Management effectiveness
Change in status of threatened species Red List Index and Sampled Red List Index
Trends in Genetic Diversity Ex situ crop collections Genetic diversity of terrestrial domesticated animals
Sustainable use
Areas under sustainable management
Area of forest under sustainable management: certification
Area of forest under sustainable management: degrad. and deforestation
Area of agricultural ecosystems under sustainable management
Proportion of products derived from sustainable sources
Proportion of fish stocks in safe biological limits Status of species in trade Wild Commodities Index
Ecological Footprint Ecological Footprint
Threats Nitrogen Deposition Nitrogen Deposition Invasive Alien Species Invasive Alien Species
Ecosystem integrity / services
Marine Trophic Index Marine Trophic Index Water Quality Water Quality
Connectivity/frag'm of ecosystems Forest Fragmentation River fragmentation and flow regulation
Health and well being of communities Health / well being of communities directly dependent on ecosystem services
Biodiversity for food & medicine Nutrition indicators of biodiversity Biodiversity for food and medicine
Trad. knowledge Status and trends of linguistic diversity Status and trends of linguistic diversity
Resource transfers
Assistance provided in support of the CBD Official development assistance provided in support of the CBD

The 2010 BIP Indicator Suite Focal Area Headline Indicators Measures
Status and trends
Trends in extent of selected biomes, ecosystems, and habitats Trends in abundance and distribution of selected species
Coverage of protected areas
Change in status of threatened species
Trends in Genetic Diversity
Sustainable use
Areas under sustainable management
Proportion of products derived from sustainable sources
Ecological Footprint
Threats Nitrogen Deposition Invasive Alien Species
Ecosystem integrity / services
Marine Trophic Index Water Quality
Connectivity/frag'm of ecosystems
Health and well being of communities
Biodiversity for food & medicine
Trad. knowledge Status and trends of linguistic diversity
Resource transfers
Assistance provided in support of the CBD

The 2010 BIP Indicator Suite Focal Area Headline Indicators Measures
Pre 2000
Post 2000
Status and trends
Trends in extent of selected biomes, ecosystems, and habitats
Extent of forests and forest types Extent of assorted habitats
Trends in abundance and distribution of selected species
Living Planet Index Global Wild Bird Indicator
Coverage of protected areas Coverage of Protected Areas Overlays with biodiversity - - Management effectiveness
Change in status of threatened species Red List Index and Sampled Red List Index
Trends in Genetic Diversity Ex situ crop collections - - Genetic diversity of terrestrial domesticated animals -
Sustainable use
Areas under sustainable management
Area of forest under sustainable management: certification
Area of forest under sustainable management: degrad. - -
Area of agricultural ecosystems under sustainable mgmt. - -
Proportion of products derived from sustainable sources
Proportion of fish stocks in safe biological limits Status of species in trade - Wild Commodities Index
Ecological Footprint Ecological Footprint
Threats Nitrogen Deposition Nitrogen Deposition Invasive Alien Species Invasive Alien Species
Ecosystem integrity / services
Marine Trophic Index Marine Trophic Index Water Quality Water Quality
Connectivity/frag'm of ecosystems Forest Fragmentation - - River fragmentation and flow regulation - -
Health and well being of communities Health / well being of communities directly dependent - -
Biodiversity for food & medicine Nutrition indicators of biodiversity - - Biodiversity for food and medicine
Trad. knowledge Status and trends of linguistic diversity Status and trends of linguistic diversity
Resource transfers
Assistance provided in support of the CBD
Official development assistance provided in support of the CBD -
www.twentyten.net
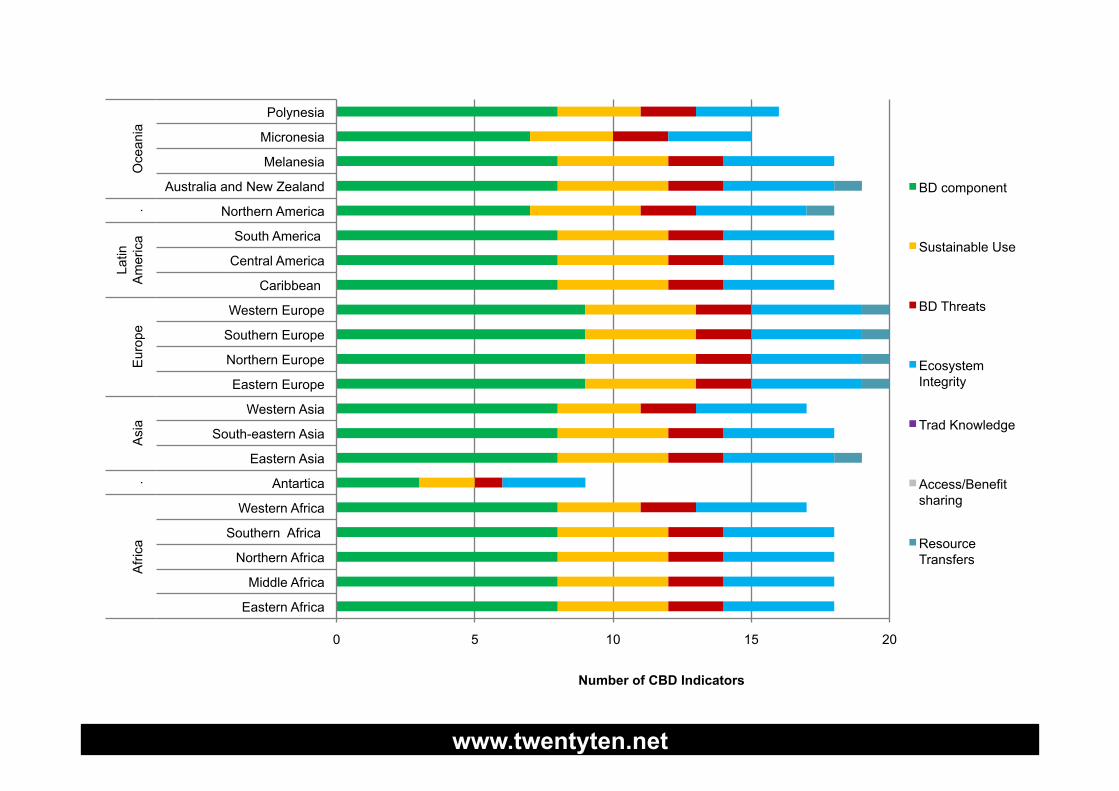
0 5 10 15 20
Eastern Africa
Middle Africa
Northern Africa
Southern Africa
Western Africa
Antartica
Eastern Asia
South-eastern Asia
Western Asia
Eastern Europe
Northern Europe
Southern Europe
Western Europe
Caribbean
Central America
South America
Northern America
Australia and New Zealand
Melanesia
Micronesia
Polynesia
Afri
ca
. A
sia
Eur
ope
Latin
A
mer
ica
. O
cean
ia
Number of CBD Indicators
BD component
Sustainable Use
BD Threats
Ecosystem Integrity
Trad Knowledge
Access/Benefit sharing
Resource Transfers
www.twentyten.net
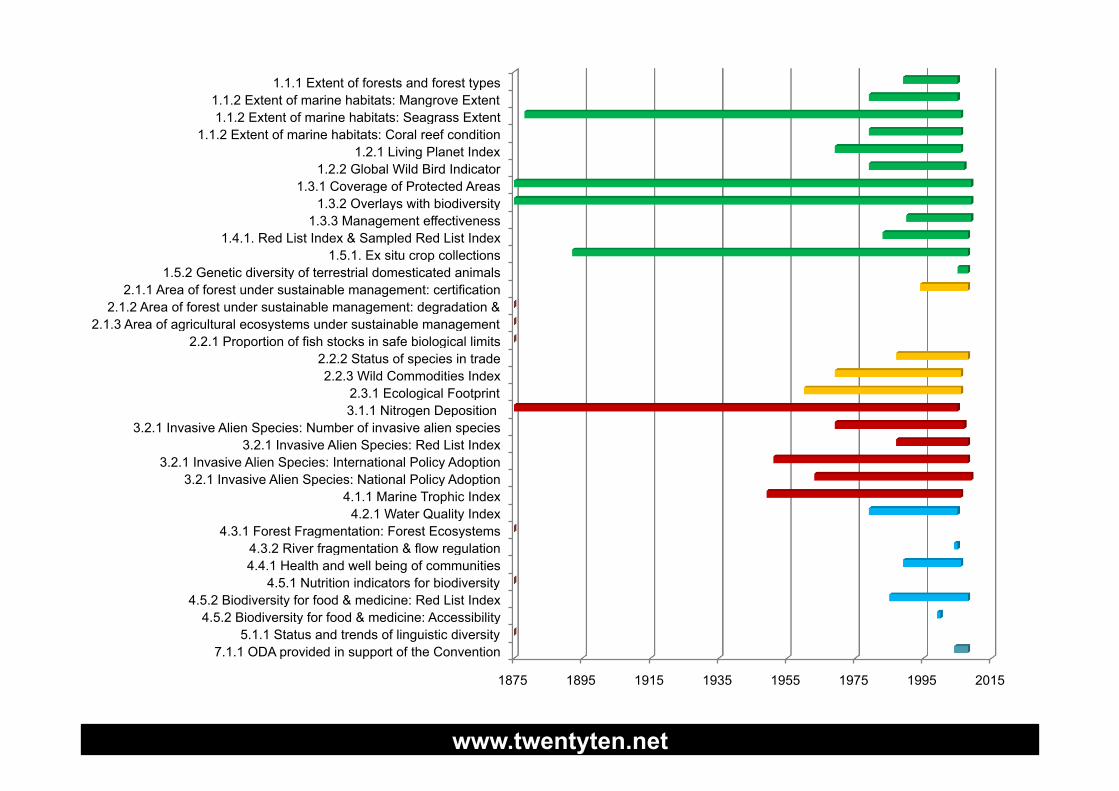
1875 1895 1915 1935 1955 1975 1995 2015
1.1.1 Extent of forests and forest types 1.1.2 Extent of marine habitats: Mangrove Extent 1.1.2 Extent of marine habitats: Seagrass Extent
1.1.2 Extent of marine habitats: Coral reef condition 1.2.1 Living Planet Index
1.2.2 Global Wild Bird Indicator 1.3.1 Coverage of Protected Areas
1.3.2 Overlays with biodiversity 1.3.3 Management effectiveness
1.4.1. Red List Index & Sampled Red List Index 1.5.1. Ex situ crop collections
1.5.2 Genetic diversity of terrestrial domesticated animals 2.1.1 Area of forest under sustainable management: certification
2.1.2 Area of forest under sustainable management: degradation & 2.1.3 Area of agricultural ecosystems under sustainable management
2.2.1 Proportion of fish stocks in safe biological limits 2.2.2 Status of species in trade 2.2.3 Wild Commodities Index
2.3.1 Ecological Footprint 3.1.1 Nitrogen Deposition
3.2.1 Invasive Alien Species: Number of invasive alien species 3.2.1 Invasive Alien Species: Red List Index
3.2.1 Invasive Alien Species: International Policy Adoption 3.2.1 Invasive Alien Species: National Policy Adoption
4.1.1 Marine Trophic Index 4.2.1 Water Quality Index
4.3.1 Forest Fragmentation: Forest Ecosystems 4.3.2 River fragmentation & flow regulation 4.4.1 Health and well being of communities
4.5.1 Nutrition indicators for biodiversity 4.5.2 Biodiversity for food & medicine: Red List Index
4.5.2 Biodiversity for food & medicine: Accessibility 5.1.1 Status and trends of linguistic diversity
7.1.1 ODA provided in support of the Convention
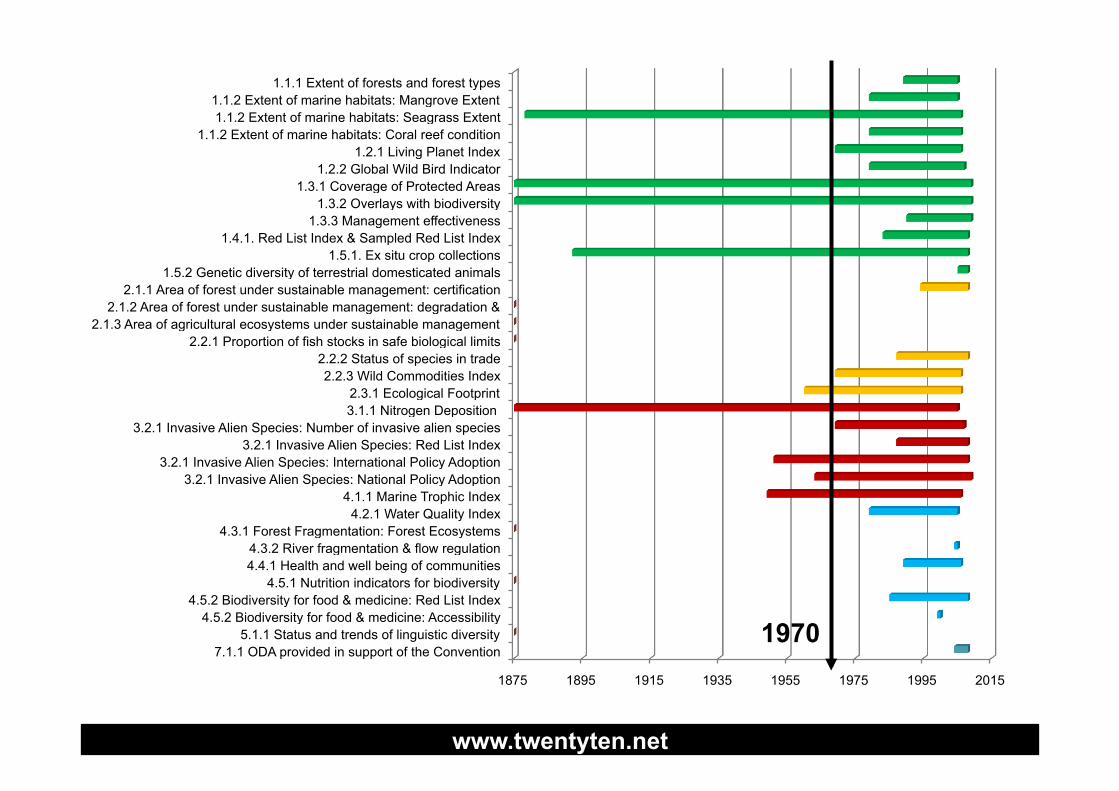
www.twentyten.net
1875 1895 1915 1935 1955 1975 1995 2015
1.1.1 Extent of forests and forest types 1.1.2 Extent of marine habitats: Mangrove Extent 1.1.2 Extent of marine habitats: Seagrass Extent
1.1.2 Extent of marine habitats: Coral reef condition 1.2.1 Living Planet Index
1.2.2 Global Wild Bird Indicator 1.3.1 Coverage of Protected Areas
1.3.2 Overlays with biodiversity 1.3.3 Management effectiveness
1.4.1. Red List Index & Sampled Red List Index 1.5.1. Ex situ crop collections
1.5.2 Genetic diversity of terrestrial domesticated animals 2.1.1 Area of forest under sustainable management: certification
2.1.2 Area of forest under sustainable management: degradation & 2.1.3 Area of agricultural ecosystems under sustainable management
2.2.1 Proportion of fish stocks in safe biological limits 2.2.2 Status of species in trade 2.2.3 Wild Commodities Index
2.3.1 Ecological Footprint 3.1.1 Nitrogen Deposition
3.2.1 Invasive Alien Species: Number of invasive alien species 3.2.1 Invasive Alien Species: Red List Index
3.2.1 Invasive Alien Species: International Policy Adoption 3.2.1 Invasive Alien Species: National Policy Adoption
4.1.1 Marine Trophic Index 4.2.1 Water Quality Index
4.3.1 Forest Fragmentation: Forest Ecosystems 4.3.2 River fragmentation & flow regulation 4.4.1 Health and well being of communities
4.5.1 Nutrition indicators for biodiversity 4.5.2 Biodiversity for food & medicine: Red List Index
4.5.2 Biodiversity for food & medicine: Accessibility 5.1.1 Status and trends of linguistic diversity
7.1.1 ODA provided in support of the Convention 1970

www.twentyten.net
CommunicaLng global progress
3rd ediLon -‐ Global Biodiversity Outlook
• Flagship IYB product of CBD, 10 May 2010
• Butchart et al (2010) Science 328: 1164-8, 28 May 2010

www.twentyten.net
Butchart et al (2010) Global biodiversity: indicators of recent declines, Science 328: 1164-8

www.twentyten.net
Butchart et al (2010) Global biodiversity: indicators of recent declines, Science 328: 1164-8
31 %
78%

www.twentyten.net
"Highly unlikely that the 2010 Target will be met"
Butchart et al (2010) Global biodiversity: indicators of recent declines, Science 328: 1164-8
significant inflecLons

www.twentyten.net
Goals / sub-‐targets (from GBO3)

www.twentyten.net

www.twentyten.net
Linked indicator narraLve: tropical humid forests

www.twentyten.net
Linked indicator narraLve: marine fisheries
www.twentyten.net
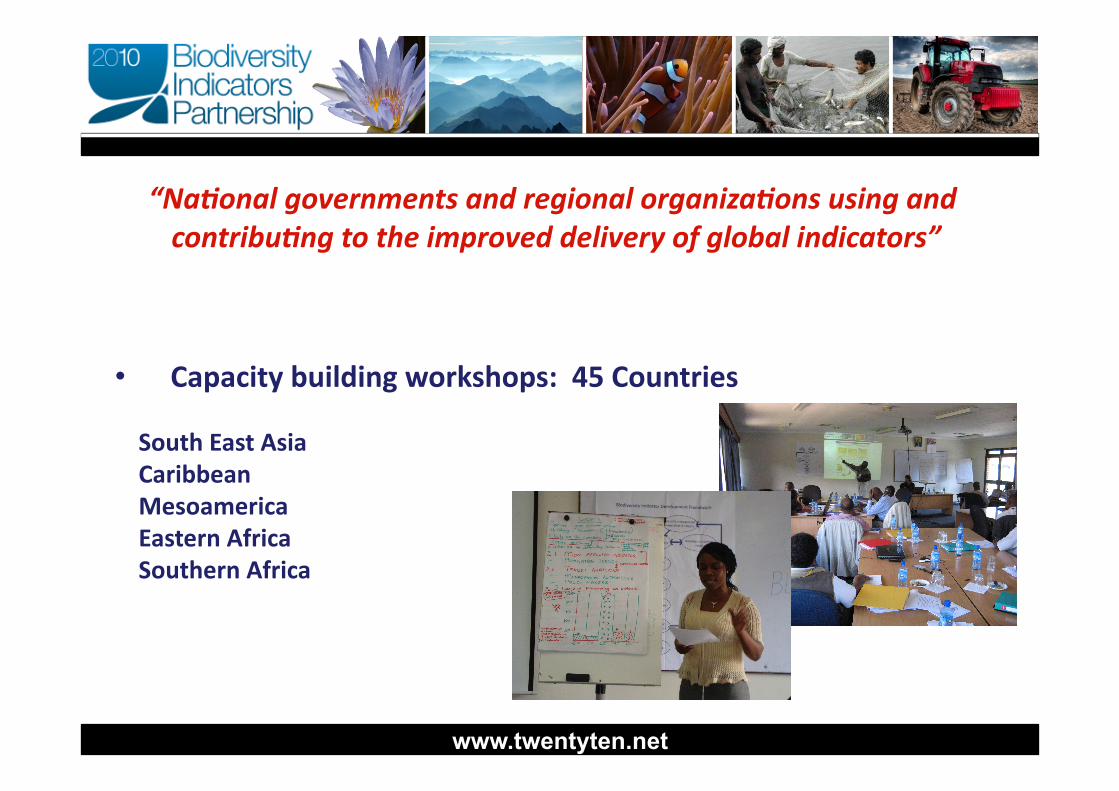
• Capacity building workshops: 45 Countries
“Na7onal governments and regional organiza7ons using and contribu7ng to the improved delivery of global indicators”
South East Asia Caribbean Mesoamerica Eastern Africa Southern Africa
www.twentyten.net
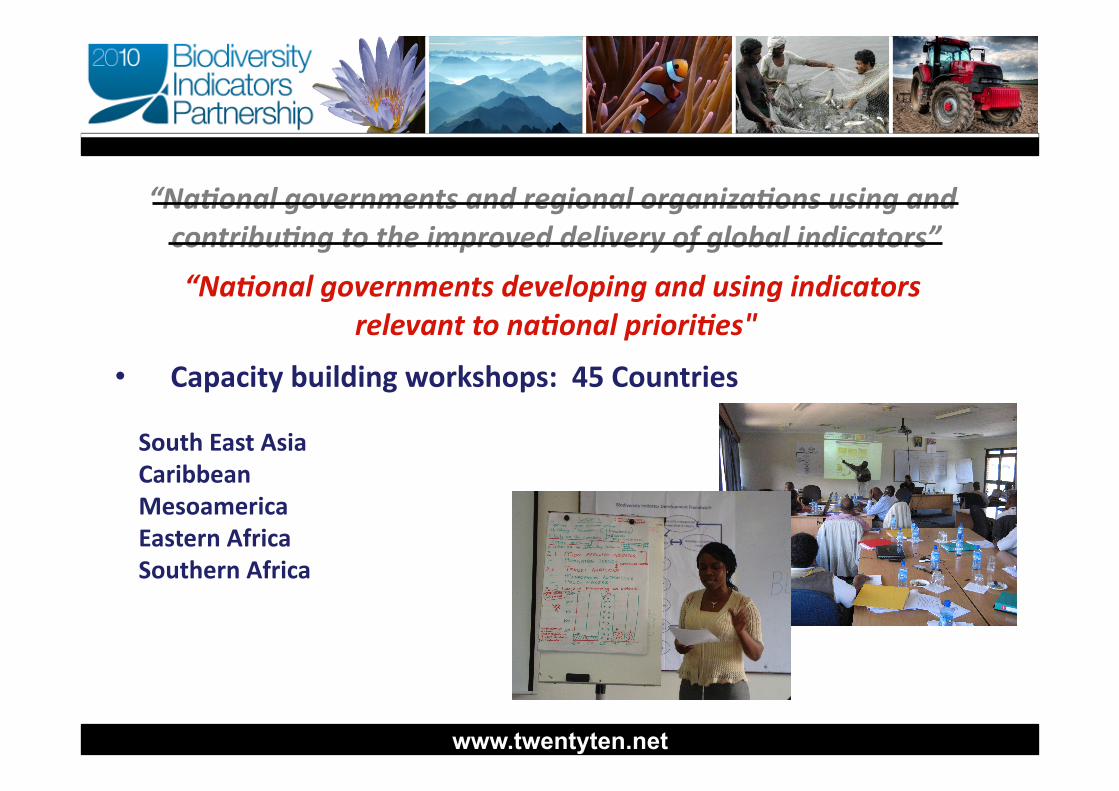
• Capacity building workshops: 45 Countries
“Na7onal governments and regional organiza7ons using and contribu7ng to the improved delivery of global indicators”
South East Asia Caribbean Mesoamerica Eastern Africa Southern Africa
“Na7onal governments developing and using indicators relevant to na7onal priori7es"

www.twentyten.net
Indicator Development Flowchart

www.twentyten.net
Indicator Development Flowchart

www.twentyten.net
Indicator Development Flowchart

www.twentyten.net
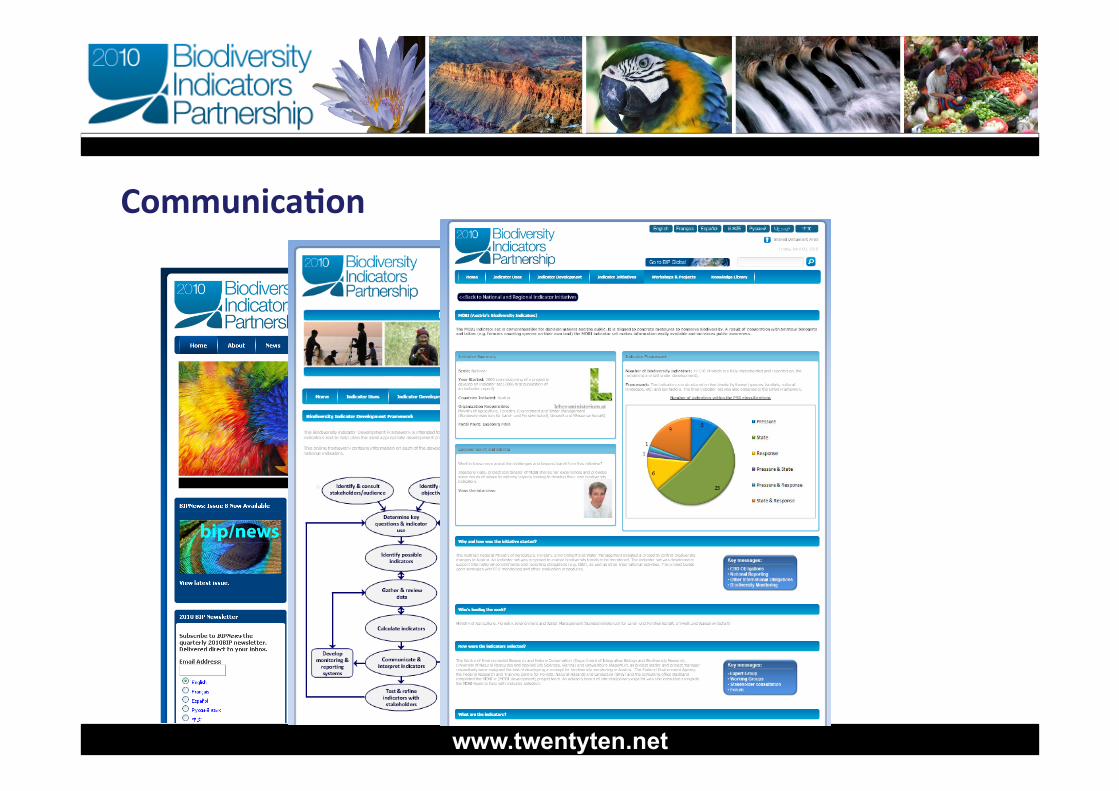
CommunicaLon

www.twentyten.net
CommunicaLon

www.twentyten.net
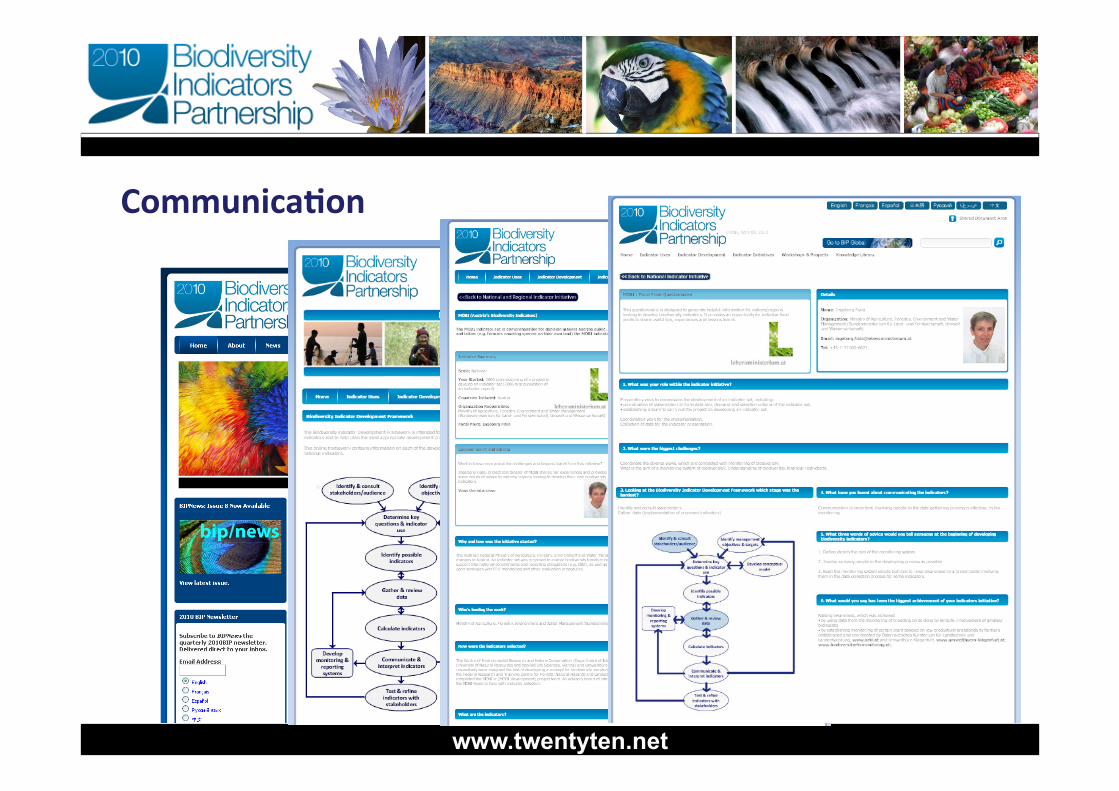
CommunicaLon

www.twentyten.net
CommunicaLon
www.twentyten.net
CommunicaLon
www.twentyten.net
CommunicaLon
www.twentyten.net
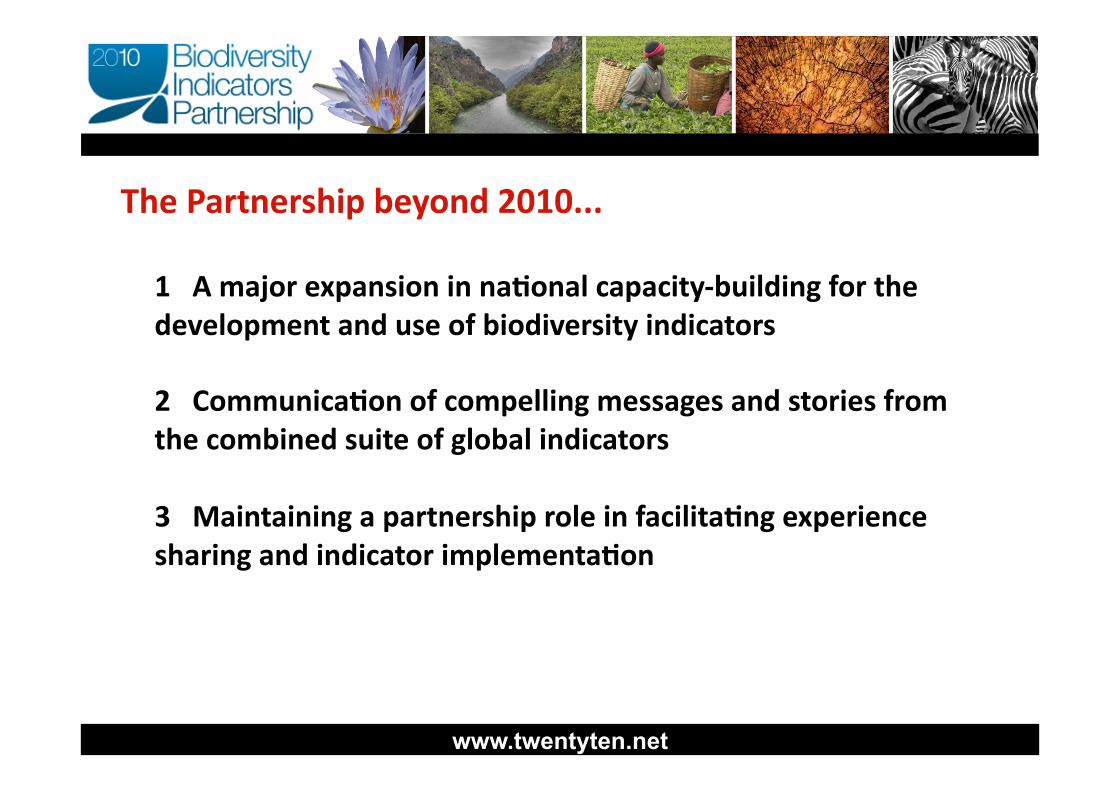
1 A major expansion in naLonal capacity-‐building for the development and use of biodiversity indicators 2 CommunicaLon of compelling messages and stories from the combined suite of global indicators 3 Maintaining a partnership role in facilitaLng experience sharing and indicator implementaLon
The Partnership beyond 2010...
www.twentyten.net