2 acemoglu, johnson and robin- son - the colonial origins...
TRANSCRIPT

2 Acemoglu, Johnson and Robin-
son - The Colonial Origins of Com-
parative Development : An Em-
pirical Investigation
2.1 Question
� What is the impact of institutions on development?
� What are institutions?
� Alternative theories of development
� Capital Accumulation (Pre-Solow)
� Technological Change (Solow)
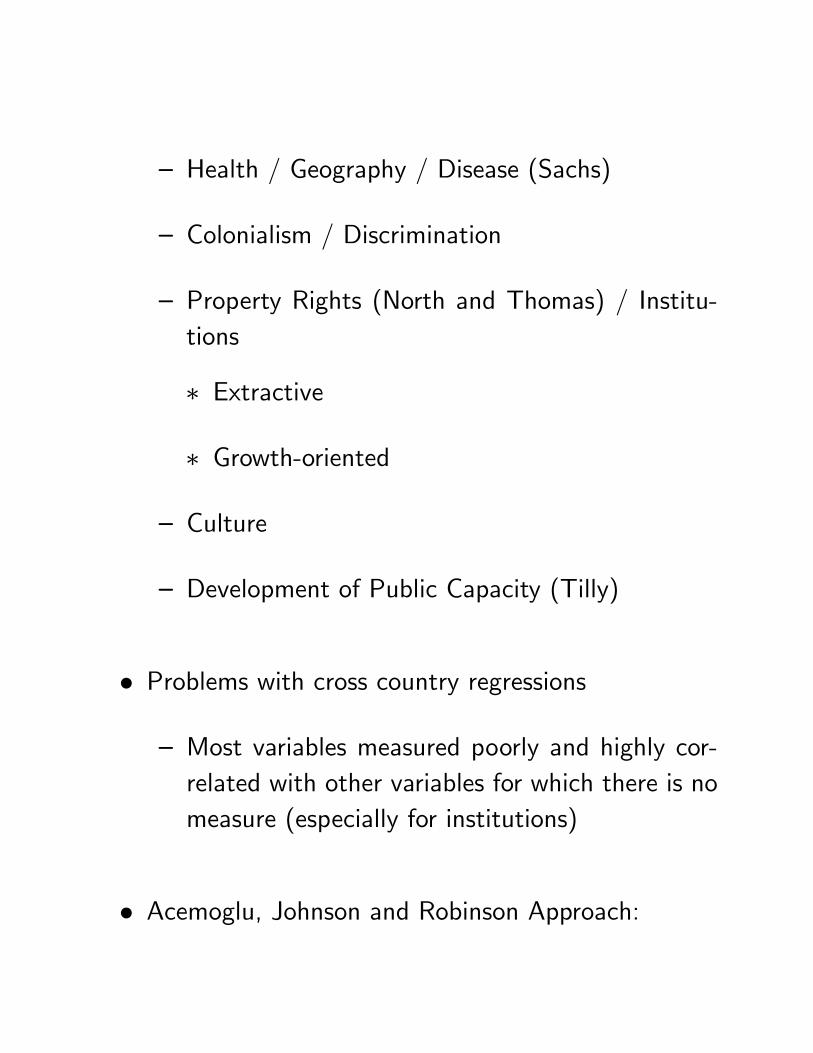
� Health / Geography / Disease (Sachs)
� Colonialism / Discrimination
� Property Rights (North and Thomas) / Institu-tions
� Extractive
� Growth-oriented
� Culture
� Development of Public Capacity (Tilly)
� Problems with cross country regressions
� Most variables measured poorly and highly cor-related with other variables for which there is nomeasure (especially for institutions)
� Acemoglu, Johnson and Robinson Approach:

� Disease environment in 19th century lead to dif-ferential short run settlement across colonies
� Di¤erential settlement across colonies lead to dif-ferential adoption of institutions across colonies
� Di¤erential adoption of institutions across colonieslead to di¤erential growth across former colonies
� Regress Level of Development on Institutions, In-strument with 19th century settler mortality
2.2 Data : Main Variables
� Log GDP per capita - World Bank Development In-dicators
� Average Expropriation Protection Against Risk (Scalefrom 1 to 10) from Political Risk Services - averagedover 1985 to 1995

� Log output per worker (robustness) - Hall and Jones
� Excluded Instrument : Settler Mortality per 1000settlers
� Mainly from Phillip Curtin (1989: Death by Mi-gration, 1998: Disease and Empire)
� Take �rst available barrack (not campaign) deathrate of soldiers
� Fill in with laborer deaths for four countries
� Latin American Mortality from Hector Gutierrez(1986: "The Mortality of Latin-American Bish-ops in the 17th and 18th centuries)
� Big debate with David Albouy over constructionof settler mortality variable
� Some countries use identical numbers (shouldcluster)
ACEMOGLU ET AL.: THE COLONIAL ORIGINS OF DEVELOPMENT
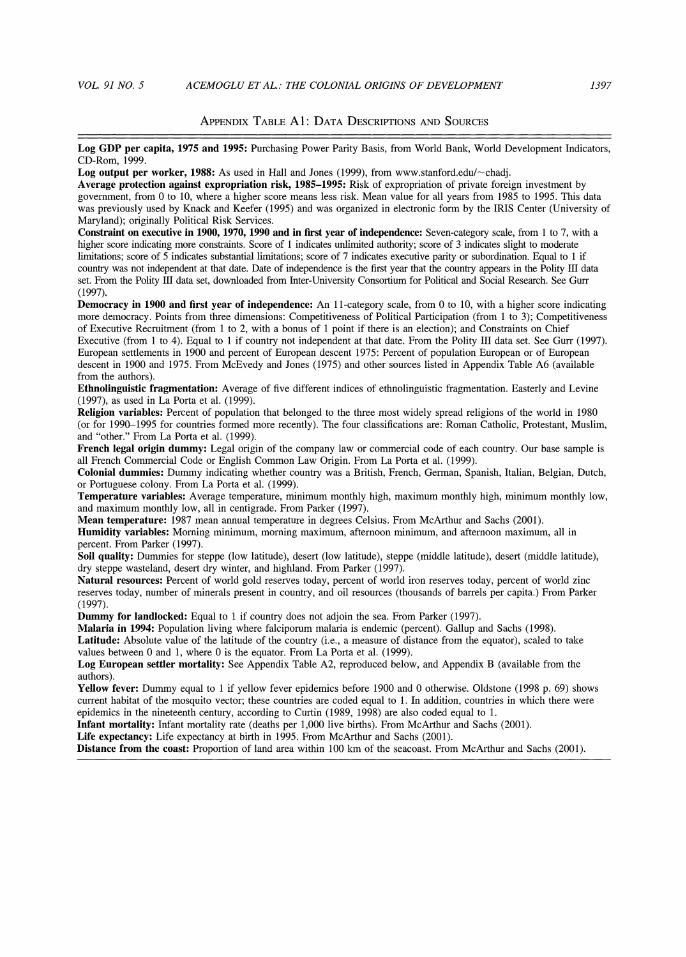
APPENDIXTABLEA l : DATA DESCRIPTIONS AND SOURCES
Log GDP per capita, 1975 and 1995: Purchasing Power Parity Basis, from World Bank, World Development Indicators, CD-Rom, 1999. Log output per worker, 1988: As used in Hall and Jones (1999), from www.stanford.edu/-chadj. Average protection against expropriation risk, 1985-1995: Risk of expropriation of private foreign investment by government, from 0 to 10, where a higher score means less risk. Mean value for all years from 1985 to 1995. This data was previously used by Knack and Keefer (1995) and was organized in electronic form by the IRIS Center (University of Maryland); originally Political Risk Services. Constraint on executive in 1900,1970,1990 and in first year of independence: Seven-category scale, from 1 to 7, with a higher score indicating more constraints. Score of 1 indicates unlimited authority; score of 3 indicates slight to moderate limitations; score of 5 indicates substantial limitations; score of 7 indicates executive parity or subordination. Equal to 1 if country was not independent at that date. Date of independence is the first year that the country appears in the Polity 111 data set. From the Polity III data set, downloaded from Inter-University Consoitium for Political and Social Research. See Gurr (1997). Democracy in 1900 and first year of independence: An 11-category scale, from 0 to 10, with a higher score indicating more democracy. Points from three dimensions: Competitiveness of Political Participation (from 1 to 3); Competitiveness of Executive Recruitment (from 1 to 2, with a bonus of 1 point if there is an election); and Constraints on Chief Executive (from 1 to 4). Equal to 1 if country not independent at that date. From the Polity I11 data set. See Gurr (1997). European settlements in 1900 and percent of European descent 1975: Percent of population European or of European descent in 1900 and 1975. From McEvedy and Jones (1975) and other sources listed in Appendix Table A6 (available from the authors). Ethnolinguistic fragmentation: Average of five different indices of ethnolinguistic fragmentation. Easterly and Levine (1997), as used in La Porta et al. (1999). Religion variables: Percent of population that belonged to the three most widely spread religions of the world in 1980 (or for 1990-1995 for countries formed more recently). The four classifications are: Roman Catholic, Protestant, Muslim, and "other." From La Porta et al. (1999). French legal origin dummy: Legal origin of the company law or commercial code of each country. Our base sample is all French Commercial Code or English Common Law Origin. From La Porta et al. (1999). Colonial dummies: Dummy indicating whether country was a British, French, German, Spanish, Italian, Belgian, Dutch, or Portuguese colony. From La Porta et al. (1999). Temperature variables: Average temperature, minimum monthly high, maximum monthly high, minimum monthly low, and maximum monthly low, all in centigrade. From Parker (1997). Mean temperature: 1987 mean annual temperature in degrees Celsius. From McArthur and Sachs (2001). Humidity variables: Morning minimum, morning maximum, afternoon minimum, and afternoon maximum, all in percent. From Parker (1997). Soil quality: Dummies for steppe (low latitude), desert (low latitude), steppe (middle latitude), desert (middle latitude), dry steppe wasteland, desert d ~ y winter, and highland. From Parker (1997). Natural resources: Percent of world gold reserves today, percent of world iron reserves today, percent of world zinc reserves today, number of minerals present in country, and oil resources (thousands of barrels per capita.) From Parker (1997). Dummy for landlocked: Equal to 1 if country does not adjoin the sea. From Parker (1997). Malaria in 1994: Population living where falciporum malaria is endemic (percent). Gallup and Sachs (1998). Latitude: Absolute value of the latitude of the country (i.e., a measure of distance from the equator), scaled to take values between 0 and 1, where 0 is the equator. From La Porta et al. (1999). Log European settler mortality: See Appendix Table A2, reproduced below, and Appendix B (available from the authors). Yellow fever: Dummy equal to 1 if yellow fever epidemics before 1900 and 0 otherwise. Oldstone (1998 p. 69) shows current habitat of the mosquito vector; these countries are coded equal to 1. In addition, countries in which there were epidemics in the nineteenth century, according to Curtin (1989, 1998) are also coded equal to 1. Infant mortality: Infant mortality rate (deaths per 1,000 live births). From McA~thur and Sachs (2001). Life expectancy: Life expectancy at birth in 1995. From McArthur and Sachs (2001). Distance from the coast: Proportion of land area within 100 km of the seacoast. From McArthur and Sachs (2001).

� Claims of selectively using barrack vs. cam-paign death rates
� Claim that when recomputed properly, e¤ectsgo away and also weak instrument problem
3 Speci�cations
� OLS Spec�cation:
log yi = �+ aRi +X0i + �i
Note: Nigeria at 25th percentile of expropriation measureand South Korea at 75th (from 5.6 to 7.8). Coe¢ cientfrom OLS is 0.52. 0.52*2.2=1.14. e1:14 � 1 = 2:1 butactual gap is 11 times di¤erence.
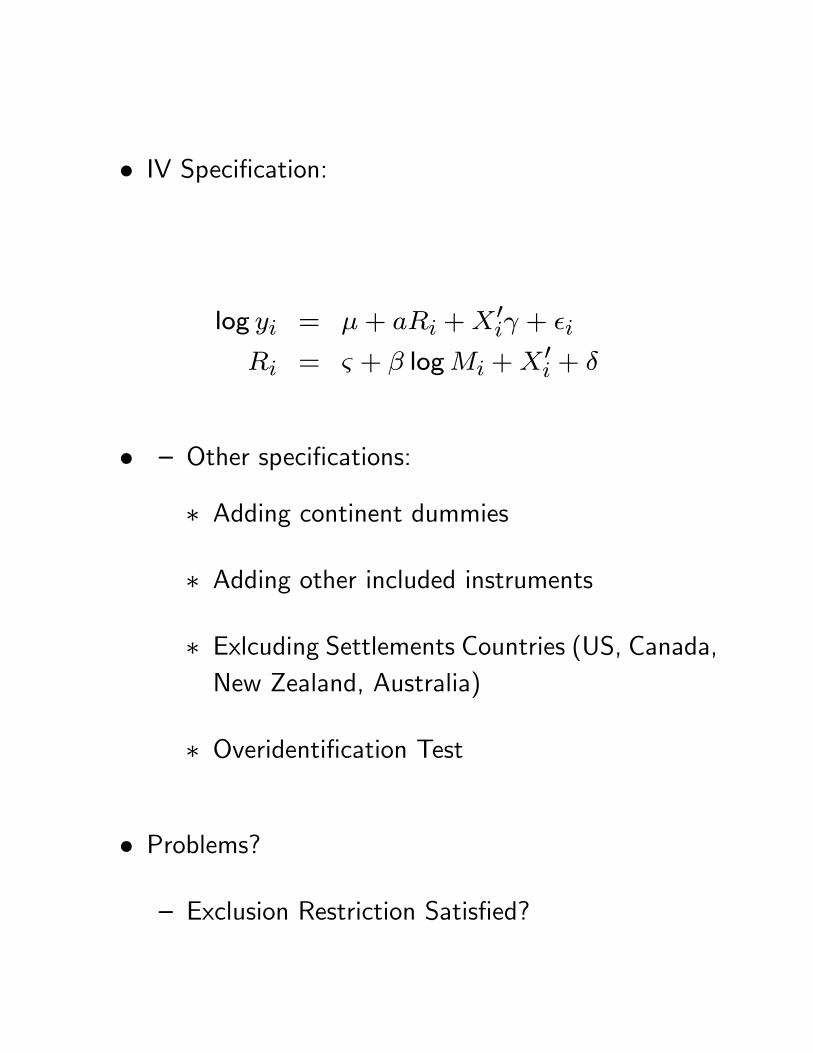
� IV Speci�cation:
log yi = �+ aRi +X0i + �i
Ri = & + � logMi +X0i + �
� � Other speci�cations:
� Adding continent dummies
� Adding other included instruments
� Exlcuding Settlements Countries (US, Canada,New Zealand, Australia)
� Overidenti�cation Test
� Problems?
� Exclusion Restriction Satis�ed?
1379 VOL. 91 NO. 5 ACEMOGLU ET AL.: THE COLONIAL ORIGINS OF DEVELOPMENT
Whole Base Whole Whole Base Base Whole Base world sample world world sample sample world sample
(1) (2) (3) (4) (5) (6) (7) (8)
Dependent variable is log output per
Dependent variable is log GDP per capita in 1995 worker in 1988
Average protection 0.54 0.52 0.47 against expropriation (0.04) (0.06) (0.06) risk, 1985-1995
Latitude 0.89 (0.49)
Asia dummy
Africa dummy
"Other" continent dummy
R~ 0.62 0.54 0.63 Number of observations 110 64 110
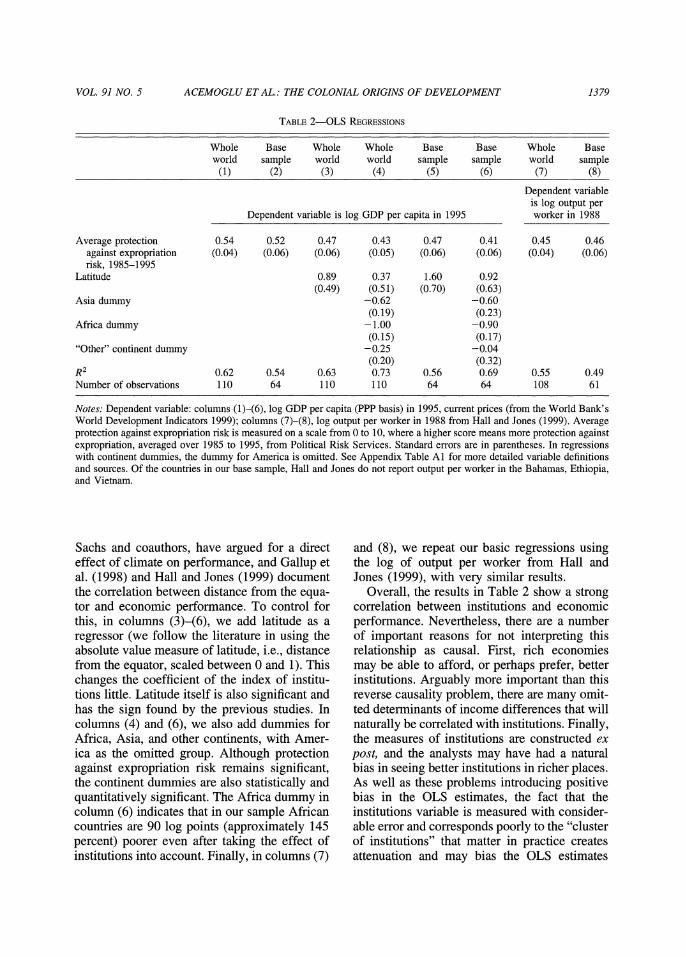
Notes: Dependent variable: columns (1)-(6), log GDP per capita (PPP basis) in 1995, current prices (from the World Bank's World Development Indicators 1999); columns (7)-(8), log output per worker in 1988 from Hall and Jones (1999). Average protection against expropriation risk is measured on a scale from 0 to 10, where a higher score means more protection against expropriation, averaged over 1985 to 1995, from Political Risk Services. Standard errors are in parentheses. In regressions with continent dummies, the dummy for America is omitted. See Appendix Table A1 for more detailed variable definitions and sources. Of the countries in our base sample, Hall and Jones do not report output per worker in the Bahamas, Ethiopia, and Vietnam.
Sachs and coauthors, have argued for a direct effect of climate on performance, and Gallup et al. (1998) and Hall and Jones (1999) document the correlation between distance from the equa- tor and economic performance. To control for this, in columns (3)-(6), we add latitude as a regressor (we follow the literature in using the absolute value measure of latitude, i.e., distance from the equator, scaled between 0 and 1). This changes the coefficient of the index of institu- tions little. Latitude itself is also significant and has the sign found by the previous studies. In columns (4) and (6), we also add dummies for Africa, Asia, and other continents, with Amer- ica as the omitted group. Although protection against expropriation risk remains significant, the continent dummies are also statistically and quantitatively significant. The Africa dummy in column (6) indicates that in our sample African countries are 90 log points (approximately 145 percent) poorer even after taking the effect of institutions into account. Finally, in columns (7)
and (8), we repeat our basic regressions using the log of output per worker from Hall and Jones (1999), with very similar results.
Overall, the results in Table 2 show a strong correlation between institutions and economic performance. Nevertheless, there are a number of important reasons for not interpreting this relationship as causal. First, rich economies may be able to afford, or perhaps prefer, better institutions. Arguably more important than this reverse causality problem, there are many omit- ted determinants of income differences that will naturally be correlated with institutions. Finally, the measures of institutions are constructed ex post, and the analysts may have had a natural bias in seeing better institutions in richer places. As well as these problems introducing positive bias in the OLS estimates, the fact that the institutions variable is measured with consider- able error and corresponds poorly to the "cluster of institutions" that matter in practice creates attenuation and may bias the OLS estimates
1386 THE AMERICAN ECONOMIC REVIEW DECEMBER 2001
TABLE4--1V OF LOGGDP PER CAPITAREGRESSIONS
Base Base Base sample.
Base Base sample sample dependent Base sample Base sample sample sample with with variable is
Base Base without without without without continent continent log output sample sample Neo-Europes Neo-Europes Africa Africa dummies dummies per worker
(1) (2) (3) (4) (5) (6) (7) (8) (9)
Panel A: Two-Stage Least Squares
Average protection against 0.94 1.00 1.28 1.21 0.58 0.58 expropriation risk 1985-1995 (0.16) (0.22) (0.36) (0.35) (0.10) (0.12)
Latitude -0.65 0.94 0.04 (1.34) (1.46) (0.84)
Asia dummy
Africa dummy
"Other" continent dulnmy
Panel B: First Stage for Average Protection Against Expropriation Risk in 1985-1995
Log European settler mortality -0.61 -0.51 (0.13) (0.14)
Latitude 2.00 (1.34)
Asia dummy
Africa dummy
"Other" continent dulnmy
Panel C: Ordinary Least Squares
Average protection against 0.52 0.47 0.49 0.47 0.48 0.47 0.42 0.40 0.46 expropriation risk 1985-1995 (0.06) (0.06) (0.08) (0.07) (0.07) (0.07) (0.06) (0.06) (0.06)
Number of observations 64 64 60 60 37 37 64 64 6 1
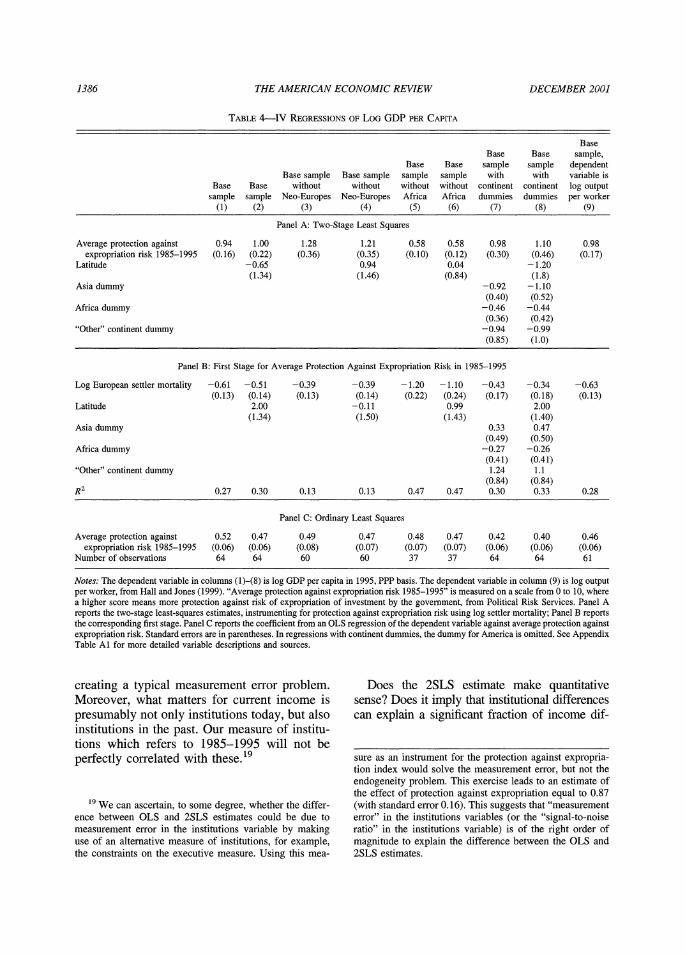
Notes: The dependent variable in columns (I)-@) is log GDP per capita in 1995, PPP basis. The dependent variable in column (9) is log output per worker, from Hall and Jones (1999). "Average protection against expropriation risk 1985-1995" is measured on a scale from 0 to 10, where a higher score means more protection against risk of expropriation of investment by the government, from Political Risk Services. Panel A reports the two-stage least-squares estimates, instrumenting for protection against expropriation risk using log settler mortality; Panel B reports the corresponding first stage. Panel C reports the coefficient from an OLS regression of the dependent variable against average protection against expropriation risk. Standard errors are in parentheses. In regressions with continent dummies, the dummy for America is omitted. See Appendix Table A1 for more detailed variable descriptions and sources.
creating a typical measurement error problem. Does the 2SLS estimate make quantitative Moreover, what matters for current income is sense? Does it imply that institutional differences presumably not only institutions today, but also can explain a significant fraction of income dif- institutions in the past. Our measure of institu- tions which refers to 1985-1995 will not be perfectly correlated with these.19 sure as an instrument for the protection against expropria-
tion index would solve the measurement error, but not the endogeneity problem. This exercise leads to an estimate of the effect of protection against expropriation equal to 0.87
l 9 We can ascertain, to some degree, whether the differ- (with standard error 0.16). This suggests that "measurement ence between OLS and 2SLS estimates could be due to error" in the institutions variables (or the "signal-to-noise measurement error in the institutions variable by making ratio" in the institutions variable) is of the right order of use of an alternative measure of institutions, for example, magnitude to explain the difference between the OLS and the constraints on the executive measure. Using this mea- 2SLS estimates.
- - - - - -
1389 VOL. 91 NO. 5 ACEMOGLU ET AL.: THE COLONIAL ORIGINS OF DEVELOPMENT
TABLE5-IV OF LOG GDP PER CAPITA CONTROLSREGRESSIONS WITH ADDITIONAL
British Bntish Base Base colonies colonies Base Base Base Base Base
sample sample only only sample sample sample sample sample (1) (2) (3) (4) (5) (6) (7) (8) (9)
Panel A: Two-Stage Least Squares
Average protection against 1.10 1.16 1.07 1.00 1.10 1.20 0.92 1.00 1.10 expropriation risk, 1985-1995 (0.22) (0.34) (0.24) (0.22) (0.19) (0.29) (0.15) (0.25) (0.29)
Latitude -0.75 -1.10 -0.94 -1.70 (1.70) (1.56) (1.50) (1.6)
British colonial dummy -0.78 -0.80 (0.35) (0.39)
French colonial dummy -0.12 -0.06 0.02 (0.35) (0.42) (0.69)
French legal origin dummy 0.89 0.96 0.51 (0.32) (0.39) (0.69)
p-value for religion variables [0.001] [0.004] [0.42]
Panel B: First Stage for Average Protection Against Expropriation Risk in 1985-1995
Log European settler mortality -0.53 -0.43 -0.59 -0.51 -0.54 -0.44 -0.58 -0.44 -0.48 (0.14) (0.16) (0.19) (0.14) (0.13) (0.14) (0.13) (0.15) (0.18)
Latitude 1.97 2.10 2.50 2.30 (1.40) (1.30) (1.50) (1.60)
British colonial dummy 0.63 0.55 (0.37) (0.37)
French colonial dummy 0.05 -0.12 -0.25 (0.43) (0.44) (0.89)
French legal origin -0.67 -0.7 -0.05 (0.33) (0.32) (0.91)
R~ 0.31 0.33 0.30 0.30 0.32 0.35 0.32 0.35 0.45
Panel C: Ordinary Least Squares Average protection against 0.53 0.47 0.61 0.47 0.56 0.56 0.53 0.47 0.47
expropriation risk, 1985-1995 (0.19) (0.07) (0.09) (0.06) (0.06) (0.06) (0.06) (0.06) (0.06) Number of observations 64 64 25 25 64 64 64 64 64
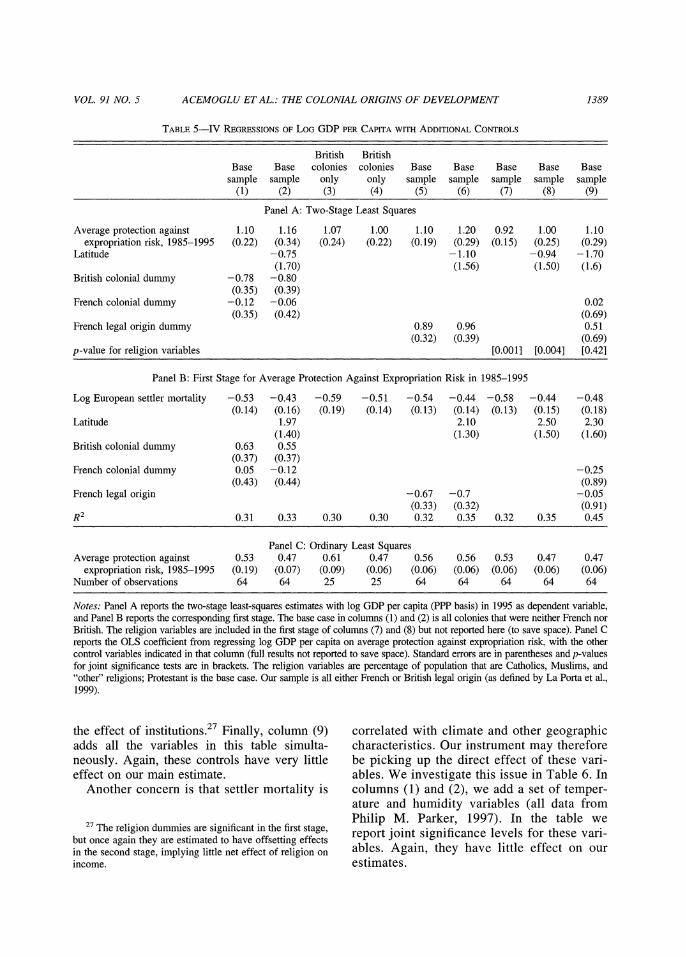
Notes: Panel A reports the two-stage least-squares estimates with log GDP per capita (PPP basis) in 1995 as dependent variable, and Panel B reports the corresponding first stage. The base case in columns (1) and (2) is all colonies that were neither French nor British. The religion variables are included in the first stage of columns (7) and (8) but not reported here (to save space). Panel C reports the OLS coefficient from regressing log GDP per capita on average protection against expropriation risk. with the other control variables indicated in that column (full results not reported to save space). Standard errors are in parentheses and p-values for joint significance tests are in brackets. The religion variables are percentage of population that are Catholics, Muslims, and "other" religions; Protestant is the base case. Our sample is all either French or British legal origin (as defined by La Porta et al., 1999).
the effect of institution^.'^ Finally, column (9) correlated with climate and other geographic adds all the variables in this table simulta- characteristics. Our instrument may therefore neously. Again, these controls have very little be picking up the direct effect of these vari- effect on our main estimate. ables. We investigate this issue in Table 6. In
Another concern is that settler mortality is columns (1) and (2), we add a set of temper- ature and humiditv variables (all data from
'"The religion dummies are significant in the first stage, Philip M. Parker, 1997). In the table we report joint significance levels for these vari-
but once again they are estimated to have offsetting effects in the second stage, implying little net effect of religion on ables. Again$ have little effect On Our
income. estimates.

1390 THE AMERICAN ECONOMIC REVIEW DECEMBER 2001
TABLE 6-ROBUSTNESS CHECKS FOR IV REGRESSIONSOF LOG GDP PER CAPITA
Base Base Base Base Base Base Base Base Base sample sample sample sample sample sample sample sample sample
(1) (2) (3) (4) (5) (6) (7) (8) (9)
Panel A: Two-Stage Least Squares
Average protection against 0.84 0.83 0.96 0.99 1.10 expropriation risk, 1985-1995 (0.19) (0.21) (0.28) (0.30) (0.33)
Latitude 0.07 -0.67 (1.60) (1.30)
p-value for temperature variables [0.96] [0.97] p-value for humidity variables [0.54] [0.54] Percent of European descent in 1975 -0.08 0.03
(0.82) (0.84) p-value for soil quality [0.79] p-value for natural resources [0.82] Dummy for being landlocked 0.64
(0.63) Ethnolinguistic fragmentation
Panel B: First Stage for Average Protection Against Expropriation Risk in 1985-1995
Log European settler mortality -0.64 -0.59 -0.41 -0.4 -0.44 -0.34 -0.64 -0.56 -0.59 (0.17) (0.17) (0.14) (0.15) (0.16) (0.17) (0.15) (0.15) (0.21)
Latitude 2.70 0.48 2.20 2.30 4.20 (2.00) (1.50) (1.50) (1.40) (2.60)
R2 0.39 0.41 0.34 0.34 0.41 0.43 0.27 0.30 0.59
Panel C: Ordinary Least Squares
Average protection against 0.41 0.38 0.39 0.38 0.46 0.42 0.46 0.45 0.38 expropriation risk, 1985-1995 (0.06) (0.06) (0.06) (0.06) (0.07) (0.07) (0.05) (0.06) (0.06)
Notes: Panel A reports the two-stage least-squares estimates with log GDP per capita (PPP basis) in 1995, and Panel B reports the corresponding first stages. Panel C reports the OLS coefficient from regressing log GDP per capita on average protection against expropriation risk, with the other control variables indicated in that column (full results not reported to save space). Standard errors are in parentheses and p-values for joint significance tests are in brackets. All regressions have 64 observations, except those including natural resources, which have 63 observations. The temperature and humidity variables are: average, minimum, and maximum monthly high temperatures, and minimum and maximum monthly low temperatures, and morning minimum and maximum humidity, and afternoon minimum and maximum humidity (from Parker, 1997). Measures of natural resources are: percent of world gold reserves today, percent of world iron reserves today, percent of world zinc reserves today, number of minerals present in country, and oil resources (thousands of barrels per capita). Measures of soil qualitylclimate are steppe (low latitude), desert (low latitude), steppe (middle latitude), desert (middle latitude), dry steppe wasteland, desert dry winter, and highland. See Appendix Table A1 for more detailed variable definitions and sources.
A related concern is that in colonies where nificant, with a coefficient of 0.96 (s.e. =
Europeans settled, the current population con- 0.28). In columns (5) and (6), we control for sists of a higher fraction of Europeans. One measures of natural resources, soil quality (in might be worried that we are capturing the practice soil types), and for whether the coun- direct effect of having more Europeans (who try is landlocked. All these controls are insig- perhaps brought a "European culture" or spe- nificant, and have little effect on our 2SLS cial relations with Europe). To control for estimate of the effect of institutions on in-this, we add the fraction of the population of come per capita. European descent in columns (3) and (4) of In columns (7) and (8), we include ethno- Table 6. This variable is insignificant, while linguistic fragmentation as another control the effect of institutions remains highly sig- and treat it as exogenous. Now the coefficient

1392 THE AMERICAN ECONOMIC REVIEW DECEMBER 2001
TABLE 7-GEOGRAPHY AND HEALTHVARIABLES
(1) (2) (3) (4) (5) (6) (7) (8) (9) (10) (11)
Yellow fever instrument for
average Instrumenting only for average Instrumenting for all protection against
protection against expropriation risk right-hand-side variables expropriation risk
Panel A: Two-Stage Least Squares
Average protection against 0.69 0.72 0.63 0.68 0.55 0.56 0.69 0.74 0.68 0.91 0.90 expropriationrisk,1985-1995 (0.25) (0.30) (0.28) (0.34) (0.24) (0.31) (0.26) (0.24) (0.23) (0.24) (0.32)
Latitude -0.57 -0.53 -0.1 (1.04) (0.97) (0.95)
Malaria in 1994 -0.57 -0.60 -0.62 (0.47) (0.47) (0.68)
Life expectancy 0.03 0.03 0.02 (0.02) (0.02) (0.02)
Infant ~nortality -0.01 -0.01 -0.01 (0.005) (0.006) (0.01)
Panel B: First Stage for Average Protection Against Expropriation Risk in 1985-1995
Log European settler mortality -0.42 -0.38 -0.34 -0.30 -0.36 -0.29 -0.41 -0.40 -0.40 (0.19) (0.19) (0.17) (0.18) (0.18) (0.19) (0.17) (0.17) (0.17)
Latitude 1.70 1.10 1.60 -0.81 -0.84 -0.84 (1.40) (1.40) (1.40) (1.80) (1.80) (1.80)
Malaria in 1994 -0.79 -0.65 (0.54) (0.55)
Life expectancy 0.05 0.04 (0.02) (0.02)
Infant mortality -0.01 -0.01 (0.01) (0.01)
Mean temperature -0.12 -0.12 -0.12 (0.05) (0.05) (0.05)
Distance from coast
Yellow fever dummy -1.10 -0.81 (0.41) (0.38)
R2 0.3 0.31 0.34 0.35 0.32 0.34 0.37 0.36 0.36 0.10 0.32
Panel C: Ordinary Least Squares
Average protection against 0.35 0.35 0.28 0.28 0.29 0.28 0.35 0.29 0.29 0.48 0.39 expropriationrisk, 1985-1995 (0.06) (0.06) (0.05) (0.05) (0.05) (0.05) (0.06) (0.05) (0.05) (0.06) (0.06)
Number of observations 62 62 60 60 60 60 60 59 59 64 64
Notes: Panel A reports the two-stage least-squares estimates with log GDP per capita (PPP basis) in 1995, and Panel B reports the corresponding first stages. Panel C reports the coefficient from an OLS regression with log GDP per capita as the dependent variable and average protection against expropriation risk and the other control variables indicated in each column as independent variables (full results not reported to save space). Standard errors are in parentheses. Columns (1)-(6) instrument for average protection against expropriation risk using log mortality and assume that the other regressors are exogenous. Columns (7)-(9) include as instruments average temperature, amount of territory within 100 km of the coast, and latitude (from McArthur and Sachs, 2001). Columns (10) and (11) use a dummy variable for whether or not a country was subject to yellow fever epidemics before 1900 as an instrument for average protection against expropriation. See Appendix Table A1 for more detailed variable definitions and sources.
institutions being the major determinant of in- temperature, and distance from the coast as in-come per capita difference~,with little effect struments in addition to our instrument, settler from geographyhealth variables. mortality. McArthur and Sachs (2001) report
Columns (7)-(9) report estimates from mod- that in these regressions the institution variable els that treat both health and institutions as is still significant, but geographyhealth are also endogenous, and following McArthur and significant. In contrast to McArthur and Sachs' Sachs, instrument for them using latitude, mean results, we find that only institutions are signif-
1394 THE AMERICAN ECONOMIC REVIEW DECEMBER 2001
TABLE 8-OVERIDENTIFICATION TESTS
Base Base Base Base Base Base Base Base Base Base sample sample sample sample sample sample sample sample sample sample
(1) (2) (3) (4) (5) (6) (7) (8) (9) (10)
Panel A: Two-Stage Least Squares Average protection against expropriation 0.87 0.92 0.71 0.68 0.72 0.69 0.60 0.61 0.55 0.56
risk, 1985-1995 (0.14) (0.20) (0.15) (0.20) (0.14) (0.19) (0.14) (0.17) (0.12) (0.14) Latitude -0.47 -0.34 0.31 -0.41 -0.16
(1.20) (1.10) (1.05) (0.92) (0.81)
Panel B: First Stage for Average Protection Against Expropriation Risk
European settlements in 1900 3.20 2.90 (0.62) (0.83)
Constraint on executive in 1900 0.32 0.26 (0.08) (0.09)
Democracy in 1900 0.24 0.20 (0.06) (0.07)
Constraint on executive in first year of 0.25 0.22 independence (0.08) (0.08)
Democracy in first year of independence 0.19 0.17 (0.05) (0.05)
RZ 0.30 0.30 0.20 0.24 0.24 0.26 0.19 0.25 0.26 0.30
Panel C: Results from Overidentification Test
p-value (from chi-squared test) [0.67] [0.96] [0.09] [0.20] [0.11] [0.28] [0.67] [0.79] [0.22] [0.26]
Panel D: Second Stage with Log Mortality as Exogenous Variable
Averageprotectionagainstexpropriation 0.81 0.88 0.45 0.42 0.52 0.48 0.49 0.49 0.4 0.41 risk, 1985-1995 (0.23) (0.30) (0.25) (0.30) (0.23) (0.28) (0.23) (0.25) (0.18) (0.19)
Log European settler mortality -0.07 -0.05 -0.25 -0.26 -0.21 -0.22 -0.14 -0.14 -0.19 -0.19 (0.17) (0.18) (0.16) (0.17) (0.15) (0.16) (0.16) (0.15) (0.13) (0.12)
Latitude -0.52 0.38 0.28 -0.38 -0.17 (1.15) (0.89) (0.86) (0.84) (0.73)
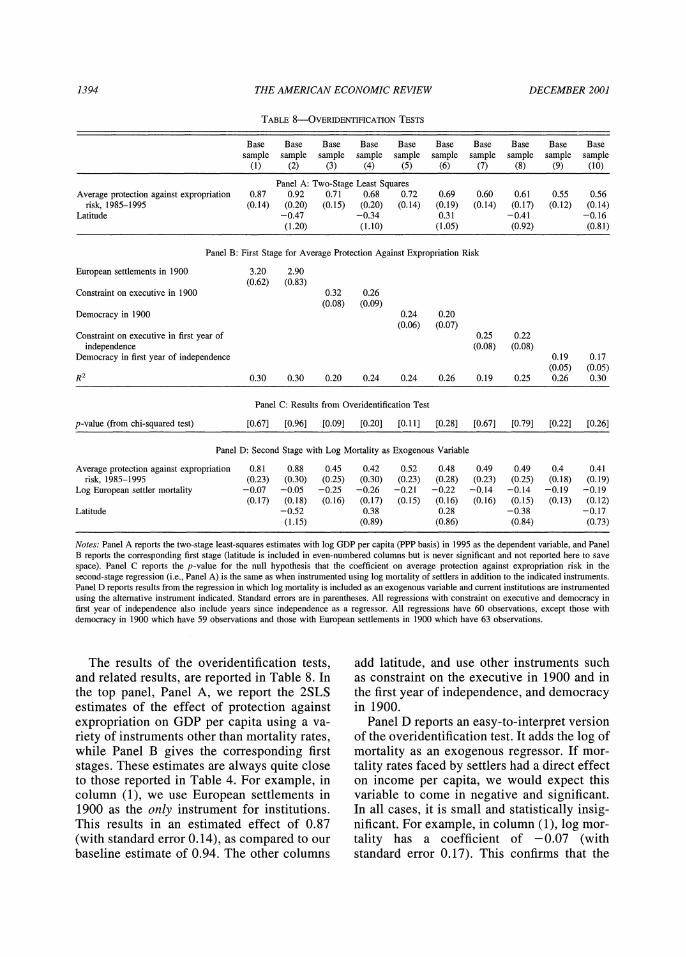
Notes: Panel A reports the two-stage least-squares estimates with log GDP per capita (PPP basis) in 1995 as the dependent variable, and Panel B reports the corresponding first stage (latitude is included in even-numbered columns but is never significant and not reported here to save space). Panel C reports the p-value for the null hypothesis that the coefficient on average protection against expropriation risk in the second-stage regression (i.e., Panel A) is the same as when instrumented using log mortality of settlers in addition to the indicated instruments. Panel D reports results from the regression in which log mortality is included as an exogenous variable and current institutions are instmmented using the alternative instrument indicated. Standard errors are in parentheses. All regressions with constraint on executive and democracy in first year of independence also include years since independence as a regressor. All regressions have 60 observations, except those with democracy in 1900 which have 59 observations and those with European settlements in 1900 which have 63 observations.
The results of the overidentification tests, add latitude, and use other instruments such and related results, are reported in Table 8. In as constraint on the executive in 1900 and in the top panel, Panel A, we report the 2SLS the first year of independence, and democracy estimates of the effect of protection against in 1900. expropriation on GDP per capita using a va- Panel D reports an easy-to-interpret version riety of instruments other than mortality rates, of the overidentification test. It adds the log of while Panel B gives the corresponding first mortality as an exogenous regressor. If mor- stages. These estimates are always quite close tality rates faced by settlers had a direct effect to those reported in Table 4. For example, in on income per capita, we would expect this column (I), we use European settlements in variable to come in negative and significant. 1900 as the only instrument for institutions. In all cases, it is small and statistically insig- This results in an estimated effect of 0.87 nificant. For example, in column (I), log mor- (with standard error 0.14), as compared to our tality has a coefficient of -0.07 (with baseline estimate of 0.94. The other columns standard error 0.17). This confirms that the

� Capital Accumulation
� Geography / Disease Environment
� Culture
� Capital Flows / Discrimination
� Others
� Weakness of Instrument
� Manipulation of construction of main instrument?

Colonialism and Modern Income
James Feyerer and Bruce Sacerdote
Colonialism and Modern Income: Islands as Natural Experiments

Table I Summary Statistics
These are summary statistics for the variables in the islands database. See the text for details on variable sources and construction. Islands still without an elected legislature are coded as getting a legislature in 2004.
Variable Obs Mean Std. Dev. Min Max Island's GDP per Capita 2000 80 7,953.38 8,909.50 264.00 53,735.00 Log (GDP Capita) 80 8.42 1.12 5.57 10.89 Infant Mortality 2002 80 18.68 15.21 4.00 79.00 Number of Centuries as a Colony 80 2.18 1.54 0.00 5.11 Northerly Vector of Prevailing Wind 80 0.18 1.28 -1.55 4.20 Easterly Vector of Prevailing Wind 80 -4.20 2.02 -6.88 4.42 No Historical (1500-1820) Off Island Trade Except Fish or Coconuts (0-1) 80 0.48 0.50 0.00 1.00 Agriculture Used Imported Slaves 80 0.40 0.49 0.00 1.00 Year of First Elected Legislature 80 1939 69 1639 2004 Had Legislature by 1800 80 0.08 0.27 0.00 1.00 Had Legislature by 1900 80 0.14 0.35 0.00 1.00 Percent Current Pop Native 77 49.07 45.06 0.00 100.00 Percent Current Pop White 77 7.86 16.06 0.00 95.88 Percent Current Pop Black 77 23.65 36.98 0.00 95.00 Percent Current Pop Mixed 77 12.60 24.05 0.00 93.20 Number of Centuries British 80 0.86 1.23 0.00 3.95 Number of Centuries French 80 0.40 0.82 0.00 3.69 Number of Centuries Spanish 80 0.38 0.95 0.00 4.05 Ever British 80 0.68 0.47 0.00 1.00 Ever French 80 0.31 0.47 0.00 1.00 Ever Spanish 80 0.25 0.44 0.00 1.00 Absolute Value of Latitude 80 15.66 7.71 0.50 51.92 Island Area (1000s sq km) 80 5.92 20.5 0.003 110.0 Island Population 70 302,720 1,394,832 102 11,000,000 Island is in Pacific 80 0.49 0.50 0.00 1.00 Island is in Atlantic 80 0.44 0.50 0.00 1.00 Island is in Indian 80 0.07 0.27 0.00 1.00
33

Table II
Outcomes Regressed on Years of Colonization
We regress Log GDP per capita and infant mortality on the number of years the island spent as a colony of a European power. Columns (1), (2), (4), (6) and (7) are OLS. Columns (3), (5) and (8) are two stage least squares where we instrument for centuries of colonial rule or the first year as a colony using the 12 month average and standard deviation of the east-west wind speed for each island.
(1) (2) (3) (4) (5) (6) (7) (8) Log GDP
Capita Log GDP
Capita Log GDP Capita -
IV
Log GDP Capita
Log GDP Capita-
IV
Infant Mortality Per 1000
Infant Mortality Per 1000
Infant Mortality Per 1000 -
IV Number of Centuries a Colony 0.413 0.450 0.441 -2.801 -2.611 -10.244 (0.065)** (0.083)** (0.157)** (1.156)* (1.259)* (4.344)* First Year a Colony -0.396 -0.545 (0.101)** (0.232)* Final Year A Colony 0.014 0.007 (0.014) (0.017) Remained A Colony in 2000 0.800 0.732 (0.149)** (0.206)** Abs(Latitude) 0.048 0.048 0.039 0.042 -0.763 -0.771 (0.011)** (0.011)** (0.011)** (0.013)** (0.211)** (0.221)** Area in millions of sq km -21.046 -20.984 -20.429 -23.791 263.524 321.185 (3.937)** (3.961)** (4.707)** (6.169)** (149.986)+ (143.722)* Island is in Pacific 0.779 0.767 0.747 0.944 -7.427 -18.724 (0.457)+ (0.522) (0.470) (0.569) (9.498) (13.608) Island is in Atlantic 0.615 0.622 0.427 0.298 -7.349 -1.117 (0.400) (0.410) (0.367) (0.403) (8.581) (8.555) Constant 7.524 6.172 6.192 13.673 16.356 24.771 41.579 60.751 (0.166)** (0.526)** (0.659)** (1.942)** (4.173)** (3.677)** (10.898)** (18.551)** Observations 80 80 80 80 80 80 80 80 R-squared 0.320 0.578 0.578 0.642 0.630 0.080 0.353 0.082
Robust standard errors in parentheses. We cluster at the island group level since several of the islands (e.g. the Cook Islands and the Federated States of Micronesia) are used as separate observations from a cluster of politically related yet geographically distinct islands. + significant at 10%; * significant at 5%; ** significant at 1%
34
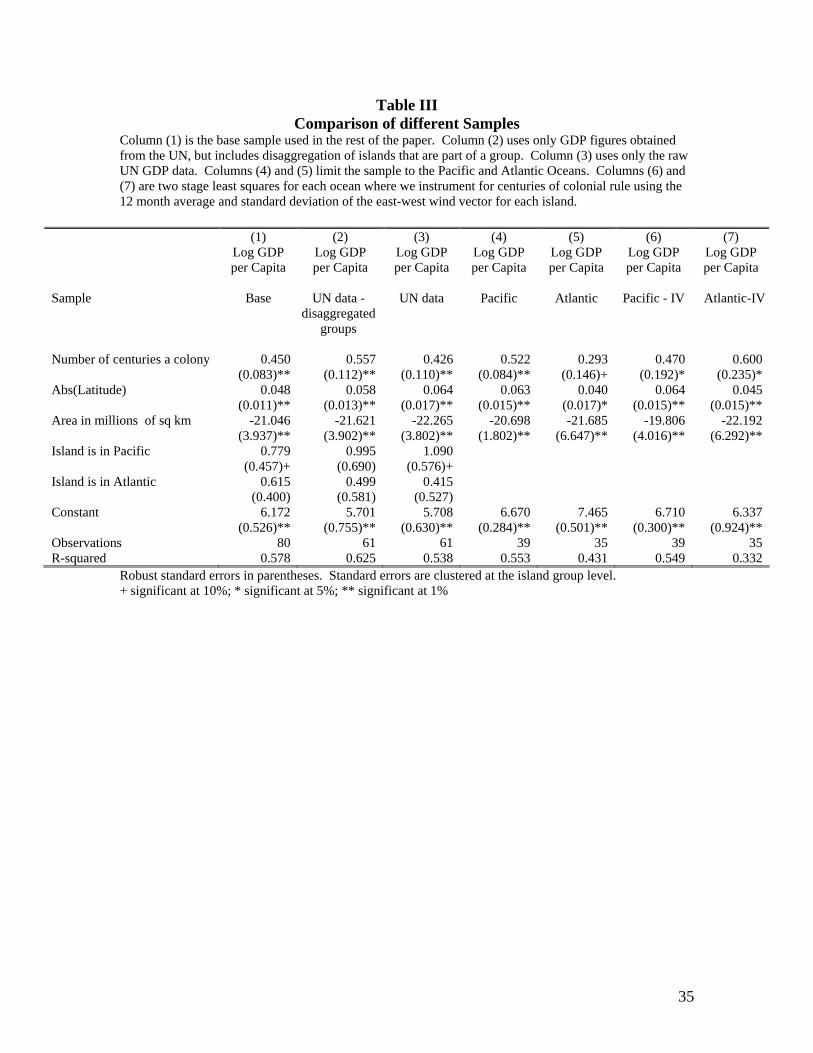
Table III Comparison of different Samples
Column (1) is the base sample used in the rest of the paper. Column (2) uses only GDP figures obtained from the UN, but includes disaggregation of islands that are part of a group. Column (3) uses only the raw UN GDP data. Columns (4) and (5) limit the sample to the Pacific and Atlantic Oceans. Columns (6) and (7) are two stage least squares for each ocean where we instrument for centuries of colonial rule using the 12 month average and standard deviation of the east-west wind vector for each island.
(1) (2) (3) (4) (5) (6) (7) Log GDP
per Capita Log GDP per Capita
Log GDP per Capita
Log GDP per Capita
Log GDP per Capita
Log GDP per Capita
Log GDP per Capita
Sample Base UN data -
disaggregated groups
UN data Pacific Atlantic Pacific - IV Atlantic-IV
Number of centuries a colony 0.450 0.557 0.426 0.522 0.293 0.470 0.600 (0.083)** (0.112)** (0.110)** (0.084)** (0.146)+ (0.192)* (0.235)* Abs(Latitude) 0.048 0.058 0.064 0.063 0.040 0.064 0.045 (0.011)** (0.013)** (0.017)** (0.015)** (0.017)* (0.015)** (0.015)** Area in millions of sq km -21.046 -21.621 -22.265 -20.698 -21.685 -19.806 -22.192 (3.937)** (3.902)** (3.802)** (1.802)** (6.647)** (4.016)** (6.292)** Island is in Pacific 0.779 0.995 1.090 (0.457)+ (0.690) (0.576)+ Island is in Atlantic 0.615 0.499 0.415 (0.400) (0.581) (0.527) Constant 6.172 5.701 5.708 6.670 7.465 6.710 6.337 (0.526)** (0.755)** (0.630)** (0.284)** (0.501)** (0.300)** (0.924)** Observations 80 61 61 39 35 39 35 R-squared 0.578 0.625 0.538 0.553 0.431 0.549 0.332
Robust standard errors in parentheses. Standard errors are clustered at the island group level. + significant at 10%; * significant at 5%; ** significant at 1%
35

Table IV Possible Mechanisms for GDP – Colonialism Relationship
(1) (2) (3) (4) Log GDP
Per Capita Log GDP Per Capita
Log GDP Per Capita
Log GDP Per Capita
Number Of Centuries A Colony 0.393 0.387 0.378 0.313 (0.100)** (0.104)** (0.103)** (0.091)** No Complex Trade Goods During Colonial Period -0.435 -0.464 -0.497 (0.279) (0.282) (0.291)+ Mining During Colonial Period 0.492 (0.323) Organized Agriculture During Colonial Period 0.298 (0.295) Livestock During Colonial Period 0.094 (0.398) Agriculture Used Imported Slaves 0.115 0.218 (0.369) (0.388) Year Of First Elected Legislature 0.000 0.000 (0.001) (0.001) Had Elected Legislature By 1800 0.288 (0.462) Had Elected Legislature By 1900 -0.470 (0.399) Percent White 0.016 (0.008)* Percent Black 0.008 (0.007) Percent Mixed 0.018 (0.005)** Abs(Latitude) 0.044 0.047 0.045 0.042 (0.011)** (0.014)** (0.011)** (0.013)** Area in millions of sq km -22.389 -23.420 -22.125 -25.058 (3.985)** (4.658)** (3.154)** (3.755)** Island is in Pacific 0.921 0.792 0.820 1.286 (0.430)* (0.470)+ (0.455)+ (0.412)** Island is in Atlantic 0.578 0.635 0.425 0.306 (0.404) (0.384) (0.410) (0.400) Constant 5.549 6.145 6.621 5.696 (2.351)* (0.517)** (0.583)** (2.214)* Observations 80 80 80 77 R-Squared 0.600 0.598 0.608 0.686
Robust standard errors in parentheses. Standard errors are clustered at the island group level. + significant at 10%; * significant at 5%; ** significant at 1%
36
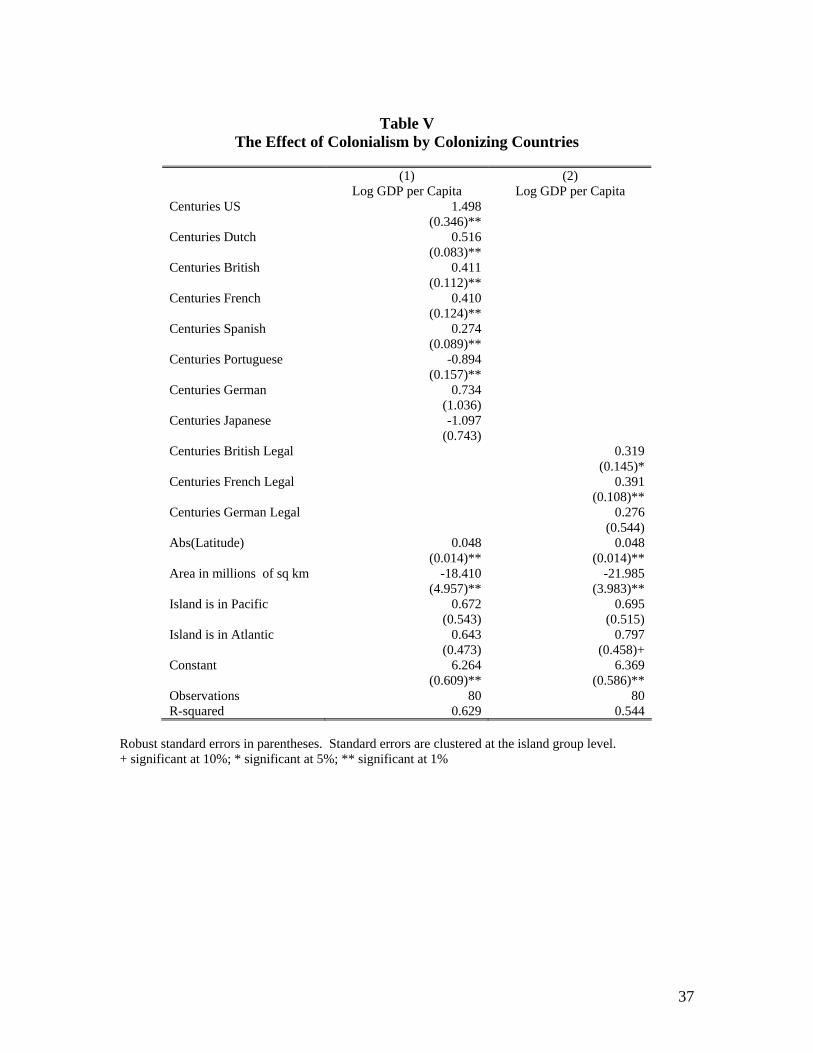
Table V
The Effect of Colonialism by Colonizing Countries
(1) (2) Log GDP per Capita Log GDP per Capita Centuries US 1.498 (0.346)** Centuries Dutch 0.516 (0.083)** Centuries British 0.411 (0.112)** Centuries French 0.410 (0.124)** Centuries Spanish 0.274 (0.089)** Centuries Portuguese -0.894 (0.157)** Centuries German 0.734 (1.036) Centuries Japanese -1.097 (0.743) Centuries British Legal 0.319 (0.145)* Centuries French Legal 0.391 (0.108)** Centuries German Legal 0.276 (0.544) Abs(Latitude) 0.048 0.048 (0.014)** (0.014)** Area in millions of sq km -18.410 -21.985 (4.957)** (3.983)** Island is in Pacific 0.672 0.695 (0.543) (0.515) Island is in Atlantic 0.643 0.797 (0.473) (0.458)+ Constant 6.264 6.369 (0.609)** (0.586)** Observations 80 80 R-squared 0.629 0.544
Robust standard errors in parentheses. Standard errors are clustered at the island group level. + significant at 10%; * significant at 5%; ** significant at 1%
37
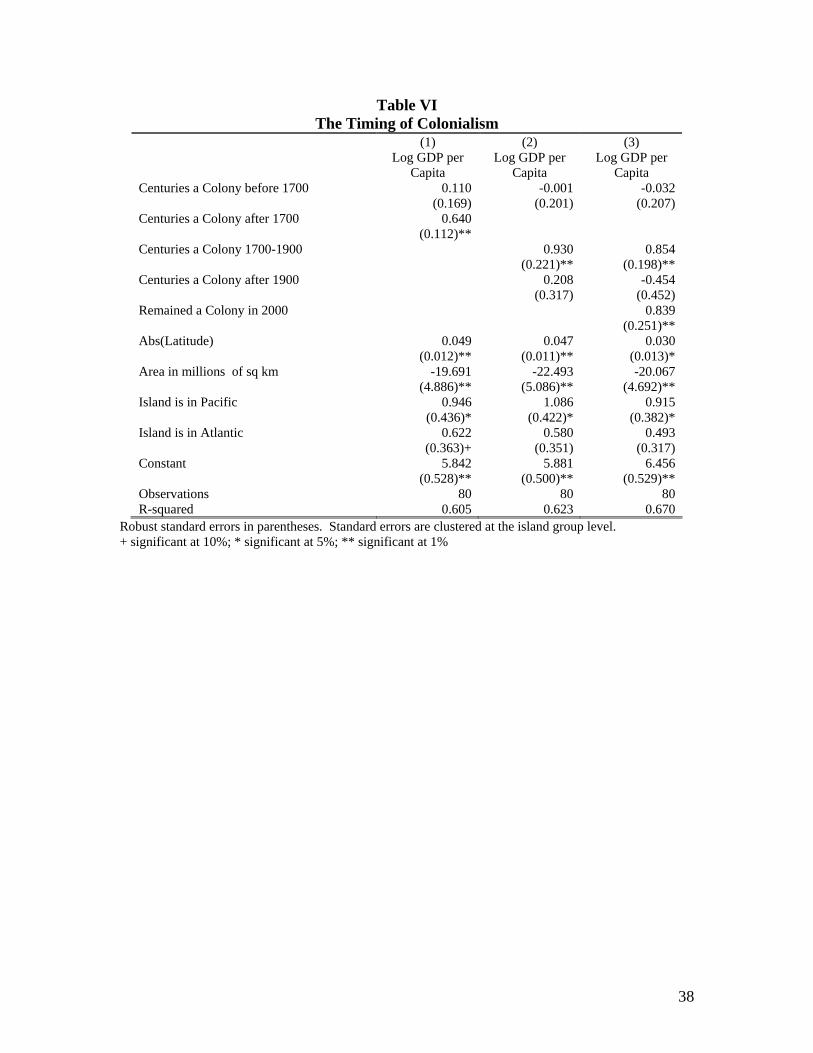
Table VI The Timing of Colonialism
(1) (2) (3) Log GDP per
Capita Log GDP per
Capita Log GDP per
Capita Centuries a Colony before 1700 0.110 -0.001 -0.032 (0.169) (0.201) (0.207) Centuries a Colony after 1700 0.640 (0.112)** Centuries a Colony 1700-1900 0.930 0.854 (0.221)** (0.198)** Centuries a Colony after 1900 0.208 -0.454 (0.317) (0.452) Remained a Colony in 2000 0.839 (0.251)** Abs(Latitude) 0.049 0.047 0.030 (0.012)** (0.011)** (0.013)* Area in millions of sq km -19.691 -22.493 -20.067 (4.886)** (5.086)** (4.692)** Island is in Pacific 0.946 1.086 0.915 (0.436)* (0.422)* (0.382)* Island is in Atlantic 0.622 0.580 0.493 (0.363)+ (0.351) (0.317) Constant 5.842 5.881 6.456 (0.528)** (0.500)** (0.529)** Observations 80 80 80 R-squared 0.605 0.623 0.670
Robust standard errors in parentheses. Standard errors are clustered at the island group level. + significant at 10%; * significant at 5%; ** significant at 1%
38

Table VII GDP and Colonialism within Non-island Developing Countries
We started with the Acemoglu-Robinson-Johnson [2001] database and added our own measure of length of colonial period. We dropped the three island countries that were in AJR and our islands database.
(1) Log GDP Per Capita
(2) Log GDP Per Capita
(3) Log GDP Per Capita
(4) Log GDP Per Capita
Number of Centuries a Colony 0.401 0.358 0.287 0.232 [0.097]** [0.090]** [0.072]** [0.084]** Abs(Latitude) 2.952 1.406 1.825 [0.883]** [0.746]+ [0.822]* Mean Temperature -0.023 -0.013 0.005 [0.023] [0.019] [0.021] Expropriation Risk 0.404 [0.067]** Log Settler Mortality (AJR) -0.403 [0.093]** Constant 7.276 7.344 4.873 9.034 [0.215]** [0.686]** [0.682]** [0.728]** Observations 64 64 64 60 R-squared 0.22 0.40 0.63 0.56
Robust standard errors in parentheses. + significant at 10%; * significant at 5%; ** significant at 1%
39

Appendix I IV First Stage Regression and Reduced Form Regression
Columns (1) and (2) are OLS. Column (1) is the first stage regression using our preferred set of instruments. We regress the islands' number of centuries as a colony on the northerly and easterly vectors of the island's prevailing wind. Column (2) is a reduced form in which we show the direct effect of wind on modern day GDP.
(1) (3) Number Of
Centuries A Colony
Log GDP Per Capita
East-West Vector Of Wind -0.265 -0.139 (0.081)** (0.066)* Monthly StDev of East-West Vector 0.885 0.260 (0.302)** (0.255) Area in millions of sq km 10.983 -16.278 (4.417)* (4.810)** Abs(Latitude) 0.020 0.060 (0.016) (0.014)** Island is in Pacific -1.684 -0.059 (0.387)** (0.514) Island is in Atlantic 0.760 0.768 (0.379)* (0.544) Constant -0.013 6.342 (0.964) (0.892)** Observations 80 80 R-Squared 0.624 0.440 F Statistic for Instruments Prob > F =
5.96.005
Robust standard errors in parentheses. Standard errors are clustered at the island group level. + significant at 10%; * significant at 5%; ** significant at 1%
40
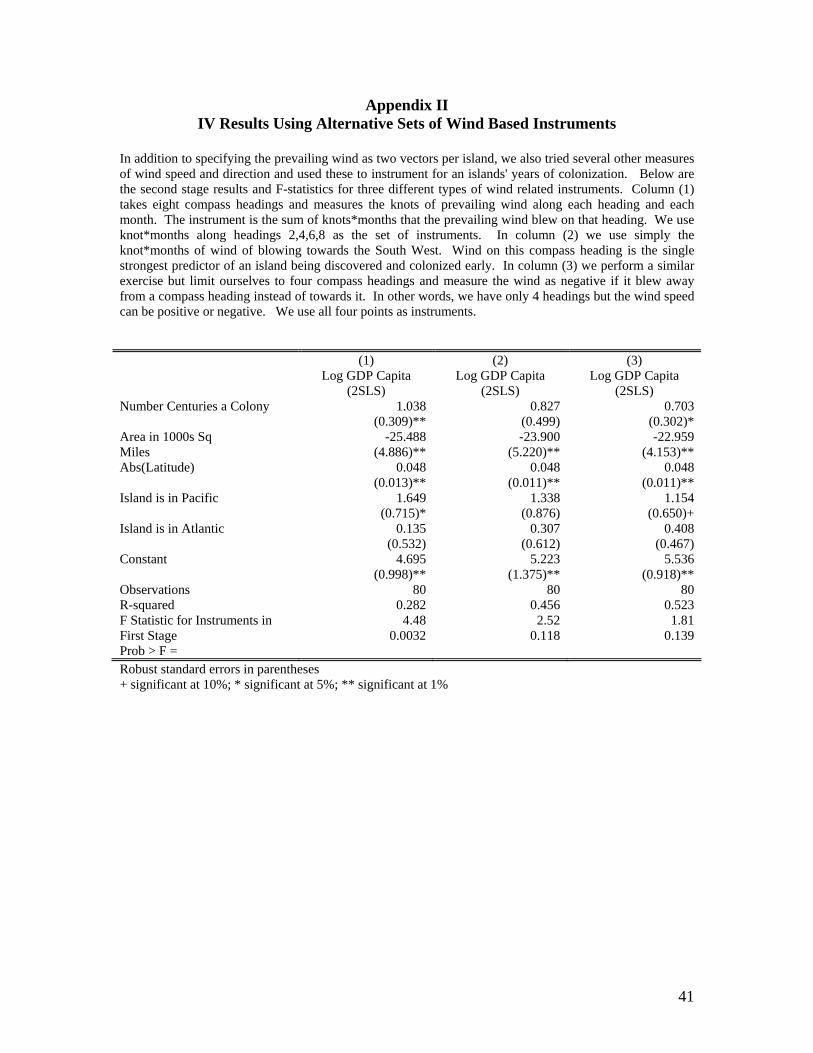
Appendix II IV Results Using Alternative Sets of Wind Based Instruments
In addition to specifying the prevailing wind as two vectors per island, we also tried several other measures of wind speed and direction and used these to instrument for an islands' years of colonization. Below are the second stage results and F-statistics for three different types of wind related instruments. Column (1) takes eight compass headings and measures the knots of prevailing wind along each heading and each month. The instrument is the sum of knots*months that the prevailing wind blew on that heading. We use knot*months along headings 2,4,6,8 as the set of instruments. In column (2) we use simply the knot*months of wind of blowing towards the South West. Wind on this compass heading is the single strongest predictor of an island being discovered and colonized early. In column (3) we perform a similar exercise but limit ourselves to four compass headings and measure the wind as negative if it blew away from a compass heading instead of towards it. In other words, we have only 4 headings but the wind speed can be positive or negative. We use all four points as instruments. (1) (2) (3) Log GDP Capita
(2SLS) Log GDP Capita
(2SLS) Log GDP Capita
(2SLS) Number Centuries a Colony 1.038 0.827 0.703 (0.309)** (0.499) (0.302)* Area in 1000s Sq -25.488 -23.900 -22.959 Miles (4.886)** (5.220)** (4.153)** Abs(Latitude) 0.048 0.048 0.048 (0.013)** (0.011)** (0.011)** Island is in Pacific 1.649 1.338 1.154 (0.715)* (0.876) (0.650)+ Island is in Atlantic 0.135 0.307 0.408 (0.532) (0.612) (0.467) Constant 4.695 5.223 5.536 (0.998)** (1.375)** (0.918)** Observations 80 80 80 R-squared 0.282 0.456 0.523 F Statistic for Instruments in First Stage Prob > F =
4.48 0.0032
2.52 0.118
1.81 0.139
Robust standard errors in parentheses + significant at 10%; * significant at 5%; ** significant at 1%
41

Appendix III List of Islands in Our Dataset
Island Group/Country Other Country Year First Sighted
Number of Years
Colonized
GDP per Capita
Aitutaki Cook Islands 1789 13 2,814 Andros, North Bahamas 1492 479 14,296 Anguilla Anguilla 1493 354 9,617 Antigua Antigua and Barbuda 1493 349 7,653 Ascension Ascension United Kingdom 1501 82 24,514 Atiu Cook Islands 1777 13 1,930 Barbados Barbados 1510 384 9,739 Bermuda Bermuda 1503 395 53,735 Bonaire Netherlands Antilles Netherlands 1499 478 15,931 Cuba Cuba 1492 389 2,535 Curacao Netherlands Antilles Netherlands 1499 492 15,931 Dominica Dominica 1493 246 3,484 East Falkland East Falkland United Kingdom 1592 231 24,514 Efate Vanuatu 1606 186 1,164 Fefan Federated States of Micronesia 1687 101 1,335 Funafuti Tuvalu 1819 62 1,204 Futuna Futuna France 1616 117 21,776 Grand Cayman Grand Cayman 1503 369 34,173 Grande Comore Comoros 1505 88 264 Grande Terre Guadeloupe 1493 376 7,900 Grenada Grenada 1498 344 3,440 Guam Guam United States 1521 443 34,364 Hispaniola DOM Dominican Republic 1492 313 3,029 Hispaniola HTI Haiti 1492 331 485 Huvadu Huvadu 1558 335 2,151 Jamaica Jamaica 1494 168 3,056 Kadavu Fiji 1789 95 2,031 Kosrae Federated States of Micronesia 1688 101 2,751 Lifou Loyalty Islands New Caldonia 1774 231 12,455 Luzon Philippines 1521 297 1,002 Mahe Seychelles 1502 220 7,764 Majuro Marshall Islands 1526 100 1,896 Malaita Solomon Islands 1568 86 791 Mangaia Cook Islands 1777 13 2,171 Mangareva Gambier Is French Polynesia 1687 124 13,955 Manihiki Cook Islands 1822 13 2,895 Martinique Martinique France 1502 226 21,776 Mauke Cook Islands 1823 13 2,493 Mauritius Mauritius 1507 359 3,839 Mayotte Mayotte France 1529 161 21,776
42

Appendix III List of Islands in Our Dataset (continued)
Island Group Other Country Year First Sighted
Number of Years
Colonized
GDP per Capita
Mitiaro Cook Islands 1823 13 2,734 Moen Federated States of Micronesia 1528 87 1,335 Montserrat Montserrat 1493 372 8,919 Nauru Nauru 1798 78 2,702 New Britain Bismarck Archipelago Papua New Guinea 1616 61 729 New Caledonia New Caledonia 1774 231 12,455 Niue Niue 1774 1 3,600 North Caicos Turks and Caicos Islands United Kingdom 1512 238 24,514 Oreor Palau 1710 120 6,076 Palmerston Cook Islands 1774 13 2,493 Penrhyn Cook Islands 1788 13 989 Pohnpei Federated States of Micronesia 1689 101 2,711 Puerto Rico Puerto Rico 1493 511 18,047 Pukapuka Cook Islands 1595 13 724 Rakahanga Cook Islands 1606 13 1,528 Rarotonga Cook Islands 1789 13 6,433 Reunion Reunion 1513 341 6,200 Rurutu Austral Islands French Polynesia 1769 236 13,955 Saba Netherlands Antilles Netherlands 1493 372 15,931 Saipan Northern Mariana Islands United States 1521 440 12,500 Sint Maartin Netherlands Antilles France 1493 356 16,000 St Croix US Virgin Islands United States 1493 250 11,868 St Eustatius Netherlands Antilles Netherlands 1493 375 15,931 St Helena St Helena United Kingdom 1502 494 24,514 St John US Virgin Islands United States 1493 250 18,012 St Kitts St. Kitts and Nevis 1493 360 8,132 St Lucia St Lucia 1500 481 4,424 St Martin Netherlands Antilles Netherlands 1493 356 21,776 St Thomas US Virgin Islands United States 1493 250 14,061 St Vincent St Vincent and the Grenadines 1498 299 2,891 Tahiti Society Islands French Polynesia 1767 208 13,955 Tahuata Marquesas French Polynesia 1595 5 13,955 Tarawa Kiribati - Line Islands 1788 66 538 Tol Federated States of Micronesia 1528 101 1,335 Tongatapu Tonga 1643 0 1,430 Tortola British Virgin Islands United Kingdom 1493 356 33,671 Trinidad Trinidad and Tobago 1498 289 6,347 Tristan da Cunha Tristan da Cunha & Gouh United Kingdom 1506 188 24,514 Tutuila American Samoa United States 1787 175 34,364 Yap Federated States of Micronesia 1686 101 2,751
43

Appendix IV GDP by Sector
This is for a subsample of islands in the database. Source is CIA World Factbook 2002, which in turn uses both UN Data and national government statistics from the relevant countries.
island ocean GDP Agriculture Industry Services Bermuda Atlantic 36 B 1% 10% 89% Grand Cayman Atlantic 1.27 B. 1% 3% 95% Jamaica Atlantic 10.21 B. 6% 24% 70% Anguilla Atlantic 104 Mill 4% 18% 78% New Britain Pacific 11.4 B. 32% 36% 32% Majuro Pacific 115 Mill 14% 16% 70% Mauritius Indian 13.85 B. 6% 33% 61% US Virgin Islands Atlantic 2.4 B. 1% 19% 80% Tongatapu Pacific 236 Mill 26% 12% 62% Pohnpei Pacific 277 Mill 50% 4% 46% Montserrat Atlantic 29 Mill 5% 14% 81% New Caledonia Pacific 3.158 B. 5% 30% 65% Guam Pacific 3.2 B. 7% 15% 78% Cuba Atlantic 31.59 B. 8% 35% 58% British Virgin Islands Atlantic 320 Mill 2% 6% 92% St Vincent Atlantic 339 Mill 10% 26% 64% Dominica Atlantic 380 Mill 18% 24% 58% Barbados Atlantic 4.496 B. 6% 16% 78% Grenada Atlantic 440 Mill 8% 24% 68% Kadavu Pacific 5.007 B. 17% 22% 61% Martinique Atlantic 6.117 B. 6% 11% 83% Puerto Rico Atlantic 65.28 B. 1% 42% 57% Antigua Atlantic 750 Mill 4% 19% 77% Tarawa Pacific 79 Mill 30% 7% 63% Malaita Pacific 800 Mill 42% 11% 47% St Lucia Atlantic 866 Mill 7% 20% 73% Reunion Indian 9.387 B. 8% 19% 73%
44
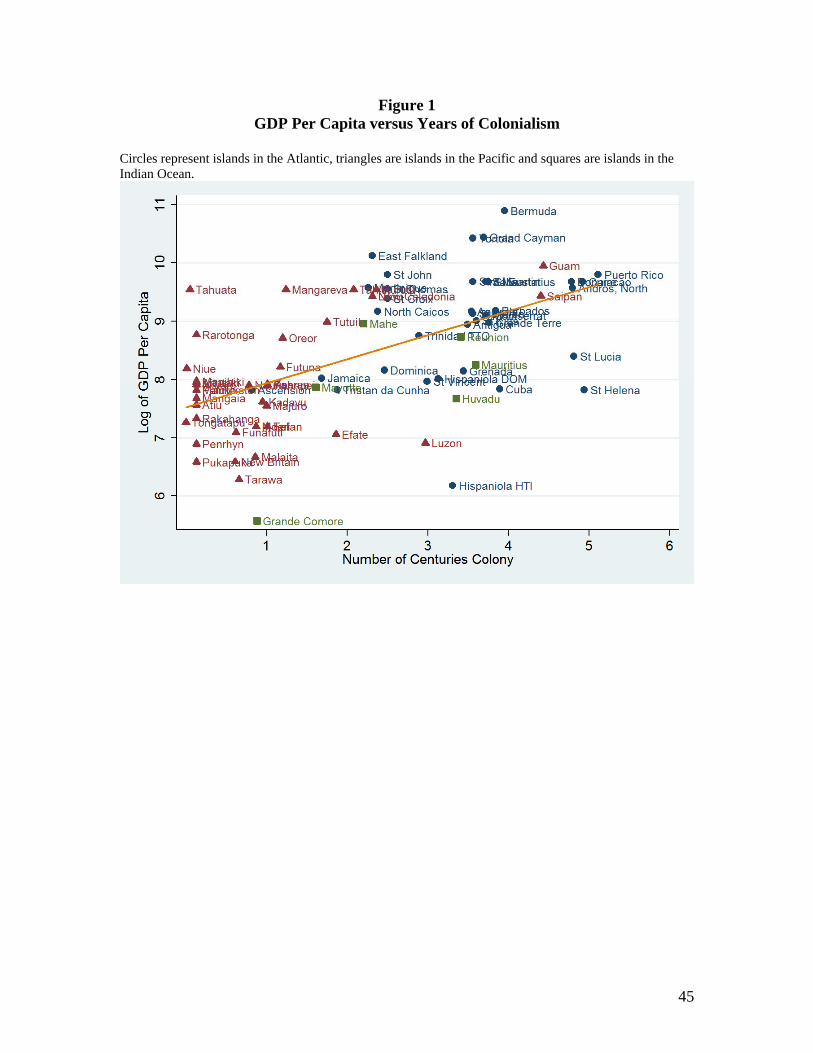
Figure 1 GDP Per Capita versus Years of Colonialism
Circles represent islands in the Atlantic, triangles are islands in the Pacific and squares are islands in the Indian Ocean.
45

Figure 2 Years of Colonialism Versus Easterly Vector of Wind
Circles represent islands in the Atlantic, triangles are islands in the Pacific and squares are islands in the Indian Ocean.
46