2 between el niño and la niña? - noaa earth … 1 what is responsible for the strong observed...
TRANSCRIPT

1
What is Responsible for the Strong Observed Asymmetry in Teleconnections 1
Between El Niño and La Niña? 2
Tao Zhang1,2, Judith Perlwitz1,2, and Martin P. Hoerling2 3 4 1Cooperative Institute for Research in Environmental Sciences 5
University of Colorado 6
Boulder, Colorado 7
2NOAA Earth System Research Laboratory 8
Physical Sciences Division 9
Boulder, Colorado 10
(Submitted to Geophysical Research Letters) 11 12
Accepted on January 20, 2014 13
Corresponding author address: 14
Dr. Tao Zhang 15
NOAA/ESRL/PSD 16
325 Broadway, R/PSD1 17
Boulder, CO 80305 18
Email: [email protected] 19
20

2
Abstract 21 22 A large asymmetric component (El Niño+La Niña) of ENSO-related teleconnections over 23
North America is found during 1984-2009 that is comparable in strength to the 24
commonly studied symmetric component (El Niño – La Niña). Climate reforecasts 25
spanning this period are diagnosed in order to understand the processes responsible for 26
the observed asymmetry. It is confirmed that an asymmetric component is indeed a 27
fundamental property of atmospheric responses to recent ENSO forcing. Each and every 28
composite of a 16-member reforecast ensemble has appreciable asymmetry in tropical 29
Pacific rainfall, upper tropospheric Pacific-North American circulation patterns, and 30
contiguous U.S. surface temperatures. There is considerable sampling variability in the 31
magnitude of this asymmetric component among individual reforecast composites. We 32
argue therefore that the true SST boundary forced signal of ENSO teleconnections is 33
likely comprised of a symmetric component having greater magnitude than its 34
asymmetric component, though the latter is an important property of how ENSO affects 35
North American climate. 36
37
3
1. Introduction 38
Neither the tropical Pacific oceanic expression nor the accompanying atmospheric 39
teleconnections of El Niño–Southern Oscillation (ENSO) are mirror images of each other 40
[e.g. Hoerling et al. 1997, 2001; Monahan and Dai 2004; Wu et al. 2005; Hannachi et al. 41
2003; An and Jin 2004; Zhang et al. 2011]. Given that ENSO is the primary source of 42
U.S. seasonal forecast skill [e.g. Quan et al. 2006], it is of predictive value to better 43
understand these higher-order characteristics. It is likewise important to assess 44
sophisticated dynamical forecast systems, and evaluate their ability to reproduce the 45
observed cold and warm event impact patterns and not just linear regression modes of 46
such impacts [e.g. Larkin and Harrison 2002]. 47
Observational composites of the wintertime U.S. surface temperature anomalies for 48
ENSO events since the early 1980s reveal the asymmetric anomalies (El Niño+La Niña) 49
to be of comparable magnitude to the symmetric anomalies (El Niño-La Niña) (see 50
Figure 1). Here we explore the factors responsible for such strong asymmetry. Energy 51
balance studies have revealed the physical processes undergirding the symmetric and 52
asymmetric components of observed North American ENSO-related surface temperature 53
anomalies [Zhang et al. 2011]. Likewise, process studies have argued that the observed 54
North American surface asymmetric component of ENSO impacts are physically 55
reconcilable with asymmetries in atmospheric circulation anomalies [e.g. Wu et al. 2005]. 56
The fundamental question of what is responsible for the large magnitude of observed 57
asymmetry in teleconnections between El Niño and La Niña remains open, however. 58
The current study utilizes a new historical reforecast data set of dynamical seasonal 59
predictions for the period 1984-2009 generated by the National Center’s for 60
4
Environmental Prediction (NCEP) Climate Forecast System (CFS) version 2 [Saha et al. 61
2013]. Using initialized short lead predictions, and applying resampling strategies that 62
take advantage of the large ensembles, we derive statistical distributions of symmetric 63
and asymmetric components of teleconnection patterns. These permit a separation of the 64
contributions by true SST forcing from contributions by random sampling variability, and 65
thus clarify the causes for the recent ENSO teleconnection characteristics. 66
67
2. Data and Methods 68
CFSv2 produces a set of 9-month retrospective forecasts with the model 69
initialized using observations from the CFS reanalysis [Saha et al. 2010]. In this study, 70
we employ the sixteen-member CFSv2 reforecasts with one-month lead-time of 71
individual northern winter months December, January, February from which seasonal 72
means (DJF) are determined (see auxiliary material for specific dates of initial conditions 73
used for the sixteen-member reforecasts). Kim et al. [2012] showed that CFSv2 captures 74
the main ENSO teleconnection pattern of stronger anomalies over the tropics, the North 75
Pacific and the North America, and predicts the interannual variation associated with 76
ENSO quite accurately. 77
This study focuses on the recent period 1984-2009 for which reforecasts are available. 78
Following the study of Zhang et al. [2011], we construct anomaly composites relative to 79
the reference period 1984-2000 and based on six El Niño (1986/87; 1987/88; 1991/92; 80
1994/95; 1997/98; 2002/03) winters and five La Niña (1988/89; 1995/96; 1998/99; 81
1999/2000; 2007/08) winters. 82

5
The symmetric component of the ENSO signal is determined as the difference 83
between El Niño (warm) and La Niña (cold) anomaly composites while the asymmetric 84
component is defined as the sum of El Niño and La Niña anomaly composites [Hoerling 85
et al. 1997]. The root mean square (RMS) of the asymmetric component over the region 86
of concern is used as a metric to quantify the strength of the asymmetry. A large sample 87
of composites is obtained based on the sixteen members of warm and cold composites 88
from the reforecasts by looping over independent warm and cold events drawn from 89
different model realizations. This approach allows to generate a total of 256 asymmetry 90
estimates (see auxiliary material for details). 91
For comparison with reforecasts, the following observational data sets are used: 500 92
hPa geopotential height fields from the National Centers for Environmental Prediction 93
(NCEP)–National Center for Atmospheric Research (NCAR) reanalysis [Kalnay et al. 94
1996], observed land surface temperature from the gridded land-based Climatic Research 95
Unit (CRU) temperature database (CRUTEM4) [Jones et al. 2012], SST data from the 96
Hadley Centre Sea Ice and SST (HadISST) dataset [Rayner et al. 2003], precipitation 97
from the Climate Prediction Center (CPC) Merged Analysis of Precipitation [CMAP; Xie 98
and Arkin 1997]. 99
100
3. Results 101
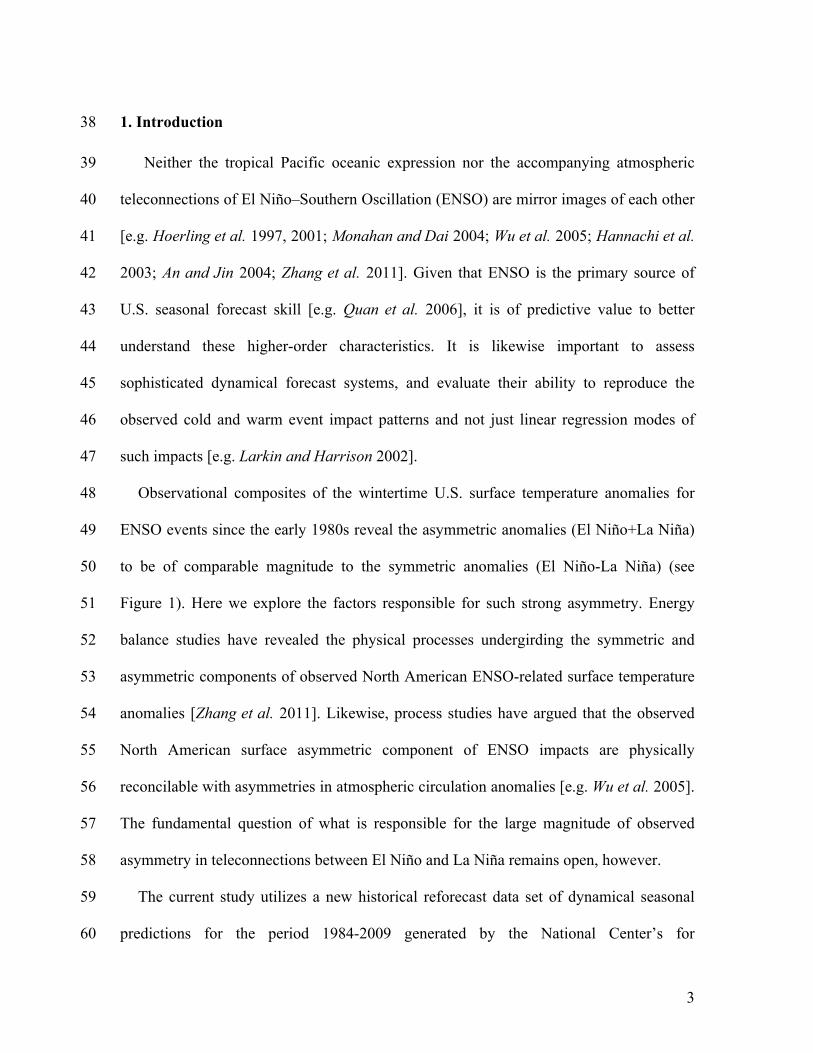
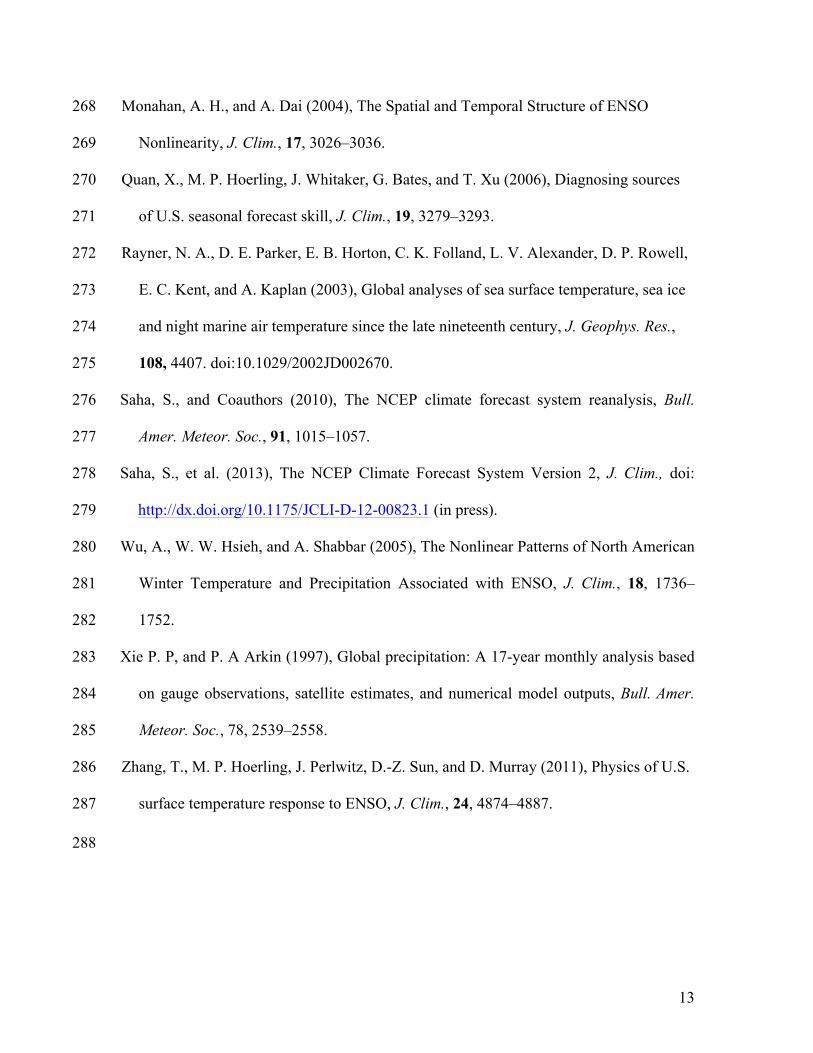
Figure 1 displays the wintertime observed asymmetric (left panel) and symmetric 102
(right panel) components of ENSO composites for 500 hPa heights (top), North 103
American surface temperature (second row), tropical Pacific SSTs (third row), and 104
tropical Pacific rainfall (bottom). Consistent with the findings of Hoerling et al. [1997] 105
6
which were based on a mostly earlier collection of ENSO cases, the composite of cases 106
during only the last quarter century also exhibits prominent asymmetry in circulation 107
anomalies over the Pacific-North American region. The symmetric component of 500 108
hPa height anomalies over the North Pacific is much stronger than the asymmetric 109
component. Over North America, each has similar magnitude and both describe high 110
pressure over central Canada. As a consequence of this latter similarity in magnitudes, 111
the strength of North American surface temperature anomalies is likewise quite similar 112
for symmetric and asymmetric composites, with each having a maximum southern 113
Canada/northern U.S. warming. The two temperature patterns are nonetheless readily 114
distinguishable from each other, with the symmetric component having a dipole structure 115
whereas the asymmetric component describes a monopole continent-wide warming. In 116
this sense, the asymmetric component appears not to be a residual of the symmetric 117
ENSO signal that might occur, for instance, if the El Niño anomalies were merely 118
stronger than the La Niña anomalies. 119
The asymmetries in the wintertime North Pacific-North American expressions of 120
ENSO impacts instead arise primarily from a phase shift between the El Niño and La 121
Niña patterns. In particular, the former has anticyclonic anomalies over central Canada 122
that reside 25° longitude east of the latter’s cyclonic anomaly (see Figure S1 in the 123
auxiliary material). This asymmetry in upper level height composites is the underlying 124
cause for the large asymmetry in North American surface temperatures as discussed in 125
detail in Zhang et al. [2011] and argued previously by Wu et al. [2005]. 126
There are several mechanisms that may be responsible for this strong observed 127
asymmetry in teleconnections between El Niño and La Niña over North America. One is 128
7
that the tropical forcing itself is asymmetrical with respect to ENSO’s extreme opposite 129
phases, as originally argued in Hoerling et al. [1997]. The lower panels of Figure 1 130
indeed reveal that the El Niño and La Niña SST composites are not symmetric. There is a 131
spatial phase shift in the SST anomalies themselves, with warming (cooling) during El 132
Niño (La Niña) being greater in the eastern (western) equatorial Pacific (see Figure S1). 133
Likewise, equatorial Pacific rainfall anomalies, which constitute the immediate forcing 134
for the atmospheric teleconnections themselves, are not symmetric (Figure 1, bottom). In 135
this sense, the asymmetric component of extratropical teleconnections could be 136
reconciled with a multi-linearity of atmospheric circulation responses (i.e. different 137
teleconnections are each linearly related to different patterns of ENSO forcing) which are 138
phase shifted owing to displacements in their SST and atmospheric convective forcings. 139
Another factor may involve inherent nonlinearity in the atmosphere itself, as 140
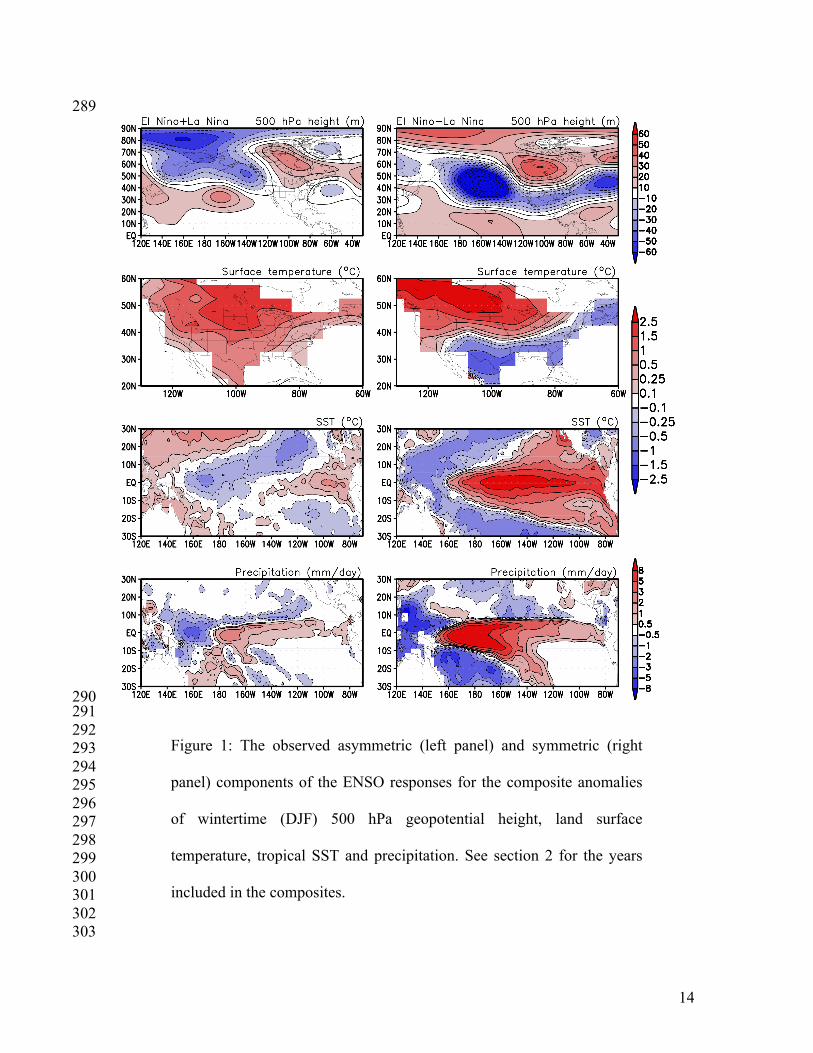
demonstrated in idealized atmospheric model simulations of Lin and Derome [2004] who 141
argued that asymmetry in teleconnection responses can result from the large 142
modifications in the basic state. 143
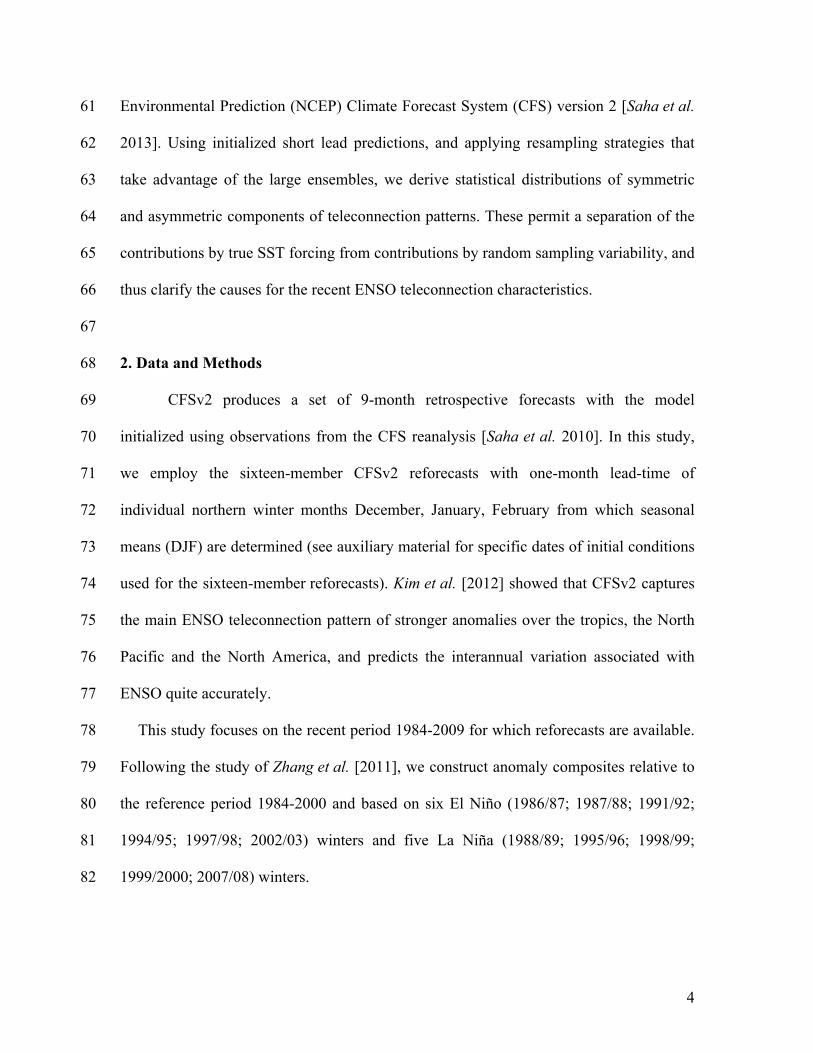
A further factor, addressed herein, is sampling variability. First, we verify that the 144
CFSv2 reforecasts are suitable tools, and show that the ensemble mean ENSO composites 145
for events during 1984-2009 for 500 hPa teleconnections, surface temperature responses, 146
and patterns of tropical forcing compare favorably with observational counterparts (see 147
Figure S2). Next, we diagnose the asymmetric (left panels) and symmetric (right panels) 148
responses of the ensemble mean reforecasts (Figure 2). The symmetric component is 149
remarkably similar to its observational counterpart, while the modeled asymmetric 150
component is much weaker than observed, primarily in the extratropics (see Figure 1). 151
8
Over the North Pacific and North American regions, the weaker asymmetry in this 152
ensemble of model reforecasts is principally due to a reduced phase shift between El 153
Niño and La Niña 500 hPa teleconnections compared to that observed (see Figure, S2). 154
Yet, the asymmetry in the model’s tropical forcing, including its predicted SSTs and 155
rainfall, are as large as those observed (cf. Figures 1 and 2). Therefore, an appreciable 156
component of the strong observed asymmetry in teleconnections between El Niño and La 157
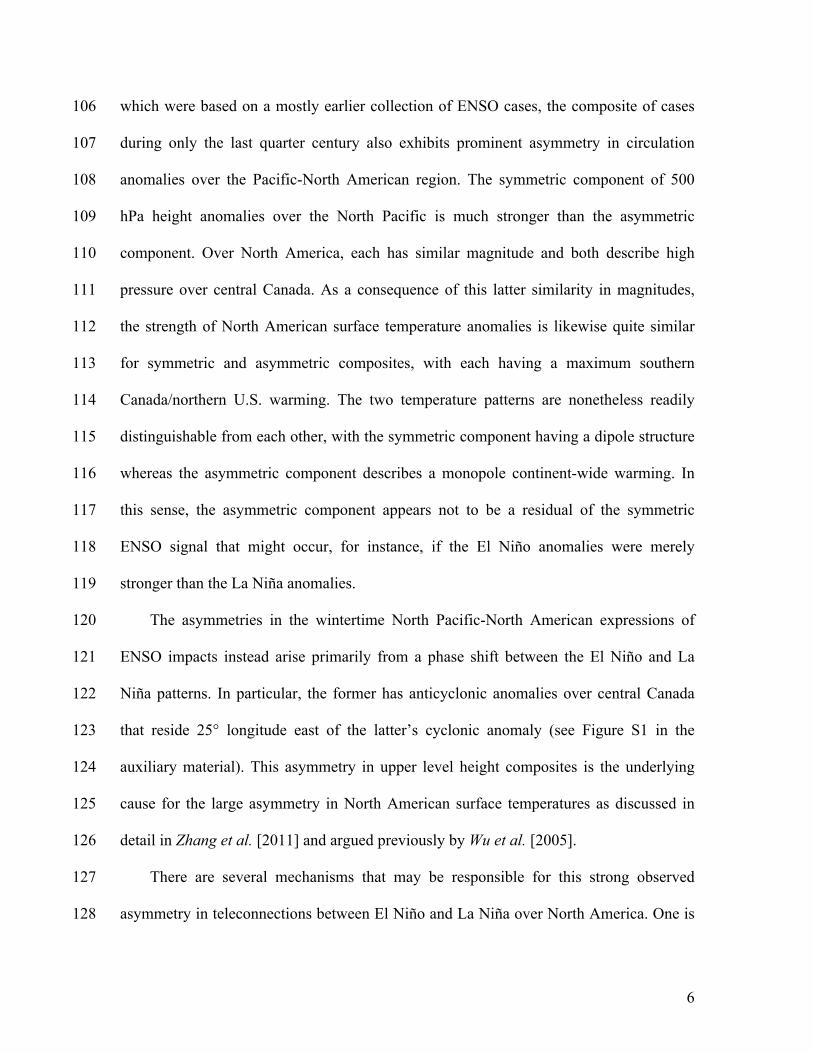
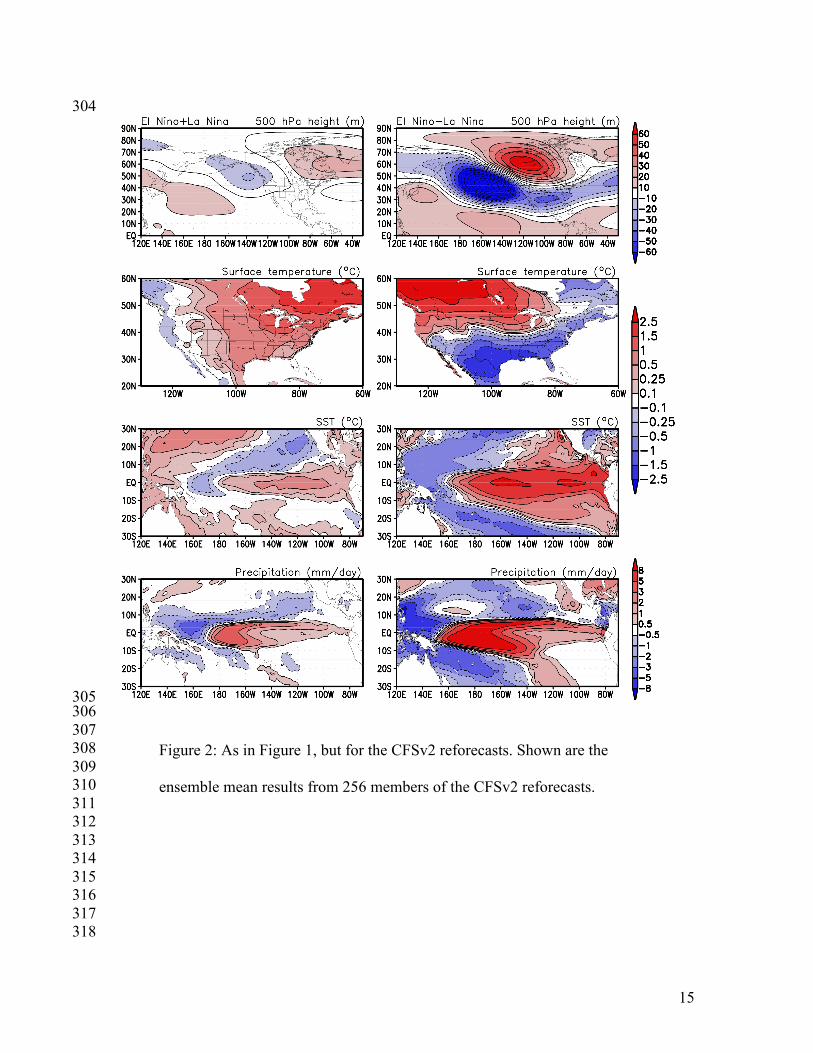
Niña may be entirely unrelated to forcing. To address the sampling variability in ENSO 158
composites, the individual reforecasts for 1984-2009 are resampled yielding a 256 sample 159
size of composites. We have verified that each of these samples has virtually identical 160
composite SSTs, and thus the variability in atmospheric composites among them stems 161
from random variability. Figure 3 displays the scatter of root mean square (RMS) values 162
in asymmetric components of Pacific-North American 500 hPa heights versus 163
asymmetric components in U.S. surface temperatures for the individual reforecast 164
composites. All samples have asymmetry, indicating that asymmetry is a fundamental 165
property of atmospheric responses to recent ENSO forcing. There is nonetheless 166
considerable spread among the samples, with RMS values of the asymmetry in surface 167
temperature ranging from 0.5oC to 2.3oC, while that of the 500 hPa heights ranges from 168
10m to 32m. Furthermore, there is a positive correlation (0.61) between the RMS values 169
of 500 hPa heights and surface temperature indicating that the asymmetry in the 170
circulation over the PNA region significantly drives asymmetry in North American 171
surface temperatures. 172
The observed asymmetric values (red square in Figure 3) reside within the 173
distribution of model samples, with many reforecast composites having weaker 174
9
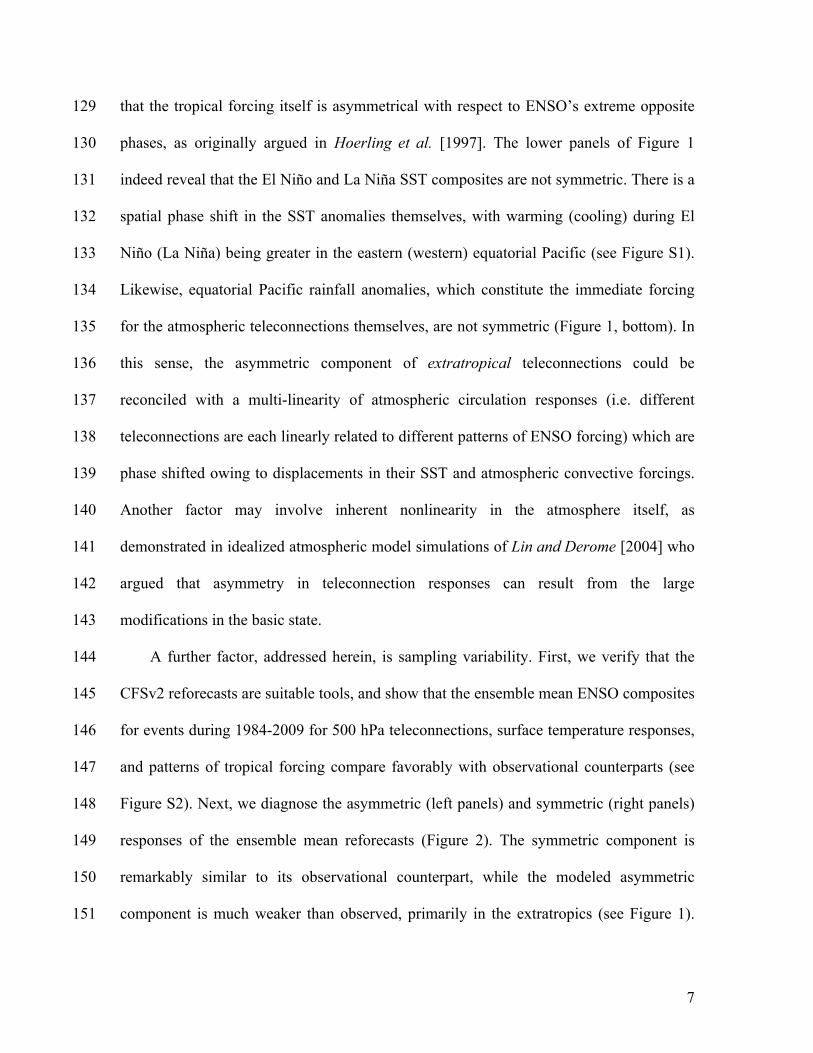
asymmetry and some having stronger asymmetry. To illustrate the spatial pattern of 175
climate anomalies for the extremes in this reforecast distribution, Figure 4 shows the 176
asymmetric component of 500 hPa height and North American surface temperature based 177
on an average of extreme weak and strong asymmetry samples (blue and red closed 178
circles in Figure 3, respectively). It is clear that the strong asymmetry subset (right 179
panels) is in closer agreement to observations (see Figure 1) than the weak asymmetry 180
subset (left panels). The comparison between these two subsets further demonstrates that 181
the stronger asymmetry in 500 hPa circulation drives a stronger asymmetry in North 182
American surface temperature, consistent with a positive correlation noted earlier (Figure 183
3). Finally, we note that while there are substantial differences in the asymmetric 184
component of extratropical climate impacts among these model subsets, differences in 185
asymmetric components of their tropical Pacific SST forcing (as well as global SSTs) are 186
negligible (not shown). Indicated hereby is the large internal variability in asymmetry of 187
ENSO’s extratropical teleconnections. 188
189 4. Summary and discussion 190
The present study provides modeling evidence that an asymmetric component of 191
wintertime ENSO teleconnections (El Nino+La Nina) over North America is a 192
fundamental feature of recent events. In particular, analysis of reforecast experiments 193
indicates that substantial portions of the central U.S. and eastern U.S. experience warm 194
winters during both El Niño and La Niña events, and that the asymmetric component of 195
North American temperatures overall is generally a warming pattern. The large 196
magnitude of the recent observed North American temperature asymmetry during ENSO 197
is not due to forcing alone, however, as indicated by the considerable sampling variability 198

10
found among ensemble members of the reforecasts. The observed composites of 6 El 199
Niño and 5 La Niña events are thus not pure indications of the asymmetric component of 200
forced signals associated ENSO extreme phases, and atmospheric noise unrelated to 201
boundary forcing can, and likely has, exerted appreciable influence. 202
Reforecast experiments further reveal that asymmetry in mid-tropospheric 203
circulation is the key driver for asymmetry in North American surface temperature 204
patterns during ENSO, with stronger circulation asymmetry driving stronger surface 205
temperature asymmetry as previously argued from empirical studies [e.g. Hoerling et al. 206
1997; Wu et al. 2005; Zhang et al. 2011]. The correlation between the two variables is 207
about 0.6, suggesting that other mechanisms besides the upper tropospheric 208
teleconnection asymmetry may also contribute to ENSO related North American surface 209
temperature asymmetry. For instance, ENSO-related U.S. surface energy calculations 210
reveal an important wintertime effect of snow cover [e.g. Zhang et al. 2011], anomalies 211
of which can sometimes arise from a single storm and thus be uncorrelated with seasonal 212
mean 500 hPa heights. 213
We do not expect that climate variations on decadal and longer time scales 214
significantly affect the present results due to the following reasons. First, the anomalies 215
are computed relative to the climatology over the recent period of reference. Second, 216
observational estimates of ENSO asymmetry in North American surface temperature over 217
several previous periods (1879-1908; 1909-1950; 1951-1983) are within the sampling 218
variability determined from the CFSv2 reforecast ensemble over the 1984-2009 period 219
(not shown). 220
11
The physics of the effect of SST forcing on teleconnection asymmetry is not 221
addressed in this study. Future research will attempt to determine whether the 222
teleconnection asymmetry is owing to some fundamental nonlinearity in the atmospheric 223
response to warm versus cold states of the tropical Pacific, or owing to a multi-linearity 224
in atmospheric responses to SST forcings that are somewhat different during El Niño and 225
La Niña. It is evident, however, that as a consequence of the fundamental nonlinearity in 226
ENSO’s extratropical impacts, multi-decadal warm (or cold) periods could arise solely 227
from fluctuations in ENSO variance, with enhanced variance (such as has occurred in the 228
last several decades) contributing to a residual warming of North America. Quantifying 229
this effect, and comparing to the signal of anthropogenic forcing, will require additional 230
study. 231
232
233
Acknowledgments 234
The support offered by the NOAA Climate Program Office Modeling, Analysis, 235
Predictions and Projections (MAPP) Program under grant GC11-300 is gratefully 236
acknowledged. We thank two anonymous reviewers for their helpful comments. 237
238 239
240
241
242
243
244
12
References 245
An, S-I., and F-F. Jin (2004), Nonlinearity and asymmetry of ENSO, J. Clim.,, 17, 2399–246
2412. 247
Hannachi, A., D. Stephenson, and K. Sperber (2003), Probability-based methods for 248
quantifying nonlinearity in the ENSO, Climate Dyn, 20, 241–256. 249
Hoerling M. P., A. Kumar, and M. Zhong (1997), El Niño, La Niña, and the nonlinearity 250
of their teleconnections, J. Clim., 10, 1769–1786. 251
Hoerling, M., A. Kumar, and T. Xu (2001), Robustness of the nonlinear climate response 252
to ENSO's extreme phases, J. Clim., 14, 1277–1293. 253
Jones, P.D., Lister, D.H., Osborn, T.J., Harpham, C., Salmon, M. and C.P. Morice 254
(2012), Hemispheric and large-scale land surface air temperature variations: an 255
extensive revision and an update to 2010, J. Geophys. Res., 256
doi:10.1029/2011JD017139. 257
Kalnay, E., et al. (1996), The NCEP/NCAR 40-year reanalysis project, Bull. Am. 258
Meteorol. Soc., 77, 437–471. 259
Kim H.-M., P. J. Webster, and J. A. Curry (2012), Seasonal prediction skill of ECMWF 260
System 4 and NCEP CFSv2 retrospective forecast for the Northern Hemisphere 261
Winter, Clim. Dyn., 39, 2957-2973, doi:10.1007/s00382-012-1364-6. 262
Larkin, Narasimhan K., and D. E. Harrison (2002), ENSO Warm (El Niño) and Cold (La 263
Niña) Event Life Cycles: Ocean Surface Anomaly Patterns, Their Symmetries, 264
Asymmetries, and Implications, J. Clim., 15, 1118–1140. 265
Lin, H., and J. Derome (2004), Nonlinearity of the Extratropical Response to Tropical 266
Forcing, J. Clim., 17, 2597–2608. 267
13
Monahan, A. H., and A. Dai (2004), The Spatial and Temporal Structure of ENSO 268
Nonlinearity, J. Clim., 17, 3026–3036. 269
Quan, X., M. P. Hoerling, J. Whitaker, G. Bates, and T. Xu (2006), Diagnosing sources 270
of U.S. seasonal forecast skill, J. Clim., 19, 3279–3293. 271
Rayner, N. A., D. E. Parker, E. B. Horton, C. K. Folland, L. V. Alexander, D. P. Rowell, 272
E. C. Kent, and A. Kaplan (2003), Global analyses of sea surface temperature, sea ice 273
and night marine air temperature since the late nineteenth century, J. Geophys. Res., 274
108, 4407. doi:10.1029/2002JD002670. 275
Saha, S., and Coauthors (2010), The NCEP climate forecast system reanalysis, Bull. 276
Amer. Meteor. Soc., 91, 1015–1057. 277
Saha, S., et al. (2013), The NCEP Climate Forecast System Version 2, J. Clim., doi: 278
http://dx.doi.org/10.1175/JCLI-D-12-00823.1 (in press). 279
Wu, A., W. W. Hsieh, and A. Shabbar (2005), The Nonlinear Patterns of North American 280
Winter Temperature and Precipitation Associated with ENSO, J. Clim., 18, 1736–281
1752. 282
Xie P. P, and P. A Arkin (1997), Global precipitation: A 17-year monthly analysis based 283
on gauge observations, satellite estimates, and numerical model outputs, Bull. Amer. 284
Meteor. Soc., 78, 2539–2558. 285
Zhang, T., M. P. Hoerling, J. Perlwitz, D.-Z. Sun, and D. Murray (2011), Physics of U.S. 286
surface temperature response to ENSO, J. Clim., 24, 4874–4887. 287
288
14
289
290 291 292 293 294 295 296 297 298 299 300 301 302 303
Figure 1: The observed asymmetric (left panel) and symmetric (right
panel) components of the ENSO responses for the composite anomalies
of wintertime (DJF) 500 hPa geopotential height, land surface
temperature, tropical SST and precipitation. See section 2 for the years
included in the composites.
15
304
305 306 307 308 309 310 311 312 313 314 315 316 317 318
Figure 2: As in Figure 1, but for the CFSv2 reforecasts. Shown are the
ensemble mean results from 256 members of the CFSv2 reforecasts.
16
319
320 321 322 323 324 325 326 327 328 329 330 331 332 333 334 335 336 337 338 339 340 341 342 343 344
Figure 3: The relationship between the root mean square (RMS) of the
asymmetry in DJF 500 hPa height over the Pacific-North America region
(120oE-60oW, 30oN-75oN) and the root mean square of the asymmetry in
DJF land surface temperature over the North America (130oW-60oW,
20oN-60oN). The closed circles correspond to 256 members of the CFSv2
reforecasts, and the red (blue) closed circles indicate the members that have
the top (bottom) three RMS values of the asymmetry in DJF 500 hPa
height and are obtained by independent warm and cold events. The
observational values are indicated by the red square. Inset value is for the
correlation based on 256-member CFSv2 reforecasts.

17
345
346 347 348 349 350 351 352 353 354 355 356 357 358 359 360 361 362 363 364 365
Figure 4: The spatial pattern of the asymmetry in (a) 500 hPa height and (b)
land surface temperature from the ensemble mean of three members with
small RMS values of the asymmetry in DJF 500 hPa height (indicated by
blue closed circles in Figure 3). The corresponding results for the ensemble
mean of three members with large RMS values (indicated by red closed
circles in Figure 3) are shown in the right panel (c~d) respectively.
The auxiliary material for
What is Responsible for the Strong Observed Asymmetry in Teleconnections
Between El Niño and La Niña?
Tao Zhang, Judith Perlwitz, and Martin P. Hoerling
1) The specific dates of initial conditions used for the sixteen-member CFSv2 reforecasts: We use the sixteen-member CFSv2 reforecasts with one-month lead-time of individual
northern winter months December, January, February for the period 1984-2009. In detail
the sixteen-member December reforecasts are taken from the model runs initialized four
times daily (00Z, 06Z, 12Z, 18Z) on the following four days: November 12, November
17, November 22, and November 27. The sixteen-member January reforecasts are taken
from the model runs initialized four times daily (00Z, 06Z, 12Z, 18Z) on the following
four days: December 12, December 17, December 22, and December 27. The sixteen-
member February reforecasts are taken from the model runs initialized four times daily
(00Z, 06Z, 12Z, 18Z) on the following four days: January 11, January 16, January 21,
and January 26.
2) Details for the generation of the 256 asymmetry estimates: There are sixteen runs (R1 to R16) available for the period from 1984 to 2009. From each
run a cold (C1 to C16) and warm (W1 to W16) ENSO composite is determined using the
six El Niño (1986/87; 1987/88; 1991/92; 1994/95; 1997/98; 2002/03) winters for the
warm composite and the five La Niña (1988/89; 1995/96; 1998/99; 1999/2000; 2007/08)
winters for the cold composite, respectively. An asymmetry estimate is calculated as the
sum of a warm and cold composite (W+C). For each of the sixteen independent warm
composites (W1 to W16), sixteen asymmetry composites can be calculated by utilizing
the sixteen cold composites as follows: W1+C1,...,W1+C16,…,W16+C1,…,W16+C16)
This approach provides a total number of 256 (16x16) asymmetry estimates.
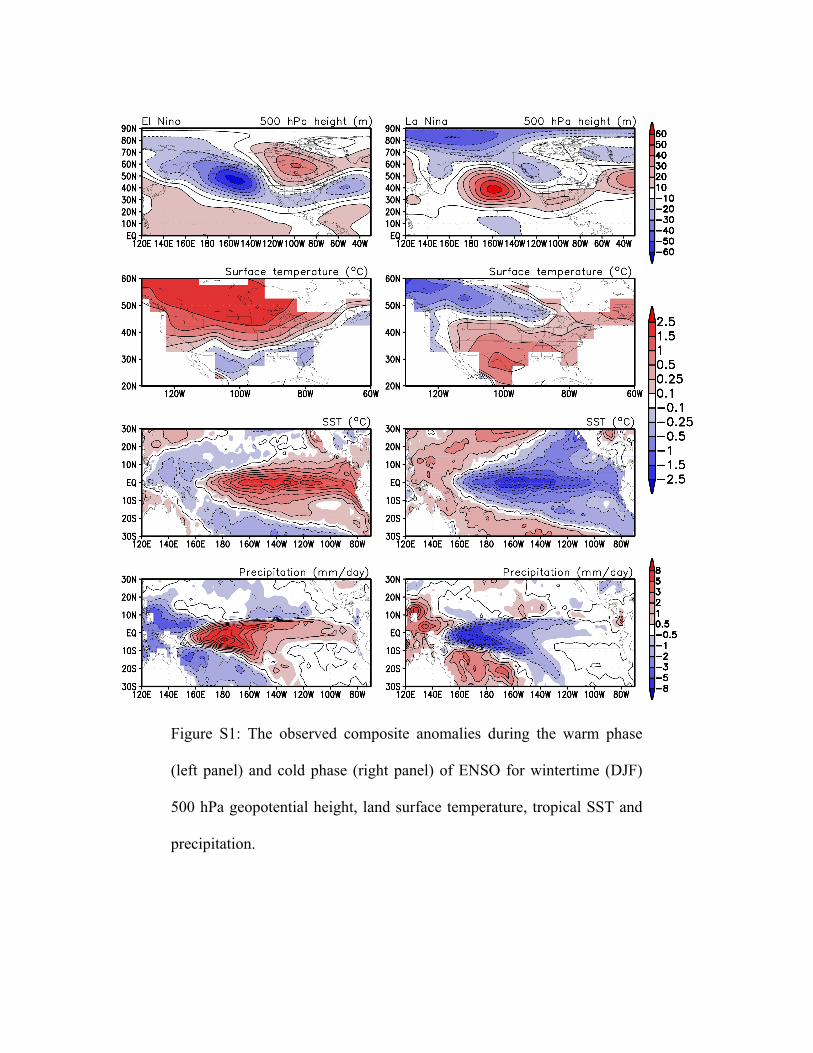
Figure S1: The observed composite anomalies during the warm phase
(left panel) and cold phase (right panel) of ENSO for wintertime (DJF)
500 hPa geopotential height, land surface temperature, tropical SST and
precipitation.
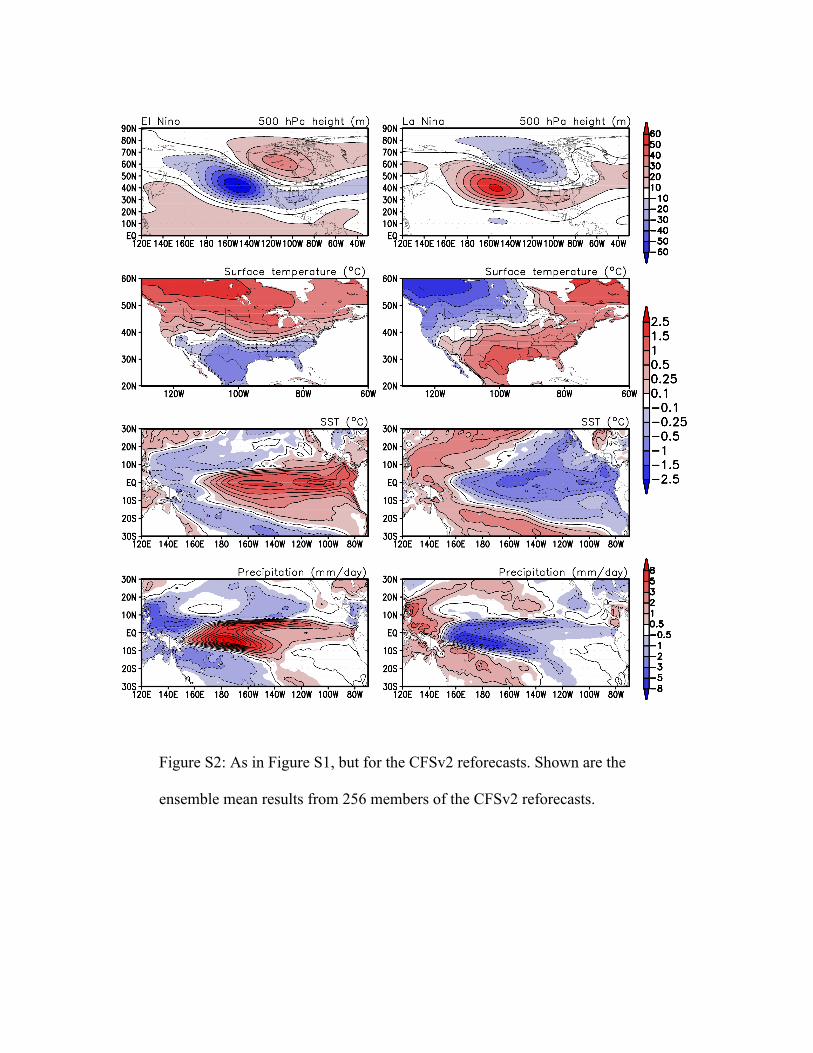
Figure S2: As in Figure S1, but for the CFSv2 reforecasts. Shown are the
ensemble mean results from 256 members of the CFSv2 reforecasts.