el niño la niña a modern day plague
TRANSCRIPT

El Niño/La Niña
A Modern Day Plague

Introduction
One thing in our daily lives which affects us and can dramatically change our outlook is the weather.Optimistic plans for a day at the beach can turn bad in a matter of thirty minutes as an afternoonthunderstorm rolls in off the Atlantic Ocean. A rainy day can be brightened by breaking clouds and sunshine.These are just small scale weather processes which can happen anytime.
However, when an El Niño occurs the results are much more devastating to the individuals that feel theaffects. Hundreds of thousands can loose their lives and billions of dollars are involved.Flash floods can rip down mountain sides swallowing unsuspecting villages and their residents in a matterof seconds. Malaria outbreaks from mosquitoes congregating around the left over stagnant pools of water can kill innocent infants. Families can parish from starvation and malnutrition because severe droughtshave decimated the seasons crops. Category five hurricanes can shred coastal cities like thin paper with150 mph winds and twenty-five foot storm surges taking peoples homes, cars, boats and lives in theprocess. Miles of beautiful enchanting coral communities thriving with color and life can be bleachedand drained of life by relentless pools of water reaching 90°F.Persistent physical oceanographic processes which span hundreds of miles along coastalregions, come to an abrupt and almost total halt. Fisherman go home with empty nets and pockets for months because their lone source of income has migrated to find cooler more productivewaters.
The following presentation is to inform you about the El Niño phenomenon and the effects whichaccompany this still not understood global event.

Normal ConditionsSun heats the ocean surface in western Pacific by Australia &
Indonesia, causing hot, moist air to rise creating low pressure on the ocean surface. Moist air rises, cools and falls in the form of precipitation. Parts in this area receive more than 330 inches of rain a year.
The now drier air is pushed east across the Pacific by upper atmosphere winds becoming cooler and more dense. Air eventually sinks creating high pressures off the west coast of the Americas.
Water is then pushed by trade winds back toward Australia & Indonesia, causing hot water to pile up in this area.
NGM 81

The El Niño Phenomenon
El Niño is a temporary warming of the eastern Pacific Ocean.For reasons unknown westerly flowing trade winds which cool the Pacific weaken and warm western water creeps east toward South America.Without the trade winds pushing the water west, surface
temperatures in the eastern Pacific increase and the water expands. Eventually deep convection occurs and moist surface air blast into the atmosphere, causing large amounts of rain in the western Americas.
NGM-74

The effects of El NiñoA severe El Niño causes the displacement of atmospheric pressure cells and affects weather over large
areas of the earth. In the 1982-83 El Niño the polar jet stream dropped southward over the Pacific Oceancausing unusually dry conditions to Hawaii and a strong low pressure system to the Gulf of Alaska which resulted in strong winds and lots of rain for the western coast of the United States.Heavy rains creep in towards Ecuador, Peru and Polynesia due to the convergence of northern and southern
trade winds (NGM 99). Draught visited Australia, southeast Africa, southern India and Indonesia dueto the cooling of the southwestern Indian Ocean, which strengthens a high pressure area keeping rain
fall from the reaching these areas. 600,000 people died in one region of India due to an epic draught in the 1789-93 El Niño (NGM 99).
In the 1982-83 El Niño, the worst on record, ocean temperatures off Peru rose 7° C above normal causingtropical marine species to migrate north as far as the Gulf of Alaska. Also, the number of North Atlantichurricanes making land fall was drastically reduced because a stronger subtropical jet stream shears offtheir tops prohibiting a westbound disaster coarse.
The 1991-92 El Niño delivered heavy winter rains o southern California and the U.S. Gulf Coast, andmild, low precipitation winter to the coastal regions of Oregon and Washington. The polar jet steam’s southern migration over the northern states also caused heavy snow in New England and Canada. (Duxbury and Duxbury 97)
Coral bleaching was frequent in Australia’s Great Barrier Reef because of high sea temperatures. Coral bleaching occurs when the coral tissue expels its zooxanthellae, a symbiotic algae,which lives in the structure of the coral essentialto its survival.
http://www.ogp.noaa.gov/misc/coral/coralit.html

http://www.nnic.noaa.gov/products/special_summaries/97_3/fig1.gif

Physical, Biological and Chemical responses to El Niño
Rain decreases the salinity of the coastal waters, where upwelling has stopped.Cool nutrient-rich upwelling waters off the coast of Peru are blockedby a 500 ft deep pool of warm water. This causes the anchovypopulation of Peru to migrate south for better conditions.
http://ww2010.atmos.uiuc.edu/(Gh)/guides/mtr/eln/upw.rxmlUniversity of Illinois
A deeper thermocline often observed during El Niño years limits the amount of nutrients brought to shallower depths by upwelling process, decreases the
years fish crop.Ekman transport causes water to be transported90° to the left of wind in the Southern Hemisphereand 90° to the right of wind in the Northern Hemisphere

Carbon Dioxide Flux
The surface waters of the central and eastern Equatorial Pacific contain high partial pressure of CO2.The Equatorial upwelling of this area is the atmosphere’s largest source of CO2, supplying about0.7 to 1.5 Pg(1015). This is four times as much as all the other oceanic regions combined.
El Niño produces large inter-annual effects on ocean-atmosphere CO2 exchange.Non-El Niño years supply a higher flux of carbon out of the ocean than when there is mature El Niño.The high CO2 fluxes in non -El Niño years of 1995-96 were the result of increased surface waterpCO2 and higher winds. The Equatorial Undercurrent (EUC) was closer to the surface in 1995-96 andupwelling supplied the higher pCO2 found in the surface waters. During the El Niño years of 1997-98 the winds and EUC were weak and the supply of pCO2 is lower .
In the same equatorial region, data shows that during two separate one year periods in 1995-96 and1997-98 the release of C as CO2 into the atmosphere was 0.7 Pg (1015) less in the El Niño year during97-98.Fluxes from buoy-measured ∆ pCO2 and winds were also calculated. It showed mature El Niñophase averaged 0.2 mol of C m-2year -1 into the ocean and post El Niño phase ranged
from 2 to6 mol of C m-2year -1 into the ocean (Science 99).
This information suggests that El Niño causes a drastic change in the flux of carbon dioxide in the centraleastern equatorial regions. This reduction of carbon dioxide in turn affects the productivity of this area.
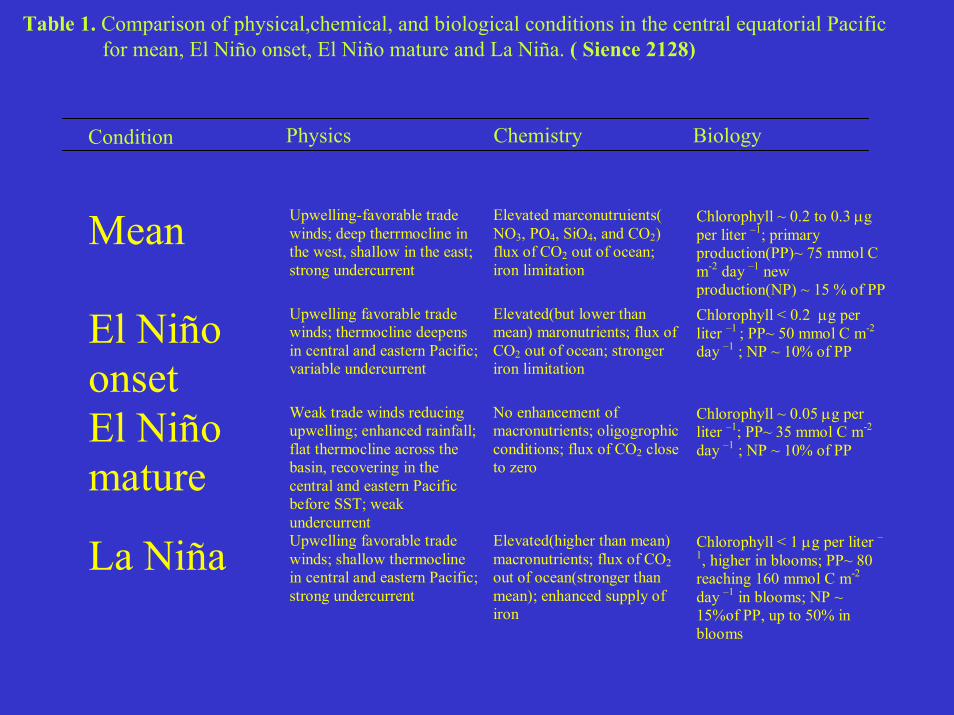
Table 1. Comparison of physical,chemical, and biological conditions in the central equatorial Pacificfor mean, El Niño onset, El Niño mature and La Niña. ( Sience 2128)
Physics Chemistry BiologyCondition
Mean Upwelling-favorable tradewinds; deep therrmocline inthe west, shallow in the east;strong undercurrent
Elevated marconutruients(NO3, PO4, SiO4, and CO2)flux of CO2 out of ocean;iron limitation
Chlorophyll ~ 0.2 to 0.3 µgper liter –1; primaryproduction(PP)~ 75 mmol Cm-2 day –1 newproduction(NP) ~ 15 % of PP
El Niñoonset
Upwelling favorable tradewinds; thermocline deepensin central and eastern Pacific;variable undercurrent
Elevated(but lower thanmean) maronutrients; flux ofCO2 out of ocean; strongeriron limitation
Chlorophyll < 0.2 µg perliter –1 ; PP~ 50 mmol C m-2
day –1 ; NP ~ 10% of PP
El Niñomature
Weak trade winds reducingupwelling; enhanced rainfall;flat thermocline across thebasin, recovering in thecentral and eastern Pacificbefore SST; weakundercurrent
No enhancement ofmacronutrients; oligogrophicconditions; flux of CO2 closeto zero
Chlorophyll ~ 0.05 µg perliter –1; PP~ 35 mmol C m-2
day –1 ; NP ~ 10% of PP
La Niña Upwelling favorable tradewinds; shallow thermoclinein central and eastern Pacific;strong undercurrent
Elevated(higher than mean)macronutrients; flux of CO2out of ocean(stronger thanmean); enhanced supply ofiron
Chlorophyll < 1 µg per liter –1, higher in blooms; PP~ 80reaching 160 mmol C m-2
day –1 in blooms; NP ~15%of PP, up to 50% inblooms

Southern Oscillation
The exact cause of El Niño is still unknown, but the appearance of certain weather processes have been associated with El Niño. One of such processes in Southern Ocean Oscillation (SO). During SO the atmospheric pressure increases on one side of the Pacific and decreases on the other side, and then reverses.The pressure centers occuring with this process lie over Easter Island in the eastern Pacific and Indonesiain the western Pacific. Normally there is a high pressure system over Easter Island and a low pressure system over Indonesia. East blowing trade winds are strong and consistent and upwelling occurs off of Peru’s coast. When the atmospheric pressure system weakens, the trade winds break down. Westerlywinds are formed due to tropical low pressure areas that develop over accumulated warm water nearIndonesia. Over a few months, the warm water moves east towards Peru, eventually increasing seasurface temperatures and suppressing upwelling.
The pool of warm surface water carries the overlying low- pressure zone of rising air and precipitationeastward across the Pacific, eventually resulting in heavy rains on the normally dry coastal regions of Peru.
http://www.netaxs.com/~trance/ra anui.htmlhttp://www.1000traveltips.org/Indonesia.htm

The Doldrums
The southward displacement of the inter-tropical convergence zone(downwelling), also refereed to asthe Doldrums,is another sign of El Niño. This movement of the south coincides with a lessening of
the southeast trade winds and development of a deep thermocline in the south west tropical Pacific. This southern shift occurs early in the year, when the southeast trade winds are at a minimum and sea surfacetemperatures are at a maximum. The coming of an El Niño is associated with a greater-than-averagesouthward deflection of the doldrums.By mid-summer, the El Niño effect lessons; in two to three months the surface water cools as
upwelling is reestablished in the eastern tropical Pacific. In November and December anotherslight warming is often observed; the atmospheric pressure distribution in the Southern OceanOscillation reverses again, and the trade winds return to their normal state. A severe El Niño usuallylasts about 15 months.

The La Niña Phenomenon and affects
During a La Niña event cooling of the eastern Pacific causing opposite conditions produced during an El Niño event.Westbound trade winds are intensified, pushing warm western Pacific water further west, causing more precipitation in India,Australia and southwest Africa. The polar jet stream in Canada moves south causing colder
temperatures in the southern U.S.
NGM 78

Jet Streams
The polar jet stream circles the earth in the Northern Hemisphere above the boundarybetween the polar easterlies and the westerly winds. Its is deflected north and south by the alternating air-pressure cells of the northern temperate zone (Duxbury and Duxbury 214).

The La Niña Phenomenon and affects
The subtropical jet stream, which blows across the Gulf of Mexicois weakened by a difference in atmospheric pressure systems the northeast Pacific Ocean, so draught occurs in the southwestern U.S.and the Atlantic hurricanes reaching the U.S. increaseThe 1998 La Niña hurricane season was the deadliest of the pasttwo centuries(NGM 99). Hurricane Mitch alone killed 11,000.
http://www.cpc.ncep.noaa.gov/products/outlooks/hurricane.html

Forecasting & Prediction NOAA has the primary responsibility within the Federal Governmentto provide climate forecasts to the nation and play a leadership role insponsoring El Niño observations and researchMost NOAA groups and services are in some way involved.
Climate Prediction Center is responsible for forecasting rainfall percentage and drought conditions in many countries.
Office of Global Programs funds scientific research focused onEl Niño.http://www.ogp.noaa.gov/ensoContact: Stephanie Kenitzer at (301) 713-0622
Climate Diagnostic Center explores climate variations like draught and floods and is working to a better understanding and prediction ofENSO. http://www.cdc.noaa.gov/ENSO
Contact: Barbara McGehan at (303) 497-6288
Hurricane Research Division in cooperation with academic institutionsstudies the relationship between hurricanes and climate events like El Niño.
at http://www.aoml.noaa.gov/hrd/Contact: Dane Konop at (301) 713-2483

Forecasting & Prediction
Pacific Environmental Marine Lab is responsible for installing and maintaining a network of buoys(ATLAS) in the tropical ocean which record wind temperature and currents.http://www.pmel.noaa.gov/toga-tao/el-nino/home.htmlContact: Dane Konop at (301) 713-2483
NOAA Corp maintains The Ka'imimoana, the R/V which supports a system a 70 buoys(TropicalAtmosphere- Ocean. The buoys measure wind direction and speed, temperature and humidity and temperature of the ocean at the surface and various depths to 500 meters. The buoys help scientist predictthe movement of warm water and earlier forecasting of El Niño.
http://rho.pmel.noaa.gov/atlasrt/kaimi.html .Contacts: Jeanne Kouhestani at (202) 482-6090 or Commander Tim Wright at (206) 526-6403

Current Conditions
El Niño/La Niña advisories are only issued by the Climate Prediction Center if warm or cold
condition across the Equatorial Pacific intensify. Currently the conditions are near neutral.
Weekly updates can be found @:
http://www.cpc.ncep.noaa.gov/products/analysis_monitoring/enso_update/index.html
http://www.cpc.ncep.noaa.gov/products/analysis_monitoring/lanina/

North Atlantic 2000 Hurricane Season
The National Oceanic and Atmospheric Administration's Climate Prediction Center, National HurricaneCenter and Hurricane Research Division has came to a consensus that there would be above average overall hurricane activity in the North Atlantic for the 2000 season.An above average Atlantic hurricane season is characterized by at least 2 of the following 3:1) at least eleven tropical storms (Nadine # 18 on Oct. 20th)2) seven or more of which become hurricanes (there have been six so far)3) three or more which become major hurricanes( 2, both category four-Isaac and Keith)
Contributing Atmospheric factors to North Atlantic Hurricanes
- The structure and location of the African easterly jet which provides energy to developing tropical systems as they travel westward from the African coast.
- Low surface air pressure across the tropical Atlantic and Caribbean- A moist unstable atmosphere over the tropical Atlantic Ocean
http://www.weather.com/weather_center/special_reports/hurricanes/inside/fury.html

North Atlantic 2000 Hurricane Season
There are five important factors in predicting the outlook for this hurricane season and others as well.These factors are 1) vertical wind sheer (the change of wind speed and direction from near the oceansurface up to an altitude of approximately 8 miles), 2)the sea surface temperature.3) Coriolis Force, 4) an existing disturbance and 5) rain and thunderstorms.
Low vertical wind sheer is an imperative component for tropical storm and hurricane development. They do not form or intensify in regions of high vertical wind sheer. The vertical wind shear over the maindevelopment region is currently uncertain because of the increased variability of the global-scale circulation patterns, in response to a weakening of the La Niña-related tropical rainfall patterns. The tropical rainfall establishes the global-scale circulation patterns that controlsthe winds and the vertical wind shear over the North Atlantic and Caribbean.Currently, tropical rainfall isweaker than previously predicted, resulting in stronger vertical wind sheer across the main developmentregion of the tropical Atlantic and Caribbean Sea.
Sea surface temperature(80° or higher with reasonable depth) are the other contributing factor.Warmer sea surface temperatures produce moist air above the ocean surface, which hurricanes usedas energy to strengthen and intensify. The sea surface temperatures of the tropical Atlantic andCaribbean Sea are near-average.
(http://www.cpc.ncep.noaa.gov/products/outlooks/hurricane.html)

North Atlantic 2000 Hurricane Season
Hurricane expert Dr. Steve Lyons claims the Coriolis Force, or the deflection force on a systemdue to the earth’s rotation is fundamental the a hurricane or cyclone’s rotation. Hurricanes form mostly north of the equator because the Coriolis Force there is zero.
Tropical storms can not just spawn, they require a basic ingredient. The ingredient is a pre-existingweather disturbance in a potential area for tropical storms. Low pressure centers or moist sea surfaceswould do what it takes to spawn a tropical storm.
Unstable environments in which rain and thunderstorms can form is the last condition that needs to befulfilled for a tropical storm to develop. The heat released from the condensation within the storms isthe main energy for a tropical storm to develop or to progress into a hurricane.
If all these conditions occur within a short period of time of one another than a tropical storm or hurricanewill develop. If these conditions persist and intensify, than so shall the storm. Areas just south or north of theequator where these conditions are frequent, produce the most storms.(http://www.weather.com/weather_center/special_reports/hurricanes/inside/fury.html)

Conclusion
El Niño is powerful and complicated weather phenomenon which effects people all over the globe. It disturbs marine processes like upwelling and has an immense effect on atmospheric and weatherprocesses like jet streams, wind flow and precipitation. The exact why reason an El Niño occursis still not fully understood. The National Oceanic and Atmospheric Administration is monitoringit daily via satellites and networks of buoys ocean and predictions of it are becoming more accurate.

References
Chavez,F.P., Strutton, P.G., Friederich,G.E., Feely, R.A., Feldman,G.C., Foley, D.G., McPhaden, M.J.Biological and Chemical Response of the Equatorial Pacific Ocean to the 1997-98 El Niño. Sciencevol.286, 2126-2131, 1999.
Duxbury and Duxbury. An Introduction to World’s Oceans. Wm.C. Brown Publishers,fifth edt.1997.
Suplee,Curt. National Geographic:Nature’s Vicious Cycle- El Niño/La Niña. March 1999.
Web Sites
National Oceanic and Atmospheric Administration; http://www.ogp.noaa.gov/misc/coral/coralit.htmlhttp://www.nnic.noaa.gov/products/special_summaries/97_3/fig1.gifhttp://www.cpc.ncep.noaa.gov/products/outlooks/hurricane.html
The weather Channelhttp://www.weather.com/weather_center/special_reports/hurricanes/inside/fury.html
University of Illinoishttp://ww2010.atmos.uiuc.edu/(Gh)/guides/mtr/eln/upw.rxml