2-d and 3-d processing and interpretation of multi-fold ground
DESCRIPTION
japanese archaeologyTRANSCRIPT

Ž .Journal of Applied Geophysics 41 1999 271–292
2-D and 3-D processing and interpretation of multi-fold groundpenetrating radar data: a case history from an archaeological site
M. Pipan ), L. Baradello 1, E. Forte 1, A. Prizzon 1, I. Finetti 1
Dipartimento di Scienze Geologiche, Ambientali e Marine, UniÕersita degli Studi di Trieste, Õia Weiss 1, 34127 Trieste, Italy`
Received 29 October 1997; accepted 1 November 1998
Abstract
Ž .A 2.5-D and 3-D multi-fold GPR survey was carried out in the Archaeological Park of Aquileia northern Italy . Theprimary objective of the study was the identification of targets of potential archaeological interest in an area designated bylocal archaeological authorities. The second geophysical objective was to test 2-D and 3-D multi-fold methods and to studylocalised targets of unknown shape and dimensions in hostile soil conditions. Several portions of the acquisition grid were
Ž . Ž . Ž .processed in common offset CO , common shot CSG and common mid point CMP geometry. An 8=8 m area wasstudied with orthogonal CMPs thus achieving a 3-D subsurface coverage with azimuthal range limited to two normalcomponents. Coherent noise components were identified in the pre-stack domain and removed by means of FK filtering ofCMP records. Stack velocities were obtained from conventional velocity analysis and azimuthal velocity analysis of 3-Dpre-stack gathers. Two major discontinuities were identified in the area of study. The deeper one most probably coincideswith the paleosol at the base of the layer associated with activities of man in the area in the last 2500 years. Thisinterpretation is in agreement with the results obtained from nearby cores and excavations. The shallow discontinuity isobserved in a part of the investigated area and it shows local interruptions with a linear distribution on the grid. Suchinterruptions may correspond to buried targets of archaeological interest. The prominent enhancement of the subsurfaceimages obtained by means of multi-fold techniques, compared with the relatively poor quality of the conventional single-foldgeoradar sections, indicates that multi-fold methods are well suited for the application to high resolution studies inarchaeology. q 1999 Elsevier Science B.V. All rights reserved.
Keywords: Ground penetrating radar; Archaeology; Multi-fold; High-resolution
1. Introduction
A 2.5-D and 3-D multi-fold ground penetrat-Ž .ing radar GPR survey was carried out in the
) Corresponding author. Fax: q39-40-6762290; E-mail:[email protected]
1 Fax: q39-40-6762290; E-mail: [email protected].
Archaeological Park of Aquileia. The primaryobjective of the study was the identification oftargets of potential archaeological interest in anarea designated by local archaeological authori-ties and situated in a polygon of approximately1000 m2 in area, that borders the town cemetery
Ž .to the north Fig. 1 . The second geophysicalobjective was to test 2-D and 3-D multi-foldmethods in a high resolution study for shallow
0926-9851r99r$ - see front matter q 1999 Elsevier Science B.V. All rights reserved.Ž .PII: S0926-9851 98 00047-0

( )M. Pipan et al.rJournal of Applied Geophysics 41 1999 271–292272
Fig. 1. Location map of the site studied in the Aquileia archaeological park.

( )M. Pipan et al.rJournal of Applied Geophysics 41 1999 271–292 273
targets of limited dimensions buried in chaoticsoils.
The GPR was successfully applied to highresolution subsurface imaging in the analysis oftargets buried at depths up to 50 centimetres,as it is typically the case of pavements inspec-tion and unexploded ordnance detectionŽHugenschmidt et al., 1996; Bruschini et al.,
.1996 , to several metres, as in the case ofgeological, archaeological, environmental andengineering applications, with maximum pene-tration depths confined to approximately 100metres for geological materials in favourable
Žconditions Davis and Annan, 1989; Fisher et. Žal., 1992; Jol et al., 1996 . Recent papers see,
e.g., Fisher et al., 1992; Greaves et al., 1996;.Pipan et al., 1996 illustrate the performance of
multi-fold techniques in the investigation of ge-ological targets and give evidence of the en-hancement of the subsurface images producedby multi-fold data processing algorithms. The
Ž .first applications of multi-fold MF methods toGPR investigation date back to the early seven-
Ž .ties Gudmandsen, 1971 but only in the latestdecade the advances in GPR technology,Žnamely the advent of low cost, portable, digitalunits, and the increasing complexity of explo-
.ration targets boosted interest to these methods.The increment of signal-to-noise ratio and thevelocity information obtained from multi-offsetprestack records are some of the primary bene-fits deriving from MF techniques. In particular,stack and multi-channel pre-stack operators,such as f–k or tau-p filters, allow substantialnoise attenuation, while conventional velocityanalysis methods, such as velocity spectra orConstant Velocity StackrGather, provide accu-rate estimates of radar waves propagation veloc-ities. Seismic processing techniques can be ap-plied due to similarities in high-frequency elec-tromagnetic and seismic wave propagationŽ .Ursin, 1983; Carcione and Cavallini, 1995 andby neglecting the distortion of the radar signaldue to the propagation in a lossy earth. Propaga-tion phenomena of the latter type are well evi-
Ždenced by simulation experiments see, e.g.,
Schoolmeesters and Slob, 1996; Tillard et al.,.1996 but deem to have negligible effects on the
performance of MF techniques in the range ofŽ .offset 60 to 200 cm and soil conditions of the
present study. A proper selection of an offsetrange and accurate velocity analyses normallyimprove the quality of the subsurface images asresults from experimental work carried out in
Žlargely variable soil conditions see, e.g.,.Greaves et al., 1996 . Several published case
histories that treat MF techniques applied toGPR focus on the study of strong discontinuitiesin the subsurface electrical properties and aim atthe identification of targets which exhibit sub-stantial lateral continuity and smooth shape.From a geometrical viewpoint, conditions ofthis type resemble those most commonly met inseismic exploration. Hence the straightforwardapplication of MF seismic techniques to GPRbenefits from a well established data acquisitionand processing technology. On the other hand, alarge number of typical GPR applications, suchas exploration, archaeology, engineering, cavi-ties and buried pipes, require imaging of lo-calised targets with lateral discontinuities andoften of unknown shape and at the limit ofresolution. Rapid variations of the dielectricproperties in the shallow subsurface due to vary-ing composition of soils and water content addfurther complexity to the GPR images in suchconditions. An application of MF methods tothis second class of problems appears to be of
Ž .academic interest see, e.g., Pipan et al., 1996 .However, the image enhancement attainable andthe interpretive benefits provided by pre-stacknoise and signal identification encourage thediffusion of MF methods to tackle more compli-cated targets.
MF methods were selected in the presentinvestigation due to the following reasons:
a. Calibrations were not available in the area:cores and excavations were not performed andother non-invasive measurements that mightprovide complementary information were notcarried out. MF techniques allow to calibrateand correlate discontinuities based on velocity

( )M. Pipan et al.rJournal of Applied Geophysics 41 1999 271–292274
Žcharacteristics and wave properties amplitude.and phase as a function of offset. Moreover,
they allow accurate identification of areal dis-continuities and localised targets by means ofintegrated interpretation of pre-stack recordsŽ .Common ShotrCommon Mid Point gathers ,stack sections and velocity analysis panels.
b. The area to be investigated is most proba-bly covered by allochtonous soils rich in rockand brick debris as results from several cores in
Ž .adjacent areas Facco, 1996 and from directinspection. The level of noise observed in thesingle-fold exploratory profiles encourages ap-plication of MF processing techniques to en-hance the quality of subsurface images.
c. The allochtonous layer exhibits variablecomposition which ranges from sandy gravel tosandy pelite. Correlated variations in water con-tent that may affect the propagation velocity andconsequently estimates of target depths are ex-pected. MF methods allow one to perform acontinuous control over the velocity variations.
The results of extensive excavations and pre-vious GPR tests in the Aquileia archaeologicalpark indicate that the majority of targets areruined brick walls of very irregular shape invertical section. The selection of a 2.5-D and3-D acquisition scheme aims at mapping thedetected anomalies for a study of their arealshape and extension and an assessment of theirpotential archaeological interest.
The investigation led to the identification oftwo major discontinuities situated at averagedepths of 100 and 220 cm respectively. Thedeeper one extends throughout the investigatedarea and most probably corresponds to the pale-osol at the beginning of the intensive coloniza-
Ž .tion of the area approximately 2500 years ago .The estimated depth to this reflector matchesthe base of the layer related to activities of menin the area of the Aquileia Archaeological Park,as it is given by cores in nearby positions. Ashallow discontinuity is observed at a limitedpart of the investigated area and may be associ-ated to the effects of human activity. Moreover,it exhibits spatial coherent interruptions with
linear alignment which may be due to excava-tions or buried remains. The diffraction hyper-bolas, which mark the interruptions, and thecoincident high velocity anomalies may indicatea considerable contrast in the electric propertiesand further encourage the latter interpretation.
The MF techniques adopted for the studyproved to be effective to enhance GPR images,identify and remove coherent noise components,evaluate radar wave velocities and reduce uncer-tainties in the interpretation, identification ofpotential targets and correlation of interpreteddiscontinuities.
2. Area description
Aquileia is one of the most important archae-ological sites in northern Italy and it was one ofthe largest and richest roman towns during theimperial period, with a maximum population ofmore than 200.000 inhabitants. As a prosperousharbour at the crossing of several imperial roadsit was for centuries a prominent commercialcentre that connected the central and northernEurope with the Mediterranean area. Aquileiawas first razed to the ground by Attila in the Vcentury and successively abandoned for approx-imately 250 years before the beginning of theIX century. During this period the whole areachanged into a marsh due to an uncontrolledwater supply from previously canalized streamsand springs. A layer of sediments of variable
Ž .grain size from sands to pelites and averagethickness not less than 100 cm deposited duringthis period. The layer is substantially preservedin wide sectors of the Aquileia archaeologicalpark as the town never reached the extension ofthe imperial period again. However, intenseagricultural and construction activities as wellas large projects, such as a diversion or canal-ization of part of the main tributaries to theneighbouring lagoon, deeply modified the areaand extensively reworked the sediment layerthat protects the roman remains.

( )M. Pipan et al.rJournal of Applied Geophysics 41 1999 271–292 275
The area is characterized by facies of alluvialplain with large marshy sectors evidenced by
Žpeat clays with fresh water faunas Marocco et.al., 1984 . Two sample cores obtained in a
radius of 500 m from the investigated site showthat the layer of interest from the archaeological
Ž .point of view approximately 250 cm consistsof allochtonous soils ranging in grain size from
Ž .sandy gravels to sandy pelites Fig. 2 .The chosen area is situated in a polygon of
approximately 1000 m2 in area, that borders theŽ .town cemetery to the north Fig. 1 . Local
Ž .Fig. 2. The sequence of sediments in cores S9r94 and S12r94 after Facco, 1996, modified .

( )M. Pipan et al.rJournal of Applied Geophysics 41 1999 271–292276
archaeological authorities have commissionedthe University of Trieste to carry out a highresolution non-invasive investigation of the areato assess its potential archaeological interest inview of future expansion of the cemetery to thenorth.
3. Methods
3.1. Acquisition
A RAMAC GPR equipped with 100, 200 and400 MHz antennas was used. The data acquisi-tion was performed in four phases:1. Calibration, selection of optimum offsets for
the single fold exploratory profiles, comple-tion of exploratory profiles through the areaon a radial grid with 458 angular separationfor each frequency.
2. Layout of acquisition grid, completion of themulti-fold 2-D acquisition and of the single-fold profiles perpendicular to the 2.5-D MFgrid.
3. Wide offset range CMP gathers acquisitionŽ .40–600 cm, 10 cm trace interval in se-lected points for enhanced velocity analyses.
4. 3-D MF data acquisition along two perpen-dicular azimuths in an 8=8 m area.Calibration of the instrument aims at setting
the correct time scale. The difference in arrivaltimes of signals obtained with two optic fibresof different length and known propagation ve-locity is measured. The ratio of the calculateddifference to the measured value gives the timescale conversion factor. Common Source Gath-ers are then obtained to analyse the response atthe different offsets and to select the optimumtransmitter–receiver separation for the ex-ploratory profiles and the offset range to beused in MF acquisition. 160, 120 and 90 cmwere selected for the 100, 200 and 400 MHzantennas respectively. The results of the ex-
ploratory profiles indicated that 200 MHz repre-sent an optimum compromise between penetra-tion and resolution attainable in the area ofstudy. The whole grid was therefore investi-gated with 200 MHz antennas and a limited partŽ .15% approximately of the profiles were re-peated with 400 MHz to obtain further detailsfrom shallow discontinuities. The offset rangefor the MF 200 MHz acquisition is 100–280 cmwith 20 cm trace interval. The resulting fold is1000%.
Ž .The acquisition grid Fig. 1 consists of 115NNW–SSE multi-fold profiles spaced by 50 cmand 27 orthogonal single-fold profiles spaced by100 cm. The spatial sampling is 10 cm, verticalstack 3200% and sampling frequency 1997 MHzfor the 200 MHz antennas.
Ž .The 8=8 m 3-D grid Fig. 1 is orientated asthe 2.5-D one and it is regularly sampled every20 cm in x and y. The CMP gathers arerecorded in static fixed position mode to ensureaccurate location and to avoid variable couplingof the antennas to the ground. At each gridpoint location, two orthogonal CMP gathers areobtained which correspond to a 3-D coveragelimited to two azimuths. The resulting bin sizeis infinitesimal as the bins coincide with the midpoint locations in x and y.
3.2. Processing
The general processing sequences consists ofthe following procedures:1. DC component removal2. Drift removal3. Spectral analysis4. Low cut filtering5. Decay analysis6. Spherical divergence correction7. Exponential gain correction8. Trace editing9. Sort
10. Spectral balance11. FK filtering of refracted waves, back-
scattered refracted waves and multiples

( )M. Pipan et al.rJournal of Applied Geophysics 41 1999 271–292 277
Ž12. Velocity analysis separate velocity analy-ses for the two perpendicular azimuths in
.the 3-D13. NMO correction14. Offset range selection for the stack15. Weighted stack16. Time variant filtering.
Velocity analyses were performed at morethan 2000 CMP locations. The analysis wascarried out for the two perpendicular azimuthsin 260 CMP locations within the 8=8 m 3-Dseismic grid. An interactive method was usedthat is based on the selection of a best fittinghyperbola and the simultaneous stack of a group
Ž .Fig. 3. Example of Common Source Gather obtained in the area of studies 200 Mhz, 10 cm trace interval : primaryŽ .reflections between 80 ns and 140 ns in the far offset 480 cm .

( )M. Pipan et al.rJournal of Applied Geophysics 41 1999 271–292278
of traces centred about the selected CMP loca-tion.
Weighted stack was used as a conventionalsignal to noise ratio enhancement procedure aswell as to analyse the radar response in selectedoffset ranges. The analysis of amplitudes for the
Ždifferent stacks essentially near-offset, mid-off-.set and far-offset stack was used in the inter-
pretation phase to correlate the discontinuitiesand identify local anomalies.
3.3. Interpretation
The interpretation was adapted to the variablecharacteristics of the response through the areaand was strictly connected with the processingphase. Processing procedures and parameterswere selected after extensive interpretation ofthe results at each processing step. The follow-ing interpretation scheme was adopted.
1. A first review of the common 90 cm offsetsections, after a basic processing which includessteps 1 through 8 of the sequence, was made toidentify profiles characterized by adequate sig-
nal to noise ratio. The screened profiles com-prised a negligible percentage of the whole
Ž .dataset not greater than 5% .2. The interpretation of the results of multi-
Žfold data processing steps 9, 10, 12, 13, 14, 15,.16 was then performed. Strong coherent noise
components were observed in the resultingstacks which were not sufficiently attenuated bythe stack procedure only.
Ž .3. Pre-stack CMP gathers interpretation ledŽto the identification of the type of noise re-
fracted waves and back-scattered refracted.waves and to the application of a further pro-
Ž .cessing step 11, FK filtering to attenuate suchcomponent.
4. The integrated interpretation of weightedŽstacks for different offset ranges near-, mid-,
.far-offset , pre-stack records and velocity analy-sis panels was performed. The major discontinu-ities were interpreted and correlated through thearea.
5. The 3-D data volume was eventually inter-preted and sliced to assess the extension andshape of some localised anomalies.
Ž . ŽFig. 4. Examples of pre-stack records obtained in the area of studies: a Common Source Gather 200 MHz antenna,. Ž . Ž20–400 cm offset range, 5 cm trace interval b Common Mid Point Gather 200 MHz antenna, 20–400 cm offset range, 10
.cm trace interval . High amplitude coherent noise components show up in both records.

()
M.P
ipanet
al.rJournalof
Applied
Geophysics
411999
271–
292279
Ž .Fig. 5. Example of Common Source Gather from the area of studies 200 MHz antenna, 20–400 cm offset range, trace interval 5 cm . GWsGround Wave,RWsRefracted Wave, MRWsMultiply reflected Refracted Wave, BSRWsBack Scattered Refracted Wave, MBSRWsMultiply reflected Back Scattered
Ž . Ž . Ž . Ž .Refracted Wave: a Original record b FK filtered record c Coherent noise components BSRW and MBSRW removed by FK filter.

( )M. Pipan et al.rJournal of Applied Geophysics 41 1999 271–292280
4. Results
4.1. Data characteristics
The radar response exhibits large variationsin different parts of the area of study. Different
Žacquisition and processing techniques i.e., sin-.gle-fold, multi-fold, 2-D and 3-D were there-
fore selected and applied in order to cope withthe large variations in Signal to Noise ratio in acost-effective way. In this section, selected ex-
amples show how different types of records, inparticular the multi-fold ones, can be used todiscriminate noise and signal.
An example of high quality Common SourceŽ .Gather CSG extracted from the present dataset
is shown in Fig. 3. The part of interest is locatedjust below the ground-wave and consists of highamplitude, continuous reflected arrivals withclear hyperbolic moveout. Refracted waves donot interfere with the primary signal that, insuch conditions, can be easily interpreted even
Ž . Ž .Fig. 6. Geometry of coherent noise components observed in the area of studies: a RW and MRW b BSRW and MBSRW.

( )M. Pipan et al.rJournal of Applied Geophysics 41 1999 271–292 281
Ž .in common offset single-fold sections. Nearoffset traces require a moving average removaldue to time variant DC offset in the near field.Less than 5% of the records from the investi-gated area exhibit such high signal to noiseratio: most of the data match the example in
Ž .Fig. 4 a,b . Strong interference from refractedwaves travelling at the ground–air interface isobserved both in the CSG and CMP gathers. Allof refracted events travel at the speed of radarwaves in air. Some of them exhibit moveoutsdecreasing with offset. This is well seen in the
Ž .example in Fig. 5 a,b,c where the reversed dipcomponent is removed by means of a FK filter-
Ž Ž ..ing Fig. 5 b,c . The characteristic linear move-out and the distinct apparent velocities allow
one to implement effective FK fan filters. Dueto the large differential moveouts, the transferfunction of a FK filter can be easily smoothedand optimized in order to achieve substantialnoise reduction, complete preservation of pri-mary signals and limited smearing of energyalong the tails of the impulse response. A geo-metric model for the observed coherent noise
Ž .components, named Refracted Waves RW ,Ž .Back-Scattered Refracted Waves BSRW and
Ž .multiples MRW and MBSRW , is shown inŽ .Fig. 6 a,b . The model is consistent with the
arrival times observed in the pre-stack recordsŽCSG, CMP gathers and Common Offset sec-
.tions . The average effect of pre-stack FK filter-Ž .ing of this components is depicted by Fig. 7 a,b
ŽFig. 7. Example of Common Mid Point Gather from the area of studies 200 MHz antenna, 140–500 cm offset range, trace. Ž . Ž .interval 20 cm, subtract 15 ns to correct time zero position . a Original record b FK filtered record.

()
M.P
ipanet
al.rJournalof
Applied
Geophysics
411999
271–
292282
Ž . Ž . Ž . Ž .Fig. 8. Comparison among between single-fold and stack records from the area of studies 200 MHz antenna, 1000% fold : a Near offset trace 100 cm b StackŽ . Ž . Ž . Ž .trace c Common offset section 100 offset d Stack section. An average 17 dB increment is observed for the two primary reflections A,B after the stack.

( )M. Pipan et al.rJournal of Applied Geophysics 41 1999 271–292 283
Ž .for a CMP gather and by Fig. 8 a,b,c,d for acomparison between single-fold and stack
records. Fig. 8 also shows the net enhancementof signal to noise ratio resulting from the stack.
ŽFig. 9. Example of CMP Gathers and velocity analysis from the 3-D grid in the area of studies 200 MHz antenna, 120–460. Ž . Ž . Ž . Ž ..cm offset range, trace interval 20 cm : a Azimuth NS b Azimuth EW c Velocity analysis of azimuth NS d Velocity
analysis of azimuth EW. The results are similar along both directions.

( )M. Pipan et al.rJournal of Applied Geophysics 41 1999 271–292284
Image enhancement is due to the reduction ofthe incoherent noise component performed by
stacking and to the attenuation of the coherentnoise component primarily performed by pre-
ŽFig. 10. Example of CMP Gathers and velocity analysis from the 3-D grid in the area of studies 200 MHz antenna,. Ž . Ž . Ž . Ž ..120–460 cm offset range, trace interval 20 cm : a Azimuth NS b Azimuth EW c Velocity analysis of azimuth NS d
Velocity analysis of azimuth EW. A difference shows up between the results obtained along the two azimuths. Thedifference in estimated stacking velocity is apparent for the deep reflector.
( )M. Pipan et al.rJournal of Applied Geophysics 41 1999 271–292 285
stack filtering. Similar results could not be at-tained by means of conventional single foldtechniques for the following reasons.
–Increasing the vertical stack during acquisi-tion did not introduce a reduction of the inco-herent noise comparable with that obtained bymeans of horizontal stack. The minimum num-
Ž .ber of stacks 256 required to appreciate a SrNratio increment is significantly higher than that
Ž .selected for data acquisition 32 . Field produc-tivity is, in the case of 256 vertical stacks,
Žcomparable with the multi-fold one 900%–
.1000% fold but the results do not justify theadditional costs.
–Weighted mixing of adjacent traces of sin-gle-fold profiles could improve the SrN ratioand in particular attenuate the incoherent noise
Ž .and enhance coherent i.e., horizontally alignedcomponents. However, this result was achievedat the expenses of lateral resolution, which wasa crucial constraint in the area of study.Weighted mixing techniques tend to produce ablurring effects which overemphasizes not exist-ing lateral continuity and cancels details which,
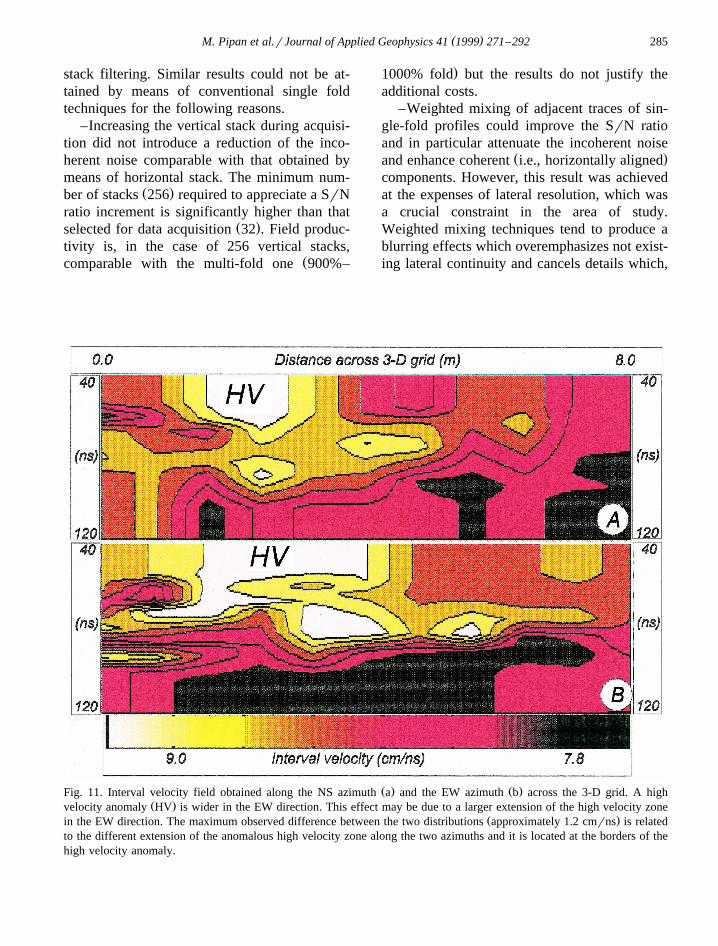
Ž . Ž .Fig. 11. Interval velocity field obtained along the NS azimuth a and the EW azimuth b across the 3-D grid. A highŽ .velocity anomaly HV is wider in the EW direction. This effect may be due to a larger extension of the high velocity zone
Ž .in the EW direction. The maximum observed difference between the two distributions approximately 1.2 cmrns is relatedto the different extension of the anomalous high velocity zone along the two azimuths and it is located at the borders of thehigh velocity anomaly.

( )M. Pipan et al.rJournal of Applied Geophysics 41 1999 271–292286
in the case of archaeological sites, are fre-quently associated with targets.
Ž–Coherent noise components see above ex-.amples could not be removed from single-fold

( )M. Pipan et al.rJournal of Applied Geophysics 41 1999 271–292 287
Ž .Fig. 13. Stack section from the area of studies line NS-58 and CMP gather from indicated location: the integratedinterpretation of stack and pre-stack records allows the identification of the primary events. Three discontinuities are here
Ž .interpreted. The deeper one approximately 350 cm gives low amplitude and discontinuous reflections which can beinterpreted in a small sector of the area of studies.
sections without removing, at the same time,signals of interest. The attenuation of such com-ponents is one of the primary objectives ofgeoradar data processing since they substan-tially degrade the lateral resolution.
4.2. Radar waÕes Õelocity
Examples of the CMP records and relevantsemblance panels for the velocity analysis alongtwo perpendicular azimuths in the 3-D grid are
Ž . Ž .shown in Fig. 9 a,b and Fig. 10 a,b . The firstŽ Ž ..case Fig. 9 a,b,c,d refers to a CMP location
where the observed velocities are substantiallyidentical in the two directions, with valuesaround 6.5–7.0 cmrns for the shallow reflec-tion at 25 ns and 8.0 cmrns at 65 ns TWT.CMP gathers and semblance panels are clearly
Ž Ždifferent in the second example Fig. 10 a,b,..c,d , particularly as regards the deeper reflec-
tion which exhibits velocities ranging between8.0 and 10.0 cmrns in the two directions. In the
Ž . ŽFig. 12. GPR profile NS-58: a Example of single-fold section from the area of studies 200 MHz antenna, 100 cm offset,. Ž . Ž10 cm trace interval ; b Example of stack section from the area of studies 200 MHz antenna, 1000% fold, 10 cm trace
. Ž . Ž .interval : line NS-58; c Interpreted stack section: the multi-fold georadar line shows two clear shallow reflectors A and BŽ .and a deeper one C . In the middle of the line and at both ends it is possible to identify interruptions of the continuity of the
Ž .reflectors as indicated by the interpretation. Such features could be interpreted as remains of the Roman town walls .
( )M. Pipan et al.rJournal of Applied Geophysics 41 1999 271–292288
framework of the present work, velocities ob-tained along both azimuth were considered tostack the data. The variations of velocity as afunction of azimuth seem limited to localisedsectors of the 3-D grid, where both the shallowand deep discontinuities are interrupted. Thelimited dip of both interfaces marginally affectsthe velocity measurement. Average interval ve-locity values for the two primary discontinuitiesidentified in the area are 6.0 and 8.0 cmrns forthe shallow and deep interface respectively. Animage of the interval velocity field obtained
Ž .along the two azimuths is shown in Fig. 11 a,b .Ž .The high velocity anomaly HV is probably
associated with a zone with relatively low watercontent which is elongated in the EW direction.
4.3. Data interpretation
Two major reflections are interpreted in theinvestigated area. The shallow one is located atan average depth of 100 cm at the base of alayer characterized by 6.0 cmrns average inter-val velocity. The deeper one is situated at 220cm average depth beneath a layer characterized
Žby higher interval velocity 8.0 cmrns on the.average . Examples of single-fold, stack and
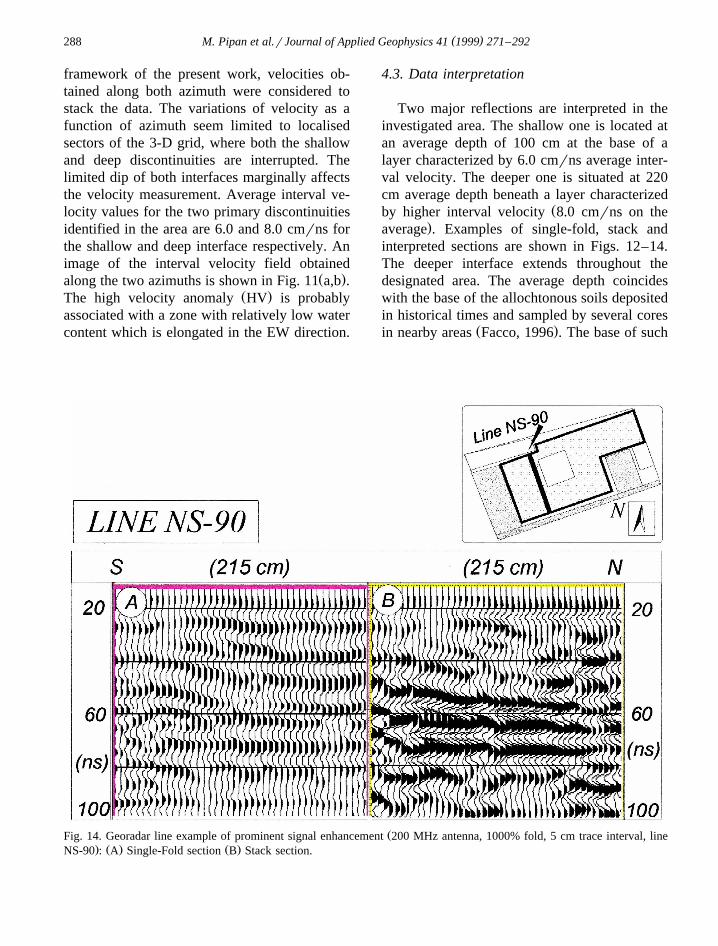
interpreted sections are shown in Figs. 12–14.The deeper interface extends throughout thedesignated area. The average depth coincideswith the base of the allochtonous soils depositedin historical times and sampled by several cores
Ž .in nearby areas Facco, 1996 . The base of such
ŽFig. 14. Georadar line example of prominent signal enhancement 200 MHz antenna, 1000% fold, 5 cm trace interval, line. Ž . Ž .NS-90 : A Single-Fold section B Stack section.

( )M. Pipan et al.rJournal of Applied Geophysics 41 1999 271–292 289
layer consists of levels ranging in grain sizefrom sandy pelites with gravel to silt with debrisand stone fragments. The underlying layer de-posited in alluvial plain to marsh conditions,depending on the elevation of the site, andconsists of sandy pelites to peat clays. An elec-tromagnetic impedance contrast as betweensandy pelites with gravel and sandy pelites orclay is consistent with weak and discontinuousreflections observed in the stack sections. Thisinterface can be interpreted in the stack sections
Ž .and CMP gathers e.g., Fig. 13 but it is hardlyimaged in the single-fold sections. Stack sec-tions further provide good images of the shal-
Ž .low interface Figs. 12 and 14 . A significantincrease of interval velocities is observed at the
Ž .interruptions of such interface Fig. 11 . TheŽdense spatial sampling in crossline direction 50
.cm allows a straightforward correlation of thevelocity anomalies and of the interruptions. Inlarge sectors of the area of study both of them
Ž .exhibit coincident linear alignment Fig. 15 .The remains exposed in the area of the AquileiaArchaeological Park are normally foundations,brickworks and masonry which exhibit porosityand water content much lower than the sur-
rounding soil. Transmission tests performed onsample remains confirm the high radar wavevelocity which can be expected from low watercontent materials. The interpretation of the lo-calized interruptions of the shallow reflector andof the high velocity anomalies provided coinci-dent results. This observation was considered asan indicator of potential archaeological interestand it was used to draw the final map of theresults of the study.
The map of the GPR evidences of zones ofŽ .potential archaeological interest Fig. 15 was
obtained from the integrated interpretation ofstack sections and velocity analyses. It illus-trates the location of sectors characterized byanomalous high velocity which are bounded byinterruptions of the main shallow reflector inter-preted throughout the area of study. The linear-ity of the alignments evidenced by the map isone of the primary indicators of features ofpotential archaeological interest, since most of
Žthe remains discovered in the area pavements,.floors, foundations and ruined walls exhibit
clear linear limits. Velocity characteristics andvertical shape of the features, as evidenced bythe GPR stack profiles, further support this de-
Fig. 15. Areal distribution of Georadar evidences of zones of possible archaeological interest, recommended for excavationtests.

( )M. Pipan et al.rJournal of Applied Geophysics 41 1999 271–292290
duction. The areas of interest have been pro-posed to the local archaeological authorities forarchaeological excavation tests.
5. Discussion
The study reveals that structures of potentialarchaeological interest are located at depths thatdo not exceed 250 cm. Our tests of MF showthe following.
1. Signal to noise ratio increment: MF tech-niques yield radar image enhancement. Thisstatement is of general validity in GPR investi-gation but of particular importance in archaeo-logical applications due to the characteristic lowsignal to noise ratio of records obtained in sitesof cultural interest. The reason for the lowquality of conventional GPR images is that ahigh level of scattering originates from long-standing human activity in such areas. Scatter-ers frequently exhibit dielectric properties not
Žvery different from those of targets e.g., wallsor stone ruins buried in soils with interspersed
.fragments of the same ruined buildings . In theframework of the present work the SrN en-hancement obtained from MF processing al-lowed the identification of discontinuities in thedepth range of interest and the interpretation oflocalised interruptions in those interfaces thatmay be due to targets of potential archaeologi-cal interest.
2. Radar wave velocities identification: MFtechniques enable to attain the most precise andeffective solutions for velocity field reconstruc-tion. The resulting detailed information aboutthe vertical and lateral velocity variations is ofuse in the correlation of discontinuities through-out the area of studies and in migration anddepth conversion processing to reconstruct aspatially correct image of the subsurface andassess the exact location of the targets of inter-est. In subsurface conditions characterized bylow conductivity and best suited for GPR inves-tigations, as it is the case of the present study,
the ratio of conduction current density to dis-placement current density is very small and thepropagation velocity provides direct informationabout the real part of the dielectric constant ofthe material. The link between radar wavesvelocity and the real part of the dielectric con-stant allows an approximate estimate of thedielectric properties of materials. The velocityfield reconstructed in the present work indicatesthat the depth of the primary discontinuitiesranges between 70–120 cm for the shallow oneand 180–250 cm for the deeper one. The deepdiscontinuity may correspond to a pedologicinterface. This would be consistent with theresults obtained from cores in nearby areaswhich give a 240 cm average depth for theinterface between allochtonous soils deposited
Žin the area in historical times approximately.2500 years . The shallow discontinuity may be
related to the activity of man in the area in thelast 2000 years. The interruptions of the shallowdiscontinuity are linearly aligned across the gridand coincide with zones of higher radar wavevelocity. Linear alignment and high velocityanomaly support the hypothesis of a potentialarchaeological interest of such zones.
3. Noise identification: coherent noise com-ponents such as RW, BSRW, MRW and MB-SRW build up a substantial percentage of theresponse recorded in the investigated archaeo-logical site. We note that such components canbe discriminated from primary signals and re-
Žmoved only in the pre-stack domain Common.Shot or Common Mid Point Gathers . Conven-
tional pre-stack filtering operators, such as f–kfilters, permit an efficient attenuation of thesecomponents in pre-stack records and substan-tially preserve the primary signal due to the
Žlarge velocity differences normally not lessthan 20 cmrns as the latter travels at velocitiesnot greater than 10 cmrns in the investigatedarea while lateral waves and more complex
.refracted paths travel at 30 cmrns . A removalof coherent and incoherent noise componentsled to an average 7-fold increment of the SrNratio for the present dataset.
( )M. Pipan et al.rJournal of Applied Geophysics 41 1999 271–292 291
4. Target identification: in the case of ar-chaeological investigation it is normally verydifficult to obtain accurate information concern-ing the type of target particularly as far ascomposition, shape and dimensions are con-cerned. This adds further complexity to theinterpretation task as the useful information maybe a spatially organized noise. This means, as inthe case of the present investigation, that whatis considered useful information in seismics,i.e., reflections from major discontinuities inimpedance, could be disregarded as pertainingto pedologic discontinuities. This is the case ofthe deeper discontinuity which is most probablythe base of the allochtonous soil. Information onpotential archaeological interest in the desig-nated area consists of laterally continuous re-flections, such as those of the shallow disconti-nuity, but also of the localized interruptions ofthe reflectors, generally marked also by diffrac-tion hyperbolas, whose distributions can be eas-ily correlated in the 3-D grid and exhibit clearlinear alignments. High velocity anomalies arefurther observed at the location of such interrup-tions. The anomalies may be due to materialscharacterized by low porosity and water contentcomparatively lower than the surrounding soil.Transmission tests performed on exposed re-mains in the area of the Aquileia ArchaeologicalPark confirm the average high velocity charac-teristics of the targets of archaeological interest.Linear alignments across the area of study andcoincident high velocity anomalies support theindication of potential archaeological interestwhich is the primary result of the present work.
5. Comparative evaluation of single rrrrrmulti-fold acquisition and processing costs:the quality of the single-fold records can beenhanced by increasing the vertical stack duringacquisition. Extensive tests performed in thearea of study indicated that a minimum thresh-old of 256 vertical stacks was required to pro-
Žvide a noticeable SrN ratio improvement witha moderate attenuation of the incoherent noise
.component only . The cost of field operations isin this case comparable with that of multi-fold
acquisition with 800–900% fold and 32 verticalstacks. The results attainable by means of sin-gle-fold processing are however not comparablewith those obtained by means of multi-foldmethods, as clearly illustrated by Figs. 8, 12 and14, since the main benefit of the latter tech-niques is the attenuation of coherent noise com-ponents which cannot be removed from single-fold records without damaging primary eventsat coincident locations. In the case of the pre-sent work, the costsrbenefits ratio definitelyfavours the use of multi-fold techniques.
Acknowledgements
The authors thank Prof. Angelo Guarino,President of the National Cultural HeritageCommittee, for his support of the present re-search work. We acknowledge Dr. FrancescaMaselli Scotti, Director of the Aquileia NationalMuseum, for granting access to the investigatedarea and providing historical information. Wethank Dr. Giancarlo Ligabue, Head of Centro
Ž .Studi e Ricerche Ligabue Venezia, Italy forhis support and encouragement in our archaeo-logical applications. We are grateful to Mr. G.Boutard, M. La Porta, and Ms. K. Sfiligoi forassistance with field work.
References
Bruschini, C., Gros, B., Guerne, F., Piece, P.Y., Carmona,`O., 1996. Ground Penetrating Radar and induction coilsensor imaging for antipersonnel mines detection. Pro-ceedings of the 6th International Conference on Ground
Ž .Penetrating Radar GPR’96 , Pub. by Dept. of Geo-science and Technology, Tohoku University, Sendai980-77, Japan, 211–216.
Carcione, J.M., Cavallini, F., 1995. On the acoustic–elec-tromagnetic analogy. Wave Motion 21, 149–162.
Davis, J.L., Annan, A.P., 1989. Ground-penetrating radarfor high-resolution mapping of soil and rock stratigra-phy. Geophysical Prospecting 37, 531–551.
Facco, S., 1996. Evoluzione paleoambientale Tardopleis-tocenica-Olocenica nell’area Nord Orientale di Aquileia:studio dei sondaggi 9 e 12. Unpublished thesis, Univer-

( )M. Pipan et al.rJournal of Applied Geophysics 41 1999 271–292292
sity of Trieste, Department of Geological, Environmen-tal and Marine Sciences.
Fisher, E., McMechan, G.A., Annan, A.P., 1992. Acquisi-tion and processing of wide-aperture ground-penetrat-
Ž .ing radar data. Geophysics 57 3 , 495–504.Greaves, R.J., Lesmes, D.P., Lee, J.M., Toksoz, M.N.,¨
1996. Velocity variations and water content estimatedfrom multi-offset, ground-penetrating radar. Geo-
Ž .physics 61 3 , 683–695.Gudmandsen, P., 1971. Electromagnetic probing of ice. In:
Ž .Wait, J.R. Ed. , Electromagnetic Probing in Geo-physics. The Golem Press, CO, 321–348.
Hugenschmidt, J., Partl, M.N., de Witte, H., 1996. GPRinspection of Mountain Motorway—A Case Study.Proceedings of the 6th International Conference on
Ž .Ground Penetrating Radar GPR’96 , Pub. by Dept. ofGeoscience and Technology, Tohoku University, Sendai980-77, Japan, 365–370.
Jol, H.M., Smith, D.G., Meyers, R.A., 1996. Three dimen-sional GPR imaging of a fan-foreset delta: an examplefrom Brigham City, UT, USA. Proceedings of the 6thInternational Conference on Ground Penetrating Radar
Ž .GPR’96 , Pub. by Dept. of Geoscience and Technol-ogy, Tohoku University, Sendai 980-77, Japan, 33–37.
Marocco, R., Pugliese, N., Stolfa, D., 1984. Some remarkson the origin and the evolution of the Grado lagoonŽ .northern Adriatic Sea . Bollettino di Oceanografia
Ž .Teorica ed Applicata 2 1 , 11–17.Pipan, M., Finetti, I., Ferigo, F., 1996. Multi-fold GPR
techniques with applications to high-resolution studies:two case histories. European Journal of Environmental
Ž .and Engineering Geophysics 1 1 , 83–103.Schoolmeesters, J.W., Slob, E.C., 1996. Effects of the
conductivityrpermittivity ratio on the dispersion andattenuation of radar signals. Extended Abstracts of the58th EAGE Conference and Technical Exhibition, Am-sterdam, The Netherlands, paper M017.
Tillard, S., Hollender, F., Jullien, F., 1996. Dispersion ofGPR waves. Extended Abstracts of the 58th EAGEConference and Technical Exhibition, Amsterdam, TheNetherlands, paper M018.
Ursin, B., 1983. Review of elastic and electromagneticwave propagation in horizontally layered media. Geo-
Ž .physics 48 1 , 1063–1081.