2 economic foundations of fm
DESCRIPTION
:)TRANSCRIPT

Economic Foundation of Financial ManagementACC08
Topical ObjectivesTopical Objectives
bull Review relevant microeconomic concepts
bull Review relevant macroeconomic concepts and
bull Identify the Green regulations affecting doing business
Microeconomics ElasticityMicroeconomics Elasticity
bull a concept related to the equilibrium between demand and supply
bull measures the dependency between demand and supply and the impact of changes in either on the equilibrium price level
Microeconomics Price Elasticity of Microeconomics Price Elasticity of DemandDemand
bull Price elasticity of demand is calculated as
Microeconomics Price Elasticity of Microeconomics Price Elasticity of DemandDemand
bull Perfect Elasticity
bull Elastic
Microeconomics Price Elasticity of Microeconomics Price Elasticity of DemandDemand
bull Unit Elasticity
bull Inelastic
Microeconomics Price Elasticity of Microeconomics Price Elasticity of DemandDemand
bull Perfectly Inelastic Elasticity
Microeconomics Price Elasticity of Microeconomics Price Elasticity of Demand - ExamplesDemand - Examples
bull For each sample determine elasticity as Perfectly Elastic Elastic Unit Elasticity Inelastic Perfectly inelastic
Microeconomics Price Elasticity of Microeconomics Price Elasticity of Demand ndash Example 1Demand ndash Example 1
bull Rich Asians buy into upwardly mobile Manilas luxury condominiums
bull Yield-hungry investors from Malaysia to Japan now buy Philippine condominium space in bulk rotating money from favorites Hong Kong and Singapore as the authorities there have acted to cool real estate prices property managers and consultants said
bull There has never been this strong foreign interest in the Philippines said David Young Philippines managing director with consultancy and brokerage Colliers International
Microeconomics Price Elasticity of Microeconomics Price Elasticity of Demand - ExamplesDemand - Examples
bull Rich Asians buy into upwardly mobile Manilas luxury condominiums (continuation)
bull Typically 40 of space in newer condominiums is owned by foreigners the maximum they are allowed Foreigners cannot own land in the Philippines but they are allowed to hold condominium titles as long as 60 of the developments total floor area is owned by Filipinos
bull Asians usually buy apartments worth as much as $550000 per unit CPG managing director Robbie Antonio said
Microeconomics Price Elasticity of Microeconomics Price Elasticity of Demand - ExamplesDemand - Examples
bull Rich Asians buy into upwardly mobile Manilas luxury condominiums (continuation)
bull Brokers also noted rising interest in office space on bets that commercial leasing prices will skyrocket as more foreign firms outsource in the country
bull The action remains concentrated in Manila brokers said although it is slowly spilling over into new wave cities in central and southern Philippines which host business process outsourcing firms
bull Top property developers use globally-known luxury brands to attract overseas demand
Microeconomics Price Elasticity of Microeconomics Price Elasticity of Demand - ExamplesDemand - Examples
bull Rich Asians buy into upwardly mobile Manilas luxury condominiums (continuation)
bull Other than Armani CPG has tapped Versace and American socialite Paris Hilton to design interiors Brand associations have attracted interest from foreign nationals Antonio said
bull For their part Megaworlds Go said the company is offering in-house brokerage services to help in leasing apartments
Microeconomics Price Elasticity of Microeconomics Price Elasticity of Demand ndash Example Demand ndash Example
bull The surge in overseas pre-sales also keeps top property firms awash with cash to fund projects and fatten their land bank
bull Jones Langs Leechiu said top developers brush off private equity and sovereign wealth funds seeking discounts as they foresee sustained strong demand from retail buyers
bull If they ask for too much discount we wont agree We dont need the money Go said
Reuters (2014 July 3) Rich Asians buy into upwardly mobile Manilas luxury condominiums Retrieved July 6 2014 from Yahoo Finance httpsfinanceyahoocomnewsrich-asians-buy-upwardly-mobile-052903760html_ylt=AwrSbmsDSLlTHVIATCRXNyoA_ylu=X3oDMTEzbm5lbnJjBHNlYwNzcgRwb3MDMQRjb2xvA2dxMQR2dGlkA1ZJUDQ3M18x
Microeconomics Price Elasticity of Microeconomics Price Elasticity of Demand ndash ExamplesDemand ndash Examples
Microeconomics Expenditures and Price Microeconomics Expenditures and Price ElasticityElasticity
Microeconomics Factors influencing Microeconomics Factors influencing elasticityelasticity
bull Close substitutes increase elasticity
bull Luxuries tend to be more elastic than necessities
bull Elasticity increases when the proportion of income spent on a product is high
bull Elasticity increases over time
Microeconomics Cross elasticity of Microeconomics Cross elasticity of DemandDemand
measures the responsiveness of the quantity demanded of one product to the change in price of another product
If Cross Elasticity Is
The Products Are
Positive Substitutes
Negative Complements
Microeconomics Income elasticity of Microeconomics Income elasticity of DemandDemand
measures the responsiveness of the demand for a product to changes in income
If Income Elasticity Is
Positive and greater than 10
Positive and less than 10
Negative
The Product IsNormal and income elastic
Normal and income inelastic
Inferior
As Income Rises
The amount of income spent and of income spent on the product rise
The amount of income spent rises but the of income spent on the product falls
The amount of income spent and of income spent on the product fall
Microeconomics Price elasticity of Microeconomics Price elasticity of SupplySupply
measures the responsiveness of the quantity supplied of a product to a change in its price
More Elastic Supply
Product is easy to produce with many different common types of resources
Less Elastic Supply
Product is hard to produce and requires very specific scarce resources
Microeconomics Examples of factors Microeconomics Examples of factors affecting increase (decrease) demand for affecting increase (decrease) demand for goodsgoods
Microeconomics Examples of factors Microeconomics Examples of factors affecting increase (decrease) supply for affecting increase (decrease) supply for goodsgoods
Microeconomics Example of factors Microeconomics Example of factors affecting increase (decrease) supply for affecting increase (decrease) supply for goodsgoods
bull Discussion Questions bull Predict what may happen to the usage by the riding
public of the MRT Of the Bus bull Do you think the MRTLRT fare hike is good
bull MRT LRT fares may go up in AugustmdashAbayabull By Miguel R Camus |Philippine Daily Inquirer 1226
am | Friday June 21st 2013 bull Read more httpbusinessinquirernet128269mrt-lrt-fares-may-go-up-in-
august-abayaixzz36mF0nFX7
Microeconomics Example of factors Microeconomics Example of factors affecting increase (decrease) supply for affecting increase (decrease) supply for goodsgoods
bull Read more httpbusinessinquirernet128269mrt-lrt-fares-may-go-up-in-august-abayaixzz36mF0nFX7
bull This means fares which were last adjusted in the early 2000s will increase by P5 in 2013 while the second P5 increase will kick in next year
bull The announcement of the fare increases comes amid severe criticism of the LRT-MRT operationsmdashcoaches with passengers woefully packed like sardines most times of the day and long queues to the stations during rush hours
Microeconomics Example of factors Microeconomics Example of factors affecting increase (decrease) supply for affecting increase (decrease) supply for goodsgoods
bull Read more httpbusinessinquirernet128269mrt-lrt-fares-may-go-up-in-august-abayaixzz36mF0nFX7
bull For example MRT 3 was designed to serve 350000 passengers per day but some 600000 people cram the system daily
bull A 13-kilometer stretch of the line on north Edsamdashfrom Muntildeoz to Trinomamdashhas yet to be connected three years into the Aquino administration
bull Critics say that no mass transportation system anywhere in the world makes money quite apart from Hong Kong
Microeconomics Example of factors Microeconomics Example of factors affecting increase (decrease) supply for affecting increase (decrease) supply for goodsgoods
bull Read more httpbusinessinquirernet128269mrt-lrt-fares-may-go-up-in-august-abayaixzz36mF0nFX7
bull Even with the fare increase the LRT lines and MRT 3 come out ldquocheaperrdquo than rates charged by bus operators which are pegged at P40 per passenger Abaya said
bull The current fare at MRT which runs through Edsa Metro Manilarsquos main highway is pegged at a maximum of P15 per passenger For LRT 1 passengers are charged up to P20 each for a single journey for LRT 2 the rate is pegged at P15
Microeconomics Example of factors Microeconomics Example of factors affecting increase (decrease) supply for affecting increase (decrease) supply for goodsgoods
bull Read more httpbusinessinquirernet128269mrt-lrt-fares-may-go-up-in-august-abayaixzz36mF0nFX7
bull Unlike other agencies under the DOTC the LRTA is unique as it does not have a regulating body when it comes to setting fares
bull For the MRT 3 alone Abaya said the government was spending P60 to transport one passenger from end to end well above the current ticket price This translates to about P7 billion to P9 billion in subsidies every year
Microeconomics Example of factors Microeconomics Example of factors affecting increase (decrease) supply for affecting increase (decrease) supply for goodsgoods
bull Read more httpbusinessinquirernet128269mrt-lrt-fares-may-go-up-in-august-abayaixzz36mF0nFX7
bull To address overcrowding the DOTC is evaluating a proposal by a Chinese manufacturer as part of its plan to acquire 48 new train cars to expand MRT 3rsquos capacity
bull ldquoComplete delivery will happen on May 2016rdquo he said
bull MRT 3 currently has a fleet of 73 train cars serving passengers at 3-minute intervals The DOTC said the addition of new cars will cut the waiting time to 25-minute intervals
Marginal Benefit vs Marginal CostMarginal Benefit vs Marginal Costbull Marginal Benefit ndash Benefit that an individual gets from consuming an
additional unit of good or service However each additional unit consumed results in smaller marginal benefit and results in diminishing returns
The demand curve represents the marginal benefit curve of the product to consumers
bull Marginal Cost ndash Cost of producing an additional unit of output also referred to as opportunity cost
The supply curve represents the marginal cost curve of the producers
Marginal Benefit vs Marginal Cost ndash Marginal Benefit vs Marginal Cost ndash Example 1Example 1
bull Read more httpnewsinfoinquirernet617323sc-ruling-on-dap-checks-balances-democracy-workixzz36mhRVdfo Follow us inquirerdotnet on Twitter | inquirerdotnet on Facebook
bull The Supreme Court last Tuesday struck down the DAP including a circular allowing the release of savings from the executive department to agencies and projects outside the national budget approved by Congress
bull The executive department pooled savings under the DAP a stimulus program introduced in 2011 and allotted these for projects to speed up government spending and boost economic growth
bull
Marginal Benefit vs Marginal Cost ndash Marginal Benefit vs Marginal Cost ndash Example 2Example 2
bull The selling price is P100bull The variable cost per unit is P40 (of which is P5 marketing
costs)bull The total fixed manufacturing cost is P5000bull The total fixed administrative costs is P2200
bull Requirementsbull Compute for the break-even unitsbull If there are 150 units how much is the increase in net income
Consumer Surplus amp Producer SurplusConsumer Surplus amp Producer Surplusbull Consumer Surplus is the difference
between total value consumers place on a good produced less the amount paid
bull Producer Surplus is the difference between the price received for each good produced and the opportunity cost of producing the good
bull The difference between the lowest available price for a good and the highest price is the producer surplus
Price Takers amp SearchersPrice Takers amp Searchersbull Price takers must take the market
price in selling their product because each price takerrsquos output is small relative to total market
bull Price searchers have a downward sloping demand curve for their product The amount they are able to sell is inversely related to the price they charge
Price Taker Market Characteristics1048729 All firms are producing an identical product1048729 A large number of firms exist in the market1048729 Each firm supplies only a very small portion of total amount supplied to the market1048729 No barriers limit the entry or exit of firms in the market
Market StructuresMarket StructuresPerfect
Competition
of Sellers and Buyers
Many
Sellerrsquos Products
Identical
Barriers to entry None
Economies of Scale
Low
Competition Between Sellers
High
Other
Buyers have perfect
knowledge of product and
price
MonopolisticCompetition
Many
Slight Differences
None
Low
High
Oligopoly
A Few Sellers
No Close Substitutes
High
Often High
High or Low
Sellers are independent
but have incentive to form cartel
Monopoly
One Seller
No Close Substitutes
Insurmountable
Often High
None
Macroeconomic ConceptMacroeconomic Conceptbull Macroeconomic concepts that have an impact on all firms
in the same environment be it a country a group of related countries or a particular industry
bull Topics covered concepts about the business cycle and how to forecast changes in the business cycle and the impact on among other things price levels and profitability
Macroeconomic Concept Business CycleMacroeconomic Concept Business Cyclebull
Moderating the Business Cycle
Policies can be used to moderate the business cycle
Status of the Economy
Appropriate Action
Using Fiscal Policy
Using Monetary Policy
RecessionGDP lt PotentialExcess unemployment
StimulusAD uarr
G uarr T darrDeficit uarr
M uarr
BoomGDP gt PotentialRising real wages
ContractionAD darr
G darr T uarrDeficit darr
M darr
bull The actions can be oDiscretionary actions require a policy change
Example bull Increase government spending on roadsbullRaise income tax rates
Moderating the Business Cycle (continued)
oAutomatic actions require no policy change and occur with changes in the level of economic activity Examples
bull Income taxes are based on progressive rates so total taxes fall at an accelerating rate with declining economic activity
bull Needs-based spending such as unemployment insurance automatically increases with rising unemployment
Moderating the Business Cycle (continued)
bull Discretionary policy is hampered by lags oRecognition oLaw-makingoImpact
Moderating the Business Cycle (continued)
bull bull The Rate of Inflation is calculated as Inflation = Last yearrsquos price index - This yearrsquos price index 100
rate Last yearrsquos price index
bull bull Inflation is an increase in the general level of prices
Macroeconomics Inflation
Inflation and Interest Rates
Nominal interest rates reflect both an expectation of inflation and a real rate of interest
bull Supply set by BSPbull Demand is a function of interest rate
bull Investment demand for capitalbull Savings supplybull Real interest rate is independent of inflation rate
Change in inflation expectations directly changes nominal rates
rnom = Real rate + E(inf)
Unexpected inflation redistributes income among economic groups
If inflation is higher than expected
Interest rates will have been set too low
Benefits borrowers at the expense of lenders
Causes borrowers to regret they did not borrow more and lenders to regret they did not lend less
Inflation and Interest Rates (continued)
If inflation is lower than expected
Interest rates will have been set too high
Benefits lenders at the expense of borrowers
Causes lenders to regret they did not lend more and borrowers to regret they did not borrow less
Inflation and Interest Rates (continued)
Two Types of Inflation
Demand-Pull Inflation starts with an increase in AD Typical causes of the increase include an increase in the money supply government spending or exports Assuming the economy is already at full employment
bull The increase in AD will increase GDPReal and the price level bull But rising costs will decrease SRAS leading to another increase in the
price level and decrease in GDPReal
bull Net result is a one time round of price increases and no change in GDPReal
bull However if the money supply continues to grow excessively and fuel AD the demand-pull inflation process can continue
Cost-Push Inflation starts with an increase in costs Typical causes of the increase include a rise in the money wage rate or raw material prices
Rising costs reduce the SRAS curve and the initial effect is to increase prices and decrease GDPReal
This fall below GDPPotential could precipitate government stimulation which will increase AD leading to another increase in prices and an increase back to GDPPotential
Net result is a one time round of price increases and no change in GDPReal
Two Types of Inflation (continued)
In the short run Some inputs (such as labor and raw materials) are variable but others (such as
property plant and equipment) are not Output can benefit by the specialization of labor All inputs are subject to the Law of Diminishing Returns
Output in the Short Run
AFC Falls as output rises and fixed cost is spread AVC and MC
bull First fall with specializationbull Then rise with Law of Diminishing Returns
MC When rising it will intersect the minimum points on AVC and ATC
Expected Relationships in the Short-Run
Expected Relationships in the Short-Run
In the long run all costs are variable and the firm can alter the size of its plant to meet higher or lower product demand
bull If expanding plant size leads to more efficiency and specialization the minimum point on the SRATC curve will be lower
bull If expanding the plant size leads to less efficiency and specialization the minimum point on the SRATC curve will be higher
bull These minimum points become the firms LRATC curve (which can be upward flat or even downward sloping)
The minimum point on the LRATC curve is the firmrsquos minimum efficient scale
Costs in the Long Run (continued)
In the short run some costs are fixed and the firm will maximize profits by operating at the minimum point on its SRATC curve
Costs in the Long Run
The aggregate demand curve (AD) measures the amount of total real consumption expenditures (goods and services) demanded at various price levels
AD = Y = C+I+G + (XndashM) = GDPRealAD curversquos downward slope is caused by the
bull Wealth Effect Rising inflation (GDP Deflator uarr) causes financial assets to lose value All other things equal this leads to increased savings and decreased current spending
bull Substitution Effect Rising prices and inflation increase nominal interest rates which reduces borrowing to fund current consumer and investment spending
A change in AD curve is due to a factor other than price
Aggregate supply is the quantity of goods services supplied (GDPReal) It is a function of aggregate production which depends on
bull Quantity of Labor (L)
bull Quantity of Capital (K)
bull Level of Technology (T)
At any one point in time the level of technology and quantity of capital are fixed but the quantity of labor is variable This produces a vertical long-run aggregate supply and an upward sloping short-run aggregate supply curve
Potential GDP increases over time with increases in the
Increases in factor costs decrease the SRAS curve
bull ldquoFull employmentrdquo quantity of labor
bull Capital (human and physical)
bull Level of Technology
bull ldquoDoes not affect real factors of production and Potential GDP
bull Rising production costs decreases SRAS (higher price for any quantity of output)
bull Assuming all other prices rise at the same rate the economy remains at Potential GDP but at a higher price level
Classical View The economy is self regulating back to full employment
bull Wages and prices adjust fully and quickly to eliminate shortages and surpluses to restore economic efficiency and full employment
bull Taxes and government intervention are potential disruption to the market signals necessary for fully functioning competitive markets
bull Technology is the prime driver in increasing aggregate demand and supply over time
Keynesian View The economy is inherently unstable and does not return to a long-run equilibrium (potential GDP) without government intervention
bull Expectation are the primary determinant of AD and expectations are the subject to excesses of optimism and pessimism (leading to inflation and recession)
bull SRAS does not quickly adjust because wages in particular are ldquostickyrdquo in the downward direction
bull Government intervention to dampen or stimulate the economy is needed to maintain output at potential GDP
Monetarist View The economy is self regulating back to full employment as long as the money supply grows at an appropriate stable pace
bull The quantity of money fuels aggregate demandbull Recessions are caused by bad monetary policybull The wage rate is sticky which delays economic recoveries when
coming from recessionbull Taxes and government intervention are a potential disruption to the
market signals necessary to make competitive markets work
MONEYMoney is a means of payment to settle a debt for a current or prior purchase It has three functions
Medium of exchange for goods or services Credit cards are not money they just delay the debt Checks are not money They move funds (money) from one account to
another Checking account balances are money
Store of value that can be held and exchanged for goods in the futureUnit of account that allows relative prices to be quoted in a standard unit
The Supply and Demand for Money
The supply of money is fixed at any point in time by the Fed (hence the vertical supply curve)
The ldquopricerdquo of money is the interest rate
Equilibrium Price
Shortage leads to selling of investments
Surplus of money leads market participants to invest
bull The demand for money is affected by four major factorsoThe level of interest rates cause movement on the demand
curve and is inversely related to demandHigher rates create an incentive to invest instead of holding money
Higher rates are associated with higher inflation which causes money to lose value
The Supply and Demand for Money (continued)
oThe General Price LevelQuantity of nominal money demanded is directly related to the price level
Quantity of real dollars demanded is independent of the price level
oReal GDP demand for money is directly related to real income
oFinancial Innovation has generally led to greater liquidity and decreased demand for narrowly defined money
The Supply and Demand for Money (continued)
Two Categoriesbull Renewable resources are replenished by naturebull Nonrenewable resources are used up in production
Renewable Resourcesbull Total supply is fixed and inelasticbull Any one purchaser can obtain more by paying a higher price
Non-Renewable Resourcesbull Total supply (both known and expected to be recovered supply) is fixed known
and perfectly elasticbull Total demand (current and all future demand) determine future pricebull Current price is the PV of future price causing the current price to rise over time
at the rate of interest rates (Hotelling Principle)bull Lack of perfect knowledge of future supply demand and interest rate can lead to
surprise changes in price today
The materials balances model
bull Kneese Ayresand DrsquoArge (1970) (Thomas 2010) (Figure 10)
Environmental Policies
The Philippine Experience
bull PD 1151 Philippine Environmental Policy (1977)bull Renewable Energy Act (2008)bull In December of 2008 then President Gloria M Arroyo
signed into law the Republic Act 9513 Renewable Energy (RE) Act of 2008-an act promoting the development utilization and commercialization of renewable energy resources and for other purposes
The Philippine Experience
bull Its targets were ldquofor the Philippines (Perez 2009) bull to be the No1 geothermal producer in the worldbull to be the No1 wind power producer in the Southeast
Asiabull to double its hydro capacity by 2013bull to expand contribution of biomass solar and ocean
energy by 250 MWrdquo
The Philippine Experience
bull The Philippines has an abounding potential for generating energy from renewable resources (Perez 2009)bull Geothermal resource 1200 MW bull Wind 700 MWbull Solar no potential estimate which depends on solar panels put
up (but currently the largest solar manufacturing hub in Southeast Asia producing 400 MW)
bull Hydro 1784 MW from 888 sitesbull Biomass (bagasse) 235 MMBFOE
The Philippine Experience
bull Amidst the so-called abundance of this Philippine potential for renewable energy about 50 of its power generation still comes from non-renewable sources (ie coal (26) and oil (23)) (Department of Trade and Industry 2009) DTI has forecasted that with growing industrial demand the country will still require 4000 to 4350 MW for sustainability (Department of Trade and Industry 2009)

Microeconomics Price Elasticity of Microeconomics Price Elasticity of DemandDemand
bull Perfectly Inelastic Elasticity
Microeconomics Price Elasticity of Microeconomics Price Elasticity of Demand - ExamplesDemand - Examples
bull For each sample determine elasticity as Perfectly Elastic Elastic Unit Elasticity Inelastic Perfectly inelastic
Microeconomics Price Elasticity of Microeconomics Price Elasticity of Demand ndash Example 1Demand ndash Example 1
bull Rich Asians buy into upwardly mobile Manilas luxury condominiums
bull Yield-hungry investors from Malaysia to Japan now buy Philippine condominium space in bulk rotating money from favorites Hong Kong and Singapore as the authorities there have acted to cool real estate prices property managers and consultants said
bull There has never been this strong foreign interest in the Philippines said David Young Philippines managing director with consultancy and brokerage Colliers International
Microeconomics Price Elasticity of Microeconomics Price Elasticity of Demand - ExamplesDemand - Examples
bull Rich Asians buy into upwardly mobile Manilas luxury condominiums (continuation)
bull Typically 40 of space in newer condominiums is owned by foreigners the maximum they are allowed Foreigners cannot own land in the Philippines but they are allowed to hold condominium titles as long as 60 of the developments total floor area is owned by Filipinos
bull Asians usually buy apartments worth as much as $550000 per unit CPG managing director Robbie Antonio said
Microeconomics Price Elasticity of Microeconomics Price Elasticity of Demand - ExamplesDemand - Examples
bull Rich Asians buy into upwardly mobile Manilas luxury condominiums (continuation)
bull Brokers also noted rising interest in office space on bets that commercial leasing prices will skyrocket as more foreign firms outsource in the country
bull The action remains concentrated in Manila brokers said although it is slowly spilling over into new wave cities in central and southern Philippines which host business process outsourcing firms
bull Top property developers use globally-known luxury brands to attract overseas demand
Microeconomics Price Elasticity of Microeconomics Price Elasticity of Demand - ExamplesDemand - Examples
bull Rich Asians buy into upwardly mobile Manilas luxury condominiums (continuation)
bull Other than Armani CPG has tapped Versace and American socialite Paris Hilton to design interiors Brand associations have attracted interest from foreign nationals Antonio said
bull For their part Megaworlds Go said the company is offering in-house brokerage services to help in leasing apartments
Microeconomics Price Elasticity of Microeconomics Price Elasticity of Demand ndash Example Demand ndash Example
bull The surge in overseas pre-sales also keeps top property firms awash with cash to fund projects and fatten their land bank
bull Jones Langs Leechiu said top developers brush off private equity and sovereign wealth funds seeking discounts as they foresee sustained strong demand from retail buyers
bull If they ask for too much discount we wont agree We dont need the money Go said
Reuters (2014 July 3) Rich Asians buy into upwardly mobile Manilas luxury condominiums Retrieved July 6 2014 from Yahoo Finance httpsfinanceyahoocomnewsrich-asians-buy-upwardly-mobile-052903760html_ylt=AwrSbmsDSLlTHVIATCRXNyoA_ylu=X3oDMTEzbm5lbnJjBHNlYwNzcgRwb3MDMQRjb2xvA2dxMQR2dGlkA1ZJUDQ3M18x
Microeconomics Price Elasticity of Microeconomics Price Elasticity of Demand ndash ExamplesDemand ndash Examples
Microeconomics Expenditures and Price Microeconomics Expenditures and Price ElasticityElasticity
Microeconomics Factors influencing Microeconomics Factors influencing elasticityelasticity
bull Close substitutes increase elasticity
bull Luxuries tend to be more elastic than necessities
bull Elasticity increases when the proportion of income spent on a product is high
bull Elasticity increases over time
Microeconomics Cross elasticity of Microeconomics Cross elasticity of DemandDemand
measures the responsiveness of the quantity demanded of one product to the change in price of another product
If Cross Elasticity Is
The Products Are
Positive Substitutes
Negative Complements
Microeconomics Income elasticity of Microeconomics Income elasticity of DemandDemand
measures the responsiveness of the demand for a product to changes in income
If Income Elasticity Is
Positive and greater than 10
Positive and less than 10
Negative
The Product IsNormal and income elastic
Normal and income inelastic
Inferior
As Income Rises
The amount of income spent and of income spent on the product rise
The amount of income spent rises but the of income spent on the product falls
The amount of income spent and of income spent on the product fall
Microeconomics Price elasticity of Microeconomics Price elasticity of SupplySupply
measures the responsiveness of the quantity supplied of a product to a change in its price
More Elastic Supply
Product is easy to produce with many different common types of resources
Less Elastic Supply
Product is hard to produce and requires very specific scarce resources
Microeconomics Examples of factors Microeconomics Examples of factors affecting increase (decrease) demand for affecting increase (decrease) demand for goodsgoods
Microeconomics Examples of factors Microeconomics Examples of factors affecting increase (decrease) supply for affecting increase (decrease) supply for goodsgoods
Microeconomics Example of factors Microeconomics Example of factors affecting increase (decrease) supply for affecting increase (decrease) supply for goodsgoods
bull Discussion Questions bull Predict what may happen to the usage by the riding
public of the MRT Of the Bus bull Do you think the MRTLRT fare hike is good
bull MRT LRT fares may go up in AugustmdashAbayabull By Miguel R Camus |Philippine Daily Inquirer 1226
am | Friday June 21st 2013 bull Read more httpbusinessinquirernet128269mrt-lrt-fares-may-go-up-in-
august-abayaixzz36mF0nFX7
Microeconomics Example of factors Microeconomics Example of factors affecting increase (decrease) supply for affecting increase (decrease) supply for goodsgoods
bull Read more httpbusinessinquirernet128269mrt-lrt-fares-may-go-up-in-august-abayaixzz36mF0nFX7
bull This means fares which were last adjusted in the early 2000s will increase by P5 in 2013 while the second P5 increase will kick in next year
bull The announcement of the fare increases comes amid severe criticism of the LRT-MRT operationsmdashcoaches with passengers woefully packed like sardines most times of the day and long queues to the stations during rush hours
Microeconomics Example of factors Microeconomics Example of factors affecting increase (decrease) supply for affecting increase (decrease) supply for goodsgoods
bull Read more httpbusinessinquirernet128269mrt-lrt-fares-may-go-up-in-august-abayaixzz36mF0nFX7
bull For example MRT 3 was designed to serve 350000 passengers per day but some 600000 people cram the system daily
bull A 13-kilometer stretch of the line on north Edsamdashfrom Muntildeoz to Trinomamdashhas yet to be connected three years into the Aquino administration
bull Critics say that no mass transportation system anywhere in the world makes money quite apart from Hong Kong
Microeconomics Example of factors Microeconomics Example of factors affecting increase (decrease) supply for affecting increase (decrease) supply for goodsgoods
bull Read more httpbusinessinquirernet128269mrt-lrt-fares-may-go-up-in-august-abayaixzz36mF0nFX7
bull Even with the fare increase the LRT lines and MRT 3 come out ldquocheaperrdquo than rates charged by bus operators which are pegged at P40 per passenger Abaya said
bull The current fare at MRT which runs through Edsa Metro Manilarsquos main highway is pegged at a maximum of P15 per passenger For LRT 1 passengers are charged up to P20 each for a single journey for LRT 2 the rate is pegged at P15
Microeconomics Example of factors Microeconomics Example of factors affecting increase (decrease) supply for affecting increase (decrease) supply for goodsgoods
bull Read more httpbusinessinquirernet128269mrt-lrt-fares-may-go-up-in-august-abayaixzz36mF0nFX7
bull Unlike other agencies under the DOTC the LRTA is unique as it does not have a regulating body when it comes to setting fares
bull For the MRT 3 alone Abaya said the government was spending P60 to transport one passenger from end to end well above the current ticket price This translates to about P7 billion to P9 billion in subsidies every year
Microeconomics Example of factors Microeconomics Example of factors affecting increase (decrease) supply for affecting increase (decrease) supply for goodsgoods
bull Read more httpbusinessinquirernet128269mrt-lrt-fares-may-go-up-in-august-abayaixzz36mF0nFX7
bull To address overcrowding the DOTC is evaluating a proposal by a Chinese manufacturer as part of its plan to acquire 48 new train cars to expand MRT 3rsquos capacity
bull ldquoComplete delivery will happen on May 2016rdquo he said
bull MRT 3 currently has a fleet of 73 train cars serving passengers at 3-minute intervals The DOTC said the addition of new cars will cut the waiting time to 25-minute intervals
Marginal Benefit vs Marginal CostMarginal Benefit vs Marginal Costbull Marginal Benefit ndash Benefit that an individual gets from consuming an
additional unit of good or service However each additional unit consumed results in smaller marginal benefit and results in diminishing returns
The demand curve represents the marginal benefit curve of the product to consumers
bull Marginal Cost ndash Cost of producing an additional unit of output also referred to as opportunity cost
The supply curve represents the marginal cost curve of the producers
Marginal Benefit vs Marginal Cost ndash Marginal Benefit vs Marginal Cost ndash Example 1Example 1
bull Read more httpnewsinfoinquirernet617323sc-ruling-on-dap-checks-balances-democracy-workixzz36mhRVdfo Follow us inquirerdotnet on Twitter | inquirerdotnet on Facebook
bull The Supreme Court last Tuesday struck down the DAP including a circular allowing the release of savings from the executive department to agencies and projects outside the national budget approved by Congress
bull The executive department pooled savings under the DAP a stimulus program introduced in 2011 and allotted these for projects to speed up government spending and boost economic growth
bull
Marginal Benefit vs Marginal Cost ndash Marginal Benefit vs Marginal Cost ndash Example 2Example 2
bull The selling price is P100bull The variable cost per unit is P40 (of which is P5 marketing
costs)bull The total fixed manufacturing cost is P5000bull The total fixed administrative costs is P2200
bull Requirementsbull Compute for the break-even unitsbull If there are 150 units how much is the increase in net income
Consumer Surplus amp Producer SurplusConsumer Surplus amp Producer Surplusbull Consumer Surplus is the difference
between total value consumers place on a good produced less the amount paid
bull Producer Surplus is the difference between the price received for each good produced and the opportunity cost of producing the good
bull The difference between the lowest available price for a good and the highest price is the producer surplus
Price Takers amp SearchersPrice Takers amp Searchersbull Price takers must take the market
price in selling their product because each price takerrsquos output is small relative to total market
bull Price searchers have a downward sloping demand curve for their product The amount they are able to sell is inversely related to the price they charge
Price Taker Market Characteristics1048729 All firms are producing an identical product1048729 A large number of firms exist in the market1048729 Each firm supplies only a very small portion of total amount supplied to the market1048729 No barriers limit the entry or exit of firms in the market
Market StructuresMarket StructuresPerfect
Competition
of Sellers and Buyers
Many
Sellerrsquos Products
Identical
Barriers to entry None
Economies of Scale
Low
Competition Between Sellers
High
Other
Buyers have perfect
knowledge of product and
price
MonopolisticCompetition
Many
Slight Differences
None
Low
High
Oligopoly
A Few Sellers
No Close Substitutes
High
Often High
High or Low
Sellers are independent
but have incentive to form cartel
Monopoly
One Seller
No Close Substitutes
Insurmountable
Often High
None
Macroeconomic ConceptMacroeconomic Conceptbull Macroeconomic concepts that have an impact on all firms
in the same environment be it a country a group of related countries or a particular industry
bull Topics covered concepts about the business cycle and how to forecast changes in the business cycle and the impact on among other things price levels and profitability
Macroeconomic Concept Business CycleMacroeconomic Concept Business Cyclebull
Moderating the Business Cycle
Policies can be used to moderate the business cycle
Status of the Economy
Appropriate Action
Using Fiscal Policy
Using Monetary Policy
RecessionGDP lt PotentialExcess unemployment
StimulusAD uarr
G uarr T darrDeficit uarr
M uarr
BoomGDP gt PotentialRising real wages
ContractionAD darr
G darr T uarrDeficit darr
M darr
bull The actions can be oDiscretionary actions require a policy change
Example bull Increase government spending on roadsbullRaise income tax rates
Moderating the Business Cycle (continued)
oAutomatic actions require no policy change and occur with changes in the level of economic activity Examples
bull Income taxes are based on progressive rates so total taxes fall at an accelerating rate with declining economic activity
bull Needs-based spending such as unemployment insurance automatically increases with rising unemployment
Moderating the Business Cycle (continued)
bull Discretionary policy is hampered by lags oRecognition oLaw-makingoImpact
Moderating the Business Cycle (continued)
bull bull The Rate of Inflation is calculated as Inflation = Last yearrsquos price index - This yearrsquos price index 100
rate Last yearrsquos price index
bull bull Inflation is an increase in the general level of prices
Macroeconomics Inflation
Inflation and Interest Rates
Nominal interest rates reflect both an expectation of inflation and a real rate of interest
bull Supply set by BSPbull Demand is a function of interest rate
bull Investment demand for capitalbull Savings supplybull Real interest rate is independent of inflation rate
Change in inflation expectations directly changes nominal rates
rnom = Real rate + E(inf)
Unexpected inflation redistributes income among economic groups
If inflation is higher than expected
Interest rates will have been set too low
Benefits borrowers at the expense of lenders
Causes borrowers to regret they did not borrow more and lenders to regret they did not lend less
Inflation and Interest Rates (continued)
If inflation is lower than expected
Interest rates will have been set too high
Benefits lenders at the expense of borrowers
Causes lenders to regret they did not lend more and borrowers to regret they did not borrow less
Inflation and Interest Rates (continued)
Two Types of Inflation
Demand-Pull Inflation starts with an increase in AD Typical causes of the increase include an increase in the money supply government spending or exports Assuming the economy is already at full employment
bull The increase in AD will increase GDPReal and the price level bull But rising costs will decrease SRAS leading to another increase in the
price level and decrease in GDPReal
bull Net result is a one time round of price increases and no change in GDPReal
bull However if the money supply continues to grow excessively and fuel AD the demand-pull inflation process can continue
Cost-Push Inflation starts with an increase in costs Typical causes of the increase include a rise in the money wage rate or raw material prices
Rising costs reduce the SRAS curve and the initial effect is to increase prices and decrease GDPReal
This fall below GDPPotential could precipitate government stimulation which will increase AD leading to another increase in prices and an increase back to GDPPotential
Net result is a one time round of price increases and no change in GDPReal
Two Types of Inflation (continued)
In the short run Some inputs (such as labor and raw materials) are variable but others (such as
property plant and equipment) are not Output can benefit by the specialization of labor All inputs are subject to the Law of Diminishing Returns
Output in the Short Run
AFC Falls as output rises and fixed cost is spread AVC and MC
bull First fall with specializationbull Then rise with Law of Diminishing Returns
MC When rising it will intersect the minimum points on AVC and ATC
Expected Relationships in the Short-Run
Expected Relationships in the Short-Run
In the long run all costs are variable and the firm can alter the size of its plant to meet higher or lower product demand
bull If expanding plant size leads to more efficiency and specialization the minimum point on the SRATC curve will be lower
bull If expanding the plant size leads to less efficiency and specialization the minimum point on the SRATC curve will be higher
bull These minimum points become the firms LRATC curve (which can be upward flat or even downward sloping)
The minimum point on the LRATC curve is the firmrsquos minimum efficient scale
Costs in the Long Run (continued)
In the short run some costs are fixed and the firm will maximize profits by operating at the minimum point on its SRATC curve
Costs in the Long Run
The aggregate demand curve (AD) measures the amount of total real consumption expenditures (goods and services) demanded at various price levels
AD = Y = C+I+G + (XndashM) = GDPRealAD curversquos downward slope is caused by the
bull Wealth Effect Rising inflation (GDP Deflator uarr) causes financial assets to lose value All other things equal this leads to increased savings and decreased current spending
bull Substitution Effect Rising prices and inflation increase nominal interest rates which reduces borrowing to fund current consumer and investment spending
A change in AD curve is due to a factor other than price
Aggregate supply is the quantity of goods services supplied (GDPReal) It is a function of aggregate production which depends on
bull Quantity of Labor (L)
bull Quantity of Capital (K)
bull Level of Technology (T)
At any one point in time the level of technology and quantity of capital are fixed but the quantity of labor is variable This produces a vertical long-run aggregate supply and an upward sloping short-run aggregate supply curve
Potential GDP increases over time with increases in the
Increases in factor costs decrease the SRAS curve
bull ldquoFull employmentrdquo quantity of labor
bull Capital (human and physical)
bull Level of Technology
bull ldquoDoes not affect real factors of production and Potential GDP
bull Rising production costs decreases SRAS (higher price for any quantity of output)
bull Assuming all other prices rise at the same rate the economy remains at Potential GDP but at a higher price level
Classical View The economy is self regulating back to full employment
bull Wages and prices adjust fully and quickly to eliminate shortages and surpluses to restore economic efficiency and full employment
bull Taxes and government intervention are potential disruption to the market signals necessary for fully functioning competitive markets
bull Technology is the prime driver in increasing aggregate demand and supply over time
Keynesian View The economy is inherently unstable and does not return to a long-run equilibrium (potential GDP) without government intervention
bull Expectation are the primary determinant of AD and expectations are the subject to excesses of optimism and pessimism (leading to inflation and recession)
bull SRAS does not quickly adjust because wages in particular are ldquostickyrdquo in the downward direction
bull Government intervention to dampen or stimulate the economy is needed to maintain output at potential GDP
Monetarist View The economy is self regulating back to full employment as long as the money supply grows at an appropriate stable pace
bull The quantity of money fuels aggregate demandbull Recessions are caused by bad monetary policybull The wage rate is sticky which delays economic recoveries when
coming from recessionbull Taxes and government intervention are a potential disruption to the
market signals necessary to make competitive markets work
MONEYMoney is a means of payment to settle a debt for a current or prior purchase It has three functions
Medium of exchange for goods or services Credit cards are not money they just delay the debt Checks are not money They move funds (money) from one account to
another Checking account balances are money
Store of value that can be held and exchanged for goods in the futureUnit of account that allows relative prices to be quoted in a standard unit
The Supply and Demand for Money
The supply of money is fixed at any point in time by the Fed (hence the vertical supply curve)
The ldquopricerdquo of money is the interest rate
Equilibrium Price
Shortage leads to selling of investments
Surplus of money leads market participants to invest
bull The demand for money is affected by four major factorsoThe level of interest rates cause movement on the demand
curve and is inversely related to demandHigher rates create an incentive to invest instead of holding money
Higher rates are associated with higher inflation which causes money to lose value
The Supply and Demand for Money (continued)
oThe General Price LevelQuantity of nominal money demanded is directly related to the price level
Quantity of real dollars demanded is independent of the price level
oReal GDP demand for money is directly related to real income
oFinancial Innovation has generally led to greater liquidity and decreased demand for narrowly defined money
The Supply and Demand for Money (continued)
Two Categoriesbull Renewable resources are replenished by naturebull Nonrenewable resources are used up in production
Renewable Resourcesbull Total supply is fixed and inelasticbull Any one purchaser can obtain more by paying a higher price
Non-Renewable Resourcesbull Total supply (both known and expected to be recovered supply) is fixed known
and perfectly elasticbull Total demand (current and all future demand) determine future pricebull Current price is the PV of future price causing the current price to rise over time
at the rate of interest rates (Hotelling Principle)bull Lack of perfect knowledge of future supply demand and interest rate can lead to
surprise changes in price today
The materials balances model
bull Kneese Ayresand DrsquoArge (1970) (Thomas 2010) (Figure 10)
Environmental Policies
The Philippine Experience
bull PD 1151 Philippine Environmental Policy (1977)bull Renewable Energy Act (2008)bull In December of 2008 then President Gloria M Arroyo
signed into law the Republic Act 9513 Renewable Energy (RE) Act of 2008-an act promoting the development utilization and commercialization of renewable energy resources and for other purposes
The Philippine Experience
bull Its targets were ldquofor the Philippines (Perez 2009) bull to be the No1 geothermal producer in the worldbull to be the No1 wind power producer in the Southeast
Asiabull to double its hydro capacity by 2013bull to expand contribution of biomass solar and ocean
energy by 250 MWrdquo
The Philippine Experience
bull The Philippines has an abounding potential for generating energy from renewable resources (Perez 2009)bull Geothermal resource 1200 MW bull Wind 700 MWbull Solar no potential estimate which depends on solar panels put
up (but currently the largest solar manufacturing hub in Southeast Asia producing 400 MW)
bull Hydro 1784 MW from 888 sitesbull Biomass (bagasse) 235 MMBFOE
The Philippine Experience
bull Amidst the so-called abundance of this Philippine potential for renewable energy about 50 of its power generation still comes from non-renewable sources (ie coal (26) and oil (23)) (Department of Trade and Industry 2009) DTI has forecasted that with growing industrial demand the country will still require 4000 to 4350 MW for sustainability (Department of Trade and Industry 2009)
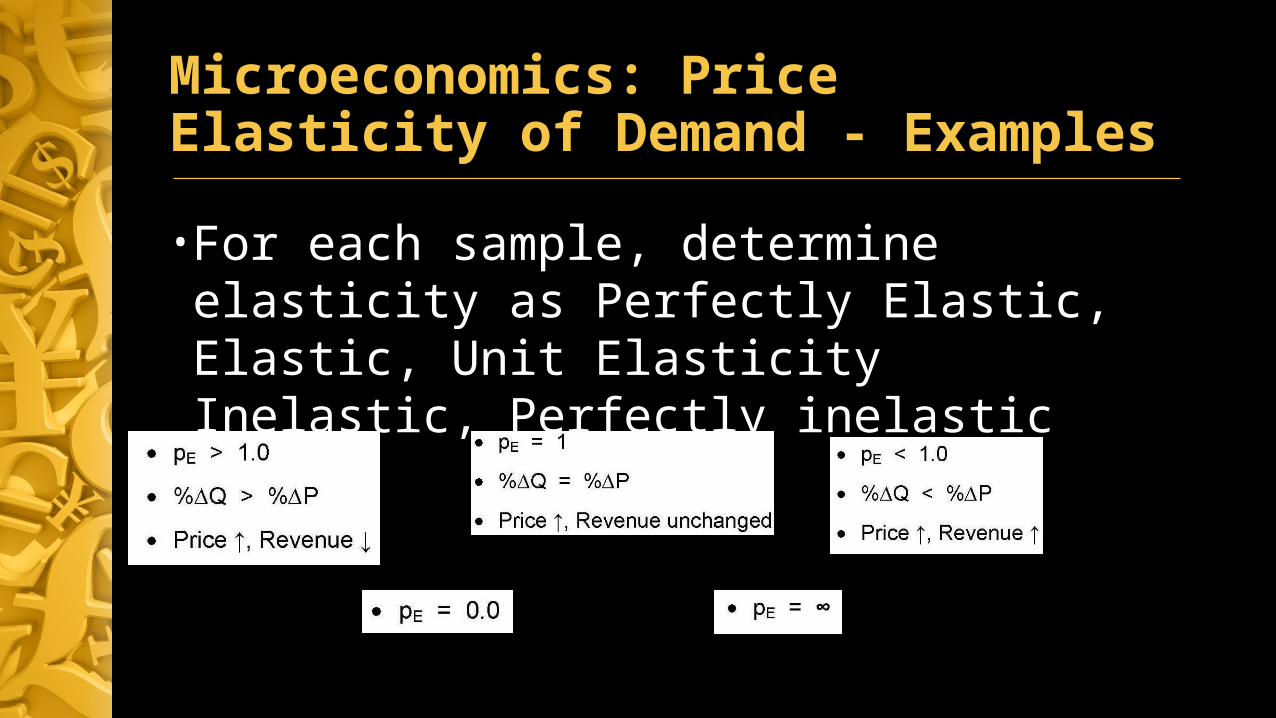
Microeconomics Price Elasticity of Microeconomics Price Elasticity of Demand - ExamplesDemand - Examples
bull For each sample determine elasticity as Perfectly Elastic Elastic Unit Elasticity Inelastic Perfectly inelastic
Microeconomics Price Elasticity of Microeconomics Price Elasticity of Demand ndash Example 1Demand ndash Example 1
bull Rich Asians buy into upwardly mobile Manilas luxury condominiums
bull Yield-hungry investors from Malaysia to Japan now buy Philippine condominium space in bulk rotating money from favorites Hong Kong and Singapore as the authorities there have acted to cool real estate prices property managers and consultants said
bull There has never been this strong foreign interest in the Philippines said David Young Philippines managing director with consultancy and brokerage Colliers International
Microeconomics Price Elasticity of Microeconomics Price Elasticity of Demand - ExamplesDemand - Examples
bull Rich Asians buy into upwardly mobile Manilas luxury condominiums (continuation)
bull Typically 40 of space in newer condominiums is owned by foreigners the maximum they are allowed Foreigners cannot own land in the Philippines but they are allowed to hold condominium titles as long as 60 of the developments total floor area is owned by Filipinos
bull Asians usually buy apartments worth as much as $550000 per unit CPG managing director Robbie Antonio said
Microeconomics Price Elasticity of Microeconomics Price Elasticity of Demand - ExamplesDemand - Examples
bull Rich Asians buy into upwardly mobile Manilas luxury condominiums (continuation)
bull Brokers also noted rising interest in office space on bets that commercial leasing prices will skyrocket as more foreign firms outsource in the country
bull The action remains concentrated in Manila brokers said although it is slowly spilling over into new wave cities in central and southern Philippines which host business process outsourcing firms
bull Top property developers use globally-known luxury brands to attract overseas demand
Microeconomics Price Elasticity of Microeconomics Price Elasticity of Demand - ExamplesDemand - Examples
bull Rich Asians buy into upwardly mobile Manilas luxury condominiums (continuation)
bull Other than Armani CPG has tapped Versace and American socialite Paris Hilton to design interiors Brand associations have attracted interest from foreign nationals Antonio said
bull For their part Megaworlds Go said the company is offering in-house brokerage services to help in leasing apartments
Microeconomics Price Elasticity of Microeconomics Price Elasticity of Demand ndash Example Demand ndash Example
bull The surge in overseas pre-sales also keeps top property firms awash with cash to fund projects and fatten their land bank
bull Jones Langs Leechiu said top developers brush off private equity and sovereign wealth funds seeking discounts as they foresee sustained strong demand from retail buyers
bull If they ask for too much discount we wont agree We dont need the money Go said
Reuters (2014 July 3) Rich Asians buy into upwardly mobile Manilas luxury condominiums Retrieved July 6 2014 from Yahoo Finance httpsfinanceyahoocomnewsrich-asians-buy-upwardly-mobile-052903760html_ylt=AwrSbmsDSLlTHVIATCRXNyoA_ylu=X3oDMTEzbm5lbnJjBHNlYwNzcgRwb3MDMQRjb2xvA2dxMQR2dGlkA1ZJUDQ3M18x
Microeconomics Price Elasticity of Microeconomics Price Elasticity of Demand ndash ExamplesDemand ndash Examples
Microeconomics Expenditures and Price Microeconomics Expenditures and Price ElasticityElasticity
Microeconomics Factors influencing Microeconomics Factors influencing elasticityelasticity
bull Close substitutes increase elasticity
bull Luxuries tend to be more elastic than necessities
bull Elasticity increases when the proportion of income spent on a product is high
bull Elasticity increases over time
Microeconomics Cross elasticity of Microeconomics Cross elasticity of DemandDemand
measures the responsiveness of the quantity demanded of one product to the change in price of another product
If Cross Elasticity Is
The Products Are
Positive Substitutes
Negative Complements
Microeconomics Income elasticity of Microeconomics Income elasticity of DemandDemand
measures the responsiveness of the demand for a product to changes in income
If Income Elasticity Is
Positive and greater than 10
Positive and less than 10
Negative
The Product IsNormal and income elastic
Normal and income inelastic
Inferior
As Income Rises
The amount of income spent and of income spent on the product rise
The amount of income spent rises but the of income spent on the product falls
The amount of income spent and of income spent on the product fall
Microeconomics Price elasticity of Microeconomics Price elasticity of SupplySupply
measures the responsiveness of the quantity supplied of a product to a change in its price
More Elastic Supply
Product is easy to produce with many different common types of resources
Less Elastic Supply
Product is hard to produce and requires very specific scarce resources
Microeconomics Examples of factors Microeconomics Examples of factors affecting increase (decrease) demand for affecting increase (decrease) demand for goodsgoods
Microeconomics Examples of factors Microeconomics Examples of factors affecting increase (decrease) supply for affecting increase (decrease) supply for goodsgoods
Microeconomics Example of factors Microeconomics Example of factors affecting increase (decrease) supply for affecting increase (decrease) supply for goodsgoods
bull Discussion Questions bull Predict what may happen to the usage by the riding
public of the MRT Of the Bus bull Do you think the MRTLRT fare hike is good
bull MRT LRT fares may go up in AugustmdashAbayabull By Miguel R Camus |Philippine Daily Inquirer 1226
am | Friday June 21st 2013 bull Read more httpbusinessinquirernet128269mrt-lrt-fares-may-go-up-in-
august-abayaixzz36mF0nFX7
Microeconomics Example of factors Microeconomics Example of factors affecting increase (decrease) supply for affecting increase (decrease) supply for goodsgoods
bull Read more httpbusinessinquirernet128269mrt-lrt-fares-may-go-up-in-august-abayaixzz36mF0nFX7
bull This means fares which were last adjusted in the early 2000s will increase by P5 in 2013 while the second P5 increase will kick in next year
bull The announcement of the fare increases comes amid severe criticism of the LRT-MRT operationsmdashcoaches with passengers woefully packed like sardines most times of the day and long queues to the stations during rush hours
Microeconomics Example of factors Microeconomics Example of factors affecting increase (decrease) supply for affecting increase (decrease) supply for goodsgoods
bull Read more httpbusinessinquirernet128269mrt-lrt-fares-may-go-up-in-august-abayaixzz36mF0nFX7
bull For example MRT 3 was designed to serve 350000 passengers per day but some 600000 people cram the system daily
bull A 13-kilometer stretch of the line on north Edsamdashfrom Muntildeoz to Trinomamdashhas yet to be connected three years into the Aquino administration
bull Critics say that no mass transportation system anywhere in the world makes money quite apart from Hong Kong
Microeconomics Example of factors Microeconomics Example of factors affecting increase (decrease) supply for affecting increase (decrease) supply for goodsgoods
bull Read more httpbusinessinquirernet128269mrt-lrt-fares-may-go-up-in-august-abayaixzz36mF0nFX7
bull Even with the fare increase the LRT lines and MRT 3 come out ldquocheaperrdquo than rates charged by bus operators which are pegged at P40 per passenger Abaya said
bull The current fare at MRT which runs through Edsa Metro Manilarsquos main highway is pegged at a maximum of P15 per passenger For LRT 1 passengers are charged up to P20 each for a single journey for LRT 2 the rate is pegged at P15
Microeconomics Example of factors Microeconomics Example of factors affecting increase (decrease) supply for affecting increase (decrease) supply for goodsgoods
bull Read more httpbusinessinquirernet128269mrt-lrt-fares-may-go-up-in-august-abayaixzz36mF0nFX7
bull Unlike other agencies under the DOTC the LRTA is unique as it does not have a regulating body when it comes to setting fares
bull For the MRT 3 alone Abaya said the government was spending P60 to transport one passenger from end to end well above the current ticket price This translates to about P7 billion to P9 billion in subsidies every year
Microeconomics Example of factors Microeconomics Example of factors affecting increase (decrease) supply for affecting increase (decrease) supply for goodsgoods
bull Read more httpbusinessinquirernet128269mrt-lrt-fares-may-go-up-in-august-abayaixzz36mF0nFX7
bull To address overcrowding the DOTC is evaluating a proposal by a Chinese manufacturer as part of its plan to acquire 48 new train cars to expand MRT 3rsquos capacity
bull ldquoComplete delivery will happen on May 2016rdquo he said
bull MRT 3 currently has a fleet of 73 train cars serving passengers at 3-minute intervals The DOTC said the addition of new cars will cut the waiting time to 25-minute intervals
Marginal Benefit vs Marginal CostMarginal Benefit vs Marginal Costbull Marginal Benefit ndash Benefit that an individual gets from consuming an
additional unit of good or service However each additional unit consumed results in smaller marginal benefit and results in diminishing returns
The demand curve represents the marginal benefit curve of the product to consumers
bull Marginal Cost ndash Cost of producing an additional unit of output also referred to as opportunity cost
The supply curve represents the marginal cost curve of the producers
Marginal Benefit vs Marginal Cost ndash Marginal Benefit vs Marginal Cost ndash Example 1Example 1
bull Read more httpnewsinfoinquirernet617323sc-ruling-on-dap-checks-balances-democracy-workixzz36mhRVdfo Follow us inquirerdotnet on Twitter | inquirerdotnet on Facebook
bull The Supreme Court last Tuesday struck down the DAP including a circular allowing the release of savings from the executive department to agencies and projects outside the national budget approved by Congress
bull The executive department pooled savings under the DAP a stimulus program introduced in 2011 and allotted these for projects to speed up government spending and boost economic growth
bull
Marginal Benefit vs Marginal Cost ndash Marginal Benefit vs Marginal Cost ndash Example 2Example 2
bull The selling price is P100bull The variable cost per unit is P40 (of which is P5 marketing
costs)bull The total fixed manufacturing cost is P5000bull The total fixed administrative costs is P2200
bull Requirementsbull Compute for the break-even unitsbull If there are 150 units how much is the increase in net income
Consumer Surplus amp Producer SurplusConsumer Surplus amp Producer Surplusbull Consumer Surplus is the difference
between total value consumers place on a good produced less the amount paid
bull Producer Surplus is the difference between the price received for each good produced and the opportunity cost of producing the good
bull The difference between the lowest available price for a good and the highest price is the producer surplus
Price Takers amp SearchersPrice Takers amp Searchersbull Price takers must take the market
price in selling their product because each price takerrsquos output is small relative to total market
bull Price searchers have a downward sloping demand curve for their product The amount they are able to sell is inversely related to the price they charge
Price Taker Market Characteristics1048729 All firms are producing an identical product1048729 A large number of firms exist in the market1048729 Each firm supplies only a very small portion of total amount supplied to the market1048729 No barriers limit the entry or exit of firms in the market
Market StructuresMarket StructuresPerfect
Competition
of Sellers and Buyers
Many
Sellerrsquos Products
Identical
Barriers to entry None
Economies of Scale
Low
Competition Between Sellers
High
Other
Buyers have perfect
knowledge of product and
price
MonopolisticCompetition
Many
Slight Differences
None
Low
High
Oligopoly
A Few Sellers
No Close Substitutes
High
Often High
High or Low
Sellers are independent
but have incentive to form cartel
Monopoly
One Seller
No Close Substitutes
Insurmountable
Often High
None
Macroeconomic ConceptMacroeconomic Conceptbull Macroeconomic concepts that have an impact on all firms
in the same environment be it a country a group of related countries or a particular industry
bull Topics covered concepts about the business cycle and how to forecast changes in the business cycle and the impact on among other things price levels and profitability
Macroeconomic Concept Business CycleMacroeconomic Concept Business Cyclebull
Moderating the Business Cycle
Policies can be used to moderate the business cycle
Status of the Economy
Appropriate Action
Using Fiscal Policy
Using Monetary Policy
RecessionGDP lt PotentialExcess unemployment
StimulusAD uarr
G uarr T darrDeficit uarr
M uarr
BoomGDP gt PotentialRising real wages
ContractionAD darr
G darr T uarrDeficit darr
M darr
bull The actions can be oDiscretionary actions require a policy change
Example bull Increase government spending on roadsbullRaise income tax rates
Moderating the Business Cycle (continued)
oAutomatic actions require no policy change and occur with changes in the level of economic activity Examples
bull Income taxes are based on progressive rates so total taxes fall at an accelerating rate with declining economic activity
bull Needs-based spending such as unemployment insurance automatically increases with rising unemployment
Moderating the Business Cycle (continued)
bull Discretionary policy is hampered by lags oRecognition oLaw-makingoImpact
Moderating the Business Cycle (continued)
bull bull The Rate of Inflation is calculated as Inflation = Last yearrsquos price index - This yearrsquos price index 100
rate Last yearrsquos price index
bull bull Inflation is an increase in the general level of prices
Macroeconomics Inflation
Inflation and Interest Rates
Nominal interest rates reflect both an expectation of inflation and a real rate of interest
bull Supply set by BSPbull Demand is a function of interest rate
bull Investment demand for capitalbull Savings supplybull Real interest rate is independent of inflation rate
Change in inflation expectations directly changes nominal rates
rnom = Real rate + E(inf)
Unexpected inflation redistributes income among economic groups
If inflation is higher than expected
Interest rates will have been set too low
Benefits borrowers at the expense of lenders
Causes borrowers to regret they did not borrow more and lenders to regret they did not lend less
Inflation and Interest Rates (continued)
If inflation is lower than expected
Interest rates will have been set too high
Benefits lenders at the expense of borrowers
Causes lenders to regret they did not lend more and borrowers to regret they did not borrow less
Inflation and Interest Rates (continued)
Two Types of Inflation
Demand-Pull Inflation starts with an increase in AD Typical causes of the increase include an increase in the money supply government spending or exports Assuming the economy is already at full employment
bull The increase in AD will increase GDPReal and the price level bull But rising costs will decrease SRAS leading to another increase in the
price level and decrease in GDPReal
bull Net result is a one time round of price increases and no change in GDPReal
bull However if the money supply continues to grow excessively and fuel AD the demand-pull inflation process can continue
Cost-Push Inflation starts with an increase in costs Typical causes of the increase include a rise in the money wage rate or raw material prices
Rising costs reduce the SRAS curve and the initial effect is to increase prices and decrease GDPReal
This fall below GDPPotential could precipitate government stimulation which will increase AD leading to another increase in prices and an increase back to GDPPotential
Net result is a one time round of price increases and no change in GDPReal
Two Types of Inflation (continued)
In the short run Some inputs (such as labor and raw materials) are variable but others (such as
property plant and equipment) are not Output can benefit by the specialization of labor All inputs are subject to the Law of Diminishing Returns
Output in the Short Run
AFC Falls as output rises and fixed cost is spread AVC and MC
bull First fall with specializationbull Then rise with Law of Diminishing Returns
MC When rising it will intersect the minimum points on AVC and ATC
Expected Relationships in the Short-Run
Expected Relationships in the Short-Run
In the long run all costs are variable and the firm can alter the size of its plant to meet higher or lower product demand
bull If expanding plant size leads to more efficiency and specialization the minimum point on the SRATC curve will be lower
bull If expanding the plant size leads to less efficiency and specialization the minimum point on the SRATC curve will be higher
bull These minimum points become the firms LRATC curve (which can be upward flat or even downward sloping)
The minimum point on the LRATC curve is the firmrsquos minimum efficient scale
Costs in the Long Run (continued)
In the short run some costs are fixed and the firm will maximize profits by operating at the minimum point on its SRATC curve
Costs in the Long Run
The aggregate demand curve (AD) measures the amount of total real consumption expenditures (goods and services) demanded at various price levels
AD = Y = C+I+G + (XndashM) = GDPRealAD curversquos downward slope is caused by the
bull Wealth Effect Rising inflation (GDP Deflator uarr) causes financial assets to lose value All other things equal this leads to increased savings and decreased current spending
bull Substitution Effect Rising prices and inflation increase nominal interest rates which reduces borrowing to fund current consumer and investment spending
A change in AD curve is due to a factor other than price
Aggregate supply is the quantity of goods services supplied (GDPReal) It is a function of aggregate production which depends on
bull Quantity of Labor (L)
bull Quantity of Capital (K)
bull Level of Technology (T)
At any one point in time the level of technology and quantity of capital are fixed but the quantity of labor is variable This produces a vertical long-run aggregate supply and an upward sloping short-run aggregate supply curve
Potential GDP increases over time with increases in the
Increases in factor costs decrease the SRAS curve
bull ldquoFull employmentrdquo quantity of labor
bull Capital (human and physical)
bull Level of Technology
bull ldquoDoes not affect real factors of production and Potential GDP
bull Rising production costs decreases SRAS (higher price for any quantity of output)
bull Assuming all other prices rise at the same rate the economy remains at Potential GDP but at a higher price level
Classical View The economy is self regulating back to full employment
bull Wages and prices adjust fully and quickly to eliminate shortages and surpluses to restore economic efficiency and full employment
bull Taxes and government intervention are potential disruption to the market signals necessary for fully functioning competitive markets
bull Technology is the prime driver in increasing aggregate demand and supply over time
Keynesian View The economy is inherently unstable and does not return to a long-run equilibrium (potential GDP) without government intervention
bull Expectation are the primary determinant of AD and expectations are the subject to excesses of optimism and pessimism (leading to inflation and recession)
bull SRAS does not quickly adjust because wages in particular are ldquostickyrdquo in the downward direction
bull Government intervention to dampen or stimulate the economy is needed to maintain output at potential GDP
Monetarist View The economy is self regulating back to full employment as long as the money supply grows at an appropriate stable pace
bull The quantity of money fuels aggregate demandbull Recessions are caused by bad monetary policybull The wage rate is sticky which delays economic recoveries when
coming from recessionbull Taxes and government intervention are a potential disruption to the
market signals necessary to make competitive markets work
MONEYMoney is a means of payment to settle a debt for a current or prior purchase It has three functions
Medium of exchange for goods or services Credit cards are not money they just delay the debt Checks are not money They move funds (money) from one account to
another Checking account balances are money
Store of value that can be held and exchanged for goods in the futureUnit of account that allows relative prices to be quoted in a standard unit
The Supply and Demand for Money
The supply of money is fixed at any point in time by the Fed (hence the vertical supply curve)
The ldquopricerdquo of money is the interest rate
Equilibrium Price
Shortage leads to selling of investments
Surplus of money leads market participants to invest
bull The demand for money is affected by four major factorsoThe level of interest rates cause movement on the demand
curve and is inversely related to demandHigher rates create an incentive to invest instead of holding money
Higher rates are associated with higher inflation which causes money to lose value
The Supply and Demand for Money (continued)
oThe General Price LevelQuantity of nominal money demanded is directly related to the price level
Quantity of real dollars demanded is independent of the price level
oReal GDP demand for money is directly related to real income
oFinancial Innovation has generally led to greater liquidity and decreased demand for narrowly defined money
The Supply and Demand for Money (continued)
Two Categoriesbull Renewable resources are replenished by naturebull Nonrenewable resources are used up in production
Renewable Resourcesbull Total supply is fixed and inelasticbull Any one purchaser can obtain more by paying a higher price
Non-Renewable Resourcesbull Total supply (both known and expected to be recovered supply) is fixed known
and perfectly elasticbull Total demand (current and all future demand) determine future pricebull Current price is the PV of future price causing the current price to rise over time
at the rate of interest rates (Hotelling Principle)bull Lack of perfect knowledge of future supply demand and interest rate can lead to
surprise changes in price today
The materials balances model
bull Kneese Ayresand DrsquoArge (1970) (Thomas 2010) (Figure 10)
Environmental Policies
The Philippine Experience
bull PD 1151 Philippine Environmental Policy (1977)bull Renewable Energy Act (2008)bull In December of 2008 then President Gloria M Arroyo
signed into law the Republic Act 9513 Renewable Energy (RE) Act of 2008-an act promoting the development utilization and commercialization of renewable energy resources and for other purposes
The Philippine Experience
bull Its targets were ldquofor the Philippines (Perez 2009) bull to be the No1 geothermal producer in the worldbull to be the No1 wind power producer in the Southeast
Asiabull to double its hydro capacity by 2013bull to expand contribution of biomass solar and ocean
energy by 250 MWrdquo
The Philippine Experience
bull The Philippines has an abounding potential for generating energy from renewable resources (Perez 2009)bull Geothermal resource 1200 MW bull Wind 700 MWbull Solar no potential estimate which depends on solar panels put
up (but currently the largest solar manufacturing hub in Southeast Asia producing 400 MW)
bull Hydro 1784 MW from 888 sitesbull Biomass (bagasse) 235 MMBFOE
The Philippine Experience
bull Amidst the so-called abundance of this Philippine potential for renewable energy about 50 of its power generation still comes from non-renewable sources (ie coal (26) and oil (23)) (Department of Trade and Industry 2009) DTI has forecasted that with growing industrial demand the country will still require 4000 to 4350 MW for sustainability (Department of Trade and Industry 2009)

Microeconomics Price Elasticity of Microeconomics Price Elasticity of Demand - ExamplesDemand - Examples
bull Rich Asians buy into upwardly mobile Manilas luxury condominiums (continuation)
bull Brokers also noted rising interest in office space on bets that commercial leasing prices will skyrocket as more foreign firms outsource in the country
bull The action remains concentrated in Manila brokers said although it is slowly spilling over into new wave cities in central and southern Philippines which host business process outsourcing firms
bull Top property developers use globally-known luxury brands to attract overseas demand
Microeconomics Price Elasticity of Microeconomics Price Elasticity of Demand - ExamplesDemand - Examples
bull Rich Asians buy into upwardly mobile Manilas luxury condominiums (continuation)
bull Other than Armani CPG has tapped Versace and American socialite Paris Hilton to design interiors Brand associations have attracted interest from foreign nationals Antonio said
bull For their part Megaworlds Go said the company is offering in-house brokerage services to help in leasing apartments
Microeconomics Price Elasticity of Microeconomics Price Elasticity of Demand ndash Example Demand ndash Example
bull The surge in overseas pre-sales also keeps top property firms awash with cash to fund projects and fatten their land bank
bull Jones Langs Leechiu said top developers brush off private equity and sovereign wealth funds seeking discounts as they foresee sustained strong demand from retail buyers
bull If they ask for too much discount we wont agree We dont need the money Go said
Reuters (2014 July 3) Rich Asians buy into upwardly mobile Manilas luxury condominiums Retrieved July 6 2014 from Yahoo Finance httpsfinanceyahoocomnewsrich-asians-buy-upwardly-mobile-052903760html_ylt=AwrSbmsDSLlTHVIATCRXNyoA_ylu=X3oDMTEzbm5lbnJjBHNlYwNzcgRwb3MDMQRjb2xvA2dxMQR2dGlkA1ZJUDQ3M18x
Microeconomics Price Elasticity of Microeconomics Price Elasticity of Demand ndash ExamplesDemand ndash Examples
Microeconomics Expenditures and Price Microeconomics Expenditures and Price ElasticityElasticity
Microeconomics Factors influencing Microeconomics Factors influencing elasticityelasticity
bull Close substitutes increase elasticity
bull Luxuries tend to be more elastic than necessities
bull Elasticity increases when the proportion of income spent on a product is high
bull Elasticity increases over time
Microeconomics Cross elasticity of Microeconomics Cross elasticity of DemandDemand
measures the responsiveness of the quantity demanded of one product to the change in price of another product
If Cross Elasticity Is
The Products Are
Positive Substitutes
Negative Complements
Microeconomics Income elasticity of Microeconomics Income elasticity of DemandDemand
measures the responsiveness of the demand for a product to changes in income
If Income Elasticity Is
Positive and greater than 10
Positive and less than 10
Negative
The Product IsNormal and income elastic
Normal and income inelastic
Inferior
As Income Rises
The amount of income spent and of income spent on the product rise
The amount of income spent rises but the of income spent on the product falls
The amount of income spent and of income spent on the product fall
Microeconomics Price elasticity of Microeconomics Price elasticity of SupplySupply
measures the responsiveness of the quantity supplied of a product to a change in its price
More Elastic Supply
Product is easy to produce with many different common types of resources
Less Elastic Supply
Product is hard to produce and requires very specific scarce resources
Microeconomics Examples of factors Microeconomics Examples of factors affecting increase (decrease) demand for affecting increase (decrease) demand for goodsgoods
Microeconomics Examples of factors Microeconomics Examples of factors affecting increase (decrease) supply for affecting increase (decrease) supply for goodsgoods
Microeconomics Example of factors Microeconomics Example of factors affecting increase (decrease) supply for affecting increase (decrease) supply for goodsgoods
bull Discussion Questions bull Predict what may happen to the usage by the riding
public of the MRT Of the Bus bull Do you think the MRTLRT fare hike is good
bull MRT LRT fares may go up in AugustmdashAbayabull By Miguel R Camus |Philippine Daily Inquirer 1226
am | Friday June 21st 2013 bull Read more httpbusinessinquirernet128269mrt-lrt-fares-may-go-up-in-
august-abayaixzz36mF0nFX7
Microeconomics Example of factors Microeconomics Example of factors affecting increase (decrease) supply for affecting increase (decrease) supply for goodsgoods
bull Read more httpbusinessinquirernet128269mrt-lrt-fares-may-go-up-in-august-abayaixzz36mF0nFX7
bull This means fares which were last adjusted in the early 2000s will increase by P5 in 2013 while the second P5 increase will kick in next year
bull The announcement of the fare increases comes amid severe criticism of the LRT-MRT operationsmdashcoaches with passengers woefully packed like sardines most times of the day and long queues to the stations during rush hours
Microeconomics Example of factors Microeconomics Example of factors affecting increase (decrease) supply for affecting increase (decrease) supply for goodsgoods
bull Read more httpbusinessinquirernet128269mrt-lrt-fares-may-go-up-in-august-abayaixzz36mF0nFX7
bull For example MRT 3 was designed to serve 350000 passengers per day but some 600000 people cram the system daily
bull A 13-kilometer stretch of the line on north Edsamdashfrom Muntildeoz to Trinomamdashhas yet to be connected three years into the Aquino administration
bull Critics say that no mass transportation system anywhere in the world makes money quite apart from Hong Kong
Microeconomics Example of factors Microeconomics Example of factors affecting increase (decrease) supply for affecting increase (decrease) supply for goodsgoods
bull Read more httpbusinessinquirernet128269mrt-lrt-fares-may-go-up-in-august-abayaixzz36mF0nFX7
bull Even with the fare increase the LRT lines and MRT 3 come out ldquocheaperrdquo than rates charged by bus operators which are pegged at P40 per passenger Abaya said
bull The current fare at MRT which runs through Edsa Metro Manilarsquos main highway is pegged at a maximum of P15 per passenger For LRT 1 passengers are charged up to P20 each for a single journey for LRT 2 the rate is pegged at P15
Microeconomics Example of factors Microeconomics Example of factors affecting increase (decrease) supply for affecting increase (decrease) supply for goodsgoods
bull Read more httpbusinessinquirernet128269mrt-lrt-fares-may-go-up-in-august-abayaixzz36mF0nFX7
bull Unlike other agencies under the DOTC the LRTA is unique as it does not have a regulating body when it comes to setting fares
bull For the MRT 3 alone Abaya said the government was spending P60 to transport one passenger from end to end well above the current ticket price This translates to about P7 billion to P9 billion in subsidies every year
Microeconomics Example of factors Microeconomics Example of factors affecting increase (decrease) supply for affecting increase (decrease) supply for goodsgoods
bull Read more httpbusinessinquirernet128269mrt-lrt-fares-may-go-up-in-august-abayaixzz36mF0nFX7
bull To address overcrowding the DOTC is evaluating a proposal by a Chinese manufacturer as part of its plan to acquire 48 new train cars to expand MRT 3rsquos capacity
bull ldquoComplete delivery will happen on May 2016rdquo he said
bull MRT 3 currently has a fleet of 73 train cars serving passengers at 3-minute intervals The DOTC said the addition of new cars will cut the waiting time to 25-minute intervals
Marginal Benefit vs Marginal CostMarginal Benefit vs Marginal Costbull Marginal Benefit ndash Benefit that an individual gets from consuming an
additional unit of good or service However each additional unit consumed results in smaller marginal benefit and results in diminishing returns
The demand curve represents the marginal benefit curve of the product to consumers
bull Marginal Cost ndash Cost of producing an additional unit of output also referred to as opportunity cost
The supply curve represents the marginal cost curve of the producers
Marginal Benefit vs Marginal Cost ndash Marginal Benefit vs Marginal Cost ndash Example 1Example 1
bull Read more httpnewsinfoinquirernet617323sc-ruling-on-dap-checks-balances-democracy-workixzz36mhRVdfo Follow us inquirerdotnet on Twitter | inquirerdotnet on Facebook
bull The Supreme Court last Tuesday struck down the DAP including a circular allowing the release of savings from the executive department to agencies and projects outside the national budget approved by Congress
bull The executive department pooled savings under the DAP a stimulus program introduced in 2011 and allotted these for projects to speed up government spending and boost economic growth
bull
Marginal Benefit vs Marginal Cost ndash Marginal Benefit vs Marginal Cost ndash Example 2Example 2
bull The selling price is P100bull The variable cost per unit is P40 (of which is P5 marketing
costs)bull The total fixed manufacturing cost is P5000bull The total fixed administrative costs is P2200
bull Requirementsbull Compute for the break-even unitsbull If there are 150 units how much is the increase in net income
Consumer Surplus amp Producer SurplusConsumer Surplus amp Producer Surplusbull Consumer Surplus is the difference
between total value consumers place on a good produced less the amount paid
bull Producer Surplus is the difference between the price received for each good produced and the opportunity cost of producing the good
bull The difference between the lowest available price for a good and the highest price is the producer surplus
Price Takers amp SearchersPrice Takers amp Searchersbull Price takers must take the market
price in selling their product because each price takerrsquos output is small relative to total market
bull Price searchers have a downward sloping demand curve for their product The amount they are able to sell is inversely related to the price they charge
Price Taker Market Characteristics1048729 All firms are producing an identical product1048729 A large number of firms exist in the market1048729 Each firm supplies only a very small portion of total amount supplied to the market1048729 No barriers limit the entry or exit of firms in the market
Market StructuresMarket StructuresPerfect
Competition
of Sellers and Buyers
Many
Sellerrsquos Products
Identical
Barriers to entry None
Economies of Scale
Low
Competition Between Sellers
High
Other
Buyers have perfect
knowledge of product and
price
MonopolisticCompetition
Many
Slight Differences
None
Low
High
Oligopoly
A Few Sellers
No Close Substitutes
High
Often High
High or Low
Sellers are independent
but have incentive to form cartel
Monopoly
One Seller
No Close Substitutes
Insurmountable
Often High
None
Macroeconomic ConceptMacroeconomic Conceptbull Macroeconomic concepts that have an impact on all firms
in the same environment be it a country a group of related countries or a particular industry
bull Topics covered concepts about the business cycle and how to forecast changes in the business cycle and the impact on among other things price levels and profitability
Macroeconomic Concept Business CycleMacroeconomic Concept Business Cyclebull
Moderating the Business Cycle
Policies can be used to moderate the business cycle
Status of the Economy
Appropriate Action
Using Fiscal Policy
Using Monetary Policy
RecessionGDP lt PotentialExcess unemployment
StimulusAD uarr
G uarr T darrDeficit uarr
M uarr
BoomGDP gt PotentialRising real wages
ContractionAD darr
G darr T uarrDeficit darr
M darr
bull The actions can be oDiscretionary actions require a policy change
Example bull Increase government spending on roadsbullRaise income tax rates
Moderating the Business Cycle (continued)
oAutomatic actions require no policy change and occur with changes in the level of economic activity Examples
bull Income taxes are based on progressive rates so total taxes fall at an accelerating rate with declining economic activity
bull Needs-based spending such as unemployment insurance automatically increases with rising unemployment
Moderating the Business Cycle (continued)
bull Discretionary policy is hampered by lags oRecognition oLaw-makingoImpact
Moderating the Business Cycle (continued)
bull bull The Rate of Inflation is calculated as Inflation = Last yearrsquos price index - This yearrsquos price index 100
rate Last yearrsquos price index
bull bull Inflation is an increase in the general level of prices
Macroeconomics Inflation
Inflation and Interest Rates
Nominal interest rates reflect both an expectation of inflation and a real rate of interest
bull Supply set by BSPbull Demand is a function of interest rate
bull Investment demand for capitalbull Savings supplybull Real interest rate is independent of inflation rate
Change in inflation expectations directly changes nominal rates
rnom = Real rate + E(inf)
Unexpected inflation redistributes income among economic groups
If inflation is higher than expected
Interest rates will have been set too low
Benefits borrowers at the expense of lenders
Causes borrowers to regret they did not borrow more and lenders to regret they did not lend less
Inflation and Interest Rates (continued)
If inflation is lower than expected
Interest rates will have been set too high
Benefits lenders at the expense of borrowers
Causes lenders to regret they did not lend more and borrowers to regret they did not borrow less
Inflation and Interest Rates (continued)
Two Types of Inflation
Demand-Pull Inflation starts with an increase in AD Typical causes of the increase include an increase in the money supply government spending or exports Assuming the economy is already at full employment
bull The increase in AD will increase GDPReal and the price level bull But rising costs will decrease SRAS leading to another increase in the
price level and decrease in GDPReal
bull Net result is a one time round of price increases and no change in GDPReal
bull However if the money supply continues to grow excessively and fuel AD the demand-pull inflation process can continue
Cost-Push Inflation starts with an increase in costs Typical causes of the increase include a rise in the money wage rate or raw material prices
Rising costs reduce the SRAS curve and the initial effect is to increase prices and decrease GDPReal
This fall below GDPPotential could precipitate government stimulation which will increase AD leading to another increase in prices and an increase back to GDPPotential
Net result is a one time round of price increases and no change in GDPReal
Two Types of Inflation (continued)
In the short run Some inputs (such as labor and raw materials) are variable but others (such as
property plant and equipment) are not Output can benefit by the specialization of labor All inputs are subject to the Law of Diminishing Returns
Output in the Short Run
AFC Falls as output rises and fixed cost is spread AVC and MC
bull First fall with specializationbull Then rise with Law of Diminishing Returns
MC When rising it will intersect the minimum points on AVC and ATC
Expected Relationships in the Short-Run
Expected Relationships in the Short-Run
In the long run all costs are variable and the firm can alter the size of its plant to meet higher or lower product demand
bull If expanding plant size leads to more efficiency and specialization the minimum point on the SRATC curve will be lower
bull If expanding the plant size leads to less efficiency and specialization the minimum point on the SRATC curve will be higher
bull These minimum points become the firms LRATC curve (which can be upward flat or even downward sloping)
The minimum point on the LRATC curve is the firmrsquos minimum efficient scale
Costs in the Long Run (continued)
In the short run some costs are fixed and the firm will maximize profits by operating at the minimum point on its SRATC curve
Costs in the Long Run
The aggregate demand curve (AD) measures the amount of total real consumption expenditures (goods and services) demanded at various price levels
AD = Y = C+I+G + (XndashM) = GDPRealAD curversquos downward slope is caused by the
bull Wealth Effect Rising inflation (GDP Deflator uarr) causes financial assets to lose value All other things equal this leads to increased savings and decreased current spending
bull Substitution Effect Rising prices and inflation increase nominal interest rates which reduces borrowing to fund current consumer and investment spending
A change in AD curve is due to a factor other than price
Aggregate supply is the quantity of goods services supplied (GDPReal) It is a function of aggregate production which depends on
bull Quantity of Labor (L)
bull Quantity of Capital (K)
bull Level of Technology (T)
At any one point in time the level of technology and quantity of capital are fixed but the quantity of labor is variable This produces a vertical long-run aggregate supply and an upward sloping short-run aggregate supply curve
Potential GDP increases over time with increases in the
Increases in factor costs decrease the SRAS curve
bull ldquoFull employmentrdquo quantity of labor
bull Capital (human and physical)
bull Level of Technology
bull ldquoDoes not affect real factors of production and Potential GDP
bull Rising production costs decreases SRAS (higher price for any quantity of output)
bull Assuming all other prices rise at the same rate the economy remains at Potential GDP but at a higher price level
Classical View The economy is self regulating back to full employment
bull Wages and prices adjust fully and quickly to eliminate shortages and surpluses to restore economic efficiency and full employment
bull Taxes and government intervention are potential disruption to the market signals necessary for fully functioning competitive markets
bull Technology is the prime driver in increasing aggregate demand and supply over time
Keynesian View The economy is inherently unstable and does not return to a long-run equilibrium (potential GDP) without government intervention
bull Expectation are the primary determinant of AD and expectations are the subject to excesses of optimism and pessimism (leading to inflation and recession)
bull SRAS does not quickly adjust because wages in particular are ldquostickyrdquo in the downward direction
bull Government intervention to dampen or stimulate the economy is needed to maintain output at potential GDP
Monetarist View The economy is self regulating back to full employment as long as the money supply grows at an appropriate stable pace
bull The quantity of money fuels aggregate demandbull Recessions are caused by bad monetary policybull The wage rate is sticky which delays economic recoveries when
coming from recessionbull Taxes and government intervention are a potential disruption to the
market signals necessary to make competitive markets work
MONEYMoney is a means of payment to settle a debt for a current or prior purchase It has three functions
Medium of exchange for goods or services Credit cards are not money they just delay the debt Checks are not money They move funds (money) from one account to
another Checking account balances are money
Store of value that can be held and exchanged for goods in the futureUnit of account that allows relative prices to be quoted in a standard unit
The Supply and Demand for Money
The supply of money is fixed at any point in time by the Fed (hence the vertical supply curve)
The ldquopricerdquo of money is the interest rate
Equilibrium Price
Shortage leads to selling of investments
Surplus of money leads market participants to invest
bull The demand for money is affected by four major factorsoThe level of interest rates cause movement on the demand
curve and is inversely related to demandHigher rates create an incentive to invest instead of holding money
Higher rates are associated with higher inflation which causes money to lose value
The Supply and Demand for Money (continued)
oThe General Price LevelQuantity of nominal money demanded is directly related to the price level
Quantity of real dollars demanded is independent of the price level
oReal GDP demand for money is directly related to real income
oFinancial Innovation has generally led to greater liquidity and decreased demand for narrowly defined money
The Supply and Demand for Money (continued)
Two Categoriesbull Renewable resources are replenished by naturebull Nonrenewable resources are used up in production
Renewable Resourcesbull Total supply is fixed and inelasticbull Any one purchaser can obtain more by paying a higher price
Non-Renewable Resourcesbull Total supply (both known and expected to be recovered supply) is fixed known
and perfectly elasticbull Total demand (current and all future demand) determine future pricebull Current price is the PV of future price causing the current price to rise over time
at the rate of interest rates (Hotelling Principle)bull Lack of perfect knowledge of future supply demand and interest rate can lead to
surprise changes in price today
The materials balances model
bull Kneese Ayresand DrsquoArge (1970) (Thomas 2010) (Figure 10)
Environmental Policies
The Philippine Experience
bull PD 1151 Philippine Environmental Policy (1977)bull Renewable Energy Act (2008)bull In December of 2008 then President Gloria M Arroyo
signed into law the Republic Act 9513 Renewable Energy (RE) Act of 2008-an act promoting the development utilization and commercialization of renewable energy resources and for other purposes
The Philippine Experience
bull Its targets were ldquofor the Philippines (Perez 2009) bull to be the No1 geothermal producer in the worldbull to be the No1 wind power producer in the Southeast
Asiabull to double its hydro capacity by 2013bull to expand contribution of biomass solar and ocean
energy by 250 MWrdquo
The Philippine Experience
bull The Philippines has an abounding potential for generating energy from renewable resources (Perez 2009)bull Geothermal resource 1200 MW bull Wind 700 MWbull Solar no potential estimate which depends on solar panels put
up (but currently the largest solar manufacturing hub in Southeast Asia producing 400 MW)
bull Hydro 1784 MW from 888 sitesbull Biomass (bagasse) 235 MMBFOE
The Philippine Experience
bull Amidst the so-called abundance of this Philippine potential for renewable energy about 50 of its power generation still comes from non-renewable sources (ie coal (26) and oil (23)) (Department of Trade and Industry 2009) DTI has forecasted that with growing industrial demand the country will still require 4000 to 4350 MW for sustainability (Department of Trade and Industry 2009)
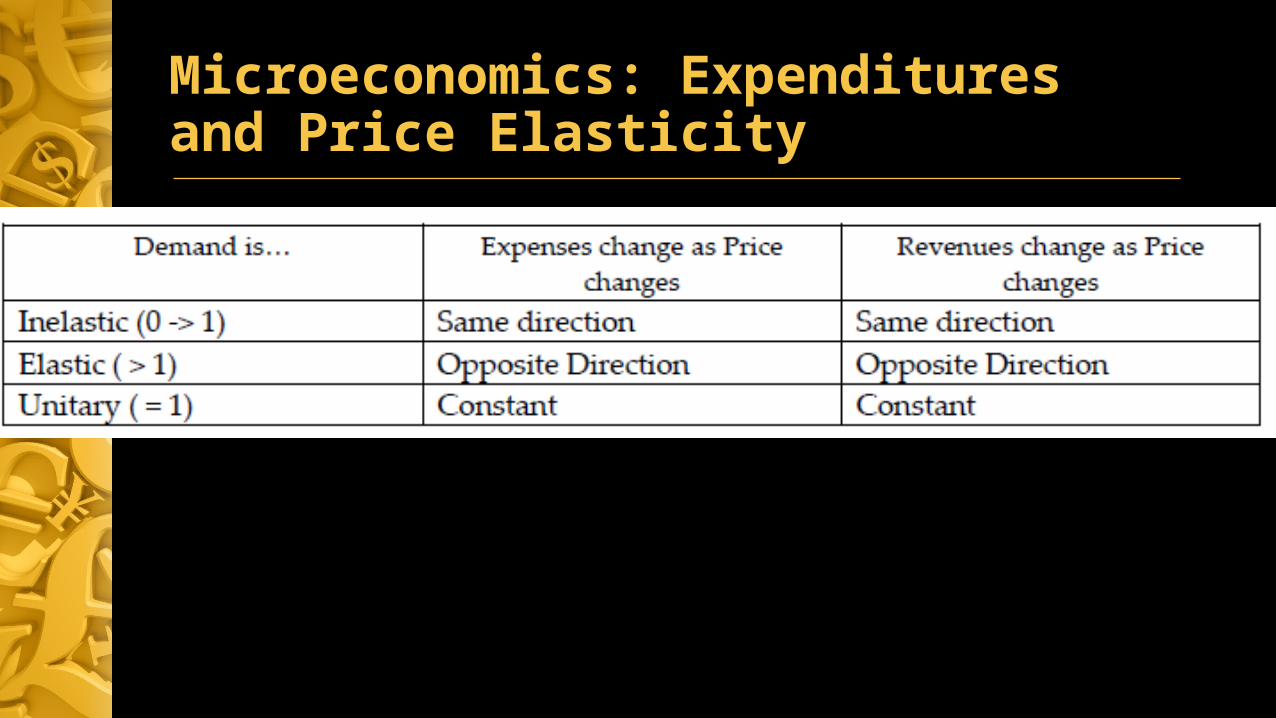

Microeconomics Example of factors Microeconomics Example of factors affecting increase (decrease) supply for affecting increase (decrease) supply for goodsgoods
bull Discussion Questions bull Predict what may happen to the usage by the riding
public of the MRT Of the Bus bull Do you think the MRTLRT fare hike is good
bull MRT LRT fares may go up in AugustmdashAbayabull By Miguel R Camus |Philippine Daily Inquirer 1226
am | Friday June 21st 2013 bull Read more httpbusinessinquirernet128269mrt-lrt-fares-may-go-up-in-
august-abayaixzz36mF0nFX7
Microeconomics Example of factors Microeconomics Example of factors affecting increase (decrease) supply for affecting increase (decrease) supply for goodsgoods
bull Read more httpbusinessinquirernet128269mrt-lrt-fares-may-go-up-in-august-abayaixzz36mF0nFX7
bull This means fares which were last adjusted in the early 2000s will increase by P5 in 2013 while the second P5 increase will kick in next year
bull The announcement of the fare increases comes amid severe criticism of the LRT-MRT operationsmdashcoaches with passengers woefully packed like sardines most times of the day and long queues to the stations during rush hours
Microeconomics Example of factors Microeconomics Example of factors affecting increase (decrease) supply for affecting increase (decrease) supply for goodsgoods
bull Read more httpbusinessinquirernet128269mrt-lrt-fares-may-go-up-in-august-abayaixzz36mF0nFX7
bull For example MRT 3 was designed to serve 350000 passengers per day but some 600000 people cram the system daily
bull A 13-kilometer stretch of the line on north Edsamdashfrom Muntildeoz to Trinomamdashhas yet to be connected three years into the Aquino administration
bull Critics say that no mass transportation system anywhere in the world makes money quite apart from Hong Kong
Microeconomics Example of factors Microeconomics Example of factors affecting increase (decrease) supply for affecting increase (decrease) supply for goodsgoods
bull Read more httpbusinessinquirernet128269mrt-lrt-fares-may-go-up-in-august-abayaixzz36mF0nFX7
bull Even with the fare increase the LRT lines and MRT 3 come out ldquocheaperrdquo than rates charged by bus operators which are pegged at P40 per passenger Abaya said
bull The current fare at MRT which runs through Edsa Metro Manilarsquos main highway is pegged at a maximum of P15 per passenger For LRT 1 passengers are charged up to P20 each for a single journey for LRT 2 the rate is pegged at P15
Microeconomics Example of factors Microeconomics Example of factors affecting increase (decrease) supply for affecting increase (decrease) supply for goodsgoods
bull Read more httpbusinessinquirernet128269mrt-lrt-fares-may-go-up-in-august-abayaixzz36mF0nFX7
bull Unlike other agencies under the DOTC the LRTA is unique as it does not have a regulating body when it comes to setting fares
bull For the MRT 3 alone Abaya said the government was spending P60 to transport one passenger from end to end well above the current ticket price This translates to about P7 billion to P9 billion in subsidies every year
Microeconomics Example of factors Microeconomics Example of factors affecting increase (decrease) supply for affecting increase (decrease) supply for goodsgoods
bull Read more httpbusinessinquirernet128269mrt-lrt-fares-may-go-up-in-august-abayaixzz36mF0nFX7
bull To address overcrowding the DOTC is evaluating a proposal by a Chinese manufacturer as part of its plan to acquire 48 new train cars to expand MRT 3rsquos capacity
bull ldquoComplete delivery will happen on May 2016rdquo he said
bull MRT 3 currently has a fleet of 73 train cars serving passengers at 3-minute intervals The DOTC said the addition of new cars will cut the waiting time to 25-minute intervals
Marginal Benefit vs Marginal CostMarginal Benefit vs Marginal Costbull Marginal Benefit ndash Benefit that an individual gets from consuming an
additional unit of good or service However each additional unit consumed results in smaller marginal benefit and results in diminishing returns
The demand curve represents the marginal benefit curve of the product to consumers
bull Marginal Cost ndash Cost of producing an additional unit of output also referred to as opportunity cost
The supply curve represents the marginal cost curve of the producers
Marginal Benefit vs Marginal Cost ndash Marginal Benefit vs Marginal Cost ndash Example 1Example 1
bull Read more httpnewsinfoinquirernet617323sc-ruling-on-dap-checks-balances-democracy-workixzz36mhRVdfo Follow us inquirerdotnet on Twitter | inquirerdotnet on Facebook
bull The Supreme Court last Tuesday struck down the DAP including a circular allowing the release of savings from the executive department to agencies and projects outside the national budget approved by Congress
bull The executive department pooled savings under the DAP a stimulus program introduced in 2011 and allotted these for projects to speed up government spending and boost economic growth
bull
Marginal Benefit vs Marginal Cost ndash Marginal Benefit vs Marginal Cost ndash Example 2Example 2
bull The selling price is P100bull The variable cost per unit is P40 (of which is P5 marketing
costs)bull The total fixed manufacturing cost is P5000bull The total fixed administrative costs is P2200
bull Requirementsbull Compute for the break-even unitsbull If there are 150 units how much is the increase in net income
Consumer Surplus amp Producer SurplusConsumer Surplus amp Producer Surplusbull Consumer Surplus is the difference
between total value consumers place on a good produced less the amount paid
bull Producer Surplus is the difference between the price received for each good produced and the opportunity cost of producing the good
bull The difference between the lowest available price for a good and the highest price is the producer surplus
Price Takers amp SearchersPrice Takers amp Searchersbull Price takers must take the market
price in selling their product because each price takerrsquos output is small relative to total market
bull Price searchers have a downward sloping demand curve for their product The amount they are able to sell is inversely related to the price they charge
Price Taker Market Characteristics1048729 All firms are producing an identical product1048729 A large number of firms exist in the market1048729 Each firm supplies only a very small portion of total amount supplied to the market1048729 No barriers limit the entry or exit of firms in the market
Market StructuresMarket StructuresPerfect
Competition
of Sellers and Buyers
Many
Sellerrsquos Products
Identical
Barriers to entry None
Economies of Scale
Low
Competition Between Sellers
High
Other
Buyers have perfect
knowledge of product and
price
MonopolisticCompetition
Many
Slight Differences
None
Low
High
Oligopoly
A Few Sellers
No Close Substitutes
High
Often High
High or Low
Sellers are independent
but have incentive to form cartel
Monopoly
One Seller
No Close Substitutes
Insurmountable
Often High
None
Macroeconomic ConceptMacroeconomic Conceptbull Macroeconomic concepts that have an impact on all firms
in the same environment be it a country a group of related countries or a particular industry
bull Topics covered concepts about the business cycle and how to forecast changes in the business cycle and the impact on among other things price levels and profitability
Macroeconomic Concept Business CycleMacroeconomic Concept Business Cyclebull
Moderating the Business Cycle
Policies can be used to moderate the business cycle
Status of the Economy
Appropriate Action
Using Fiscal Policy
Using Monetary Policy
RecessionGDP lt PotentialExcess unemployment
StimulusAD uarr
G uarr T darrDeficit uarr
M uarr
BoomGDP gt PotentialRising real wages
ContractionAD darr
G darr T uarrDeficit darr
M darr
bull The actions can be oDiscretionary actions require a policy change
Example bull Increase government spending on roadsbullRaise income tax rates
Moderating the Business Cycle (continued)
oAutomatic actions require no policy change and occur with changes in the level of economic activity Examples
bull Income taxes are based on progressive rates so total taxes fall at an accelerating rate with declining economic activity
bull Needs-based spending such as unemployment insurance automatically increases with rising unemployment
Moderating the Business Cycle (continued)
bull Discretionary policy is hampered by lags oRecognition oLaw-makingoImpact
Moderating the Business Cycle (continued)
bull bull The Rate of Inflation is calculated as Inflation = Last yearrsquos price index - This yearrsquos price index 100
rate Last yearrsquos price index
bull bull Inflation is an increase in the general level of prices
Macroeconomics Inflation
Inflation and Interest Rates
Nominal interest rates reflect both an expectation of inflation and a real rate of interest
bull Supply set by BSPbull Demand is a function of interest rate
bull Investment demand for capitalbull Savings supplybull Real interest rate is independent of inflation rate
Change in inflation expectations directly changes nominal rates
rnom = Real rate + E(inf)
Unexpected inflation redistributes income among economic groups
If inflation is higher than expected
Interest rates will have been set too low
Benefits borrowers at the expense of lenders
Causes borrowers to regret they did not borrow more and lenders to regret they did not lend less
Inflation and Interest Rates (continued)
If inflation is lower than expected
Interest rates will have been set too high
Benefits lenders at the expense of borrowers
Causes lenders to regret they did not lend more and borrowers to regret they did not borrow less
Inflation and Interest Rates (continued)
Two Types of Inflation
Demand-Pull Inflation starts with an increase in AD Typical causes of the increase include an increase in the money supply government spending or exports Assuming the economy is already at full employment
bull The increase in AD will increase GDPReal and the price level bull But rising costs will decrease SRAS leading to another increase in the
price level and decrease in GDPReal
bull Net result is a one time round of price increases and no change in GDPReal
bull However if the money supply continues to grow excessively and fuel AD the demand-pull inflation process can continue
Cost-Push Inflation starts with an increase in costs Typical causes of the increase include a rise in the money wage rate or raw material prices
Rising costs reduce the SRAS curve and the initial effect is to increase prices and decrease GDPReal
This fall below GDPPotential could precipitate government stimulation which will increase AD leading to another increase in prices and an increase back to GDPPotential
Net result is a one time round of price increases and no change in GDPReal
Two Types of Inflation (continued)
In the short run Some inputs (such as labor and raw materials) are variable but others (such as
property plant and equipment) are not Output can benefit by the specialization of labor All inputs are subject to the Law of Diminishing Returns
Output in the Short Run
AFC Falls as output rises and fixed cost is spread AVC and MC
bull First fall with specializationbull Then rise with Law of Diminishing Returns
MC When rising it will intersect the minimum points on AVC and ATC
Expected Relationships in the Short-Run
Expected Relationships in the Short-Run
In the long run all costs are variable and the firm can alter the size of its plant to meet higher or lower product demand
bull If expanding plant size leads to more efficiency and specialization the minimum point on the SRATC curve will be lower
bull If expanding the plant size leads to less efficiency and specialization the minimum point on the SRATC curve will be higher
bull These minimum points become the firms LRATC curve (which can be upward flat or even downward sloping)
The minimum point on the LRATC curve is the firmrsquos minimum efficient scale
Costs in the Long Run (continued)
In the short run some costs are fixed and the firm will maximize profits by operating at the minimum point on its SRATC curve
Costs in the Long Run
The aggregate demand curve (AD) measures the amount of total real consumption expenditures (goods and services) demanded at various price levels
AD = Y = C+I+G + (XndashM) = GDPRealAD curversquos downward slope is caused by the
bull Wealth Effect Rising inflation (GDP Deflator uarr) causes financial assets to lose value All other things equal this leads to increased savings and decreased current spending
bull Substitution Effect Rising prices and inflation increase nominal interest rates which reduces borrowing to fund current consumer and investment spending
A change in AD curve is due to a factor other than price
Aggregate supply is the quantity of goods services supplied (GDPReal) It is a function of aggregate production which depends on
bull Quantity of Labor (L)
bull Quantity of Capital (K)
bull Level of Technology (T)
At any one point in time the level of technology and quantity of capital are fixed but the quantity of labor is variable This produces a vertical long-run aggregate supply and an upward sloping short-run aggregate supply curve
Potential GDP increases over time with increases in the
Increases in factor costs decrease the SRAS curve
bull ldquoFull employmentrdquo quantity of labor
bull Capital (human and physical)
bull Level of Technology
bull ldquoDoes not affect real factors of production and Potential GDP
bull Rising production costs decreases SRAS (higher price for any quantity of output)
bull Assuming all other prices rise at the same rate the economy remains at Potential GDP but at a higher price level
Classical View The economy is self regulating back to full employment
bull Wages and prices adjust fully and quickly to eliminate shortages and surpluses to restore economic efficiency and full employment
bull Taxes and government intervention are potential disruption to the market signals necessary for fully functioning competitive markets
bull Technology is the prime driver in increasing aggregate demand and supply over time
Keynesian View The economy is inherently unstable and does not return to a long-run equilibrium (potential GDP) without government intervention
bull Expectation are the primary determinant of AD and expectations are the subject to excesses of optimism and pessimism (leading to inflation and recession)
bull SRAS does not quickly adjust because wages in particular are ldquostickyrdquo in the downward direction
bull Government intervention to dampen or stimulate the economy is needed to maintain output at potential GDP
Monetarist View The economy is self regulating back to full employment as long as the money supply grows at an appropriate stable pace
bull The quantity of money fuels aggregate demandbull Recessions are caused by bad monetary policybull The wage rate is sticky which delays economic recoveries when
coming from recessionbull Taxes and government intervention are a potential disruption to the
market signals necessary to make competitive markets work
MONEYMoney is a means of payment to settle a debt for a current or prior purchase It has three functions
Medium of exchange for goods or services Credit cards are not money they just delay the debt Checks are not money They move funds (money) from one account to
another Checking account balances are money
Store of value that can be held and exchanged for goods in the futureUnit of account that allows relative prices to be quoted in a standard unit
The Supply and Demand for Money
The supply of money is fixed at any point in time by the Fed (hence the vertical supply curve)
The ldquopricerdquo of money is the interest rate
Equilibrium Price
Shortage leads to selling of investments
Surplus of money leads market participants to invest
bull The demand for money is affected by four major factorsoThe level of interest rates cause movement on the demand
curve and is inversely related to demandHigher rates create an incentive to invest instead of holding money
Higher rates are associated with higher inflation which causes money to lose value
The Supply and Demand for Money (continued)
oThe General Price LevelQuantity of nominal money demanded is directly related to the price level
Quantity of real dollars demanded is independent of the price level
oReal GDP demand for money is directly related to real income
oFinancial Innovation has generally led to greater liquidity and decreased demand for narrowly defined money
The Supply and Demand for Money (continued)
Two Categoriesbull Renewable resources are replenished by naturebull Nonrenewable resources are used up in production
Renewable Resourcesbull Total supply is fixed and inelasticbull Any one purchaser can obtain more by paying a higher price
Non-Renewable Resourcesbull Total supply (both known and expected to be recovered supply) is fixed known
and perfectly elasticbull Total demand (current and all future demand) determine future pricebull Current price is the PV of future price causing the current price to rise over time
at the rate of interest rates (Hotelling Principle)bull Lack of perfect knowledge of future supply demand and interest rate can lead to
surprise changes in price today
The materials balances model
bull Kneese Ayresand DrsquoArge (1970) (Thomas 2010) (Figure 10)
Environmental Policies
The Philippine Experience
bull PD 1151 Philippine Environmental Policy (1977)bull Renewable Energy Act (2008)bull In December of 2008 then President Gloria M Arroyo
signed into law the Republic Act 9513 Renewable Energy (RE) Act of 2008-an act promoting the development utilization and commercialization of renewable energy resources and for other purposes
The Philippine Experience
bull Its targets were ldquofor the Philippines (Perez 2009) bull to be the No1 geothermal producer in the worldbull to be the No1 wind power producer in the Southeast
Asiabull to double its hydro capacity by 2013bull to expand contribution of biomass solar and ocean
energy by 250 MWrdquo
The Philippine Experience
bull The Philippines has an abounding potential for generating energy from renewable resources (Perez 2009)bull Geothermal resource 1200 MW bull Wind 700 MWbull Solar no potential estimate which depends on solar panels put
up (but currently the largest solar manufacturing hub in Southeast Asia producing 400 MW)
bull Hydro 1784 MW from 888 sitesbull Biomass (bagasse) 235 MMBFOE
The Philippine Experience
bull Amidst the so-called abundance of this Philippine potential for renewable energy about 50 of its power generation still comes from non-renewable sources (ie coal (26) and oil (23)) (Department of Trade and Industry 2009) DTI has forecasted that with growing industrial demand the country will still require 4000 to 4350 MW for sustainability (Department of Trade and Industry 2009)
Microeconomics Example of factors Microeconomics Example of factors affecting increase (decrease) supply for affecting increase (decrease) supply for goodsgoods
bull Read more httpbusinessinquirernet128269mrt-lrt-fares-may-go-up-in-august-abayaixzz36mF0nFX7
bull This means fares which were last adjusted in the early 2000s will increase by P5 in 2013 while the second P5 increase will kick in next year
bull The announcement of the fare increases comes amid severe criticism of the LRT-MRT operationsmdashcoaches with passengers woefully packed like sardines most times of the day and long queues to the stations during rush hours
Microeconomics Example of factors Microeconomics Example of factors affecting increase (decrease) supply for affecting increase (decrease) supply for goodsgoods
bull Read more httpbusinessinquirernet128269mrt-lrt-fares-may-go-up-in-august-abayaixzz36mF0nFX7
bull For example MRT 3 was designed to serve 350000 passengers per day but some 600000 people cram the system daily
bull A 13-kilometer stretch of the line on north Edsamdashfrom Muntildeoz to Trinomamdashhas yet to be connected three years into the Aquino administration
bull Critics say that no mass transportation system anywhere in the world makes money quite apart from Hong Kong
Microeconomics Example of factors Microeconomics Example of factors affecting increase (decrease) supply for affecting increase (decrease) supply for goodsgoods
bull Read more httpbusinessinquirernet128269mrt-lrt-fares-may-go-up-in-august-abayaixzz36mF0nFX7
bull Even with the fare increase the LRT lines and MRT 3 come out ldquocheaperrdquo than rates charged by bus operators which are pegged at P40 per passenger Abaya said
bull The current fare at MRT which runs through Edsa Metro Manilarsquos main highway is pegged at a maximum of P15 per passenger For LRT 1 passengers are charged up to P20 each for a single journey for LRT 2 the rate is pegged at P15
Microeconomics Example of factors Microeconomics Example of factors affecting increase (decrease) supply for affecting increase (decrease) supply for goodsgoods
bull Read more httpbusinessinquirernet128269mrt-lrt-fares-may-go-up-in-august-abayaixzz36mF0nFX7
bull Unlike other agencies under the DOTC the LRTA is unique as it does not have a regulating body when it comes to setting fares
bull For the MRT 3 alone Abaya said the government was spending P60 to transport one passenger from end to end well above the current ticket price This translates to about P7 billion to P9 billion in subsidies every year
Microeconomics Example of factors Microeconomics Example of factors affecting increase (decrease) supply for affecting increase (decrease) supply for goodsgoods
bull Read more httpbusinessinquirernet128269mrt-lrt-fares-may-go-up-in-august-abayaixzz36mF0nFX7
bull To address overcrowding the DOTC is evaluating a proposal by a Chinese manufacturer as part of its plan to acquire 48 new train cars to expand MRT 3rsquos capacity
bull ldquoComplete delivery will happen on May 2016rdquo he said
bull MRT 3 currently has a fleet of 73 train cars serving passengers at 3-minute intervals The DOTC said the addition of new cars will cut the waiting time to 25-minute intervals
Marginal Benefit vs Marginal CostMarginal Benefit vs Marginal Costbull Marginal Benefit ndash Benefit that an individual gets from consuming an
additional unit of good or service However each additional unit consumed results in smaller marginal benefit and results in diminishing returns
The demand curve represents the marginal benefit curve of the product to consumers
bull Marginal Cost ndash Cost of producing an additional unit of output also referred to as opportunity cost
The supply curve represents the marginal cost curve of the producers
Marginal Benefit vs Marginal Cost ndash Marginal Benefit vs Marginal Cost ndash Example 1Example 1
bull Read more httpnewsinfoinquirernet617323sc-ruling-on-dap-checks-balances-democracy-workixzz36mhRVdfo Follow us inquirerdotnet on Twitter | inquirerdotnet on Facebook
bull The Supreme Court last Tuesday struck down the DAP including a circular allowing the release of savings from the executive department to agencies and projects outside the national budget approved by Congress
bull The executive department pooled savings under the DAP a stimulus program introduced in 2011 and allotted these for projects to speed up government spending and boost economic growth
bull
Marginal Benefit vs Marginal Cost ndash Marginal Benefit vs Marginal Cost ndash Example 2Example 2
bull The selling price is P100bull The variable cost per unit is P40 (of which is P5 marketing
costs)bull The total fixed manufacturing cost is P5000bull The total fixed administrative costs is P2200
bull Requirementsbull Compute for the break-even unitsbull If there are 150 units how much is the increase in net income
Consumer Surplus amp Producer SurplusConsumer Surplus amp Producer Surplusbull Consumer Surplus is the difference
between total value consumers place on a good produced less the amount paid
bull Producer Surplus is the difference between the price received for each good produced and the opportunity cost of producing the good
bull The difference between the lowest available price for a good and the highest price is the producer surplus
Price Takers amp SearchersPrice Takers amp Searchersbull Price takers must take the market
price in selling their product because each price takerrsquos output is small relative to total market
bull Price searchers have a downward sloping demand curve for their product The amount they are able to sell is inversely related to the price they charge
Price Taker Market Characteristics1048729 All firms are producing an identical product1048729 A large number of firms exist in the market1048729 Each firm supplies only a very small portion of total amount supplied to the market1048729 No barriers limit the entry or exit of firms in the market
Market StructuresMarket StructuresPerfect
Competition
of Sellers and Buyers
Many
Sellerrsquos Products
Identical
Barriers to entry None
Economies of Scale
Low
Competition Between Sellers
High
Other
Buyers have perfect
knowledge of product and
price
MonopolisticCompetition
Many
Slight Differences
None
Low
High
Oligopoly
A Few Sellers
No Close Substitutes
High
Often High
High or Low
Sellers are independent
but have incentive to form cartel
Monopoly
One Seller
No Close Substitutes
Insurmountable
Often High
None
Macroeconomic ConceptMacroeconomic Conceptbull Macroeconomic concepts that have an impact on all firms
in the same environment be it a country a group of related countries or a particular industry
bull Topics covered concepts about the business cycle and how to forecast changes in the business cycle and the impact on among other things price levels and profitability
Macroeconomic Concept Business CycleMacroeconomic Concept Business Cyclebull
Moderating the Business Cycle
Policies can be used to moderate the business cycle
Status of the Economy
Appropriate Action
Using Fiscal Policy
Using Monetary Policy
RecessionGDP lt PotentialExcess unemployment
StimulusAD uarr
G uarr T darrDeficit uarr
M uarr
BoomGDP gt PotentialRising real wages
ContractionAD darr
G darr T uarrDeficit darr
M darr
bull The actions can be oDiscretionary actions require a policy change
Example bull Increase government spending on roadsbullRaise income tax rates
Moderating the Business Cycle (continued)
oAutomatic actions require no policy change and occur with changes in the level of economic activity Examples
bull Income taxes are based on progressive rates so total taxes fall at an accelerating rate with declining economic activity
bull Needs-based spending such as unemployment insurance automatically increases with rising unemployment
Moderating the Business Cycle (continued)
bull Discretionary policy is hampered by lags oRecognition oLaw-makingoImpact
Moderating the Business Cycle (continued)
bull bull The Rate of Inflation is calculated as Inflation = Last yearrsquos price index - This yearrsquos price index 100
rate Last yearrsquos price index
bull bull Inflation is an increase in the general level of prices
Macroeconomics Inflation
Inflation and Interest Rates
Nominal interest rates reflect both an expectation of inflation and a real rate of interest
bull Supply set by BSPbull Demand is a function of interest rate
bull Investment demand for capitalbull Savings supplybull Real interest rate is independent of inflation rate
Change in inflation expectations directly changes nominal rates
rnom = Real rate + E(inf)
Unexpected inflation redistributes income among economic groups
If inflation is higher than expected
Interest rates will have been set too low
Benefits borrowers at the expense of lenders
Causes borrowers to regret they did not borrow more and lenders to regret they did not lend less
Inflation and Interest Rates (continued)
If inflation is lower than expected
Interest rates will have been set too high
Benefits lenders at the expense of borrowers
Causes lenders to regret they did not lend more and borrowers to regret they did not borrow less
Inflation and Interest Rates (continued)
Two Types of Inflation
Demand-Pull Inflation starts with an increase in AD Typical causes of the increase include an increase in the money supply government spending or exports Assuming the economy is already at full employment
bull The increase in AD will increase GDPReal and the price level bull But rising costs will decrease SRAS leading to another increase in the
price level and decrease in GDPReal
bull Net result is a one time round of price increases and no change in GDPReal
bull However if the money supply continues to grow excessively and fuel AD the demand-pull inflation process can continue
Cost-Push Inflation starts with an increase in costs Typical causes of the increase include a rise in the money wage rate or raw material prices
Rising costs reduce the SRAS curve and the initial effect is to increase prices and decrease GDPReal
This fall below GDPPotential could precipitate government stimulation which will increase AD leading to another increase in prices and an increase back to GDPPotential
Net result is a one time round of price increases and no change in GDPReal
Two Types of Inflation (continued)
In the short run Some inputs (such as labor and raw materials) are variable but others (such as
property plant and equipment) are not Output can benefit by the specialization of labor All inputs are subject to the Law of Diminishing Returns
Output in the Short Run
AFC Falls as output rises and fixed cost is spread AVC and MC
bull First fall with specializationbull Then rise with Law of Diminishing Returns
MC When rising it will intersect the minimum points on AVC and ATC
Expected Relationships in the Short-Run
Expected Relationships in the Short-Run
In the long run all costs are variable and the firm can alter the size of its plant to meet higher or lower product demand
bull If expanding plant size leads to more efficiency and specialization the minimum point on the SRATC curve will be lower
bull If expanding the plant size leads to less efficiency and specialization the minimum point on the SRATC curve will be higher
bull These minimum points become the firms LRATC curve (which can be upward flat or even downward sloping)
The minimum point on the LRATC curve is the firmrsquos minimum efficient scale
Costs in the Long Run (continued)
In the short run some costs are fixed and the firm will maximize profits by operating at the minimum point on its SRATC curve
Costs in the Long Run
The aggregate demand curve (AD) measures the amount of total real consumption expenditures (goods and services) demanded at various price levels
AD = Y = C+I+G + (XndashM) = GDPRealAD curversquos downward slope is caused by the
bull Wealth Effect Rising inflation (GDP Deflator uarr) causes financial assets to lose value All other things equal this leads to increased savings and decreased current spending
bull Substitution Effect Rising prices and inflation increase nominal interest rates which reduces borrowing to fund current consumer and investment spending
A change in AD curve is due to a factor other than price
Aggregate supply is the quantity of goods services supplied (GDPReal) It is a function of aggregate production which depends on
bull Quantity of Labor (L)
bull Quantity of Capital (K)
bull Level of Technology (T)
At any one point in time the level of technology and quantity of capital are fixed but the quantity of labor is variable This produces a vertical long-run aggregate supply and an upward sloping short-run aggregate supply curve
Potential GDP increases over time with increases in the
Increases in factor costs decrease the SRAS curve
bull ldquoFull employmentrdquo quantity of labor
bull Capital (human and physical)
bull Level of Technology
bull ldquoDoes not affect real factors of production and Potential GDP
bull Rising production costs decreases SRAS (higher price for any quantity of output)
bull Assuming all other prices rise at the same rate the economy remains at Potential GDP but at a higher price level
Classical View The economy is self regulating back to full employment
bull Wages and prices adjust fully and quickly to eliminate shortages and surpluses to restore economic efficiency and full employment
bull Taxes and government intervention are potential disruption to the market signals necessary for fully functioning competitive markets
bull Technology is the prime driver in increasing aggregate demand and supply over time
Keynesian View The economy is inherently unstable and does not return to a long-run equilibrium (potential GDP) without government intervention
bull Expectation are the primary determinant of AD and expectations are the subject to excesses of optimism and pessimism (leading to inflation and recession)
bull SRAS does not quickly adjust because wages in particular are ldquostickyrdquo in the downward direction
bull Government intervention to dampen or stimulate the economy is needed to maintain output at potential GDP
Monetarist View The economy is self regulating back to full employment as long as the money supply grows at an appropriate stable pace
bull The quantity of money fuels aggregate demandbull Recessions are caused by bad monetary policybull The wage rate is sticky which delays economic recoveries when
coming from recessionbull Taxes and government intervention are a potential disruption to the
market signals necessary to make competitive markets work
MONEYMoney is a means of payment to settle a debt for a current or prior purchase It has three functions
Medium of exchange for goods or services Credit cards are not money they just delay the debt Checks are not money They move funds (money) from one account to
another Checking account balances are money
Store of value that can be held and exchanged for goods in the futureUnit of account that allows relative prices to be quoted in a standard unit
The Supply and Demand for Money
The supply of money is fixed at any point in time by the Fed (hence the vertical supply curve)
The ldquopricerdquo of money is the interest rate
Equilibrium Price
Shortage leads to selling of investments
Surplus of money leads market participants to invest
bull The demand for money is affected by four major factorsoThe level of interest rates cause movement on the demand
curve and is inversely related to demandHigher rates create an incentive to invest instead of holding money
Higher rates are associated with higher inflation which causes money to lose value
The Supply and Demand for Money (continued)
oThe General Price LevelQuantity of nominal money demanded is directly related to the price level
Quantity of real dollars demanded is independent of the price level
oReal GDP demand for money is directly related to real income
oFinancial Innovation has generally led to greater liquidity and decreased demand for narrowly defined money
The Supply and Demand for Money (continued)
Two Categoriesbull Renewable resources are replenished by naturebull Nonrenewable resources are used up in production
Renewable Resourcesbull Total supply is fixed and inelasticbull Any one purchaser can obtain more by paying a higher price
Non-Renewable Resourcesbull Total supply (both known and expected to be recovered supply) is fixed known
and perfectly elasticbull Total demand (current and all future demand) determine future pricebull Current price is the PV of future price causing the current price to rise over time
at the rate of interest rates (Hotelling Principle)bull Lack of perfect knowledge of future supply demand and interest rate can lead to
surprise changes in price today
The materials balances model
bull Kneese Ayresand DrsquoArge (1970) (Thomas 2010) (Figure 10)
Environmental Policies
The Philippine Experience
bull PD 1151 Philippine Environmental Policy (1977)bull Renewable Energy Act (2008)bull In December of 2008 then President Gloria M Arroyo
signed into law the Republic Act 9513 Renewable Energy (RE) Act of 2008-an act promoting the development utilization and commercialization of renewable energy resources and for other purposes
The Philippine Experience
bull Its targets were ldquofor the Philippines (Perez 2009) bull to be the No1 geothermal producer in the worldbull to be the No1 wind power producer in the Southeast
Asiabull to double its hydro capacity by 2013bull to expand contribution of biomass solar and ocean
energy by 250 MWrdquo
The Philippine Experience
bull The Philippines has an abounding potential for generating energy from renewable resources (Perez 2009)bull Geothermal resource 1200 MW bull Wind 700 MWbull Solar no potential estimate which depends on solar panels put
up (but currently the largest solar manufacturing hub in Southeast Asia producing 400 MW)
bull Hydro 1784 MW from 888 sitesbull Biomass (bagasse) 235 MMBFOE
The Philippine Experience
bull Amidst the so-called abundance of this Philippine potential for renewable energy about 50 of its power generation still comes from non-renewable sources (ie coal (26) and oil (23)) (Department of Trade and Industry 2009) DTI has forecasted that with growing industrial demand the country will still require 4000 to 4350 MW for sustainability (Department of Trade and Industry 2009)

Microeconomics Example of factors Microeconomics Example of factors affecting increase (decrease) supply for affecting increase (decrease) supply for goodsgoods
bull Read more httpbusinessinquirernet128269mrt-lrt-fares-may-go-up-in-august-abayaixzz36mF0nFX7
bull For example MRT 3 was designed to serve 350000 passengers per day but some 600000 people cram the system daily
bull A 13-kilometer stretch of the line on north Edsamdashfrom Muntildeoz to Trinomamdashhas yet to be connected three years into the Aquino administration
bull Critics say that no mass transportation system anywhere in the world makes money quite apart from Hong Kong
Microeconomics Example of factors Microeconomics Example of factors affecting increase (decrease) supply for affecting increase (decrease) supply for goodsgoods
bull Read more httpbusinessinquirernet128269mrt-lrt-fares-may-go-up-in-august-abayaixzz36mF0nFX7
bull Even with the fare increase the LRT lines and MRT 3 come out ldquocheaperrdquo than rates charged by bus operators which are pegged at P40 per passenger Abaya said
bull The current fare at MRT which runs through Edsa Metro Manilarsquos main highway is pegged at a maximum of P15 per passenger For LRT 1 passengers are charged up to P20 each for a single journey for LRT 2 the rate is pegged at P15
Microeconomics Example of factors Microeconomics Example of factors affecting increase (decrease) supply for affecting increase (decrease) supply for goodsgoods
bull Read more httpbusinessinquirernet128269mrt-lrt-fares-may-go-up-in-august-abayaixzz36mF0nFX7
bull Unlike other agencies under the DOTC the LRTA is unique as it does not have a regulating body when it comes to setting fares
bull For the MRT 3 alone Abaya said the government was spending P60 to transport one passenger from end to end well above the current ticket price This translates to about P7 billion to P9 billion in subsidies every year
Microeconomics Example of factors Microeconomics Example of factors affecting increase (decrease) supply for affecting increase (decrease) supply for goodsgoods
bull Read more httpbusinessinquirernet128269mrt-lrt-fares-may-go-up-in-august-abayaixzz36mF0nFX7
bull To address overcrowding the DOTC is evaluating a proposal by a Chinese manufacturer as part of its plan to acquire 48 new train cars to expand MRT 3rsquos capacity
bull ldquoComplete delivery will happen on May 2016rdquo he said
bull MRT 3 currently has a fleet of 73 train cars serving passengers at 3-minute intervals The DOTC said the addition of new cars will cut the waiting time to 25-minute intervals
Marginal Benefit vs Marginal CostMarginal Benefit vs Marginal Costbull Marginal Benefit ndash Benefit that an individual gets from consuming an
additional unit of good or service However each additional unit consumed results in smaller marginal benefit and results in diminishing returns
The demand curve represents the marginal benefit curve of the product to consumers
bull Marginal Cost ndash Cost of producing an additional unit of output also referred to as opportunity cost
The supply curve represents the marginal cost curve of the producers
Marginal Benefit vs Marginal Cost ndash Marginal Benefit vs Marginal Cost ndash Example 1Example 1
bull Read more httpnewsinfoinquirernet617323sc-ruling-on-dap-checks-balances-democracy-workixzz36mhRVdfo Follow us inquirerdotnet on Twitter | inquirerdotnet on Facebook
bull The Supreme Court last Tuesday struck down the DAP including a circular allowing the release of savings from the executive department to agencies and projects outside the national budget approved by Congress
bull The executive department pooled savings under the DAP a stimulus program introduced in 2011 and allotted these for projects to speed up government spending and boost economic growth
bull
Marginal Benefit vs Marginal Cost ndash Marginal Benefit vs Marginal Cost ndash Example 2Example 2
bull The selling price is P100bull The variable cost per unit is P40 (of which is P5 marketing
costs)bull The total fixed manufacturing cost is P5000bull The total fixed administrative costs is P2200
bull Requirementsbull Compute for the break-even unitsbull If there are 150 units how much is the increase in net income
Consumer Surplus amp Producer SurplusConsumer Surplus amp Producer Surplusbull Consumer Surplus is the difference
between total value consumers place on a good produced less the amount paid
bull Producer Surplus is the difference between the price received for each good produced and the opportunity cost of producing the good
bull The difference between the lowest available price for a good and the highest price is the producer surplus
Price Takers amp SearchersPrice Takers amp Searchersbull Price takers must take the market
price in selling their product because each price takerrsquos output is small relative to total market
bull Price searchers have a downward sloping demand curve for their product The amount they are able to sell is inversely related to the price they charge
Price Taker Market Characteristics1048729 All firms are producing an identical product1048729 A large number of firms exist in the market1048729 Each firm supplies only a very small portion of total amount supplied to the market1048729 No barriers limit the entry or exit of firms in the market
Market StructuresMarket StructuresPerfect
Competition
of Sellers and Buyers
Many
Sellerrsquos Products
Identical
Barriers to entry None
Economies of Scale
Low
Competition Between Sellers
High
Other
Buyers have perfect
knowledge of product and
price
MonopolisticCompetition
Many
Slight Differences
None
Low
High
Oligopoly
A Few Sellers
No Close Substitutes
High
Often High
High or Low
Sellers are independent
but have incentive to form cartel
Monopoly
One Seller
No Close Substitutes
Insurmountable
Often High
None
Macroeconomic ConceptMacroeconomic Conceptbull Macroeconomic concepts that have an impact on all firms
in the same environment be it a country a group of related countries or a particular industry
bull Topics covered concepts about the business cycle and how to forecast changes in the business cycle and the impact on among other things price levels and profitability
Macroeconomic Concept Business CycleMacroeconomic Concept Business Cyclebull
Moderating the Business Cycle
Policies can be used to moderate the business cycle
Status of the Economy
Appropriate Action
Using Fiscal Policy
Using Monetary Policy
RecessionGDP lt PotentialExcess unemployment
StimulusAD uarr
G uarr T darrDeficit uarr
M uarr
BoomGDP gt PotentialRising real wages
ContractionAD darr
G darr T uarrDeficit darr
M darr
bull The actions can be oDiscretionary actions require a policy change
Example bull Increase government spending on roadsbullRaise income tax rates
Moderating the Business Cycle (continued)
oAutomatic actions require no policy change and occur with changes in the level of economic activity Examples
bull Income taxes are based on progressive rates so total taxes fall at an accelerating rate with declining economic activity
bull Needs-based spending such as unemployment insurance automatically increases with rising unemployment
Moderating the Business Cycle (continued)
bull Discretionary policy is hampered by lags oRecognition oLaw-makingoImpact
Moderating the Business Cycle (continued)
bull bull The Rate of Inflation is calculated as Inflation = Last yearrsquos price index - This yearrsquos price index 100
rate Last yearrsquos price index
bull bull Inflation is an increase in the general level of prices
Macroeconomics Inflation
Inflation and Interest Rates
Nominal interest rates reflect both an expectation of inflation and a real rate of interest
bull Supply set by BSPbull Demand is a function of interest rate
bull Investment demand for capitalbull Savings supplybull Real interest rate is independent of inflation rate
Change in inflation expectations directly changes nominal rates
rnom = Real rate + E(inf)
Unexpected inflation redistributes income among economic groups
If inflation is higher than expected
Interest rates will have been set too low
Benefits borrowers at the expense of lenders
Causes borrowers to regret they did not borrow more and lenders to regret they did not lend less
Inflation and Interest Rates (continued)
If inflation is lower than expected
Interest rates will have been set too high
Benefits lenders at the expense of borrowers
Causes lenders to regret they did not lend more and borrowers to regret they did not borrow less
Inflation and Interest Rates (continued)
Two Types of Inflation
Demand-Pull Inflation starts with an increase in AD Typical causes of the increase include an increase in the money supply government spending or exports Assuming the economy is already at full employment
bull The increase in AD will increase GDPReal and the price level bull But rising costs will decrease SRAS leading to another increase in the
price level and decrease in GDPReal
bull Net result is a one time round of price increases and no change in GDPReal
bull However if the money supply continues to grow excessively and fuel AD the demand-pull inflation process can continue
Cost-Push Inflation starts with an increase in costs Typical causes of the increase include a rise in the money wage rate or raw material prices
Rising costs reduce the SRAS curve and the initial effect is to increase prices and decrease GDPReal
This fall below GDPPotential could precipitate government stimulation which will increase AD leading to another increase in prices and an increase back to GDPPotential
Net result is a one time round of price increases and no change in GDPReal
Two Types of Inflation (continued)
In the short run Some inputs (such as labor and raw materials) are variable but others (such as
property plant and equipment) are not Output can benefit by the specialization of labor All inputs are subject to the Law of Diminishing Returns
Output in the Short Run
AFC Falls as output rises and fixed cost is spread AVC and MC
bull First fall with specializationbull Then rise with Law of Diminishing Returns
MC When rising it will intersect the minimum points on AVC and ATC
Expected Relationships in the Short-Run
Expected Relationships in the Short-Run
In the long run all costs are variable and the firm can alter the size of its plant to meet higher or lower product demand
bull If expanding plant size leads to more efficiency and specialization the minimum point on the SRATC curve will be lower
bull If expanding the plant size leads to less efficiency and specialization the minimum point on the SRATC curve will be higher
bull These minimum points become the firms LRATC curve (which can be upward flat or even downward sloping)
The minimum point on the LRATC curve is the firmrsquos minimum efficient scale
Costs in the Long Run (continued)
In the short run some costs are fixed and the firm will maximize profits by operating at the minimum point on its SRATC curve
Costs in the Long Run
The aggregate demand curve (AD) measures the amount of total real consumption expenditures (goods and services) demanded at various price levels
AD = Y = C+I+G + (XndashM) = GDPRealAD curversquos downward slope is caused by the
bull Wealth Effect Rising inflation (GDP Deflator uarr) causes financial assets to lose value All other things equal this leads to increased savings and decreased current spending
bull Substitution Effect Rising prices and inflation increase nominal interest rates which reduces borrowing to fund current consumer and investment spending
A change in AD curve is due to a factor other than price
Aggregate supply is the quantity of goods services supplied (GDPReal) It is a function of aggregate production which depends on
bull Quantity of Labor (L)
bull Quantity of Capital (K)
bull Level of Technology (T)
At any one point in time the level of technology and quantity of capital are fixed but the quantity of labor is variable This produces a vertical long-run aggregate supply and an upward sloping short-run aggregate supply curve
Potential GDP increases over time with increases in the
Increases in factor costs decrease the SRAS curve
bull ldquoFull employmentrdquo quantity of labor
bull Capital (human and physical)
bull Level of Technology
bull ldquoDoes not affect real factors of production and Potential GDP
bull Rising production costs decreases SRAS (higher price for any quantity of output)
bull Assuming all other prices rise at the same rate the economy remains at Potential GDP but at a higher price level
Classical View The economy is self regulating back to full employment
bull Wages and prices adjust fully and quickly to eliminate shortages and surpluses to restore economic efficiency and full employment
bull Taxes and government intervention are potential disruption to the market signals necessary for fully functioning competitive markets
bull Technology is the prime driver in increasing aggregate demand and supply over time
Keynesian View The economy is inherently unstable and does not return to a long-run equilibrium (potential GDP) without government intervention
bull Expectation are the primary determinant of AD and expectations are the subject to excesses of optimism and pessimism (leading to inflation and recession)
bull SRAS does not quickly adjust because wages in particular are ldquostickyrdquo in the downward direction
bull Government intervention to dampen or stimulate the economy is needed to maintain output at potential GDP
Monetarist View The economy is self regulating back to full employment as long as the money supply grows at an appropriate stable pace
bull The quantity of money fuels aggregate demandbull Recessions are caused by bad monetary policybull The wage rate is sticky which delays economic recoveries when
coming from recessionbull Taxes and government intervention are a potential disruption to the
market signals necessary to make competitive markets work
MONEYMoney is a means of payment to settle a debt for a current or prior purchase It has three functions
Medium of exchange for goods or services Credit cards are not money they just delay the debt Checks are not money They move funds (money) from one account to
another Checking account balances are money
Store of value that can be held and exchanged for goods in the futureUnit of account that allows relative prices to be quoted in a standard unit
The Supply and Demand for Money
The supply of money is fixed at any point in time by the Fed (hence the vertical supply curve)
The ldquopricerdquo of money is the interest rate
Equilibrium Price
Shortage leads to selling of investments
Surplus of money leads market participants to invest
bull The demand for money is affected by four major factorsoThe level of interest rates cause movement on the demand
curve and is inversely related to demandHigher rates create an incentive to invest instead of holding money
Higher rates are associated with higher inflation which causes money to lose value
The Supply and Demand for Money (continued)
oThe General Price LevelQuantity of nominal money demanded is directly related to the price level
Quantity of real dollars demanded is independent of the price level
oReal GDP demand for money is directly related to real income
oFinancial Innovation has generally led to greater liquidity and decreased demand for narrowly defined money
The Supply and Demand for Money (continued)
Two Categoriesbull Renewable resources are replenished by naturebull Nonrenewable resources are used up in production
Renewable Resourcesbull Total supply is fixed and inelasticbull Any one purchaser can obtain more by paying a higher price
Non-Renewable Resourcesbull Total supply (both known and expected to be recovered supply) is fixed known
and perfectly elasticbull Total demand (current and all future demand) determine future pricebull Current price is the PV of future price causing the current price to rise over time
at the rate of interest rates (Hotelling Principle)bull Lack of perfect knowledge of future supply demand and interest rate can lead to
surprise changes in price today
The materials balances model
bull Kneese Ayresand DrsquoArge (1970) (Thomas 2010) (Figure 10)
Environmental Policies
The Philippine Experience
bull PD 1151 Philippine Environmental Policy (1977)bull Renewable Energy Act (2008)bull In December of 2008 then President Gloria M Arroyo
signed into law the Republic Act 9513 Renewable Energy (RE) Act of 2008-an act promoting the development utilization and commercialization of renewable energy resources and for other purposes
The Philippine Experience
bull Its targets were ldquofor the Philippines (Perez 2009) bull to be the No1 geothermal producer in the worldbull to be the No1 wind power producer in the Southeast
Asiabull to double its hydro capacity by 2013bull to expand contribution of biomass solar and ocean
energy by 250 MWrdquo
The Philippine Experience
bull The Philippines has an abounding potential for generating energy from renewable resources (Perez 2009)bull Geothermal resource 1200 MW bull Wind 700 MWbull Solar no potential estimate which depends on solar panels put
up (but currently the largest solar manufacturing hub in Southeast Asia producing 400 MW)
bull Hydro 1784 MW from 888 sitesbull Biomass (bagasse) 235 MMBFOE
The Philippine Experience
bull Amidst the so-called abundance of this Philippine potential for renewable energy about 50 of its power generation still comes from non-renewable sources (ie coal (26) and oil (23)) (Department of Trade and Industry 2009) DTI has forecasted that with growing industrial demand the country will still require 4000 to 4350 MW for sustainability (Department of Trade and Industry 2009)
Microeconomics Example of factors Microeconomics Example of factors affecting increase (decrease) supply for affecting increase (decrease) supply for goodsgoods
bull Read more httpbusinessinquirernet128269mrt-lrt-fares-may-go-up-in-august-abayaixzz36mF0nFX7
bull Unlike other agencies under the DOTC the LRTA is unique as it does not have a regulating body when it comes to setting fares
bull For the MRT 3 alone Abaya said the government was spending P60 to transport one passenger from end to end well above the current ticket price This translates to about P7 billion to P9 billion in subsidies every year
Microeconomics Example of factors Microeconomics Example of factors affecting increase (decrease) supply for affecting increase (decrease) supply for goodsgoods
bull Read more httpbusinessinquirernet128269mrt-lrt-fares-may-go-up-in-august-abayaixzz36mF0nFX7
bull To address overcrowding the DOTC is evaluating a proposal by a Chinese manufacturer as part of its plan to acquire 48 new train cars to expand MRT 3rsquos capacity
bull ldquoComplete delivery will happen on May 2016rdquo he said
bull MRT 3 currently has a fleet of 73 train cars serving passengers at 3-minute intervals The DOTC said the addition of new cars will cut the waiting time to 25-minute intervals
Marginal Benefit vs Marginal CostMarginal Benefit vs Marginal Costbull Marginal Benefit ndash Benefit that an individual gets from consuming an
additional unit of good or service However each additional unit consumed results in smaller marginal benefit and results in diminishing returns
The demand curve represents the marginal benefit curve of the product to consumers
bull Marginal Cost ndash Cost of producing an additional unit of output also referred to as opportunity cost
The supply curve represents the marginal cost curve of the producers
Marginal Benefit vs Marginal Cost ndash Marginal Benefit vs Marginal Cost ndash Example 1Example 1
bull Read more httpnewsinfoinquirernet617323sc-ruling-on-dap-checks-balances-democracy-workixzz36mhRVdfo Follow us inquirerdotnet on Twitter | inquirerdotnet on Facebook
bull The Supreme Court last Tuesday struck down the DAP including a circular allowing the release of savings from the executive department to agencies and projects outside the national budget approved by Congress
bull The executive department pooled savings under the DAP a stimulus program introduced in 2011 and allotted these for projects to speed up government spending and boost economic growth
bull
Marginal Benefit vs Marginal Cost ndash Marginal Benefit vs Marginal Cost ndash Example 2Example 2
bull The selling price is P100bull The variable cost per unit is P40 (of which is P5 marketing
costs)bull The total fixed manufacturing cost is P5000bull The total fixed administrative costs is P2200
bull Requirementsbull Compute for the break-even unitsbull If there are 150 units how much is the increase in net income
Consumer Surplus amp Producer SurplusConsumer Surplus amp Producer Surplusbull Consumer Surplus is the difference
between total value consumers place on a good produced less the amount paid
bull Producer Surplus is the difference between the price received for each good produced and the opportunity cost of producing the good
bull The difference between the lowest available price for a good and the highest price is the producer surplus
Price Takers amp SearchersPrice Takers amp Searchersbull Price takers must take the market
price in selling their product because each price takerrsquos output is small relative to total market
bull Price searchers have a downward sloping demand curve for their product The amount they are able to sell is inversely related to the price they charge
Price Taker Market Characteristics1048729 All firms are producing an identical product1048729 A large number of firms exist in the market1048729 Each firm supplies only a very small portion of total amount supplied to the market1048729 No barriers limit the entry or exit of firms in the market
Market StructuresMarket StructuresPerfect
Competition
of Sellers and Buyers
Many
Sellerrsquos Products
Identical
Barriers to entry None
Economies of Scale
Low
Competition Between Sellers
High
Other
Buyers have perfect
knowledge of product and
price
MonopolisticCompetition
Many
Slight Differences
None
Low
High
Oligopoly
A Few Sellers
No Close Substitutes
High
Often High
High or Low
Sellers are independent
but have incentive to form cartel
Monopoly
One Seller
No Close Substitutes
Insurmountable
Often High
None
Macroeconomic ConceptMacroeconomic Conceptbull Macroeconomic concepts that have an impact on all firms
in the same environment be it a country a group of related countries or a particular industry
bull Topics covered concepts about the business cycle and how to forecast changes in the business cycle and the impact on among other things price levels and profitability
Macroeconomic Concept Business CycleMacroeconomic Concept Business Cyclebull
Moderating the Business Cycle
Policies can be used to moderate the business cycle
Status of the Economy
Appropriate Action
Using Fiscal Policy
Using Monetary Policy
RecessionGDP lt PotentialExcess unemployment
StimulusAD uarr
G uarr T darrDeficit uarr
M uarr
BoomGDP gt PotentialRising real wages
ContractionAD darr
G darr T uarrDeficit darr
M darr
bull The actions can be oDiscretionary actions require a policy change
Example bull Increase government spending on roadsbullRaise income tax rates
Moderating the Business Cycle (continued)
oAutomatic actions require no policy change and occur with changes in the level of economic activity Examples
bull Income taxes are based on progressive rates so total taxes fall at an accelerating rate with declining economic activity
bull Needs-based spending such as unemployment insurance automatically increases with rising unemployment
Moderating the Business Cycle (continued)
bull Discretionary policy is hampered by lags oRecognition oLaw-makingoImpact
Moderating the Business Cycle (continued)
bull bull The Rate of Inflation is calculated as Inflation = Last yearrsquos price index - This yearrsquos price index 100
rate Last yearrsquos price index
bull bull Inflation is an increase in the general level of prices
Macroeconomics Inflation
Inflation and Interest Rates
Nominal interest rates reflect both an expectation of inflation and a real rate of interest
bull Supply set by BSPbull Demand is a function of interest rate
bull Investment demand for capitalbull Savings supplybull Real interest rate is independent of inflation rate
Change in inflation expectations directly changes nominal rates
rnom = Real rate + E(inf)
Unexpected inflation redistributes income among economic groups
If inflation is higher than expected
Interest rates will have been set too low
Benefits borrowers at the expense of lenders
Causes borrowers to regret they did not borrow more and lenders to regret they did not lend less
Inflation and Interest Rates (continued)
If inflation is lower than expected
Interest rates will have been set too high
Benefits lenders at the expense of borrowers
Causes lenders to regret they did not lend more and borrowers to regret they did not borrow less
Inflation and Interest Rates (continued)
Two Types of Inflation
Demand-Pull Inflation starts with an increase in AD Typical causes of the increase include an increase in the money supply government spending or exports Assuming the economy is already at full employment
bull The increase in AD will increase GDPReal and the price level bull But rising costs will decrease SRAS leading to another increase in the
price level and decrease in GDPReal
bull Net result is a one time round of price increases and no change in GDPReal
bull However if the money supply continues to grow excessively and fuel AD the demand-pull inflation process can continue
Cost-Push Inflation starts with an increase in costs Typical causes of the increase include a rise in the money wage rate or raw material prices
Rising costs reduce the SRAS curve and the initial effect is to increase prices and decrease GDPReal
This fall below GDPPotential could precipitate government stimulation which will increase AD leading to another increase in prices and an increase back to GDPPotential
Net result is a one time round of price increases and no change in GDPReal
Two Types of Inflation (continued)
In the short run Some inputs (such as labor and raw materials) are variable but others (such as
property plant and equipment) are not Output can benefit by the specialization of labor All inputs are subject to the Law of Diminishing Returns
Output in the Short Run
AFC Falls as output rises and fixed cost is spread AVC and MC
bull First fall with specializationbull Then rise with Law of Diminishing Returns
MC When rising it will intersect the minimum points on AVC and ATC
Expected Relationships in the Short-Run
Expected Relationships in the Short-Run
In the long run all costs are variable and the firm can alter the size of its plant to meet higher or lower product demand
bull If expanding plant size leads to more efficiency and specialization the minimum point on the SRATC curve will be lower
bull If expanding the plant size leads to less efficiency and specialization the minimum point on the SRATC curve will be higher
bull These minimum points become the firms LRATC curve (which can be upward flat or even downward sloping)
The minimum point on the LRATC curve is the firmrsquos minimum efficient scale
Costs in the Long Run (continued)
In the short run some costs are fixed and the firm will maximize profits by operating at the minimum point on its SRATC curve
Costs in the Long Run
The aggregate demand curve (AD) measures the amount of total real consumption expenditures (goods and services) demanded at various price levels
AD = Y = C+I+G + (XndashM) = GDPRealAD curversquos downward slope is caused by the
bull Wealth Effect Rising inflation (GDP Deflator uarr) causes financial assets to lose value All other things equal this leads to increased savings and decreased current spending
bull Substitution Effect Rising prices and inflation increase nominal interest rates which reduces borrowing to fund current consumer and investment spending
A change in AD curve is due to a factor other than price
Aggregate supply is the quantity of goods services supplied (GDPReal) It is a function of aggregate production which depends on
bull Quantity of Labor (L)
bull Quantity of Capital (K)
bull Level of Technology (T)
At any one point in time the level of technology and quantity of capital are fixed but the quantity of labor is variable This produces a vertical long-run aggregate supply and an upward sloping short-run aggregate supply curve
Potential GDP increases over time with increases in the
Increases in factor costs decrease the SRAS curve
bull ldquoFull employmentrdquo quantity of labor
bull Capital (human and physical)
bull Level of Technology
bull ldquoDoes not affect real factors of production and Potential GDP
bull Rising production costs decreases SRAS (higher price for any quantity of output)
bull Assuming all other prices rise at the same rate the economy remains at Potential GDP but at a higher price level
Classical View The economy is self regulating back to full employment
bull Wages and prices adjust fully and quickly to eliminate shortages and surpluses to restore economic efficiency and full employment
bull Taxes and government intervention are potential disruption to the market signals necessary for fully functioning competitive markets
bull Technology is the prime driver in increasing aggregate demand and supply over time
Keynesian View The economy is inherently unstable and does not return to a long-run equilibrium (potential GDP) without government intervention
bull Expectation are the primary determinant of AD and expectations are the subject to excesses of optimism and pessimism (leading to inflation and recession)
bull SRAS does not quickly adjust because wages in particular are ldquostickyrdquo in the downward direction
bull Government intervention to dampen or stimulate the economy is needed to maintain output at potential GDP
Monetarist View The economy is self regulating back to full employment as long as the money supply grows at an appropriate stable pace
bull The quantity of money fuels aggregate demandbull Recessions are caused by bad monetary policybull The wage rate is sticky which delays economic recoveries when
coming from recessionbull Taxes and government intervention are a potential disruption to the
market signals necessary to make competitive markets work
MONEYMoney is a means of payment to settle a debt for a current or prior purchase It has three functions
Medium of exchange for goods or services Credit cards are not money they just delay the debt Checks are not money They move funds (money) from one account to
another Checking account balances are money
Store of value that can be held and exchanged for goods in the futureUnit of account that allows relative prices to be quoted in a standard unit
The Supply and Demand for Money
The supply of money is fixed at any point in time by the Fed (hence the vertical supply curve)
The ldquopricerdquo of money is the interest rate
Equilibrium Price
Shortage leads to selling of investments
Surplus of money leads market participants to invest
bull The demand for money is affected by four major factorsoThe level of interest rates cause movement on the demand
curve and is inversely related to demandHigher rates create an incentive to invest instead of holding money
Higher rates are associated with higher inflation which causes money to lose value
The Supply and Demand for Money (continued)
oThe General Price LevelQuantity of nominal money demanded is directly related to the price level
Quantity of real dollars demanded is independent of the price level
oReal GDP demand for money is directly related to real income
oFinancial Innovation has generally led to greater liquidity and decreased demand for narrowly defined money
The Supply and Demand for Money (continued)
Two Categoriesbull Renewable resources are replenished by naturebull Nonrenewable resources are used up in production
Renewable Resourcesbull Total supply is fixed and inelasticbull Any one purchaser can obtain more by paying a higher price
Non-Renewable Resourcesbull Total supply (both known and expected to be recovered supply) is fixed known
and perfectly elasticbull Total demand (current and all future demand) determine future pricebull Current price is the PV of future price causing the current price to rise over time
at the rate of interest rates (Hotelling Principle)bull Lack of perfect knowledge of future supply demand and interest rate can lead to
surprise changes in price today
The materials balances model
bull Kneese Ayresand DrsquoArge (1970) (Thomas 2010) (Figure 10)
Environmental Policies
The Philippine Experience
bull PD 1151 Philippine Environmental Policy (1977)bull Renewable Energy Act (2008)bull In December of 2008 then President Gloria M Arroyo
signed into law the Republic Act 9513 Renewable Energy (RE) Act of 2008-an act promoting the development utilization and commercialization of renewable energy resources and for other purposes
The Philippine Experience
bull Its targets were ldquofor the Philippines (Perez 2009) bull to be the No1 geothermal producer in the worldbull to be the No1 wind power producer in the Southeast
Asiabull to double its hydro capacity by 2013bull to expand contribution of biomass solar and ocean
energy by 250 MWrdquo
The Philippine Experience
bull The Philippines has an abounding potential for generating energy from renewable resources (Perez 2009)bull Geothermal resource 1200 MW bull Wind 700 MWbull Solar no potential estimate which depends on solar panels put
up (but currently the largest solar manufacturing hub in Southeast Asia producing 400 MW)
bull Hydro 1784 MW from 888 sitesbull Biomass (bagasse) 235 MMBFOE
The Philippine Experience
bull Amidst the so-called abundance of this Philippine potential for renewable energy about 50 of its power generation still comes from non-renewable sources (ie coal (26) and oil (23)) (Department of Trade and Industry 2009) DTI has forecasted that with growing industrial demand the country will still require 4000 to 4350 MW for sustainability (Department of Trade and Industry 2009)
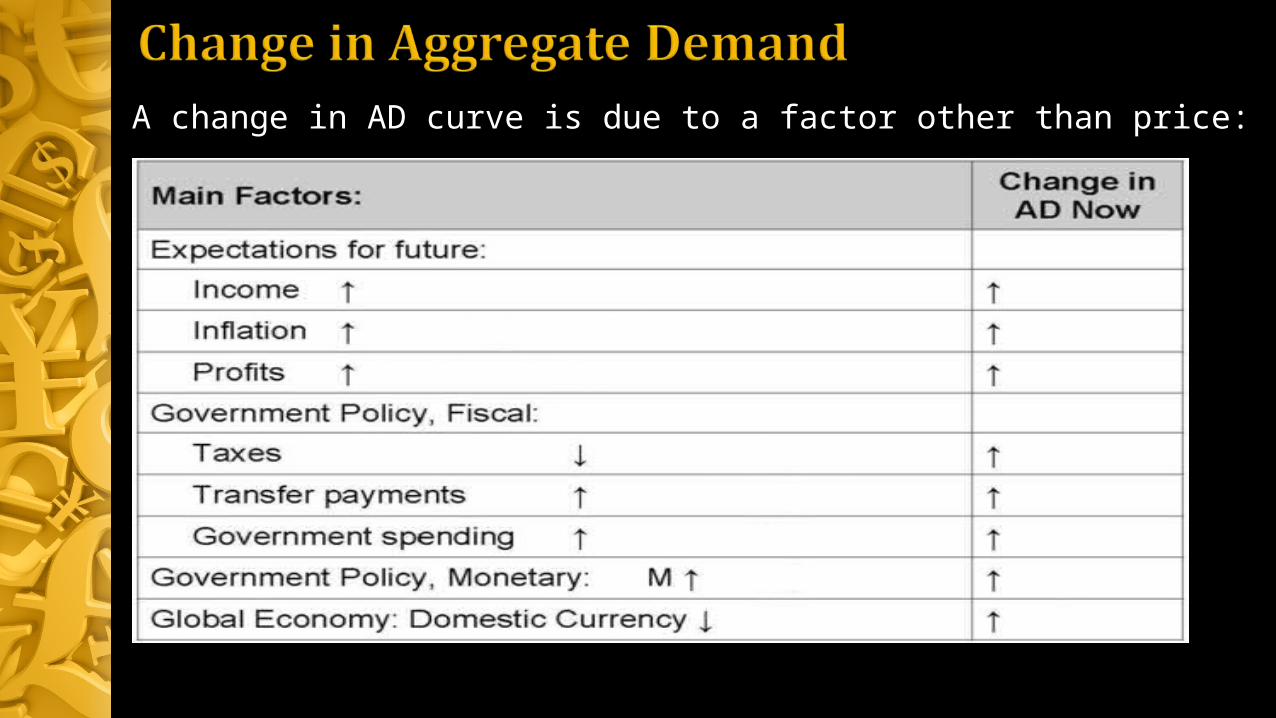
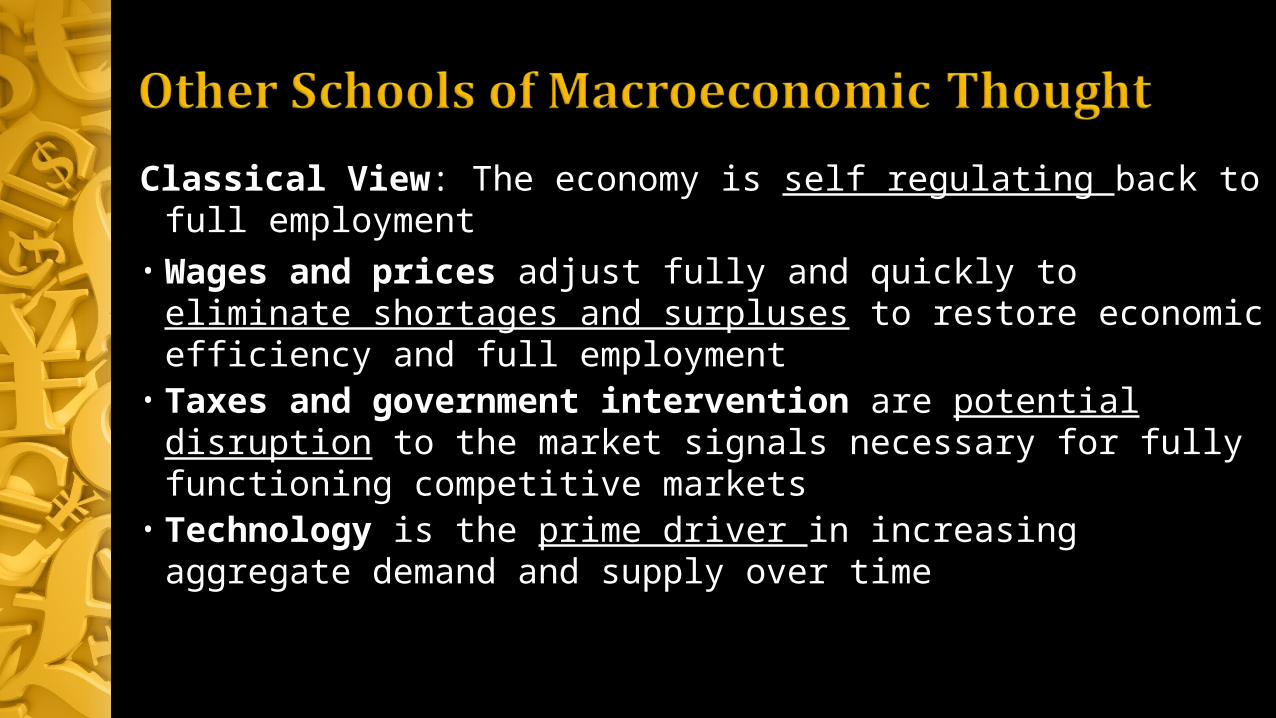
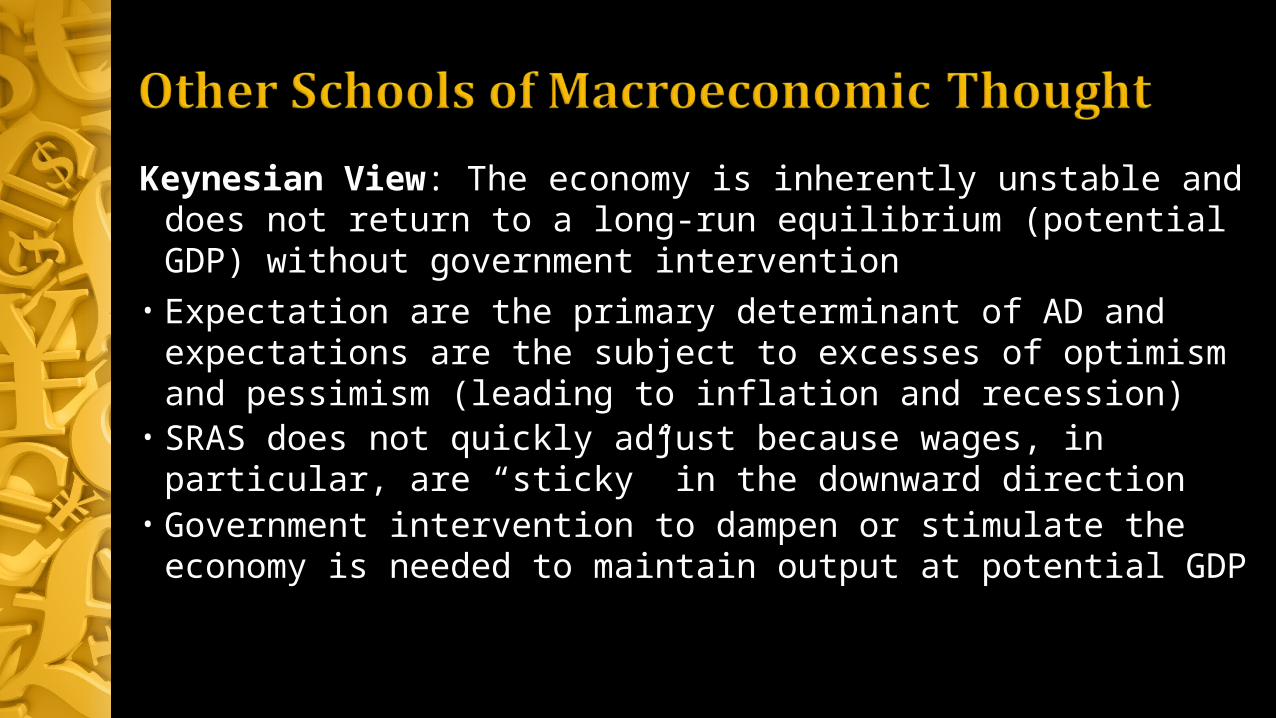
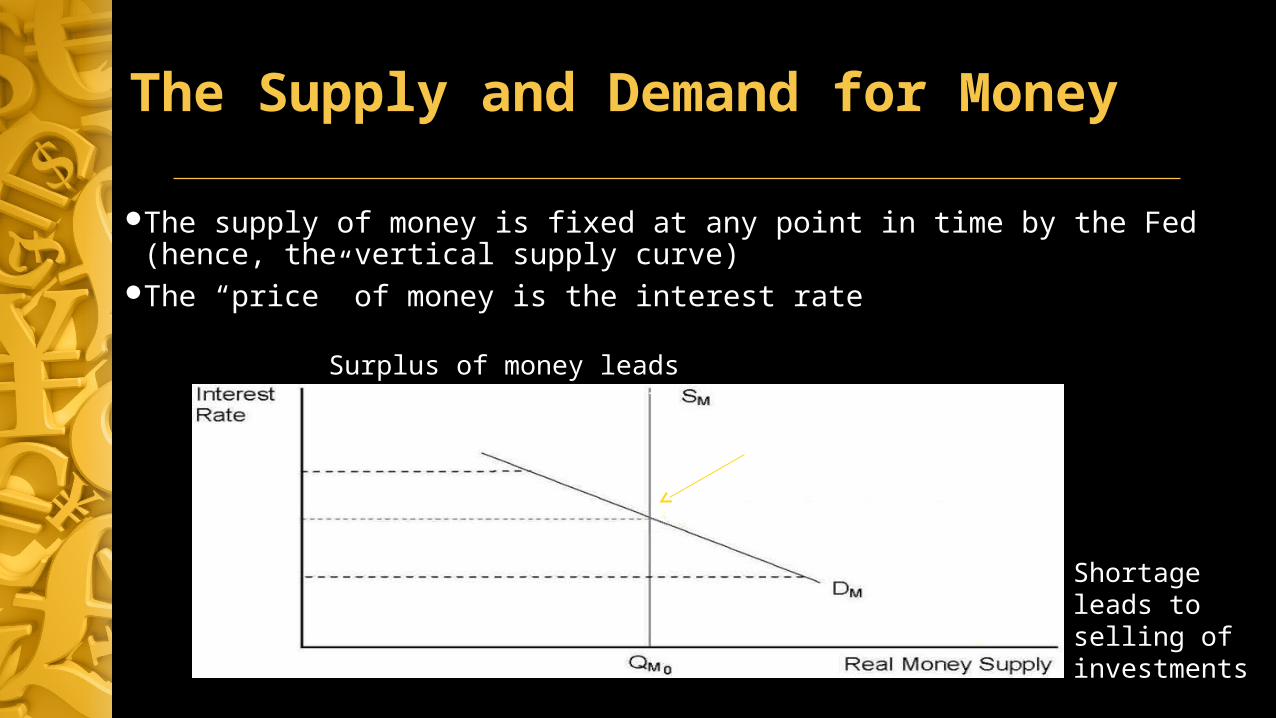

The Philippine Experience
bull Amidst the so-called abundance of this Philippine potential for renewable energy about 50 of its power generation still comes from non-renewable sources (ie coal (26) and oil (23)) (Department of Trade and Industry 2009) DTI has forecasted that with growing industrial demand the country will still require 4000 to 4350 MW for sustainability (Department of Trade and Industry 2009)