2 highlights of year 2005 positive economic outlook and indicators for africa g8 adopts the...
TRANSCRIPT

2
Highlights of Year 2005
Positive economic outlook and indicators for Africa
G8 adopts the Multilateral Debt Relief Initiative
Mr. Donald Kaberuka assumes office as the seventh elected
President of the Bank Group in September
Constitution of a Presidential Task Force on Institutional Reform
Bank policies and mix of products are amended to better address the
needs of member countries
Launch of first Botswana Pula denominated bond under the local
currency initiative

3
Table of Contents
11 African Economic Outlook
Bank Financial Profile33
Capital Market Activities44
22 Bank Group’s Activities and Road Ahead

4
The combination of the positive economic outlook and greater attention from the international community should result in progress towards achieving the Millennium Development Goals in Africa
11 African Economic Outlook

5
3.5%
4.0%
4.9%
5.2%
4.6%
3%
4%
4%
5%
5%
6%
2001 2002 2003 2004 2005
Drivers
Macroeconomic stability – Debt relief – Continued global expansion
Africa’s 2005 real GDP growth rate exceeded 4.5% for the third consecutive year
18 countries achieved GDP 18 countries achieved GDP growth rates growth rates above 5above 5 %%
Average per regionAverage per region
Central Africa: Central Africa: 4.8% 4.8%North Africa:North Africa: 4.8% 4.8%East Africa: East Africa: 5.6% 5.6% Southern Africa: 5.0%Southern Africa: 5.0%West Africa: West Africa: 4.4% 4.4%
Real GDP Growth
6
-5%
-2%
1%
4%
7%
10%
13%
2001 2002 2003 2004 2005
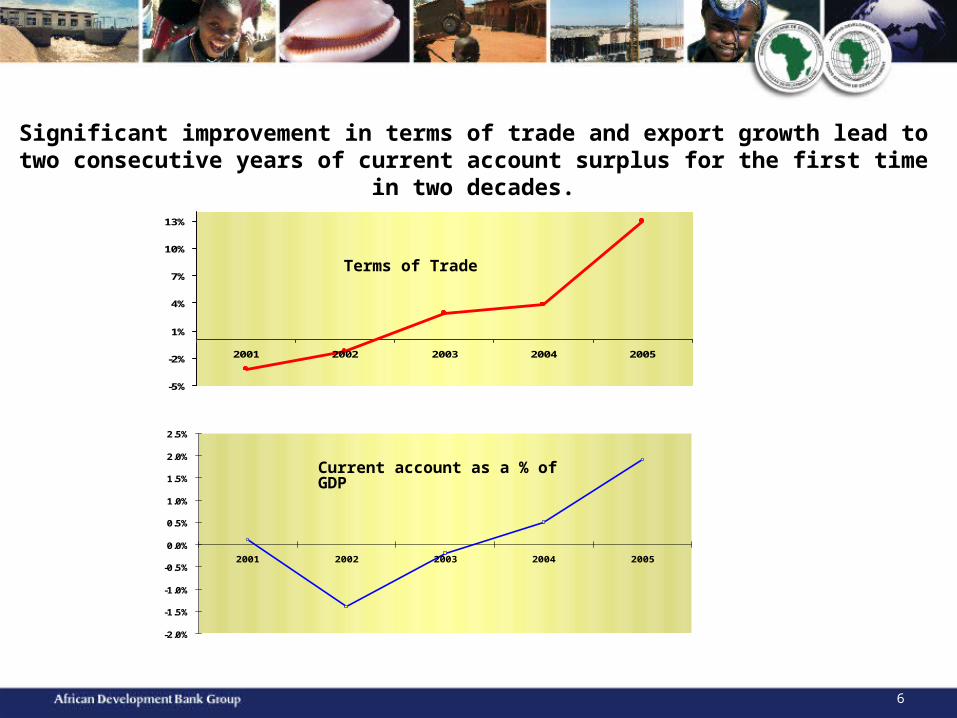
Significant improvement in terms of trade and export growth lead to two consecutive years of current account surplus for the first time in two decades.
-2.0%
-1.5%
-1.0%
-0.5%
0.0%
0.5%
1.0%
1.5%
2.0%
2.5%
2001 2002 2003 2004 2005
Terms of Trade
Current account as a % of GDP

7
Improved export performance and debt relief measures have contributed to a steady decline in debt service
53.3% 52.9%
48.3%
42.4%
35.7%
30%
40%
50%
60%
2001 2002 2003 2004 2005
17.8%
14.9%
13.8%
12.0%
10.6%
10%
15%
20%
2001 2002 2003 2004 2005
Debt Service Ratio Debt / GDP
8
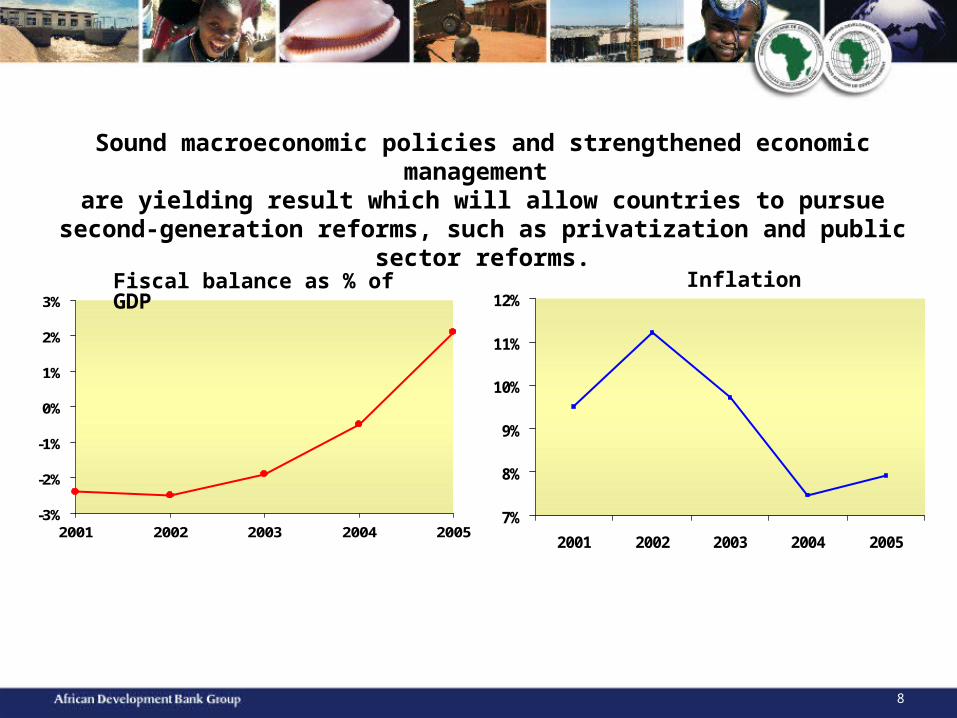
Sound macroeconomic policies and strengthened economic management are yielding result which will allow countries to pursue second-generation
reforms, such as privatization and public sector reforms.
7%
8%
9%
10%
11%
12%
2001 2002 2003 2004 2005
-3%
-2%
-1%
0%
1%
2%
3%
2001 2002 2003 2004 2005
InflationFiscal balance as % of GDP

9
G8 SUMMIT ON POVERTYG8 SUMMIT ON POVERTY
Fight against disease Fight against disease and hunger: and hunger:
Bono, Clinton & GatesBono, Clinton & Gates
Commission for Commission for AfricaAfrica
1.1. Eradicate extreme poverty Eradicate extreme poverty and hungerand hunger
2.2. Achieve universal Achieve universal primary educationprimary education
3.3. Promote gender equality Promote gender equality and empower womenand empower women
4.4. Reduce child mortalityReduce child mortality
5.5. Improve maternal healthImprove maternal health
6.6. Combat HIV/AIDS, malaria Combat HIV/AIDS, malaria and other diseasesand other diseases
7.7. Ensure environmental Ensure environmental sustainabilitysustainability
8.8. Develop a global Develop a global partnership for partnership for developmentdevelopment
Multilateral Debt Relief Initiative
Still, only few African countries will achieve the MDGs by 2015 even if all existing commitments to increase aid are honoured.
African Infrastructure African Infrastructure ConsortiumConsortium
In 2005, the spotlight of world development agenda was firmly on Africa
Millennium Millennium Development GoalsDevelopment Goals

10
22 Bank Group’s Activities and Road Ahead
In 2005, the Bank continued to build on its achievements and to reposition itself for greater effectiveness and efficiency in the delivery of its mandate

11
Access to ADB window
Access to ADF window
Access to ADB and ADF windows
Providing impetus to Africa’s development through the three windows of the ADB Group
Bank Group Vision
“The African Development
Bank is the premier financial
development institution of
Africa dedicated to
combating poverty and
improving the lives of the
people of the continent and
engaged in the task of
mobilizing resources toward
the economic and social
progress of its regional
member countries”
12
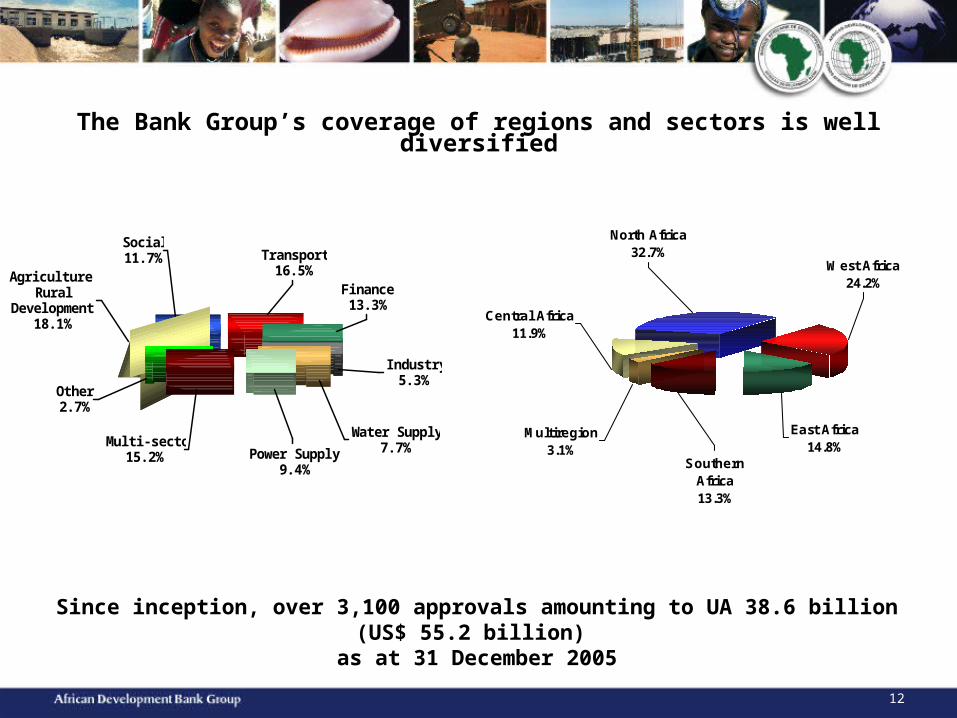
The Bank Group’s coverage of regions and sectors is well diversified
Agriculture & Rural
Development18.1%
Finance13.3%
Transport16.5%
Social11.7%
Other2.7%
Multi-sector15.2% Power Supply
9.4%
Water Supply7.7%
Industry5.3%
Since inception, over 3,100 approvals amounting to UA 38.6 billion (US$ 55.2 billion) as at 31 December 2005
Central Africa11.9%
Southern Africa13.3%
Multiregion3.1%
North Africa32.7%
West Africa24.2%
East Africa14.8%

13
The Bank Group’s approvals reflect customized assistance
24 out of 33 eligible African countries already benefit from debt relief under enhanced HIPC initiative
0
500
1,000
1,500
2,000
2,500
3,000
2001 2002 2003 2004 2005
ADB ADF HIPC NTF
In UA million
US$ 3.3 billion
US$ 4.3 billion
US$ 2.6 billion
US$ 2.8 billion
US$ 3.0 billion

14
The Bank’s Middle Income Countries Initiative in 2005 further increased the attractiveness of the ADB window
COMPETITIVE PRICINGCOMPETITIVE PRICINGCommitment fees eliminated for new sovereign
guaranteed loansLending spread decreased from 0.5% to 0.4%Market risk premium eliminated for fixed rate loans
Commitment fees eliminated for new sovereign guaranteed loans
Lending spread decreased from 0.5% to 0.4%Market risk premium eliminated for fixed rate loans
ENVIRONMENTAL IMPACTENVIRONMENTAL IMPACT
TECHNICAL ASSISTANCETECHNICAL ASSISTANCE
MIC Trust Fund amount increased from UA 1 million (US$ 1.43 million) to UA 16 million (US$ 22.87 million)
Ceiling per project raised to UA 600,000 (US$ 857,562) from UA 100,000 (US$ 142,927)
MIC Trust Fund amount increased from UA 1 million (US$ 1.43 million) to UA 16 million (US$ 22.87 million)
Ceiling per project raised to UA 600,000 (US$ 857,562) from UA 100,000 (US$ 142,927)
Loan-processing procedures streamlinedLoan-processing procedures streamlined

15
Manufacturing0.90%Others
1.00%
Oil & Gas13.90%
Infrastructure12.20%
Infrastructure Funds8.70%
Finance55.20%
Mining6.10%
Tourism2.00%
192 199
164180
241
270
306
255 257
206
0
50
100
150
200
250
300
350
2001 2002 2003 2004 2005
Approvals in UA million Approvals in US$ million
Development of a vibrant and competitive private sector across Africa is a strategic priority for the Bank
Loans30.0%
Private & Quasi-Equity0.8%
Equity Funds 9.3%
Guarantee0.7% Lines of
Credit53.6%
Enclave Projects
5.6%
Sector Distribution Product Type
Private sector strategy focus on Creating a conducive business environment Strengthening financial systems Improving infrastructure through Public-Private
Partnerships Promoting development of trade and
small-and-medium scale enterprises
Cumulative approvals: UA 1.17 billion (US$ 1.67 billion)
16
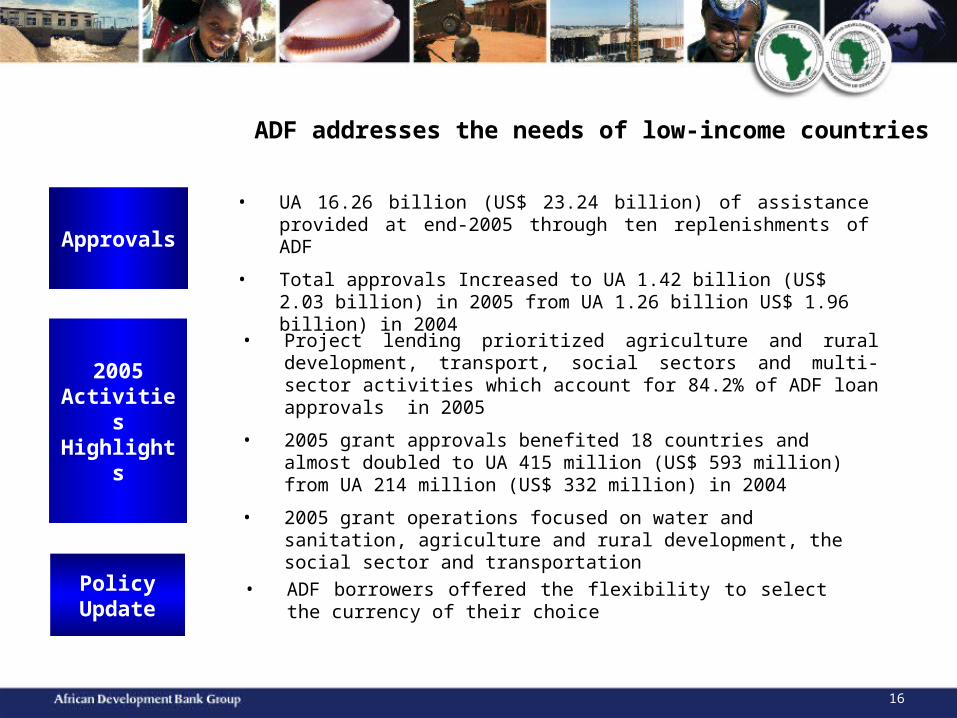
ADF addresses the needs of low-income countries
• ADF borrowers offered the flexibility to select the currency of their choice
Policy Update
2005 Activities Highlights
• Project lending prioritized agriculture and rural development, transport, social sectors and multi-sector activities which account for 84.2% of ADF loan approvals in 2005
• 2005 grant approvals benefited 18 countries and almost doubled to UA 415 million (US$ 593 million) from UA 214 million (US$ 332 million) in 2004
• 2005 grant operations focused on water and sanitation, agriculture and rural development, the social sector and transportation
Approvals
• UA 16.26 billion (US$ 23.24 billion) of assistance provided at end-2005 through ten replenishments of ADF
• Total approvals Increased to UA 1.42 billion (US$ 2.03 billion) in 2005 from UA 1.26 billion US$ 1.96 billion) in 2004

17
Through co-financing and partnership, the Bank Group enhances the resources and expertise mobilised for Africa
• From 1967 to 2005, the Bank participated in 852 co-financing operations, amounting to UA 84.2 billion (US$ 120.4 billion).
• In 2005, 19 operations for UA 3.2 billion (US$ 4.6 billion) were co-financed compared to 31 operations for UA 2.9 billion (US$ 4.4 billion) in 2004.
47.7%
6.7%
18.6%
0.6% 9.5% 1.2%
15.7%
Multisector Energy Sector Environment
Finance Transportation Agricultural Sector
Social Sector
Sector Distribution in 2005

18
The Multilateral Debt Relief Initiative launched in 2005 aims to complement the HIPC debt relief process
• HIPC debt relief is projected to substantially lower debt stocks and debt ratios for most HIPC beneficiaries
• 14 countries had reached completion point at end - 2005, 11 are at decision point and 7 are at pre-decision point
• The G8 Summit in July 2005 proposed that the ADF, IDA and IMF provide 100% irrevocable debt stock cancellation for countries that reach the completion point under the enhanced HIPC initiative
• 33 of the 42 eligible countries are in Africa
• Underlying Principles: Irrevocability and additionality of debt relief as well as preservation of the financial integrity of ADF and IDA
• Based on debt outstanding and disbursed at December 31, 2004, as the cut-off date, and January 1, 2006, as the implementation date, the cost of canceling the ADF debt of the 33 potential beneficiaries, after HIPC relief, is estimated at UA 5.84 billion (US$9.06 billion) in nominal terms.
• Donors will make new contributions to match, “dollar-for-dollar”, foregone principal and service charge payments based on an agreed burden sharing
Heavily Indebted
Poor Countries
Initiative
Heavily Indebted
Poor Countries
Initiative
Multilateral
Debt Relief
Initiative
Multilateral
Debt Relief
Initiative

19
The Bank Group continues to champion vital initiatives on the continent
Global statistics initiative to meet the demand for reliable regular and comparable data, and to strengthen statistical capacity in the continent leading to increased investor confidence and private capital flows. In 2005, under the supervision of the Bank, 48 RMCs started monthly data collection, providing the Bank with the monthly price data of available goods and services for 853 products.
Conceived by the Bank to assist countries emerging from conflicts to clear their arrears, re-engage with development partners and become fully reintegrated in the international community. At end 2005, the arrears of Burundi and the Republic of Congo have been cleared
through this facility.
Bank selected in 2005 to host the Secretariat of the African Infrastructure Consortium for which NEPAD is lead infrastructure agency.Took part in all support missions in 2004 and 2005 to launch APRM in nine countries and the actual peer review missions in Ghana, Rwanda and Kenya.
Rural Water Supply and Sanitation Initiative: (RWSSI) was launched by the Bank in 2004 to provide safe water and basic sanitation to 80% of the rural populations in Africa by 2015. It is a USD 14.2 billion initiative to be financed by ADF, donors, government resources and beneficiaries. At end 2005, 8 RWSSI programs and 2 studies were approved.
African Water Facility: This USD 600 million facility seeks to strengthen water resource management in the continent. At end 2005, donor countries had pledged EUR 9.9 million in financial support. The Bank has committed EUR 1.8 million over 3 years.
Post-Conflict Country Facility
Water Initiatives

20
Strengthen the Bank’s operations
with renewed country focus and greater
delegation to regional offices
Adapt the Bank’s structure to enable it to fulfill its mandate better
Invest in Bank Staff and improve business and
administration processes
Deepen the Bank’s research capacity
TASK FORCE ON
INSTITUTIONAL REFORM
The Bank continues to build on the strong foundation laid by past reforms to serve its regional members more effectively

21
The Bank’s decentralization process is well under way
Algeria
Angola
Burkina Faso
Cameroon
Chad
DRC
Ghana
Kenya
Malawi
Morocco
Rwanda
Sierra Leone
Sudan
Zambia
Offices Logistically Operational
Egypt
Ethiopia
Gabon
Nigeria
Madagascar
Mali
Mozambique
Senegal
Tanzania
Uganda
Offices Planned/
Work-in Progress 25 Offices to be established before the end
of 2006
Countries covered would represent approx. 89% of the Bank’s current portfolio
Strengthening institutional capabilities, ensuring greater development and making the Bank more client-responsive
Field offices expected to strengthen country dialogue, country portfolio performance and project implementation
25 Offices to be established before the end of 2006
Countries covered would represent approx. 89% of the Bank’s current portfolio
Strengthening institutional capabilities, ensuring greater development and making the Bank more client-responsive
Field offices expected to strengthen country dialogue, country portfolio performance and project implementation

22
The Bank’s robust financial position bolsters its ability to deliver on its development mandate
Bank Financial Profile33
23
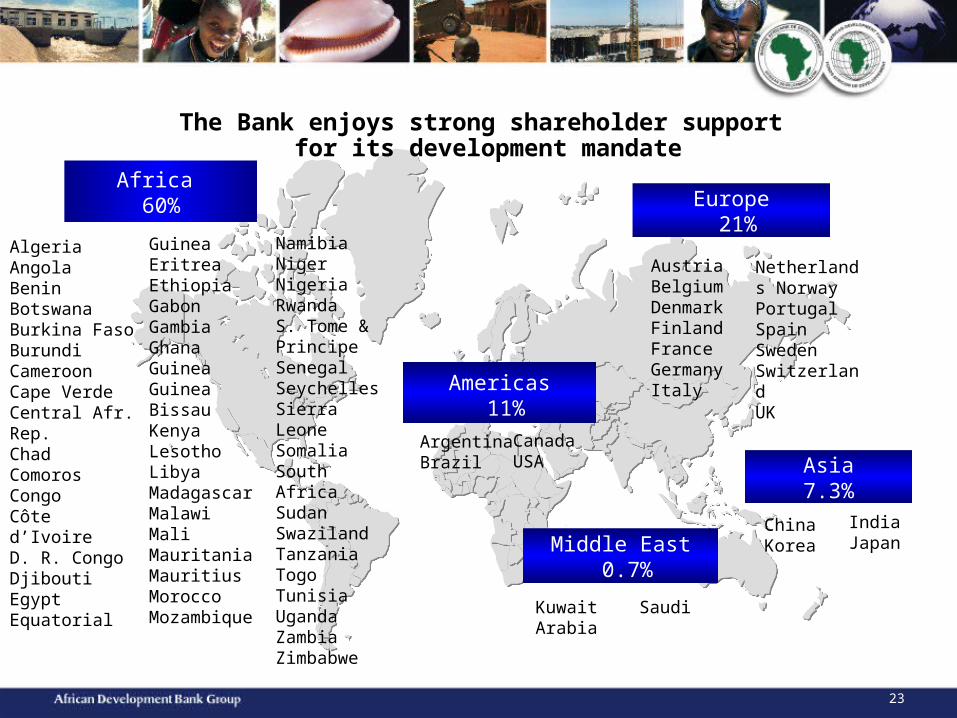
The Bank enjoys strong shareholder support for its development mandate
Netherlands NorwayPortugalSpainSwedenSwitzerlandUK
Canada USA
Europe 21%
AlgeriaAngolaBeninBotswanaBurkina FasoBurundiCameroonCape VerdeCentral Afr. Rep.ChadComorosCongoCôte d’Ivoire D. R. CongoDjiboutiEgyptEquatorial
NamibiaNigerNigeriaRwandaS. Tome & PrincipeSenegal SeychellesSierra LeoneSomaliaSouth AfricaSudanSwazilandTanzaniaTogo TunisiaUgandaZambiaZimbabwe
Africa 60%
Americas 11%
AustriaBelgiumDenmarkFinlandFranceGermanyItaly
Middle East 0.7%
Kuwait Saudi Arabia
IndiaJapan
Asia7.3%
ChinaKorea
Argentina Brazil
GuineaEritreaEthiopiaGabonGambiaGhanaGuineaGuinea BissauKenyaLesothoLibyaMadagascarMalawiMaliMauritaniaMauritiusMoroccoMozambique

24
The ADB’s strong financial condition protects its bondholders
* Not restated. The Bank defines “usable capital” as the sum of paid-in capital, reserves, and callable capital of countries rated double-A and above
57.6%60.3%61.6%
47.9%51.2%
0%
50%
100%
2001* 2002* 2003* 2004 2005
Debt / Usable Capital* Policy Limit
LeverageLeverage

25
Growing reserves and stable earnings enhance the Bank’s risk bearing capacity…
221144178189125
1,5081,465
1,266
2,2662,187
2001* 2002* 2003* 2004** 2005
Net Income Total Reserves
In UA million
* These figures have not been restated. Net income figures exclude the IAS 39 adjustment.**The total amount transferred to reserves on 1 January 2005 due to the application of the IFRS changes was UA 700.18 million.
2005Net incomeUS$ 316 million
ReservesUS$ 3,239 million
26
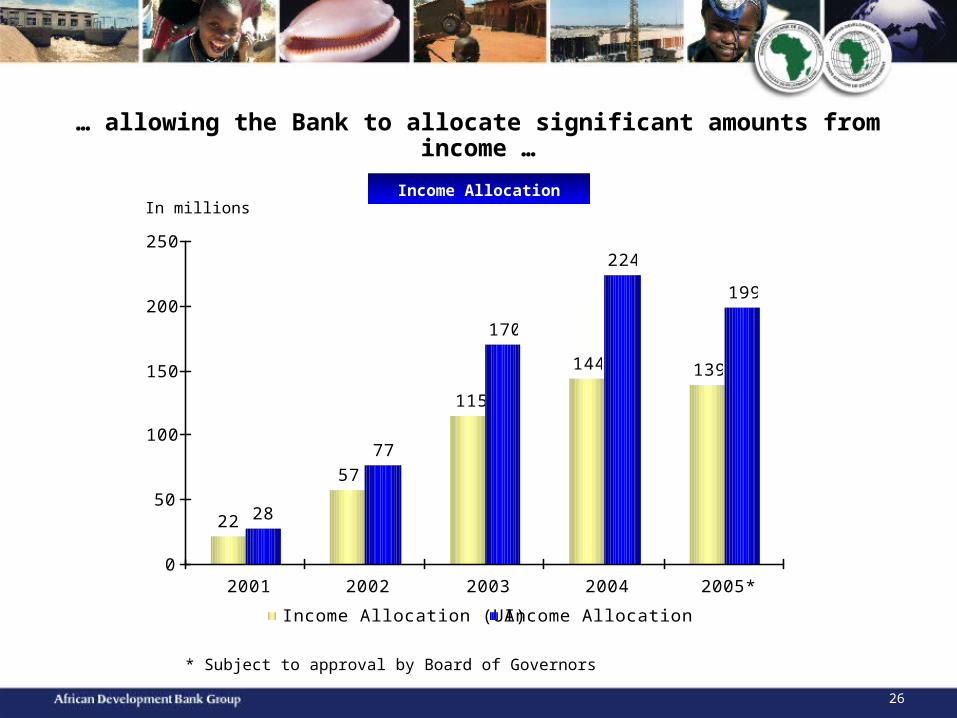
… allowing the Bank to allocate significant amounts from income …
22
57
115
144 139
28
77
170
224
199
0
50
100
150
200
250
2001 2002 2003 2004 2005*
Income Allocation (UA) Income Allocation (US$)
In millions
* Subject to approval by Board of Governors
Income Allocation
27
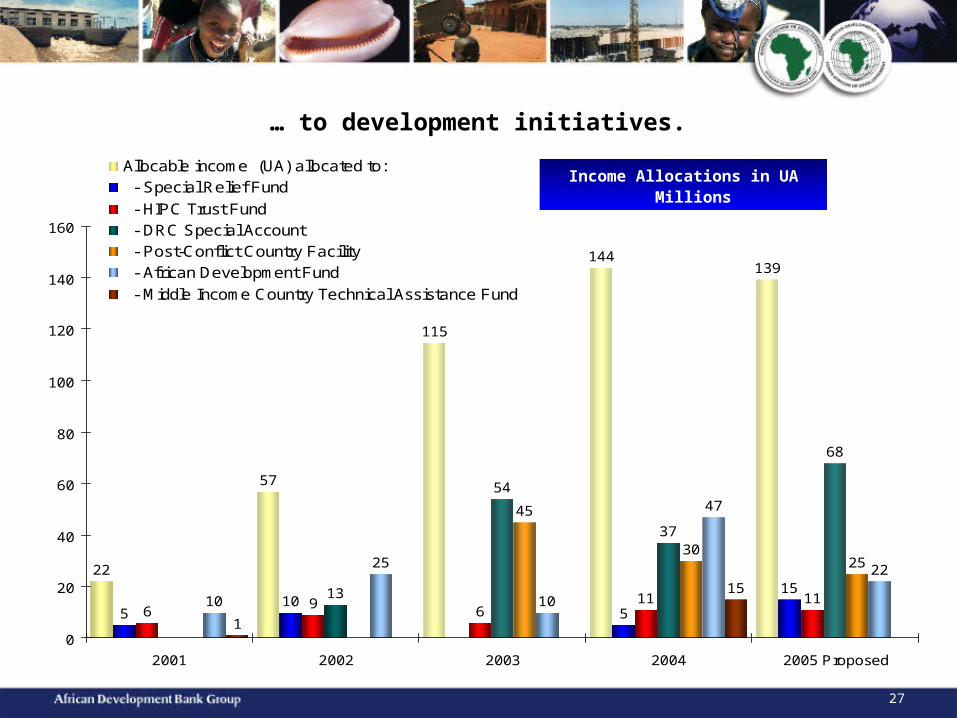
… to development initiatives.
22
57
115
144139
510
5
15
69
611 1113
54
37
68
45
3025
10
25
10
47
22
1
15
0
20
40
60
80
100
120
140
160
2001 2002 2003 2004 2005 Proposed
Allocable income (UA) allocated to: - Special Relief Fund
- HIPC Trust Fund - DRC Special Account - Post-Conflict Country Facility - African Development Fund
- Middle Income Country Technical Assistance Fund
Income Allocations in UA Millions

28
The Bank’s exceptional risk bearing capacity reinforces its ability to operate in a challenging environment
1,948 1,983 2,023 2,066 2,112
2,187 2,266
1,2661,5071,465
494469491
0
1,000
2,000
3,000
4,000
5,000
2001 2002 2003 2004 2005
Paid-in capital Reserves Loan loss provisions
Uses of risk capital
In UA million
Based on the effects of the revised IFRS, effective 1 January 2005, the nature of loan loss provisions has changed from ‘general’ to ‘specific’; accordingly, loan loss provisions represent a reduction in the exposure to the relevant country, not a source of risk capital. Therefore, the main components of the Total Risk Capital are Paid-in Capital and Reserves.
Unused risk capital49%
Sovereign portfolio
45%
Treasury2%
Non-sovereign portfolio
4%
As of 31 December 2005As of 31 December 2005
2005 Risk capital
Paid-in capital: US 3,018 million
Reserves: US$ 3,239 million
2005 Risk capital
Paid-in capital: US 3,018 million
Reserves: US$ 3,239 million
Risk capital
29
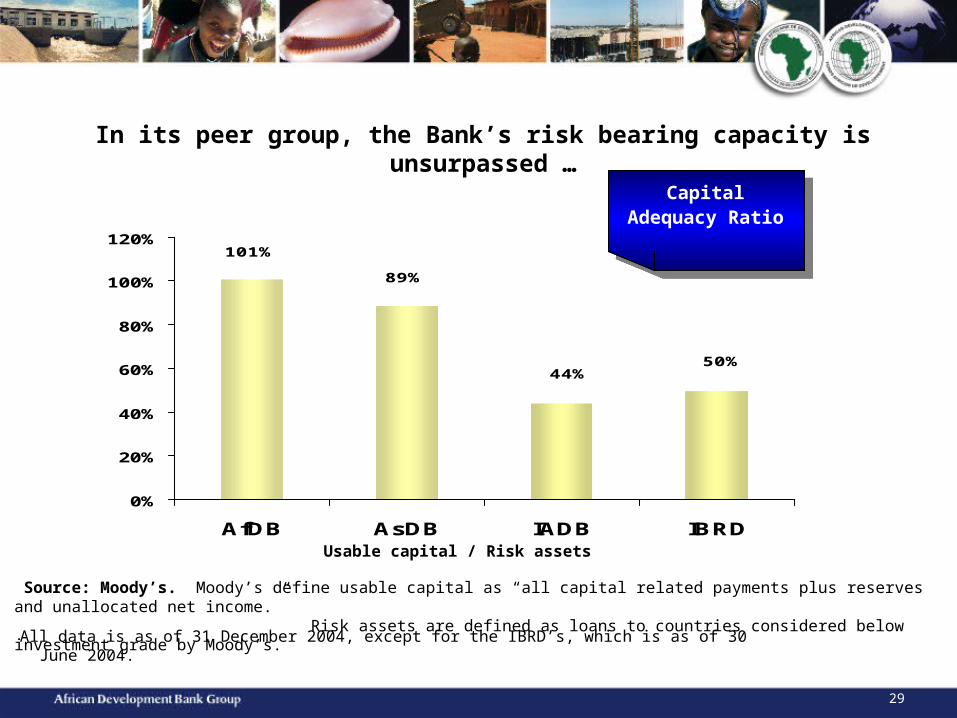
In its peer group, the Bank’s risk bearing capacity is unsurpassed …
101%
89%
44%50%
0%
20%
40%
60%
80%
100%
120%
AfDB AsDB IADB IBRDUsable capital / Risk assets
Source: Moody’s. Moody’s define usable capital as “all capital related payments plus reserves and unallocated net income.” Risk assets are defined as loans to countries considered below investment grade by Moody’s.
All data is as of 31 December 2004, except for the IBRD’s, which is as of 30 June 2004.
Capital Adequacy Ratio
Capital Adequacy Ratio

30
… and the Bank’s concentration risk is the lowest
86%
165%
191%
137%
0%
50%
100%
150%
200%
250%
ADB AsDB IADB IBRD
5 largest exposures to equitySource: Fitch
All data is as of 31 December 2004, except for the IBRD’s, which is as of 30 June 2004.
Concentration Ratio
Concentration Ratio
31
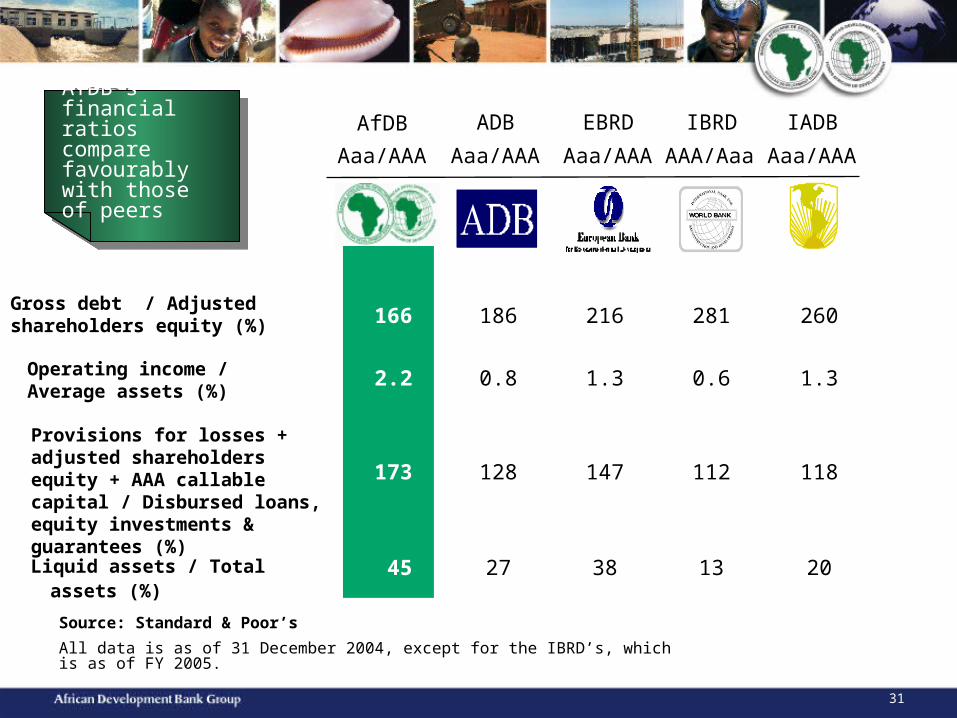
Aaa/AAA Aaa/AAA Aaa/AAA AAA/Aaa Aaa/AAA
AfDB ADB EBRD IBRD IADBAfDB’s financial ratios compare favourably with those of peers
AfDB’s financial ratios compare favourably with those of peers
Provisions for losses + adjusted shareholders equity + AAA callable capital / Disbursed loans, equity investments & guarantees (%)
Gross debt / Adjustedshareholders equity (%)
Operating income / Average assets (%)
Liquid assets / Total assets (%)
166 186 216 281 260
2.2 0.8 1.3 0.6 1.3
173 128 147 112 118
45 27 38 13 20
Source: Standard & Poor’s
All data is as of 31 December 2004, except for the IBRD’s, which is as of FY 2005.
32
CAPITAL MARKET ACTIVITIES44
The Bank is a flexible and responsive issuer in the capital markets
33
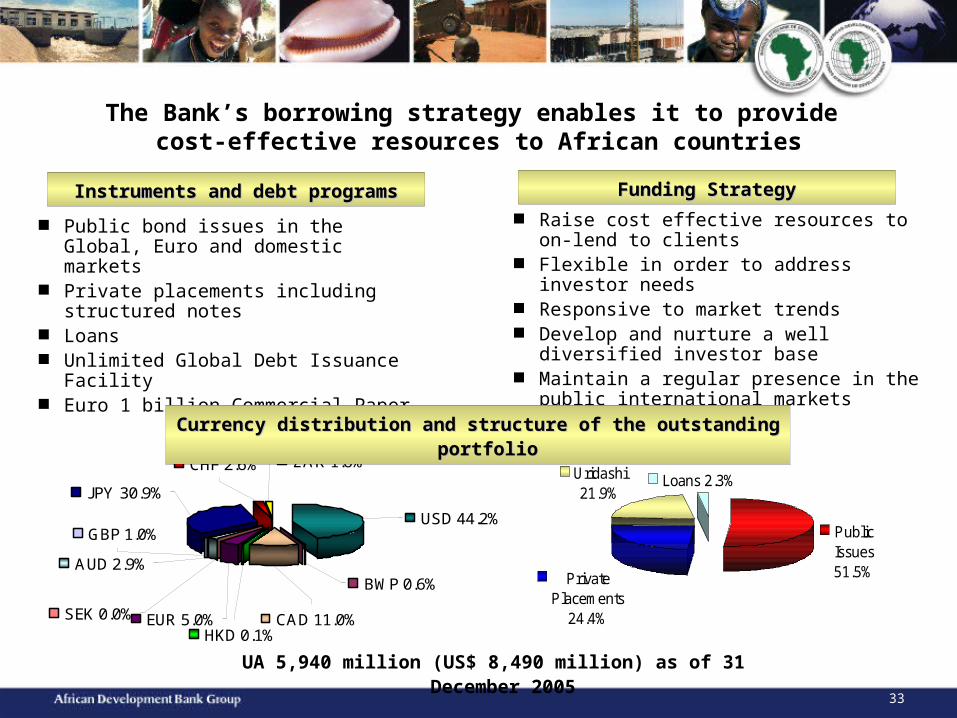
The Bank’s borrowing strategy enables it to provide cost-effective resources to African countries
ZAR 1.6%
USD 44.2%
BWP 0.6%
CAD 11.0%
CHF 2.6%
JPY 30.9%
GBP 1.0%
AUD 2.9%
EUR 5.0%HKD 0.1%
SEK 0.0%
Public bond issues in the Global, Euro and domestic markets
Private placements including structured notes
Loans Unlimited Global Debt Issuance Facility Euro 1 billion Commercial Paper
UA 5,940 million (US$ 8,490 million) as of 31 December 2005
Raise cost effective resources to on-lend to clients
Flexible in order to address investor needs Responsive to market trends Develop and nurture a well diversified investor
base Maintain a regular presence in the public
international markets
Public Issues 51.5%Private
Placements 24.4%
Uridashi 21.9%
Loans 2.3%
Instruments and debt programsInstruments and debt programs Funding StrategyFunding Strategy
Currency distribution and structure of the outstanding portfolioCurrency distribution and structure of the outstanding portfolio

34
The Bank maintains a constant presence in the global debt market
Americas 43%
Europe 15%
Asia 40%
Middle East & Africa 2%
2003 – USD 1,000 million Global 2003 – USD 1,000 million Global – – 3.25% due 20083.25% due 2008
2004 – USD 500 million Global – 3.75% due 20102004 – USD 500 million Global – 3.75% due 2010
2005 – USD 500 million Global – 4.50% due 20092005 – USD 500 million Global – 4.50% due 2009
Fund Managers
27%
Corporates 1%
Central Banks 48%
P ension Funds 5%
Insurance Companies
8%
Banks 11%
Investors – by TypeInvestors – by Type Investors – by GeographyInvestors – by Geography
35
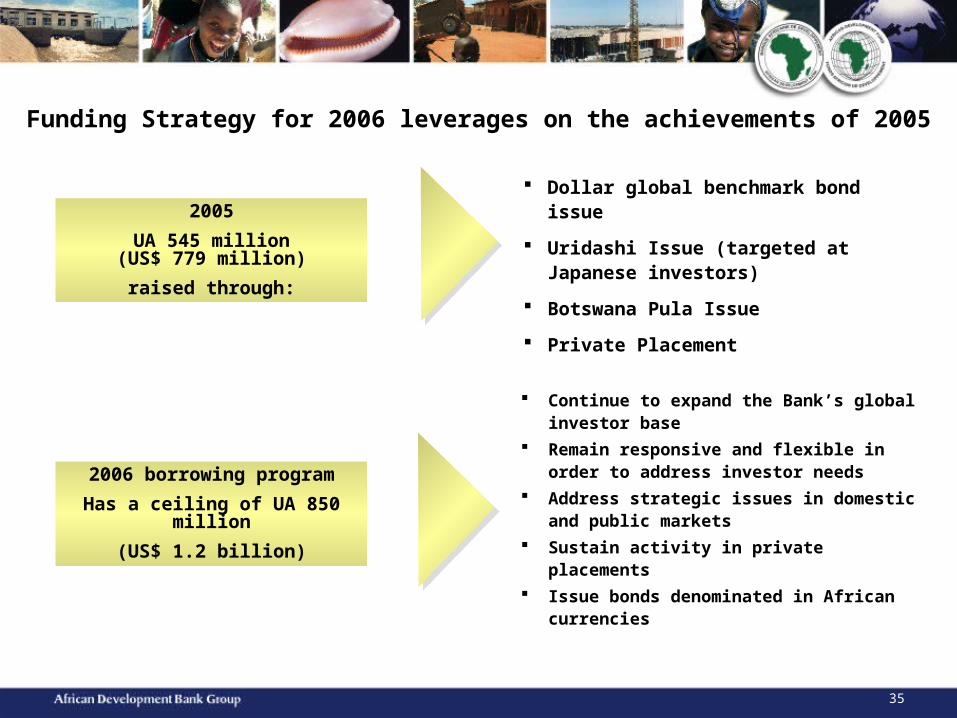
Funding Strategy for 2006 leverages on the achievements of 2005
Dollar global benchmark bond issue
Uridashi Issue (targeted at Japanese investors)
Botswana Pula Issue
Private Placement
2005
UA 545 million (US$ 779 million)
raised through:
Continue to expand the Bank’s global investor base
Remain responsive and flexible in order to address investor needs
Address strategic issues in domestic and public markets
Sustain activity in private placements
Issue bonds denominated in African currencies
2006 borrowing program
Has a ceiling of UA 850 million
(US$ 1.2 billion)

36
Building on success in African currencies
The Bank is monitoring issuance possibilities in several other African currencies
IFR Comments
“ … the transaction … represented the first true Eurobond in the currency….”
“… good demand from European institutions with the paper quickly sold out, primarily on the back of the chunky 10% coupon and the positive economic story that has emerged from Botswana since independence in 1966.”
EUROWEEK Comments
“AfDB defies pessimists to launch clearable pula Eurobond”
“The African Development Bank … priced the first Botswana pula Eurobond that will be fully clearable in the currency.”
IFR Comments
“The African Development Bank (AfDB) last week opened the door to the Tanzanian shilling market with a US$10m one-year currency-linked bond …”
EUROWEEK Comments
“AfDB introduces new market with synthetic Tanzanian shilling bond”
“The African Development Bank has become the first supranational borrower to issue a bond linked to the Tanzanian shilling”
BOTSWANAPULA ISSUE
BWP 300 million 10% due 12 January 2007
BOTSWANAPULA ISSUE
BWP 300 million 10% due 12 January 2007
TANZANIAN SHILLING ISSUE
USD 10 million linked to TZS11.8% due 20 February 2007
TANZANIAN SHILLING ISSUE
USD 10 million linked to TZS11.8% due 20 February 2007

37
The Bank enjoys the highest credit rating
Strong Support from Member Countries
Healthy Capital Position
Excellent LiquidityPreferred Creditor Status
Prudent Financial Management
Franchise Value
Quality of Management

38
APPENDIX

39
ADB: Summary financial information
In UA million
Net Income
Reserves
Paid in Capital*** net of CEAS
Subscribed Capital
Approvals
Assets
2001 2002 2003 2004 2005
987 1,068 746 1,520 869
8,873 8,197 10,034 10,792 11,601
21,491 21,510 21,564 21,597 21,636
1,770 1,803 1,866 1,920 1,967
1,266 1,465 1,508 2,187** 2,266
125* 189* 178* 144 221
* These figures have not been restated. Net income figures exclude the IAS 39 adjustment. **The total amount transferred to reserves on 1 January 2005 due to the application of the IFRS changes was UA 700.18 million.***Paid-in Capital excludes non-convertible currencies and non-negotiable notes

40
ADB: Statement of income and expenses (UA million)
YEARS ENDED 31 DECEMBER 2005 2004 2003 2002 2001
OPERATIONAL INCOME AND EXPENSESIncome from loans 324.23 323.11 325.46 414.82 447.82Income from investments 155.37 123.57 99.77 74.01 121.32Total operational income 479.60 446.68 425.23 488.83 569.14 Interest and amortized issuance costs (217.12) (197.08) (219.59) (258.69) (349.45) Unrealized loss/(gains) fair valued borrowings and related derivatives (30.77) (7.70) (81.65) 37.20 82.30 Unrealized gain/(loss) derivatives on non fair valued borrowings 7.22 (10.35)
Provision for loan losses 13.85 (53.86) 21.51 (3.49) (53.80)Net operational income 252.78 177.69 145.51 263.86 248.20
OTHER EXPENSES, netAdministration expenses 155.69 142.20 109.32 81.82 73.99Management fees (114.02) (104.59) (77.55) (59.50) (52.19)Administration expenses - net (41.67) (37.61) (45.14) (32.27) (30.35)Other income 15.72 7.40 2.61 1.25 1.40Depreciation (7.10) (6.42) (5.57) (5.51) (5.88)Provision for equity investments 0.75 3.31 (1.68) (0.06) (5.62)Loss/(gain) on exchange (0.74) (0.84) 0.98 (1.20) (0.09)
Translation gains and losses 1.58Total other expenses, net (31.46) (34.16) (48.80) (37.79) (40.54)
Net income 221.32 143.53 96.71 226.07 207.66
2004 has been restated
41
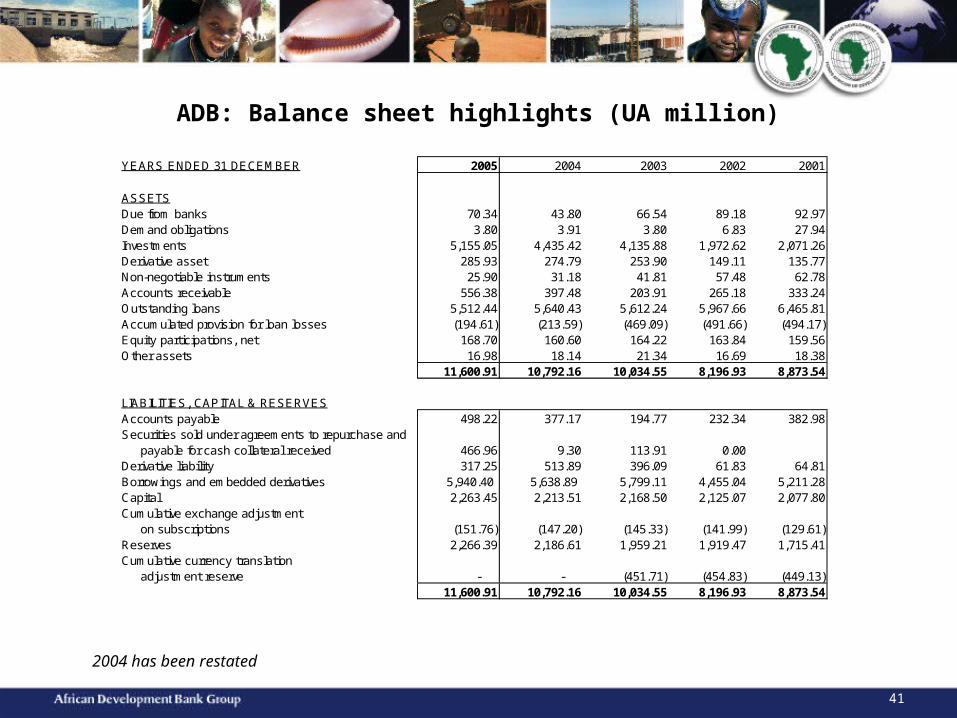
ADB: Balance sheet highlights (UA million)
YEARS ENDED 31 DECEMBER 2005 2004 2003 2002 2001
ASSETSDue from banks 70.34 43.80 66.54 89.18 92.97Demand obligations 3.80 3.91 3.80 6.83 27.94Investments 5,155.05 4,435.42 4,135.88 1,972.62 2,071.26Derivative asset 285.93 274.79 253.90 149.11 135.77Non-negotiable instruments 25.90 31.18 41.81 57.48 62.78Accounts receivable 556.38 397.48 203.91 265.18 333.24Outstanding loans 5,512.44 5,640.43 5,612.24 5,967.66 6,465.81Accumulated provision for loan losses (194.61) (213.59) (469.09) (491.66) (494.17)Equity participations, net 168.70 160.60 164.22 163.84 159.56Other assets 16.98 18.14 21.34 16.69 18.38
11,600.91 10,792.16 10,034.55 8,196.93 8,873.54
LIABILITIES, CAPITAL & RESERVESAccounts payable 498.22 377.17 194.77 232.34 382.98Securities sold under agreements to repurchase and payable for cash collateral received 466.96 9.30 113.91 0.00Derivative liability 317.25 513.89 396.09 61.83 64.81Borrowings and embedded derivatives 5,940.40 5,638.89 5,799.11 4,455.04 5,211.28Capital 2,263.45 2,213.51 2,168.50 2,125.07 2,077.80Cumulative exchange adjustment on subscriptions (151.76) (147.20) (145.33) (141.99) (129.61)Reserves 2,266.39 2,186.61 1,959.21 1,919.47 1,715.41Cumulative currency translation adjustment reserve - - (451.71) (454.83) (449.13)
11,600.91 10,792.16 10,034.55 8,196.93 8,873.54
2004 has been restated
42
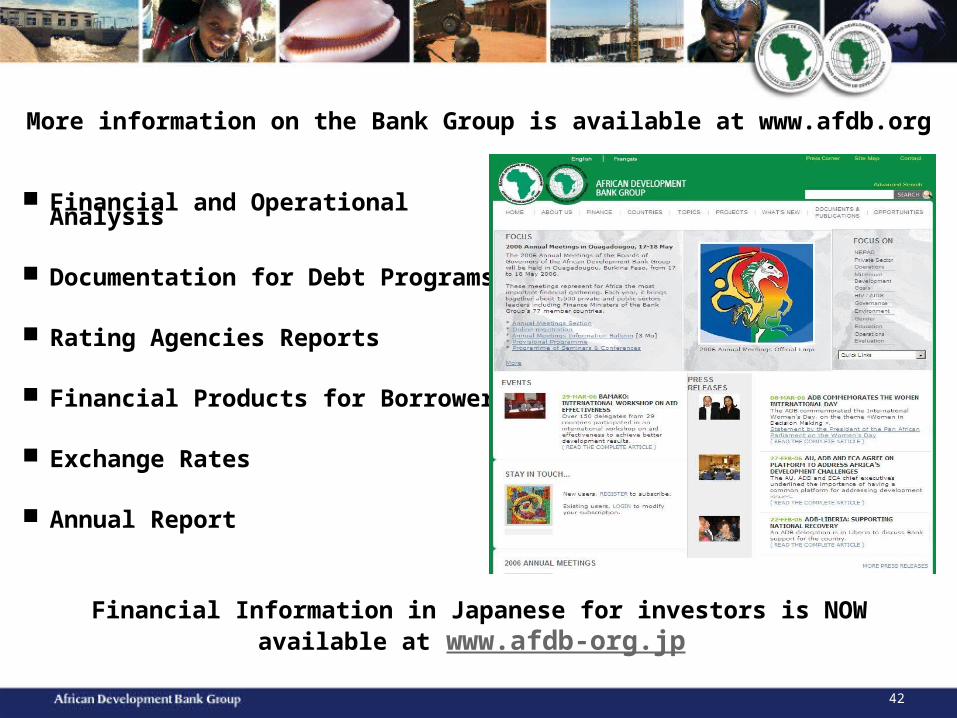
More information on the Bank Group is available at www.afdb.org
Financial and Operational Analysis
Documentation for Debt Programs
Rating Agencies Reports
Financial Products for Borrowers
Exchange Rates
Annual Report
Financial Information in Japanese for investors is NOW available at www.afdb-org.jp