2 table !23.-relative risk of cancer of the larynx for men ... have laryngeal cancer mortality risks...
TRANSCRIPT
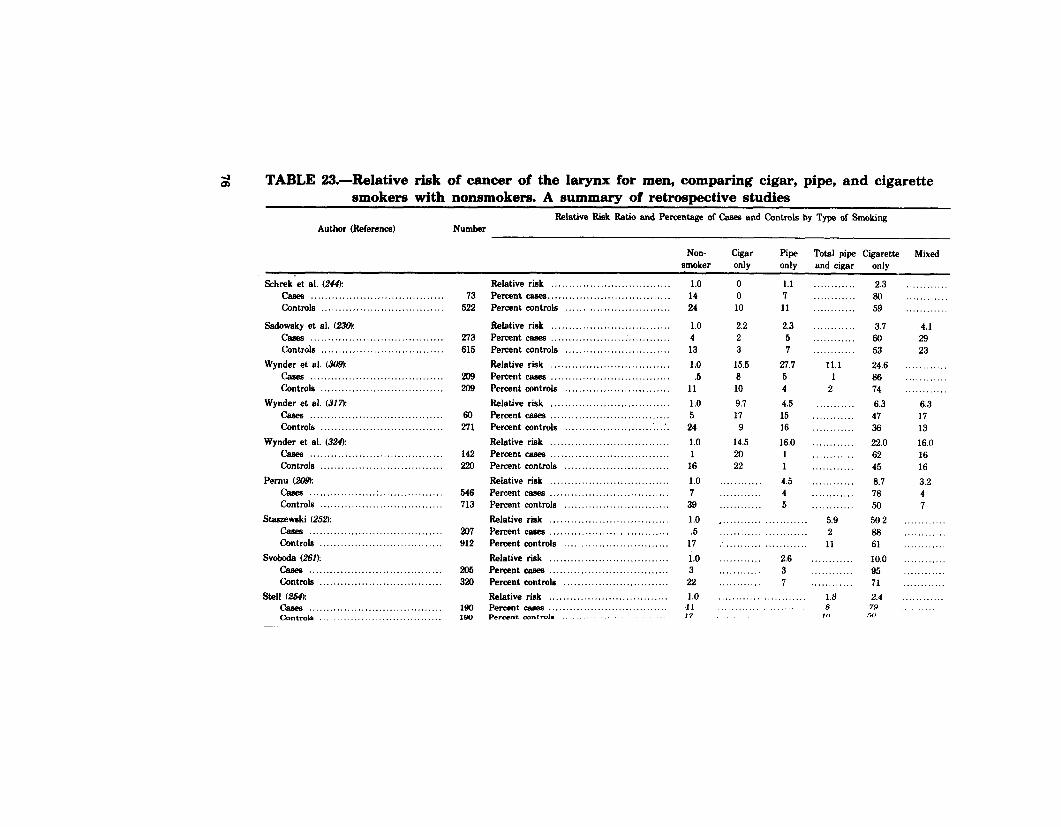
2 TABLE !23.-Relative risk of cancer of the larynx for men, comparing cigar, pipe, and cigarette smokers with nonsmokers. A summary of retrospective studies
Relative Riik Ratio and Percentage of Cams and Controls by Type of Smoking Author (Reference) Number
Non- Cigar Pipe Total pipe Cigarette Mixed smoker only only and cigar only
Schrek-et al. (244): cam? ...................................... Controls ...................................
Sadowsky et al. (236): rhea ...................................... Controls ...................................
Wynder et al. (309): cases ...................................... Controls ...................................
Wynder et al. (317)~ cases ...................................... Controls ...................................
Wynder et al. (324): caees ...................................... Controls ...................................
Pernu f209): cases ................... . ....... ........... Contmls ...................................
Staszewski (252): cases ...................................... Controls ...................................
Svoboda (261): casee ...................................... Contmls ...................................
St.41 L?&e cases ...................................... Contmh ...................................
73 522
273 615
209 206
60 271
142
546 713
207 912
206 320
190 loo
Relative risk .................................. Percent casee ................................... Percent controls ..............................
Relative risk .................................. Percent cases ................................... Percent contmls .............................. Relative risk .................................. Percent casea .................................. Percent controls .............................. Relative risk .................................. Percent cams .................................. Percent controls ........................ .:. .:. Relative risk .................................. Percent cams .................................. Percent controls .............................. Relative risk .................................. Percent cama .................................. Percent controls .............................. Relative rink .................................. Percent casea .................................. Percent controls .............................. Relative risk .................................. Percent case8 .................................. Percent controls .............................. Relative tik .................................. Percent cams .................................. Percent contrd* ......
1.0 14 24
1.0 4 13 1.0 .5
11 1.0 5 24 1.0 1
16 1.0 7 39 1.0 .5
17 1.0 3 22 1.0 11 17
0 0 10
2.2 2 3
15.5 8 10 9.7 17
9 14.5 20 22
. . . . . . . . . .
. . . . . . . . . . . . ,
1.1 1 11
2.3 5 7
27.7 5 4 4.5 15 16 16.0 1 1 4.5 4 5
.... 5.9 ............ ......... .. 2 ........................ 11 ............ 2.6 ............ ............ 3 ......... .. ............ 7 ............ ............ ............ 1.3 ........................ 8
10
2.3 80 59
3.7 60 53 24.6 66 74 6.3 47 36 22.0 62 45 6.7 76 50 56.2 66 61 10.0 95 71 2.4
7.9 -d,
............
... ........ 4.1 29 23
....... ....
............
............ 6.3 17 13 16.0 16 16 3.2 4 7
............
............
............
............
............
............ ............
........

CASES=239 CONTROLS=4725
ClGAREl-fES
PER DAY
NON-SMOKERS
0 l-6 7+
OUNCES OF ALCOHOL PER DAY
FIGURE 25.-Relative risks of larynx cancer by daily consumption of alcohol and cigarettes for ma les
’ Not significant. SOURCE: McCoy et al. (I 79).
respiratory tract. Several recent experiments have been performed (23, 24, 72, 73, 125, 126, 133).
Cigarette smoke inhalation has not been found to induce laryngeal tumors in other rodents. Such tumors have been induced, however, by direct application of carcinogens known to be present in cigarette smoke. This is accomplished by the intratracheal instillation of benzo[a]pyrene in combination with particulates into hamster lungs. In this animal mode l, laryngeal tumors, as well as tumors in other parts of the respiratory tract, are induced (184, 231, 232). One study has recently reported a synergy of alcohol and benzo[a]pyrene injection (257).
Conclusion 1. Cigarette smoking is the ma jor cause of laryngeal cancer in the
United States. Cigar and pipe smokers experience a risk for laryngeal cancer similar to that of a cigarette smoker.
2. The risk of developing laryngeal cancer increases with in- creased exposure as measured by the number of cigarettes smoked daily as well as other dose measurements. Heavy
77

smokers have laryngeal cancer mortality risks 20 to 30 times greater than nonsmokers.
3. Cessation of smoking reduces the risk of laryngeal cancer mortality compared to that of the continuing smoker. The longer a former smoker is off cigarettes the lower the risk.
4. Smokers who use filtered lower tar cigarettes have lower laryngeal cancer ri$s than those who use unfiltered higher tar cigarettes.
5. The use of alcohol in combination with cigarette smoking appears to act synergistically to greatly increase the risk for cancer of the larynx.
Oral Cancer Introduction
Cancers of the oral cavity include malignant tumors of the lip, tongue, salivary gland, floor of the mouth, mesopharynx, and hypopharynx. It is estimated that in 1982 there will be 26,800 new cases and 9,150 deaths due to these tumors (21. Males are affected more commonly than females (by about threefold). Several authors (29, 175) have reported geographic differences in mortality. In the southeast, females living in urban and rural areas have mortality rates that exceed those of northern females by 30 and 90 percent respectively.
Cancer of the Buccal Cavity and Pharynx, Excluding Lip2 From 1950 to 1967, the age-adjusted rate remained stable at 2.8
per ‘100,000. The increase in the age-adjusted death rate from 2.8 to 2.9 per 100,000 between 1967 and 1968 resulted in part from changes in coding procedures in the International Classification of Diseases. From 1968 to 1977, the age-adjusted rate rose from 2.9 to 3.1. Total deaths from cancer of these sites increased from 1,461 in 1950 to 8,291 in 1977.
While the age-adjusted death rate of white males fell slightly over the study period (Figure 261, rates of white females and of males and females of races other than white increased. The largest increases occurred among other than white males, whose mortality rates rose from 4.1 to 7.7 per 160,000 between 1950 and 1977. The white male to female.mortality ratio fell gradually over the study period, from 4.09 to 2.93. In contrast, the mortality sex ratio (male/female) in the other than white population increased from 2.56 to 3.85. The mortality ratio of other than white males to white males increased from 0.91 to 1.75, while the mortality ratio of other .than white females to white females decreased slightly, from 1.45 to 1.33.
z Cancer of the lip is causally associated with smoking, particularly pipe smoking. However, because this cancer site representi so few deaths in the United States, only 163 in 1977. it is excluded from thin review.
78

+=WHITE IIRLES
X=WHITE FEIIFILES
O=NONWHITE MILES
~=NONWHITE FEIIALES
1965 CRLENDAR YERRS
1970 1975

The death rates of white males 35 to 54 years of age and of those at least 75 years old were lower in 1977 than in 1960 (Figure 27), but rates were higher among white males between 55 and 74 years of age, as well as among white females in the same age range. In contrast, among other than white males in every lo-year age group from 35 through 84, as well as among females between 35 and 64, death rates were higher in 1977 than in 1960; the average increase in mortality in these age groups was 60 percent (Figure 28).
When age-specific death rates are plotted by calendar year and age (Figures 29 and 30), a three-dimensional graph is produced, which can be examined from 1950 to 1977, or from the reverse perspective.
Squamous cell cancer is the most common histological type of oral cancer and comprises about 90 percent of these tumors. The 5-year survival for cancer of the floor of the mouth, tongue. and pharynx ranges from 25 to 45 percent.
Numerous epidemiological and experimental studies have estab lished a close association between smoking and oral cancer. Alcohol has an incompletely understood but important synergistic role with tobacco in increasing disease incidence and mortality.
Causal Significance of the Association Consistency of the Association
More than 25 retrospective studies have examined the relation- ship between smoking and the development of cancer of the oral cavity (269,276).
These studies have been done in many countries, in different areas, and have involved diverse study methods. Almost uniformly, they show an association between cigarettes and other forms of tobacco use and cancer of the oral cavity and pharynx. The TNCS study (299) and the Hawaiian Study of Five Ethnic Groups (113) reported similar findings.
Six of the major prospective studies examined the relationship between smoking and oral cancer. These data, presented in Table 24, show a close association between smoking and oral cancer.
Strength of the Association The relative risks for oral cancer among smokers were substantial-
ly greater compared with nonsmokers in the retrospective studies. Similarly, in the prospective studies, the mortality ratios for cancer of the oral cavity among smokers ranged from 1.22 among Japanese females to over 13 in the U.S. Veterans and British Physicians studies (Table 24).
A dose-response relationship was noted in many of the retrospec- tive and prospective studies (Table 25) (64, 98, 120, 131, 276). The American Cancer Society 25State Study (155) reported a reduction
80

0 10 20 30 40 50 60 70
ROE IN YEARS IBY S-YEAR ROE DROUPSI
60
b :: 30
1:
- C 80
FEtlRLES
+ =1950-1956 * =1957-1963 0 q 1964-1970 [II :1971-1977
10 20 30 40 50 60 70 EO
RGE IN YEARS IBY 5-YERR ROE QROUPSI

7!
6t
j- MRLES
7:
6C
15
0 0 10 20 30 40 50 60 70 -80 01
ROE IN YEARS ISY S-YEAR ROE GROUPS)
1 0
FEHRLES
+=1950-1956 * -1957-1963 0 =1964-1970 cl=1971-1977
10 20 30 40 50 60 70 80 ROE IN YEARS IBY 5-YERR RGE GROUPS)

'20
FIGURE !29.-Age-specific mortality rates by 5-year age groups for cancer of the buccal cavity and pharynx for white males, United States, 1950- 1977
SOURCE: National cm~~r Institute (198).
in risk for cancer of the buccal cavity and pharynx among smokers of lower tar and nicotine cigarettes, but the reduction WAS nyt statistically significant. Wynder and Hoffmann (326) reported siml- lar findings in a retrospective study of smokers of filter cigarettes versus smokers of nonfilter cigarettes.
83

30
0
FIGURE 34X-Age-specific mortality rates by 5-year age groups for cancer of the buccal cavity and pharynx for white females, United States 19!50-1977
SOURCE: National Cancer Institute (198).
Specificity of the Association
The prospective studies have reported mortality data for a large number of diseases. Specificity, which is related to the magnitude of the association between smoking and oral cancer, is evidenced by the differences in the mortality ratios (smokers versus nonsmokers) of oral cancer and other cancers (Appendix Tables A and B). These
84
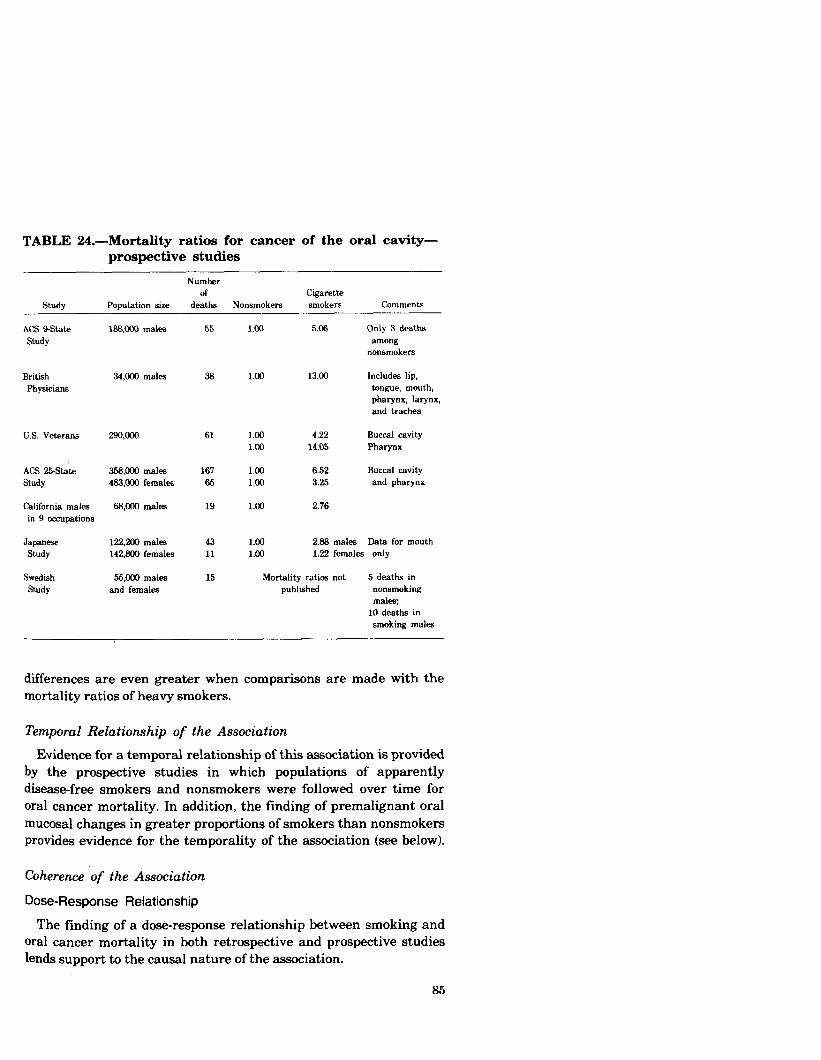
TABLE 24.-Mortality ratios for cancer of the oral cavity- prospective studies
Study
NUIllbW of cigarette
Population size deaths Nonsmokers smokers Comments
ACS 9State Study
British Physicians
U.S. Veterans
ACS 2!%St.at.e 358,000 males 167 Study 463,000 females 65
California males in 9 occupations
68,OOU males 19
Japan- Study
122,200 males 142,800 females
Swedish stuby
55,000 males and females
43 11
15
166,cOO males
34,Mw males
55
38
61
1.00 5.06 Only 3 deaths among
nonsmokers
1.00 13.00 Includes lip, tongue, mouth, pharynx, larynx, and trachea
1.00 4.22 1.00 14.05
1.00 6.52 1.00 3.25
1.00 2.76
Buccal cavity Pharynx
Buccal cavity and pharynx
1.00 2.86 males Data for mouth 1.00 1.22 females only
Mortality ratios not 5 deaths in pubbsbed nonsmoking
males; 10 deaths in smoking males
differences are even greater when comparisons are made with the mortality ratios of heavy smokers.
Temporal Relationship of the Association
Evidence for a temporal relationship of this association is provided by the prospective studies in which populations of apparently disease-free smokers and nonsmokers were followed over time for oral cancer mortality. In addition, the finding of premalignant oral mucosal changes in greater proportions of smokers than nonsmokers provides evidence for the temporality of the association (see below).
Coherence of the Association
Dose-Response Relationship
The finding of a dose-response relationship between smoking and oral cancer mortality in both retrospective and prospective studies lends support to the causal nature of the association.
85

TABLE 25.-Oral cancer mortality ratios by amount smoked-prospective studies
Study
British Physicians
Population Amount Smoked
per &Y Commenb MdW Females
NS 1.00 NS 1.00 Male data 1-14 5.00 l-14 - by grams 1524 7.00 l&24 4.00 of tobaaa 25+ 33.00 25+ 6.56 per day
U.S. Veterans
Japanese in 29 Health Districts
ACS Sstate Study
188,ooO males
California males in 9 occupations
NS 1.00 l-9 2.92’
10-20 2.87 21-39 6.15 40+ 12.40’
NS 1.00 1-19 1.20
20-29 5.50 30+ 9.10
NS 1.00 l-9 7.00
lo-20 6.00 2C+ 7.67
NS 1.00 < ‘12 pack 3.69
1 pack 1.17 l’/, pack 5.52
‘Eked on fewer then20 deaths.
Hypopharynn OdY
Includes larynx and e&w-
Correlation of Sex Differences in Oral Cancer With Different Smoking Habits
Oral cancer is predominantly a disease of males, but the difference between male and female rates of disease is narrowing. This finding is consistent with the differences in the smoking trends of males and females noted above. As with laryngeal and esophageal cancer, there is a strong association between oral cancer and alcohol consumption. This must be considered as contributing to the excess ratio of male to female oral cancer mortality (see below).
Correlation of Oral Cancer Mortality Rates Among Popylations With Different Tobacco Consumption
In populations with low proportions of smokers. (e.g., Mormons and Seventh Day Adventists), the incidence and mortality rates of cancer of the gum, mouth, tongue, and pharynx are substantially reduced (79, 165, 166, 211, 294).
86

N -497
PRESENT l-3 44 7-10 11-15 16 + NON- SMOKERS SMOKERS
FIGURE 31.-Relative risk of ma le ex-smokers for cancer of the oral cavity by years since quitting smoking
SOURCE: Wynder and Stellman G’6).
Oral Cancer Mortality and Cessation of Smoking
In the U.S. Veterans Study (224), exsmokers had approximately 40 percent of the risk for oral cancers of current smokers. Data from the American Health Foundat ion study found that the risk of cancer of the oral cavity among former smokers declined with the number of years off cigarettes when compared to the risk of continuing smokers. After 16 or more years of cessation, the risk of oral cancer approaches that of nonsmokers (Figure 31). This is consistent with the causal nature of the association.
Smoking and Histological Changes in the Oral Mucosa
Leukoplakia is an abnormal thickening and keratinization of oral mucosa and is recognized as a precursor of ma lignancy of the oral cavity (124). A few studies have established a relationship between smoking in various forms and leukoplakia (269).
Oral Cancer and Non-Cigarette Tobacco Use The oral cavity and pharynx are the sites most consistently
exposed to tobacco smoke. A summary of the data from the prospective epidemiological studies is presented in Table 26. They demonstrate that cigar and pipe smokers experience a significant risk of developing cancer of the oral cavity compared with nonsmok- ers. This risk is approximately equal for all smokers whether an individual uses a pipe, cigar, or cigarette.
Several authors have reported a relationship between chewing tobacco and/or snuff dipping (the placement’and retention of fine
87

TABLE 26.-Mortality ratios for oral cancer in cigar and pipe smokers. A summary of prospective epidemiological studies
Study Smoking Type
NOW Cigar Pipe Total Pipe Cigarette Mid Smoker Only Only and Cigar Only
ACS S&ate Study ’ 1.00 5.00 3.50 - 5.06 - British Physicians ’ 1.00 - - ‘9.00 13.00 11.00 ACS 25-Stat.e Study 1.00 - - 4.94 M 6.52 -
F 3.75 - US. Veterans Study
Oral * 1.00 4.11 3.12 4.20 4.22 3.79 Pharynx 1.00 - 1.93 7.76 14.05 7.75
’ Combines data for oral. larynx, and esophagus. z Figures for all non-lung respiratory cancers. ’ Mortality rati- for ages 45 to 64 only as present& l Excludes pharynx.
ground or powdered tobacco in the oral vestibule between the gums and cheek) and oral cancer (36,186,. 207,234,299,301,310), A recent report found a fourfold increase in risk for oral cancer among female snuff dippers compared to nontobacco users (301). The excess risk for cancers of the cheek and gum was nearly fiftyfold among long-term users. The authors estimated 87 percent of these tumors were related to snuff use. In the Third National Cancer Survey, Williams and Horm (299) noted an excess relative risk for cancers of the gum and mouth in male and female users of chewing tobacco or snuff; However, this risk was only statistically significant for males.
A few epidemiological investigations have demonstrated an associ- ation between the combined use of alcohol and pipe or cigar smoking and the development of oral cancer (135, 272, 173, 310). Heavy pipe and/or cigar smoking and heavy drinking are associated with higher rates of oral cancer than are seen with either habit alone.
Synergistic Role of Alcohol and Cigarettes for Oral Cancer Oral cancer occurs more commonly in heavier users of alcohol (37,
88, 136, 227, 283, 302, 310). A recent study (179) noted an interaction (Figure 32) for oral cavity cancer in white males who use both alcohol and cigarettes. Nonsmokers who consumed 7 ounces or more of alcohol per day had a relative risk of 2.5. Those cigarette smokers who consumed 7 ounces or more of alcohol per day had a relative risk of 5.1 if they smoked one-half a pack or less daily, 20.5 if they smoked 11 to 20 cigarettes per day, and 24.0 if they smoked more than one pack of cigarettes per day. A distinct synergy (a multiplicative effect) of alcohol and cigarette smoking has been described elsewhere (271). The mechanism by which these two factors interact is unclear.
88

CASES = 304
CONTROLS=4725
CIGARETTES
PER DAY
NON-SMOKERS
0 14 7+
OUNCES OF ALCOHOL PER DAY
FIGURE 32.-Relative risks of oral cavity cancer by daily consumption of alcohol and cigarettes for ma les
* Not signdicant SOURCE: McCoy et al. (179).
Experimental Studies
A useful animal mode l for the experimental study of oral carcinogenesis has not been found. Cigarette smoke and cigarette smoke condensates generally fail to produce ma lignancies when applied to the oral cavity of m ice, rabbits, or hamsters. Mechanical factors, such as secretion of saliva, interfere with the retention of carcinogenic agents. However, positive results have been obtained with benzo[a]pyrene, 20-methyl-cholanthrene, 9,1Odimethyl-1,2 ben- zanthracene, and other tobacco smoke carcinogens when applied to the cheek pouch of hamsters. The cheek pouch, however, lacks salivary glands, and its structure and function differ from those of the oral mu iosa. These studies have been reviewed in previous reports of the U.S. Public Health Service (272, 276).
Conclusion 1. Cigarette smoking is a ma jor cause of cancers of the oral cavity
in the United States. Individuals who smoke pipes or cigars experience a risk for oral cancer similar tQ that of the cigarette smoker.
89

2. Mortality ratios for oral cancer increase with the number of cigarettes smoked daily and diminish with cessation of smok- ing.
3. Cigarette smoking and alcohol use act synergistically to increase the risk of oral cavity cancers.
4. Long term use of snuff appears to be a factor factor in the development of cancers of the oral cavity, particularly cancers of the cheek and gum.
Carcinoma of the Esophagus
Introduction Carcinoma of the esophagus is a rapidly fatal neoplasm; there is a
median survival of less than 6 months following diagnosis and a 5- year survival rate of 3 percent.
The number of deaths caused by esophageal cancer rose from 3,866 in 1950 to 7,283 in 1977. The age-adjusted death rate increased from 2.3 to 2.6 over this period (Figure 33).
In the United States in 1977, 3,924 white males and 1,520 white females died from esophageal cancer; in the other than white population, 1,404 males and 435 females died from this disease. While these figures represent only a slight increase in age-adjusted mortality in the white population, they do reflect nearly a twofold increase in the other than white population from 1950 to 1977.
The ratio of the age-adjusted death rate of the other than white population to that of the white population increased over the study period. In 1977, the death rate from this cause among other than white males between the ages of 35 and 44 years was eight times that among white males of the same age. The death rate of other than white females in this age group was 13 times the corresponding rate of white females. Mortality ratios by race (white/other-than-white) decreased with age in both males and females.
Among whites, the mortality sex ratio (male/female) declined slightly between 1968 and 1977. In the other than white group, there was also a greater relative increase in the age-adjusted death rate of females than in those of males.
Among white males and females, age-specific death rates from cancer of the esophagus (Figure 34) increased in each succeeding lo- year age group to the end of the lifespan. In other than white males, mortality peaked between ages 65 and 74 (Figure 35). The pattern was irregular in other than white females, varying with age group and time span over the 1950-1977 period.
A three-dimensional graph of age-specific death rates for white males and females for cancer of the esophagus over the period 1950- 1977 is shown in Figures 36 and 37.
90

9 + =WHITE MALES
m =WHITE FEllfILES
O=NDNWHITE IIALES
[IIzNONWHITE FEIIRLES
6
t
L..~~““~‘~“““““‘~“” :950 1955 1960 1965 1970 1975
CALENDAR YEARS

I I
tlRLES
0 10 20 30 40 50 60 70 60 ROE IN YEARS IBY 5-YERR AGE GROUPS1
FE~IRLES
+=1950-1956 3lc=1957-1963 c)=1964-1970 cl:1971-1977
10 20 30 40 50 60 70 80 AGE IN YERRS IBY S-YERR ROE GROUPS)

50
40
g 30
;;t cn k B b
= 20
10
ROE IN YERRS [BY 5-YERR AGE GROUPS1
50
40
= 30 2 E 4 =: b =: 20
10
0
FEtlALES
+ =1950-1956 * :1957-1963 0 =1964-1970 L!l:1971-1977
10 20 30 40 50 60 70 80 ROE IN YERRS IBY S-YEAR RGE GROUPS)

IIIIIIIIIIIIIIII IIIII I 90
z IIIIIIIIIIlllllllllII GO s z w
FIGURE 36.-Age-specific mortality rates by Byear age groups for cancer of the esophagus for white males, United States, 1950-1977
SOURCE. National Cancer Institute (1981.
It is estimated that in 1982 in the United States there will be 8,900 new cases and 8,300 deaths from this disease (2).
A number of epidemiological and experimental studies have established an association between smoking and esophageal cancer.
94
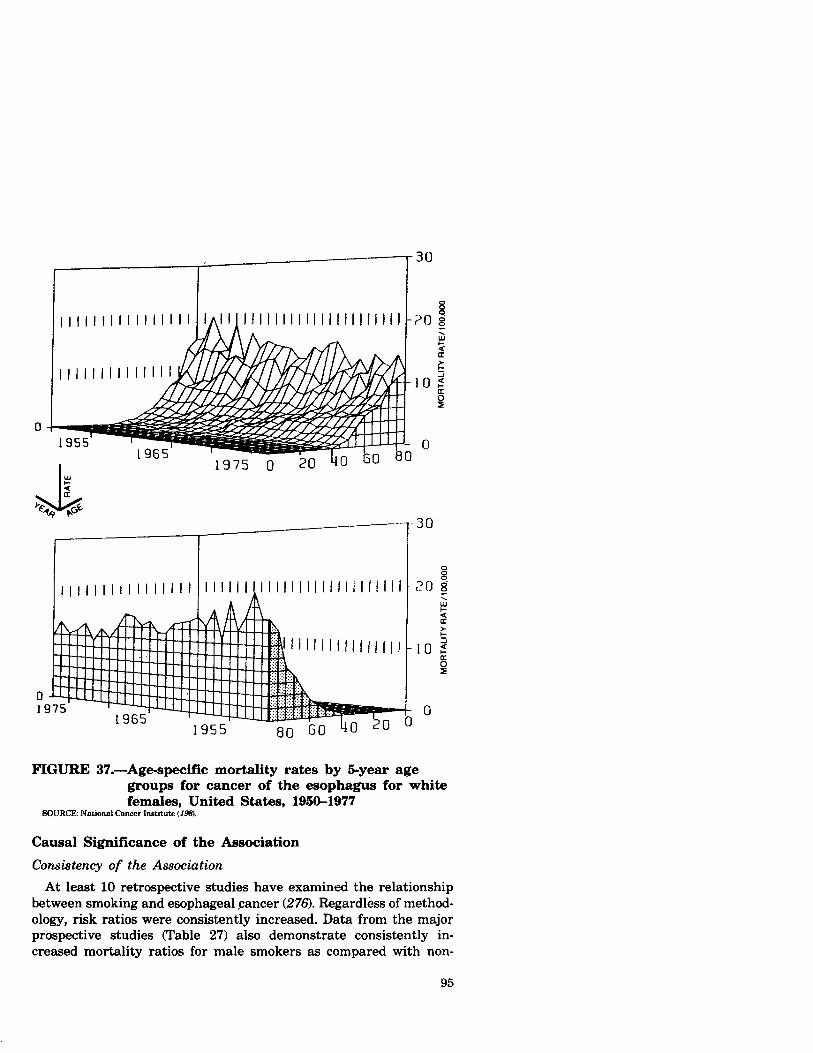
FIGURE 37.-Age-specific mortality rates by 5-year age groups for cancer of the esophagus for white females, United States, 1950-1977
SOURCE: National Cancer Institute (198).
Causal Significance of the Association
Consistency of the Association At least 10 retrospective studies have examined the relationship
between smoking and esophageal cancer (276). Regardless of method- ology, risk ratios were consistently increased. Data from the major prospective studies (Table 27) also demonstrate consistently in- creased mortality ratios for male smokers as compared with non-
95

TABLE 27.-Mortality ratios for cancer of the esophagus- prospective studies
Study
ACS BState Study
Population size
168,000
Number of Cigarette deaths Nonsmokers smokers Comments
1 nonsmoker 1.00 5.06 Eeophagus and 33 smokers other respiratory
sites
British Physicians
34,000 males 65 1.00 4.70 E=phsgus and other respiratory sites
U.S. Veterans 29QooO 119 1.00 6.43
ACS 25-State 398,@30 males 116 1.00 3.96 Study 483,OGfl females 48 1.00 4.89
California males 68,000 males 32 l.cm 1.82 in 9 occupations
JapaneSe Study
122,200 males 215 1.00 2.35
Swedish 55,000 males 1 nonsmoker Study and females 12 smokers 1.00 -
smokers. The ACS 25-&&e Study showed similar results for female smokers and cancer of the esophagus.
Strength of the Association Mortality ratios in the retrospective studies ranged from 1.3 to
11.1 among heavy smokers; mortality ratios in the prospective studies ranged from 1.8 to 6.4. In four of the large prospective studies, a dose-response relationship was demonstrated (Table 28). A reduced risk for esophageal cancer among female but not male smokers of lower tar and nicotine cigarettes has also been reported (155).
Specificity of the Association Specificity of the association between smoking and esophageal
cancer is evidenced by substantial differences in the mortality ratios (smokers versus nonsmokers) for esophageal cancer compared to other smoking-related cancers (Appendix Tables A and B).
Temporal Relationship of the Association The temporal relationship of this association is supported by the
prospective studies in which populations of initially disease-free subjects were followed for the development of esophageal carcinoma. In addition, there are histological data suggesting that smoking
96

TABLE 28.-Mortality ratios for cancer of the esophagus by amount smoked-prospective studies
Study Population Size Cigarettes/Day Ratio Comments
British Physicians
34,ooO males Nonsmoker 1.00 1-14 4.00 E-24 4.33 %+ 10.00
Grams of tobacco per day
U.S. Veterans Nonsmoker l-9
1~20 21-39 40+
1.00 3.06’ 4.34
12.42 9.20’
‘Based on fewer than 20 deaths
Japanese in 29 Health Districts
122,200 males Nonsmoker 1.00 1-19 2.2n
20-23 2.80 30+ 3.24l
California males in 9 occupations
Nonsmoker 1.00 about ‘1. pk 1.n about 1 pk 1.69
ahout l’/* pk 1.82
antedates premalignant and malignant transformation of esopha- geal epithelium (13,16X
Coherence of the Association
Dose-Response Relationship
There is a doseresponse relationship between smoking and esophageal cancer mortality in retrospective and prospective studies (276).
Esophageal Cancer Mortality and Cessation of Smoking
Several of the prospective studies noted reduced risks for cancer of the esophagus after quitting smoking. The U.S. Veterans Study found that the mortality ratio for ex-smokers decreased to 2.41 compared to 6.43 for continuing smokers. For the British Physicians Study, the corresponding ratios were 1.66 and 5.33, respectively. Thus, ex- smokers had only about one-third the risk for esophageal cancer of current smokers.
Figure 38 presents data from the American Health Foundation study for esophageal cancer mortality risk by the number of years off cigarettes. After quitting smoking for 4 years or more, former smoker rates were not substantially above those of nonsmokers.
97

PRESENT l-3 44 7-10 11-15 16+ NON- SMOKERS SMOKERS
FIGURE 38.-Relative risk of ma le ex-smokers for cancer of the esophagus by years since quitting smoking
SOURCE: Wynder and Stellman c326I
Correlation of Sex Differences in Esophageal Cancer W ith Different Smoking Habits
Esophageal cancer is predominantly a disease of ma les. The sex differences observed for esophageal cancer mortality are compatible with the sex differences in smoking patterns. As with oral and laryngeal cancer, esophageal cancer has also been related to excessive alcohol consumption. This must be considered as contribut- ing to the excess ratios of ma le to female esophageal cancer mortality (see page 1011.
Correlation of Esophageal Cancer Mortality Among Populations W ith Different Tobacco Consumption
In populations with low proport ions of smokers (e.g., Mormons and Seventh Day Adventists), the mortality rates from esophageal cancer are substantially reduced (79, 165, 166,211,294).
98

TABLE 29.-Mortality ratios for cancer of the esophagus in cigar and pipe smokers-a summary of prospective epidemiological studies
Smoking type
Study NOW Cigar Pipe Total pipe Cigarette
smoker only Oh and cimr only Mixed
ACS 9State Stud;l 1.00 5.00 3.50 - 5.06
British Physicians
ACS 25State Study
1.00
1.00
-
-
-
-
3.70
3.97
4.70
males 3.96* females 4.89
9.0
- -
U.S. Veterans 1.00 5.33 1.99 4.65 6.43 -
’ Combines data for oral. larynx. end esophagus. ’ Mortality ratio for ages 45 to 64.
Smoking and Histologic Changes in the Esophagus
Examination of 12,598 histologic sections of esophageal autopsy tissue from 1,268 men showed histologic findings which were similar to the abnormalities generally accepted as being premalignant in respiratory tract epithelium (16). Only 2.5 percent of the slides from current smokers exhibited no atypical cells, compared with 93.5 percent of slides from nonsmokers. The finding of 60 percent or more atypical cells was rare in the tissue of nonsmokers (0.3 percent), but much more common in tissue of smokers (17.7 percent).
Esophageal Cancer and Non-Cigarette Tobacco Use The esophagus is not directly exposed to inhaled tobacco smoke,
but tobacco smoke constituents condense on the mucous membranes of the mouth and pharynx and are swallowed, thus contacting esophageal cells. The esophagus also receives mucous cleared from the lungs by the ciliary mechanism or by coughing which is also swallowed. Variations in the inhalation of the smoke of -different tobacco products may not appreciably alter the degree of exposure of the esophagus. This possibility is suggested by the prospective and retrospective epidemiological studies which demon@rate similar mortality rates for cancer of the esophagus in smokers of cigars, pipes, and cigarettes. These data are presented in Table 29.
Several retrospective investigations have examined the association between smoking in various forms and cancer of the esophagus (Table 30). These studies suggest that cigar, pipe, and cigarette smokers develop cancer of the esophagus . at rates substantially higher than do nonsmokers and that little difference exists between these rates observed in smokers of pipes, cigars, or cigarettes. H#ologic changes in the esophagus have been related to smoking of
99

cigarettes and other forms of tobacco (16). Several retrospective studies conducted in the United States and other countries have examined the synergistic role of tobacco use and heavy alcohol intake and the risk of mortality from cancer of the esophagus. At least four of these investigations contain data on pipe and cigar smoking (33, 172, 173, 307). It appears that smoking in any form in combination with heavy drinking results in especially high rates of cancer of the esophagus.
TABLE 30.~Relative risk of cancer of the esophagus for men, comparing cigar, pipe, and cigarette smokers with nonsmokers. A summary of retrospective studies
Relative risk ratio and percentage of aaee Author, reference NWllhW and controls by type of smoking
Non- Ci Pipe TOW pipe Ciguette Mixed smoker only only . and cigar 4Y
Sadowsky (ue): caaea .................. Controls ...............
wynder (sf7jl: Cpaes .................. Controls. ..............
Pemu (rar) cases. ................. Controls ...............
Schwartz (~40: cases. ................. Controls ...............
Wynder and Bms ,mn:
casea. ................. COMdS ...............
Bradshaw and Shoaland (S.9:
cases. ................. Controls. ..............
Martine 2. (In): cases. ................. controls ...............
hltiinez’ (175): Cpres .................. Controls ...............
164 615
39 115
Lo2 713
239 249
150 156
117 366
126 360
346 346
Math risk 1.0 4.8 3.8 5.1 3.3 33 per~en+ w 4 5 a 6 69 la Percent controls 13 3 7 4 59 19
Relative risk 1.0 3.1 21 . 26 .4 Percent cases 13 15 18 . . 51 3 Percent controls 24 9 16 . 36 1s
Relative risk 1.0 . . . . 3.0 . . percent caae3 17 I . . Percent controls 39 5 .
Relative risk 1.0 26 Percent casea 2 . . 2 . . Percent controls ia . 7 . .
Relative risk 1.0 3.6 9.0 6.0 Percent cases 5 19 9 4 Percent controls 15 16 3 2
Relative risk 1.0 4.8 Percent case3 15 41 Percent Contras 32 la
Relative risk 1.0 20 . . . . Percent case3 a 9 . Percent controls 14 a
Relative risk 1.0 20 28 Percent eases 21 10 15 Percent contmls 22 9 1
.
.
.
27 59 50
11.7 aa 67
28 51 55
23 66 58
1.5 31 31
1.7 a4 a6
5.9 la I
86 7 7
3.7 11 9
22 43 a4
25 34 25
1Tbk study eombinea data for oml CMKZT and cancer of the wopbagu.
100