cancer risk queensland study
TRANSCRIPT

June 2005
Current status of
prostate cancerin Queensland, 1982 to 2002
Viertel Centre for Research in Cancer Control
The generosity of Queenslanders and the Sylvia and Charles Viertel Charitable Foundation makes this research possible
The Queensland Cancer Fund is an independent, community-based charity and is not government funded
For information and support contact our Cancer Helpline on 13 11 20, Monday to Friday 8am to 8pm
Queensland
StudyCancer Risk

Queensland Cancer Fund
�
Queensland Cancer Risk Study
Viertel Centre for Research in Cancer ControlQueensland Cancer Fund
December, 2005
Queensland
Cancer RiskStudy Results

Queensland Cancer Fund
V i e r t e l C e n t r e f o r R e s e a r c h i n C a n c e r C o n t r o l
Queensland Cancer Risk Study
��
Viertel Centre for Research in Cancer ControlQueensland Cancer Fund553 Gregory TerraceFortitude Valley Qld 4006
Postal address:PO Box 201Spring Hill Qld 4004Australia
Telephone: +61 7 3258 2309Facsimile: +61 7 3258 2310Website: www.qldcancer.com.au/vcrcc/
© Queensland Cancer Fund, 2005
ISBN: 1-876360-11-9
“Bowling” photo on the cover courtesy of Albert and Logan News.

Queensland Cancer Risk Study
Queensland Cancer Fund
���
Queensland Cancer Risk Study
Queensland Cancer Risk Study
TABLE OF CONTENTS
TABLE OF CONTENTS .................................................................................................................... ���LiST OF TABLES .............................................................................................................................. vLiST OF FigurES ............................................................................................................................ vACkNOwLEdgEmENTS ................................................................................................................. v�ExECuTivE SummAry ................................................................................................................... v�� Background .................................................................................................................................. vii
Study Objectives ........................................................................................................................... vii
Methods ........................................................................................................................................ vii
Key Findings ................................................................................................................................. viii
Conclusions .................................................................................................................................. x
ChApTEr 1: introduct�on ................................................................................................................ 1ChApTEr 2: methods ...................................................................................................................... 2 Sample Demographics ................................................................................................................. 2
ChApTEr 3: Tobacco ...................................................................................................................... 5 Smoking Behaviour ...................................................................................................................... 5
Current Smokers .......................................................................................................................... 6
Past Smokers ................................................................................................................................ 7
Other Tobacco Use ....................................................................................................................... 7
ChApTEr 4: Alcohol ........................................................................................................................ 8 Patterns of Alcohol Consumption ................................................................................................. 8
ChApTEr 5: d�et .............................................................................................................................. 10 Vegetable and Fruit Intake ........................................................................................................... 10
Knowledge of Recommended Daily Intake .................................................................................. 10
Variety of Vegetable and Fruit Consumption ............................................................................... 11
Supplements ................................................................................................................................. 11
ChApTEr 6: phys�cal Act�v�ty ......................................................................................................... 12 Physical Activity Levels of Queenslanders ................................................................................... 12
Walking ......................................................................................................................................... 13
Moderate Physical Activity ............................................................................................................ 13
Vigorous Physical Activity ............................................................................................................. 13
ChApTEr 7: Body mass .................................................................................................................. 14 Current Body Mass Index and Self-perception of Weight .................................................. 14
Body Mass Index at 20 Years of Age and Greatest Weight ......................................................... 15
ChApTEr 8: Sun Exposure And Sun protect�on .......................................................................... 16 Time Spent Outdoors and Sun Protection .................................................................................... 16
Sun-tanning and Sunburn ............................................................................................................ 19
Solarium Use and Attitudes .......................................................................................................... 20

Queensland Cancer Fund
V i e r t e l C e n t r e f o r R e s e a r c h i n C a n c e r C o n t r o l
Queensland Cancer Risk Study
�v
ChApTEr 9: Female reproduct�ve h�story And hormones ........................................................ 21 Hormone Medications .................................................................................................................. 21
Age at Menarche and Menopause .............................................................................................. 21
ChApTEr 10: Screen�ng Behav�our 23Cervical Cancer Screening ............................................................................................................ 23
Breast Cancer Screening .............................................................................................................. 24
Colorectal Cancer Screening ......................................................................................................... 26
Prostate Cancer Screening ............................................................................................................ 27
Skin Screening ............................................................................................................................. 28
ChApTEr 11: Exper�ence of Cancer .............................................................................................. 30 Personal Cancer History ............................................................................................................... 30
Family Cancer History .................................................................................................................. 30
ChApTEr 12: knowledge, Att�tudes and percept�ons ................................................................. 32 Belief in a Cure and Treatment for Cancer .................................................................................. 32
Belief in Reducing Risk of Cancer ............................................................................................... 32
Perception of Risk ........................................................................................................................ 33
ChApTEr 13: d�scuss�on ............................................................................................................... 34 Cancer Risk Factors ..................................................................................................................... 34
Cancer Screening, Knowledge and Attitudes ............................................................................... 34
Conclusions .................................................................................................................................. 36
rEFErENCES .................................................................................................................................. 37AppENdiCES ................................................................................................................................... 38

Queensland Cancer Risk Study
Queensland Cancer Fund
v
Queensland Cancer Risk Study
LiST OF TABLESTable 1.1 Participants by sex, age group and geographic region ........................................ 1Table 2.1 Weighted sample distribution and Queensland population distribution ................ 4Table 3.1 Current smoking status ......................................................................................... 5Table 3.2 Quit attempt techniques of current smokers ......................................................... 6Table 3.3 Future quitting intentions for current smokers ...................................................... 6Table 3.4 Future quit techniques of current smokers ........................................................... 7Table 3.5 Quitting techniques of ex-smokers ....................................................................... 7Table 4.1 Drinking intake status ........................................................................................... 8Table 6.1 The Active Australia Survey categories for activity time ....................................... 12Table 6.2 Percentage of respondents achieving different levels of physical activity during
the previous week, by sex and age ...................................................................... 13Table 7.1 Classification of Body Mass Index for people aged 18 years and over ................. 14Table 7.2 Self-perception of weight versus self-reported body mass index ......................... 15Table 7.3 Self-perception of weight versus self-reported body mass index by sex .............. 15Table 8.1 Prevalence of sun protective behaviours while outdoors during peak UV times on
the WEEKEND by skin type ................................................................................. 17Table 8.2 Prevalence of sun protective behaviours while outdoors during peak UV times on
a WEEKDAY by skin type ................................................................................. 18Table 8.3 Amount of time spent outdoors whilst at work by skin type .................................. 19Table 8.4 Number of times sunburnt in the last 12 months by skin type .............................. 19Table 8.5 Number of times severely sunburnt in the last 12 months by skin type ................ 19Table 9.1 Current menstrual status ...................................................................................... 22Table 11.1 Percentage of respondents who reported a diagnosis of cancer ......................... 31
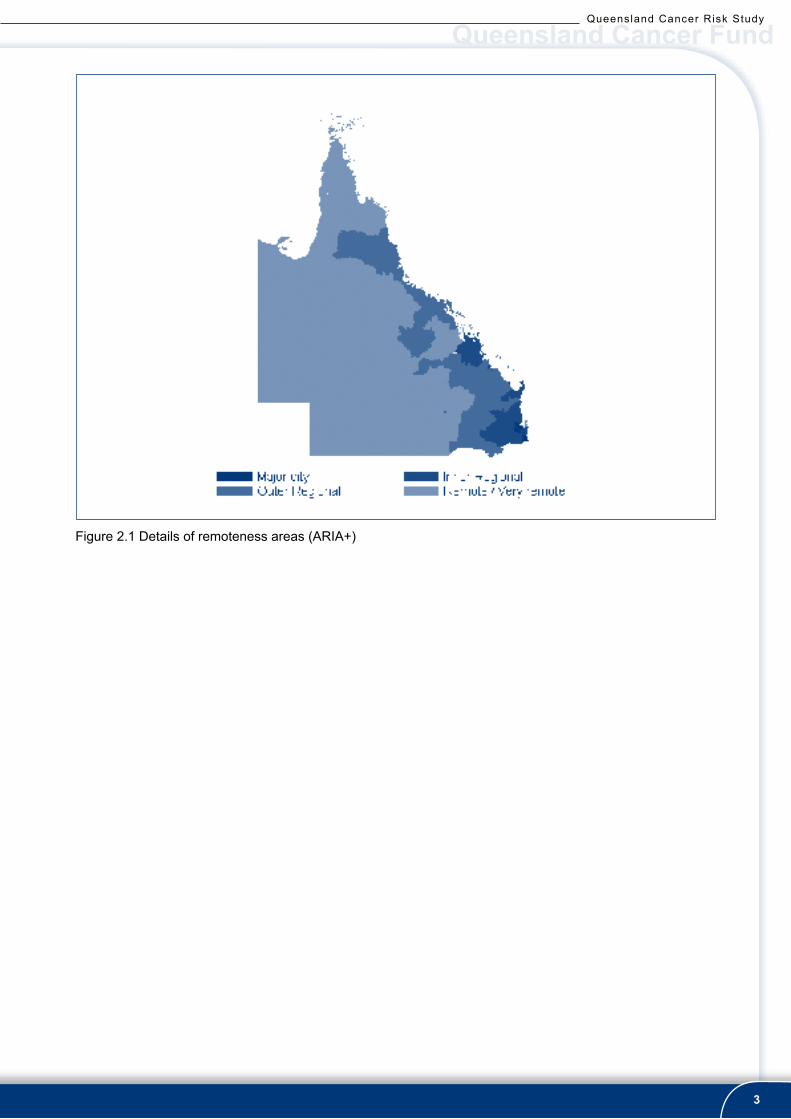
Figure 2.1 Details of remoteness areas (ARIA+) ..................................................................... 3
LiST OF FigurES
Queensland Cancer Fund
V i e r t e l C e n t r e f o r R e s e a r c h i n C a n c e r C o n t r o l
Queensland Cancer Risk Study
v�
ACkNOwLEdgEmENTS
This project was funded and conducted by the Queensland Cancer Fund. The Fund gratefully acknowledges its donors, volunteers and Branches whose support made this work possible. Special thanks go to the nearly 10,000 Queenslanders who took the time to take part in this study.
project management Comm�ttee
Assoc Prof Joanne Aitken (Viertel Centre for Research in Cancer Control, Queensland Cancer Fund)Prof Beth Newman (Centre for Health Research, Queensland University of Technology)Dr David Whiteman, (Queensland Institute of Medical Research)Assoc Prof Elizabeth Eakin (Viertel Centre for Research in Cancer Control, Queensland Cancer Fund)
Steer�ng Comm�ttee
Professor Ian Frazer (Committee Chair) (Centre for Immunology & Cancer Research, University of Queensland)Professor Ross Young (Department of Psychology, Queensland University of Technology)Dr Brian Cole (General Practitioner)Dr Jeff Dunn (Queensland Cancer Fund)
We gratefully acknowledge the expert advice and contributions of Dr Suzanne Steginga (Queensland Cancer Fund), Professor Neville Owen (Cancer Prevention Research Centre, University of Queensland), Professor Wayne Hall (Institute of Molecular Bioscience, University of Queensland) and Assoc Prof Lin Fritschi (Viertel Centre for Research in Cancer Control, Queensland Cancer Fund).
We also acknowledge the skilled and dedicated project staff - Mrs Carla Rogers (Project Manager), Mrs Tracey DisSipio, and Mrs Carla Shield. We thank our team of telephone interviewers; staff of the Health Information Branch, Queensland Health for assistance in sample selection; Adam Stoneley for assistance in data management and computer programming and Dr Peter Baade for advice in statistical analysis.

Queensland Cancer Risk Study
Queensland Cancer Fund
v��
Queensland Cancer Risk Study
ExECuTivE SummAry
Background
Behavioural factors such as smoking, alcohol consumption, inappropriate diet, inadequate physical activity, overweight and excessive sun exposure increase an individual’s risk of cancer and account for an ever increasing proportion of the total burden of cancer in the population. Improvement in these behavioural factors carries with it an expected reduction in the incidence of cancer over time. Community-wide campaigns aimed at reducing smoking and sun exposure have been conducted in Queensland for some years and campaigns to increase fruit and vegetable consumption and increase physical activity are underway. Cancer screening programs for cervical cancer and breast cancer are well-established and have resulted in reductions in the mortality rates for these diseases, while the introduction of a national screening program for bowel cancer has begun.
To plan, improve and evaluate these and other strategies for cancer prevention and early detection, information on the current prevalence of cancer risk factors and the level of cancer screening activity in the Queensland population is essential. We need to know how far we have come, how far we still have to go and where we can most effectively target our efforts and resources. Significant gaps exist in this knowledge.
The Queensland Cancer Fund undertook to address these gaps through the Queensland Cancer Risk Study, the first comprehensive survey of cancer risk factors, knowledge and attitudes towards cancer and screening activity across Queensland. Information from this study will provide a rational basis on which to refine and target prevention and early detection efforts. It will assist in shaping future cancer control policy and practice and will form a baseline against which to measure progress.
Study object�ves
The objectives of the Queensland Cancer Risk Study were to describe the distribution and determinants of behavioural risk factors for cancer in the Queensland population (smoking; alcohol consumption; diet; physical inactivity; overweight; sunburn, sun protection and solarium use); to describe current levels of screening for cervical, breast, colorectal and prostate cancer and melanoma; to describe Queenslanders’ experience of cancer; and to document Queenslanders’ knowledge of and attitudes towards cancer, cancer screening and perceived personal risk of cancer.
methods
The Queensland Cancer Risk Study was a state-wide survey of 9,419 residents of Queensland aged 20-75 years. Information from each respondent was collected through an anonymous computer-assisted telephone interview (Module 1) followed by a mailed self-administered questionnaire that sought more detailed information from respondents who agreed to provide their contact details (Module 2). This report includes results from Module 1 only.
All interviews were conducted between February and November 2004. Respondents were sampled at random within strata defined by age, gender and geographic region. Telephone numbers were selected at random from listings in the electronic White Pages. The interview was restricted to English-speaking respondents. A total of 9,419 people were interviewed. The overall response rate was 45.6%.
In order to evaluate differences by geographic region, Queensland was divided along geographical lines into four distinct areas according to remoteness as defined by the Accessibility/Remoteness Index of Australia (ARIA)+ classification that is based on physical road distance to the nearest town of 1000 or more people. The ARIA+ classification uses the following categories: Major city, Inner regional, Outer regional, Remote and Very remote. Due to the small number of people in the more remote areas, Remote and Very remote were combined into a single “Remote/Very remote” category.

Queensland Cancer Fund
V i e r t e l C e n t r e f o r R e s e a r c h i n C a n c e r C o n t r o l
Queensland Cancer Risk Study
v���
Key findings
Tobacco
23% of Queenslanders (25% of men and 21% of women) are current smokers.19% of Queenslanders (21% of men and 17% of women) smoke every day. Daily smoking prevalence decreased with increasing age (20-39 years 24%, 40-59 years 17% and 60-75 years 8%).Daily smoking prevalence is higher in remote/very remote areas (30%) compared with other areas of Queensland (19%).49% of daily smokers attempted to quit in the past 12 months.“Cold turkey” was the most common technique used for previous successful quit attempts and also the technique participants would be most likely to use in the future.
Alcohol
66% of Queenslanders drink alcohol regularly (i.e. at least once per month); 18% are infrequent drinkers; 8% are ex-drinkers and 7% are non-drinkers.More men (75%) than women (57%) are regular drinkers and more Queenslanders aged 20-39 years and 40-59 years are regular drinkers compared to those aged 60-75 years (68%, 68% and 60%, respectively).Overall, 9% of Queenslanders aged 20 years or older drink alcohol every day (the Dietary Guideline for Australian Adults recommends that adults have one or two alcohol-free days per week).A higher percentage of men (13%) than women (6%) drink alcohol every day and the percentage of Queenslanders who drink every day increases with age (20-39 years 4%, 40-59 years 12%, 60-75 years 18%).Among regular drinkers, on those occasions when they drink, 64% exceed the level of alcohol consumption recommended by the Dietary Guidelines for Australian Adults (i.e., two standard drinks for men and one standard drink for women). The percentage of regular drinkers exceeding these recommended levels is higher among women (71%) than men (58%) and is higher among younger people (20-39 years 72%, 40-59 years 62%, 60-75 years 44%).The percentage of regular drinkers exceeding these recommended levels is higher in remote/very remote areas (70%) than in other areas of Queensland (64%).There are no regional differences in the percentage of regular drinkers.
•••
•
••
•
•
•
•
•
•
•
•
d�et
The recommended intake of 5 serves of vegetables a day is achieved by only 12% of Queenslanders while 46% meet the recommended intake of 2 serves of fruit a day.Men aged 20-39 years and those living in major cities are the most likely groups NOT to meet vegetable intake recommendations.Men aged 20-39 years and those in outer regional and remote/very remote locations are the most likely groups NOT to meet fruit intake recommendations.Only about one in 10 Queenslanders know the recommended intake of vegetables and/or the recommended daily intake of fruit.38% of Queenslanders regularly take some type of vitamin, herbal or natural supplement, of whom 15% do this in part to reduce their risk of cancer.
phys�cal act�v�ty
There are high levels of physical inactivity in the Queensland population, with approximately 40% of Queenslanders either sedentary or achieving levels of activity insufficient for health benefits (i.e., less than the recommended 150 minutes of physical activity per week).Among those with “sufficient” levels of activity, walking is the most common form of physical activity.
•
•
•
•
•
•
•

Queensland Cancer Risk Study
Queensland Cancer Fund
�x
Queensland Cancer Risk Study
Men and people under the age of 40 years are relatively more active.There are few regional differences in levels of physical activity.
Body mass
Over half (54%) of Queenslanders are overweight or obese.Being overweight/obese is more common among men (61%) than women (46%) and increases with age.Being overweight/obese is more common in remote and very remote regions (63%) than other areas of Queensland (55%).Although most people have a correct perception of their weight, 16% of overweight/obese people believe themselves to be of normal weight and 1% believe themselves to be underweight.
Sun exposure and sun protect�on
70% of Queenslanders have been sunburnt at least once in the past 12 months.Men and people under the age of 40 are more likely to have been sunburnt at least once in the past 12 months.16% of Queenslanders have been SEVERELY sunburnt (defined as pain for two or more days, blistering or peeling of the skin) at least once in the past 12 months.Men and people under the age of 40 are more likely to have been severely sunburnt at least once in the past 12 months.There is little difference between regions either in sunburn or severe sunburn in the past 12 months.Solarium use is still low overall (1.3% of Queenslanders had visited a solarium in the past 12 months) but higher among women, young Queenslanders and those in city areas.Most Queenslanders who visit solaria do not recall receiving the required information and consent forms.
Female reproduct�ve h�story and hormones
Among Queensland women aged 20-75 years, 29% have used the mini-pill at some time (8% are currently using the mini-pill), 70% have used other forms of the oral contraceptive pill (18% are currently using the oral contraceptive pill) and 22% have used hormone replacement therapy.There is little difference between regions either in use of the mini-pill or in use of the oral contraceptive pill.Hormone replacement therapy is used much less by women living in remote or very remote regions compared to the rest of Queensland.
Screen�ng behav�our
The majority of Queenslanders believe that it is important to check for different types of cancer even if there are no symptoms (98% believe it is important to check for cervical cancer, 98% for breast cancer, 80% for colorectal cancer and 96% for skin cancer).The proportions of Queenslanders who report they comply with cancer screening guidelines are: 68% of women aged 20-75 years report they have a Pap smear test at least every two years, 80% of women aged 50-69 years report they have a mammogram at least every two years, 2% of Queenslanders aged 50-75 years report they have a faecal occult blood test (FOBT) at least every two years.In addition, 25% of men aged 50-69 years report they have a PSA test at least every two years and 14% of Queenslanders aged 20-75 years report they have a skin examination every year.The proportion of Queenslanders who can name the screening tests for different types of cancer are:
87% of women aged 20-75 years mentioned “Pap smear” for cervical cancer, 91% of women aged 50-69 years mentioned “mammogram” for breast cancer, 17% of adults aged 50-75 years mentioned “FOBT” (faecal occult blood test) for bowel cancer, 48% of adults aged 50-75 years mentioned “colonoscopy” for bowel cancer.
In addition, 51% of men aged 50-69 years mentioned “DRE” (digital rectal examination) for prostate cancer and 50% of men aged 50-69 years mentioned “PSA” (prostate-specific antigen) test for prostate cancer.There was little variation in screening practices across the State. However, no respondents living in remote/very remote areas of Queensland reported undergoing a regular FOBT.
••
•••
•
••
•
•
••
•
•
•
•
•
•
•
•
•
•

Queensland Cancer Fund
V i e r t e l C e n t r e f o r R e s e a r c h i n C a n c e r C o n t r o l
Queensland Cancer Risk Study
x
Exper�ence of cancer
One in six respondents (16%) had had a diagnosis of cancer. About half of these cancers were non-melanoma skin cancer. Excluding non-melanoma skin cancer, 8% of respondents had had a diagnosis of cancer.41% of respondents stated that one or more close blood relatives (parents, children, brothers, sisters) had had a diagnosis of cancer.85% of respondents personally knew someone who had had cancer.
knowledge, att�tudes and percept�ons
Just over half (54%) of Queenslanders are at least moderately confident that there will be cures for the most common forms of cancer within their lifetimes.Most Queenslanders (97%) believe that treating cancer in the early stages increases a person’s chance of survival.Most Queenslanders (98%) are able to name one or more actions they can take to reduce their risk of getting cancer with the most common being “protection from sun exposure” and “eating well”.Almost one quarter (24%) of Queenslanders who had not had cancer thought they had a “high” to “certain” risk of getting skin cancer and 14.6% thought they had a high or certain risk of getting a cancer other than skin cancer.
•
•
•
•
•
•
•
Conclus�ons
Overall, these results suggest that, for the majority of Queensland adults, there is scope for improvement in regard to cancer risk behaviours and knowledge. Continuing efforts are warranted to improve behavioural risk factors for the whole of the Queensland population. In addition, this study has identified a number of demographic groups with multiple cancer risk behaviours, namely, men, younger Queenslanders and residents of remote/very remote areas. This information will be invaluable in informing strategies and the design of appropriate messages to target these high risk groups. The Queensland Cancer Fund Community Services Department is currently developing specific program recommendations that will be informed by these data.
This report describes only a small portion of the information provided by the Queensland Cancer Risk Study. The data-set comprising Module 2, the results of the self-administered questionnaire, includes a wealth of information and avenues for further inquiry into the common reasons for engaging in cancer risk behaviours and for failing to follow cancer screening guidelines. Such information will help to further refine efforts to reach at-risk Queenslanders with cancer control messages and programs.
In conclusion, the Queensland Cancer Risk Study provides the most comprehensive picture to date of the behaviour and attitudes of the State’s population in regard to prevention, early detection and screening for cancer. These results will inform the cancer control initiatives of the Queensland Cancer Fund and other stakeholders and will provide a platform to help frame and direct future cancer prevention and early detection programs. Importantly, these results will also provide a benchmark against which to monitor progress in improving knowledge, attitudes and behaviour with the goal of limiting the incidence and impact of cancer in the population.

Queensland Cancer Risk Study
Queensland Cancer Fund
1
Queensland Cancer Risk Study
ChApTEr 1: introduct�on Behavioural factors such as smoking, alcohol consumption, inappropriate diet, inadequate physical activity, overweight and excessive sun exposure increase an individual’s risk of cancer and account for an ever increasing proportion of the total burden of cancer in the population. Improvement in these behavioural factors carries with it an expected reduction in the incidence of cancer over time. Community-wide campaigns aimed at reducing smoking and sun exposure have been conducted in Queensland for some years and campaigns to increase fruit and vegetable consumption and increase physical activity are underway. Cancer screening programs for cervical cancer and breast cancer are well-established and have resulted in reductions in the mortality rates for these diseases, while the introduction of a national screening program for bowel cancer has begun.
To plan, improve and evaluate these and other strategies for cancer prevention and early detection, information on the current prevalence of cancer risk factors and the level of cancer screening activity in the Queensland population is essential. We need to know how far we have come, how far we still have to go and where we can most effectively target our efforts and resources. Significant gaps exist in this knowledge.
The Queensland Cancer Fund undertook to address these gaps through the Queensland Cancer Risk Study, the first comprehensive survey of cancer risk factors, cancer screening activity, and knowledge and attitudes towards cancer across Queensland. Information from this study will provide a rational basis on which to refine and target prevention and early detection efforts. It will assist in shaping future cancer control policy and practice and will form a baseline against which to measure progress.
The objectives of the Queensland Cancer Risk Study were to describe the distribution and determinants of behavioural risk factors for cancer in the Queensland population (smoking; alcohol consumption; diet; physical inactivity; overweight; sunburn, sun protection and solarium use); to describe current levels of screening for cervical, breast, colorectal, prostate cancer and melanoma; to describe Queenslanders’ experience of cancer; and to document Queenslanders’ knowledge of and attitudes towards cancer, cancer screening and perceived personal risk of cancer.
Table 1.1 Participants by sex, age group and geographic regiona
geograph�c reg�onb Total(n=9419)
20-39(n=3142)
Age group (years)
40-59(n=3162)
60-75(n=3115)
male Female male Female male Female male FemaleSouth West/Darling Downs 304 295 100 100 104 98 100 97West Moreton 324 294 109 100 117 98 98 96Logan 300 302 100 101 100 101 100 100Brisbane (South) 301 301 100 101 100 101 101 99Central/Fitzroy 303 302 100 102 102 100 101 100Sunshine Coast 304 305 102 99 102 105 100 101Far North 363 361 122 121 120 120 121 120Northern/North West 360 360 120 120 120 120 120 120Mackay 362 363 121 121 121 122 120 120Wide Bay 363 363 121 121 122 122 120 120Brisbane (Bayside) 360 360 120 120 120 120 120 120Gold Coast 360 362 120 120 120 122 120 120Brisbane (North) 361 360 121 120 120 120 120 120Redcliffe/Caboolture 361 365 120 120 121 124 120 121a Column numbers and percentages are raw data.

Queensland Cancer Fund
V i e r t e l C e n t r e f o r R e s e a r c h i n C a n c e r C o n t r o l
Queensland Cancer Risk Study
2
ChApTEr 2: methods The Queensland Cancer Risk Study was a state-wide survey of 9,419 residents of Queensland aged 20-75 years. Information from each respondent was collected through an anonymous computer-assisted telephone interview (Module 1) followed by a mailed self-administered questionnaire that sought more detailed information from respondents who agreed to provide their contact details (Module 2). This report includes results from Module 1 only.
All interviews were conducted between February and November 2004.
Respondents were sampled at random within strata defined by age, gender and geographic region, as shown in Table 2.1. For this survey, Queensland was divided into 14 geographic regions. These regions are aggregates of the Health Service Districts used by Queensland Health and equate largely to the Commonwealth Sub-regions, a geographic entity defined by the Commonwealth Department of Health and Aged Care. These regions have also been used in state-wide surveys conducted by Queensland Health. To assist interpretation, three of these regions have been renamed for the purposes of this report as “Brisbane (North)” (formerly Prince Charles Hospital and District), “Brisbane (South)” (formerly QEII Hospital and District) and “Brisbane (Bayside)” (formerly Bayside).
Sampling proceeded region by region, in the order listed in Table 1.1. The sample quota required for each age-gender-region cell was calculated to provide 90% power to detect a minimum absolute difference in proportions of 0.1 when comparing between two sample cells with two-sided testing and a significance level of 0.05. A total of 9,419 people were interviewed. The overall response rate was 45.6%.
In order to evaluate differences by geographic region, Queensland was divided along geographical lines into four distinct areas according to remoteness as defined by the Accessibility/Remoteness Index of Australia (ARIA)+ classification that is based on physical road distance to the nearest town of 1000 or more people. The ARIA+ classification uses the following categories: Major city, Inner regional, Outer regional, Remote and Very remote (Figure 2.1). Due to the small number of people in the more remote areas, Remote and Very remote were combined into a single “Remote/Very remote” category.
Telephone numbers were selected at random from listings in the electronic White Pages. The sampling frame included the current White Pages combined with previous editions of the White Pages from the last six years, a technique that has been found to increase the probability of capturing silent numbers. This is because, over time, listed numbers from earlier editions of the White Pages are recirculated to become today’s silent numbers. The interview was restricted to English-speaking respondents.
The 30-minute telephone interview included questions about tobacco use, alcohol consumption, diet, physical activity, body mass index, sun exposure and sun protection, female reproductive history and hormones, cancer screening activity, cancer history and family cancer history, and knowledge and perceptions of cancer risk. The interview was developed after a comprehensive review of relevant questions from national and international surveys.
All analyses were weighted by age, gender and geographic location so that the results reflect the actual Queensland resident population in the 20-75 years age range, based on the Queensland 2003 estimated resident population obtained from the Australian Bureau of Statistics.
Sample demograph�cs
The demographic characteristics of the weighted survey sample were compared to those same characteristics in the whole Queensland population using information on the Queensland 2001 Census obtained from the Australian Bureau of Statistics (Table 2.1). The survey sample was reasonably representative of the Queensland population, although respondents tended to have a higher level of education and were more likely to be married. There was an under-representation of Indigenous people in the survey sample. The demographic characteristics of the survey sample are tabulated in detail in Appendix A.
Queensland Cancer Risk Study
Queensland Cancer Fund
3
Queensland Cancer Risk Study
Figure 2.1 Details of remoteness areas (ARIA+)

Queensland Cancer Fund
V i e r t e l C e n t r e f o r R e s e a r c h i n C a n c e r C o n t r o l
Queensland Cancer Risk Study
4
Table 2.1 Weighted sample distribution and Queensland population distributionvar�able Survey d�str�but�ona
%Queensland
d�str�but�on b %Sex Male 49.9 49.0c
Female 50.1 51.0c
Age 20-39 years 42.6 43.8 40-59 years 40.5 40.2 60-75 years 16.9 16.0cResidential region by ARIA+ Major city 54.5 53.8c
Inner regional 25.2 25.7c
Outer regional 18.1 17.6c
Remote/Very remote 2.2 2.9c
Country of birth Australia 79.6 77.7 Overseas 20.4 17.2 Ethnicity Indigenous Australian 1.3 3.1Education level University or college degree 25.9 10.8 Trade or technical certificate/Diploma 30.8 21.5 Senior high school or below 43.3 67.7Employment status Employed full-timed 69.9 63.9 Employed part-time 29.9 33.0Marital status Married 64.2 51.3 Divorced 5.4 8.0 Married, but separated 2.7 3.8 Widowed 2.6 5.8 Never married (includes living together)e 25.0 31.2
Total Queensland population N=9,419 N=3,585,639
a Column percentages are standardised to the 2003 Queensland population by age, sex and geographic location.b Applicable to all persons (excluding overseas visitors).c Applicable to persons aged 15 years and over.d Full-time is defined as having worked 35 hours or more in all jobs during the week.e Never married is defined as per the ABS Registered Marital Status and refers to the legal status of the person and not necessarily his/her current living.
arrangements therefore, “living together” is included in the “never married” category.
Stat�st�cal notes
The estimates provided in this report are subject to sampling and non-sampling error. Data in future publications may differ from this report due to further coding of responses. Due to rounding some results in the tables in this report do not add up to 100 percent.

Queensland Cancer Risk Study
Queensland Cancer Fund
5
Queensland Cancer Risk Study
ChApTEr 3: TobaccoKey findings
23% of Queenslanders (25% of men and 21% of women) are current smokers.19% of Queenslanders (21% of men and 17% of women) smoke every day.Daily smoking prevalence decreased with increasing age (20-39 years 24%, 40-59 years 17% and 60-75 years 8%).Daily smoking prevalence is higher in remote/very remote areas (30%) compared with other areas of Queensland (19%).49% of daily smokers attempted to quit in the past 12 months.“Cold turkey” was the most common technique used for previous successful quit attempts and also the technique participants would be most likely to use in the future.Detailed results are tabulated in Appendix B
•••
•
••
•
Tobacco smoking is the main known cause of cancer-related death worldwide. Cigarette smoking is an established risk factor for lung cancer and has been causally linked to numerous other cancers such as cancer of the larynx, oral cavity, pharynx, oesophagus, pancreas, kidney and bladder. Other types of cancer, such as cancer of the stomach, liver, and nasal sinuses and myeloid leukaemia, may also be a consequence of smoking. Passive smoking has also been shown to be an important cancer risk.(1)
Smok�ng behav�our
Just over half (53.4%) of the Queensland population have smoked at least 100 cigarettes during their lives, and almost one in four adults (23.0% of Queenslanders; 25.2% of men and 20.8% of women) were identified as current smokers (Appendix B1-B2). This proportion of current smokers is comparable to the 21.2% reported from the Queensland results of the 2001 National Drug Strategy Household Survey.(2)
To obtain a more detailed assessment of cigarette intake and quitting behaviour, smoking status was divided according to current smoking status with ex-smokers further divided into short- and long-term ex-smokers. Literature suggests that among former smokers, the time of abstinence from cigarettes is the most important indicator of the probability of relapse.(3) Ex-smokers who have abstained from smoking for a 12-month period have only about a 5% risk of relapsing, so 12 months of continuous abstinence has been used as the criterion for ‘successful quitting’. The five groups therefore were: 1) lifelong non-smokers (those who have never smoked at least 100 cigarettes in their lifetime); 2) current daily smokers; 3) current intermittent smokers (those who report smoking on some days); 4) short-term ex-smokers (“recent quitters”, those who quit smoking fewer than 12 months ago); and 5) long-term ex-smokers (those who quit smoking 12 months ago or longer) (Table 3.1, Appendix B2).
Table 3.1 Current smoking statusa
Smok�ng status N=9411 %Current daily smoker 1753 18.6Current intermittent smoker 411 4.4Long-term ex-smoker 2594 27.6Short-term ex-smoker 262 2.8Life-long non-smoker 4391 46.6a Column counts and percentages are standardised to the 2003 Queensland population by age, sex and geographic location.
A higher percentage of men than women were daily smokers (20.7% and 16.5% respectively). Smoking prevalence was highest in the 20-39 year age group and decreased with increasing age. Daily smoking prevalence was higher in remote/very remote areas compared with other areas of Queensland (Appendix B2).
On average, respondents were aged 15 years when they first tried a cigarette and 17 years when they first started to smoke at least once per week (Appendix B3-B4).

Queensland Cancer Fund
V i e r t e l C e n t r e f o r R e s e a r c h i n C a n c e r C o n t r o l
Queensland Cancer Risk Study
6
Current smokers
Tobacco �ntake
Current daily smokers smoked 19 cigarettes per day on average. Current intermittent smokers smoked on 13 of the last 30 days, with an average consumption of 6.5 cigarettes per day during this time (Appendix B5-B7).
Qu�t attempts
A quit attempt was defined as having stopped smoking for more than one day in the last 12 months in order to try to stop smoking. Just under half (48.5%) of daily smokers made at least one quit attempt. Current daily smokers who did attempt to quit made an average of 2.5 attempts during the last 12 months (Appendix B8-B9).
Over half (63.8%) of intermittent smokers made an attempt to quit over the last 12 months with an average of five attempts. The most popular strategy for attempting to quit smoking in the last 12 months for both daily and intermittent smokers was giving up “cold turkey” (Table 3.2).
Table 3.2 Quit attempt techniques of current smokersa
Qu�t techn�que% tr�ed method
da�ly smokers interm�ttent smokersCold turkey/just gave up 64.2 72.9Nicotine patches 32.4 17.6Zyban 12.1 6.1Nicotine gum 7.9 5.3Reduced the number of cigarettes smoked 2.0 3.8a Column percentages are standardised to the 2003 Queensland population by age, sex and geographic location.
For daily smokers who had attempted unsuccessfully to quit smoking in the last 12 months, the longest they were able to refrain from smoking was 10 days on average. For intermittent smokers who had attempted to give up smoking in the last year, they refrained for an average of 40 days.
Future qu�tt�ng �ntent�ons
Current daily and intermittent smokers were asked about their future quitting intentions (Table 3.3). In both groups, fewer than 10% of current smokers had no intention of ever quitting smoking. A higher percentage of current intermittent smokers intended to quit in the next month than current daily smokers, whereas current daily smokers were more likely than intermittent smokers to report intending to quit but not in the next six months.
Table 3.3 Future quitting intentions for current smokersa
Future qu�tt�ng �ntent�ons % da�ly smokers % �nterm�ttent smokers
Intend to quit in the next month 16.5 35.6Intend to quit in the next 6 months 30.5 30.5Intend to quit but not in the next 6 months 38.3 17.8Never intend to quit 8.8 8.3Don’t know 5.9 7.8a Column percentages are standardised to the 2003 Queensland population by age, sex and geographic location.

Queensland Cancer Risk Study
Queensland Cancer Fund
7
Queensland Cancer Risk Study
A higher percentage of younger respondents and residents of remote/very remote regions intended to quit in the next one to six months. For those respondents who indicated an intention to quit sometime in the next six months, most indicated that they would “go cold turkey” or ”just give up” (Table 3.4, Appendix B12-B13).
Table 3.4 Future quit techniques of current smokersa
Future qu�t techn�ques% who may qu�t �n the
next month next 6 monthsCold turkey/just give up 53.8 48.7Nicotine patches 27.8 30.0Zyban 5.5 7.4Nicotine gum 2.8 4.6Reduce the number of cigarettes smoked 3.7 2.9a Column percentages are standardised to the 2003 Queensland population by age, sex and geographic location.
past smokers
As previously noted, respondents who had smoked at least 100 cigarettes during their lifetime but who no longer smoke were classified as either short-term or long-term ex-smokers, depending upon how recently they had given up smoking.
Of the respondents defined as short-term ex-smokers, it had been 3.8 months on average since they quit smoking. For long-term ex-smokers, it had been 192 months, or close to 16 years, on average since they quit smoking.
Qu�t techn�ques
Both short- and long-term ex-smokers were asked about the methods that they used to give up smoking (Table 3.5, Appendix B15). The most common technique used to quit smoking was “cold turkey” or “just gave up”. Short-term ex-smokers were much more likely than long-term ex-smokers to use nicotine replacement therapies and Zyban.
Table 3.5 Quitting techniques of ex-smokersa
Qu�t techn�que% who used method
Long-term ex-smokers
Short-term ex-smokers
Cold turkey/just give up 83.5 58.4Nicotine patches 4.9 14.9Zyban 1.4 10.7Used hypnosis 1.5 3.1Reduce the number of cigarettes smoked 2.2 1.5a Column percentages are standardised to the 2003 Queensland population by age, sex and geographic location.
Other tobacco use
Overall, 2.1% of Queenslanders smoke cigars, 0.4% smoke a pipe and 0.1% chew tobacco. Men aged 20-39 years were more likely to report smoking cigars, while older men (60-75 years) were more likely to report smoking a pipe. The highest prevalence of chewing tobacco was in remote/very remote areas of Queensland (Appendix B16-B18).

Queensland Cancer Fund
V i e r t e l C e n t r e f o r R e s e a r c h i n C a n c e r C o n t r o l
Queensland Cancer Risk Study
8
ChApTEr 4: AlcoholKey findings
66% of Queenslanders drink alcohol regularly (i.e. at least once per month); 18% are infrequent drinkers; 8% are ex-drinkers and 7% are non-drinkers.More men (75%) than women (57%) are regular drinkers and more Queenslanders aged 20-39 years and 40-59 years are regular drinkers compared to those aged 60-75 years (68%, 68% and 60%, respectively).Overall, 9% of Queenslanders aged 20 years or older drink alcohol every day (the Dietary Guideline for Australian Adults recommends that adults have one or two alcohol-free days per week).A higher percentage of men (13%) than women (6%) drink alcohol every day and the percentage of Queenslanders who drink every day increases with age (20-39 years 4%, 40-59 years 12%, 60-75 years 18%).Among regular drinkers, on those occasions when they drink, 64% exceed the level of alcohol consumption recommended by the Dietary Guidelines for Australian Adults (i.e. two standard drinks for men and one standard drink for women).The percentage of regular drinkers exceeding these recommended levels is higher among women (71%) than men (58%) and is higher among younger people (20-39 years 72%, 40-59 years 62%, 60-75 years 44%).The percentage of regular drinkers exceeding these recommended levels is higher in remote/very remote areas (70%) than in other areas of Queensland (64%).There are no regional differences in the percentage of regular drinkers.Detailed results are tabulated in Appendix C.
High levels of alcohol consumption have been associated with increased risk of cancers of the lips, mouth, throat, larynx, oesophagus, pharynx, and liver and may increase the risk of stomach, pancreas, bowel and breast cancer.(4)
patterns of alcohol consumpt�on
Approximately two-thirds (66.4%) of Queenslanders were regular drinkers, i.e. reported they drank alcohol at least once a month (Table 4.1). More men than women were regular drinkers (75.6% versus 57.4%) and the prevalence of regular drinking decreased slightly with age (67.7% of 20-39 year olds and 67.8% of 40-59 year olds were regular drinkers compared with 59.9% of 60-75 year olds) (Appendix C1).
•
•
•
•
•
•
•
••
Table 4.1 Drinking intake statusa
dr�nk�ng behav�our Definition Number %Regular drinker Drink at least once per month 6257 66.4Infrequent drinker Drink <once per month 1718 18.2Past drinker Used to drink alcohol but have stopped 711 7.6Life-long non-drinker Have never drunk alcohol 730 7.8a Column percentages are standardised to the 2003 Queensland population by age, sex and geographic location.
Regular drinkers were 20 years of age on average when they began to drink alcohol at least once a month. Among regular drinkers, about one-fifth (21.1%) drank less than one day a week over the past 12 months, while 13.8% drank every day (Appendix C2-C3).
Overall, 9.2% of the Queensland population reported that, on average, they drank every day over the past 12 months. The most recent Dietary Guidelines for Australian Adults recommend that people have one or two alcohol-free days per week.(5) Daily drinking was more common among men (12.5% versus 5.9% for women), and increased with age (37% of 20-39 year olds, 11.5% of 40-59 year olds and 17.8% of 60-75 year olds drank daily).

Queensland Cancer Risk Study
Queensland Cancer Fund
9
Queensland Cancer Risk Study
The most recent Dietary Guidelines for Australian Adults recommend that if people are going to drink, they should limit their average daily intake of alcohol to no more than two standard drinks for men and one standard drink for women.(5) Among regular drinkers, on those occasions when they drank, close to two-thirds (63.5%) drank above these recommended levels. This proportion was higher among women (70.8%) than men (57.9%), reflecting in part the lower recommended levels for women. The proportion of regular drinkers exceeding these recommended levels decreased with increasing age, and tended to be higher in regional and remote areas (Appendix C4).
Among regular drinkers, about three-quarters (76%) drank five or more drinks of alcohol at one sitting on at least one occasion during the last 12 months and 26.4% of regular drinkers reported this level of drinking about once a week or more. Among regular drinkers, men were more likely than women to have five or more drinks of alcohol about once a month or more (57.2% and 31.1%, respectively) and those aged 20-39 years were more likely than those aged 40-59 and 60-75 years to have five or more drinks of alcohol about once a month or more (55.4%, 41.3% and 29.1%, respectively) (Appendix C5).
Compared with the amount they were drinking 12 months ago, 31.8% of regular drinkers were drinking less alcohol, 56.8% were drinking about the same amount of alcohol, and 11.4% were drinking more alcohol (Appendix C6).
past dr�nkers
A total of 7.6% of Queenslanders reported they used to drink alcohol but have now stopped. They were on average 35 years old when they stopped drinking alcohol. Men tended to be older than women when they stopped drinking (38.0 years versus 32.9 years, respectively) (Appendix C7).

Queensland Cancer Fund
V i e r t e l C e n t r e f o r R e s e a r c h i n C a n c e r C o n t r o l
Queensland Cancer Risk Study
10
ChApTEr 5: d�etKey findings
The recommended intake of 5 serves of vegetables a day is achieved by only 12% of Queenslanders while 46% meet the recommended intake of 2 serves of fruit a day.Men aged 20-39 years and those living in major cities are the most likely groups NOT to meet vegetable intake recommendations.Men aged 20-39 years and those in outer regional and remote/very remote locations are the most likely groups NOT to meet fruit intake recommendations.Only about one in 10 Queenslanders know the recommended intake of vegetables and/or the recommended daily intake of fruit.38% of Queenslanders regularly take some type of vitamin, herbal or natural supplement, of whom 15% do this in part to reduce their risk of cancer.Detailed results are tabulated in Appendix D.
It has been estimated that up to 30% of cancers are attributable to diet.(6) A Westernised diet (high caloric food rich in animal fat and protein) increases the risk of colon, breast, prostate, endometrial and other cancers. Research has shown that fruit and vegetable consumption has an overall protective effect for cancers of the pharynx, larynx, lung, oesophagus, stomach and cervix uteri and that consumption of vegetables may reduce risk of cancers of the colon and rectum.(6) Current guidelines encourage Australians to eat at least five serves of vegetables and two serves of fruit a day.(5)
vegetable and fru�t �ntake
Respondents were asked about their usual daily consumption of vegetables and fruits over the past 12 months. Only 11.9% of respondents met the recommended intakes of at least five serves of vegetables per day and 45.5% met the recommended intake of at least two serves of fruit per day. Overall, just 7.7% of Queenslanders met both the vegetable and fruit recommendations (Appendix D1-D7). In comparison, the 2001 National Health Survey reported that 31.1% Queenslanders usually consumed four or more serves of vegetables a day and 44.6% reported eating two or more serves of fruit a day.(7)
The prevalence of not meeting vegetable recommendations was highest among men aged 20-39 years and those respondents living in major cities. Similarly, men aged 20-39 were the most likely group to not meet fruit recommendations. However, non-compliance with fruit intake recommendations is highest in outer regional and remote/very remote locations of Queensland (Appendix D2, D5).
Compared to 12 months ago, 78.4% of Queenslanders were eating the same amount of vegetables while 14.8% were eating more. The remaining 6.5% were eating fewer vegetables than a year ago. Compared to 12 months ago, 74.7% of Queenslanders were eating the same amount of fruit, 15.3% were eating more, and the remaining 8.7% were eating less fruit (Appendix D3, D6).
knowledge of recommended da�ly �ntake
Queenslanders’ knowledge of recommended guidelines for daily fruit and vegetable intake was quite poor. Less than a third (29.8%) of respondents knew the recommended daily intake of vegetables, with a similar proportion (27.7%) stating they knew the recommended daily fruit intake (Appendix D8, D11).
Of the respondents who stated that they knew the recommended intake, only 31.4% correctly stated five serves for vegetables, with 36.2% correctly stating two serves for fruit. Therefore, of the entire Queensland population, only 9.4% were able to indicate correctly five serves as the recommended daily intake of vegetables, and only 10.0% correctly identified two serves as the recommended daily intake of fruit (Appendix D9, D12).
Dietary intake and knowledge were combined to show the percentage of Queenslanders who: 1) knew and met the guidelines, 2) knew the recommendations but didn’t meet them, 3) incorrectly stated the recommended daily intake (‘incorrectly know’); 4) didn’t know the guidelines and didn’t meet them, and 5) those who stated that they didn’t know the guidelines but met them (Appendix D10, D13).
•
•
•
•
•
•

Queensland Cancer Risk Study
Queensland Cancer Fund
11
Queensland Cancer Risk Study
Only 1.7% of Queensland adults knew and met the recommended guidelines of at least five serves of vegetables per day. Most Queenslanders (61.8%) didn’t know the vegetable guidelines and didn’t meet them. The prevalence of not knowing the vegetable guidelines and not meeting them was highest among men, increased with age and increased with remoteness (Appendix D10).
Only 5.3% of Queensland adults knew and met the recommended guidelines of at least two serves of fruit per day. Almost half of Queensland adults (42.7%) didn’t know the fruit guidelines and didn’t meet them. The prevalence of not knowing the fruit guidelines and not meeting them was highest among men, decreased with age and increased with remoteness (Appendix D13).
var�ety of vegetable and fru�t consumpt�on
Respondents were asked about the different types of vegetables they eat on a typical day. Note that this question does not relate to the amount of each vegetable consumed. Among Queenslanders, the majority ate either three to four (56.5%) or five or more (34.2%) types of vegetables on a typical day (Appendix D14).
Supplements
Respondents were asked about their regular (defined as at least three times a week) use of vitamin, herbal or natural supplements. Altogether, 37.9% of respondents indicated that they regularly take some type of vitamin, herbal or natural supplement. Of these respondents, 14.9% agreed with the statement “Is one of the reasons you take these supplements to reduce your risk of cancer?” (Appendix D15-D16).

Queensland Cancer Fund
V i e r t e l C e n t r e f o r R e s e a r c h i n C a n c e r C o n t r o l
Queensland Cancer Risk Study
12
ChApTEr 6: phys�cal Act�v�tyKey findings
There are high levels of physical inactivity in the Queensland population, with approximately 40% of Queenslanders either sedentary or achieving levels of activity insufficient for health benefits (i.e., less than the recommended 150 minutes of physical activity per week).Among those with “sufficient” levels of activity, walking is the most common form of physical activity.Men and people under the age of 40 years are relatively more active.There are few regional differences in levels of physical activity.Detailed results are tabulated in Appendix E.
Regular, moderate physical activity has been shown to confer a variety of health benefits including protection against cancer. There is evidence that physical activity reduces the risk of some cancers independent of its association with a healthy body weight. Physical activity is associated with a reduced risk of colon cancer(8) and of pre-cancerous polyps in the large bowel(9) and consensus is emerging regarding a modest reduced risk of breast cancer among active women compared to those with a sedentary lifestyle.(10, 11)
In this survey, physical activity was measured using the Active Australia guidelines(12) in which ‘sufficient time’ to achieve health benefits was defined as at least 150 minutes of physical activity a week. This is calculated as the sum of the amount of time spent walking plus the amount of time spent in other moderate activity plus the amount of time spent in vigorous activity weighted by two (Table 6.1).
•
••••
Table 6.1 The Active Australia Survey categories for activity timea
weekly act�v�ty t�mea to gain health benefits Category0 minutes SedentaryLess than 150 minutes Insufficient150 minutes or more Sufficienta Total time = time walking + time in other moderate activity + time in vigorous activity x 2
Source: AIHW (2003) The Active Australia Survey: a guide and manual for implementation, analysis and reporting. Canberra: AHIW
phys�cal act�v�ty levels of Queenslanders
Overall, 59.3% of Queenslanders (61.9% of men and 56.7% of women) were classed as having sufficient levels of physical activity (Table 6.2, Appendix E1), comparable to the 2001 National Health Survey that classified 57.0% of Queenslanders as having sufficient levels of physical activity.(7) In total, 40.7% of Queenslanders aged 20 years and older were either sedentary or did not undertake physical activity at a level sufficient to achieve health benefits. Similar proportions of men (16.0%) and women (16.5%) were sedentary and this proportion increased with age, from 14.0% in those aged 20-39 years to 20.0% in those aged 60-75 years. On average, 23.4% of Queenslanders were more active 12 months ago compared with now, 18.4% were less active 12 months ago compared with now, and 58.2% reported that their activity levels were similar now compared with 12 months ago (Appendix E2).

Queensland Cancer Risk Study
Queensland Cancer Fund
13
Queensland Cancer Risk Study
Table 6.2 Percentage of respondents achieving different levels of physical activity during the previous week, by sex and agea
Current level of phys�cal act�v�ty
Total Sex Age group (years)(n=9417) male Female 20-39 40-59 60-75
(n=4696) (n=4722) (n=4017) (n=3812) (n=1588)Sedentary 16.3 16.0 16.5 14.0 17.1 20.0Insufficient 24.4 22.1 26.7 24.0 25.1 23.9Sufficient 59.3 61.9 56.7 62.0 57.7 56.1a Column percentages are standardised to the 2003 Queensland population by age, sex and geographic location.
Note: Sufficient time is defined as 150 minutes per week, using the sum of walking, moderate activity and vigorous activity (weighted by 2)
walk�ng
Overall, 74.3% of Queenslanders walked continuously for at least 10 minutes at least once a week over the last month. Approximately one-quarter (25.6%) of Queenslanders reported that they never walked or walked less than once a week (continuously for at least 10 minutes) over the last month (Appendix E3).
moderate phys�cal act�v�ty (other than walk�ng)
Moderate physical activity as defined in this survey includes exercise such as gentle swimming, social tennis and golf. Most (63.1%) Queenslanders had not undertaken any of these activities in the last month, 11.6% had done so less than once a week and 25.2% one or more times per week in the last month (Appendix E6).
v�gorous phys�cal act�v�ty
v�gorous garden�ng or yard work
Overall, 39.3% of respondents did no vigorous gardening or heavy yard work in the last month, 19.1% undertook vigorous gardening or heavy yard work less than once a week over the last month and 41.6% one or more times per week. Those who participated in vigorous gardening at least one day per week were more likely to be men than women and living outside of major cities (Appendix E8).
v�gorous phys�cal act�v�ty (other than v�gorous garden�ng or yard work)
Other vigorous physical activity (excluding household chores and gardening) includes exercise such as jogging, cycling, aerobics and competitive tennis. In total, 55.5% of the respondents undertook no such vigorous physical activity in the last month, 7.6% undertook such vigorous activity less than once a week in the last month and 36.9% once or more per week. Those who participated in these forms of vigorous activity at least one day per week were more likely to be men than women, younger, and living in major cities rather than regional areas of Queensland (Appendix E10).
Queensland Cancer Fund
V i e r t e l C e n t r e f o r R e s e a r c h i n C a n c e r C o n t r o l
Queensland Cancer Risk Study
14
ChApTEr 7: Body massKey findings
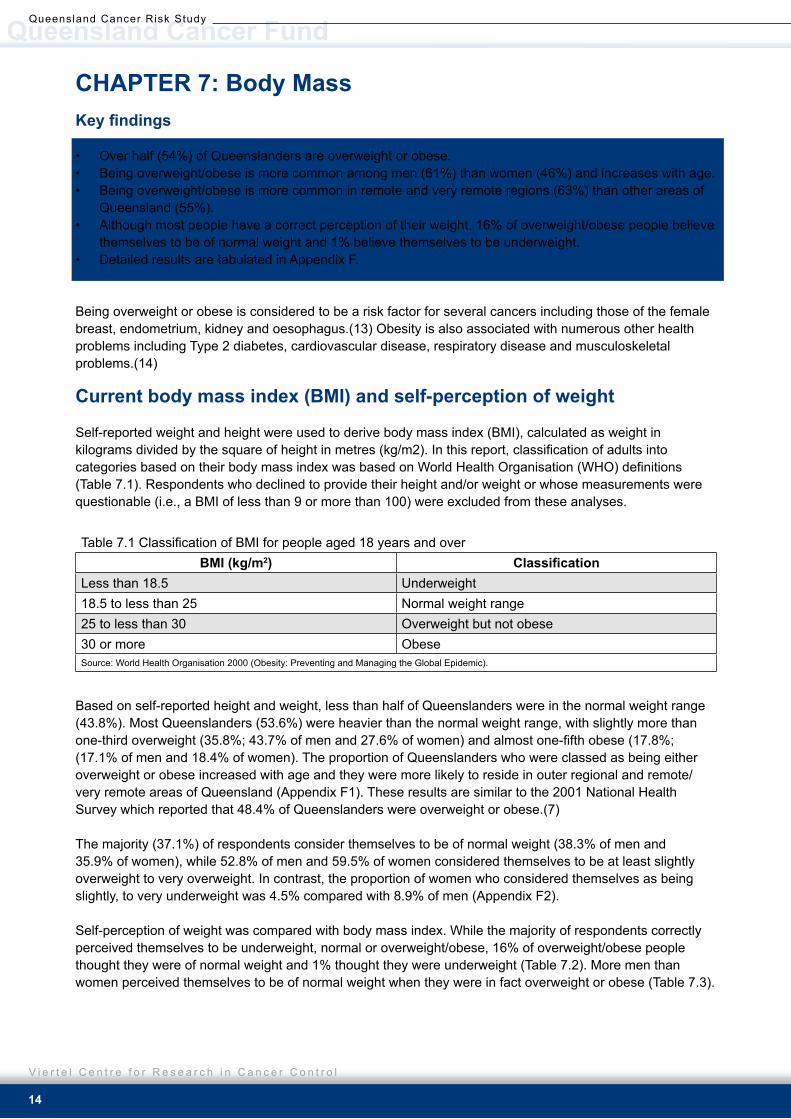
Over half (54%) of Queenslanders are overweight or obese.Being overweight/obese is more common among men (61%) than women (46%) and increases with age.Being overweight/obese is more common in remote and very remote regions (63%) than other areas of Queensland (55%).Although most people have a correct perception of their weight, 16% of overweight/obese people believe themselves to be of normal weight and 1% believe themselves to be underweight.Detailed results are tabulated in Appendix F.
Being overweight or obese is considered to be a risk factor for several cancers including those of the female breast, endometrium, kidney and oesophagus.(13) Obesity is also associated with numerous other health problems including Type 2 diabetes, cardiovascular disease, respiratory disease and musculoskeletal problems.(14)
Current body mass �ndex (Bmi) and self-percept�on of we�ght
Self-reported weight and height were used to derive body mass index (BMI), calculated as weight in kilograms divided by the square of height in metres (kg/m2). In this report, classification of adults into categories based on their body mass index was based on World Health Organisation (WHO) definitions (Table 7.1). Respondents who declined to provide their height and/or weight or whose measurements were questionable (i.e., a BMI of less than 9 or more than 100) were excluded from these analyses.
•••
•
•
Table 7.1 Classification of BMI for people aged 18 years and overBmi (kg/m2) Classification
Less than 18.5 Underweight18.5 to less than 25 Normal weight range25 to less than 30 Overweight but not obese30 or more ObeseSource: World Health Organisation 2000 (Obesity: Preventing and Managing the Global Epidemic).
Based on self-reported height and weight, less than half of Queenslanders were in the normal weight range (43.8%). Most Queenslanders (53.6%) were heavier than the normal weight range, with slightly more than one-third overweight (35.8%; 43.7% of men and 27.6% of women) and almost one-fifth obese (17.8%; (17.1% of men and 18.4% of women). The proportion of Queenslanders who were classed as being either overweight or obese increased with age and they were more likely to reside in outer regional and remote/very remote areas of Queensland (Appendix F1). These results are similar to the 2001 National Health Survey which reported that 48.4% of Queenslanders were overweight or obese.(7)
The majority (37.1%) of respondents consider themselves to be of normal weight (38.3% of men and 35.9% of women), while 52.8% of men and 59.5% of women considered themselves to be at least slightly overweight to very overweight. In contrast, the proportion of women who considered themselves as being slightly, to very underweight was 4.5% compared with 8.9% of men (Appendix F2).
Self-perception of weight was compared with body mass index. While the majority of respondents correctly perceived themselves to be underweight, normal or overweight/obese, 16% of overweight/obese people thought they were of normal weight and 1% thought they were underweight (Table 7.2). More men than women perceived themselves to be of normal weight when they were in fact overweight or obese (Table 7.3).

Queensland Cancer Risk Study
Queensland Cancer Fund
15
Queensland Cancer Risk Study
Table 7.2 Self-perception of weight versus self-reported body mass indexa
Self-reported current body mass �ndex (kg/m2)Self-percept�on underwe�ght (<18.5)
(n=231) %Normal (18.5-24.9)
(n=3964) %Overwe�ght/Obese
(25+)(n=4844) %
Underweight 52.8 11.5 1.0Normal 45.5 62.8 16.3Overweight/Obese 1.7 25.7 82.7a Column percentages are standardised to the 2003 Queensland population by age, sex and geographic location.
Table 7.3 Self-perception of weight versus self-reported body mass index by sexa
Self-reported current body mass �ndex (kg/m2)Sex Self-percept�on underwe�ght % Normal % Overwe�ght/
Obese %(n=32) (n=1766) (n=2793)
Male Underweight 68.8 20.2 1.4Normal 31.3 62.9 22.9Overweight/Obese 0.0 16.9 75.7
(n=198) (n=2198) (n=2051)Female Underweight 50.0 4.5 0.4
Normal 48.0 62.8 7.4Overweight/Obese 2.0 32.7 92.2
a Column percentages are standardised to the 2003 Queensland population by age, sex and geographic location.
Body mass �ndex at 20 years of age and greatest we�ght
The majority of respondents reported measurements equivalent to having had a normal BMI at age 20 years (68.9%). Similar to trends for current BMI, respondents residing in outer regional and remote/very remote areas of Queensland were more likely to report having been overweight or obese at age 20 (Appendix F3).
When reporting on the most they had ever weighed, more than one-third of respondents reported having been overweight (37.1%) and an additional 30.4% reported having been obese (Appendix F4). (This excludes women’s weights while pregnant.)

Queensland Cancer Fund
V i e r t e l C e n t r e f o r R e s e a r c h i n C a n c e r C o n t r o l
Queensland Cancer Risk Study
16
ChApTEr 8: Sun Exposure and Sun protect�onKey findings
70% of Queenslanders have been sunburnt at least once in the past 12 months.Men and people under the age of 40 are more likely to have been sunburnt at least once in the past 12 months.16% of Queenslanders have been SEVERELY sunburnt (defined as pain for two or more days, blistering or peeling of the skin) at least once in the past 12 months.Men and people under the age of 40 are more likely to have been severely sunburnt at least once in the past 12 months.There is little difference between regions either in sunburn or severe sunburn in the past 12 months.Solarium use is still low overall (1.3% of Queenslanders had visited a solarium in the past 12 months) but higher among women, young Queenslanders and those in city areas.Most Queenslanders who visit solaria do not recall receiving the required information and consent forms.Detailed results are tabulated in Appendix G.
Melanoma and non-melanoma skin cancer (NMSC) are associated with exposure to solar ultraviolet radiation (UV). Both long-term sun exposure and sunburn can cause skin damage and increase the risk of developing skin cancer. Skin cancer is the most common type of cancer in Australia,(15) and Queensland has a disproportionately high incidence of NMSC (16) and melanoma.(15)
T�me spent outdoors and sun protect�on
Respondents were asked to consider the time they had spent outdoors on the previous day between the hours of 10am and 2pm - the period of peak UV radiation. If they were outdoors, they were asked what methods of sun protection they had used. For a total of 1,760 respondents, the previous day was a weekend day, usually Sunday. For the remaining 7,660 respondents, the previous day was a weekday. Results are reported here separately for weekend days and weekdays.
weekend sun exposure and sun protect�on
For the 1,760 respondents for whom the day prior to the survey was a weekend day, a total of 45.2% (53.9% of men and 36.1% of women) spent longer than 15 minutes outdoors between 10am and 2pm. Among those who spent at least 15 minutes outdoors during the peak UV period, almost half (49.0%) spent two hours or more outdoors. Men were more likely than women to spend two or more hours outdoors (54.8% versus 40.0%) and respondents under the age of 60 years were more likely to spend two hours or more outdoors than were older respondents (51.3% versus 36.6%). This equates to 22.1% of Queenslanders who spent at least two hours outdoors between 10am and 2pm on the previous weekend day (Appendix G3-G4).
Of all of those who spent longer than 15 minutes outdoors between 10am and 2pm on the previous weekend day (Table 8.1), just over half wore some form of head wear (31.6% wore a hat, 18.3 % wore a cap, 2.1% wore a bike helmet and 1.3% wore a visor). For those who specified that they wore head wear, only 4.3% wore head wear with a flap that covered the neck. For those who specified a hat or cap, 71.3% indicated the headwear had a wide brim, 26.8% a narrow brim and 1.9% no brim or couldn’t remember. Overall, 35.2% of Queenslanders who spent longer than 15 minutes outdoors during peak UV times in the previous weekend day wore a wide brimmed hat (Appendix G5-G9). In addition, just over half of those who spent longer than 15 minutes outdoors wore sunglasses and only one-quarter used a sunscreen.
Respondents were also asked to describe what would happen to their skin if exposed to strong sunshine at the beginning of summer with no protection, with possible responses of ‘burn and not tan afterwards’ (highly sensitive), ‘burn first then tan afterwards’ (moderately sensitive), and ‘tan, not burn’ (not sensitive). The proportion of respondents who spent at least 15 minutes outdoors on a weekend day during the peak UV period increased as sun sensitivity decreased (36.5% of those with highly sensitive skin compared to 45.9% of those with skin that was not sensitive) (Table 8.1). Those respondents who reported highly sensitive skin
••
•
•
••
••

Queensland Cancer Risk Study
Queensland Cancer Fund
17
Queensland Cancer Risk Study
also reported the highest use of nearly all of the sun protective behaviours. Use of headwear with a flap that covered the neck was similar across all skin types.
Table 8.1 Prevalence of sun protective behaviours while outdoors during peak UV times on the WEEKEND by skin typea
Sun protect�ve behav�our
Total(n=787)
%
Sk�n h�ghly sens�t�ve(n=131)
%
Sk�n moderately sens�t�ve(n=420)
%
Sk�n not sens�t�ve(n=236)
%
Outdoors longer than 15 minutes between 10am and 2pm yesterday
45.2 36.5 48.3 45.9
Amount of time outdoors during peak UV times15 mins – less than 1 hour 25.7 26.7 27.1 22.51 hour – less than 2 hours 24.9 26.7 25.0 23.72 hours – less than 4 hours 29.1 28.2 28.3 30.9The entire 4 hours 20.3 18.3 19.5 22.9When outdoors during peak UV timesWore some form of headwear 53.6 67.9 52.1 48.3Wore a hat or cap 50.1 61.7 48.8 46.0Wore a wide-brimmed hat 35.6 48.1 33.6 32.2Wore head wear with a flap that covered the neck 4.3 4.6 4.4 4.7Wore sunglasses 55.3 48.1 56.2 57.6Wore sunscreen 25.5 42.7 24.8 17.4a Column percentages are standardised to the 2003 Queensland population by age, sex and geographic location.
weekday sun exposure and sun protect�on
Overall, weekday sun exposure was lower than weekend sun exposure, although trends were in a similar direction. For the 7,660 respondents for whom the day prior to the survey was a weekday, a total of 36.8% (46.1% of men and 27.7% of women) spent longer than 15 minutes outdoors during 10am to 2pm. Among those who spent at least 15 minutes outdoors during the peak UV period, 40.4% spent two hours or more outdoors. Men were more likely than women to spend two or more hours outdoors (49.8% versus 24.9%) and respondents over the age of 40 years were more likely to spend two hours or more outdoors than were younger respondents (37.1% versus 42.5%). Respondents in outer regional and remote areas were more likely to have been outside during the peak UV period on the previous day, and were more likely to spend two hours or more outdoors than respondents from major cities or inner regional areas. This equates to 14.9% of Queenslanders who spent at least two hours outdoors between 10am and 2pm on the previous weekday (Appendix G11-G12).
Of those who spent longer than 15 minutes outdoors between 10am and 2pm on the previous weekday (Table 8.2), only half wore some form of head wear (32.8% wore a hat, 17.2% wore a cap, 1.4% wore a visor and 1.2% wore a bike helmet). Of those who specified that they wore head wear, only 5.2% wore headwear with a flap that covered the neck. For those who specified a hat or cap, 74.4% indicated the headwear had a wide brim, 23.2% a narrow brim and 2.4% no brim or couldn’t remember. Overall, 37.1% of Queenslanders who spent longer than 15 minutes outdoors during peak UV times in the previous day wore a wide brimmed hat (Appendix G13-G17). Just over half of those outdoors on the previous weekday wore sunglasses and only one-fifth used a sunscreen.
The proportion of respondents who spent at least 15 minutes outdoors on a week day during the peak UV period increased as their skin’s sensitivity to the sun decreased (30.2% of those with highly sensitive skin compared to 43.4% of those with skin which was not sensitive). Those respondents who reported highly sensitive skin also reported the highest use of nearly all of the sun protective behaviours. Both highly

Queensland Cancer Fund
V i e r t e l C e n t r e f o r R e s e a r c h i n C a n c e r C o n t r o l
Queensland Cancer Risk Study
18
and moderately sensitive skin types reported higher use of sunglasses compared to respondents without sensitive skin.
Table 8.2 Prevalence of sun protective behaviours while outdoors during peak UV times on a WEEKDAY by skin typea
Sun protect�ve behav�ourTotal
(n=2813) %h�ghly
sens�t�ve(n=549) %
moderately sens�t�ve
(n=1375) %
Not sens�t�ve(n=889) %
Outdoors longer than 15 minutes between 10am and 2pm yesterday
36.9 30.2 36.5 43.4
Amount of time outdoors during peak UV times15 mins – less than 1 hour 37.6 41.5 38.2 34.21 hour – less than 2 hours 22.0 23.3 21.2 22.62 hours – less than 4 hours 23.6 20.8 25.7 22.2The entire 4 hours 16.7 14.4 14.9 20.9When outdoors during peak UV timesWore headwear 52.6 59.4 52.6 48.5Wore a hat or cap 50.0 56.8 49.5 46.5Wore a wide-brimmed hat/cap 37.1 43.9 36.3 34.2Wore head wear with a flap that covered the neck 5.2 6.9 4.9 4.6Wore sunglasses 56.3 59.2 59.9 48.9Wore sunscreen 21.7 32.1 22.7 13.7a Column percentages are standardised to the 2003 Queensland population by age, sex and geographic location.
T�me outdoors wh�le at work
A total of 69.7% of respondents stated they were in paid employment at the time of the survey. Most of those (63.9%) indicated that they spend very little of their working time outside during daylight hours, almost 18% spend half of their time outdoors whilst at work, and only 13.2% spend most or all of their of their time outdoors whilst at work (Appendix G19).
The amount of time spent outdoors at work varied by gender, age and geographic location. Men more frequently spent all (8.5%) or most (13.6%) of their work time outdoors with over half spending no or very little time outdoors whilst at work. In contrast, few women spent all of the time (0.8%) or most of the time (3.7%) outdoors whilst at work, with approximately three-quarters reporting no or very little of their work time outdoors.
Overall, respondents aged 60-75 years more frequently spent at least half of their time at work outdoors compared to 40-59 and 20-39 year age groups (39.8%, 29.1% and 29.6%, respectively).
Respondents who reported their skin type as not sensitive more frequently spent half to all of their time outdoors at work compared to respondents with more sensitive skin (Table 8.3).

Queensland Cancer Risk Study
Queensland Cancer Fund
19
Queensland Cancer Risk Study
Table 8.3 Amount of time spent outdoors whilst at work by skin typea
work t�me outdoors
Total (n=9364)
%
Sk�n h�ghly sens�t�ve (n=2175)
%
Sk�n moderately sens�t�ve (n=4630)
%
Sk�n not sens�t�ve (n=2559)
%All of the time 4.6 2.9 4.1 7.0Most of the time 8.6 6.1 7.6 12.6Half of the time 17.9 13.5 17.9 21.6Very little of the time 63.9 72.5 65.2 54.2None of the time 5.0 5.0 5.2 4.6a Column percentages are standardised to the 2003 Queensland population by age, sex and geographic location.
Sun-tann�ng and sunburn
Respondents were asked about their sun-tanning behaviour over the past 12 months and whether they had been sunburnt. Overall, 12.1% of Queenslanders over the age of 20 years had made an attempt to get a suntan in the past 12 months. Women, those aged 20-39 years and those living in major city areas of Queensland were more likely to have attempted to get a suntan.
Most Queenslanders (70.1%) were sunburnt once or more in the past 12 months: 18.3% were sunburnt once, 36.4% were sunburnt two to five times and 15.4% were sunburnt six or more times in the past 12 months. More men than women had been sunburnt at least twice over the last 12 months (57.4% and 46.2%, respectively). Those aged 20-39 years were also more likely to have been sunburnt compared to those aged 40-59 or 60-75 (65.7%, 47.7% and 26.3%, respectively). There was little variation across geographic locations (Appendix G20-G21).
Respondents with highly sensitive or moderately sensitive skin were more likely to have been sunburnt two or more times in the last 12 months compared to those without sensitive skin (Table 8.4).
Table 8.4 Number of times sunburnt in the last 12 months by skin typea
T�mes been sunburnt
Total(n=9369)
%
Sk�n h�ghly sens�t�ve (n=2176)
%
Sk�n moderately sens�t�ve (n=4632)
%
Sk�n not sens�t�ve (n=2561)
%None 29.8 28.9 22.1 44.4Once 18.3 16.9 18.4 19.42-5 times 36.5 37.6 42.1 25.46 or more times 15.4 16.6 17.4 10.7a Column percentages are standardised to the 2003 Queensland population by age, sex and geographic location.
Respondents were also asked how many times they had been SEVERELY sunburnt in the past 12 months (i.e., pain for two or more days, blistering or peeling of the skin). Altogether, 15.7% of Queenslanders had been severely sunburnt at least once in the last 12 months. Men and younger people were more likely to have been severely sunburnt. There was little variation across geographic locations (Appendix G22). Respondents who reported their skin type to be highly or moderately sensitive were more likely to report severe sunburns than those with less sensitive skin (Table 8.5).
Table 8.5 Number of times severely sunburnt in the last 12 months by skin typea
T�mes been severely sunburnt
Total(n=9368)
%
Sk�n h�ghly sens�t�ve (n=2176)
%
Sk�n moderately sens�t�ve
(n=4631)%
Sk�n not sens�t�ve (n=2561)
%None 84.3 83.3 81.9 89.5Once 10.3 10.7 11.7 7.72-5 times 4.8 5.3 5.7 2.76 or more times 0.5 0.7 0.6 0.2a Column percentages are standardised to the 2003 Queensland population by age, sex and geographic location.

Queensland Cancer Fund
V i e r t e l C e n t r e f o r R e s e a r c h i n C a n c e r C o n t r o l
Queensland Cancer Risk Study
20
Solar�um use and att�tudes
Overall, 10.7% of respondents had ever visited a solarium. Among those who had ever visited a solarium, 12.0% had visited a solarium in the last 12 months. This equates to 1.3% of Queenslanders aged 20-75 years who reported they had visited a solarium in the last 12 months. The proportion of Queenslanders who visited a solarium in the last 12 months was higher among women than men, younger people, and those residing in major city areas rather than regional or remote areas of Queensland (Appendix G23-24).
Of those respondents who had visited a solarium in the last 12 months, about one third (34.7%) used it regularly (between once a fortnight and twice a week), almost a third (29.2%) used it in concentrated bursts until tanned, and the remaining 36.1% only used it once or twice. Half of those respondents who visited a solarium in the last 12 months used the solarium, on average, less than 15 minutes each time (Appendix G24-G26).
Australian/New Zealand Standard AS/NZS2636:2002 ‘Solaria for cosmetic purposes’ provides a voluntary code of conduct which notes that prior to commencing a course of tanning at a commercial solarium lasting one or more sessions, solarium operators should ensure that a consent form is read, signed and dated by the client. Those who had visited a solarium in the last 12 months were also asked to think about the solarium that they visited most recently and whether they were asked to sign a consent form regarding use of the solarium - specifically, a consent form that listed the risks of UV exposure, which skin types should not use solaria and a section to sign saying that the user had read the information and chose to undergo UV exposure at the establishment. Over half (52.7%) of those who had visited a solarium in the last 12 months did not recall signing such a consent form. The most common places respondents used a sun-tanning unit was at the hairdresser/beautician (48.4%), at a solarium (31.2%), or at the gym (11.7%) (Appendix G27-G28).
Most Queenslanders disagreed (32.2%) or strongly disagreed (22.6%) with the statement: “You can get a safer suntan in the solarium than at the beach” (Appendix G29).

Queensland Cancer Risk Study
Queensland Cancer Fund
21
Queensland Cancer Risk Study
ChApTEr 9: Female reproduct�ve h�story and hormonesKey findings
Among Queensland women aged 20-75 years, 29% have used the mini-pill at some time (8% are currently using the mini-pill), 70% have used other forms of the oral contraceptive pill (18% are currently using the oral contraceptive pill) and 22% have used hormone replacement therapy.There is little difference between regions either in use of the mini-pill or in use of the oral contraceptive pill.Hormone replacement therapy is used much less by women living in remote or very remote regions compared to the rest of Queensland.Detailed results are tabulated in Appendix H.
A woman’s reproductive history and hormone medications can influence her risk of breast, ovarian, endometrial and cervical cancer. Early menarche, late menopause and late age at first birth are known to increase risk of breast cancer while long-term use of hormone replacement therapy also increases risk of breast cancer and endometrial cancer (unless progesterone is used with oestrogen).(6)
hormone med�cat�ons
m�n�-p�ll
The mini-pill is a contraceptive for women. As opposed to other forms of hormonal contraceptives, which combine oestrogen and progestogen, the mini-pill contains only progestogen. Overall, 28.8% of Queensland women have used the mini-pill at some time. Of these women, 64.2% last used it more than five years ago, 20.1% one to five years ago, 7.5% less than 12 months ago, and 8.2% were current users of the mini-pill. On average, women used the mini-pill for a period of 12 months (Appendix H1-H3).
Other forms of the oral contracept�ve p�ll
Over two-thirds (69.9%) of Queensland women have used other forms of the oral contraceptive pill at some time. Of these women, 62.0% last used it more than five years ago, 14.7% one to five years ago, 5.2% less than 12 months ago, and 18.1% were current users of the oral contraceptive pill. On average, women used the oral contraceptive pill for a period of eight years (Appendix H4-H6).
hormone replacement therapy
Approximately one-fifth (21.9%) of Queensland women have used hormone replacement therapy (HRT) at some time. On average, women were 48 years old when they began taking HRT and 54 years old when they last used HRT. On average, women used HRT for a period of four years. HRT was used much less by women living in remote or very remote regions compared to the rest of the State (Appendix H7-H9).
Age at menarche and menopause
On average, Queensland women were 13 years of age at the time of their first menstrual period (Appendix H11). The current menstrual status of Queensland women aged 20-75 years is listed below (Table 9.1, Appendix H12).
•
•
•
•

Queensland Cancer Fund
V i e r t e l C e n t r e f o r R e s e a r c h i n C a n c e r C o n t r o l
Queensland Cancer Risk Study
22
Table 9.1 Current menstrual statusa
N=4713 %Having regular monthly periods 2100 44.6Periods have stopped for >12 months 1756 37.3Having periods but irregularly (skip months) 426 9.0Pregnant or breastfeeding 296 6.3Using deprovera/implants 134 2.8a Column counts and percentages are standardised to the 2003 Queensland population by age, sex and geographic location.
Among those whose periods had stopped for more than 12 months, women were, on average, 48 years old when they stopped completely. Periods ended naturally for the majority of women (51.6%), or after a hysterectomy (39.0%), with a small number of women stating that they ended after treatment for cancer (1%), or for some other reason (8.4%) (Appendix H13-H14).

Queensland Cancer Risk Study
Queensland Cancer Fund
23
Queensland Cancer Risk Study
ChApTEr 10: Screen�ng behav�ourKey findings
The majority of Queenslanders believe that it is important to check for different types of cancer even if there are no symptoms (98% believe it is important to check for cervical cancer, 98% for breast cancer, 80% for colorectal cancer and 96% for skin cancer).The proportions of Queenslanders who report they comply with cancer screening guidelines are: 68% of women aged 20-75 years report they have a Pap smear test at least every two years, 80% of women aged 50-69 years report they have a mammogram at least every two years, 2% of Queenslanders aged 50-75 years report they have a faecal occult blood test (FOBT) at least every two years.In addition, 25% of men aged 50-69 years report they have a PSA test at least every two years and 14% of Queenslanders aged 20-75 years report they have a skin examination every year.The proportion of Queenslanders who can name the screening tests for different types of cancer are: 87% of women aged 20-75 years mentioned “Pap smear” for cervical cancer, 91% of women aged 50-69 years mentioned “mammogram” for breast cancer, 17% of adults aged 50-75 years mentioned “FOBT” (faecal occult blood test) for bowel cancer, 48% of adults aged 50-75 years mentioned “colonoscopy” for bowel cancer.In addition, 51% of men aged 50-69 years mentioned “DRE” (digital rectal examination) for prostate cancer and 50% of men aged 50-69 years mentioned “PSA” (prostate-specific antigen) test for prostate cancer.There was little variation in screening practices across the State. However, no respondents living in remote/very remote areas of Queensland reported undergoing a regular FOBT.Detailed results are tabulated in Appendices I to M.
Cancer screening is the application of a test to an apparently cancer-free group to identify those people likely to have the disease.(17) The aim of cancer screening is to detect early signs of disease. The benefits of screening flow from the fact that early diagnosis (i.e., in the pre-symptomatic phase) allows for prompt and effective treatment (18). Population screening is recommended for cancer of the cervix (i.e., Pap smear test), breast (i.e., mammography), and bowel (i.e., faecal occult blood test). There are currently no population screening programs underway for prostate cancer or melanoma, however, screening for these cancers using the PSA test and whole-body skin examination, respectively, is available in consultation with the patient’s doctor.
For each of the aforementioned cancers, respondents were asked whether they knew of any tests or checks that a doctor could do to see if a person had the cancer in question. It was not possible in this survey to differentiate between people who had the screening test before any symptoms appeared (this is true screening, as defined above), and those people who had the test in order to investigate symptoms of which they were already aware (this is not regarded as screening). Screening behaviour was not verified through medical records.
Cerv�cal cancer screen�ng
The National Cervical Screening Program encourages routine screening with Pap smears every two years for women who have ever been sexually active. Screening should start from the age of 18 to 20 years (or within two years of first sexual intercourse) for women who have no symptoms or history suggestive of cervical cancer.(19)
The presence of some types of human papillomavirus (HPV) increases the risk of developing cervical cancer. It has been estimated that HPV (types 16 and 18) cause 70% of cervical cancers.(20) However, the majority of women with HPV will not go on to develop cervical cancer, which implies that other co-factors need to be present to promote the development of the disease. Other factors associated with a higher risk of developing cervical cancer include early age at first sexual intercourse, a number of sexual partners, a sexual partner who has had a number of partners, and cigarette smoking. Most people will not know that they have the infection, which usually resolves itself within one to two years.(19) Detailed results for cervical screening are tabulated in Appendix I.
•
•
•
•
•
•
•

Queensland Cancer Fund
V i e r t e l C e n t r e f o r R e s e a r c h i n C a n c e r C o n t r o l
Queensland Cancer Risk Study
24
knowledge and bel�efs about cerv�cal cancer screen�ng
Most women (97.8%) aged 20-75 years either strongly agreed (83.1%) or agreed (14.7%) with the statement “It is important to check for cervical cancer even if I have no symptoms” (Appendix I1).
Altogether, 88.3% of women aged 20-75 years said they knew of tests or checks that the doctor could do to see if they had cervical cancer. Of these, 98.3% mentioned the Pap smear test. This equates to 86.8% of women aged 20-75 years who mentioned a Pap smear test. Women also mentioned an internal vaginal examination (3.1%), blood test (2.9%), ThinPrep or PapNet (2.3%), ultrasound (2.2%), biopsy (2.1%), or colposcopy (1.5%) (Appendix I2-I3).
Women were also asked whether or not they knew what causes cervical cancer. Most (65.4%) women aged 20-75 years did not mention a cause. Only a small proportion of women mentioned HPV (5.3%) or infection (3.7%). These women were subsequently asked, “About what percentage of cervical cancers do you think are caused by infection?” Of those who responded, about half said 60% or more of cervical cancers are caused by infection; 78.5% believed that a person would not know whether or not they had this infection without a special test being done. Furthermore, these women believed that if no treatment was given, about 50% of people with this infection (HPV) would get cervical cancer (Appendix I4-I7).
There was reasonable knowledge of the recommended screening interval between Pap smears. The majority of women (85.5%) aged 20-75 years reported knowing the recommended time between Pap smears. Of the women who stated that they knew the recommended time, 80.5% correctly stated up to two years. This equates to 68.8% of Queensland women aged 20 years and older who were able to correctly indicate the recommended screening interval for cervical cancer (Appendix I8-I9).
Cerv�cal cancer screen�ng behav�our
The interviewer described a Pap smear test as a test that “involves a doctor or nurse taking a sample of cells to detect changes of the cervix” and women were then asked whether they had ever had a Pap smear test. The majority (96.6%) of women aged 20-75 years indicated that they had a Pap test (3.3% had not and 0.1% did not know). On average, these women were 21 years old when they had their first Pap test (Appendix I10-I11).
Of those women aged 20-75 years who had had a Pap test, 71.6% had had their last Pap smear test less than two years ago (40.6% less than one year ago and 31.0% one to less than two years ago), 8.8% had their last Pap smear test two to less than three years ago, 5.1% three to less than five years ago and 14.4% of women aged 20-75 years had not had a Pap smear test in the last 5 years. The proportion of women who had their most recent Pap smear test less than two years ago decreased as age increased (Appendix I12).
For the majority of women (84.5%) aged 20-75 years who had had a Pap test, the reason for having their last Pap test was for a general or regular check up. Other reasons included symptoms (5.6%), a family history (1.0%), a personal history of cervical cancer (1.8%) or because their doctor suggested it (7.0%). The women in this last category did not indicate whether this was because of symptoms or just for a regular check (Appendix I13).
In total, 74.1% of women aged 20-75 years who had had a Pap test indicated that they have regular Pap tests and among those, most (95.5%) said that the usual time between their tests was up to two years (4.4% attend more frequently than yearly, 23.2% attend every year and 67.9% attend every two years). This equates to 68.4% of Queensland women aged 20-75 years who reported they have a Pap test at least every two years (Appendix I14-I15).
Breast cancer screen�ng
BreastScreen Queensland provides free biennial breast cancer screening mammograms to women aged 50-69 years. Mammograms are also available to women aged 40-49 years and women over 70 years of age.(21) The Program is aimed at women without symptoms of breast cancer. Women with symptoms that may have
Queensland Cancer Risk Study
Queensland Cancer Fund
25
Queensland Cancer Risk Study
been found through breast self-examination or clinical breast examination are encouraged to seek medical advice for further investigation. This may take the form of a clinical breast exam (if that has not already been performed), imaging tests (i.e., mammography and ultrasound) or non-surgical biopsy (i.e., fine needle aspiration and core biopsy).(22) Detailed results for breast screening are tabulated in Appendix J.
knowledge and bel�efs about breast screen�ng
Most women (98.4%) aged 50-69 years either strongly agreed (84.1%) or agreed (14.3%) with the statement “It is important to check for breast cancer even if I have no symptoms” (Appendix J1).
Altogether, 97.2% of women aged 50-69 years said they knew of tests or checks that the doctor could do to see if they had breast cancer. Of these, 93.8% mentioned a mammogram. This equates to 91.2% of women aged 50-69 years who mentioned a mammogram. Women also mentioned breast self-examination (61.8%), clinical breast examination (29.0%), ultrasound (15.5%), biopsy (3.2%), CT scan (1.9%), or blood test (1.3%) (Appendix J2-J3).
There was reasonable knowledge of the recommended screening interval between mammograms. The majority of women (85.5%) aged 50-69 years reported knowing the recommended time between mammograms. Of the women who stated that they knew the recommended time, 87.1% correctly stated up to two years. This equates to 74.5% of Queensland women aged 50-69 years who were able to correctly indicate the recommended screening interval for breast cancer (Appendix J4-J5).
Breast cancer screen�ng behav�our
The interviewer described a mammogram as “an x-ray taken of the breast by a machine that presses against the breast while the picture is taken” and women were then asked whether they had ever had a mammogram. The majority (93.3%) of women aged 50-69 years indicated that they had had a mammogram. On average, these women were 45 years old when they had their first mammogram (Appendix J6-J7).
Of those women aged 50-69 years who had had a mammogram, 86.4% had their last mammogram less than two years ago (51.0% less than one year ago and 35.4% one to less than two years ago), 5.8% had their last mammogram two to less than three years ago, 2.7% three to less than five years ago and 4.8% of women aged 50-69 years had not had a mammogram in the last five years (Appendix J8).
For the majority of women (83.4%) aged 50-69 years who had had a mammogram, the reason for having their last mammogram was for a general or regular check up. Other reasons included symptoms (6.7%), a family history (3.4%), a personal history of breast cancer (3.0%) or because their doctor suggested it (3.5%). The women in this last category did not indicate whether this was because of symptoms or just for a regular check. Women aged 50-69 years attended for their last mammogram at a free public breast screening clinic (59.9%), a free mobile or relocatable screening service (13.0%), a private breast clinic (11.3%), a private radiologist (7.2%), or a free public service at a private facility (8.0%) (Appendix J9-J10).
In total, 88.2% of women aged 50-69 years who had had a mammogram indicated that they have regular mammograms and among those, most (97.2%) said that the usual time between their tests was up to two years (1.0% attend more frequently than yearly, 23.8% attend every year and 72.4% attend every two years). This equates to 79.9% of Queensland women aged 50-69 years who reported they have a mammogram at least every two years (Appendix J11-J12).
Women aged 40-49 years and women aged 70 and over are also able to access free breast cancer screening services. For women aged 40-49 years, 63.1% had had a mammogram, of which 60.3% said that they have regular mammograms. Of those women, most (97.3%) indicated that the usual time between their tests was up to two years (2.7% attend more frequently than yearly, 25.9% attend every year and 68.7% attend every two years). For women aged 70-75 years, 91.6% had had a mammogram, of which 79.6% said that they have regular mammograms. Of those women, most (96.1%) indicated that the usual time between their tests was up to two years (0.6% attend more frequently than yearly, 16.7% attend every year and 78.8% attend every two years). This equates to 37.2% of women aged 40-49 years, and 70.1% of women aged 70-75 years who reported they have a mammogram at least every two years.

Queensland Cancer Fund
V i e r t e l C e n t r e f o r R e s e a r c h i n C a n c e r C o n t r o l
Queensland Cancer Risk Study
26
Colorectal cancer screen�ng
Regular screening for colorectal cancer is recommended by the National Health and Medical Research Council and the Australian Government has recently announced the introduction of a national colorectal cancer screening program. It is currently recommended that people over the age of 50 and at average risk of colorectal cancer have FOBT every two years and consider flexible sigmoidoscopy every five years.(23) Detailed results for colorectal screening are tabulated in Appendix K.
knowledge and bel�efs about colorectal cancer screen�ng
Most Queenslanders (81.3%) aged 50-75 years either strongly agreed (42.8%) or agreed (38.5%) with the statement “It is important to check for bowel cancer even if I have no symptoms” (Appendix K1).
Altogether, 62.2% of respondents aged 50-75 years said that they knew of tests or checks that the doctor could do to see if they had bowel cancer. Of these, 28.0% mentioned FOBT and 76.5% mentioned a colonoscopy. This equates to 17.4% and 47.6% of respondents aged 50-75 years who mentioned FOBT or a colonoscopy, respectively. Respondents also mentioned looking for blood in bowel motions (9.1%), blood test (5.6%), barium enema (5.9%), DRE (4.4%), imaging tests (2.8%), endoscopy or gastroscopy (3.2%), sigmoidoscopy (1.4%), or virtual colonoscopy (1.8%) (Appendix K2-K3).
Fewer 30-49 year olds than 50-75 year olds mentioned FOBT as a test for bowel cancer (19.6% versus 28.0, respectively). Fewer men than women stated colonoscopy as a test for bowel cancer (64.0% versus 82.9%, respectively). Colonoscopy was also mentioned more frequently by respondents in major city and inner regional areas (79.4% and 73.8%) compared with respondents living in outer regional and remote/very remote areas (68.5% and 66.7%) of Queensland.
Colorectal cancer screen�ng behav�our
The interviewer described a faecal occult blood test (FOBT) as “a test that is done at home, usually by smearing small samples of bowel motions on cards and then sending to a laboratory” and respondents were then asked whether they had ever had a faecal occult blood test. Only 15.2% of respondents aged 50-75 years indicated that they had had a FOBT (84.4% had not and 0.4% didn’t know). On average, these respondents were 54 years old when they had their first FOBT (Appendix K4-K5).
Of those aged 50-75 years who had had a FOBT, 42.0% had their last FOBT less than two years ago (25.8% less than one year ago and 16.2% one to less than two years ago), 11.6% had their last FOBT two to less than three years ago, 11.3% three to less than five years ago and 34.5% of respondents aged 50-75 years had not had a FOBT in the last five years (Appendix K6).
For the majority of respondents (54.6%) aged 50-75 years who had had a FOBT, the reason for having their last FOBT was for a general or regular check up. Other reasons included symptoms (23.9%), a family history (5.1%), a personal history of bowel cancer (0.4%) or because their doctor suggested it (16.0%). The respondents in this last category did not indicate whether this was because of symptoms or just for a regular check (Appendix K7).
In total, 17.0% of respondents aged 50-75 years who had had a FOBT indicated that they have regular FOBT tests and among these, most (94.5%) said that the usual time between their tests was up to two years (7.8% had a test more frequently than yearly, 61.1% had a test every year and 25.6% had a test every two years). This equates to 2.5% of Queenslanders aged 50-75 years who reported they have FOBT testing at least every two years. No respondents living in remote/very remote areas of Queensland reported having regular FOBT tests (Appendix K8-K9).
FOBT testing is not recommended for people aged less than 50 years old. However, for those aged 30-49 years, 3.4% had an FOBT, of which 10.1% said that they have regular FOBT testing. Of those people, all indicated that the usual time between their tests was up to two years (50% attend every year and 50% attend every two years).

Queensland Cancer Risk Study
Queensland Cancer Fund
27
Queensland Cancer Risk Study
The interviewer described a colonoscopy as “when a doctor uses a flexible fibre-optic device to examine the whole length of your bowel; patients are usually sedated for this” and respondents were then asked whether they had ever had a colonoscopy. Overall, 14.4% of respondents aged 30-49 years, and 37.8% of respondents aged 50-75 years indicated that they had had a colonoscopy. The proportion of respondents who have ever had a colonoscopy decreased the further away respondents lived from major cities (Appendix K10).
Of those respondents aged 50-75 years who had had a colonoscopy, 70.6% had their last colonoscopy less than five years ago (19.7% less than one year ago, 18.2% one to less than two years ago, 14.7% two to less than three years ago and 18.0% three to less than five years ago) and 29.3% had not had a colonoscopy in the last five years (Appendix K11).
Of those respondents aged 30-49 years who had had a colonoscopy, 63.1% had their last colonoscopy less than five years ago (16.0% less than one year ago, 14.8% one to less than two years ago, 14.5% two to less than three years ago, 17.7% three to less than five years ago) and 36.5% had not had a colonoscopy in the last five years (Appendix K11).
Those in major city, inner regional and outer regional areas were more likely to have had their last colonoscopy less than five years ago compared with those living in remote/very remote areas of Queensland.
prostate cancer screen�ng
The two most common screening tests for prostate cancer are the prostate-specific antigen (PSA) test and digital rectal examination (DRE). The PSA test is a blood test that checks for elevated levels of prostate-specific antigen, the protein secreted almost exclusively by a normal prostate gland to help nourish sperm. An elevated PSA level indicates an abnormal finding but is not diagnostic of prostate cancer. A DRE is an exam in which a doctor places a gloved finger into the back passage to feel the prostate gland. At present, there is no population-based screening program in Queensland for prostate cancer and men with symptoms are encouraged to seek medical advice for further investigation.(24) Such screening would likely be most beneficial for men aged 50-69 years. Detailed results for prostate screening are tabulated in Appendix L.
knowledge and bel�efs about prostate cancer screen�ng
Altogether, 75.0% of men aged 50-69 years said that they knew of tests or checks that the doctor could do to see if they had prostate cancer. Of these, 68.1% mentioned a DRE and 66.9% mentioned a PSA/blood test. This equates to 51.1% and 50.1% of men aged 50-69 years who mentioned a DRE or PSA test, respectively. Men also mentioned imaging tests such as ultrasound, MRI, x-ray or CT scan (4.6%), transrectal ultrasound (3.6%), biopsy (2.9%), colonoscopy (2.3%), urine test (1.4%) physical examination (1.9%), cystoscopy or urethroscopy (0.9%), or faecal occult blood test (0.4%) (Appendix L1-L2).
prostate cancer screen�ng behav�our
The interviewer described a PSA test as “a blood test used to check for prostate cancer” and men were then asked whether they had ever had a PSA test. Approximately half (50.6%) of men aged 50-69 years indicated that they had had a PSA test (40.2% had not and 9.2% didn’t know). On average, these men were 54 years old when they had their first PSA test.
Of those men aged 50-69 years who had had a PSA test, 76.6% had their last PSA test less than two years ago (58.1% less than one year ago and 18.5% one to less than two years ago), 9.1% had their last PSA test two to less than three years ago, 7.1% had a PSA test three to less than five years ago and 6.2% of men aged 50-69 years had not had a PSA test in the last five years (Appendix L3-L5).
For the majority of men (68.3%) aged 50-69 years who had had a PSA test, the reason for having their last PSA test was for a general or regular check up. Other reasons included symptoms (12.4%), a family history (3.7%), a personal history of prostate cancer (2.7%) or because their doctor suggested it (12.9%). The men in this last category did not indicate whether this was because of symptoms or just for a regular check (Appendix L6).

Queensland Cancer Fund
V i e r t e l C e n t r e f o r R e s e a r c h i n C a n c e r C o n t r o l
Queensland Cancer Risk Study
28
In total 52.0% of the men aged 50-69 years who had had a PSA test indicated that they have regular PSA tests and among these, most (97.1%) said that the usual time between their tests was up to two years (25.1% have a test more frequently than yearly, 53.1% have a test every year and 18.9% have a test every two years). This equates to 25.5% of men aged 50-69 years who reported they have a PSA test at least every two years (Appendix L7-L8).
Among men aged 40-49 years, 17.0% had had a PSA test, of which 33.7% said that they have regular PSA tests. Of those men, most (86.0%) indicated that the usual time between their tests was up to two years (1.8% have a test more frequently than yearly, 61.4% have a test every year and 22.8% have a test every two years).
For men aged 70-75 years, 64.5% had had a PSA test, of which 61.1% said that they have regular PSA tests. Of those men, most (96.7%) indicated that the usual time between their tests was up to two years (37.8% have a test more frequently than yearly, 48.9% have a test every year and 10.0% have a test every two years).
The interviewer described a digital rectal examination (DRE) as “an exam in which a doctor places a gloved finger into the back passage to feel the prostate gland” and men were then asked whether they had ever had a DRE. Over half (57.4%) of men aged 50-69 years indicated that they had had a DRE (42.1% had not and 0.5% didn’t know). On average, these men were 50 years old when they had their first DRE.
Of those men aged 50-69 years who had had a DRE, 44.3% had their last DRE less than two years ago (25.0% less than one year ago and 19.3% one to less than two years ago), 11.4% had their last DRE two to less than three years ago, 12.1% had a DRE three to less than five years ago and 31.6% of men aged 50-69 years had not had a DRE in the last five years (Appendix L9-L11). Sk�n screen�ng
Queensland has the highest incidence of melanoma in the world.(25) Screening of the skin by whole-body skin examination by a doctor has the potential to improve early detection of melanoma and reduce mortality, although conclusive evidence of this is lacking. Whole- or part-body skin examination, largely through general practice, plays an important role in the diagnosis of skin cancer in Queensland. In recent years, skin cancer clinics, usually staffed by general practitioners with a special interest in skin cancer, have played an increasing role in the diagnosis and management of skin cancer in this State. Detailed results for skin screening are tabulated in Appendix M.
Bel�efs about sk�n screen�ng
Most respondents (95.6%) either strongly agreed (72.1%) or agreed (23.5%) with the statement “It is important to check for skin cancer even if I have no symptoms” (Appendix M1).
Sk�n screen�ng behav�our
The interviewer described a skin check as “the doctor deliberately checking the skin on all or nearly all of your whole body for early signs of skin cancer, not just looking at a particular spot, such as a mole,” and respondents were then asked whether they had ever had such a skin check. Altogether, 40.4% of respondents aged 20-75 years indicated that they had had such a skin check. On average, these respondents were 38 years old when they had their first skin check (Appendix M2-M3).
Of those aged 20-75 years who had had a skin check, 48.9% had their last skin check less than one year ago, 21.3% had their last skin check one to less than two years ago, 16.2% had a skin check two to less than five years ago, and 13.3% of respondents aged 20-75 years had not had a skin check in the last five years (Appendix M4).
For the majority of respondents (56.4%) aged 20-75 years who had had a skin check, the reason for having their last skin check was for a general or regular check. Other reasons included symptoms (30.3%), a family

Queensland Cancer Risk Study
Queensland Cancer Fund
29
Queensland Cancer Risk Study
history (4.7%), or a personal history of skin cancer (8.6%). Respondents aged 20-75 years attended for their last skin check at a GP’s surgery (44.9%), a skin clinic (37.4%), a dermatologist (12.0%), or a hospital outpatient clinic (1.6%) (Appendix M5-M6).
In total, 45.6% of respondents aged 20-75 years who had had a skin check indicated that they have regular skin checks and among those, most (76.9%) said that the usual time between their skin checks was up to 12 months. This equates to 14.2% of Queenslanders aged 20-75 years who reported they have a skin check at least every year (Appendix M7-M8).
Among those who have regular skin checks, a higher proportion of men than women have regular skin checks at least every 12 months (80.9% versus 73.1%). The proportion of respondents having skin checks at least every 12 months increased with age.

Queensland Cancer Fund
V i e r t e l C e n t r e f o r R e s e a r c h i n C a n c e r C o n t r o l
Queensland Cancer Risk Study
30
ChApTEr 11: Exper�ence of cancerKey findings
One in six respondents (16%) had had a diagnosis of cancer. About half of these cancers were non-melanoma skin cancer. Excluding non-melanoma skin cancer, 8% of respondents had had a diagnosis of cancer.41% of respondents stated that one or more close blood relatives (parents, children, brothers, sisters) had had a diagnosis of cancer.85% of respondents personally know someone who has had cancer.Detailed results are tabulated in Appendix N.
Most of the risk factors in the previous chapters have been behavioural factors which are potentially modifiable. Other factors which may increase the risk of cancer include having had a previous diagnosis of cancer and having a family history of cancer.(26) It is possible that having experienced cancer, either personally or through knowledge of a relative or friend with cancer, a person may be more receptive to health messages in regard to reducing their cancer risk and following cancer screening guidelines.
personal cancer h�story
Overall, 15.8% of respondents indicated they had had a diagnosis of cancer. Of those, the majority (86.7%) had been diagnosed with one type of cancer, 11.8% had been diagnosed with two types of cancer, 1.2% had had three types and 0.4% had had four different types of cancer diagnosed (Appendix N1, N3). Reported cancers were not verified through medical records.
Overall, the most prevalent cancer reported was non-melanoma skin cancer for both men (8.8%) and women (7.3%) with a total of 8.0% of respondents reporting this diagnosis (Table 11.1, Appendix I4). Excluding non-melanoma skin cancer, a total of 8.9% respondents had had a diagnosis of cancer, the most common of which were melanoma (3.4% of respondents) with a mean age at diagnosis of 42.3 years and colorectal cancer (0.6% of respondents) with a mean age at diagnosis of 54.7 years. Excluding non-melanoma skin cancer, the mean age at first cancer diagnosis was 43.2 years of age. As expected, prevalence of cancer increased with age, with 17.8% of the oldest age group reporting a history of cancer (Appendix N4-N5). Information from the Queensland Cancer Registry (unpublished) suggest that the total prevalence of cancer, excluding non-melanoma skin cancer, in the Queensland population is approximately 4.5%, indicating that our sample had a higher prevalence of cancer than the population at large.
Respondents who had been diagnosed with cancer were asked about their use of complementary therapies or unproven methods to help treat the cancer. Less than 1% of cancer survivors reported they had used complementary therapies (e.g., acupuncture, massage) to help treat their cancer. A total of 8.5% reported they had used unproven methods (Appendix N6).
Fam�ly cancer h�story
Overall, 40.7% of respondents reported that one or more of their CLOSE blood relatives (parents, children, brothers, or sisters) had had a diagnosis of cancer. Of these, just over half (51.3%) were diagnosed before the age of 55 years (Appendix N7-N8).
When asked about EXTENDED blood relatives, 52.5% of respondents reported that at least one extended blood relative had been diagnosed with cancer. Extended family included only those who were related by blood and not relatives by marriage (Appendix N9).
Respondents were also asked if anyone else they knew personally had ever had cancer. Overall, 84.6% of respondents personally knew someone who had had cancer (Appendix N10).
•
•
••

Queensland Cancer Risk Study
Queensland Cancer Fund
31
Queensland Cancer Risk Study
Table 11.1 Percentage of respondents who reported a diagnosis of cancera b
Type of cancer d�agnosedTotal persons
(n=9419)%
males(n=4697)
%
Females(n=4722)
%No cancer diagnosis 84.2 85.3 83.1Non-melanoma skin cancer (not sunspots) 8.0 8.8 7.3Melanoma 3.4 3.9 2.9Colorectal (colon/rectum/bowel) 0.6 0.8 0.5Lymphoma (including Non-Hodgkin’s) 0.3 0.3 0.3Bladder/Kidney 0.2 0.3 0.1Lung (including trachea, pleura and bronchus) 0.1 0.1 0.1Stomach 0.1 0.1 0.1Leukaemia 0.1 0.1 0.1Other 0.3 0.2 0.5Male cancers Prostate 0.5 1.1 - Testicular 0.1 0.2 -
Female cancers Cervical 1.5 - 3.1 Breast 1.2 - 2.4 Ovarian 0.3 - 0.5 Uterine or endometrial 0.2 - 0.3a Column percentages are standardised to the 2003 Queensland population by age, sex and geographic location.b Does not add up to 100% as question allows for multiple responses.

Queensland Cancer Fund
V i e r t e l C e n t r e f o r R e s e a r c h i n C a n c e r C o n t r o l
Queensland Cancer Risk Study
32
ChApTEr 12: knowledge, att�tudes and percept�ons
Key findings
Just over half (54%) of Queenslanders are at least moderately confident that there will be cures for the most common forms of cancer within their lifetimes.Most Queenslanders (97%) believe that treating cancer in the early stages increases a person’s chance of survival.Most Queenslanders (98%) are able to name one or more actions they can take to reduce their risk of getting cancer with the most common being “protection from sun exposure” and “eating well”.Almost one quarter (24%) of Queenslanders who had not had cancer thought they had a “high” to “certain” risk of getting skin cancer and 14.6% thought they had a high or certain risk of getting a cancer other than skin cancer.Detailed results are tabulated in Appendix O.
There are many factors that influence whether people engage in behaviours that reduce their risk of cancer and these factors include people’s knowledge about cancer and cancer risk, their attitudes to cancer and their perception of whether they can influence their own risk. Respondents were asked about the chances that there will be cures for cancers in the future, how they could reduce their risk of getting cancer and their chances of getting cancer.
Bel�ef �n a cure and treatment for cancer
This set of questions dealt with beliefs about a cure and treatment regarding all types of cancer. They were not questions about factual knowledge and as such, there were no right or wrong answers. When people were asked how confident they were that there will be cures for the most common forms of cancer within their lifetimes, 15.2% were not at all confident, 29.8% were slightly confident, 38.8% were moderately confident, 12.3% were very confident, 3.3% were extremely confident and 0.6% didn’t know (Appendix O1).
Most Queenslanders (97.0%) agree that “treating cancer in the early stages increases a person’s chance of survival” (Appendix O2).
Bel�ef �n reduc�ng r�sk of cancer
When asked what people in general could do to reduce their risk of getting cancer, most respondents (97.7%) were able to name one or more actions. The top ten actions are highlighted in Table 12.1 (Appendix O3). These included protection from the sun, eating well, having regular check-ups and not smoking. Not everyone believed that they themselves could reduce their risk of cancer in the future by their own actions or behaviours. In total, 3.8% of respondents believed that they themselves could not reduce their risk at all by their own actions, 22.3% believed they could slightly reduce their risk, 38.4% believed they could moderately reduce their risk, 30.1% believed they could greatly reduce their risk, 2.4% believed they could completely eliminate their risk, and 2.9% didn’t know (Appendix O4).
•
•
•
•
•
Table 12.1 What Queenslanders believe people can do to reduce their risk of cancera
Act�onb N=9418 %Sun protection 6361 67.5Eat well 4723 50.1Regular check-ups 4111 43.6Not smoke 3266 34.7Be active/keep a healthy weight 2987 31.7Eat more fruit/vegetables/cereals 2538 26.9Limit alcohol 1227 13.0Reduce stress 780 8.3Avoid chemicals/pesticides 689 7.3Avoid passive smoking 160 1.7a Column percentages are standardised to the 2003 Queensland population by age, sex and geographic location.b Does not add up to 100% as question allows for multiple responses.

Queensland Cancer Risk Study
Queensland Cancer Fund
33
Queensland Cancer Risk Study
percept�on of r�sk
Respondents who had never been diagnosed with cancer were asked about their own risk of getting cancer. This set of questions dealt with the individual’s perceived chances of getting cancer other than skin cancer during their lifetime, chances of getting skin cancer during their lifetime, and comparing these chances with other men/women their own age and race. Again, there were no right or wrong answers to these questions.
Almost one quarter (23.9%) of respondents who had not had cancer thought they had a “high” to “certain” risk of getting skin cancer and 14.6% thought they had a high or certain risk of getting a cancer other than skin cancer. Overall, 21.5% of respondents who had not had cancer indicated they had an above average to much above average risk of getting skin cancer compared with other men/women their age and race, while 12.4% indicated the same risk for cancer other than skin cancer (Appendix O5-O8).

Queensland Cancer Fund
V i e r t e l C e n t r e f o r R e s e a r c h i n C a n c e r C o n t r o l
Queensland Cancer Risk Study
34
ChApTEr 13: d�scuss�onThe Queensland Cancer Risk Study is the first comprehensive, state-wide survey of cancer risk factors, cancer screening activity, and knowledge and attitudes towards cancer in Queensland. This report summarises information from 9,419 people interviewed from across all areas of Queensland.
Cancer r�sk factors
The prevalence of risk factors for cancer among Queensland adults is high. This is especially so for risk factors for which educational efforts are only just beginning. For example, 88% of Queensland adults do not eat enough vegetables and 54% do not eat enough fruit, 40% of Queensland adults are physically inactive, 54% are overweight or obese and 63% of regular drinkers consume excessive amounts of alcohol. In contrast, the prevalence of smoking, a risk factor for which programs have been in place for many years, is reducing. Excessive sun exposure is still problematic with 70% of Queenslanders being sunburnt at least once in the past 12 months despite SunSmart campaigns having been conducted in Queensland over many years.
Many cancer risk behaviours are more prevalent among men, those aged 20-39 years and those living in remote/very remote areas of Queensland. When compared to women, men are more likely to smoke on a daily basis, drink alcohol regularly, drink alcohol in excessive quantities, eat less than two serves of fruit a day, eat less than five serves of vegetables a day, be overweight or obese and to have been sunburnt or severely sunburnt at least once in the past 12 months. In contrast, women are more likely than men to be inactive and to use solaria.
When compared to older age groups, those aged 20-39 years are more likely to smoke on a daily basis, drink alcohol regularly, drink alcohol in excessive quantities, eat less than two serves of fruit a day, eat less than five serves of vegetables a day, to have been sunburnt or severely sunburnt at least once in the past 12 months and use solaria. In contrast, those aged over 40 years of age are more likely than younger people to be less active and more likely to be overweight or obese.
When compared to people living in other areas of Queensland, those from remote/very remote areas of Queensland are more likely to smoke on a daily basis, drink alcohol in excessive quantities, eat less than two serves of fruit a day and be overweight or obese. In contrast, those living in city areas are more likely than people living in other areas of Queensland to eat less than five serves of vegetables a day and use solaria.
Awareness of the Dietary Guidelines for fruit and vegetable intake is poor across the population and a low proportion of Queensland adults meet the recommended intake of two serves of fruit a day and five serves of vegetables a day.
There was a high experience of cancer in our study sample. A substantial number believed they are at high risk of cancer but also recognised that through lifestyle changes, they could reduce their risk of getting cancer. The results presented here indicate that for a significant proportion of the population, this is not translating into behaviour conducive to cancer risk reduction. There is considerable potential to use this information for cancer prevention messages.
Cancer screen�ng, knowledge and att�tudes
National population screening programs are well-established for cancer of the cervix (i.e., Pap smear test) and breast (i.e., mammography). Screening for bowel cancer (i.e., FOBT testing) is recommended and introduction of a national population screening program is in progress. There are currently no population screening programs underway for prostate cancer or melanoma, however, screening for these cancers using the PSA test and whole-body skin examination, respectively, is available on demand in consultation with the patient’s doctor.

Queensland Cancer Risk Study
Queensland Cancer Fund
35
Queensland Cancer Risk Study
The majority of Queenslanders believe that it is important to check for different types of cancer even if there are no symptoms. It is encouraging to see that knowledge of the available tests for cancer screening and the recommended intervals between screening for both cervical and breast cancer is quite high among women. Knowledge about screening for bowel cancer is lower but would be expected to increase as the relatively recent national bowel cancer screening program is rolled out.
Most Queenslanders believe that treating cancer in the early stages increases a person’s chance of survival. However, knowledge and beliefs surrounding cancer screening does not always translate into optimal behaviour.
A high proportion of women reported complying with cancer screening guidelines for having a Pap smear and mammogram every two years. However, our sample had a higher level of education than the general population and the results most likely over-represent the true proportion of Queensland women adhering to these recommendations. Consequently, there are still significant numbers of women in the target groups who do not have Pap smears and mammograms every two years.
The proportion of people who reported complying with cancer screening guidelines for FOBT testing was very low, probably because Australia’s bowel cancer screening program is only now being rolled out. On the other hand, while there are currently no population screening programs underway for prostate cancer or melanoma, over one quarter of men aged 50-69 years reported having a PSA test at least every two years and a significant proportion of the population reported having annual whole-body skin checks by their doctor. These levels of screening are surprisingly high for procedures for which there is, as yet, no conclusive evidence of benefit.
It has previously been believed that people living in remote/very remote areas of Queensland may be disadvantaged in their access to cancer screening services. However, there was little variation in reported screening practices across the State.
It should be noted that these are cross-sectional analyses and therefore inferences must be made with caution. One of the main limitations of this study is the potential for bias and the difficulty in obtaining a truly representative sample given that participation in the survey was, of course, entirely voluntary. Comparison of the weighted survey sample distribution with the Australian Bureau of Statistics Queensland population suggested the survey respondents tended to have a higher level of education and were more likely to be married. Based on estimates from the Queensland Cancer Registry, the respondents also had more experience with cancer than the Queensland population (i.e., personal or family history). However, it would be expected that with a relatively higher level of education and an over-representation of cancer experience in the sample, the results presented here are, if anything, likely to be conservative, i.e. they are likely to underestimate the true extent of cancer risk behaviours in the Queensland population and to overestimate compliance with cancer screening guidelines.

Queensland Cancer Fund
V i e r t e l C e n t r e f o r R e s e a r c h i n C a n c e r C o n t r o l
Queensland Cancer Risk Study
36
Conclus�ons
Overall, these results suggest that for the majority of Queensland adults, there is scope for improvement in regard to cancer risk behaviours and knowledge. Continuing efforts are warranted to improve behavioural risk factors for the whole of the Queensland population. In addition, this study has identified a number of demographic groups with multiple cancer risk behaviours, namely, men, younger Queenslanders and residents of remote/very remote areas. This information will be invaluable in informing strategies and the design of appropriate messages to target these high risk groups. The Queensland Cancer Fund Community Services Department is currently developing specific program recommendations that will be informed by these data.
This report describes only a small portion of the information provided by the Queensland Cancer Risk Study. The data-set comprising Module 2, the results of the self-administered questionnaire, includes a wealth of information and avenues for further inquiry into the common reasons for engaging in cancer risk behaviours and for failing to follow cancer screening guidelines. Such information will help to further refine efforts to reach at-risk Queenslanders with cancer control messages and programs.
In conclusion, the Queensland Cancer Risk Study provides the most comprehensive picture to date of the behaviour and attitudes of the State’s population in regard to prevention, early detection and screening for cancer. These results will inform the cancer control initiatives of the Queensland Cancer Fund and other stakeholders and will provide a platform to help frame and direct future cancer prevention and early detection programs. Importantly, these results will also provide a benchmark against which to monitor progress in improving knowledge, attitudes and behaviour with the goal of limiting the incidence and impact of cancer in the population.

Queensland Cancer Risk Study
Queensland Cancer Fund
37
Queensland Cancer Risk Study
rEFErENCES1. Stewart BW, Kleihues P (Eds.) (2003). World Health Organisation, International Agency for Research
on Cancer: World Cancer Report. Lyon: IARCPress2. Australian Institute of Health and Welfare (AIHW) (2002) 2001 National Drug Strategy Household
Survey: Detailed Findings. 3. Pierce J (2005) Conducting a Smoking Prevalence Survey, 2005, from
http://factsheets.globalink.org/en/prevalence.shtml4. National Health and Medical Research Council (NHMRC) (2001) Australian Alcohol Guidelines:
Health Risks and Benefits. Canberra: NHMRC5. National Health and Medical Research Council (NHMRC) (2003) Dietary Guidelines for Australian
Adults. Canberra: NHMRC6. World Health Organisation (WHO) (2003) World Cancer Report. Lyon: IARC Press7. Australian Bureau of Statistics (ABS) (2002) 2001 National Health Survey, Summary of Results,
Australia. Canberra: ABS8. Colditz G, Cannuscio C, Frazier A (1997) Physical activity, exercise, and physical fitness: definitions
and distinctions for health-related research. Public Health Report 100: 126-1319. Neugut A, Terry M, Hocking G, Mosca L, Garbowski G, Forde K (1996) Leisure and occupational
physical activity and risk of colorectal adenomatous polyps. International Journal of Cancer 68: 744-748
10. Rockhill B, Willett W, Hunter D, Manson J, Hankinson S, Colditz G (1999) A prospective study of recreational physical activity and breast cancer risk. Archives of Internal Medicine 159(19): 2290-2296
11. Thune I, Brenn T, Lund E, Gaard M (1997) Physical activity and risk of breast cancer. The New England Journal of Medicine 336(18): 1269-1275
12. Australian Institute of Health and Welfare (AIHW) (2003) The Active Australia Survey: a guide and manual for implementation, analysis and reporting. Canberra: AIHW
13. Calle E, Thun M (2004) Obesity and cancer. Oncogene 23(38): 6365-637814. World Health Organisation (2000) Obesity: Preventing and Managing the Global Epidemic. Report of
a WHO Consultation. WHO Technical Report Series 894. Geneva: WHO15. Australian Institute of Health and Welfare (AIHW), Australasian Association of Cancer Registries
(AACR) (2003) Cancer in Australia 2000. AIHW cat. no. CAN 18. Canberra: AIHW16. National Cancer Control Initiative (2003) The 2002 National Non-melanoma Skin Cancer Survey.
Melbourne: NCCI17. Moss S (1996) General Principles of Cancer Screening. In: Chamberlain J, Moss S (Eds.), Evaluation
of Cancer Screening. London: Springer18. Beaglehole R, Bonita R, Kjellstrom T (1993) Basic Epidemiology. Geneva: World Health Organization19. Commonwealth Department of Health and Family Services (1998) Screening for the Prevention of
Cervical Cancer. Canberra: Publications Production Unit (Public Affiars, Parliamentary and Access Branch)
20. South Australia Cervix Screening Program (2004) Pap News - The Human Papillomavirus Vaccine Study (Vol. No. 18 December). Adelaide: South Australia Cervix Screening Program
21. Queensland Health (2001) BreastScreen Queensland Annual Statistical Report for 1999. Brisbane: Queensland Health
22. National Breast Cancer Centre, The Royal Australian College of General Practitioners (1997) The Investigation of a New Breast Symptom: A guide for General Practitioners. Canberra: iSource National Breast Cancer Centre
23. National Health and Medical Research Council (NHMRC) (1999) Clinical Practice Guidelines: The Prevention, Early Detection and Management of Colorectal Cancer. Canberra: NHMRC
24. Australian Health Technology Advisory Committee (1996) Prostate Cancer Screening. Canberra: Commonwealth Department of Health and Family Services
25. Parkin D, Whelan S, et al (Eds.) (2002). Cancer incidence in five continents. Volume VIII. Lyon, France: IARC (WHO)
26. Chen Y, Hunter D (2005) Molecular epidemiology of cancer. CA: A Cancer Journal for Clinicians 55: 45-54

Queensland Cancer Fund
V i e r t e l C e n t r e f o r R e s e a r c h i n C a n c e r C o n t r o l
Queensland Cancer Risk Study
38
AppENdiCES
Appendix A. Descriptive statistics of the SAMPLE DEMOGRAPHICS ................................................. 39Appendix B. Descriptive statistics for Chapter 3: TOBACCO ............................................................... 48Appendix C. Descriptive statistics for Chapter 4: ALCOHOL ............................................................... 56Appendix D. Descriptive statistics for Chapter 5: DIET ........................................................................ 59Appendix E. Descriptive statistics for Chapter 6: PHYSICAL ACTIVITY .............................................. 64Appendix F. Descriptive statistics for Chapter 7: BODY MASS ........................................................... 69Appendix G. Descriptive statistics for Chapter 8: SUN EXPSOURE AND SUN PROTECTION .......... 71Appendix H. Descriptive statistics for Chapter 9: FEMALE REPRODUCTIVE HISTORY
AND HORMONES ........................................................................................................... 80Appendix I. Descriptive statistics for Chapter 10: CERVICAL SCREENING ........................................ 85Appendix J. Descriptive statistics for Chapter 10: BREAST SCREENING .......................................... 90Appendix K. Descriptive statistics for Chapter 10: COLORECTAL SCREENING ................................ 95Appendix L. Descriptive statistics for Chapter 10: PROSTATE SCREENING ...................................... 100Appendix M. Descriptive statistics for Chapter 10: SKIN SCREENING ............................................... 105Appendix N. Descriptive statistics for Chapter 11: CANCER HISTORY ............................................... 109Appendix O. Descriptive statistics for Chapter 12: KNOWLEDGE, ATTITUDES
AND PERCEPTIONS ....................................................................................................... 113

Queensland Cancer Risk Study
Queensland Cancer Fund
39
Queensland Cancer Risk Study
App
endi
x A
. Des
crip
tive
stat
istic
s of t
he S
AM
PLE
DEM
OG
RA
PHIC
Sa (n=
9419
)
Sex
Age
gro
up (y
ears
)r
emot
enes
s (A
riA
+ ca
tego
r�es)
b
(n)
%
mal
eFe
mal
e20
-39
40-5
960
-75
maj
or c
�tyin
ner
reg�
onal
Out
er
reg�
onal
rem
ote/
very
rem
ote
(n=4
698)
%(n
=472
1)%
(n=4
016)
%(n
=381
4)%
(n=1
589)
%(n
=512
6)%
(n=2
372)
%(n
=170
3)%
(n=2
09)
%
Cou
ntry
of b
�rth
A1.
In w
hich
cou
ntry
wer
e yo
u bo
rn?
Aus
tralia
Eng
land
New
Zea
land
Asi
aN
orth
ern
Eur
ope
Sco
tland
, Ire
land
or W
ales
Sou
ther
n E
urop
eE
aste
rn E
urop
eM
iddl
e E
ast
Oth
er
(941
8)
79.6 5.6
4.7
1.7
1.7
1.1
0.6
0.2
0.1
4.6
(469
8)
79.1 5.9
4.4
1.6
2.0
0.9
0.8
0.3
0.1
4.9
(472
0)
80.1
5.3
4.9
1.8
1.4
1.3
0.5
0.2
0.1
4.2
(401
6)
83.3 3.1
5.1
2.2
0.7
0.6
0.2
0.1
0.2
4.5
(381
3)
77.7 6.3
4.7
1.5
2.0
1.3
0.8
0.3
0.1
5.2
(158
7)
74.9
10.2 3.4
1.0
3.6
2.0
1.2
0.4
0.0
3.3
(512
3)
74.9 6.5
6.0
2.5
1.9
1.3
0.8
0.3
0.3
5.7
(237
3)
84.2 5.1
3.5
0.8
1.7
1.3
0.4
0.3
0.0
2.9
(170
2)
86.1 4.0
2.8
0.8
1.2
0.5
0.6
0.1
0.0
3.9
(207
)
91.8 1.9
1.9
1.9
0.5
0.5
0.5
0.0
0.0
1.0
For p
eopl
e bo
rn o
vers
eas:
A2.
How
old
wer
e yo
u w
hen
you
first
ar
rived
to li
ve in
Aus
tralia
? Mea
n (S
D)
Med
ian
(min
, max
)
(191
7)(9
79)
22.1
(14.
2)21
.0 (0
, 72)
(937
)
22.4
(13.
6)22
.5 (0
, 70)
(671
)
16.6
(10.
8)17
.0 (0
,38)
(848
)
22.9
(13.
8)23
.0 (0
, 56)
(398
)
30.1
(14.
5)28
.0 (0
, 72)
(128
6)
22.1
(13.
5)22
.0 (0
, 70)
(372
)
23.8
(15.
2)23
.0 (0
, 72)
(232
)
20.4
(13.
3)21
.0 (0
, 71)
(20)
21.3
(13.
9)25
.0 (1
, 42)

Queensland Cancer Fund
V i e r t e l C e n t r e f o r R e s e a r c h i n C a n c e r C o n t r o l
Queensland Cancer Risk Study
40
Sex
Age
gro
up (y
ears
)r
emot
enes
s (A
riA
+ ca
tego
r�es)
b
(n)
%
mal
eFe
mal
e20
-39
40-5
960
-75
maj
or c
�tyin
ner
reg�
onal
Out
er
reg�
onal
rem
ote/
very
rem
ote
(n=4
698)
%(n
=472
1)%
(n=4
016)
%(n
=381
4)%
(n=1
589)
%(n
=512
6)%
(n=2
372)
%(n
=170
3)%
(n=2
09)
%
Ethn
�c�ty
A3.
How
wou
ld y
ou d
escr
ibe
your
eth
nic
o
rigin
?
C
auca
sian
/Whi
te
Indi
geno
us A
ustra
lian
Sou
th-E
ast A
sian
Pac
ific
Isla
nder
Nor
th-E
ast A
sian
M
iddl
e E
aste
rnS
outh
Asi
anS
outh
Am
eric
an/S
pani
sh/In
dian
Bla
ck A
frica
nA
frica
n A
mer
ican
Indi
geno
us A
mer
ican
Oth
erD
on’t
know
(941
8)
93.3 1.3
1.0
0.7
0.5
0.4
0.3
0.3
0.0
0.0
0.0
2.2
0.2
(469
9)
93.3 1.2
0.9
0.5
0.5
0.4
0.2
0.3
0.1
0.0
0.0
2.4
0.2
(472
1)
92.7 1.5
1.1
0.8
0.4
0.4
0.5
0.2
0.0
0.0
0.0
2.1
0.3
(401
7)
90.7 2.1
1.2
0.8
0.7
0.6
0.5
0.3
0.1
0.0
0.0
2.7
0.2
(381
4)
94.2 0.9
1.0
0.8
0.4
0.2
0.3
0.3
0.0
0.0
0.0
1.8
0.1
(158
7)
96.1 0.6
0.4
0.1
0.1
0.1
0.2
0.1
0.0
0.0
0.0
2.0
0.5
(512
5)
92.0 0.8
0.3
0.8
0.6
0.5
0.6
0.4
0.0
0.0
0.0
2.5
0.2
(237
3)
95.3 1.1
0.3
0.3
0.3
0.2
0.2
0.2
0.0
0.0
0.0
2.0
0.2
(170
3)
93.9 2.2
0.5
0.8
0.3
0.1
0.0
1.0
0.0
0.0
0.0
1.6
0.5
(209
)
89.5 6.7
1.0
0.5
0.0
0.5
0.0
0.0
0.0
0.0
0.0
1.0
1.0
For t
hose
who
des
crib
ed th
emse
lves
as
Cau
casi
an:
A4.
Whi
ch o
f the
follo
win
g m
ost c
lose
ly
desc
ribes
you
r eth
nic
orig
in?
Eng
lish
Sco
ttish
, Iris
h or
Wel
sh
Oth
er N
orth
ern
Eur
opea
n S
outh
ern
Eur
opea
n E
aste
rn E
urop
ean
Mix
ed
Oth
er
Don
’t kn
ow
(876
0)
33.1
17.7 6.9
2.3
1.0
36.2 1.1
1.6
(438
4)
31.9
19.4 7.8
2.4
1.2
34.4 1.2
1.8
(437
6)
34.4
16.0 6.1
2.2
0.7
38.1 1.1
1.4
(364
0)
34.6
17.6 6.5
2.5
1.0
34.1 1.3
2.3
(359
3)
32.2
18.1 7.0
2.3
1.0
36.9 1.1
1.4
(152
7)
31.9
16.9 7.7
2.0
0.7
39.6 0.8
0.5
(471
3)
32.9
18.3 6.8
2.1
1.3
35.8 1.3
1.4
(225
9)
33.1
17.0 7.3
0.8
0.8
38.5 0.7
1.9
(160
0)
33.1
16.9 6.8
5.2
0.4
34.8 1.3
1.6
(186
)
39.8
15.6 5.9
0.5
0.5
32.8 1.6
3.2

Queensland Cancer Risk Study
Queensland Cancer Fund
41
Queensland Cancer Risk Study
Sex
Age
gro
up (y
ears
)r
emot
enes
s (A
riA
+ ca
tego
r�es)
b
(n)
%
mal
eFe
mal
e20
-39
40-5
960
-75
maj
or c
�tyin
ner
reg�
onal
Out
er
reg�
onal
rem
ote/
very
rem
ote
(n=4
698)
%(n
=472
1)%
(n=4
016)
%(n
=381
4)%
(n=1
589)
%(n
=512
6)%
(n=2
372)
%(n
=170
3)%
(n=2
09)
%
Educ
at�o
n
A5.
Wha
t is
the
high
est l
evel
of e
duca
tion
and
train
ing
you
have
com
plet
ed?
Uni
vers
ity o
r col
lege
deg
ree
Trad
e or
tech
nica
l cer
tifica
te/D
iplo
ma
Sen
ior h
igh
scho
ol
Juni
or h
igh
scho
ol
Prim
ary
scho
ol
Did
not
com
plet
e pr
imar
y sc
hool
(941
5)
25.9
30.8
19.2
17.0 6.4
0.8
(469
4)
25.5
40.3
15.1
12.1 6.0
1.0
(472
0)
26.2
21.4
23.2
21.8 6.8
0.6
(401
6)
29.7
30.6
25.4
12.4 1.8
0.1
(381
1)
25.8
31.6
15.1
20.9 5.9
0.7
(158
8)
16.3
29.5
13.0
19.3
19.2 2.6
(512
2)
31.2
30.1
19.4
14.3 4.5
0.1
(237
0)
19.8
31.5
19.6
19.0 9.1
1.0
(170
3)
19.6
31.7
18.3
21.5 7.8
1.2
(209
)
14.8
35.4
13.9
22.5
11.0 2.4
Empl
oym
ent s
tatu
s
A6.
Wou
ld y
ou d
escr
ibe
your
self
as
empl
oyed
(eith
er s
elf-e
mpl
oyed
, or
empl
oyed
for s
alar
y or
wag
es)?
Yes
No
(941
5)
69.7
30.3
(469
6)
78.9
21.1
(471
9)
60.5
39.5
(401
6)
80.5
19.5
(381
2)
77.5
22.5
(158
7)
23.6
76.4
(512
4)
71.4
28.6
(237
0)
63.4
36.6
(170
2)
71.9
28.1
(208
)
80.3
19.7
For t
hose
who
des
crib
ed th
emse
lves
as
empl
oyed
:A
7. H
ow m
any
hour
s a
wee
k do
you
w
ork?
Non
e1-
1516
-24
25-3
435
-39 40
41-4
849
hou
rs +
(656
1) 0.2
9.0
8.6
12.3
16.6
18.8
11.4
23.2
(370
5)
0.1
3.5
3.3
5.9
15.8
21.5
16.2
33.6
(285
4)
0.2
16.0
15.5
20.6
17.7
15.1 5.1
9.7
(323
2)
0.0
9.3
8.5
11.5
16.7
20.4
12.7
20.9
(295
4)
0.3
7.5
8.4
12.9
17.0
17.7
10.7
25.5
(376
)
0.8
18.4
11.2
14.9
12.5
12.5 5.1
24.7
(366
1)
0.1
8.3
8.7
12.4
17.3
20.5
11.9
20.7
(150
3)
0.1
10.4 9.0
12.7
18.0
15.8
10.6
23.4
(122
2)
0.3
9.6
7.7
11.8
14.1
18.0
10.1
28.5
(166
)
0.0
5.4
9.0
9.0
7.2
12.0
18.1
39.2

Queensland Cancer Fund
V i e r t e l C e n t r e f o r R e s e a r c h i n C a n c e r C o n t r o l
Queensland Cancer Risk Study
42
Sex
Age
gro
up (y
ears
)r
emot
enes
s (A
riA
+ ca
tego
r�es)
b
(n)
%
mal
eFe
mal
e20
-39
40-5
960
-75
maj
or c
�tyin
ner
reg�
onal
Out
er
reg�
onal
rem
ote/
very
rem
ote
(n=4
698)
%(n
=472
1)%
(n=4
016)
%(n
=381
4)%
(n=1
589)
%(n
=512
6)%
(n=2
372)
%(n
=170
3)%
(n=2
09)
%
For t
hose
who
des
crib
ed th
emse
lves
as
empl
oyed
:A
8. W
ork
stat
usc
Full-
time
Par
t-tim
eC
urre
ntly
on
leav
e
(656
1)
69.9
29.9 0.2
(370
5)
87.1
12.8 0.1
(285
5)
47.7
52.1 0.2
(323
2)
70.7
29.2 0.0
(295
4)
71.0
28.8 0.3
(376
)
54.8
44.4 0.8
(366
1)
70.4
29.5 0.1
(150
3)
67.7
32.2 0.1
(122
2)
70.6
29.1 0.3
(167
)
76.0
24.0 0.0
For t
hose
who
des
crib
ed th
emse
lves
as
unem
ploy
ed:
A9.
Are
you
per
man
ently
una
ble
to w
ork
beca
use
of il
lnes
s or
dis
abili
ty?
Yes
No
(285
5)
16.8
83.2
(989
)
27.2
72.8
(186
6)
11.3
88.7
(784
)
7.4
92.6
(859
)
29.6
70.4
(121
2)
13.9
86.1
(146
4)
14.4
85.6
(867
)
18.9
81.1
(480
)
19.0
81.0
(41)
29.3
70.7
For t
hose
who
des
crib
ed th
emse
lves
as
unem
ploy
ed a
nd n
ot il
l/dis
able
d:A
10. A
re y
ou re
tired
?
Yes
No
(233
7)
54.7
45.3
(713
)
70.3
29.7
(162
5)
47.9
52.1
(708
)
1.1
98.9
(590
)
42.9
57.1
(103
9)
98.0 2.0
(124
1)
52.4
47.6
(679
)
61.4
38.6
(388
)
51.5
48.5
(28)
39.3
60.7
For t
hose
who
des
crib
ed th
emse
lves
as
unem
ploy
ed, n
ot il
l/dis
able
d or
retir
ed:
A11
. How
long
has
it b
een
sinc
e yo
u w
ere
in p
aid
empl
oym
ent?
Up
to 1
mon
th1
mon
th to
less
than
3 m
onth
s
3 m
onth
s to
less
than
6 m
onth
s 6
mon
ths
to le
ss th
an 1
yea
r
1 ye
ar to
less
than
2 y
ears
2
year
s or
mor
e
Nev
er in
pai
d em
ploy
men
t
(105
1) 5.2
7.3
6.6
10.1
11.8
56.4 2.4
(217
)
11.1
17.1
10.1
13.8
15.7
27.2 5.1
(834
)
3.6
4.8
5.6
9.1
10.9
64.0 1.9
(696
)
5.3
7.0
6.8
11.2
13.5
53.0 3.2
(332
)
4.5
8.1
6.6
7.5
8.7
63.3 1.2
(22) 9.1
4.5
0.0
13.6 9.1
59.1 4.5
(584
)
6.0
8.2
6.0
8.2
13.4
55.8 2.4
(156
)
4.9
4.9
7.5
10.9
10.6
58.9 2.3
(183
)
3.3
7.7
5.5
15.3 8.7
56.3 3.3
(18)
0.0
5.6
22.2 5.6
16.7
44.4 5.6

Queensland Cancer Risk Study
Queensland Cancer Fund
43
Queensland Cancer Risk Study
Sex
Age
gro
up (y
ears
)r
emot
enes
s (A
riA
+ ca
tego
r�es)
b
(n)
%
mal
eFe
mal
e20
-39
40-5
960
-75
maj
or c
�tyin
ner
reg�
onal
Out
er
reg�
onal
rem
ote/
very
rem
ote
(n=4
698)
%(n
=472
1)%
(n=4
016)
%(n
=381
4)%
(n=1
589)
%(n
=512
6)%
(n=2
372)
%(n
=170
3)%
(n=2
09)
%
For t
hose
who
des
crib
ed th
emse
lves
as
unem
ploy
ed, n
ot il
l/dis
able
d or
retir
ed:
A12
. Are
you
cur
rent
ly s
eeki
ng w
ork?
Yes
No
Ref
used
to a
nsw
er
(105
4)
33.4
66.5 0.1
(218
)
61.9
38.1 0.0
(837
)
26.0
73.8 0.1
(697
)
32.9
67.1 0.0
(334
)
34.4
65.3 0.3
(23)
34.8
65.2 0.0
(589
)
33.8
66.0 0.2
(264
)
33.0
67.0 0.0
(183
)
33.3
66.7 0.0
(17)
35.3
64.7 0.0
A13
. Are
you
a s
tude
nt?
Yes
No
(941
8) 9.4
90.6
(469
7)
8.3
91.6
(472
1)
10.5
89.5
(401
6)
16.2
83.7
(381
4)
5.3
94.7
(158
8)
2.2
97.8
(512
4)
10.8
89.2
(237
1)
7.2
92.7
(170
3)
8.5
91.5
(209
)
8.1
91.9
For t
hose
who
des
crib
ed th
emse
lves
as
a st
uden
t:A
14. A
re y
ou a
full-
time
or p
art-t
ime
stud
ent?
Full-
time
P
art-t
ime
(887
)
37.3
62.7
(391
)
38.4
61.6
(496
)
36.5
63.5
(652
)
44.9
55.1
(201
)
17.9
82.1
(34) 5.9
94.1
(552
)
42.0
58.0
(171
)
25.7
74.3
(145
)
34.5
65.5
(17)
29.4
70.6
A15
. Wou
ld y
ou d
escr
ibe
your
mai
n oc
cupa
tion
as h
ouse
hold
dut
ies
or
hom
e ca
rer?
Yes
No
Oth
erR
efus
ed to
ans
wer
(941
4)
35.7
63.5 0.6
0.2
(469
3)
15.2
84.2 0.5
0.2
(472
0)
56.2
43.0 0.7
0.1
(401
5)
30.4
69.1 0.5
0.0
(381
0)
30.5
68.6 0.7
0.2
(158
7)
61.9
37.1 0.8
0.2
(512
3)
32.4
66.9 0.5
0.2
(237
1)
42.0
57.2 0.7
0.1
(170
1)
36.9
62.4 0.6
0.1
(209
)
36.4
62.7 1.0
0.0
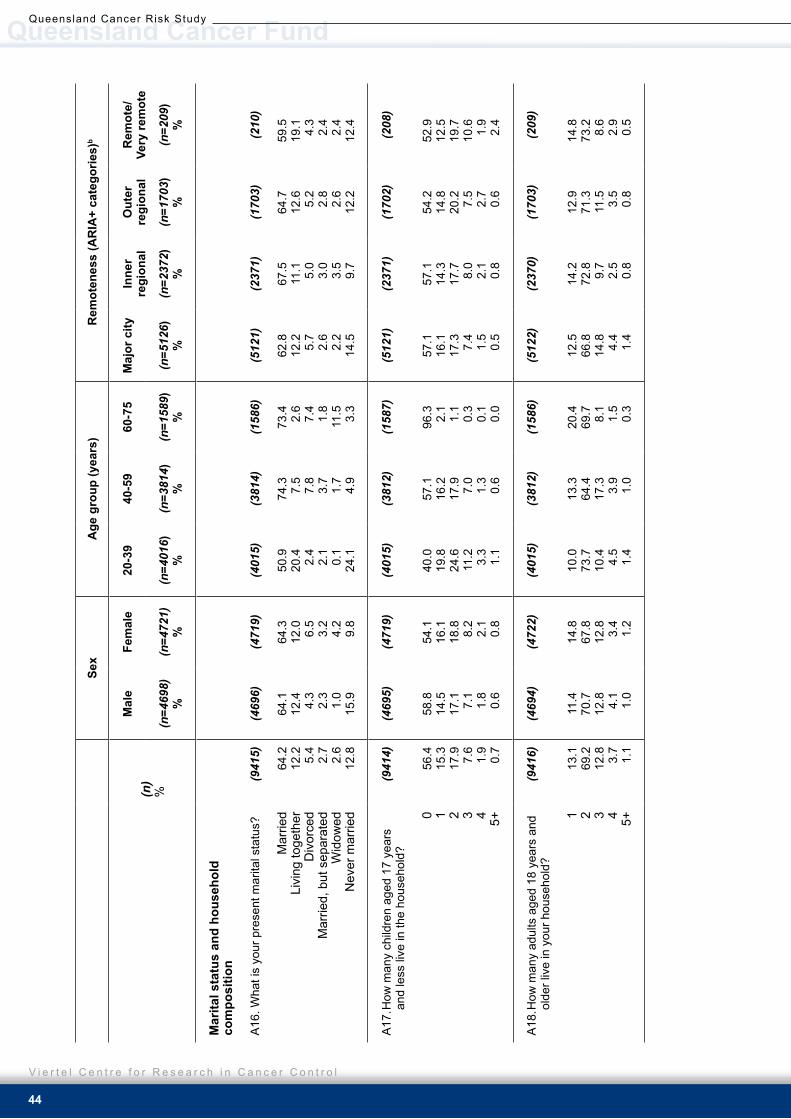
Queensland Cancer Fund
V i e r t e l C e n t r e f o r R e s e a r c h i n C a n c e r C o n t r o l
Queensland Cancer Risk Study
44
Sex
Age
gro
up (y
ears
)r
emot
enes
s (A
riA
+ ca
tego
r�es)
b
(n)
%
mal
eFe
mal
e20
-39
40-5
960
-75
maj
or c
�tyin
ner
reg�
onal
Out
er
reg�
onal
rem
ote/
very
rem
ote
(n=4
698)
%(n
=472
1)%
(n=4
016)
%(n
=381
4)%
(n=1
589)
%(n
=512
6)%
(n=2
372)
%(n
=170
3)%
(n=2
09)
%
mar
�tal s
tatu
s an
d ho
useh
old
com
pos�
t�on
A16
. Wha
t is
your
pre
sent
mar
ital s
tatu
s?
M
arrie
d
Livi
ng to
geth
er
Div
orce
d
Mar
ried,
but
sep
arat
ed
Wid
owed
N
ever
mar
ried
(941
5)
64.2
12.2 5.4
2.7
2.6
12.8
(469
6)
64.1
12.4 4.3
2.3
1.0
15.9
(471
9)
64.3
12.0 6.5
3.2
4.2
9.8
(401
5)
50.9
20.4 2.4
2.1
0.1
24.1
(381
4)
74.3 7.5
7.8
3.7
1.7
4.9
(158
6)
73.4 2.6
7.4
1.8
11.5 3.3
(512
1)
62.8
12.2 5.7
2.6
2.2
14.5
(237
1)
67.5
11.1 5.0
3.0
3.5
9.7
(170
3)
64.7
12.6 5.2
2.8
2.6
12.2
(210
)
59.5
19.1 4.3
2.4
2.4
12.4
A17
. How
man
y ch
ildre
n ag
ed 1
7 ye
ars
and
less
live
in th
e ho
useh
old?
0
1
2
3
4
5+
(941
4)
56.4
15.3
17.9 7.6
1.9
0.7
(469
5)
58.8
14.5
17.1 7.1
1.8
0.6
(471
9)
54.1
16.1
18.8 8.2
2.1
0.8
(401
5)
40.0
19.8
24.6
11.2 3.3
1.1
(381
2)
57.1
16.2
17.9 7.0
1.3
0.6
(158
7)
96.3 2.1
1.1
0.3
0.1
0.0
(512
1)
57.1
16.1
17.3 7.4
1.5
0.5
(237
1)
57.1
14.3
17.7 8.0
2.1
0.8
(170
2)
54.2
14.8
20.2 7.5
2.7
0.6
(208
)
52.9
12.5
19.7
10.6 1.9
2.4
A18
. How
man
y ad
ults
age
d 18
yea
rs a
nd
olde
r liv
e in
you
r hou
seho
ld?
1
2
3
4
5+
(941
6)
13.1
69.2
12.8 3.7
1.1
(469
4)
11.4
70.7
12.8 4.1
1.0
(472
2)
14.8
67.8
12.8 3.4
1.2
(401
5)
10.0
73.7
10.4 4.5
1.4
(381
2)
13.3
64.4
17.3 3.9
1.0
(158
6)
20.4
69.7 8.1
1.5
0.3
(512
2)
12.5
66.8
14.8 4.4
1.4
(237
0)
14.2
72.8 9.7
2.5
0.8
(170
3)
12.9
71.3
11.5 3.5
0.8
(209
)
14.8
73.2 8.6
2.9
0.5

Queensland Cancer Risk Study
Queensland Cancer Fund
45
Queensland Cancer Risk Study
Sex
Age
gro
up (y
ears
)r
emot
enes
s (A
riA
+ ca
tego
r�es)
b
(n)
%
mal
eFe
mal
e20
-39
40-5
960
-75
maj
or c
�tyin
ner
reg�
onal
Out
er
reg�
onal
rem
ote/
very
rem
ote
(n=4
698)
%(n
=472
1)%
(n=4
016)
%(n
=381
4)%
(n=1
589)
%(n
=512
6)%
(n=2
372)
%(n
=170
3)%
(n=2
09)
%
hou
seho
ld �n
com
e
A19
. Wha
t is
your
cur
rent
gro
ss h
ouse
hold
in
com
e?Le
ss th
an $
20,0
00$2
0,00
0 –
less
than
$40
,000
$
40,0
00 –
less
than
$60
,000
$60,
000
– le
ss th
an $
80,0
00$8
0,00
0 –
less
than
$10
0,00
0$1
00,0
00 o
r gre
ater
Ref
used
to a
nsw
erD
on’t
know
(941
8)
12.4
19.9
19.9
16.0 9.8
11.8 4.8
6.0
(469
8)
10.4
18.9
20.8
16.6
10.3
14.0 4.4
4.6
(472
0)
14.3
21.0
19.1
15.4 9.2
9.6
4.1
7.4
(401
7)
5.9
19.1
21.9
19.5
11.3
12.9 3.2
6.1
(381
3)
10.0
17.6
20.9
16.8
11.1
14.2 5.0
4.5
(158
7)
34.6
27.7
12.5 5.2
2.6
3.3
5.0
9.0
(512
5)
10.0
18.1
19.8
17.3
10.6
13.8 4.8
5.6
(237
1)
17.0
24.2
20.1
13.8 7.5
7.3
3.8
6.2
(170
4)
13.2
20.0
20.4
14.8
10.4
11.2 3.2
6.8
(210
)
10.5
16.2
16.2
20.0
11.0
21.0 1.9
3.3
A20
. How
man
y pe
ople
are
dep
ende
nt o
n th
is in
com
e?0 1 2 3 4 5+
(846
8) 0.1
10.3
39.0
18.5
19.2
12.9
(428
3)
0.1
10.3
39.9
18.7
18.5
12.4
(418
6)
0.1
10.2
37.9
18.3
20.0
13.6
(364
6)
0.0
6.7
26.4
23.7
25.2
18.0
(345
4)
0.2
9.6
39.5
18.2
20.1
12.4
(136
6)
0.1
21.5
70.9 5.3
1.2
1.0
(459
1)
0.2
10.2
37.7
20.2
19.0
12.8
(213
8)
0.0
10.7
42.6
15.6
18.9
12.2
(153
5)
0.1
9.6
38.6
18.1
20.0
13.6
(197
)
0.0
11.7
32.5
13.7
23.9
18.3
gen
eral
hea
lth
A21
. In g
ener
al, h
ow w
ould
you
rate
you
r he
alth
?P
oor
Fair
Goo
dE
xcel
lent
(941
8) 3.0
20.3
56.5
20.1
(469
7)
2.4
21.4
56.7
19.5
(472
0)
3.5
19.4
56.5
20.6
(401
6)
2.7
20.7
58.5
18.1
(381
4)
2.8
19.2
55.5
22.4
(158
7)
4.0
22.2
54.5
19.3
(512
4)
2.9
20.1
56.5
20.5
(237
2)
3.0
20.3
56.0
20.7
(170
3)
3.1
20.1
58.4
18.4
(209
)
2.4
26.8
53.6
17.2

Queensland Cancer Fund
V i e r t e l C e n t r e f o r R e s e a r c h i n C a n c e r C o n t r o l
Queensland Cancer Risk Study
46
Sex
Age
gro
up (y
ears
)r
emot
enes
s (A
riA
+ ca
tego
r�es)
b
(n)
%
mal
eFe
mal
e20
-39
40-5
960
-75
maj
or c
�tyin
ner
reg�
onal
Out
er
reg�
onal
rem
ote/
very
rem
ote
(n=4
698)
%(n
=472
1)%
(n=4
016)
%(n
=381
4)%
(n=1
589)
%(n
=512
6)%
(n=2
372)
%(n
=170
3)%
(n=2
09)
%
A22
. How
wou
ld y
ou ra
te y
our h
ealth
now
co
mpa
red
to o
ne y
ear a
go?
Wor
seA
bout
the
sam
eB
ette
rD
on’t
know
(941
8)
10.1
67.2
22.7 0.1
(469
8)
9.3
68.6
22.0 0.0
(472
1)
10.8
65.7
23.4 0.1
(401
7)
9.7
61.3
29.0 0.1
(381
4)
9.8
70.9
19.2 0.1
(158
8)
11.5
73.0
15.4 0.0
(512
5)
10.0
66.8
23.1 0.0
(237
2)
9.7
68.3
21.9 0.0
(170
3)
10.2
67.0
22.8 0.0
(209
)
12.9
64.6
22.5 0.0
pr�v
ate
heal
th �n
sura
nce
A23
. Do
you
have
priv
ate
heal
th
in
sura
nce?
Yes
No
Don
’t kn
ow
(941
6)
51.8
48.0 0.2
(469
7)
51.2
48.5 0.3
(472
0)
52.4
47.5 0.0
(401
6)
43.0
56.8 0.2
(381
2)
59.2
40.7 0.2
(158
7)
56.6
43.4 0.0
(512
4)
54.4
45.4 0.2
(237
2)
46.8
53.2 0.1
(170
3)
51.4
48.4 0.2
(210
)
51.4
48.6 0.0
Res
pond
ents
who
hav
e pr
ivat
e he
alth
in
sura
nce:
A24
. Wha
t typ
e of
priv
ate
heal
th in
sura
nce
do y
ou h
ave? H
ospi
tal a
nd e
xtra
s co
ver
Hos
pita
l cov
er o
nly
Ext
ras
cove
r onl
yD
on’t
know
(487
8)
78.0
14.9 5.6
1.5
(240
5)
77.1
15.5 5.3
2.1
(247
4)
78.8
14.3 5.9
1.0
(172
5)
78.0
11.0 8.7
2.3
(225
5)
80.0
14.4 4.6
1.1
(898
)
72.9
23.6 2.2
1.2
(278
7)
78.9
13.2 6.6
1.3
(110
8)
75.6
16.8 5.7
1.9
(874
)
77.5
17.7 2.9
1.9
(108
)
83.3
13.9 1.9
0.9
A25
. Do
you
have
a re
gula
r gen
eral
pr
actit
ione
r (G
P)?
Yes
No
(941
7)
82.4
17.6
(469
7)
77.2
22.8
(472
0)
87.6
12.4
(401
7)
75.6
24.4
(381
3)
85.0
15.0
(158
8)
93.7 6.3
(512
3)
82.0
18.0
(237
1)
85.7
14.3
(170
3)
80.6
19.4
(209
)
71.8
28.2

Queensland Cancer Risk Study
Queensland Cancer Fund
47
Queensland Cancer Risk Study
Sex
Age
gro
up (y
ears
)r
emot
enes
s (A
riA
+ ca
tego
r�es)
b
(n)
%
mal
eFe
mal
e20
-39
40-5
960
-75
maj
or c
�tyin
ner
reg�
onal
Out
er
reg�
onal
rem
ote/
very
rem
ote
(n=4
698)
%(n
=472
1)%
(n=4
016)
%(n
=381
4)%
(n=1
589)
%(n
=512
6)%
(n=2
372)
%(n
=170
3)%
(n=2
09)
%
A26
. Hav
e yo
u se
en a
GP
in th
e la
st 1
2 m
onth
s fo
r any
reas
on?
Yes
No
Can
’t re
mem
ber
(941
7)
87.0
12.8 0.2
(469
7)
82.4
17.2 0.3
(472
1)
91.4 8.5
0.1
(401
7)
84.3
15.4 0.2
(381
3)
86.5
13.3 0.2
(158
7)
94.6 5.3
0.1
(512
4)
87.8
12.0 0.2
(237
1)
86.6
13.2 0.2
(170
3)
85.3
14.5 0.2
(210
)
85.7
14.3 0.0
a C
olum
n pe
rcen
tage
s ar
e st
anda
rdis
ed to
the
2003
Que
ensl
and
popu
latio
n by
age
, sex
and
geo
grap
hic
loca
tion.
b A
cces
sibi
lity/
Rem
oten
ess
Inde
x of
Aus
tralia
c Th
ese
cate
gorie
s ba
sed
on A
BS
cat
egor
ies
of p
art-t
ime
<35
hour
s an
d fu
ll-tim
e 35
hou
rs o
r mor
e

Queensland Cancer Fund
V i e r t e l C e n t r e f o r R e s e a r c h i n C a n c e r C o n t r o l
Queensland Cancer Risk Study
48
App
endi
x B
. Des
crip
tive
stat
istic
s for
Cha
pter
3: T
OB
AC
CO
a (n=
9419
)
Sex
Age
gro
up (y
ears
)r
emot
enes
s (A
riA
+ ca
tego
r�es)
b
(n)
%
mal
eFe
mal
e20
-39
40-5
960
-75
maj
or c
�tyin
ner
reg�
onal
Out
er
reg�
onal
rem
ote/
very
rem
ote
(n=4
698
%(n
=472
1)%
(n=4
016)
%(n
=381
4)%
(n=1
589)
%(n
=512
6)%
(n=2
372)
%(n
=170
3)%
(n=2
09)
%
Smok
�ng
beha
v�ou
r
B1.
H
ave
you
ever
sm
oked
at l
east
100
ci
gare
ttes
in y
our e
ntire
life
?
Ye
s
No/
Don
’t kn
ow
(941
9)
53.4
46.6
(469
8)
60.0
40.0
(472
1)
46.7
53.3
(401
7)
51.9
48.1
(381
4)
55.3
44.7
(159
0)
52.6
47.4
(512
6)
51.6
48.4
(237
2)
55.1
44.9
(170
2)
55.9
44.1
(210
)
57.6
42.4
B2.
Cur
rent
sm
okin
g st
atus
Cur
rent
dai
ly s
mok
erC
urre
nt in
term
itten
t sm
oker
Long
-term
ex-
smok
erS
hort-
term
ex-
smok
erLi
fe-lo
ng n
on-s
mok
er
(941
1)
18.6 4.4
27.6 2.8
46.6
(469
0)
20.7 4.5
32.1 2.7
40.0
(472
1)
16.5 4.3
23.1 2.9
53.3
(401
2)
24.0 6.1
18.0 3.7
48.2
(381
2)
17.3 3.6
32.0 2.4
44.8
(158
9)
8.2
1.8
41.1 1.4
47.5
(511
9)
17.2 4.4
27.3 2.6
48.5
(237
1)
19.5 4.3
28.6 2.7
44.9
(170
3)
20.0 4.8
27.6 3.4
44.0
(209
)
30.1 2.4
23.4 1.4
42.6
Eve
r sm
oker
s:B
3. A
ge w
hen
first
trie
d a
ciga
rette
<12
12-1
516
-17
18-2
425
+
Mea
n (S
D)
Med
ian
(min
, max
)
(502
7)
12.7
48.1
21.5
15.1 2.5
(282
0)
16.1
49.2
19.6
13.4 1.7
14.4
(3.8
)14
.0 (2
,50)
(220
7)
8.3
46.8
24.0
17.3 3.6
15.6
(4.3
)15
.0 (5
,55)
(208
4)
12.8
53.5
22.3
10.6 0.9
14.4
(3.1
)15
.0(2
,30)
(210
8)
12.3
47.5
21.4
16.2 2.6
15.0
(3.9
)15
.0 (4
,42)
(836
)
13.5
36.5
19.7
23.7 6.6
16.2
(6.0
)15
.0 (3
,55)
(264
4)
12.4
47.2
22.2
15.5 2.6
15.0
(4.1
)15
.0 (3
,52)
(130
8)
13.5
48.3
21.0
14.9 2.3
14.8
(4.2
)15
.0 (4
,55)
(952
)
12.2
50.1
21.0
13.9 2.8
14.9
(3.9
)15
.0 (4
,39)
(120
)
14.2
50.8
16.7
16.7 1.7
14.5
(4.0
)15
.0 (2
,35)

Queensland Cancer Risk Study
Queensland Cancer Fund
49
Queensland Cancer Risk Study
Sex
Age
gro
up (y
ears
)r
emot
enes
s (A
riA
+ ca
tego
r�es)
b
(n)
%
mal
eFe
mal
e20
-39
40-5
960
-75
maj
or c
�tyin
ner
reg�
onal
Out
er
reg�
onal
rem
ote/
very
rem
ote
(n=4
698
%(n
=472
1)%
(n=4
016)
%(n
=381
4)%
(n=1
589)
%(n
=512
6)%
(n=2
372)
%(n
=170
3)%
(n=2
09)
%
Eve
r sm
oker
s:B
4.
Age
whe
n st
arte
d to
sm
oke
at le
ast
once
a w
eek
<12
12-1
516
-17
18-2
425
+
Mea
n (S
D)
Med
ian
(min
, max
)
(500
3) 3.7
32.2
29.3
30.4 4.4
(280
9)
4.6
33.7
28.8
29.2 3.7
16.6
(4.1
)16
.0 (1
,50)
(219
4)
2.5
30.3
29.9
31.9 5.5
17.2
(4.6
)17
.0 (1
,60)
(208
3)
3.1
36
.6
29.8
28
.2
2.3
16.3
(3.4
)16
.0(1
,37)
(209
4) 4.2
31.0
30.2
30.2 4.4
16.8
(4.1
)16
.0 (1
,42)
(826
)
3.8
24.3
25.7
36.3 9.9
18.3
(6.1
)17
.0 (1
,60)
(263
4)
3.6
32.2
28.4
31.2 4.5
16.9
(4.4
)17
.0 (1
,52)
(129
6) 3.6
31.6
30.3
29.8 4.6
16.9
(4.3
)16
.0 (1
,60)
(949
)
3.8
33.3
29.4
29.1 4.4
16.7
(4.1
)16
.0 (1
,51)
(121
)
3.3
31.4
34.7
27.3 3.3
16.6
(3.6
)16
.0 (5
,35)
Cur
rent
sm
oker
s
Cur
rent
dai
ly s
mok
ers
B5.
Av
erag
e nu
mbe
r of c
igar
ette
s yo
u sm
oke
a da
y0-
2up
to 1
010
-20
>20
M
ean
(SD
)M
edia
n (m
in, m
ax)
(175
1) 0.4
11.1
60.7
27.8
(972
)
0.5
10.1
57.8
31.6
19.9
(11.
0)20
.0 (1
,100
)
(779
)
0.3
12.3
64.3
23.1
17.9
(10.
0)15
.0 (1
,113
)
(960
)
0.4
14.0
63.6
22.0
17.4
10.
1)15
.0(1
,113
)
(660
)
0.2
7.6
56.7
35.6
21.1
(11.
0)20
.0 (1
,100
)
(131
)
0.8
7.6
59.5
32.1
19.9
(10.
6)20
.0 (1
,70)
(882
)
0.1
13.3
60.0
26.6
18.4
(10.
3)17
.0 (2
,112
)
(461
)
0.7
8.0
64.9
26.5
19.0
(9.2
)20
.0 (1
,50)
(342
)
0.3
9.6
57.3
32.7
20.6
(12.
7)20
.0(1
,100
)
(64) 3.
110
.957
.828
.1
18.7
(11.
6)15
.0 (2
,75)

Queensland Cancer Fund
V i e r t e l C e n t r e f o r R e s e a r c h i n C a n c e r C o n t r o l
Queensland Cancer Risk Study
50
Sex
Age
gro
up (y
ears
)r
emot
enes
s (A
riA
+ ca
tego
r�es)
b
(n)
%
mal
eFe
mal
e20
-39
40-5
960
-75
maj
or c
�tyin
ner
reg�
onal
Out
er
reg�
onal
rem
ote/
very
rem
ote
(n=4
698
%(n
=472
1)%
(n=4
016)
%(n
=381
4)%
(n=1
589)
%(n
=512
6)%
(n=2
372)
%(n
=170
3)%
(n=2
09)
%
Cur
rent
inte
rmitt
ent s
mok
ers:
B6.
H
ow m
any
of th
e pa
st 3
0 da
ys d
id
you
smok
e a
ciga
rette
?
0-7
days
8-16
day
s17
-24
days
25 o
r mor
e da
ys
Mea
n (S
D)
Med
ian
(min
, max
)
(412
)
34.8
33.3
18.9
13.0
(211
)
36.3
33.5
19.8
10.4
12.3
(8.4
)12
.0 (0
,30)
(203
)
33.3
33.3
17.9
15.4
13.5
(8.6
)15
.0 (0
,30)
(248
)
33.9
34.7
19.8
11.7
12.7
(8.3
)13
.2(0
,30)
(138
)
37.8
32.6
15.6
14.1
12.6
(8.7
)12
.0 (0
,30)
(28)
31.0
24.1
27.6
17.2
15.2
(8.8
)15
.0 (0
,30)
(226
)
31.3
38.8
18.3
11.6
13.0
(7.9
)14
.0 (0
,30)
(100
)
37.3
32.4
19.6
10.8
12.4
(8.8
)14
.0 (0
,30)
(81)
42.0
18.5
19.8
19.8
13.1
(9.8
)12
.0 (0
,30)
(6)
20.0
40.0
40.0 0.0
12.3
(7.7
)12
.8 (0
,20)
Cur
rent
inte
rmitt
ent s
mok
ers:
B7.
Av
erag
e nu
mbe
r of c
igar
ette
s yo
u sm
oked
dur
ing
the
past
30
days
0-2
up to
10
10-2
0>2
0
Mea
n (S
D)
Med
ian
(min
, max
)
(398
)
25.7
48.9
21.9 3.5
(202
)
25.7
47.5
23.8 3.0
6.5
(5.9
)4.
0 (0
, 30)
(196
)
25.5
50.5
19.9 4.1
6.4
(8.2
)4.
0 (0
, 88)
(240
)
25.0
50.4
20.4 4.2
6.3
(6.3
)4.
0 (1
, 40)
(130
)
27.7
45.4
24.6 2.3
6.4
(6.3
)5.
0 (0
, 50)
(27)
22.2
51.9
22.2 3.7
8.1
(14.
2)4.
0 (0
, 88)
(221
)
29.4
49.8
17.6 3.2
5.7
(5.7
)4.
0 (0
, 40)
(97) 23
.746
.427
.8 2.1
6.8
(8.8
)5.
0 (0
, 88)
(76)
19.7
47.4
26.3 6.6
8.1
(8.2
)5.
0 (1
, 50)
(5) 0.0
80.0
20.0 0.0
8.0
(4.8
)6.
5 (3
, 15)
Qu�
t atte
mpt
s (r
estr
icte
d to
cur
rent
sm
oker
s)
B8.
D
urin
g th
e pa
st 1
2 m
onth
s, h
ave
you
stop
ped
smok
ing
for m
ore
than
on
e da
y be
caus
e yo
u w
ere
tryin
g to
qu
it sm
okin
g?Ye
sN
o
(216
4)
51.4
48.6
(118
1)
50.5
49.5
(982
)
52.5
47.5
(120
8)
54.6
45.4
(797
)
46.9
53.1
(159
)
49.7
50.3
(110
5)
50.8
49.2
(564
)
49.5
50.5
(424
)
53.5
46.5
(69)
63.8
36.2

Queensland Cancer Risk Study
Queensland Cancer Fund
51
Queensland Cancer Risk Study
Sex
Age
gro
up (y
ears
)r
emot
enes
s (A
riA
+ ca
tego
r�es)
b
(n)
%
mal
eFe
mal
e20
-39
40-5
960
-75
maj
or c
�tyin
ner
reg�
onal
Out
er
reg�
onal
rem
ote/
very
rem
ote
(n=4
698
%(n
=472
1)%
(n=4
016)
%(n
=381
4)%
(n=1
589)
%(n
=512
6)%
(n=2
372)
%(n
=170
3)%
(n=2
09)
%
Cur
rent
sm
oker
s w
ho h
ave
tried
to q
uit
smok
ing:
B9.
N
umbe
r of t
imes
you
trie
d to
qui
t in
the
last
12
mon
ths
Onc
eTw
ice
Thre
e tim
esFo
ur o
r mor
e tim
es
Mea
n (S
D)
Med
ian
(min
, max
)
(111
4)
40.5
27.0
13.3
19.3
(597
)
44.7
24.6
13.1
17.6
3.2
(14.
3)2.
0 (1
, 365
)
(517
)
35.6
29.6
13.5
21.3
3.2
(4.9
)2.
0 (1
, 52)
(660
)
42.6
26.8
12.6
18.0
2.8
(4.0
)2.
0 (1
, 52)
(374
)
38.2
27.3
13.9
20.6
3.1
(5.1
)2.
0 (1
, 52)
(80)
30.5
26.3
16.3
22.5
6.8
(38.
0)2.
0 (1
, 365
)
(562
)
41.5
26.9
13.2
18.5
3.5
(15.
0)2.
0 (1
, 365
)
(280
)
39.3
28.2
14.3
18.2
2.9
(4.4
)2.
0 (1
, 52)
(229
)
39.7
25.8
12.7
21.8
2.9
(3.2
)2.
0 (1
, 25)
(43)
39.5
25.6
11.6
23.3
3.0
(3.3
)2.
0 (1
, 20)
Cur
rent
sm
oker
s w
ho h
ave
tried
to q
uit
smok
ing:
B10
. Met
hod(
s) u
sed
whe
n at
tem
pted
to
quit
smok
ingc C
old
turk
ey/ju
st g
ave
up
Nic
otin
e pa
tche
s Zy
ban
Nic
otin
e gu
m
Nic
otin
e lo
zeng
es
Red
uced
the
no. o
f Cig
aret
tes
Sm
oked
Use
d hy
pnos
isN
icot
ine
inha
ler
Cal
led
the
Qui
tline
R
educ
ed n
icot
ine
leve
l H
elp
from
fam
ily/fr
iend
s S
top
smok
ing
cour
se
Oth
er
(111
5)
66.2
28.9
10.6 7.3
3.9
2.4
1.8
1.0
0.7
0.5
0.4
0.1
9.7
(597
)
66
.6
27.5
11
.1
6.4
4.
4
1.8
1.
3
0.3
0.
2
0.7
0.
5
0.2
8.
5
(518
)
65.8
30.7
10.1 8.3
3.3
3.3
2.3
1.7
1.2
0.2
0.2
0.0
11.2
(660
)
72.4
25.9 8.2
6.1
3.6
1.8
0.8
0.9
0.2
0.3
0.5
0.0
8.3
(375
)
55.7
34.9
15.5 9.9
4.5
2.9
3.7
1.1
1.6
0.5
0.3
0.3
12.0
(80)
63.3
25.3 8.8
6.3
2.5
5.1
1.3
1.3
0.0
1.3
1.3
0.0
11.3
(562
)
66.4
29.8 9.1
7.3
4.8
2.1
1.4
0.5
0.0
0.7
0.2
0.0
8.6
(280
)
61.8
30.1
14.7 7.9
3.2
2.2
2.5
0.7
2.5
0.0
0.4
0.0
10.4
(229
)
69.9
13.6 9.2
6.1
3.1
3.1
2.2
2.6
0.0
0.4
0.9
0.4
10.5
(43)
72.1
13.6
11.4 9.1
0.0
4.5
0.0
0.0
0.0
2.3
0.0
0.0
15.9

Queensland Cancer Fund
V i e r t e l C e n t r e f o r R e s e a r c h i n C a n c e r C o n t r o l
Queensland Cancer Risk Study
52
Sex
Age
gro
up (y
ears
)r
emot
enes
s (A
riA
+ ca
tego
r�es)
b
(n)
%
mal
eFe
mal
e20
-39
40-5
960
-75
maj
or c
�tyin
ner
reg�
onal
Out
er
reg�
onal
rem
ote/
very
rem
ote
(n=4
698
%(n
=472
1)%
(n=4
016)
%(n
=381
4)%
(n=1
589)
%(n
=512
6)%
(n=2
372)
%(n
=170
3)%
(n=2
09)
%
Cur
rent
sm
oker
s w
ho h
ave
tried
to q
uit
smok
ing:
B11
. In
the
past
12
mon
ths,
wha
t was
the
long
est y
ou w
ere
able
to re
frain
from
sm
okin
g be
caus
e yo
u w
ere
tryin
g to
qu
it (d
ays)
?<2
day
s2
to 1
4 da
ys15
to 3
0 da
ys>3
0 da
ys
Mea
n (S
D)
Med
ian
(min
, max
)
(110
9) 6.9
47.2
15.6
30.2
(595
)
7.
7
48.6
14
.6
29.1 d
14(.4
,360
)
(514
)
5.
8
45.7
16
.9
31.5 d
10 (.
5,36
0)
(657
)
6.1
43.7
17.0
33.2 d
17 (1
,360
)
(373
)
8.3
52.0
13.7
26.0
d
10 (.
4, 2
70)
(79) 7.6
53.2
12.7
26.6 d
8.6
(.5,3
60)
(561
)
6.8
45.3
18.0
29.9 d
14 (.
5,36
0)
(279
)
6.1
50.9
13.3
29.7
d
14 (.
4,30
0)
(227
)
7.9
45.4
14.1
32.6 d
14 (1
,270
)
(43) 9.
355
.8 9.3
25.6
d
14 (1
,360
)
Cur
rent
sm
oker
s:B
12. I
nten
tions
rega
rdin
g qu
ittin
g sm
okin
g in
the
futu
re:
Inte
nd to
qui
t in
the
next
mon
thIn
tend
to q
uit i
n th
e ne
xt 6
mon
ths
Inte
nd to
qui
t but
not
in th
e ne
xt 6
mon
ths
Nev
er in
tend
to q
uit
Don
’t kn
ow
(216
4)
20.1
30.5
34.4 8.7
6.3
(118
2)
21
.3
27.8
35
.2
9.3
6.
3
(982
)
18.6
33.6
33.5 8.0
6.2
(120
7)
21.7
31.5
36.8 5.4
4.6
(796
)
17.7
29.6
33.8
11.3 7.5
(159
)
20.1
26.4
20.1
21.4
11.9
(110
6)
19.8
31.0
35.5 8.1
5.5
(565
)
21.4
28.3
33.6 8.5
8.1
(424
)
18.9
30.9
34.4
10.1 5.7
(69)
23.2
36.2
23.2
11.6 5.8

Queensland Cancer Risk Study
Queensland Cancer Fund
53
Queensland Cancer Risk Study
Sex
Age
gro
up (y
ears
)r
emot
enes
s (A
riA
+ ca
tego
r�es)
b
(n)
%
mal
eFe
mal
e20
-39
40-5
960
-75
maj
or c
�tyin
ner
reg�
onal
Out
er
reg�
onal
rem
ote/
very
rem
ote
(n=4
698
%(n
=472
1)%
(n=4
016)
%(n
=381
4)%
(n=1
589)
%(n
=512
6)%
(n=2
372)
%(n
=170
3)%
(n=2
09)
%
Cur
rent
sm
oker
s w
ho in
tend
to q
uit i
n th
e fu
ture
:B
13. M
etho
d yo
u w
ould
use
if y
ou w
ere
to
atte
mpt
to q
uit s
mok
ing
in th
e fu
ture
c
C
old
turk
ey/ju
st g
ive
upN
icot
ine
patc
hes
Zyba
nN
icot
ine
gum
Nic
otin
e lo
zeng
esR
educ
e th
e nu
mbe
r of c
igar
ette
s sm
oked
Use
hyp
nosi
sN
icot
ine
inha
ler
Cal
l the
Qui
tline
Red
uce
nico
tine
leve
lH
elp
from
fam
ily/fr
iend
sS
top
smok
ing
cour
se
Oth
er
(197
5)
50.0
29.8 6.6
3.9
2.7
2.8
5.1
0.7
0.6
0.3
0.6
0.2
19.9
(107
2)
50.
6
28.0
7.
1
4.5
2.
2
3.2
4.
5
0.4
0.
7
0.3
0.
8
0.3
21
.4
(904
)
49.2
31.9
6.1
3.2
3.2
2.4
5.9
1.1
0.6
0.2
0.3
0.2
18.1
(114
3)
51.2
32.6 6.3
4.1
2.5
2.7
4.3
0.9
0.5
0.2
0.8
0.0
18.3
(707
)
46.8
26.6 7.6
3.5
2.7
2.8
6.9
0.4
0.8
0.3
0.4
0.6
22.8
(126
)
55.6
21.4 4.0
3.2
3.2
4.0
1.6
0.0
0.8
0.8
0.0
0.0
18.4
(101
6)
48.8
30.5 5.6
4.2
2.9
3.3
6.0
0.5
0.6
0.2
0.3
0.3
18.9
(517
)
50.1
29.0 9.7
3.1
2.9
2.1
4.3
0.8
0.8
0.2
0.8
0.2
21.9
(382
)
51.8
30.1 5.5
3.9
2.1
2.6
3.9
1.0
0.3
0.3
1.0
0.3
20.7
(61)
55.7
19.7 6.6
3.9
0.0
1.6
3.3
0.0
3.3
1.6
1.7
0.0
14.8
past
sm
oker
s
B14
. H
ow lo
ng h
as it
bee
n si
nce
you
quit
smok
ing
ciga
rette
s?
<12
mon
ths
1 - <
5 ye
ars
5 - <
10 y
ears
10 -
<20
year
s20
- <3
0 ye
ars
30+
year
s
Mea
n (S
D)
Med
ian
(min
, max
)
(285
6) 9.2
15.8
15.4
26.4
18.8
14.5
(163
2)
7.
8
15.6
14
.2
25.6
20
.1
16.9
186.
5(14
7)16
8(.0
,183
6)
(122
4)
11.0
16.1
17.1
27.5
17.0
11.2
158.
8(13
3.4)
132(
.0,6
36)
(872
)
17.2
29.7
25.2
25.6 2.3
0.0
75.2
(65.
6)60
(.1,3
24)
(130
7)
6.9
11.2
12.5
27.6
28.2
13.7
192.
0(11
24.3
)18
0(.0
,516
)
(674
)
3.3
6.8
8.3
24.9
22.0
34.7
269.
1(16
7.4)
240(
.0,1
836)
(153
1)
8.8
17.0
15.7
26.1
18.3
14.1
170.
0(13
8.7)
144(
.0,7
68)
(741
)
8.6
14.4
14.2
27.0
20.8
15.0
184.
4(15
1.0)
156(
.0,1
836)
(527
)
11.0
14.8
15.7
26.4
17.8
14.2
172.
5(14
0)14
4(.1
,720
)
(52) 5.
813
.517
.328
.815
.419
.2
185.
4(13
4.9)
180(
.7,5
04)

Queensland Cancer Fund
V i e r t e l C e n t r e f o r R e s e a r c h i n C a n c e r C o n t r o l
Queensland Cancer Risk Study
54
Sex
Age
gro
up (y
ears
)r
emot
enes
s (A
riA
+ ca
tego
r�es)
b
(n)
%
mal
eFe
mal
e20
-39
40-5
960
-75
maj
or c
�tyin
ner
reg�
onal
Out
er
reg�
onal
rem
ote/
very
rem
ote
(n=4
698
%(n
=472
1)%
(n=4
016)
%(n
=381
4)%
(n=1
589)
%(n
=512
6)%
(n=2
372)
%(n
=170
3)%
(n=2
09)
%
B15
. Met
hod(
s) y
ou u
sed
to q
uit s
mok
ingc
C
old
turk
ey/ju
st g
ave
upN
icot
ine
patc
hes
Zyba
nN
icot
ine
gum
Nic
otin
e lo
zeng
esR
educ
ed th
e no
. of c
igar
ette
s sm
oked
Use
d hy
pnos
is
Nic
otin
e in
hale
rC
alle
d th
e Q
uitli
neR
educ
ed n
icot
ine
leve
l
Hel
p fro
m fa
mily
/frie
nds
Sto
p sm
okin
g co
urse
O
ther
(286
2)
81.1 5.8
2.3
2.6
0.6
2.1
1.6
0.1
0.1
0.6
1.1
0.3
14.4
(163
7)
81.6 5.3
2.4
2.3
0.9
1.5
1.7
0.1
0.1
0.9
1.1
0.5
13.6
(122
5)
80.4 6.4
2.1
3.1
0.2
2.9
1.6
0.2
0.1
0.2
1.1
0.1
15.5
(875
)
80.6 5.3
2.4
2.2
0.9
1.5
1.7
0.5
0.1
0.9
1.1
0.3
13.6
(131
1)
80.7 5.4
2.1
3.5
0.2
2.9
1.6
0.0
0.1
0.2
1.1
0.3
15.5
(676
)
82.5 3.8
2.3
1.5
0.6
2.1
1.6
0.0
0.1
0.6
1.1
0.3
14.4
(153
6)
81.0 5.8
2.3
3.2
0.9
2.4
1.9
0.1
0.1
0.7
0.8
0.4
13.0
(743
)
81.6 5.1
1.9
1.5
0.1
2.4
1.5
0.0
0.0
0.5
1.6
0.3
16.0
(528
)
79.7 6.6
3.2
2.7
0.4
0.9
1.3
0.2
0.2
0.2
1.1
0.2
16.5
(53)
92.3 3.8
0.0
1.9
0.0
0.0
0.0
0.0
0.0
0.0
1.9
0.0
7.7
Oth
er to
bacc
o us
e
B16
. Do
you
curr
ently
sm
oke
ciga
rs?
Ye
s
No/
Don
’t kn
ow
(941
9) 2.1
97.9
(469
7)
3.7
96.3
(472
1)
0.4
99.9
(401
6)
2.8
97.2
(381
4) 1.7
98.3
(158
9)
1.1
98.9
(512
6)
2.2
97.8
(237
1) 1.8
98.2
(170
3)
2.1
97.9
(209
)
1.4
98.6
B17
. Do
you
curr
ently
sm
oke
a pi
pe?
Ye
s
No/
Don
’t kn
ow
(941
9) 0.4
99.6
(469
7)
0.7
99.3
(472
2)
0.1
99.9
(401
7)
0.4
99.6
(381
4) 0.3
99.7
(158
9)
0.6
99.4
(512
6)
0.3
99.7
(237
1) 0.6
99.4
(170
3)
0.4
99.6
(209
)
0.0
100.
0
B18
. Do
you
curr
ently
che
w to
bacc
o?
Ye
s
No/
Don
’t kn
ow
(941
9) 0.1
99.9
(469
8)
0.2
99.8
(472
2)
0.0
100.
0
(401
6)
0.1
99.9
(381
4) 0.1
99.9
(158
9)
0.0
100.
0
(512
6)
0.1
99.9
(237
1) 0.0
100.
0
(170
3)
0.1
99.9
(209
)
0.5
99.5

Queensland Cancer Risk Study
Queensland Cancer Fund
55
Queensland Cancer Risk Study
a C
olum
n pe
rcen
tage
s ar
e st
anda
rdis
ed to
the
2003
Que
ensl
and
popu
latio
n by
age
, sex
and
geo
grap
hic
loca
tion.
b A
cces
sibi
lity/
Rem
oten
ess
Inde
x of
Aus
tralia
c D
oes
not a
dd u
p to
100
% a
s qu
estio
n al
low
s fo
r mul
tiple
resp
onse
s.d N
ot a
pplic
able
to c
alcu
late
an
arith
met
ic m
ean
as th
e di
strib
utio
n w
as s
kew
ed.

Queensland Cancer Fund
V i e r t e l C e n t r e f o r R e s e a r c h i n C a n c e r C o n t r o l
Queensland Cancer Risk Study
56
App
endi
x C
. Des
crip
tive
stat
istic
s for
Cha
pter
4: A
LCO
HO
La (n=
9419
)
Sex
Age
gro
up (y
ears
)r
emot
enes
s (A
riA
+ ca
tego
r�es)
b
(n)
%
mal
eFe
mal
e20
-39
40-5
960
-75
maj
or c
�tyin
ner
reg�
onal
Out
er
reg�
onal
rem
ote/
very
rem
ote
(n=4
698)
%
(n
=472
1)%
(n=4
016)
%(n
=381
4)%
(n=1
589)
%(n
=512
6)%
(n=2
372)
%(n
=170
3)%
(n=2
09)
%
Alc
ohol
inta
ke:
C1.
Whi
ch o
f the
follo
win
g be
st d
escr
ibes
y
ou?
Cur
rent
ly d
rink
alco
hol a
t lea
st o
nce
/mon
thC
urre
ntly
drin
k al
coho
l <on
ce p
er m
onth
Life
-long
non
-drin
ker
Use
d to
drin
k al
coho
l but
hav
e st
oppe
d
(941
6)
66.4
18.2 7.8
7.6
(469
4)
75.6
12.0 5.5
7.0
(472
2)
57.4
24.5
10.0 8.1
(401
5)
67.7
20.0 5.4
7.0
(381
2)
67.8
17.1 8.0
7.1
(158
9)
59.9
16.7
13.3
10.1
(512
4)
67.4
17.9 7.6
7.2
(237
2)
65.4
18.0 8.3
8.2
(170
1)
65.9
19.7 7.5
6.9
(210
)
61.4
18.1 6.7
13.8
Reg
ular
drin
kers
:C
2. H
ow o
ld w
ere
you
whe
n yo
u fir
st s
tarte
d to
drin
k al
coho
l at l
east
onc
e a
mon
th?
<12
12-1
516
-17
18-2
425
+
Mea
n (S
D)
Med
ian
(min
, max
)
(625
7) 1.0
7.3
23.7
49.8
18.3
(354
8)
1.2
9.0
28.2
51.6 9.9
19.0
(5.3
)18
.0 (1
, 67)
(271
0)
0.7
5.1
17.7
47.3
29.1
22.7
(9.1
)19
.0 (3
, 73)
(271
9)
0.5
8.8
29.8
53.0 7.9
18.5
(3.5
)18
.0 (3
,37)
(258
6) 1.4
6.4
21.5
49.0
21.7
21.0
(7.2
)18
.0 (4
, 57)
(951
)
1.3
5.7
12.1
42.5
38.5
25.7
(12.
2)21
.0 (1
, 73)
(345
3) 1.0
6.9
24.2
49.8
18.0
20.5
(7.3
)18
.0 (2
, 73)
(155
2) 1.0
8.2
21.5
48.4
20.9
21.2
(8.3
)18
.0 (1
, 72)
(112
0)
1.1
7.1
25.1
51.0
15.7
20.2
(6.8
)18
.0 (3
, 70)
(129
)
0.0
7.8
24.0
54.3
14.0
19.5
(5.2
)18
.0 (1
2, 6
5)

Queensland Cancer Risk Study
Queensland Cancer Fund
57
Queensland Cancer Risk Study
Sex
Age
gro
up (y
ears
)r
emot
enes
s (A
riA
+ ca
tego
r�es)
b
(n)
%
mal
eFe
mal
e20
-39
40-5
960
-75
maj
or c
�tyin
ner
reg�
onal
Out
er
reg�
onal
rem
ote/
very
rem
ote
(n=4
698)
%
(n
=472
1)%
(n=4
016)
%(n
=381
4)%
(n=1
589)
%(n
=512
6)%
(n=2
372)
%(n
=170
3)%
(n=2
09)
%
Reg
ular
drin
kers
:C
3. D
urin
g th
e la
st 1
2 m
onth
s, o
n ho
w
man
y da
ys p
er w
eek
did
you
usua
lly
drin
k al
coho
l? Less
than
one
day
a w
eek
1 or
2 d
ays
a w
eek
3 or
4 d
ays
a w
eek
5 or
6 d
ays
a w
eek
Eve
ry d
ay
(624
8)
21.1
33.4
20.5
11.1
13.8
(354
2)
16.3
32.3
22.2
12.7
16.6
(270
6)
27.4
35.0
18.4 9.1
10.2
(271
5)
27.7
41.3
18.5 7.0
5.5
(258
0)
16.5
29.6
22.9
14.3
16.7
(952
)
14.7
21.5
19.7
14.3
29.7
(344
7)
22.3
34.4
20.6
11.2
11.6
(155
2)
18.6
32.2
20.5
11.3
17.3
(111
9)
20.8
32.5
20.4
10.6
15.6
(128
)
21.1
32.0
20.3
10.9
15.6
Reg
ular
drin
kers
:C
4. O
n a
day
whe
n yo
u dr
ink
alco
hol,
how
m
any
drin
ks w
ould
you
nor
mal
ly h
ave?
Abo
ve th
e re
com
men
ded
drin
king
leve
lc
With
in th
e re
com
men
ded
drin
king
leve
ld
(625
7)
63.5
36.5
(354
7)
57.9
42.1
(271
0)
70.8
29.2
(271
9)
72.2
27.8
(258
6)
61.5
38.5
(952
)
44.1
55.9
(345
2)
62.1
37.9
(155
2)
63.9
36.1
(112
1)
66.6
33.4
(128
)
69.5
30.5
Reg
ular
drin
kers
:C
5. D
urin
g th
e la
st 1
2 m
onth
s, h
ow o
ften
did
you
have
five
or m
ore
drin
ks o
f al
coho
l on
one
occa
sion
?
Nev
erLe
ss th
an o
nce
a m
onth
Abo
ut o
nce
a m
onth
Abo
ut o
nce
a w
eek
Mor
e th
an o
nce
a w
eek
Eve
ryda
y
(612
4)
24.0
30.3
19.2
10.8 9.3
6.3
(342
2)
15.5
27.3
21.2
13.7
12.9 9.4
(270
1)
34.9
34.1
16.7 7.2
4.8
2.4
(269
2)
12.6
32.1
22.8
14.0
11.3 7.3
(251
1)
27.4
31.3
17.7 9.3
8.4
5.9
(922
)
48.5
22.5
12.8 5.9
6.1
4.3
(339
1)
24.9
32.2
18.6
10.4 7.9
6.0
(151
6)
25.5
29.0
18.0 9.9
11.3 6.3
(109
0)
20.8
26.4
21.8
13.0
10.5 7.4
(123
)
12.2
29.3
26.0
13.8
13.8 4.9

Queensland Cancer Fund
V i e r t e l C e n t r e f o r R e s e a r c h i n C a n c e r C o n t r o l
Queensland Cancer Risk Study
58
Sex
Age
gro
up (y
ears
)r
emot
enes
s (A
riA
+ ca
tego
r�es)
b
(n)
%
mal
eFe
mal
e20
-39
40-5
960
-75
maj
or c
�tyin
ner
reg�
onal
Out
er
reg�
onal
rem
ote/
very
rem
ote
(n=4
698)
%
(n
=472
1)%
(n=4
016)
%(n
=381
4)%
(n=1
589)
%(n
=512
6)%
(n=2
372)
%(n
=170
3)%
(n=2
09)
%
Reg
ular
drin
kers
:C
6. C
ompa
red
with
12
mon
ths
ago,
on
aver
age
do y
ou n
ow d
rink:
Less
Abo
ut th
e sa
me
Mor
e
(625
2)
31.8
56.8
11.4
(354
6)
32.5
58.1 9.4
(270
6)
30.8
55.2
14.0
(271
4)
37.5
45.5
17.0
(258
6)
27.8
64.2 8.1
(951
)
26.4
69.3 4.3
(344
8)
31.1
56.3
12.6
(155
1)
30.9
58.3
10.7
(112
1)
34.7
56.3 9.0
(128
)
34.4
57.0 8.6
Pas
t drin
kers
:C
7. H
ow o
ld w
ere
you
whe
n yo
u st
oppe
d dr
inki
ng a
lcoh
ol?
Mea
n (S
D)
Med
ian
(min
, max
)
(705
)(3
28)
38.0
(13.
7)37
.0 (4
, 73)
(376
)
32.9
(12.
9)28
.0(1
0,74
)
(277
)
25.8
(5.1
)25
.0(1
6,39
)
(271
)
37.3
(11.
3)39
.0 (4
, 59)
(157
)
48.5
(14.
7)50
.0 (6
, 74)
(363
)
34.9
(13.
3)31
.0 (6
, 73)
(193
)
36.3
(13.
9)34
.1 (9
, 74)
(118
)
35.7
(13.
9)31
.5 (6
, 73)
(29)
31.7
(11.
7)29
.7 (4
, 61)
a C
olum
n pe
rcen
tage
s ar
e st
anda
rdis
ed to
the
2003
Que
ensl
and
popu
latio
n by
age
, sex
and
geo
grap
hic
loca
tion.
b A
cces
sibi
lity/
Rem
oten
ess
Inde
x of
Aus
tralia
c A
bove
the
reco
mm
ende
d dr
inki
ng le
vel i
s de
fined
as
mor
e th
an tw
o st
anda
rd d
rinks
for m
en a
nd m
ore
than
one
sta
ndar
d dr
ink
for w
omen
d W
ithin
the
reco
mm
ende
d dr
inki
ng le
vel i
s de
fined
as
no m
ore
than
two
stan
dard
drin
ks fo
r men
and
one
for w
omen

Queensland Cancer Risk Study
Queensland Cancer Fund
59
Queensland Cancer Risk Study
Sex
Age
gro
up (y
ears
)r
emot
enes
s (A
riA
+ ca
tego
r�es)
b
(n)
%
mal
eFe
mal
e20
-39
40-5
960
-75
maj
or c
�tyin
ner
reg�
onal
Out
er
reg�
onal
rem
ote/
very
rem
ote
(n=4
698)
%
(n
=472
1)%
(n=4
016)
%(n
=381
4)%
(n=1
589)
%(n
=512
6)%
(n=2
372)
%(n
=170
3)%
(n=2
09)
%
Reg
ular
drin
kers
:C
6. C
ompa
red
with
12
mon
ths
ago,
on
aver
age
do y
ou n
ow d
rink:
Less
Abo
ut th
e sa
me
Mor
e
(625
2)
31.8
56.8
11.4
(354
6)
32.5
58.1 9.4
(270
6)
30.8
55.2
14.0
(271
4)
37.5
45.5
17.0
(258
6)
27.8
64.2 8.1
(951
)
26.4
69.3 4.3
(344
8)
31.1
56.3
12.6
(155
1)
30.9
58.3
10.7
(112
1)
34.7
56.3 9.0
(128
)
34.4
57.0 8.6
Pas
t drin
kers
:C
7. H
ow o
ld w
ere
you
whe
n yo
u st
oppe
d dr
inki
ng a
lcoh
ol?
Mea
n (S
D)
Med
ian
(min
, max
)
(705
)(3
28)
38.0
(13.
7)37
.0 (4
, 73)
(376
)
32.9
(12.
9)28
.0(1
0,74
)
(277
)
25.8
(5.1
)25
.0(1
6,39
)
(271
)
37.3
(11.
3)39
.0 (4
, 59)
(157
)
48.5
(14.
7)50
.0 (6
, 74)
(363
)
34.9
(13.
3)31
.0 (6
, 73)
(193
)
36.3
(13.
9)34
.1 (9
, 74)
(118
)
35.7
(13.
9)31
.5 (6
, 73)
(29)
31.7
(11.
7)29
.7 (4
, 61)
a C
olum
n pe
rcen
tage
s ar
e st
anda
rdis
ed to
the
2003
Que
ensl
and
popu
latio
n by
age
, sex
and
geo
grap
hic
loca
tion.
b A
cces
sibi
lity/
Rem
oten
ess
Inde
x of
Aus
tralia
c A
bove
the
reco
mm
ende
d dr
inki
ng le
vel i
s de
fined
as
mor
e th
an tw
o st
anda
rd d
rinks
for m
en a
nd m
ore
than
one
sta
ndar
d dr
ink
for w
omen
d W
ithin
the
reco
mm
ende
d dr
inki
ng le
vel i
s de
fined
as
no m
ore
than
two
stan
dard
drin
ks fo
r men
and
one
for w
omen
App
endi
x D
. Des
crip
tive
stat
istic
s for
Cha
pter
5: D
IETa (
n=94
19)
Sex
Age
gro
up (y
ears
)r
emot
enes
s (A
riA
+ ca
tego
r�es)
b
(n)
%
mal
eFe
mal
e20
-39
40-5
960
-75
maj
or c
�tyin
ner
reg�
onal
Out
er
reg�
onal
rem
ote/
very
rem
ote
(n=4
698)
%(n
=472
1)%
(n=4
016)
%(n
=381
4)%
(n=1
589)
%(n
=512
6)%
(n=2
372)
%(n
=170
3)%
(n=2
09)
%
vege
tabl
e an
d fr
u�t �
ntak
e
D1.
Thi
nkin
g ov
er th
e pa
st 1
2 m
onth
s,
how
man
y se
rves
of v
eget
able
s do
yo
u us
ually
eat
eac
h da
y?
Less
than
one
ser
ve1
serv
e2
serv
es3
serv
es4
serv
es5
serv
es6
serv
es o
r mor
eD
on’t
eat v
eget
able
sD
on’t
know
(941
8) 4.1
19.4
30.8
19.2
14.3 5.6
6.3
0.1
0.2
(469
6)
5.3
23.8
32.2
15.7
12.6 4.4
5.7
0.2
0.2
(472
2)
3.0
15.0
29.5
22.7
16.0 6.8
6.9
0.1
0.1
(401
5)
5.3
24.0
33.3
16.4
11.8 4.0
5.0
0.1
0.2
(381
4)
3.7
17.3
30.5
20.9
14.7 6.0
6.7
0.2
0.2
(159
0)
2.1
12.8
25.3
22.1
19.7 8.7
8.9
0.2
0.1
(512
7)
4.5
21.7
30.6
17.8
14.2 5.1
5.9
0.1
0.1
(236
9)
3.5
16.4
32.0
20.4
14.4 6.3
6.6
0.1
0.3
(170
3)
3.8
16.8
29.7
21.1
15.0 6.4
6.9
0.2
0.1
(210
)
3.3
17.1
32.4
23.8 9.5
5.2
8.1
0.0
0.5
D2.
Mee
ting
reco
mm
ende
d da
ily in
take
of
vege
tabl
es (5
ser
ves
or m
ore)
?
Yes
No
(940
2)
11.9
88.1
(468
6)
10.2
89.8
(471
5)
13.7
86.3
(400
8)
9.0
91.0
(380
6)
12.7
87.3
(158
7)
17.6
82.4
(511
9)
11.0
89.0
(236
5)
12.9
87.1
(170
1)
13.3
86.7
(208
)
13.5
86.5
D3.
Are
you
eat
ing
the
sam
e am
ount
of
vege
tabl
es n
ow a
s yo
u w
ere
abou
t 12
mon
ths
ago?
Yes
– sa
me
No
– ea
ting
mor
eN
o –
eatin
g le
ssD
on’t
know
Don
’t ea
t veg
etab
les
(941
9)
78.4
14.8 6.5
0.2
0.1
(469
7)
80.9
13.5 5.3
0.3
0.1
(472
2)
76.0
16.2 7.7
0.1
0.0
(401
6)
72.7
19.5 7.5
0.2
0.1
(381
4)
81.9
12.5 5.3
0.2
0.0
(159
0)
84.5 8.6
6.8
0.1
0.1
(512
6)
77.9
15.6 6.3
0.2
0.1
(237
1)
80.2
12.6 7.0
0.1
0.0
(170
2)
77.4
16.3 6.1
0.2
0.0
(209
)
81.8
10.0 8.1
0.0
0.0

Queensland Cancer Fund
V i e r t e l C e n t r e f o r R e s e a r c h i n C a n c e r C o n t r o l
Queensland Cancer Risk Study
60
Sex
Age
gro
up (y
ears
)r
emot
enes
s (A
riA
+ ca
tego
r�es)
b
(n)
%
mal
eFe
mal
e20
-39
40-5
960
-75
maj
or c
�tyin
ner
reg�
onal
Out
er
reg�
onal
rem
ote/
very
rem
ote
(n=4
698)
%(n
=472
1)%
(n=4
016)
%(n
=381
4)%
(n=1
589)
%(n
=512
6)%
(n=2
372)
%(n
=170
3)%
(n=2
09)
%
D4.
Thi
nkin
g ba
ck o
ver t
he p
ast 1
2 m
onth
s, h
ow m
any
serv
es o
f fru
it do
yo
u us
ually
eat
eac
h da
y?
Less
than
1 s
erve
1 se
rve
2 se
rves
3 se
rves
4 se
rves
5 se
rves
6 se
rves
or m
ore
Don
’t ea
t fru
itD
on’t
know
(941
9)
19.5
33.4
26.9
12.1 4.4
1.2
0.8
1.6
0.1
(469
6)
24.2
33.6
24.4 9.8
3.9
1.0
0.9
1.9
0.1
(472
0)
14.7
33.3
29.4
14.4 4.9
1.3
0.7
1.2
0.0
(401
6)
23.9
35.9
23.8 9.2
3.4
0.8
0.7
2.3
0.1
(381
3)
17.8
33.1
27.9
12.6 5.2
1.3
0.9
1.2
0.1
(158
9)
12.1
28.0
32.8
18.3 5.2
1.7
1.0
0.7
0.1
(512
6)
18.4
33.4
26.7
13.0 4.6
1.2
0.8
1.8
0.1
(237
1)
19.2
32.0
29.8
11.4 4.3
1.0
1.1
1.2
0.0
(170
2)
22.2
35.5
23.9
10.8 4.1
1.2
0.7
1.6
0.1
(210
)
25.2
31.9
23.3
10.5 5.2
1.9
0.5
1.4
0.0
D5.
Mee
ting
reco
mm
ende
d da
ily in
take
of
fruit
(2 s
erve
s or
mor
e)?
Yes
No
(941
2)
45.5
54.5
(469
2)
40.2
59.8
(472
0)
50.8
49.2
(401
3)
37.9
62.1
(381
1)
47.9
52.1
(158
7)
59.1
40.9
(512
1)
46.3
53.7
(237
1)
47.5
52.5
(170
2)
40.7
59.3
(209
)
41.1
58.9
D6.
Are
you
eat
ing
the
sam
e am
ount
of
frui
t now
, as
you
wer
e ab
out 1
2 m
onth
s ag
o?Ye
s –
sam
eN
o –
eatin
g m
ore
No
– ea
ting
less
Don
’t kn
owD
on’t
eat f
ruit
(941
9)
74.7
15.3 8.7
0.2
1.1
(469
8)
76.7
14.2 7.5
0.1
1.4
(472
2)
72.7
16.4
10.0 0.2
0.8
(401
6)
68.7
18.0
11.5 0.1
1.7
(381
3)
78.0
14.1 7.0
0.1
0.7
(158
8)
82.0
11.2 6.0
0.2
0.6
(512
6)
74.5
15.4 8.7
0.2
1.2
(237
1)
75.7
14.8 8.5
0.1
0.9
(170
3)
73.6
16.1 9.2
0.1
1.1
(210
)
76.7
11.9 9.5
0.0
1.9
D7.
Mee
ting
both
reco
mm
ende
d da
ily
inta
ke o
f veg
etab
les
and
fruit?
No
Yes
(941
9)
92.3 7.7
(469
8)
93.9 6.1
(472
2)
90.7 9.3
(401
7)
94.9 5.1
(381
4)
91.6 8.4
(158
9)
87.1
12.9
(512
6)
92.7 7.3
(237
2)
91.4 8.6
(170
2)
92.3 7.7
(209
)
91.4 8.6

Queensland Cancer Risk Study
Queensland Cancer Fund
61
Queensland Cancer Risk Study
Sex
Age
gro
up (y
ears
)r
emot
enes
s (A
riA
+ ca
tego
r�es)
b
(n)
%
mal
eFe
mal
e20
-39
40-5
960
-75
maj
or c
�tyin
ner
reg�
onal
Out
er
reg�
onal
rem
ote/
very
rem
ote
(n=4
698)
%(n
=472
1)%
(n=4
016)
%(n
=381
4)%
(n=1
589)
%(n
=512
6)%
(n=2
372)
%(n
=170
3)%
(n=2
09)
%
kno
wle
dge
of re
com
men
ded
da�ly
�n
take
D8.
Do
you
know
wha
t the
reco
mm
ende
d da
ily in
take
of v
eget
able
s is
for
adul
ts?
Yes
No
(941
9)
29.8
70.2
(469
8)
17.3
82.7
(472
1)
42.2
57.8
(401
7)
34.6
65.4
(381
4)
28.1
71.9
(158
9)
21.7
78.3
(512
6)
35.6
64.4
(237
2)
24.6
75.4
(170
3)
21.0
79.0
(209
)
18.2
81.8
Res
pond
ents
who
sai
d th
ey k
now
the
RD
I fo
r veg
etab
les:
D9.
Wha
t is
the
reco
mm
ende
d da
ily
inta
ke o
f veg
etab
les
for a
dults
? 1 se
rve
2 se
rves
3 se
rves
4 se
rves
5 se
rves
Mor
e th
an 5
ser
ves
(280
3) 3.4
14.0
25.8
15.6
31.4 9.7
(812
)
6.5
20.0
26.0
15.0
22.8 9.7
(199
2)
2.2
11.6
25.8
15.8
34.9 9.7
(138
7)
3.2
14.0
28.7
15.6
27.8
10.7
(107
1)
3.4
14.6
23.7
15.6
34.4 8.4
(344
)
4.7
12.2
20.9
15.7
36.9 9.6
(182
6)
3.5
14.6
25.0
16.2
30.3
10.5
(585
)
3.2
12.5
27.0
14.7
33.7 8.9
(356
)
3.1
13.2
28.4
14.6
33.1 7.6
(38) 7.9
15.8
28.9 7.9
36.8 2.6
D10
. K
now
ledg
e an
d be
havi
our
(veg
etab
le in
take
)
Kne
w a
nd m
et g
uide
lines
Kne
w a
nd d
idn’
t mee
t gui
delin
esD
idn’
t kno
w a
nd d
idn’
t mee
t gui
delin
esIn
corr
ectly
kne
wD
idn’
t kno
w b
ut m
et g
uide
lines
(941
9) 1.7
7.6
61.8
20.4 8.4
(469
9)
0.3
3.7
73.6
13.3 9.1
(472
2)
3.1
11.6
50.0
27.4 7.8
(401
5)
1.0
8.6
59.1
24.9 6.4
(381
4)
2.1
7.5
63.5
18.4 8.4
(158
9)
2.5
5.5
64.8
13.7
13.5
(512
6)
1.7
9.1
57.0
24.8 7.4
(237
2)
1.9
6.4
66.1
16.3 9.2
(170
2)
1.6
5.3
69.3
14.0 9.8
(210
)
1.0
5.7
71.0
11.4
11.0
D11
. Do
you
know
wha
t the
re
com
men
ded
daily
inta
ke o
f fru
it is
fo
r adu
lts?
Yes
No
(941
9)
27.7
72.3
(469
8)
14.5
85.5
(472
1)
40.8
59.2
(401
7)
27.2
72.8
(381
4)
29.0
71.0
(158
9)
25.8
74.2
(512
6)
30.1
69.9
(237
1)
25.7
74.3
(170
3)
24.6
75.4
(209
)
16.7
83.3

Queensland Cancer Fund
V i e r t e l C e n t r e f o r R e s e a r c h i n C a n c e r C o n t r o l
Queensland Cancer Risk Study
62
Sex
Age
gro
up (y
ears
)r
emot
enes
s (A
riA
+ ca
tego
r�es)
b
(n)
%
mal
eFe
mal
e20
-39
40-5
960
-75
maj
or c
�tyin
ner
reg�
onal
Out
er
reg�
onal
rem
ote/
very
rem
ote
(n=4
698)
%(n
=472
1)%
(n=4
016)
%(n
=381
4)%
(n=1
589)
%(n
=512
6)%
(n=2
372)
%(n
=170
3)%
(n=2
09)
%
Res
pond
ents
who
sai
d th
ey k
now
the
RD
I fo
r fru
it:D
12. W
hat i
s th
e re
com
men
ded
daily
in
take
of f
ruit
for a
dults
?1
serv
e2
serv
es3
serv
es4
serv
es5
serv
esM
ore
than
5 s
erve
s
(260
7) 7.6
36.2
42.8 7.1
5.4
0.9
(681
)
16.6
40.1
28.0 5.7
7.6
1.9
(192
7)
4.4
34.8
48.1 7.6
4.7
0.5
(109
1)
8.2
37.0
38.1 8.6
6.9
1.2
(110
6)
7.3
36.5
44.6 6.6
4.2
0.8
(409
)
6.6
32.8
50.9 4.4
5.1
0.2
(154
2)
7.5
37.8
41.3 7.6
5.1
0.7
(609
)
8.4
32.3
46.8 6.4
5.1
1.0
(419
)
6.4
36.0
43.2 6.4
6.7
1.2
(36)
11.1
33.3
41.7 2.8
11.1 0.0
D13
. Kno
wle
dge
and
beha
viou
r (fru
it in
take
)K
new
and
met
gui
delin
esK
new
and
did
n’t m
eet g
uide
lines
Did
n’t k
now
and
did
n’t m
eet g
uide
lines
Inco
rrec
tly k
new
Did
n’t k
now
but
met
gui
delin
es
(941
9) 5.3
4.7
42.7
17.7
29.6
(469
7)
2.3
3.5
52.2 8.7
33.4
(472
1)
8.2
6.0
33.3
26.6
25.9
(401
7)
4.6
5.5
48.4
17.1
24.4
(381
4)
5.9
4.7
40.7
18.4
30.3
(158
9)
5.6
2.8
33.3
17.4
40.9
(512
6)
5.9
5.5
40.7
18.7
29.2
(237
2)
4.7
3.7
42.2
17.4
32.1
(170
3)
4.7
4.2
48.7
15.7
26.7
(209
)
1.9
3.8
48.8
11.0
34.4
var�e
ty o
f veg
etab
le c
onsu
mpt
�on
D14
. How
man
y di
ffere
nt ty
pes
of
vege
tabl
es w
ould
you
eat
on
a ty
pica
l day
?1
or 2
type
s3
or 4
type
s5
or m
ore
type
sI d
o no
t eat
veg
etab
les
(941
6) 8.8
56.5
34.2 0.4
(469
4)
11.1
31.7
26.7 0.5
(472
1)
6.6
51.4
41.8 0.2
(401
3)
10.3
58.1
31.2 0.4
(381
4)
8.3
55.1
36.1 0.4
(159
0)
6.3
56.0
37.4 0.3
(512
2)
10.4
56.6
32.5 0.5
(237
2)
7.2
57.0
35.6 0.3
(170
3)
6.7
55.9
37.2 0.2
(209
)
7.2
55.5
36.8 0.5
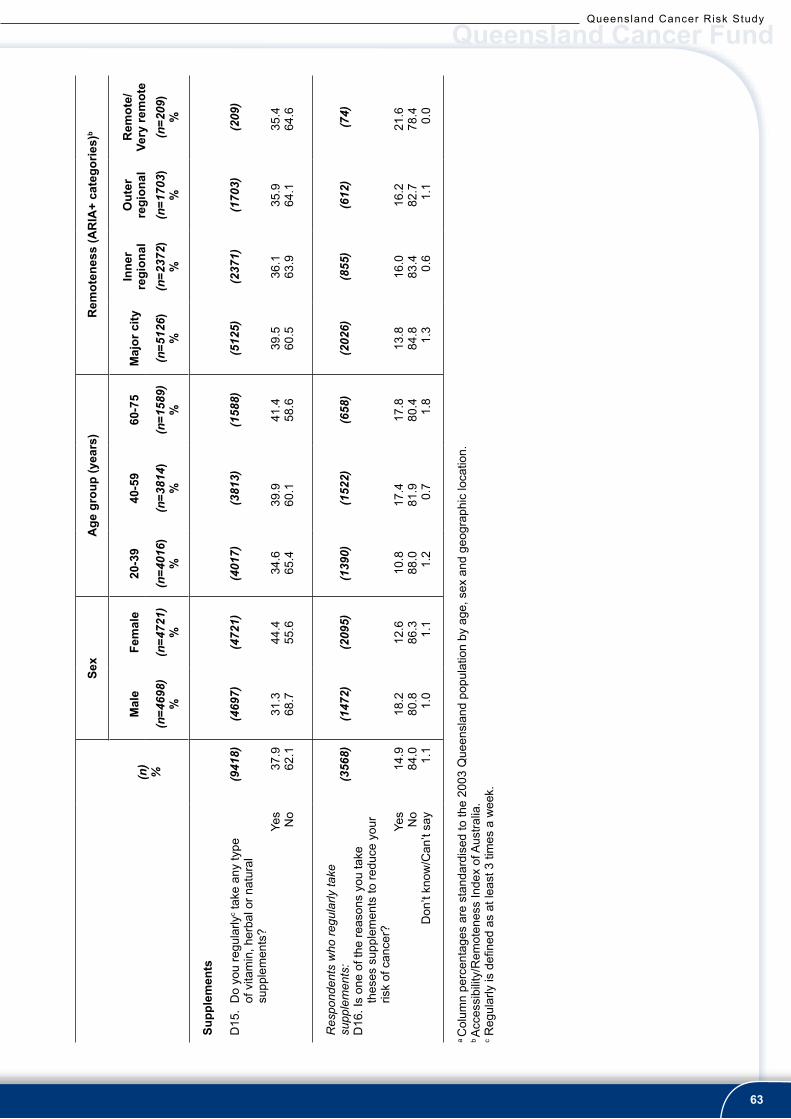
Queensland Cancer Risk Study
Queensland Cancer Fund
63
Queensland Cancer Risk Study
Sex
Age
gro
up (y
ears
)r
emot
enes
s (A
riA
+ ca
tego
r�es)
b
(n)
%
mal
eFe
mal
e20
-39
40-5
960
-75
maj
or c
�tyin
ner
reg�
onal
Out
er
reg�
onal
rem
ote/
very
rem
ote
(n=4
698)
%(n
=472
1)%
(n=4
016)
%(n
=381
4)%
(n=1
589)
%(n
=512
6)%
(n=2
372)
%(n
=170
3)%
(n=2
09)
%
Supp
lem
ents
D15
. D
o yo
u re
gula
rlyc t
ake
any
type
of
vita
min
, her
bal o
r nat
ural
su
pple
men
ts?
Yes
No
(941
8)
37.9
62.1
(469
7)
31.3
68.7
(472
1)
44.4
55.6
(401
7)
34.6
65.4
(381
3)
39.9
60.1
(158
8)
41.4
58.6
(512
5)
39.5
60.5
(237
1)
36.1
63.9
(170
3)
35.9
64.1
(209
)
35.4
64.6
Res
pond
ents
who
regu
larly
take
su
pple
men
ts:
D16
. Is
one
of th
e re
ason
s yo
u ta
ke
thes
es s
uppl
emen
ts to
redu
ce y
our
risk
of c
ance
r?Ye
sN
oD
on’t
know
/Can
’t sa
y
(356
8)
14.9
84.0 1.1
(147
2)
18.2
80.8 1.0
(209
5)
12.6
86.3 1.1
(139
0)
10.8
88.0 1.2
(152
2)
17.4
81.9 0.7
(658
)
17.8
80.4 1.8
(202
6)
13.8
84.8 1.3
(855
)
16.0
83.4 0.6
(612
)
16.2
82.7 1.1
(74)
21.6
78.4 0.0
a C
olum
n pe
rcen
tage
s ar
e st
anda
rdis
ed to
the
2003
Que
ensl
and
popu
latio
n by
age
, sex
and
geo
grap
hic
loca
tion.
b A
cces
sibi
lity/
Rem
oten
ess
Inde
x of
Aus
tralia
.c R
egul
arly
is d
efine
d as
at l
east
3 ti
mes
a w
eek.
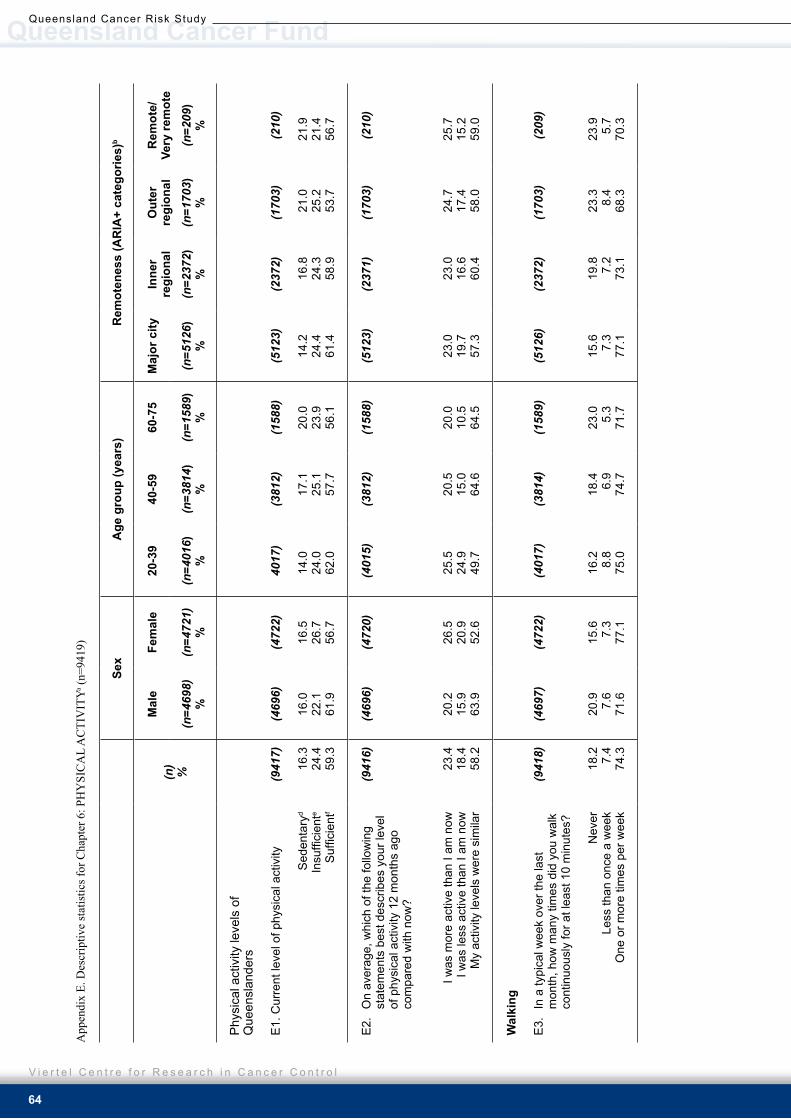
Queensland Cancer Fund
V i e r t e l C e n t r e f o r R e s e a r c h i n C a n c e r C o n t r o l
Queensland Cancer Risk Study
64
App
endi
x E.
Des
crip
tive
stat
istic
s for
Cha
pter
6: P
HY
SIC
AL
AC
TIV
ITYa (
n=94
19)
Sex
Age
gro
up (y
ears
)r
emot
enes
s (A
riA
+ ca
tego
r�es)
b
(n)
%
mal
eFe
mal
e20
-39
40-5
960
-75
maj
or c
�tyin
ner
reg�
onal
Out
er
reg�
onal
rem
ote/
very
rem
ote
(n=4
698)
%(n
=472
1)%
(n=4
016)
%(n
=381
4)%
(n=1
589)
%(n
=512
6)%
(n=2
372)
%(n
=170
3)%
(n=2
09)
%
Phy
sica
l act
ivity
leve
ls o
f Q
ueen
slan
ders
E1.
Cur
rent
leve
l of p
hysi
cal a
ctiv
ity
Sed
enta
ryd
Insu
ffici
ente
Suf
ficie
ntf
(941
7)
16.3
24.4
59.3
(469
6)
16.0
22.1
61.9
(472
2)
16.5
26.7
56.7
4017
)
14.0
24.0
62.0
(381
2)
17.1
25.1
57.7
(158
8)
20.0
23.9
56.1
(512
3)
14.2
24.4
61.4
(237
2)
16.8
24.3
58.9
(170
3)
21.0
25.2
53.7
(210
)
21.9
21.4
56.7
E2.
O
n av
erag
e, w
hich
of t
he fo
llow
ing
stat
emen
ts b
est d
escr
ibes
you
r lev
el
of p
hysi
cal a
ctiv
ity 1
2 m
onth
s ag
o co
mpa
red
with
now
?
I w
as m
ore
activ
e th
an I
am n
owI w
as le
ss a
ctiv
e th
an I
am n
owM
y ac
tivity
leve
ls w
ere
sim
ilar
(941
6)
23.4
18.4
58.2
(469
6)
20.2
15.9
63.9
(472
0)
26.5
20.9
52.6
(401
5)
25.5
24.9
49.7
(381
2)
20.5
15.0
64.6
(158
8)
20.0
10.5
64.5
(512
3)
23.0
19.7
57.3
(237
1)
23.0
16.6
60.4
(170
3)
24.7
17.4
58.0
(210
)
25.7
15.2
59.0
wal
k�ng
E3.
In
a ty
pica
l wee
k ov
er th
e la
st
mon
th, h
ow m
any
times
did
you
wal
k co
ntin
uous
ly fo
r at l
east
10
min
utes
?
Nev
erLe
ss th
an o
nce
a w
eek
One
or m
ore
times
per
wee
k
(941
8)
18.2 7.4
74.3
(469
7)
20.9 7.6
71.6
(472
2)
15.6 7.3
77.1
(401
7)
16.2 8.8
75.0
(381
4)
18.4 6.9
74.7
(158
9)
23.0 5.3
71.7
(512
6)
15.6 7.3
77.1
(237
2)
19.8 7.2
73.1
(170
3)
23.3 8.4
68.3
(209
)
23.9 5.7
70.3

Queensland Cancer Risk Study
Queensland Cancer Fund
65
Queensland Cancer Risk Study
Sex
Age
gro
up (y
ears
)r
emot
enes
s (A
riA
+ ca
tego
r�es)
b
(n)
%
mal
eFe
mal
e20
-39
40-5
960
-75
maj
or c
�tyin
ner
reg�
onal
Out
er
reg�
onal
rem
ote/
very
rem
ote
(n=4
698)
%(n
=472
1)%
(n=4
016)
%(n
=381
4)%
(n=1
589)
%(n
=512
6)%
(n=2
372)
%(n
=170
3)%
(n=2
09)
%
Res
pond
ents
who
wal
k on
e or
mor
e tim
es
per w
eek
excl
udes
mis
sing
val
ues:
E4.
In
a ty
pica
l wee
k ov
er th
e la
st m
onth
, ho
w m
uch
time
did
you
spen
d w
alki
ng in
this
way
(min
utes
)?
75th p
erce
ntile
95th p
erce
ntile
Mea
n (S
D)
Med
ian
(min
, max
)
(295
6)(1
482)
210.
060
0.0
c
60.0
(0,8
40)
(147
4)
200.
042
0.0
c
90.0
(0,8
40)
(121
8)
180.
054
0.0
c
70.0
(0,8
40)
(123
3)
210.
048
0.0
c
90.0
(0,8
40)
(504
)
210.
060
0.0
c
94.2
(0,8
40)
(532
)
150.
045
0.0
c
60.0
(0,8
40)
(156
6)
210.
060
0.0
c
90.0
(0,8
40)
(717
)
180.
042
0.0
c
80.0
(0,8
40)
(132
)
240.
084
0.0 c
90.0
(0,8
40)
E5.
Wha
t is
your
nor
mal
wal
king
pac
e ou
tdoo
rs?
Slo
wN
orm
al, a
vera
geB
risk
pace
Very
bris
k, s
tridi
ng
(700
2) 5.3
44.1
43.4 7.1
(336
1)
5.1
44.7
42.3 7.9
(364
0)
5.5
43.6
44.5 6.4
(301
3)
3.7
40.3
47.2 8.9
(285
0) 5.2
44.7
43.3 6.8
(114
0)
9.9
53.2
33.9 3.1
(395
1)
5.0
42.0
44.8 8.2
(173
3) 5.6
45.9
42.9 5.5
(116
3)
5.7
48.8
39.6 5.8
(147
)
8.8
42.9
42.9 5.4
mod
erat
e ph
ys�c
al a
ct�v
�ty (�
n ad
d�t�o
n to
wal
k�ng
)
E6.
In
a ty
pica
l wee
k ov
er th
e la
st m
onth
, ho
w m
any
times
did
you
do
any
mor
e m
oder
ate
phys
ical
act
iviti
es
that
you
hav
e no
t alre
ady
men
tione
dg (e
xclu
ding
hou
seho
ld c
hore
s,
gard
enin
g or
yar
dwor
k)?
Nev
erLe
ss th
an o
nce
a w
eek
One
or m
ore
times
per
wee
k
(941
7)
63.1
11.6
25.2
(469
6)
57.2
14.1
28.7
(472
2)
69.1 9.1
21.8
(401
7)
58.0
15.4
26.6
(381
2)
66.4
10.4
23.2
(158
9)
68.4 4.8
26.7
(512
4)
60.2
12.9
26.9
(237
1)
65.1
10.0
24.9
(170
3)
68.2
10.4
21.4
(209
)
71.8 8.1
20.1

Queensland Cancer Fund
V i e r t e l C e n t r e f o r R e s e a r c h i n C a n c e r C o n t r o l
Queensland Cancer Risk Study
66
Sex
Age
gro
up (y
ears
)r
emot
enes
s (A
riA
+ ca
tego
r�es)
b
(n)
%
mal
eFe
mal
e20
-39
40-5
960
-75
maj
or c
�tyin
ner
reg�
onal
Out
er
reg�
onal
rem
ote/
very
rem
ote
(n=4
698)
%(n
=472
1)%
(n=4
016)
%(n
=381
4)%
(n=1
589)
%(n
=512
6)%
(n=2
372)
%(n
=170
3)%
(n=2
09)
%
Res
pond
ents
who
par
ticip
ated
in
mod
erat
e ph
ysic
al a
ctiv
ities
one
or m
ore
times
per
wee
k:E
7.
In a
typi
cal w
eek
over
the
last
mon
th,
how
muc
h tim
e di
d yo
u sp
end
each
wee
k do
ing
thes
e ac
tiviti
es
(min
utes
)?
75th p
erce
ntile
95th p
erce
ntile
M
ean
(SD
)M
edia
n (m
in, m
ax)
(295
6)(1
482)
30.0
360.
0
c
0.0(
0,84
0)
(147
4)
0.0
240.
0
c
0.0(
0,84
0)
(121
8)
30.0
240.
0
c
0.0(
0,84
0)
(123
3) 0.0
300.
0
c
0.0(
0,84
0)
(504
)
45.0
480.
0
c
0.0(
0,84
0)
(532
)
30.0
360.
0
c
0.0(
0,84
0)
(156
6)
30.0
330.
0
c
0.0(
0,84
0)
(717
)
0.0
240.
0
c
0.0(
0,84
0)
(132
)
0.0
346.
8 c
0.0(
0,84
0)
v�go
rous
phy
s�ca
l act
�v�ty
E8.
In
a ty
pica
l wee
k ov
er th
e la
st m
onth
, ho
w m
any
times
did
you
do
any
vigo
rous
gar
deni
ng o
r hea
vy w
ork
arou
nd th
e ya
rd, w
hich
mad
e yo
u br
eath
e ha
rder
or p
uff a
nd p
ant?
N
ever
Less
than
onc
e a
wee
kO
ne o
r mor
e tim
es p
er w
eek
(941
9)
39.3
19.1
41.6
(469
8)
33.0
19.5
47.6
(472
2)
45.6
18.7
35.7
(401
6)
39.7
21.2
39.1
(381
3)
35.8
18.8
45.4
(158
9)
46.6
14.5
38.9
(512
6)
42.6
20.2
37.2
(237
2)
33.3
17.1
49.6
(170
3)
38.2
18.9
42.9
(209
)
34.4
16.3
49.3

Queensland Cancer Risk Study
Queensland Cancer Fund
67
Queensland Cancer Risk Study
Sex
Age
gro
up (y
ears
)r
emot
enes
s (A
riA
+ ca
tego
r�es)
b
(n)
%
mal
eFe
mal
e20
-39
40-5
960
-75
maj
or c
�tyin
ner
reg�
onal
Out
er
reg�
onal
rem
ote/
very
rem
ote
(n=4
698)
%(n
=472
1)%
(n=4
016)
%(n
=381
4)%
(n=1
589)
%(n
=512
6)%
(n=2
372)
%(n
=170
3)%
(n=2
09)
%
Res
pond
ents
who
par
ticip
ated
in v
igor
ous
gard
enin
g or
hea
vy w
ork
arou
nd th
e ya
rd
one
or m
ore
times
per
wee
k:E
9.
In a
typi
cal w
eek
over
the
last
mon
th,
how
muc
h tim
e di
d yo
u sp
end
doin
g vi
goro
us g
arde
ning
or h
eavy
wor
k ar
ound
the
yard
(min
utes
)?
75th p
erce
ntile
95th p
erce
ntile
Mea
n (S
D)
Med
ian
(min
, max
)
(295
6)(1
482)
180.
072
0.0 c
60.0
(0,8
40)
(147
4)
120.
036
0.0 c
0.0(
0,84
0)
(121
8)
120.
054
0.0
c
0.0(
0,84
0)
(123
3)
150.
060
0.0
c
3.1(
0,84
0)
(504
)
120.
060
0.0 c
0.0(
0,84
0)
(532
)
120.
048
0.0 c
0.0(
0,84
0)
(156
6)
120.
060
0.0
c
16.9
(0,8
40)
(717
)
120.
048
0.0
c
0.0(
0,84
0)
(132
)
240.
084
0.0 c
24.6
(0,8
40)
E10
. In
a ty
pica
l wee
k ov
er th
e la
st m
onth
, ho
w m
any
times
did
you
do
any
vigo
rous
phy
sica
l act
ivity
, whi
ch
mad
e yo
u br
eath
e ha
rder
or p
uff a
nd
pant
h (e
xclu
ding
hou
seho
ld c
hore
s,
gard
enin
g or
yar
dwor
k)?
N
ever
Less
than
onc
e a
wee
kO
ne o
r mor
e tim
es p
er w
eek
(941
8)
55.5 7.6
36.9
(469
7)
50.3 8.2
41.5
(472
2)
60.6 7.1
32.3
(401
6)
42.0 9.3
48.7
(381
4)
60.4 7.6
32.0
(158
8)
77.6 3.6
18.8
(512
5)
52.1 7.8
40.1
(237
2)
59.8 7.1
33.1
(170
3)
58.9 8.3
32.8
(210
)
59.5 5.7
34.8
Res
pond
ents
who
par
ticip
ated
in v
igor
ous
phys
ical
act
ivity
one
or m
ore
times
per
w
eek:
E11
. In
a ty
pica
l wee
k ov
er th
e la
st m
onth
, ho
w m
uch
time
did
you
spen
d do
ing
this
vig
orou
s ph
ysic
al a
ctiv
ity
(min
utes
)?75
th p
erce
ntile
95th p
erce
ntile
M
ean
(SD
)M
edia
n (m
in, m
ax)
(295
6)(1
482)
150.
048
0.0
c
20.0
(0,8
40)
(147
4)
107.
436
0.0
c
0.0(
0,84
0)
(121
8)
120.
042
0.0
c
30.0
(0,8
40)
(123
3)
120.
042
0.0
c
0.0(
0,84
0)
(504
)
90.0
480.
0
c
0.0(
0,84
0)
(532
)
120.
043
3.4
c
0.0(
0,84
0)
(156
6)
120.
045
0.0
c
0.0(
0,84
0)
(717
)
120.
036
0.0
c
0.0(
0,84
0)
(132
)
120.
039
7.4 c
0.0(
0,84
0)

Queensland Cancer Fund
V i e r t e l C e n t r e f o r R e s e a r c h i n C a n c e r C o n t r o l
Queensland Cancer Risk Study
68
a C
olum
n pe
rcen
tage
s ar
e st
anda
rdis
ed to
the
2003
Que
ensl
and
popu
latio
n by
age
, sex
and
geo
grap
hic
loca
tion.
b A
cces
sibi
lity/
Rem
oten
ess
Inde
x of
Aus
tralia
c Not
app
licab
le to
cal
cula
te a
n ar
ithm
etic
mea
n as
the
dist
ribut
ion
was
ske
wed
.d ’S
eden
tary
’ is
defin
ed a
s no
act
ivity
.e ’In
suffi
cien
t’ tim
e is
defi
ned
as p
artic
ipat
ing
in s
ome
activ
ity b
ut le
ss th
an 1
50 m
inut
es p
er w
eek,
usi
ng th
e su
m o
f wal
king
, mod
erat
e ac
tivity
and
vig
orou
s ac
tivity
(wei
ghte
d by
two)
..f ’S
uffic
ient
’ tim
e is
defi
ned
as 1
50 m
inut
es o
r mor
e pe
r wee
k, u
sing
the
sum
of w
alki
ng, m
oder
ate
activ
ity a
nd v
igor
ous
activ
ity (w
eigh
ted
by tw
o).
g Mod
erat
e ph
ysic
al a
ctiv
ity e
g. g
entle
sw
imm
ing,
soc
ial t
enni
s, g
olf,
etc.
h Vig
orou
s ph
ysic
al a
ctiv
ity e
g. jo
ggin
g, c
yclin
g, a
erob
ics,
com
petit
ive
tenn
is, e
tc.

Queensland Cancer Risk Study
Queensland Cancer Fund
69
Queensland Cancer Risk Study
App
endi
x F.
Des
crip
tive
stat
istic
s for
Cha
pter
7: B
OD
Y M
ASS
a (n=
9419
)
Sex
Age
gro
up (y
ears
)r
emot
enes
s (A
riA
+ ca
tego
r�es)
b
(n)
%
mal
eFe
mal
e20
-39
40-5
960
-75
maj
or c
�tyin
ner
reg�
onal
Out
er
reg�
onal
rem
ote/
very
rem
ote
(n=4
698)
%(n
=472
1)%
(n=4
016)
%(n
=381
4)%
(n=1
589)
%(n
=512
6)%
(n=2
372)
%(n
=170
3)%
(n=2
09)
%
Bod
y m
ass
�nde
x (B
mi)
and
self-
perc
ept�o
n of
we�
ght
F1. C
urre
nt b
ody
mas
s in
dex
(kg/
m2 )
Und
erw
eigh
t (B
MI <
18.5
)N
orm
al (B
MI 1
8.5-
24.9
)O
verw
eigh
t (B
MI 2
5.0-
29.9
)O
bese
(BM
I 30+
)
(904
5) 2.6
43.8
35.8
17.8
(459
4)
0.7
38.5
43.7
17.1
(445
0)
4.5
49.4
27.6
18.4
(384
6)
4.0
49.2
32.2
14.6
(367
2)
1.7
40.1
38.0
20.2
(152
6)
1.1
39.3
39.6
19.9
(492
3)
3.2
45.8
35.4
15.6
(227
4)
2.1
44.1
35.5
18.3
(164
4)
1.6
38.9
37.3
22.3
(194
)
1.5
35.1
35.6
27.8
F2. H
ow w
ould
you
des
crib
e yo
urse
lf
now
?Ve
ry u
nder
wei
ght
Und
erw
eigh
tS
light
ly u
nder
wei
ght
Nor
mal
wei
ght
Slig
htly
ove
rwei
ght
Ove
rwei
ght
Very
ove
rwei
ght
(941
1) 0.4
1.2
5.1
37.1
34.2
17.6 4.3
(469
2)
0.4
1.3
7.2
38.3
36.2
14.4 2.2
(471
8)
0.3
1.1
3.1
35.9
32.4
20.8 6.3
(401
6)
0.5
1.7
6.9
43.0
30.5
14.4 2.9
(380
9)
0.2
1.0
4.1
31.7
36.7
20.4 5.9
(158
7)
0.3
0.8
3.1
35.2
37.9
18.9 3.7
(512
2)
0.4
1.3
6.0
37.5
32.9
17.7 4.2
(236
9)
0.3
1.1
4.6
37.3
35.2
17.2 4.3
(170
2)
0.3
1.2
3.5
36.1
36.9
17.4 4.6
(209
)
0.5
0.5
3.3
33.5
36.4
21.5 4.3
Bod
y m
ass
�nde
x at
20
year
s of
age
an
d gr
eate
st w
e�gh
t
Res
pond
ents
age
d 21
yea
rs o
r ove
r:F3
. Bod
y m
ass
inde
x at
20
year
s ol
d
(kg/
m2 )
Und
erw
eigh
t (B
MI <
18.5
)N
orm
al (B
MI 1
8.5-
24.9
)O
verw
eigh
t (B
MI 2
5.0-
29.9
)O
bese
(BM
I 30+
)
(877
6)
11.7
68.9
15.0 4.4
(439
9)
5.4
69.1
20.8 4.7
(437
8)
18.0
68.6 9.2
4.2
(370
8)
10.7
66.0
17.3 6.0
(359
6)
11.9
70.4
13.9 3.8
(147
2)
13.7
72.4
12.0 1.8
(476
7)
11.5
70.6
13.8 4.0
(220
5)
12.2
68.5
15.2 4.0
(160
5)
11.8
64.5
17.8 5.9
(192
)
7.8
67.7
18.2 6.3

Queensland Cancer Fund
V i e r t e l C e n t r e f o r R e s e a r c h i n C a n c e r C o n t r o l
Queensland Cancer Risk Study
70
Sex
Age
gro
up (y
ears
)r
emot
enes
s (A
riA
+ ca
tego
r�es)
b
(n)
%
mal
eFe
mal
e20
-39
40-5
960
-75
maj
or c
�tyin
ner
reg�
onal
Out
er
reg�
onal
rem
ote/
very
rem
ote
(n=4
698)
%(n
=472
1)%
(n=4
016)
%(n
=381
4)%
(n=1
589)
%(n
=512
6)%
(n=2
372)
%(n
=170
3)%
(n=2
09)
%
F4. H
eavi
est b
ody
mas
s in
dex
(kg/
m2 )
Und
erw
eigh
t (B
MI <
18.5
)N
orm
al (B
MI 1
8.5-
24.9
)O
verw
eigh
t (B
MI 2
5.0-
29.9
)O
bese
(BM
I 30+
)
(913
0) 0.9
31.6
37.1
30.4
(459
5)
0.4
25.3
42.4
31.9
(453
5)
1.4
37.9
31.8
28.9
(388
6)
1.7
36.7
35.3
26.3
(370
8)
0.4
28.4
37.2
34.0
(153
6)
0.2
26.2
41.5
32.1
(496
9)
1.1
33.3
37.4
28.1
(229
7)
0.7
31.7
37.2
30.4
(165
5)
0.7
27.1
36.3
36.0
(203
)
0.0
25.1
36.0
38.9
F5. A
ge w
hen
wei
ghed
the
mos
t (ye
ars)
<1
818
- <2
525
- <3
535
- <4
545
- <5
555
- <6
565
+
Mea
n (S
D)
Med
ian
(min
, max
)
(941
7) 2.2
18.0
25.9
19.7
16.5
11.1 6.6
(469
4)
1.4
18.5
26.8
20.4
16.2
10.7 6.0
37.6
(14.
1)35
(0,7
5)
(472
0)
2.9
17.6
24.9
19.0
16.8
11.5 7.2
38.1
(14.
8)36
(0,8
0)
(401
6)
4.0
32.7
48.0
13.9 0.0
0.1
1.7
27.1
(6.2
)27
(0,6
7)
(381
2)
1.1
7.8
10.9
31.0
36.3
10.9 1.9
42.1
(10.
9)44
(0,7
3)
(158
9)
0.8
5.7
5.9
7.2
10.8
39.3
30.3
55.2
(14.
9)60
(0,8
0)
(512
4)
2.3
19.6
26.6
19.1
16.1
10.3 6.1
37.1
(14.
2)35
(0,8
0)
(237
1)
2.1
15.7
22.9
19.8
17.9
13.5 8.2
39.7
(15.
1)38
(0,7
5)
(170
3)
2.0
16.5
27.2
21.7
15.7
10.5 6.4
37.7
(14.
1)35
(0,7
5)
(209
)
2.4
17.2
31.1
17.7
18.7 9.1
3.8
38.8
(13.
6)34
(0,7
3)
a C
olum
n pe
rcen
tage
s ar
e st
anda
rdis
ed to
the
2003
Que
ensl
and
popu
latio
n by
age
, sex
and
geo
grap
hic
loca
tion.
b A
cces
sibi
lity/
Rem
oten
ess
Inde
x of
Aus
tralia
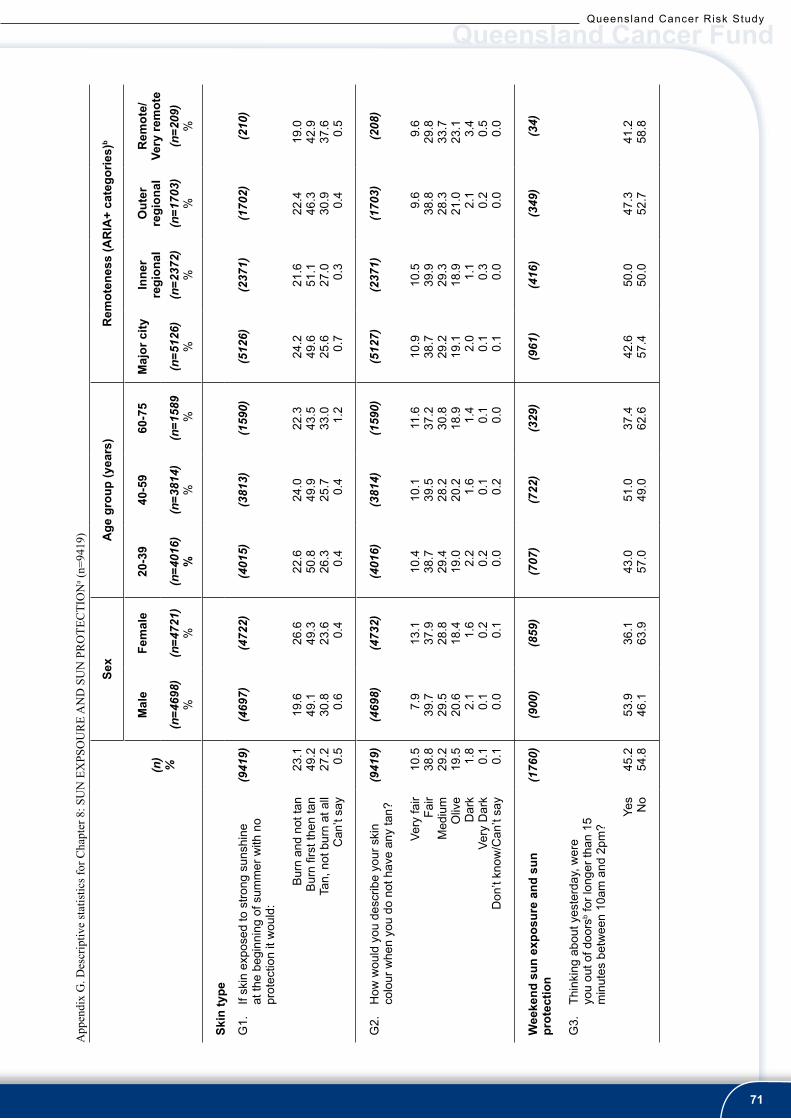
Queensland Cancer Risk Study
Queensland Cancer Fund
71
Queensland Cancer Risk Study
App
endi
x G
. Des
crip
tive
stat
istic
s for
Cha
pter
8: S
UN
EX
PSO
UR
E A
ND
SU
N P
RO
TEC
TIO
Na (
n=94
19)
Sex
Age
gro
up (y
ears
)r
emot
enes
s (A
riA
+ ca
tego
r�es)
b
(n)
%
mal
eFe
mal
e20
-39
40-5
960
-75
maj
or c
�tyin
ner
reg�
onal
Out
er
reg�
onal
rem
ote/
very
rem
ote
(n=4
698)
%(n
=472
1)%
(n=4
016)
%(n
=381
4)%
(n=1
589
%(n
=512
6)%
(n=2
372)
%(n
=170
3)%
(n=2
09)
%
Sk�n
type
G1.
If
skin
exp
osed
to s
trong
sun
shin
e at
the
begi
nnin
g of
sum
mer
with
no
prot
ectio
n it
wou
ld:
B
urn
and
not t
an
Bur
n fir
st th
en ta
n
Tan,
not
bur
n at
all
Can
’t sa
y
(941
9)
23.1
49.2
27.2 0.5
(469
7)
19.6
49.1
30.8 0.6
(472
2)
26.6
49.3
23.6 0.4
(401
5)
22.6
50.8
26.3 0.4
(381
3)
24.0
49.9
25.7 0.4
(159
0)
22.3
43.5
33.0 1.2
(512
6)
24.2
49.6
25.6 0.7
(237
1)
21.6
51.1
27.0 0.3
(170
2)
22.4
46.3
30.9 0.4
(210
)
19.0
42.9
37.6 0.5
G2.
H
ow w
ould
you
des
crib
e yo
ur s
kin
colo
ur w
hen
you
do n
ot h
ave
any
tan?
Very
fair
Fair
Med
ium
Oliv
eD
ark
Very
Dar
kD
on’t
know
/Can
’t sa
y
(941
9)
10.5
38.8
29.2
19.5 1.8
0.1
0.1
(469
8)
7.9
39.7
29.5
20.6 2.1
0.1
0.0
(473
2)
13.1
37.9
28.8
18.4 1.6
0.2
0.1
(401
6)
10.4
38.7
29.4
19.0 2.2
0.2
0.0
(381
4)
10.1
39.5
28.2
20.2 1.6
0.1
0.2
(159
0)
11.6
37.2
30.8
18.9 1.4
0.1
0.0
(512
7)
10.9
38.7
29.2
19.1 2.0
0.1
0.1
(237
1)
10.5
39.9
29.3
18.9 1.1
0.3
0.0
(170
3)
9.6
38.8
28.3
21.0 2.1
0.2
0.0
(208
)
9.6
29.8
33.7
23.1 3.4
0.5
0.0
wee
kend
sun
exp
osur
e an
d su
n pr
otec
t�on
G3.
Th
inki
ng a
bout
yes
terd
ay, w
ere
you
out o
f doo
rsb f
or lo
nger
than
15
min
utes
bet
wee
n 10
am a
nd 2
pm?
Yes
N
o
(176
0)
45.2
54.8
(900
)
53.9
46.1
(859
)
36.1
63.9
(707
)
43.0
57.0
(722
)
51.0
49.0
(329
)
37.4
62.6
(961
)
42.6
57.4
(416
)
50.0
50.0
(349
)
47.3
52.7
(34)
41.2
58.8

Queensland Cancer Fund
V i e r t e l C e n t r e f o r R e s e a r c h i n C a n c e r C o n t r o l
Queensland Cancer Risk Study
72
Sex
Age
gro
up (y
ears
)r
emot
enes
s (A
riA
+ ca
tego
r�es)
b
(n)
%
mal
eFe
mal
e20
-39
40-5
960
-75
maj
or c
�tyin
ner
reg�
onal
Out
er
reg�
onal
rem
ote/
very
rem
ote
(n=4
698)
%(n
=472
1)%
(n=4
016)
%(n
=381
4)%
(n=1
589
%(n
=512
6)%
(n=2
372)
%(n
=170
3)%
(n=2
09)
%
If sp
ent l
onge
r tha
n 15
min
utes
out
door
s:G
4.
Abo
ut h
ow m
uch
time
did
you
spen
d ou
t of d
oors
c yes
terd
ay b
etw
een
10am
an
d 2p
m? 15
min
utes
– le
ss th
an 1
hou
r1
hour
– le
ss th
en 2
hou
rs2
hour
s –
4 ho
urs
(795
)
25.8
25.2
49.0
(484
)
21.5
23.8
54.8
(310
)
32.6
27.4
40.0
(304
)
27.0
23.4
49.7
(368
)
22.6
24.7
52.7
(123
)
32.5
30.9
36.6
(408
)
26.2
26.7
47.1
(208
)
26.9
25.5
47.6
(164
)
23.8
21.3
54.8
(14)
21.4
21.4
57.2
If sp
ent l
onge
r tha
n 15
min
utes
out
door
s:G
5.
Wer
e yo
u w
earin
g a
cap,
hat
or s
un
viso
r whi
le o
utdo
ors
betw
een
10am
an
d 2p
m y
este
rday
?
Hat
Cap
Bik
e he
lmet
Viso
rN
one
(796
)
31.6
18.3 2.1
1.3
46.7
(485
)
35.7
22.1 2.7
0.8
38.8
(311
)
25.4
12.5 1.3
1.9
58.8
(303
)
27.1
17.8 2.0
2.0
51.2
(369
)
33.3
18.2 2.4
0.8
45.3
(123
)
37.4
20.3 0.8
0.8
40.7
(409
)
29.6
15.6 1.7
1.7
51.3
(207
)
32.4
19.8 2.9
0.5
44.4
(164
)
34.8
23.2 2.4
1.2
38.4
(13)
46.2
15.4 0.0
0.0
38.5
If re
spon
dent
wor
e a
hat,
cap
or b
ike
helm
et:
G6.
Did
it h
ave
a fla
p th
at c
over
ed y
our
nec
k?Ye
sN
o
(406
)
8.5
91.5
(284
)
4.6
95.4
(122
)
18.0
82.0
(143
)
11.2
88.8
(191
)
7.9
92.1
(72) 5.6
94.4
(192
)
8.9
91.1
(109
)
11.0
89.0
(97) 6.2
93.8
(8)
0.0
100.
0
G7.
Fo
r tho
se w
ho s
peci
fied
hat o
r cap
, did
it
have
a w
ide
brim
or a
nar
row
brim
?
Wid
e br
imN
arro
w b
rimN
o br
imD
on’t
rem
embe
r/can
’t sa
y
(397
)
71.3
26.8 1.4
0.5
(279
)
72.0
26.2 1.8
0.0
(118
)
69.5
28.0 0.8
1.7
(137
)
58.4
40.9 0.7
0.0
(190
)
76.8
20.5 2.6
0.0
(71)
81.7
15.5 0.0
2.8
(184
)
68.5
30.4 1.1
0.0
(110
)
77.3
20.0 1.8
0.9
(96)
68.8
29.2 1.0
1.0
(8)
87.5
12.5 0.0
0.0

Queensland Cancer Risk Study
Queensland Cancer Fund
73
Queensland Cancer Risk Study
Sex
Age
gro
up (y
ears
)r
emot
enes
s (A
riA
+ ca
tego
r�es)
b
(n)
%
mal
eFe
mal
e20
-39
40-5
960
-75
maj
or c
�tyin
ner
reg�
onal
Out
er
reg�
onal
rem
ote/
very
rem
ote
(n=4
698)
%(n
=472
1)%
(n=4
016)
%(n
=381
4)%
(n=1
589
%(n
=512
6)%
(n=2
372)
%(n
=170
3)%
(n=2
09)
%
If sp
ent l
onge
r tha
n 15
min
utes
out
door
s:G
8. W
ere
you
wea
ring
any
sung
lass
es?
Yes
No
Don
’t kn
ow/C
an’t
rem
embe
r
(795
)
54.9
44.8 0.3
(485
)
52.8
47.2 0.0
(310
)
58.1
41.3 0.6
(304
)
61.8
38.2 0.0
(368
)
51.9
47.6 0.5
(123
)
47.2
52.8 0.0
(408
)
58.6
40.9 0.5
(208
)
51.0
49.0 0.0
(164
)
51.8
48.2 0.0
(14)
42.9
57.1 0.0
If sp
ent l
onge
r tha
n 15
min
utes
out
door
s:G
9.
Did
you
use
a s
unsc
reen
bet
wee
n 10
am a
nd 2
pm y
este
rday
?
N
o, d
idn’
t use
sun
scre
enYe
s, u
sed
suns
cree
nM
ake-
up w
ith a
sun
scre
en o
nly
(795
)
72.8
25.4 1.7
(485
)
80.0
20.0 0.0
(310
)
61.6
33.9 4.5
(304
)
68.4
29.3 2.3
(369
)
73.7
24.7 1.6
(123
)
80.5
18.7 0.8
(409
)
66.5
31.3 2.2
(208
)
79.3
19.2 1.4
(165
)
83.0
15.8 1.2
(14)
42.9
57.1 0.0
G10
. W
hat i
s th
e to
tal a
mou
nt o
f tim
e th
at
you
wer
e ou
tdoo
rsb d
urin
g da
ylig
ht
hour
s ye
ster
day?
Less
than
15
min
utes
15 m
inut
es –
less
than
1 h
our
1 ho
ur –
less
than
2 h
ours
2 ho
urs
– le
ss th
an 4
hou
rs4
or m
ore
hour
sD
on’t
know
(166
4)
17.2
25.7
18.0
21.0
17.9 0.2
(829
)
12.4
22.8
18.9
20.7
24.8 0.2
(835
)
21.9
28.5
17.1
21.3
11.0 0.1
(671
)
18.2
25.2
18.3
19.1
18.9 0.3
(672
)
15.0
24.3
17.7
22.9
19.9 0.1
(320
)
19.7
29.7
17.8
21.3
11.6 0.0
(908
)
20.0
26.3
18.5
19.3
15.6 0.2
(407
)
13.5
26.5
15.7
21.4
22.9 0.0
(318
)
13.5
23.6
20.1
24.5
17.9 0.3
(30)
13.3
20.0
13.3
30.0
20.0 3.3
wee
kday
sun
exp
osur
e an
d su
n pr
otec
t�on
G11
. Th
inki
ng a
bout
yes
terd
ay, w
ere
you
out o
f doo
rsb f
or lo
nger
than
15
min
utes
bet
wee
n 10
am a
nd 2
pm?
Yes
No
(766
0)
36.8
63.2
(379
8)
46.1
53.9
(386
2)
27.7
72.3
(331
0)
35.9
64.1
(309
1)
35.9
64.1
(126
0)
41.3
58.7
(416
5)
32.7
67.3
(195
6)
42.1
57.9
(135
4)
40.3
59.7
(176
)
48.9
51.1

Queensland Cancer Fund
V i e r t e l C e n t r e f o r R e s e a r c h i n C a n c e r C o n t r o l
Queensland Cancer Risk Study
74
Sex
Age
gro
up (y
ears
)r
emot
enes
s (A
riA
+ ca
tego
r�es)
b
(n)
%
mal
eFe
mal
e20
-39
40-5
960
-75
maj
or c
�tyin
ner
reg�
onal
Out
er
reg�
onal
rem
ote/
very
rem
ote
(n=4
698)
%(n
=472
1)%
(n=4
016)
%(n
=381
4)%
(n=1
589
%(n
=512
6)%
(n=2
372)
%(n
=170
3)%
(n=2
09)
%
If sp
ent l
onge
r tha
n 15
min
utes
out
door
s:G
12.
Abo
ut h
ow m
uch
time
did
you
spen
d ou
t of d
oors
c yes
terd
ay b
etw
een
10am
an
d 2p
m? 15
min
utes
– le
ss th
an 1
hou
r1
hour
– le
ss th
en 2
hou
rs2
hour
s –
4 ho
urs
(282
0)
37.6
22.0
40.4
(175
1)
28.5
21.6
49.8
(106
9)
52.5
22.6
24.9
(118
8)
41.7
21.1
37.1
(111
1)
36.1
20.9
43.0
(521
)
31.5
26.5
42.0
(136
2)
45.7
22.0
32.2
(823
)
33.3
21.0
45.5
(546
)
25.5
23.1
51.5
(85)
27.1
23.5
49.4
If sp
ent l
onge
r tha
n 15
min
utes
out
door
s:G
13.
Wer
e yo
u w
earin
g a
cap,
hat
or s
un
viso
r whi
le o
utdo
ors
betw
een
10am
an
d 2p
m y
este
rday
?
Hat
Cap
Bik
e he
lmet
Viso
rN
one
(282
0)
32.8
17.2 1.2
1.4
47.4
(175
0)
37.5
22.3 1.7
0.5
38.0
(107
0)
25.2 8.9
0.5
2.8
62.6
(118
9)
28.5
18.3 1.0
0.6
51.6
(111
0)
34.1
16.9 2.0
2.1
45.0
(521
)
40.1
15.0 0.2
1.7
43.0
(136
1)
26.2
16.6 0.8
1.7
54.7
(824
)
34.7
18.1 1.8
1.3
44.1
(546
)
43.0
16.7 1.3
0.9
38.1
(85)
54.1
21.2 1.2
1.2
22.4
If re
spon
dent
wor
e a
hat,
cap
or b
ike
helm
et:
G14
. Did
it h
ave
a fla
p th
at c
over
ed y
our
ne
ck?
Yes
No
(145
0)
10.2
89.8
(105
5)
9.1
90.9
(395
)
12.9
87.1
(564
)
13.3
86.7
(590
)
8.3
91.7
(296
)
7.8
92.2
(606
)
11.6
88.4
(446
)
8.7
91.3
(332
)
9.0
91.0
(64)
14.1
85.9
G15
. Fo
r tho
se w
ho s
peci
fied
hat o
r cap
, did
it
have
a w
ide
brim
or a
nar
row
brim
?
Wid
e br
imN
arro
w b
rimN
o br
imD
on’t
rem
embe
r/can
’t sa
y
(141
0)
74.4
23.2 1.7
0.7
(104
6)
71.7
25.2 1.8
1.0
(365
)
81.9
16.4 1.4
0.3
(557
)
68.4
28.7 2.0
0.9
(566
)
78.6
18.9 1.6
0.9
(287
)
77.4
20.9 1.4
0.3
(582
)
69.8
27.1 2.1
1.0
(435
)
76.6
21.1 1.4
0.9
(327
)
78.9
19.6 1.2
0.3
(64)
76.6
20.3 3.1
0.0

Queensland Cancer Risk Study
Queensland Cancer Fund
75
Queensland Cancer Risk Study
Sex
Age
gro
up (y
ears
)r
emot
enes
s (A
riA
+ ca
tego
r�es)
b
(n)
%
mal
eFe
mal
e20
-39
40-5
960
-75
maj
or c
�tyin
ner
reg�
onal
Out
er
reg�
onal
rem
ote/
very
rem
ote
(n=4
698)
%(n
=472
1)%
(n=4
016)
%(n
=381
4)%
(n=1
589
%(n
=512
6)%
(n=2
372)
%(n
=170
3)%
(n=2
09)
%
If sp
ent l
onge
r tha
n 15
min
utes
out
door
s:G
16. W
ere
you
wea
ring
any
sung
lass
es? Ye
sN
oD
on’t
know
/Can
’t re
mem
ber
(282
0)
56.3
43.6 0.1
(175
1)
55.3
44.6 0.1
(106
9)
57.8
42.1 0.1
(118
9)
62.9
37.0 0.1
(111
1)
55.6
44.4 0.0
(521
)
42.6
57.2 0.2
(136
2)
58.6
41.3 0.1
(824
)
53.0
47.0 0.0
(547
)
54.8
45.0 0.2
(86)
59.3
40.7 0.0
If sp
ent l
onge
r tha
n 15
min
utes
out
door
s:G
17.
Did
you
use
a s
unsc
reen
bet
wee
n 10
am a
nd 2
pm y
este
rday
?
N
o, d
idn’
t use
sun
scre
enYe
s, u
sed
suns
cree
nM
ake-
up w
ith a
sun
scre
en o
nly
Don
’t kn
ow/C
an’t
rem
embe
r
(282
0)
75.7
21.7 2.4
0.3
(175
1)
83.9
15.9 0.1
0.1
(107
0)
62.3
31.0 6.2
0.5
(118
9)
73.5
23.0 3.1
0.4
(111
1)
75.7
22.3 1.9
0.1
(520
)
81.0
17.3 1.5
0.2
(136
2)
72.2
24.7 2.8
0.2
(824
)
79.4
18.8 1.6
0.2
(546
)
79.1
18.1 2.7
0.0
(86)
73.3
23.3 2.3
1.2
G18
. W
hat i
s th
e to
tal a
mou
nt o
f tim
e th
at
you
wer
e ou
tdoo
rsb d
urin
g da
ylig
ht
hour
s ye
ster
day?
Less
than
15
min
utes
15 m
inut
es –
less
than
1 h
our
1 ho
ur –
less
than
2 h
ours
2 ho
urs
– le
ss th
an 4
hou
rs4
or m
ore
hour
sD
on’t
know
(740
0)
19.5
31.3
20.1
16.0
12.9 0.2
(358
8)
14.5
27.5
19.7
18.1
19.9 0.2
(381
4)
24.1
34.9
20.6
14.1 6.2
0.2
(319
5)
18.9
32.3
20.4
16.7
11.7 0.1
(298
4)
20.6
31.6
20.7
14.0
12.8 0.3
(122
1)
18.1
28.3
18.2
19.3
16.0 0.2
(404
9)
23.2
33.1
21.3
13.5 8.7
0.1
(191
1)
14.4
29.7
18.5
19.5
17.7 0.2
(126
8)
15.9
29.0
19.0
18.5
17.5 0.1
(167
)
12.0
24.6
21.0
19.2
22.2 1.2

Queensland Cancer Fund
V i e r t e l C e n t r e f o r R e s e a r c h i n C a n c e r C o n t r o l
Queensland Cancer Risk Study
76
Sex
Age
gro
up (y
ears
)r
emot
enes
s (A
riA
+ ca
tego
r�es)
b
(n)
%
mal
eFe
mal
e20
-39
40-5
960
-75
maj
or c
�tyin
ner
reg�
onal
Out
er
reg�
onal
rem
ote/
very
rem
ote
(n=4
698)
%(n
=472
1)%
(n=4
016)
%(n
=381
4)%
(n=1
589
%(n
=512
6)%
(n=2
372)
%(n
=170
3)%
(n=2
09)
%
T�m
e ou
tdoo
rs w
h�le
at w
ork
G19
. W
hen
you’
re w
orki
ng a
t you
r job
, abo
ut
how
muc
h tim
e do
you
spe
nd o
utsi
de
durin
g da
ylig
ht h
ours
?
All
of th
e tim
eM
ost o
f the
tim
eH
alf o
f the
tim
eVe
ry li
ttle
of th
e tim
eN
one
of th
e tim
e
(941
4) 4.6
8.6
17.9
63.9 5.0
(469
5)
8.5
13.6
18.8
54.1 5.0
(471
8)
0.8
3.7
16.9
73.5 5.0
(401
5)
5.6
8.2
15.8
64.6 5.8
(381
2)
4.4
8.0
16.7
65.4 5.5
(158
7)
2.8
11.2
25.8
58.3 2.0
(512
2)
3.3
5.8
14.4
69.6 6.9
(237
1)
5.3
10.8
21.5
59.5 3.0
(170
2)
7.1
12.7
22.7
55.0 2.5
(209
)
10.5
18.7
21.5
45.5 3.8
Sunt
ann�
ng a
nd s
unbu
rn
G20
. H
ave
you
mad
e an
y at
tem
pt to
get
a
sunt
an in
the
past
12
mon
ths?
Yes
No
(941
9)
12.1
87.9
(469
8)
10.0
90.0
(472
1)
14.2
85.8
(401
6)
16.1
83.9
(381
4)
10.7
89.3
(159
0)
5.5
94.5
(512
6)
14.2
85.8
(237
2)
11.0
89.0
(170
3)
8.3
91.7
(210
)
5.2
94.8
G21
. H
ow m
any
times
did
you
get
sun
burn
t in
the
past
12
mon
ths?
Non
eO
nce
2-5
times
6 or
mor
e tim
es
(941
9)
29.9
18.3
36.4
15.4
(469
8)
26.5
16.1
37.1
20.3
(472
2)
33.3
20.5
35.6
10.6
(401
6)
15.7
18.6
45.2
20.5
(381
4)
32.4
19.9
34.4
13.3
(158
9)
59.9
13.8
18.7 7.6
(512
6)
29.2
19.8
36.8
14.2
(237
2)
31.1
16.3
36.4
16.2
(170
3)
30.5
16.7
35.9
16.9
(210
)
28.1
19.0
28.6
24.3

Queensland Cancer Risk Study
Queensland Cancer Fund
77
Queensland Cancer Risk Study
Sex
Age
gro
up (y
ears
)r
emot
enes
s (A
riA
+ ca
tego
r�es)
b
(n)
%
mal
eFe
mal
e20
-39
40-5
960
-75
maj
or c
�tyin
ner
reg�
onal
Out
er
reg�
onal
rem
ote/
very
rem
ote
(n=4
698)
%(n
=472
1)%
(n=4
016)
%(n
=381
4)%
(n=1
589
%(n
=512
6)%
(n=2
372)
%(n
=170
3)%
(n=2
09)
%
If re
spon
dent
was
sun
burn
t at
leas
t on
ce in
th
e pa
st 1
2 m
onth
s?G
22.
How
man
y tim
es d
id yo
u ge
t SE
VE
RE
LY
sunb
urnt
in th
e pa
st 1
2 m
onth
s?
Non
eO
nce
2-5
times
6 or
mor
e tim
es
(660
2)
77.6
14.7 6.9
0.8
(345
1)
75.3
15.1 8.6
1.0
(315
1)
80.2
14.3 4.9
0.5
(338
5)
68.6
19.6
10.8 1.0
(257
9)
86.0
10.4 2.9
0.6
(637
)
91.7 6.0
1.9
0.5
(362
8)
78.4
14.5 6.5
0.6
(163
5)
77.1
15.0 6.8
1.2
(118
3)
77.0
15.0 7.2
0.8
(151
)
72.2
13.9
10.6 3.3
Sola
r�um
use
and
att�
tude
s
G23
. H
ave
you
ever
use
d a
sola
rium
or s
un-
tann
ing
unit?
Ye
sN
o
(941
9)
10.7
89.3
(469
7)
5.9
94.1
(472
2)
15.5
84.5
(401
6)
13.5
86.5
(381
4)
10.2
89.8
(158
9)
4.8
95.2
(512
6)
13.0
87.0
(237
1)
9.6
90.4
(170
3)
6.1
93.9
(210
)
5.2
94.8
If re
spon
dent
has
eve
r us
ed a
sol
ariu
m o
r su
n-ta
nnin
g un
it:G
24.
Hav
e yo
u us
ed a
sol
ariu
m o
r a s
un-
tann
ing
unit
in th
e la
st 1
2 m
onth
s?
Ye
sN
o
(100
8)
12.0
88.0
(276
)
13.4
86.6
(733
)
11.6
88.4
(543
)
17.9
82.1
(389
)
6.2
93.8
(77) 1.3
98.7
(666
)
13.4
86.6
(228
)
11.4
88.6
(104
)
6.7
93.3
(11)
0.0
100.
0

Queensland Cancer Fund
V i e r t e l C e n t r e f o r R e s e a r c h i n C a n c e r C o n t r o l
Queensland Cancer Risk Study
78
Sex
Age
gro
up (y
ears
)r
emot
enes
s (A
riA
+ ca
tego
r�es)
b
(n)
%
mal
eFe
mal
e20
-39
40-5
960
-75
maj
or c
�tyin
ner
reg�
onal
Out
er
reg�
onal
rem
ote/
very
rem
ote
(n=4
698)
%(n
=472
1)%
(n=4
016)
%(n
=381
4)%
(n=1
589
%(n
=512
6)%
(n=2
372)
%(n
=170
3)%
(n=2
09)
%
If re
spon
dent
use
d a
sola
rium
or s
un-ta
nnin
g un
it in
the
last
12
mon
ths:
G25
. H
ow m
any
times
hav
e yo
u us
ed a
so
lariu
m o
r sun
-tann
ing
unit
in th
e la
st
12 m
onth
s?2
or m
ore
times
a w
eek
Wee
kly
Fortn
ight
lyC
once
ntra
ted
burs
ts u
ntil
tann
edO
nce
or tw
ice,
not
regu
larly
(121
)
16.3
13.6 4.8
29.2
36.1
(37)
16.2 5.4
5.4
24.3
48.6
(84)
15.5
16.7 4.8
32.1
31.0
(96)
15.6
12.5 6.3
29.2
36.5
(23)
17.4
21.7 0.0
26.1
34.8
(1)
0.0
0.0
0.0
100.
00.
0
(88)
18.2 8.0
4.5
31.8
37.5
(26) 7.7
34.6 7.7
19.2
30.8
(7)
14.3
14.3 0.0
42.9
28.6
(0)
0.0
0.0
0.0
0.0
0.0
If re
spon
dent
use
d a
sola
rium
or s
un-ta
nnin
g un
it in
the
last
12
mon
ths:
G26
. H
ow lo
ng o
n av
erag
e di
d yo
u us
e th
e so
lariu
m o
r sun
-tann
ing
unit
each
tim
e?Le
ss th
an 1
5 m
inut
esA
bout
15
min
utes
15-3
0 m
inut
esA
bout
30
min
utes
Long
er th
an 3
0 m
inut
es
(121
)
50.9
16.0
26.2 5.2
1.7
(37)
64.9
13.5
10.8 5.4
5.4
(84)
44.0
17.9
33.3 4.8
0.0
(96)
56.3
16.7
25.0 2.1
0.0
(24)
33.3
12.5
33.3
12.5 8.3
(1)
0.0
0.0
0.0
100.
00.
0
(89)
51.7
14.6
27.1 3.4
2.2
(25)
48.0
12.0
28.0
12.0 0.0
(7)
42.9
42.9 0.0
14.3 0.0
(0)
0.0
0.0
0.0
0.0
0.0
If re
spon
dent
use
d a
sola
rium
or s
un-ta
nnin
g un
it in
the
last
12
mon
ths:
G27
. H
as th
e so
lariu
m e
ver a
sked
you
to
sign
a c
onse
nt fo
rm re
gard
ing
use
of
the
sola
rium
(mos
t rec
ent l
ocat
ion)
? Yes
No
Can
’t sa
y
(122
)
38.5
52.7 8.8
(37)
32.4
67.6 0.0
(85)
41.2
45.9
12.9
(37)
38.5
52.1 9.4
(23)
39.1
56.5 4.3
(1)
0.0
100.
00.
0
(89)
37.1
55.1 7.9
(26)
46.2
38.5
15.4
(7)
14.3
75.7 0.0
(0)
0.0
0.0
0.0
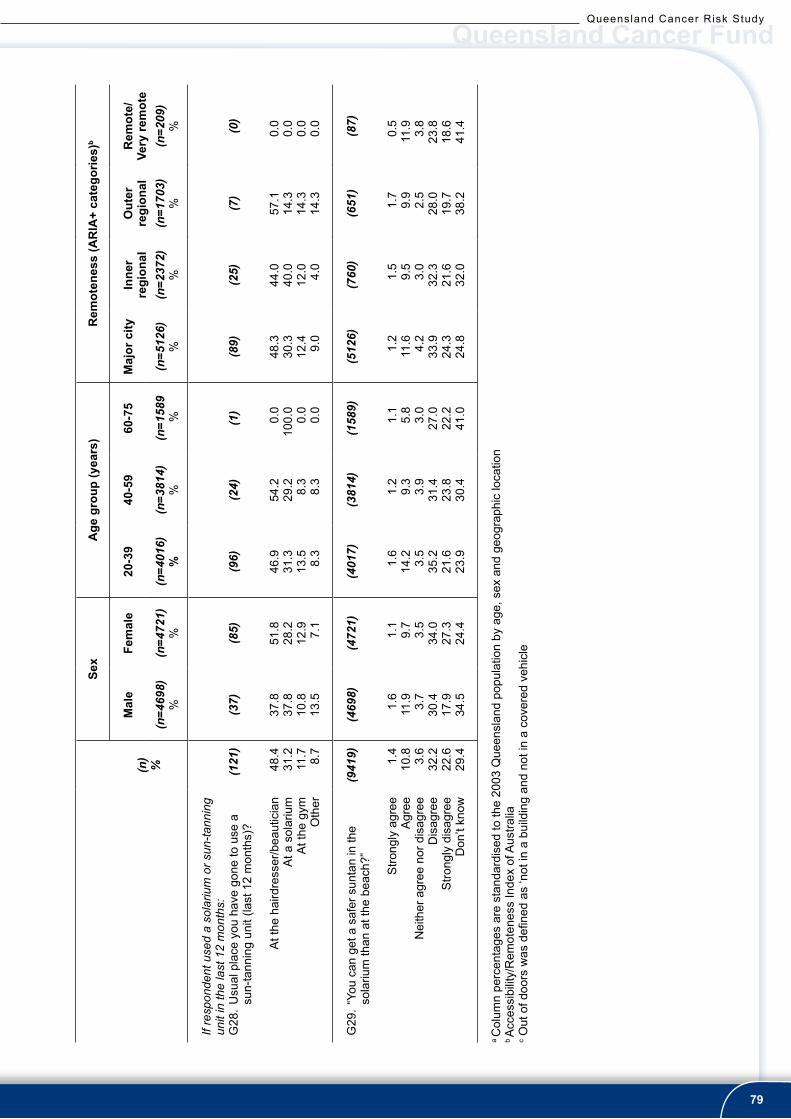
Queensland Cancer Risk Study
Queensland Cancer Fund
79
Queensland Cancer Risk Study
Sex
Age
gro
up (y
ears
)r
emot
enes
s (A
riA
+ ca
tego
r�es)
b
(n)
%
mal
eFe
mal
e20
-39
40-5
960
-75
maj
or c
�tyin
ner
reg�
onal
Out
er
reg�
onal
rem
ote/
very
rem
ote
(n=4
698)
%(n
=472
1)%
(n=4
016)
%(n
=381
4)%
(n=1
589
%(n
=512
6)%
(n=2
372)
%(n
=170
3)%
(n=2
09)
%
If re
spon
dent
use
d a
sola
rium
or s
un-ta
nnin
g un
it in
the
last
12
mon
ths:
G28
. U
sual
pla
ce y
ou h
ave
gone
to u
se a
su
n-ta
nnin
g un
it (la
st 1
2 m
onth
s)?
A
t the
hai
rdre
sser
/bea
utic
ian
At a
sol
ariu
mA
t the
gym
Oth
er
(121
)
48.4
31.2
11.7 8.7
(37)
37.8
37.8
10.8
13.5
(85)
51.8
28.2
12.9 7.1
(96)
46.9
31.3
13.5 8.3
(24)
54.2
29.2 8.3
8.3
(1)
0.0
100.
00.
00.
0
(89)
48.3
30.3
12.4 9.0
(25)
44.0
40.0
12.0 4.0
(7)
57.1
14.3
14.3
14.3
(0)
0.0
0.0
0.0
0.0
G29
. “Y
ou c
an g
et a
saf
er s
unta
n in
the
sola
rium
than
at t
he b
each
?”
Stro
ngly
agr
eeA
gree
Nei
ther
agr
ee n
or d
isag
ree
Dis
agre
eS
trong
ly d
isag
ree
Don
’t kn
ow
(941
9) 1.4
10.8 3.6
32.2
22.6
29.4
(469
8)
1.6
11.9 3.7
30.4
17.9
34.5
(472
1)
1.1
9.7
3.5
34.0
27.3
24.4
(401
7)
1.6
14.2 3.5
35.2
21.6
23.9
(381
4)
1.2
9.3
3.9
31.4
23.8
30.4
(158
9)
1.1
5.8
3.0
27.0
22.2
41.0
(512
6)
1.2
11.6 4.2
33.9
24.3
24.8
(760
)
1.5
9.5
3.0
32.3
21.6
32.0
(651
)
1.7
9.9
2.5
28.0
19.7
38.2
(87)
0.5
11.9 3.8
23.8
18.6
41.4
a C
olum
n pe
rcen
tage
s ar
e st
anda
rdis
ed to
the
2003
Que
ensl
and
popu
latio
n by
age
, sex
and
geo
grap
hic
loca
tion
b A
cces
sibi
lity/
Rem
oten
ess
Inde
x of
Aus
tralia
c Out
of d
oors
was
defi
ned
as ‘n
ot in
a b
uild
ing
and
not i
n a
cove
red
vehi
cle

Queensland Cancer Fund
V i e r t e l C e n t r e f o r R e s e a r c h i n C a n c e r C o n t r o l
Queensland Cancer Risk Study
80
App
endi
x H
. Des
crip
tive
stat
istic
s for
Cha
pter
9: F
EMA
LE R
EPR
OD
UC
TIV
E H
ISTO
RY A
ND
HO
RM
ON
ESa (
n=47
21)
Age
gro
up (y
ears
)r
emot
enes
s (A
riA
+ ca
tego
r�es)
b
(n)
%
20-3
940
-59
60-7
5m
ajor
c�ty
inne
r re
g�on
alO
uter
re
g�on
alr
emot
e/ve
ry re
mot
e(n
=201
8)%
(n=1
910)
%(n
=793
)%
(n=2
594)
%(n
=120
0)%
(n=8
30)
%(n
=90)
%
hor
mon
e m
ed�c
at�o
ns
H1.
Hav
e yo
u ev
er ta
ken
the
Min
i-pill
for b
irth
cont
rol?
Yes
No
Don
’t kn
ow
(472
1)
28.8
71.0 0.1
(201
8)
37.6
62.4 0.0
(190
9)
28.8
71.0 0.2
(794
)
6.7
93.2 0.1
(259
5)
29.2
70.7 0.0
(120
1)
29.6
69.9 0.5
(829
)
27.0
73.0 0.0
(90)
23.3
76.7 0.0
Res
pond
ents
who
hav
e ev
er ta
ken
the
Min
i-pill
:H
2. W
hen
did
you
last
use
the
min
i-pill
? Mor
e th
an 5
yea
rs a
go1-
5 ye
ars
ago
Less
than
12
mon
ths
ago
Cur
rent
use
r
(136
7)
64.2
20.1 7.5
8.2
(759
)
43.3
32.3
11.6
12.8
(554
)
89.4 5.1
2.7
2.9
(54)
98.1 1.9
0.0
0.0
(759
)
61.3
20.2 9.0
9.6
(360
)
68.6
18.6 6.1
6.7
(224
)
67.0
22.8 4.0
6.3
(22)
68.2
13.6 9.1
9.1
Res
pond
ents
who
hav
e ev
er ta
ken
the
Min
i-pill
:H
3. H
ow lo
ng d
id y
ou o
r hav
e yo
u us
ed th
e m
ini-p
ill fo
r
a
ltoge
ther
(mon
ths)
?
<6 m
onth
s6
– 12
mon
ths
>12
mon
ths
Mea
n (S
D)
Med
ian
(min
, max
)
(135
6)
29.1
25.3
45.6
(752
)
35.2
25.3
39.5 c
9 (.0
3,30
0)
(551
)
22.3
26.3
51.4 c
18.0
(0, 3
60)
(54)
11.1
16.7
72.2 c
60.0
(.07,
360)
(758
)
28.6
24.3
47.1 c
12.0
(0,3
60)
(358
)
26.2
29.5
44.3 c
12.0
(0,3
60)
(223
)
33.6
22.4
43.9 c
12.0
(.07,
360)
(21)
42.9
23.8
33.3 c
6.5(
.07,
240)
H4.
Hav
e yo
u ev
er u
sed
any
othe
r typ
es o
f ora
l con
trace
ptiv
e
p
ill?
Yes
No
(472
1)
69.9
30.1
(201
9)
74.8
25.2
(190
9)
70.6
29.4
(793
)
56.1
43.9
(259
4)
68.9
31.1
(120
0)
69.3
30.8
(829
)
73.9
26.1
(90)
75.6
24.4

Queensland Cancer Risk Study
Queensland Cancer Fund
81
Queensland Cancer Risk Study
Age
gro
up (y
ears
)r
emot
enes
s (A
riA
+ ca
tego
r�es)
b
(n)
%
20-3
940
-59
60-7
5m
ajor
c�ty
inne
r re
g�on
alO
uter
re
g�on
alr
emot
e/ve
ry re
mot
e(n
=201
8)%
(n=1
910)
%(n
=793
)%
(n=2
594)
%(n
=120
0)%
(n=8
30)
%(n
=90)
%
Res
pond
ents
who
hav
e ev
er u
sed
the
oral
con
trace
ptiv
e pi
ll:H
5. W
hen
did
you
last
use
the
oral
con
trace
ptiv
e pi
ll?
Mor
e th
an 5
yea
rs a
go1-
5 ye
ars
ago
Less
than
12
mon
ths
ago
Cur
rent
use
r
(330
1)
62.0
14.7 5.2
18.1
(151
0)
32.6
25.7 9.9
31.8
(134
7)
82.6 7.2
1.6
8.7
(445
)
98.9 0.2
0.4
0.4
(178
8)
59.2
15.7 5.7
19.4
(832
)
66.5
13.3 4.8
15.4
(612
)
63.9
13.1 3.9
19.1
(68)
60.3
20.6 7.4
11.8
Res
pond
ents
who
hav
e ev
er u
sed
the
oral
con
trace
ptiv
e pi
ll:H
6. H
ow lo
ng h
ave
you
used
the
oral
con
trace
ptiv
e pi
ll fo
r
a
ltoge
ther
(mon
ths)
?
<5 y
ears
5 –
10 y
ears
>10
year
s
Mea
n (S
D)
Med
ian
(min
, max
)
(339
1)
33.2
35.4
31.4
(151
1)
33.8
41.0
25.2 c
7.0(
0,55
)
(139
5)
30.6
30.9
38.5 c
10.0
(0,4
2)
(489
)
38.7
30.1
30.3 c
7.8(
0,43
)
(180
0)
35.3
34.8
29.8 c
7.0(
0,55
)
(891
)
30.4
36.6
33.0 c
9.0(
0,40
)
(632
)
31.7
35.2
33.1 c
8.0(
0,43
)
(71)
26.8
35.2
38.0 c
9.4(
<0.1
,23)
H7.
Hav
e yo
u ev
er ta
ken
horm
one
repl
acem
ent t
hera
py
(HR
T) th
at h
as b
een
pres
crib
ed b
y yo
ur d
octo
r for
any
re
ason
?
Yes
No
(472
1)
21.9
78.1
(201
9)
2.2
97.8
(191
1)
28.4
71.6
(794
)
56.2
43.8
(259
4)
21.1
78.9
(120
3)
25.2
74.8
(830
)
20.4
79.6
(90)
16.7
83.3

Queensland Cancer Fund
V i e r t e l C e n t r e f o r R e s e a r c h i n C a n c e r C o n t r o l
Queensland Cancer Risk Study
82
Age
gro
up (y
ears
)r
emot
enes
s (A
riA
+ ca
tego
r�es)
b
(n)
%
20-3
940
-59
60-7
5m
ajor
c�ty
inne
r re
g�on
alO
uter
re
g�on
alr
emot
e/ve
ry re
mot
e(n
=201
8)%
(n=1
910)
%(n
=793
)%
(n=2
594)
%(n
=120
0)%
(n=8
30)
%(n
=90)
%
Res
pond
ents
who
hav
e ev
er u
sed
HR
T:H
8. H
ow o
ld w
ere
you
whe
n yo
u fir
st u
sed
HR
T?
<40
40 –
45
46 –
50
51 –
55
>55
Mea
n (S
D)
Med
ian
(min
, max
)
(101
7)
16.7
14.1
25.5
30.3
13.4
(45)
100
.0
0.0
0.
0
0.0
0.
0
29.1
(5.7
)30
.0(1
9,38
)
(535
)
17
.2
19.6
34
.0
25.6
3.
6
45.0
(6.9
)47
.0(1
7,58
)
(438
)
7.
5
8.7
17
.8
39.0
26
.9
50.2
(7.4
)50
.0(1
0,72
)
(81)
15.1
16.5
26.2
28.8
13.4
46.4
(8.3
)48
.0(1
2,68
)
(300
)
17.7
12.0
23.0
33.0
14.3
47.2
(8.3
)49
.0(1
7,69
)
(165
)
19.4
10.3
27.9
30.3
12.1
46.1
(8.6
)48
.0(1
0,70
)
(15)
26.7
13.3
20.0
26.7
13.3
46.1
(8.9
)45
.3(3
2,72
)
Res
pond
ents
who
hav
e ev
er u
sed
HR
T:H
9. H
ow o
ld w
ere
you
whe
n yo
u la
st u
sed
HR
T?
<40
40 –
45
46 –
50
51 –
55
56 –
60
61 –
65
>65
Mea
n (S
D)
Med
ian
(min
, max
)
(100
8) 7.7
5.2
13.2
25.7
22.8
14.8
10.5
(45)
100.
00.
00.
00.
00.
00.
00.
0
31.1
(5.4
)32
.4(2
0,39
)
(532
)
4.7
8.6
21.6
38.7
26.3
0.0
0.0
50.3
(6.2
)52
.0(1
7,59
)
(432
)
1.9
1.6
4.4
12.5
20.8
34.5
24.3
59.5
(7.5
)60
.0(1
0,74
)
(539
)
8.0
5.2
11.9
27.8
21.2
14.8
11.1
53.4
(9.7
)54
.0(1
7,74
)
(290
)
6.6
4.1
13.8
22.1
26.2
15.2
12.1
54.2
(9.0
)55
.0(1
0,73
)
(164
)
9.8
6.7
16.5
26.2
20.7
14.0
6.1
51.9
(9.2
)53
.0(2
1,73
)
(14)
0.0
7.1
14.3
14.3
42.9
14.3
7.1
54.0
(6.8
)55
.0(4
3,72
)

Queensland Cancer Risk Study
Queensland Cancer Fund
83
Queensland Cancer Risk Study
Age
gro
up (y
ears
)r
emot
enes
s (A
riA
+ ca
tego
r�es)
b
(n)
%
20-3
940
-59
60-7
5m
ajor
c�ty
inne
r re
g�on
alO
uter
re
g�on
alr
emot
e/ve
ry re
mot
e(n
=201
8)%
(n=1
910)
%(n
=793
)%
(n=2
594)
%(n
=120
0)%
(n=8
30)
%(n
=90)
%
Res
pond
ents
who
hav
e ev
er u
sed
HR
T:H
10. H
ow lo
ng h
ave
you
used
HR
T fo
r alto
geth
er (m
onth
s)?
< 5
year
s5
– 10
yea
rs>1
0 ye
ars
Mea
n (S
D)
Med
ian
(min
, max
)
(102
9)
50.6
25.8
23.6
(45)
91.1
2.2
6.7 c
0.5(
0,14
)
(541
)
58.6
27.0
14.4 c
3.0(
0,29
)
(442
)
36.7
26.5
36.9 c
7.0(
0,40
)
(546
)
50.5
24.2
25.3 c
4.0(
0,40
)
(300
)
49.7
26.3
24.0 c
5.0(
0,38
)
(169
)
53.8
28.4
17.8 c
4.0(
0,36
)
(15)
40.0
40.0
20.0 c
5.8(
0.3,
28)
Age
at m
enar
che
and
men
opau
se
H11
. How
old
wer
e yo
u w
hen
you
had
your
firs
t per
iod?
<12
12-1
3>1
3
Mea
n (S
D)
Med
ian
(min
, max
)
(471
8)
15.0
48.4
36.6
(199
3)
13
.0
50.4
36
.6
13.1
(1.6
)13
.0 (7
,19)
(189
5)
17
.0
47.8
35
.2
13.0
(1.7
)13
.0 (7
,30)
(779
)
15
.5
44.4
40
.1
13.1
(1.6
)13
.0 (8
,21)
(257
1)
14
.7
49.2
36
.1
13.1
(1.6
)13
.0 (7
,19)
(118
7)
15
.2
48.4
36
.4
13.1
(1.6
)13
.0 (7
,30)
(820
)
15
.9
45.4
38
.6
13.1
(1.7
)13
.0 (8
,21)
(88)
14
.6
49.4
36
.0
13.1
(1.7
)13
.0 (9
,18)
H12
. Thi
nkin
g ab
out y
our
curr
ent s
ituat
ion,
whi
ch o
ne o
f the
fo
llow
ing
appl
ies
to y
ou?
H
avin
g re
gula
r mon
thly
per
iods
P
erio
ds h
ave
stop
ped
for >
12 m
onth
sH
avin
g pe
riods
but
irre
gula
rly (s
kip
mon
ths)
Pre
gnan
t or b
reas
tfeed
ing
Usi
ng d
epro
vera
/impl
ants
(471
3)
44.6
37.3 9.0
6.3
2.8
(201
5)
69.7
3.1
9.5
12
.5
5.3
(190
5)
36.4
47.6
12
.2 2.3
1.4
(794
)
0.3
99.1 0.3
0.1
0.3
(258
9)
46.2
35.3 9.1
6.3
3.1
(119
7)
40.7
41.9 9.4
6.0
2.0
(829
)
45.0
37.0 8.2
6.4
3.4
(91)
48.4
34.1 9.9
6.6
1.1

Queensland Cancer Fund
V i e r t e l C e n t r e f o r R e s e a r c h i n C a n c e r C o n t r o l
Queensland Cancer Risk Study
84
Age
gro
up (y
ears
)r
emot
enes
s (A
riA
+ ca
tego
r�es)
b
(n)
%
20-3
940
-59
60-7
5m
ajor
c�ty
inne
r re
g�on
alO
uter
re
g�on
alr
emot
e/ve
ry re
mot
e(n
=201
8)%
(n=1
910)
%(n
=793
)%
(n=2
594)
%(n
=120
0)%
(n=8
30)
%(n
=90)
%
Res
pond
ents
who
se p
erio
ds s
topp
ed fo
r >12
mon
ths:
H
13. H
ow o
ld w
ere
you
whe
n yo
ur p
erio
ds s
topp
ed
com
plet
ely?
<40
40 –
45
46 –
50
51 –
55
>55
Mea
n (S
D)
Med
ian
(min
, max
)
(173
1)
22.6
15.6
20.7
30.5
10.6
(64)
100
.0
0.0
0.
0
0.0
0.
0
29.9
(4.9
)31
(20,
37)
(898
)
23
.6
17.1
23
.3
30.5
5.
5
44.9
(7.8
)47
(21,
57)
(768
)
14
.8
15.1
19
.5
32.9
17
.6
47.4
(7.5
)50
(12,
67)
(908
)
22
.6
16.3
21
.8
28.9
10
.5
45.2
(8.3
)47
(20,
66)
(490
)
21
.2
16.1
17
.6
33.3
11
.8
45.9
(8.2
)48
(12,
63)
(301
)
23
.2
12.9
23
.2
30.8
9.
9
45.6
(8.2
)48
(22,
67)
(31)
35
.5
12.9
16
.1
32.3
3.
2
41.6
(10.
7)45
(20,
60)
Res
pond
ents
who
se p
erio
ds s
topp
ed fo
r >12
mon
ths:
H
14. D
id y
our p
erio
d en
d:
Nat
ural
ly (o
f the
ir ow
n ac
cord
)A
fter y
ou h
ad a
hys
tere
ctom
yB
ecau
se o
f can
cer
Oth
er re
ason
(1
758)
51.6
39.0 1.0
8.4
(67) 0.0
52.2 4.5
43.3
(907
)
48.3
41.8 1.2
8.7
(785
)
59.9
34.5 0.6
5.0
(919
)
49.9
39.1 1.3
9.7
(501
)
53.3
38.3 1.0
7.4
(307
)
54.1
39.4 0.3
6.2
(31)
48.4
41.9 0.0
9.7
a C
olum
n pe
rcen
tage
s ar
e st
anda
rdis
ed to
the
2003
Que
ensl
and
popu
latio
n by
age
, sex
and
geo
grap
hic
loca
tion.
b A
cces
sibi
lity/
Rem
oten
ess
Inde
x of
Aus
tralia
c Not
app
licab
le to
cal
cula
te a
n ar
ithm
etic
mea
n as
the
dist
ribut
ion
was
ske
wed
.

Queensland Cancer Risk Study
Queensland Cancer Fund
85
Queensland Cancer Risk Study
App
endi
x I.
Des
crip
tive
stat
istic
s for
Cha
pter
10:
CER
VIC
AL
SCR
EEN
ING
a (n=
4721
) (w
omen
onl
y)
Age
gro
up y
ears
rem
oten
ess
(Ar
iA+
cate
gor�e
s)b
(n)
%
20-3
940
-59
60-7
5m
ajor
c�ty
inne
r re
g�on
alO
uter
re
g�on
alr
emot
e/ve
ry re
mot
e(n
=201
8)%
(n=1
910)
%(n
=793
)%
(n=2
594)
%(n
=120
0)%
(n=8
30)
%(n
=90)
%
kno
wle
dge
and
bel�e
fs a
bout
cer
v�ca
l can
cer s
cree
n�ng
I1. I
t is
impo
rtant
to c
heck
for c
ervi
cal c
ance
r eve
n if
I hav
e
no
sym
ptom
s
Stro
ngly
agr
eeA
gree
Nei
ther
agr
ee n
or d
isag
ree
Dis
agre
eS
trong
ly D
isag
ree
Uns
ure/
Don
’t kn
ow/N
o re
spon
se
(472
1)
83.1
14.7 0.4
0.9
0.2
0.5
(201
8)
86.3
12.1 0.2
0.9
0.0
0.4
(191
0)
85.1
13.1 0.3
0.7
0.3
0.4
(793
)
70.5
25.1 1.3
1.6
0.5
1.0
(259
4)
84.1
14.1 0.5
0.9
0.1
0.3
(120
0)
81.1
16.3 0.4
1.1
0.3
0.8
(830
)
82.5
14.9 0.5
1.0
0.2
0.8
(90)
88.9 8.9
0.0
0.0
2.2
0.0
I2. D
o yo
u kn
ow o
f any
test
s/ch
ecks
that
you
r doc
tor c
ould
do
to s
ee if
you
had
cer
vica
l can
cer?
Yes
No
(472
1)
88.3
11.4
(201
9)
90.4 9.6
(191
1)
90.4 9.6
(793
)
78.3
21.7
(259
4)
89.2
10.8
(120
3)
86.9
13.1
(830
)
87.3
12.7
(90)
91.1 8.9
Res
pond
ents
who
kno
w o
f tes
ts/c
heck
s fo
r cer
vica
l can
cer:
I3. W
hat a
re th
e te
sts/
chec
ksc
P
ap s
mea
r tes
t
Inte
rnal
vag
inal
exa
min
atio
n
Blo
od te
st
Thin
Pre
p/P
apN
et
Ultr
asou
nd
Bio
psy
C
olpo
scop
y
Oth
er
(417
1)
98.3 3.1
2.9
2.3
2.2
2.1
1.5
3.3
(182
4)
99.0 3.0
3.3
2.5
2.1
2.0
2.4
3.6
(172
6)
98.2 3.0
3.0
2.7
2.8
2.0
0.9
3.2
(621
)
96.1 3.5
1.6
1.1
0.8
2.6
0.6
2.6
(231
4)
98.5 3.3
2.7
2.2
2.8
2.2
1.6
3.6
(104
3)
98.2 2.6
3.1
2.5
1.4
1.6
1.2
2.8
(725
)
97.7 3.0
3.0
2.6
1.2
2.2
1.8
2.9
(82)
96.3 2.4
3.7
3.7
3.7
2.4
2.4
3.7

Queensland Cancer Fund
V i e r t e l C e n t r e f o r R e s e a r c h i n C a n c e r C o n t r o l
Queensland Cancer Risk Study
86
Age
gro
up y
ears
rem
oten
ess
(Ar
iA+
cate
gor�e
s)b
(n)
%
20-3
940
-59
60-7
5m
ajor
c�ty
inne
r re
g�on
alO
uter
re
g�on
alr
emot
e/ve
ry re
mot
e(n
=201
8)%
(n=1
910)
%(n
=793
)%
(n=2
594)
%(n
=120
0)%
(n=8
30)
%(n
=90)
%
I4. D
o yo
u kn
ow w
hat c
ause
s ce
rvic
al c
ance
r?c
S
exua
l int
erco
urse
H
uman
Pap
illom
aviru
s (H
PV
)
Fam
ily h
isto
ry
Infe
ctio
n
Oth
er
No
caus
e m
entio
ned
(472
1)
11.5 5.3
4.9
3.7
23.6
65.4
(201
8)
9.8
5.9
6.5
2.9
24.6
64.6
(191
0)
13.5 5.8
3.8
4.8
25.8
63.1
(793
)
10.9 2.6
3.4
3.0
16.0
73.1
(259
4)
12.6 6.8
6.1
3.8
25.1
62.6
(120
0)
10.1 3.3
2.3
4.0
21.3
69.1
(830
)
10.6 3.9
5.3
3.3
23.3
67.3
(90)
5.6
2.2
2.2
3.3
15.6
76.7
If re
spon
dent
ans
wer
ed “H
PV
” or”
infe
ctio
n”:
I5. A
bout
wha
t per
cent
age
of c
ervi
cal c
ance
rs d
o yo
u th
ink
a
re c
ause
d by
infe
ctio
n?
M
ean
(SD
)
Med
ian
(min
, max
)
(155
)(7
3)
58.8
(29.
2)60
.0(1
,100
)
(71)
60.0
(23.
1)53
.3(1
0,10
0)
(11)
64.7
(29.
8)70
.6(1
,100
)
(104
)
58.4
(28.
1)60
.0 (1
,100
)
(26)
69.1
(22.
0)70
.0(1
0,00
)
(25)
54.8
(23.
3)50
.0(5
,100
)
(2)
67.3
(10.
9)67
.7 (6
0,75
)
If re
spon
dent
ans
wer
ed “H
PV
” or”
infe
ctio
n”:
I6. W
ould
som
eone
kno
w w
heth
er o
r not
they
hav
e th
is
i
nfec
tion
with
out a
spe
cial
test
bei
ng d
one?
Ye
s
No
D
on’t
know
(354
)
13.6
78.5 7.9
(143
)
6.3
88.1 5.6
(171
)
19.3
71.3 9.4
(39)
15.4
74.4
10.3
(230
)
12.6
80.9 6.5
(71)
12.7
77.5 9.9
(49)
22.4
65.3
12.2
(4)
0.0
100.
00.
0
If re
spon
dent
ans
wer
ed “H
PV
” or”
infe
ctio
n”:
I7. I
f no
treat
men
t is
give
n, a
bout
wha
t per
cent
age
of p
eopl
e
with
this
infe
ctio
n (H
PV
) will
get
cer
vica
l can
cer?
M
ean
(SD
)
Med
ian
(min
, max
)
(144
)(6
7)
50.0
(32.
6)50
.0(2
,100
)
(59)
56.3
(30.
7)60
.0 (0
,100
)
(16)
63.1
(28.
9)50
.0 (5
,100
)
(91)
53.5
(31.
9)50
.0 (2
,100
)
(29)
52.7
(32.
3)50
.0 (0
,100
)
(18)
59.7
(31.
2)61
.3 (2
,100
)
(2)
54.4
(6.7
)53
.6 (5
0,60
)

Queensland Cancer Risk Study
Queensland Cancer Fund
87
Queensland Cancer Risk Study
Age
gro
up y
ears
rem
oten
ess
(Ar
iA+
cate
gor�e
s)b
(n)
%
20-3
940
-59
60-7
5m
ajor
c�ty
inne
r re
g�on
alO
uter
re
g�on
alr
emot
e/ve
ry re
mot
e(n
=201
8)%
(n=1
910)
%(n
=793
)%
(n=2
594)
%(n
=120
0)%
(n=8
30)
%(n
=90)
%
I8. D
o yo
u kn
ow w
hat t
he re
com
men
ded
time
is b
etw
een
P
ap s
mea
rs?
Ye
s
No
(472
1)
85.5
14.5
(201
9)
89.8
10.2
(191
0)
86.2
13.8
(793
)
72.6
27.4
(259
4)
86.3
13.7
(120
1)
84.4
15.6
(830
)
84.8
15.2
(89)
84.3
15.7
Res
pond
ents
who
sai
d th
ey k
now
the
reco
mm
ende
d tim
e be
twee
n P
ap s
mea
rs:
I9. W
hat i
s th
e re
com
men
ded
time?
Le
ss th
an a
yea
r
12 m
onth
s
Up
to 2
yea
rs
Up
to 3
yea
rs
Mor
e th
an 3
yea
rs
M
ean
(SD
)
Med
ian
(min
, max
)
(403
7) 0.0
9.8
80.5 1.1
8.6
(181
3)
0.0
7.7
84.2 1.7
6.5
1.9
(0.2
)2.
0 (1
, 2)
(164
7)
0.0
10.4
79.2 0.6
9.8
1.9
(0.3
)2.
0 (1
, 2)
(577
)
0.0
14.9
72.3 0.5
12.3
1.9
(0.3
)2.
0 (1
, 2)
(223
9)
0.0
10.8
79.9 1.2
8.2
1.9
(0.3
)2.
0 (1
, 2)
(101
3)
0.0
9.4
81.6 0.9
8.1
1.9
(0.3
)2.
0 (1
, 2)
(75)
0.0
8.0
80.5 1.0
10.5
1.9
(0.3
)2.
0 (1
, 2)
(75)
0.0
5.3
84.0 0.0
10.7
1.9
(0.3
)2.
0 (1
, 2)
Cer
v�ca
l can
cer s
cree
n�ng
beh
av�o
ur
I10.
Hav
e yo
u ev
er h
ad a
Pap
sm
ear t
est?
Yes
No
Don
’t kn
ow
(472
1)
96.6 3.3
0.1
(201
9)
94.8 5.2
0.0
(191
2)
99.3 0.7
0.1
(794
)
94.8 5.0
0.1
(259
4)
96.2 3.8
0.0
(120
2)
97.5 2.5
0.0
(830
)
96.5 3.3
0.2
(90)
96.7 3.3
0.0

Queensland Cancer Fund
V i e r t e l C e n t r e f o r R e s e a r c h i n C a n c e r C o n t r o l
Queensland Cancer Risk Study
88
Age
gro
up y
ears
rem
oten
ess
(Ar
iA+
cate
gor�e
s)b
(n)
%
20-3
940
-59
60-7
5m
ajor
c�ty
inne
r re
g�on
alO
uter
re
g�on
alr
emot
e/ve
ry re
mot
e(n
=201
8)%
(n=1
910)
%(n
=793
)%
(n=2
594)
%(n
=120
0)%
(n=8
30)
%(n
=90)
%
Res
pond
ents
who
hav
e ev
er h
ad a
Pap
sm
ear t
est:
I11.
How
old
wer
e yo
u w
hen
you
had
your
firs
t Pap
test
?
<2
0
20 –
29
30
– 3
9
40 –
49
50
– 5
9
60 –
69
70
+
Mea
n (S
D)
Med
ian
(min
, max
)
(412
0)
32.4
43.2
13.3
7.6
3.0
0.6
0.0
(186
6)
54.1
43.8 2.0
0.0
0.0
0.0
0.0
19.9
(3.1
)19
.0(1
6,27
)
(169
2)
18.9
50.8
20.0 9.3
0.9
0.0
0.0
25.4
(9.4
)22
.0(1
8,56
)
(562
)
0.5
18.1
30.6
27.8
18.9 4.1
0.0
39.1
(13.
8)44
.1(2
0,55
)
(225
0)
32.1
43.7
13.5 7.5
2.7
0.4
0.0
23.0
(8.5
)20
.4(1
6,56
)
(105
3)
31.1
40.3
15.2 8.5
4.1
0.8
0.0
23.1
(6.6
)21
.0(1
7,45
)
(729
)
33.9
46.0
10.6 6.4
2.5
0.7
0.0
21.2
(6.8
)20
.0(1
7,55
)
(80)
38.8
41.3
10.0
10.0 0.0
0.0
0.0
24.1
(8.7
)20
.0 (1
5,62
)
Res
pond
ents
who
hav
e ev
er h
ad a
Pap
sm
ear t
est:
I12.
How
long
has
it b
een
sinc
e yo
ur la
st P
ap s
mea
r tes
t?
Less
than
one
yea
r ago
1 ye
ar to
less
than
2 y
ears
ago
2 ye
ars
to le
ss th
an 3
yea
rs a
go3
year
s to
less
than
5 y
ears
ago
5 or
mor
e ye
ars
ago
Don
’t kn
ow
(456
2)
40.6
31.0
8.8
5.1
14.4
0.1
(191
2)
48.7
33.4 9.3
4.4
4.0
0.2
(189
6)
38.8
31.8 8.4
5.1
16.0 0.1
(751
)
24.5
23.0 8.3
6.8
36.9 0.5
(249
7)
42.2
31.3 8.2
5.2
12.9 0.3
(117
0)
37.7
30.0 9.7
4.9
17.6 0.2
(802
)
40.0
31.2 8.5
5.2
15.0 0.1
(88)
35.2
36.4
14.8 3.4
10.2 0.0
Res
pond
ents
who
hav
e ev
er h
ad a
Pap
sm
ear t
est:
I13.
Wha
t pro
mpt
ed y
ou to
hav
e th
is m
ost r
ecen
t Pap
test
?
G
ener
al/re
gula
r che
ck u
p
Sym
ptom
s (ir
regu
lar p
erio
ds, e
tc)
Fa
mily
his
tory
H
ad c
ance
r in
the
past
D
octo
r sug
gest
ed I
have
this
test
(453
7)
84.5
5.6
1.0
1.8
7.0
(190
2)
83.4 6.5
1.1
2.2
6.8
(188
9)
86.5 4.8
1.2
2.0
5.6
(747
)
82.3 5.5
0.5
0.5
11.1
(249
1)
84.7 6.1
0.9
1.6
6.6
(115
5)
84.0 5.3
1.2
1.7
7.8
(798
)
84.8 4.9
1.0
2.1
7.1
(87)
85.1 1.1
1.1
4.6
8.0

Queensland Cancer Risk Study
Queensland Cancer Fund
89
Queensland Cancer Risk Study
Age
gro
up y
ears
rem
oten
ess
(Ar
iA+
cate
gor�e
s)b
(n)
%
20-3
940
-59
60-7
5m
ajor
c�ty
inne
r re
g�on
alO
uter
re
g�on
alr
emot
e/ve
ry re
mot
e(n
=201
8)%
(n=1
910)
%(n
=793
)%
(n=2
594)
%(n
=120
0)%
(n=8
30)
%(n
=90)
%
Res
pond
ents
who
hav
e ev
er h
ad a
Pap
sm
ear t
est:
I14.
Do
you
have
regu
lar P
ap s
mea
r tes
ts?
Ye
s
Onl
y ha
d on
e
No
or n
ot re
gula
rly
Not
any
mor
e
(456
2)
74.1 3.0
10.2
12.7
(191
4)
82.7 5.3
10.1 1.9
(189
6)
75.2 0.9
8.9
15.0
(752
)
49.9 2.4
13.4
34.3
(249
6)
74.3 3.8
10.7
11.3
(116
9)
72.9 2.0
9.8
15.4
(801
)
74.9 2.2
9.5
13.4
(88)
78.4 3.4
6.8
11.4
Res
pond
ents
who
hav
e re
gula
r Pap
sm
ear t
ests
:I1
5. W
hat i
s th
e us
ual t
ime
perio
d be
twee
n yo
ur P
ap te
sts?
Le
ss th
an a
yea
r
12 m
onth
s
Up
to 2
yea
rs
Up
to 3
yea
rs
Mor
e th
an 3
yea
rs
Don
’t kn
ow/C
an’t
say
(337
8) 4.4
23.2
67.9 3.1
0.6
0.7
(157
8)
6.7
22.1
66.8 3.3
0.4
0.7
(142
5)
2.7
25.6
67.6 2.8
0.8
0.4
(375
)
1.6
18.7
73.6 3.7
0.8
1.6
(185
1)
5.0
23.3
67.0 3.5
0.5
0.6
(851
)
3.6
21.9
69.6 3.3
0.9
0.7
(599
)
3.5
25.2
68.4 2.0
0.3
0.5
(68)
4.4
22.1
69.1 1.5
1.5
1.5
a C
olum
n pe
rcen
tage
s ar
e st
anda
rdis
ed to
the
2003
Que
ensl
and
popu
latio
n by
age
, sex
and
geo
grap
hic
loca
tion.
b A
cces
sibi
lity/
Rem
oten
ess
Inde
x of
Aus
tralia
c D
oes
not a
dd u
p to
100
% a
s qu
estio
n al
low
s fo
r mul
tiple
resp
onse
s.

Queensland Cancer Fund
V i e r t e l C e n t r e f o r R e s e a r c h i n C a n c e r C o n t r o l
Queensland Cancer Risk Study
90
App
endi
x J.
Des
crip
tive
stat
istic
s for
Cha
pter
10:
BR
EAST
SC
REE
NIN
Ga (
n=27
03) (
wom
en a
ged
>40
year
s onl
y)
Age
gro
up (y
ears
)r
emot
enes
s (A
riA
+ ca
tego
r�es)
b
(n)
%
40-4
950
-69
70-7
5m
ajor
c�ty
inne
r re
g�on
alO
uter
re
g�on
alr
emot
e/ve
ry re
mot
e
(n=9
59)
%(n
=153
0)%
(n=2
14)
%(n
=142
8)%
(n=7
58)
%(n
=470
)%
(n=4
6)%
kno
wle
dge
and
bel�e
fs a
bout
bre
ast c
ance
r scr
een�
ng
J1.
Do
you
agre
e or
dis
agre
e w
ith th
e st
atem
ent,
it is
im
porta
nt to
che
ck fo
r bre
ast c
ance
r eve
n if
I hav
e no
s
ympt
oms?
S
trong
ly a
gree
A
gree
N
eith
er a
gree
nor
dis
agre
e
Dis
agre
e
Stro
ngly
dis
agre
e
Uns
ure/
Don
’t kn
ow/N
o re
spon
se
(270
3)
82.3
16.1
0.2
0.7
0.3
0.4
(959
)
81.9
17.0 0.3
0.3
0.4
0.1
(153
1)
84.1
14.3 0.1
0.7
0.2
0.6
(214
)
71.0
24.3 0.5
2.8
0.5
1.0
(142
8)
81.9
17.1 0.0
0.6
0.1
0.3
(758
)
81.3
15.7 0.5
1.1
0.5
0.9
(470
)
84.5
14.0 0.4
0.6
0.2
0.2
(46)
91.3 8.7
0.0
0.0
0.0
0.0
J2. D
o yo
u kn
ow o
f any
test
s/ch
ecks
that
you
or y
our d
octo
r
co
uld
do to
see
if y
ou h
ad b
reas
t can
cer?
Ye
s
No
(270
3)
97.0
3.0
(959
)
97.4 2.6
(153
0)
97.2 2.8
(214
)
94.4 5.6
(142
8)
97.6 2.4
(757
)
96.0 4.0
(470
)
97.0 3.0
(46)
95.7 4.3

Queensland Cancer Risk Study
Queensland Cancer Fund
91
Queensland Cancer Risk Study
Age
gro
up (y
ears
)r
emot
enes
s (A
riA
+ ca
tego
r�es)
b
(n)
%
40-4
950
-69
70-7
5m
ajor
c�ty
inne
r re
g�on
alO
uter
re
g�on
alr
emot
e/ve
ry re
mot
e
(n=9
59)
%(n
=153
0)%
(n=2
14)
%(n
=142
8)%
(n=7
58)
%(n
=470
)%
(n=4
6)%
Res
pond
ents
who
kno
w o
f tes
ts/c
heck
s fo
r bre
ast c
ance
r:J3
. Wha
t are
thes
e te
sts/
chec
ksc
M
amm
ogra
m
Bre
ast s
elf e
xam
inat
ion
C
linic
al b
reas
t exa
min
atio
n
Ultr
asou
nd
Bio
psy
C
T sc
an
Blo
od te
st
Oth
er
(262
3)
92.7
63.1
30.0
15.0
4.1
2.0
1.1
2.2
(934
)
92.4
69.2
31.7
16.3
5.9
2.5
0.9
1.5
(148
7)
93.8
61.8
29.0
15.5 3.2
1.9
1.3
2.6
(202
)
86.1
45.0
29.2 5.0
2.5
0.0
1.0
1.5
(205
3)
93.2
64.5
28.6
17.3 3.7
2.2
0.7
2.4
(101
8)
93.4
56.5
30.5
12.9 4.5
1.1
1.5
1.2
(665
)
90.6
69.3
33.6
11.8 3.9
2.4
1.3
3.1
(72)
88.6
68.2
28.9 9.1
8.9
2.2
4.5
0.0
Res
pond
ents
who
hav
e re
gula
r mam
mog
ram
s:J4
. Do
you
know
wha
t the
reco
mm
ende
d tim
e is
bet
wee
n
m
amm
ogra
ms?
Ye
s
No
(178
1)
83.5
16.5
(365
)
78.1
21.9
(126
0)
85.5
14.5
(156
)
80.1
19.9
(952
)
83.3
16.7
(487
)
85.2
14.8
(308
)
81.2
18.8
(34)
88.2
11.8

Queensland Cancer Fund
V i e r t e l C e n t r e f o r R e s e a r c h i n C a n c e r C o n t r o l
Queensland Cancer Risk Study
92
Age
gro
up (y
ears
)r
emot
enes
s (A
riA
+ ca
tego
r�es)
b
(n)
%
40-4
950
-69
70-7
5m
ajor
c�ty
inne
r re
g�on
alO
uter
re
g�on
alr
emot
e/ve
ry re
mot
e
(n=9
59)
%(n
=153
0)%
(n=2
14)
%(n
=142
8)%
(n=7
58)
%(n
=470
)%
(n=4
6)%
Res
pond
ents
who
sai
d th
ey k
now
the
reco
mm
ende
d tim
e be
twee
n m
amm
ogra
ms:
J5. W
hat i
s th
e re
com
men
ded
time?
Le
ss th
an a
yea
r
A ye
ar
Up
to 2
yea
rs
Up
to 3
yea
rs
Mor
e th
an 3
yea
rs
M
ean
(SD
)
Med
ian
(min
, max
)
(148
4) 0.0
12.1
86.7 1.0
0.1
(284
)
0.0
13.4
85.2 1.4
0.0
1.9
(0.4
)2.
0 (1
, 3)
(107
4)
0.0
11.8
87.1 0.9
0.2
1.9
(0.4
)2.
0 (1
, 6)
(125
)
0.0
12.0
87.2 0.8
0.0
1.9
(0.3
)2.
0 (1
, 3)
(790
)
0.0
13.5
84.8 1.6
0.0
1.9
(0.4
)2.
0 (1
, 3)
(414
)
0.0
11.8
87.2 0.5
0.5
1.9
(0.4
)2.
0 (1
, 6)
(249
)
0.0
8.8
91.2 0.0
0.0
1.9
(0.3
)2.
0 (1
, 2)
(31) 0.0
9.7
90.3 0.0
0.0
1.9
(0.3
)2.
0 (1
, 2)
Bre
ast c
ance
r scr
een�
ng b
ehav
�our
J6. H
ave
you
ever
had
a m
amm
ogra
m?
Ye
s
No
(270
3)
82.4
17.6
(959
)
63.1
36.9
(153
1)
93.3 6.7
(214
)
91.6 8.4
(142
8)
83.0
17.0
(758
)
81.4
18.6
(470
)
82.6
17.4
(47)
80.9
19.1
Res
pond
ents
who
hav
e ev
er h
ad a
mam
mog
ram
:J7
. How
old
wer
e yo
u w
hen
you
had
your
firs
t mam
mog
ram
?
<3
0
30 –
39
40
– 4
9
50 –
59
60
– 6
9
70+
M
ean
(SD
)
Med
ian
(min
, max
)
(210
4) 4.4
19.0
47.5
24.7 4.2
0.2
(598
)
8.2
36.5
55.4 0.0
0.0
0.0
38.0
(5.9
)40
.0(0
,49)
(134
8)
2.8
13.0
47.5
34.1 2.6
0.0
44.9
(8.1
)45
.0(0
, 69)
(158
)
3.2
3.8
18.4
38.0
33.5 3.2
53.1
(12.
1)55
.0(0
, 72)
(111
8) 3.6
19.7
48.5
24.7 3.3
0.3
43.6
(8.3
)43
.0(0
, 71)
(585
)
5.8
18.1
44.1
26.2 5.6
0.2
43.5
(10.
5)44
.0(0
, 72)
(366
)
4.9
18.3
48.9
23.0 4.6
0.3
43.3
(9.1
)43
.0(0
, 71)
(38) 2.6
15.8
55.3
18.4 5.3
2.6
44.8
(8.8
)43
.9(2
1, 8
4)

Queensland Cancer Risk Study
Queensland Cancer Fund
93
Queensland Cancer Risk Study
Age
gro
up (y
ears
)r
emot
enes
s (A
riA
+ ca
tego
r�es)
b
(n)
%
40-4
950
-69
70-7
5m
ajor
c�ty
inne
r re
g�on
alO
uter
re
g�on
alr
emot
e/ve
ry re
mot
e
(n=9
59)
%(n
=153
0)%
(n=2
14)
%(n
=142
8)%
(n=7
58)
%(n
=470
)%
(n=4
6)%
Res
pond
ents
who
hav
e ev
er h
ad a
mam
mog
ram
:J8
. How
long
has
it b
een
sinc
e yo
ur la
st m
amm
ogra
m?
Le
ss th
an o
ne y
ear a
go
1 ye
ar to
less
than
2 y
ears
ago
2
year
s to
less
than
3 y
ears
ago
3
year
s to
less
than
5 y
ears
ago
5
or m
ore
year
s ag
o
Don
’t kn
ow/n
ot s
ure
(222
9)
47.1
34.1 7.4
3.6
7.4
0.4
(604
)
39.9
29.6
10.4 5.8
13.7 0.5
(142
8)
51.0
35.4 5.8
2.7
4.8
0.3
(197
)
41.1
38.1 9.6
4.1
6.6
0.5
(118
6)
48.1
32.5 8.4
4.3
6.1
0.6
(616
)
46.3
35.7 6.5
2.3
9.3
0.0
(389
)
45.5
36.0 5.1
4.1
8.7
0.5
(37)
43.2
37.8
13.5 0.0
5.4
0.0
Res
pond
ents
who
hav
e ev
er h
ad a
mam
mog
ram
:J9
. Wha
t pro
mpt
ed y
ou to
hav
e yo
ur m
ost r
ecen
t
m
amm
ogra
m?
G
ener
al/re
gula
r che
ck u
p
Sym
ptom
s (lu
mp,
dis
char
ge, p
ain
etc)
Fa
mily
his
tory
H
ad b
reas
t can
cer i
n th
e pa
st
Doc
tor s
ugge
sted
I ha
ve th
is te
st
(222
2)
75.7
12.7 4.2
2.7
4.6
(601
)
55.2
29.3 6.8
1.8
6.8
(142
5)
83.4 6.7
3.4
3.0
3.5
(196
)
83.2 5.6
2.0
3.6
5.6
(118
4)
74.9
12.0 4.7
2.8
5.6
(616
)
74.8
14.1 4.7
2.9
3.4
(384
)
79.2
12.8 2.1
2.3
3.6
(38)
81.6 7.9
5.3
2.6
2.6
Res
pond
ents
who
hav
e ev
er h
ad a
mam
mog
ram
:J1
0. W
as th
e pl
ace
whe
re y
ou h
ad y
our l
ast m
amm
ogra
m:
Fr
ee p
ublic
bre
ast s
cree
ning
clin
ic
Free
mob
ile/re
loca
tabl
e sc
reen
ing
serv
ice
P
rivat
e br
east
clin
ic
A pr
ivat
e ra
diol
ogis
t
Free
pub
lic s
ervi
ce a
t a p
rivat
e fa
cilit
y
Don
’t kn
ow/c
an’t
say
(222
5)
56.7
12.6
11.2
10.2 8.1
1.1
(602
)
45.7
12.1
13.0
18.4 8.6
2.2
(142
6)
59.9
13.0
11.3 7.2
8.0
0.6
(197
)
67.0
11.7 5.6
6.6
7.6
1.5
(118
3)
59.9 6.0
14.8
10.8 7.2
1.3
(616
)
55.4
13.8 8.3
11.9
10.1 0.6
(387
)
53.0
25.1 5.4
7.0
8.3
1.3
(37)
16.2
73.0 8.1
0.0
2.7
0.0

Queensland Cancer Fund
V i e r t e l C e n t r e f o r R e s e a r c h i n C a n c e r C o n t r o l
Queensland Cancer Risk Study
94
Age
gro
up (y
ears
)r
emot
enes
s (A
riA
+ ca
tego
r�es)
b
(n)
%
40-4
950
-69
70-7
5m
ajor
c�ty
inne
r re
g�on
alO
uter
re
g�on
alr
emot
e/ve
ry re
mot
e
(n=9
59)
%(n
=153
0)%
(n=2
14)
%(n
=142
8)%
(n=7
58)
%(n
=470
)%
(n=4
6)%
Res
pond
ents
who
hav
e ev
er h
ad a
mam
mog
ram
:J1
1.
Do
you
have
regu
lar m
amm
ogra
ms?
Ye
s
Onl
y ha
d on
e
No
or n
ot re
gula
rly
Not
any
mor
e
(222
9)
79.9 9.9
8.3
1.9
(605
)
60.3
25.0
13.6 1.2
(142
8)
88.2 4.2
6.2
1.4
(196
)
79.6 4.6
7.7
8.2
(118
4)
80.3 9.6
8.6
1.4
(617
)
78.8
10.9 7.5
2.9
(387
)
79.6 9.3
9.3
1.8
(38)
89.5 7.9
2.6
0.0
Res
pond
ents
who
hav
e re
gula
r mam
mog
ram
s:J1
2.
Wha
t is
the
usua
l tim
e pe
riod
betw
een
your
m
amm
ogra
ms?
Le
ss th
an a
yea
r
A ye
ar
Up
to 2
yea
rs
Up
to 3
yea
rs
Mor
e th
an 3
yea
rs
Don
’t kn
ow/c
an’t
say
(178
2) 1.3
23.6
72.2 1.7
0.4
0.8
(367
)
2.7
25.9
68.7 1.6
0.8
0.3
(125
9)
1.0
23.8
72.4 1.7
0.3
0.9
(156
)
0.6
16.7
78.8 2.6
0.0
1.3
(952
)
1.5
25.1
69.9 2.1
0.5
0.9
(486
)
1.2
23.5
73.5 1.0
0.2
0.6
(308
)
1.0
19.5
76.6 1.6
0.3
1.0
(34) 0.0
23.5
73.5 2.9
0.0
0.0
a C
olum
n pe
rcen
tage
s ar
e st
anda
rdis
ed to
the
2003
Que
ensl
and
popu
latio
n by
age
, sex
and
geo
grap
hic
loca
tion.
b A
cces
sibi
lity/
Rem
oten
ess
Inde
x of
Aus
tralia
c D
oes
not a
dd u
p to
100
% a
s qu
estio
n al
low
s fo
r mul
tiple
resp
onse
s.

Queensland Cancer Risk Study
Queensland Cancer Fund
95
Queensland Cancer Risk Study
App
endi
x K
. Des
crip
tive
stat
istic
s for
Cha
pter
10:
CO
LOR
ECTA
L SC
REE
NIN
Ga (
n=77
78) (
men
and
wom
en a
ged
>30
year
s onl
y)
Sex
Age
gro
up (y
ears
)r
emot
enes
s (A
riA
+ ca
tego
r�es)
b
(n)
%
mal
eFe
mal
e30
-49
50-7
5m
ajor
c�ty
inne
r re
g�on
alO
uter
re
g�on
alr
emot
e/ve
ry re
mot
e(n
=384
4)%
(n=3
934)
%(n
=433
2)%
(n=3
447)
%(n
=412
8)%
(n=2
045)
%(n
=142
9)%
(n=1
71)
%
kno
wle
dge
and
bel�e
fs a
bout
col
orec
tal c
ance
r sc
reen
�ng
K1.
D
o yo
u ag
ree
or d
isag
ree
with
the
stat
emen
t, it
is im
porta
nt to
che
ck fo
r bow
el c
ance
r eve
n if
I hav
e no
sym
ptom
s?S
trong
ly a
gree
Agr
eeN
eith
er a
gree
nor
dis
agre
eD
isag
ree
Stro
ngly
dis
agre
eU
nsur
e/D
on’t
know
/No
resp
onse
(777
8)
39.5
40.1 3.1
10.1 0.7
6.6
(384
3)
39.9
45.0 2.4
7.9
0.7
4.0
(393
4)
39.1
35.4 3.7
12.2 0.6
9.2
(433
2)
36.9
41.1 3.0
11.2 0.7
6.8
(344
5)
42.8
38.5 3.2
8.6
0.6
6.2
(412
7)
38.7
39.2 3.8
11.3 0.5
6.5
(204
5)
39.7
40.6 2.7
9.5
0.9
6.6
(142
8)
41.0
42.2 1.6
7.8
0.6
6.9
(171
)
45.0
40.4 1.8
6.4
2.3
4.1
K2.
D
o yo
u kn
ow o
f any
test
s/ch
ecks
that
you
or
your
doc
tor c
ould
do
to s
ee if
you
had
bow
el
canc
er?
Yes
No
(777
8)
54.4
45.6
(384
4)
42.0
58.0
(393
4)
66.4
33.6
(433
1)
48.2
51.8
(344
6)
62.2
37.8
(412
7)
54.2
45.8
(204
5)
55.8
44.2
(142
9)
53.7
46.3
(171
)
47.4
52.6

Queensland Cancer Fund
V i e r t e l C e n t r e f o r R e s e a r c h i n C a n c e r C o n t r o l
Queensland Cancer Risk Study
96
Sex
Age
gro
up (y
ears
)r
emot
enes
s (A
riA
+ ca
tego
r�es)
b
(n)
%
mal
eFe
mal
e30
-49
50-7
5m
ajor
c�ty
inne
r re
g�on
alO
uter
re
g�on
alr
emot
e/ve
ry re
mot
e(n
=384
4)%
(n=3
934)
%(n
=433
2)%
(n=3
447)
%(n
=412
8)%
(n=2
045)
%(n
=142
9)%
(n=1
71)
%
Res
pond
ents
who
kno
w o
f tes
ts/c
heck
s fo
r bo
wel
ca
ncer
:K
3.
Wha
t are
thes
e te
sts/
chec
ksc
C
olon
osco
py
Faec
al o
ccul
t blo
od te
st (F
OB
T)
Look
for b
lood
in b
owel
mot
ion
B
lood
test
B
ariu
m e
nem
a
Dig
ital r
ecta
l exa
min
atio
n (D
RE
)
Imag
ing
test
s (u
ltras
ound
, MR
I, X
-ray
)
End
osco
py/G
astro
scop
y
Sig
moi
dosc
opy/
Flex
ible
sig
moi
dosc
opy
Vi
rtual
col
onos
copy
(CT
colo
nogr
aphy
)
Sto
ol te
st
Hom
e te
st k
it
Sym
ptom
s
Bio
psy
K
now
ther
e ar
e te
st b
ut n
ot s
ure
wha
t the
y ar
e
Oth
er
(422
9)
75.7
23.9 9.1
6.6
6.4
5.6
3.7
3.0
1.6
1.5
1.1
0.9
0.9
0.7
1.4
2.7
(161
5)
64.0
24.2 8.4
11.3 6.1
6.6
4.1
3.7
1.4
2.0
1.2
0.6
0.7
0.6
1.9
3.5
(261
4)
82.9
23.7 9.5
3.6
6.7
4.9
3.5
2.6
1.7
1.1
1.0
1.1
1.0
0.8
1.2
2.3
(208
7)
74.8
19.6 9.1
7.6
7.0
6.8
4.7
2.9
1.8
1.1
1.2
0.8
1.0
1.1
2.0
2.8
(214
1)
76.5
28.0 9.1
5.6
5.9
4.4
2.8
3.2
1.4
1.8
0.9
1.1
0.7
0.4
0.9
2.6
(223
8)
79.4
22.3 8.4
6.0
7.1
5.2
4.6
2.9
1.7
2.0
0.8
0.7
1.0
0.9
1.1
3.2
(114
1)
73.8
22.5 9.1
6.7
5.7
5.2
2.5
2.9
1.4
0.8
0.5
1.1
0.4
0.7
1.9
1.9
(768
)
68.5
30.9
10.5 7.8
6.0
6.9
3.5
3.6
1.3
1.0
2.6
1.0
1.2
0.3
1.4
2.5
(80)
66.7
21.3
13.8 8.8
3.8
8.8
1.2
1.3
2.5
0.0
0.0
2.5
1.3
1.3
3.7
3.7
Col
orec
tal c
ance
r scr
een�
ng b
ehav
�our
K4.
H
ave
you
ever
had
a fa
ecal
occ
ult b
lood
test
(F
OB
T)?
Ye
s
No
D
on’t
know
(777
8) 8.6
91.0 0.4
(384
4)
8.7
90.7 0.5
(393
4)
8.6
91.2 0.2
(433
1)
3.4
96.2 0.3
(344
5)
15.2
84.4 0.4
(412
8)
7.9
91.7 0.4
(204
5)
9.0
90.6 0.4
(142
9)
10.8
88.8 0.4
(171
)
5.3
94.7 0.0
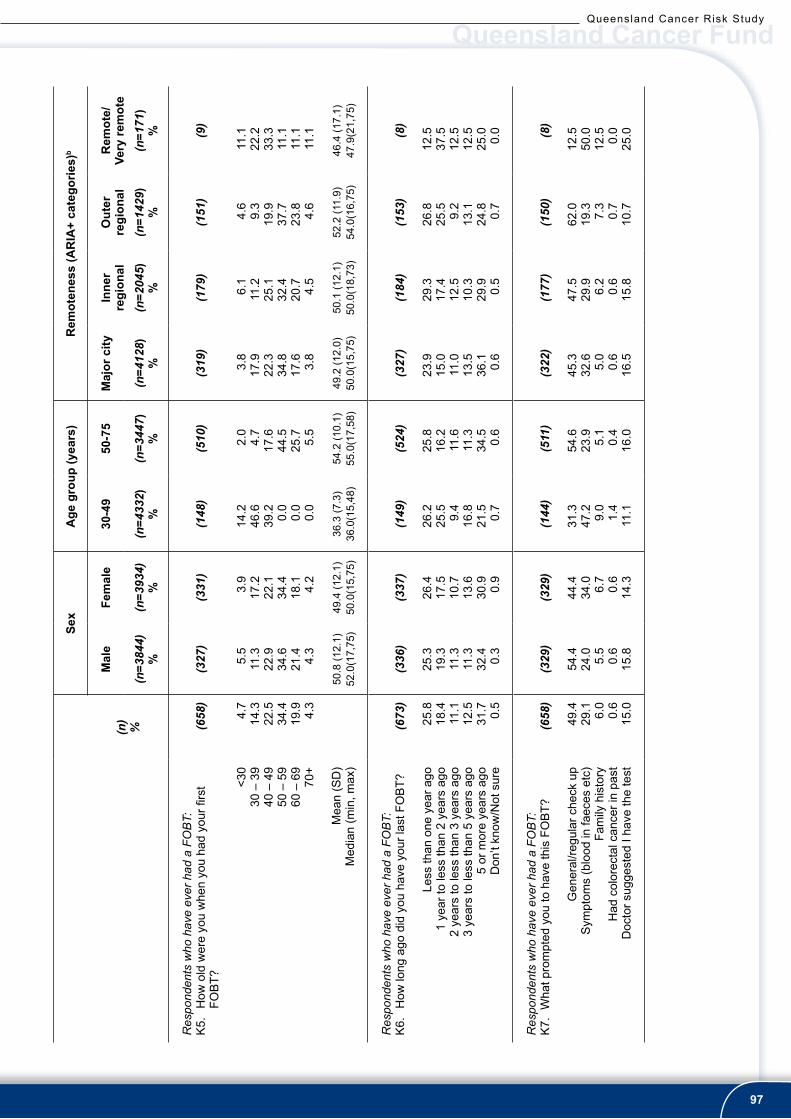
Queensland Cancer Risk Study
Queensland Cancer Fund
97
Queensland Cancer Risk Study
Sex
Age
gro
up (y
ears
)r
emot
enes
s (A
riA
+ ca
tego
r�es)
b
(n)
%
mal
eFe
mal
e30
-49
50-7
5m
ajor
c�ty
inne
r re
g�on
alO
uter
re
g�on
alr
emot
e/ve
ry re
mot
e(n
=384
4)%
(n=3
934)
%(n
=433
2)%
(n=3
447)
%(n
=412
8)%
(n=2
045)
%(n
=142
9)%
(n=1
71)
%
Res
pond
ents
who
hav
e ev
er h
ad a
FO
BT:
K5.
H
ow o
ld w
ere
you
whe
n yo
u ha
d yo
ur fi
rst
FOB
T?
<3
0
30 –
39
40
– 4
9
50 –
59
60
– 6
9
70+
M
ean
(SD
)
Med
ian
(min
, max
)
(658
)
4.7
14.3
22.5
34.4
19.9 4.3
(327
)
5.5
11.3
22.9
34.6
21.4 4.3
50.8
(12.
1)52
.0(1
7,75
)
(331
)
3.9
17.2
22.1
34.4
18.1 4.2
49.4
(12.
1)50
.0(1
5,75
)
(148
)
14.2
46.6
39.2 0.0
0.0
0.0
36.3
(7.3
)36
.0(1
5,48
)
(510
)
2.0
4.7
17.6
44.5
25.7 5.5
54.2
(10.
1)55
.0(1
7,58
)
(319
)
3.8
17.9
22.3
34.8
17.6 3.8
49.2
(12.
0)50
.0(1
5,75
)
(179
)
6.1
11.2
25.1
32.4
20.7 4.5
50.1
(12.
1)50
.0(1
8,73
)
(151
)
4.6
9.3
19.9
37.7
23.8 4.6
52.2
(11.
9)54
.0(1
6,75
)
(9)
11.1
22.2
33.3
11.1
11.1
11.1
46.4
(17.
1)47
.9(2
1,75
)
Res
pond
ents
who
hav
e ev
er h
ad a
FO
BT:
K6.
H
ow lo
ng a
go d
id y
ou h
ave
your
last
FO
BT?
Le
ss th
an o
ne y
ear a
go
1 ye
ar to
less
than
2 y
ears
ago
2
year
s to
less
than
3 y
ears
ago
3
year
s to
less
than
5 y
ears
ago
5
or m
ore
year
s ag
o
Don
’t kn
ow/N
ot s
ure
(673
)
25.8
18.4
11.1
12.5
31.7 0.5
(336
)
25.3
19.3
11.3
11.3
32.4 0.3
(337
)
26.4
17.5
10.7
13.6
30.9 0.9
(149
)
26.2
25.5 9.4
16.8
21.5 0.7
(524
)
25.8
16.2
11.6
11.3
34.5 0.6
(327
)
23.9
15.0
11.0
13.5
36.1 0.6
(184
)
29.3
17.4
12.5
10.3
29.9 0.5
(153
)
26.8
25.5 9.2
13.1
24.8 0.7
(8)
12.5
37.5
12.5
12.5
25.0 0.0
Res
pond
ents
who
hav
e ev
er h
ad a
FO
BT:
K7.
Wha
t pro
mpt
ed y
ou to
hav
e th
is F
OB
T?
G
ener
al/re
gula
r che
ck u
p
Sym
ptom
s (b
lood
in fa
eces
etc
)
Fam
ily h
isto
ry
Had
col
orec
tal c
ance
r in
past
D
octo
r sug
gest
ed I
have
the
test
(658
)
49.4
29.1 6.0
0.6
15.0
(329
)
54.4
24.0 5.5
0.6
15.8
(329
)
44.4
34.0 6.7
0.6
14.3
(144
)
31.3
47.2 9.0
1.4
11.1
(511
)
54.6
23.9 5.1
0.4
16.0
(322
)
45.3
32.6 5.0
0.6
16.5
(177
)
47.5
29.9 6.2
0.6
15.8
(150
)
62.0
19.3 7.3
0.7
10.7
(8)
12.5
50.0
12.5 0.0
25.0

Queensland Cancer Fund
V i e r t e l C e n t r e f o r R e s e a r c h i n C a n c e r C o n t r o l
Queensland Cancer Risk Study
98
Sex
Age
gro
up (y
ears
)r
emot
enes
s (A
riA
+ ca
tego
r�es)
b
(n)
%
mal
eFe
mal
e30
-49
50-7
5m
ajor
c�ty
inne
r re
g�on
alO
uter
re
g�on
alr
emot
e/ve
ry re
mot
e(n
=384
4)%
(n=3
934)
%(n
=433
2)%
(n=3
447)
%(n
=412
8)%
(n=2
045)
%(n
=142
9)%
(n=1
71)
%
Res
pond
ents
who
hav
e ev
er h
ad a
FO
BT:
K8.
D
o yo
u ha
ve re
gula
r FO
BTs
?
Ye
s
Onl
y ha
d on
e
No
or n
ot re
gula
rly
(673
)
15.6
59.7
24.7
(336
)
14.9
58.3
26.8
(337
)
16.3
61.1
22.6
(148
)
10.1
72.3
17.6
(524
)
17.0
56.3
26.7
(326
)
15.0
58.6
26.4
(184
)
14.1
59.8
26.1
(154
)
18.8
61.0
20.1
(9)
0.0
77.8
22.2
Res
pond
ents
who
hav
e re
gula
r FO
BTs
:K
9.
Wha
t is
the
usu
al t
ime
perio
d be
twee
n yo
ur
FOB
Ts?
Le
ss th
an a
yea
r
12 m
onth
s
Up
to 2
yea
rs
Up
to 3
yea
rs
Mor
e th
an 3
yea
rs
Don
’t kn
ow/C
an’t
say
(105
)
6.3
59.8
28.9 1.1
1.6
2.3
(49) 8.2
59.2
26.5 2.0
4.1
0.0
(54) 3.7
61.1
31.5 0.0
0.0
3.7
(16) 0.0
50.0
50.0 0.0
0.0
0.0
(90) 7.8
61.1
25.6 1.1
2.2
2.2
(49)
10.2
65.3
18.4 2.0
0.0
4.0
(26) 0.0
73.1
26.9 0.0
0.0
0.0
(28) 3.6
42.9
50.0 0.0
3.6
0.0
(0)
0.0
0.0
0.0
0.0
0.0
0.0
K10
. Hav
e yo
u ev
er h
ad a
col
onos
copy
?
Ye
s
No
D
on’t
know
/Not
sur
e
(777
8)
24.7
75.0 0.3
(384
4)
23.0
76.5 0.5
(393
4)
26.4
73.5 0.2
(433
2)
14.4
85.4 0.2
(344
6)
37.8
61.8 0.4
(412
7)
26.2
73.5 0.4
(204
5)
24.4
75.3 0.2
(142
9)
21.8
77.9 0.3
(170
)
18.8
81.2 0.0

Queensland Cancer Risk Study
Queensland Cancer Fund
99
Queensland Cancer Risk Study
Sex
Age
gro
up (y
ears
)r
emot
enes
s (A
riA
+ ca
tego
r�es)
b
(n)
%
mal
eFe
mal
e30
-49
50-7
5m
ajor
c�ty
inne
r re
g�on
alO
uter
re
g�on
alr
emot
e/ve
ry re
mot
e(n
=384
4)%
(n=3
934)
%(n
=433
2)%
(n=3
447)
%(n
=412
8)%
(n=2
045)
%(n
=142
9)%
(n=1
71)
%
Res
pond
ents
who
hav
e ev
er h
ad a
col
onos
copy
:K
11. H
ow lo
ng h
as it
bee
n si
nce
your
last
co
lono
scop
y?
Le
ss th
an o
nce
year
ago
1
year
to le
ss th
an 2
yea
rs a
go
2 ye
ars
to le
ss th
an 3
yea
rs a
go
3 ye
ars
to le
ss th
an 5
yea
rs a
go
5 or
mor
e ye
ars
ago
D
on’t
know
/Not
sur
e
(192
4)
18.6
17.1
14.6
17.9
31.6 0.2
(887
)
20.2
16.7
13.9
18.4
30.6 0.3
(103
8)
17.2
17.4
15.2
17.5
32.4 0.2
(622
)
16.1
14.8
14.5
17.7
36.5 0.5
(130
2)
19.7
18.2
14.7
18.0
29.3 0.1
(108
1)
18.5
16.7
15.0
18.2
31.3 0.3
(499
)
18.2
17.6
15.0
18.2
30.7 0.2
(312
)
19.9
17.9
13.1
16.7
32.1 0.3
(32)
12.5
12.5 9.4
15.6
50.0 0.0
a C
olum
n pe
rcen
tage
s ar
e st
anda
rdis
ed to
the
2003
Que
ensl
and
popu
latio
n by
age
, sex
and
geo
grap
hic
loca
tion.
b A
cces
sibi
lity/
Rem
oten
ess
Inde
x of
Aus
tralia
c D
oes
not a
dd u
p to
100
% a
s qu
estio
n al
low
s fo
r mul
tiple
resp
onse
s.

Queensland Cancer Fund
V i e r t e l C e n t r e f o r R e s e a r c h i n C a n c e r C o n t r o l
Queensland Cancer Risk Study
100
App
endi
x L.
Des
crip
tive
stat
istic
s for
Cha
pter
10:
PR
OST
ATE
SCR
EEN
ING
a (n=
2700
) (m
en a
ged
>40
year
s onl
y)
Age
gro
up (y
ears
)r
emot
enes
s (A
riA
+ ca
tego
r�es)
b
(n)
%
40-4
950
-69
70-7
5m
ajor
c�ty
inne
r re
g�on
alO
uter
re
g�on
alr
emot
e/ve
ry re
mot
e(n
=998
)%
(n=1
471)
%(n
=231
)%
(n=1
387)
%(n
=752
)%
(n=5
02)
%(n
=58)
%
kno
wle
dge
abou
t pro
stat
e ca
ncer
scr
een�
ng
L1.
Do
you
know
of a
ny te
sts/
chec
ks th
at y
our d
octo
r cou
ld
do to
see
if y
ou h
ad p
rost
ate
canc
er?
Yes
No
(269
8)
69.4
30.6
(996
)
59.7
40.3
(147
0)
75.0
25.0
(231
)
75.8
24.2
(138
6)
74.1
28.6
(752
)
67.6
32.4
(502
)
68.5
31.5
(59)
54.2
45.8
Res
pond
ents
who
kno
w o
f tes
ts/c
heck
s fo
r pro
stat
e ca
ncer
:L2
. W
hat a
re th
ese
test
s/ch
ecks
c
D
igita
l rec
tal e
xam
inat
ion
Pro
stat
e-sp
ecifi
c an
tigen
test
/blo
od te
stIm
agin
g te
sts
(ultr
asou
nd, M
RI,
X-r
ay, C
T sc
an)
Tran
srec
tal u
ltras
ound
B
iops
yC
olon
osco
pyU
rine
test
P
hysi
cal e
xam
inat
ion
Cys
tosc
opy/
Ure
thro
scop
yFa
ecal
occ
ult b
lood
test
(FO
BT)
or s
tool
test
Kno
w th
ere
are
test
s bu
t not
sur
e w
hat t
hey
are
Oth
er
(187
3)
69.2
61.0 4.1
3.9
3.1
2.7
2.2
1.5
0.8
0.3
2.9
3.1
(575
)
75.2
47.7 3.2
4.0
2.4
3.9
3.9
1.0
0.2
0.2
4.4
4.2
(110
2)
68.1
66.9 4.6
3.6
2.9
2.3
1.4
1.9
0.9
0.4
2.2
2.5
(175
)
56.3
68.2 4.0
5.1
6.3
1.7
1.7
1.1
2.3
0.6
2.3
3.4
(990
)
73.4
61.5 3.7
3.6
3.0
2.6
2.6
2.0
0.5
0.4
1.6
3.3
(508
)
64.7
61.7 4.2
4.9
3.0
2.6
0.6
0.6
1.0
0.0
4.7
2.6
(344
)
65.1
60.1 4.9
3.2
3.5
2.9
3.2
1.5
0.9
0.6
3.8
2.9
(32)
56.3
43.8 6.5
3.1
0.0
3.1
3.2
3.1
3.2
0.0
3.1
6.3
pros
tate
can
cer s
cree
n�ng
beh
av�o
urL3
. H
ave
you
ever
had
a p
rost
ate-
spec
ific
antig
en (P
SA
) te
st?
Yes
No
Don
’t kn
ow
(269
8)
39.4
52.3 8.4
(996
)
17.0
76.5 6.5
(147
1)
50.6
40.2 9.2
(231
)
64.5
24.2
11.3
(138
5)
39.1
53.6 7.2
(751
)
41.8
47.8
10.4
(502
)
37.3
54.8 8.0
(58)
31.0
56.9
12.1

Queensland Cancer Risk Study
Queensland Cancer Fund
101
Queensland Cancer Risk Study
Age
gro
up (y
ears
)r
emot
enes
s (A
riA
+ ca
tego
r�es)
b
(n)
%
40-4
950
-69
70-7
5m
ajor
c�ty
inne
r re
g�on
alO
uter
re
g�on
alr
emot
e/ve
ry re
mot
e(n
=998
)%
(n=1
471)
%(n
=231
)%
(n=1
387)
%(n
=752
)%
(n=5
02)
%(n
=58)
%
Res
pond
ents
who
hav
e ev
er h
ad a
PS
A:
L4.
How
old
wer
e yo
u w
hen
you
had
your
firs
t PS
A te
st?
<3
0
30 –
39
40
– 4
9
50 –
59
60
– 6
9
70+
M
ean
(SD
)
Med
ian
(min
, max
)
(104
8) 0.6
3.7
23.6
45.1
24.0 3.0
(169
)
1.8
16.6
81.7 0.0
0.0
0.0
42.5
(4.3
)43
.0(2
6,49
)
(734
)
0.5
1.5
14.4
62.3
21.3 0.0
53.7
(6.5
)54
.0(2
1,69
)
(145
)
0.0
0.0
3.4
9.7
65.5
21.4
64.7
(6.2
)65
.0(4
3,75
)
(534
) 0.2
3.2
24.7
46.8
22.7 2.4
53.1
(8.3
)53
.0(2
2,75
)
(311
) 1.0
4.2
19.6
46.9
24.4 3.9
54.1
(8.8
)54
.0(2
6,75
)
(184
) 0.0
4.3
27.7
37.5
27.2 3.3
53.7
(9.0
)53
.0(2
7,73
)
(18) 5.6
5.6
22.2
38.9
27.8 0.0
50.8
(11.
2)51
.7(2
1,69
)
Res
pond
ents
who
hav
e ev
er h
ad a
PS
A:
L5.
How
long
ago
did
you
hav
e yo
ur la
st P
SA
test
?
Le
ss th
an o
ne y
ear a
go
1 ye
ar to
less
than
2 y
ears
ago
2
year
s to
less
than
3 y
ears
ago
3
year
s to
less
than
5 y
ears
ago
5
or m
ore
year
s ag
o
Don
’t kn
ow/n
ot s
ure
(106
2)
57.7
18.2 9.8
6.9
6.5
0.9
(170
)
48.8
20.0
14.7 8.2
7.6
0.6
(744
)
58.1
18.5 9.1
7.1
6.2
0.9
(149
)
65.8
14.8 7.4
4.7
6.7
0.7
(542
)
57.0
18.3
11.8 6.5
5.5
0.9
(314
)
58.0
19.1 8.3
5.4
8.3
1.0
(187
)
59.9
15.0 7.5
10.2 7.0
0.5
(18)
50.0
33.3 0.0
11.1 5.6
0.0

Queensland Cancer Fund
V i e r t e l C e n t r e f o r R e s e a r c h i n C a n c e r C o n t r o l
Queensland Cancer Risk Study
102
Age
gro
up (y
ears
)r
emot
enes
s (A
riA
+ ca
tego
r�es)
b
(n)
%
40-4
950
-69
70-7
5m
ajor
c�ty
inne
r re
g�on
alO
uter
re
g�on
alr
emot
e/ve
ry re
mot
e(n
=998
)%
(n=1
471)
%(n
=231
)%
(n=1
387)
%(n
=752
)%
(n=5
02)
%(n
=58)
%
Res
pond
ents
who
hav
e ev
er h
ad a
PS
A:
L6.
Wha
t pro
mpt
ed y
ou to
hav
e th
is P
SA
test
?
G
ener
al/re
gula
r che
ck u
p
Sym
ptom
s (d
ifficu
lty s
tarti
ng u
rine
flow
etc
)
Fam
ily h
isto
ry
Had
pro
stat
e ca
ncer
in th
e pa
st
Doc
tor s
ugge
sted
I ha
ve th
is te
st
(105
2)
66.3
13.6 4.1
2.9
13.1
(169
)
64.5
16.6 8.3
0.0
10.7
(735
)
68.3
12.4 3.7
2.7
12.9
(148
)
58.1
16.2 1.4
7.4
16.9
(535
)
69.7
12.9 2.4
2.4
12.5
(312
)
59.9
15.7 4.5
4.2
15.7
(186
)
67.2
12.4 8.6
2.2
9.7
(18)
61.1
16.7 0.0
0.0
22.2
Res
pond
ents
who
hav
e ev
er h
ad a
PS
A:
L7.
Do
you
have
regu
lar P
SA
test
s?
Ye
s
Onl
y ha
d on
e
No
or n
ot re
gula
rly
(106
2)
50.3
30.9
18.8
(169
)
33.7
49.1
17.2
(744
)
52.0
30.0
18.0
(149
)
61.1
14.1
24.8
(542
)
51.5
30.8
17.7
(314
)
48.7
32.2
19.1
(187
)
49.2
29.4
21.4
(18)
55.6
22.2
22.2

Queensland Cancer Risk Study
Queensland Cancer Fund
103
Queensland Cancer Risk Study
Age
gro
up (y
ears
)r
emot
enes
s (A
riA
+ ca
tego
r�es)
b
(n)
%
40-4
950
-69
70-7
5m
ajor
c�ty
inne
r re
g�on
alO
uter
re
g�on
alr
emot
e/ve
ry re
mot
e(n
=998
)%
(n=1
471)
%(n
=231
)%
(n=1
387)
%(n
=752
)%
(n=5
02)
%(n
=58)
%
Res
pond
ents
who
hav
e re
gula
r PS
A te
sts:
L8.
Wha
t is
the
usua
l tim
e pe
riod
betw
een
your
PS
A te
sts?
Le
ss th
an a
yea
r
12 m
onth
s
Up
to 2
yea
rs
Up
to 3
yea
rs
Mor
e th
an 3
yea
rs
Don
’t kn
ow/C
an’t
say
(534
)
24.7
53.3
17.8 3.0
0.5
0.7
(57) 1.8
61.4
22.8 8.8
1.8
3.5
(386
)
25.1
53.1
18.9 2.3
0.5
0.0
(90)
37.8
48.9
10.0 2.2
0.0
1.1
(280
)
25.4
53.6
16.8 3.2
0.4
0.7
(153
)
20.9
54.2
20.3 3.3
0.7
0.7
(91) 26
.456
.015
.4 2.2
0.0
0.0
(10)
50.0
10.0
40.0 0.0
0.0
0.0
L9.
Hav
e yo
u ev
er h
ad a
dig
ital r
ecta
l exa
m (D
RE
)?
Ye
s
No
D
on’t
know
(269
8)
48.7
50.8 0.5
(996
)
29.6
70.1 0.3
(147
0)
57.4
42.1 0.5
(231
)
76.2
22.9 0.9
(138
5)
50.8
48.8 0.4
(751
)
48.7
50.7 0.5
(502
)
44.2
55.4 0.4
(59)
39.0
59.3 1.7
Res
pond
ents
who
hav
e ev
er h
ad a
DR
E:
L10.
How
old
wer
e yo
u w
hen
you
had
your
firs
t DR
E?
<3
0
30 –
39
40
– 4
9
50 –
59
60
– 6
9
70+
M
ean
(SD
)
Med
ian
(min
, max
)
(128
8) 7.7
12.3
25.6
34.3
18.1 2.0
(288
)
19.1
39.6
41.3 0.0
0.0
0.0
35.7
(8.4
)38
.0(1
0,49
)
(831
)
4.6
5.1
24.4
49.8
16.1 0.0
50.2
(9.6
)50
.0(1
4,69
)
(169
)
3.6
1.8
5.3
16.0
58.6
14.8
60.1
(11.
5)65
.0(1
5,74
)
(688
) 8.4
11.8
25.3
35.6
17.2 1.7
48.0
(12.
3)50
.0(1
0,74
)
(363
) 6.6
12.4
22.9
35.5
19.8 2.8
49.4
(12.
3)50
.0(1
5,74
)
(217
) 6.0
14.3
31.8
28.1
18.0 1.8
47.9
(12.
1)48
.0(1
4,73
)
(22)
18.2 9.1
22.7
31.8
18.2 0.0
45.9
(14.
1)48
.4(1
7,69
)

Queensland Cancer Fund
V i e r t e l C e n t r e f o r R e s e a r c h i n C a n c e r C o n t r o l
Queensland Cancer Risk Study
104
Age
gro
up (y
ears
)r
emot
enes
s (A
riA
+ ca
tego
r�es)
b
(n)
%
40-4
950
-69
70-7
5m
ajor
c�ty
inne
r re
g�on
alO
uter
re
g�on
alr
emot
e/ve
ry re
mot
e(n
=998
)%
(n=1
471)
%(n
=231
)%
(n=1
387)
%(n
=752
)%
(n=5
02)
%(n
=58)
%
Res
pond
ents
who
hav
e ev
er h
ad a
DR
E:
L11.
H
ow lo
ng a
go d
id y
ou h
ave
your
last
DR
E?
Le
ss th
an o
ne y
ear a
go
1 ye
ar to
less
than
2 y
ears
ago
2
year
s to
less
than
3 y
ears
ago
3
year
s to
less
than
5 y
ears
ago
5
or m
ore
year
s ag
o
Don
’t kn
ow/N
ot s
ure
(131
5)
23.1
15.9
11.1
13.2
36.1 0.5
(295
)
14.2 7.5
10.8
16.9
50.5 0.0
(843
)
25.0
19.3
11.4
12.1
31.6 0.6
(176
)
29.0
13.6
10.2
11.9
34.7 0.6
(704
)
24.4
16.6
11.1
13.4
33.8 0.7
(365
)
21.6
15.3
12.1
12.1
38.9 0.0
(221
)
21.3
14.5
10.0
14.5
39.8 0.0
(24)
20.8
16.7
12.5
12.5
33.3 4.2
a C
olum
n pe
rcen
tage
s ar
e st
anda
rdis
ed to
the
2003
Que
ensl
and
popu
latio
n by
age
, sex
and
geo
grap
hic
loca
tion.
b A
cces
sibi
lity/
Rem
oten
ess
Inde
x of
Aus
tralia
c D
oes
not a
dd u
p to
100
% a
s qu
estio
n al
low
s fo
r mul
tiple
resp
onse
s.

Queensland Cancer Risk Study
Queensland Cancer Fund
105
Queensland Cancer Risk Study
App
endi
x M
. Des
crip
tive
stat
istic
s for
Cha
pter
10:
SK
IN S
CR
EEN
ING
a (n=
9419
)
Sex
Age
gro
up (y
ears
)r
emot
enes
s (A
riA
+ ca
tego
r�es)
b
(n)
%
mal
eFe
mal
e20
-39
40-5
960
-75
maj
or c
�tyin
ner
reg�
onal
Out
er
reg�
onal
rem
ote/
very
rem
ote
(n=4
698)
%(n
=472
1)%
(n=4
016)
%(n
=381
4)%
(n=1
589)
%(n
=512
6)%
(n=2
372)
%(n
=170
3)%
(n=2
09)
%
Bel
�efs
abo
ut s
k�n
canc
er s
cree
n�ng
M1.
Do
you
agre
e or
dis
agre
e w
ith th
e st
atem
ent,
it is
impo
rtant
to c
heck
fo
r ski
n ca
ncer
eve
n if
I hav
e no
sy
mpt
oms?
S
trong
ly a
gree
Agr
eeN
eith
er a
gree
nor
dis
agre
eD
isag
ree
Stro
ngly
dis
agre
eU
nsur
e/D
on’t
know
/No
resp
onse
(941
8)
72.1
23.5 0.8
2.5
0.2
0.9
(469
7)
69.5
25.7 0.9
2.6
0.3
1.0
(472
1)
74.7
21.4 0.7
2.3
0.0
0.8
(401
6)
72.4
24.0 0.6
2.1
0.2
0.6
(381
3)
73.2
22.1 0.9
2.6
0.2
1.0
(158
9)
68.8
25.9 1.1
3.0
0.1
1.3
(512
3)
71.8
23.5 1.0
2.7
0.2
0.9
(237
2)
72.1
24.1 0.7
2.0
0.1
0.9
(170
3)
72.9
23.2 0.3
2.6
0.1
0.9
(210
)
76.2
19.5 2.4
1.4
0.5
0.0
Sk�n
can
cer s
cree
n�ng
beh
av�o
ur
M2.
Hav
e yo
u ev
er h
ad a
full
body
(or
near
ly fu
ll bo
dy) s
kin
chec
k?
Yes
No
Don
’t kn
ow/N
ot s
ure
(941
8)
40.4
59.5 0.1
(469
8)
40.6
59.3 0.1
(472
2)
40.3
59.7 0.0
(401
6)
34.9
65.0 0.0
(381
3)
44.5
55.4 0.1
(158
8)
44.5
55.2 0.3
(512
6)
42.4
57.5 0.1
(237
1)
41.0
59.0 0.0
(170
3)
34.0
65.9 0.1
(210
)
40.5
59.0 0.5

Queensland Cancer Fund
V i e r t e l C e n t r e f o r R e s e a r c h i n C a n c e r C o n t r o l
Queensland Cancer Risk Study
106
Sex
Age
gro
up (y
ears
)r
emot
enes
s (A
riA
+ ca
tego
r�es)
b
(n)
%
mal
eFe
mal
e20
-39
40-5
960
-75
maj
or c
�tyin
ner
reg�
onal
Out
er
reg�
onal
rem
ote/
very
rem
ote
(n=4
698)
%(n
=472
1)%
(n=4
016)
%(n
=381
4)%
(n=1
589)
%(n
=512
6)%
(n=2
372)
%(n
=170
3)%
(n=2
09)
%
In th
e fo
llow
ing,
“ski
n ch
eck”
refe
rs to
a
doct
or d
elib
erat
ely
chec
king
the
skin
on
all o
r nea
rly a
ll of
you
r who
le b
ody
for
early
sig
ns o
f ski
n ca
ncer
. Res
pond
ents
w
ho h
ave
ever
had
a s
kin
chec
k:M
3. H
ow o
ld w
ere
you
whe
n yo
u ha
d yo
ur fi
rst s
kin
chec
k?
<18
18 -
<25
25 -
<35
35 -
<45
45 -
<55
55 -
<65
65+
Mea
n (S
D)
Med
ian
(min
, max
)
(375
8) 6.1
12.2
22.9
21.3
19.1
13.4 5.0
(188
7) 7.3
12.3
21.8
21.8
18.3
13.5 5.0
38.6
(14.
9)38
.0(3
,75)
(187
2) 5.0
12.1
24.0
20.7
19.9
13.4 4.9
39.2
(14.
7)38
.0(1
,74)
(138
8)
15.1
29.8
45.0
10.2 0.0
0.0
0.0
25.0
(6.9
)25
.0(2
,39)
(167
7) 1.0
2.5
13.3
37.4
36.4 9.4
0.0
42.3
(9.2
)43
.0(1
,59)
(692
)
0.6
0.3
1.7
4.5
15.6
50.3
27.0
58.3
(9.8
)60
.0(1
,75)
(215
3)
6.3
12.6
22.6
22.3
18.7
12.7 4.7
38.6
(14.
7)38
.0(2
,74)
(953
)
5.4
9.9
21.0
19.7
21.4
16.6 6.1
40.7
(15.
0)40
.0(1
,75)
(569
)
6.3
13.5
26.7
20.6
17.2
11.2 4.4
37.4
(14.
7)35
.0(1
,75)
(86) 8.
118
.624
.415
.119
.810
.5 3.5
35.6
(15.
4)32
.0(1
1,70
)
In th
e fo
llow
ing,
“ski
n ch
eck”
refe
rs to
a
doct
or d
elib
erat
ely
chec
king
the
skin
on
all o
r nea
rly a
ll of
you
r who
le b
ody
for
early
sig
ns o
f ski
n ca
ncer
. Res
pond
ents
w
ho h
ave
ever
had
a s
kin
chec
k:M
4. H
ow lo
ng h
as it
bee
n si
nce
your
last
sk
in c
heck
?
Less
than
one
yea
r ago
1 ye
ar to
less
than
2 y
ears
ago
2 ye
ars
to le
ss th
an 5
yea
rs a
go5
or m
ore
year
s ag
oD
on’t
know
(380
8)
48.9
21.3
16.2
13.3 0.3
(190
8)
50.1
19.5
16.2
14.0 0.2
(190
1)
47.7
23.1
16.2
12.6 0.4
(140
3)
42.7
22.5
19.7
15.0 0.1
(169
8)
49.8
21.7
15.0
13.1 0.4
(706
)
59.1
17.8
12.3
10.3 0.4
(217
2)
50.6
21.5
15.1
12.4 0.3
(971
)
50.6
21.6
15.4
12.2 0.2
(579
)
40.4
19.7
22.3
17.3 0.3
(84) 46.4
21.4
10.7
21.4 0.0

Queensland Cancer Risk Study
Queensland Cancer Fund
107
Queensland Cancer Risk Study
Sex
Age
gro
up (y
ears
)r
emot
enes
s (A
riA
+ ca
tego
r�es)
b
(n)
%
mal
eFe
mal
e20
-39
40-5
960
-75
maj
or c
�tyin
ner
reg�
onal
Out
er
reg�
onal
rem
ote/
very
rem
ote
(n=4
698)
%(n
=472
1)%
(n=4
016)
%(n
=381
4)%
(n=1
589)
%(n
=512
6)%
(n=2
372)
%(n
=170
3)%
(n=2
09)
%
In th
e fo
llow
ing,
“ski
n ch
eck”
refe
rs to
a
doct
or d
elib
erat
ely
chec
king
the
skin
on
all o
r nea
rly a
ll of
you
r who
le b
ody
for
early
sig
ns o
f ski
n ca
ncer
. Res
pond
ents
w
ho h
ave
ever
had
a s
kin
chec
k:M
5. W
hat p
rom
pted
you
to h
ave
this
ski
n ch
eck?
Gen
eral
/regu
lar c
heck
up
Sym
ptom
s (c
hang
e in
mol
e, e
tc)
Fam
ily h
isto
ryH
ad s
kin
canc
er in
the
past
(373
5)
56.4
30.3 4.7
8.6
(187
3)
55.6
30.6 3.6
10.1
(186
2)
57.1
29.9 5.8
7.1
(137
5)
58.8
29.3 6.9
5.0
(166
2)
54.0
32.3 4.3
9.4
(698
)
57.3
27.5 1.4
13.8
(214
6)
58.0
29.3 4.6
8.1
(938
)
52.8
32.1 5.5
9.6
(570
)
58.2
30.2 3.5
8.1
(82) 42.7
35.4 7.3
14.6
In th
e fo
llow
ing,
“ski
n ch
eck”
refe
rs to
a
doct
or d
elib
erat
ely
chec
king
the
skin
on
all o
r nea
rly a
ll of
you
r who
le b
ody
for
early
sig
ns o
f ski
n ca
ncer
. Res
pond
ents
w
ho h
ave
ever
had
a s
kin
chec
k:M
6. W
here
did
you
hav
e th
is s
kin
chec
k?
At y
our G
P’s
sur
gery
At a
spe
cial
ski
n cl
inic
At a
der
mat
olog
ist
At a
hos
pita
l out
patie
nts
Oth
er
(380
8)
44.9
37.4
12.0 1.6
4.0
(190
7)
48.7
33.6
10.9 1.6
5.1
(190
1)
41.1
41.3
13.2 1.6
2.8
(140
4)
53.2
32.2 9.3
1.6
3.7
(169
7)
43.0
38.5
12.9 1.2
4.3
(707
)
32.8
45.4
15.3 2.7
3.8
(217
3)
39.0
41.6
15.6 1.1
2.8
(972
)
45.7
41.0 8.2
1.5
3.5
(580
)
63.8
19.3 5.9
2.9
8.1
(86) 58.1
11.6 8.1
9.3
12.8
In t
he f
ollo
win
g, “
skin
che
ck”
refe
rs t
o a
doct
or d
elib
erat
ely
chec
king
the
skin
on
all
or n
early
all
of y
our
who
le b
ody
for
early
si
gns
of s
kin
canc
er.
Res
pond
ents
who
ha
ve e
ver h
ad a
ski
n ch
eck:
M7.
Do
you
have
regu
lar s
kin
chec
ks? Ye
sO
nly
had
one
No
or n
ot re
gula
rly
(380
3)
45.6
36.4
18.1
(190
6)
44.0
35.5
20.5
(189
7)
47.1
37.3
15.6
(140
1)
39.9
40.6
19.5
(169
5)
46.7
35.9
17.4
(707
)
54.0
29.1
16.8
(216
8)
49.2
34.2
16.6
(971
)
44.2
36.3
19.6
(579
)
34.2
44.6
21.2
(85) 45.9
36.5
17.6

Queensland Cancer Fund
V i e r t e l C e n t r e f o r R e s e a r c h i n C a n c e r C o n t r o l
Queensland Cancer Risk Study
108
Sex
Age
gro
up (y
ears
)r
emot
enes
s (A
riA
+ ca
tego
r�es)
b
(n)
%
mal
eFe
mal
e20
-39
40-5
960
-75
maj
or c
�tyin
ner
reg�
onal
Out
er
reg�
onal
rem
ote/
very
rem
ote
(n=4
698)
%(n
=472
1)%
(n=4
016)
%(n
=381
4)%
(n=1
589)
%(n
=512
6)%
(n=2
372)
%(n
=170
3)%
(n=2
09)
%
In th
e fo
llow
ing,
“ski
n ch
eck”
refe
rs to
a
doct
or d
elib
erat
ely
chec
king
the
skin
on
all o
r nea
rly a
ll of
you
r who
le b
ody
for
early
sig
ns o
f ski
n ca
ncer
. Res
pond
ents
w
ho h
ave
ever
had
a s
kin
chec
k:M
8.
Wha
t is
the
usua
l tim
e pe
riod
betw
een
your
ski
n ch
ecks
?
Less
than
a y
ear
12 m
onth
sU
p to
2 y
ears
Up
to 3
yea
rsM
ore
than
3 y
ears
Don
’t kn
ow/C
an’t
say
(173
9)
24.1
52.8
19.2 2.0
1.0
0.9
(840
)
31.9
49.0
14.9 2.6
0.8
0.7
(897
)
16.8
56.3
23.3 1.4
1.0
1.1
(563
)
18.8
54.9
21.8 2.0
1.8
0.7
(795
)
23.6
53.1
19.5 1.9
0.8
1.1
(382
)
32.7
49.0
14.9 2.4
0.3
0.8
(107
2)
22.4
55.3
19.1 1.8
0.7
0.7
(429
)
28.2
49.4
18.2 2.1
1.2
0.9
(198
)
25.3
44.9
23.2 3.0
2.0
1.5
(40) 20.0
57.5
15.0 2.5
2.5
2.5
a C
olum
n pe
rcen
tage
s ar
e st
anda
rdis
ed to
the
2003
Que
ensl
and
popu
latio
n by
age
, sex
and
geo
grap
hic
loca
tion.
b A
cces
sibi
lity/
Rem
oten
ess
Inde
x of
Aus
tralia

Queensland Cancer Risk Study
Queensland Cancer Fund
109
Queensland Cancer Risk Study
App
endi
x N
. Des
crip
tive
stat
istic
s for
Cha
pter
11:
CA
NC
ER H
ISTO
RYa (
n=94
19)
Sex
Age
gro
up (y
ears
)r
emot
enes
s (A
riA
+ ca
tego
r�es)
b
(n)
%
mal
eFe
mal
e20
-39
40-5
960
-75
maj
or c
�tyin
ner
reg�
onal
Out
er
reg�
onal
rem
ote/
very
rem
ote
(n=4
698)
%(n
=472
1)%
(n=4
016)
%(n
=381
4)%
(n=1
589)
%(n
=512
6)%
(n=2
372)
%(n
=170
3)%
(n=2
09)
%
pers
onal
can
cer h
�sto
ry
N1.
Hav
e yo
u ev
er b
een
diag
nose
d w
ith
canc
er?
Yes
No
(941
7)
15.8
84.2
(469
5)
14.7
85.3
(472
1)
16.9
83.1
(401
6)
6.5
93.5
(381
3)
18.6
81.4
(158
9)
32.2
67.8
(512
4)
15.3
84.7
(237
1)
16.6
83.4
(170
3)
16.0
84.0
(209
)
17.7
84.2
N2.
Eve
r bee
n di
agno
sed
with
can
cer
(oth
er th
an n
on-m
elan
oma
skin
ca
ncer
?)Ye
sN
o
(941
7) 8.9
91.1
(469
5)
7.0
93.0
(472
1)
10.8
89.2
(401
6)
4.3
95.7
(381
2)
9.8
90.2
(158
8)
18.3
81.7
(512
3)
8.6
91.4
(237
1)
9.4
90.6
(170
3)
9.1
90.9
(209
)
8.1
91.9
Res
pond
ents
who
hav
e ev
er b
een
diag
nose
d w
ith c
ance
r:N
3. N
umbe
r of d
iffer
ent t
ypes
of c
ance
r
d
iagn
oses
One
Two
Thre
eFo
ur
(148
5)
86.7
11.8 1.2
0.4
(689
)
86.2
12.0 1.5
0.3
(797
)
87.1
11.5 1.5
0.4
(264
)
93.2 5.7
1.1
0.0
(710
)
87.5
11.4 0.8
0.3
(512
)
82.2
15.4 1.8
0.6
(782
)
87.2
11.5 0.9
0.4
(393
)
85.8
12.2 1.5
0.5
(272
)
86.0
13.0 0.7
0.4
(37)
91.9 2.7
5.4
0.0

Queensland Cancer Fund
V i e r t e l C e n t r e f o r R e s e a r c h i n C a n c e r C o n t r o l
Queensland Cancer Risk Study
110
Sex
Age
gro
up (y
ears
)r
emot
enes
s (A
riA
+ ca
tego
r�es)
b
(n)
%
mal
eFe
mal
e20
-39
40-5
960
-75
maj
or c
�tyin
ner
reg�
onal
Out
er
reg�
onal
rem
ote/
very
rem
ote
(n=4
698)
%(n
=472
1)%
(n=4
016)
%(n
=381
4)%
(n=1
589)
%(n
=512
6)%
(n=2
372)
%(n
=170
3)%
(n=2
09)
%
N4.
Typ
e of
can
cer d
iagn
osed
N
o ca
ncer
dia
gnos
isN
on-m
elan
oma
skin
can
cer n
ot s
unsp
ots
Mel
anom
aC
olor
ecta
l (co
lon/
rect
um/b
owel
)Ly
mph
oma
(incl
udin
g N
on-H
odgk
in’s
)B
ladd
er/K
idne
y Lu
ng (i
nclu
ding
trac
hea,
ple
ura
&
bron
chus
)S
tom
ach
Leuk
aem
iaO
ther
Pro
stat
eTe
stic
ular
Cer
vica
lB
reas
tO
varia
nU
terin
e or
end
omet
rial
(941
7)
84.2 8.0
3.4
0.6
0.3
0.2
0.1
0.1
0.1
0.3
0.5
0.1
1.5
1.2
0.3
0.2
(469
5)
85.3 8.8
3.9
0.8
0.3
0.3
0.1
0.1
0.1
0.2
1.1
0.2 - - - -
(472
1)
83.1 7.3
2.9
0.5
0.3
0.1
0.1
0.1
0.1
0.5 - - 3.1
2.4
0.5
0.3
(401
6)
93.5 2.3
1.8
0.0
0.1
0.0
0.0
0.0
0.0
0.3
0.0
0.1
1.7
0.3
0.2
0.0
(381
3)
81.4
10.1 4.1
0.6
0.3
0.1
0.1
0.1
0.0
0.3
0.2
0.1
1.7
1.6
0.3
0.1
(158
9)
67.8
17.4 6.1
2.2
0.5
1.1
0.4
0.1
0.4
0.7
2.7
0.1
0.8
2.8
0.3
0.6
(512
4)
84.7 7.5
3.5
0.6
0.3
0.2
0.1
0.0
0.1
0.4
0.4
0.1
1.4
1.3
0.4
0.2
(237
1)
83.4 8.8
3.6
0.7
0.3
0.3
0.0
0.1
0.0
0.2
0.9
0.0
1.5
1.3
0.1
0.1
(170
3)
84.0 8.3
3.1
0.6
0.3
0.2
0.3
0.2
0.1
0.4
0.6
0.1
1.8
0.9
0.1
0.2
(209
)
82.3 9.6
3.8
0.5
0.0
0.0
0.0
0.0
0.5
0.5
0.0
0.0
2.9
0.5
1.0
0.0
Res
pond
ents
who
hav
e ev
er b
een
diag
nose
d w
ith c
ance
r, ex
clud
ing
non-
mel
anom
a sk
in c
ance
rN
5. A
ge a
t firs
t can
cer d
iagn
osis M
ean
(SD
)M
edia
n (m
in, m
ax)
(807
)(3
20)
48.3
(15.
1)50
.0 (1
, 75)
(487
)
39.8
(14.
5)39
.0 (1
, 74)
(170
)
25.3
(6.6
)26
.0 (1
, 38)
(354
)
41.0
(9.8
)42
.0 (1
2, 5
9)
(283
)
56.7
(11.
9)59
.0 (1
, 75)
(433
)
42.3
(15.
3)42
.0 (1
, 75)
(208
)
46.6
(15.
3)48
.0 (6
, 74)
(148
)
41.6
(14.
8)41
.0 (9
, 75)
(17)
38.8
(14.
5)37
.9 (1
6, 7
3)

Queensland Cancer Risk Study
Queensland Cancer Fund
111
Queensland Cancer Risk Study
Sex
Age
gro
up (y
ears
)r
emot
enes
s (A
riA
+ ca
tego
r�es)
b
(n)
%
mal
eFe
mal
e20
-39
40-5
960
-75
maj
or c
�tyin
ner
reg�
onal
Out
er
reg�
onal
rem
ote/
very
rem
ote
(n=4
698)
%(n
=472
1)%
(n=4
016)
%(n
=381
4)%
(n=1
589)
%(n
=512
6)%
(n=2
372)
%(n
=170
3)%
(n=2
09)
%
Res
pond
ents
who
hav
e ev
er b
een
diag
nose
d w
ith c
ance
r:N
6. R
espo
nden
ts w
ho h
ad u
sed
unpr
oven
m
etho
ds to
hel
p tre
at th
eir c
ance
r Yes
No
(148
5) 8.5
91.5
(689
)
8.9
91.9
(796
)
8.2
91.8
(263
)
9.1
90.9
(711
)
8.7
91.3
(512
)
7.6
92.4
(782
)
8.7
91.3
(393
)
7.6
92.4
(272
)
8.5
91.5
(37)
10.5
89.5
Fam
�ly c
ance
r h�s
tory
N7.
Hav
e an
y of
you
r clo
sec b
lood
rela
tives
ev
er h
ad c
ance
r or l
euka
emia
?
Yes
No
Don
’t kn
ow/C
an’t
say
(941
6)
40.7
57.3 2.0
(469
5)
38.0
59.7 2.3
(472
0)
43.5
54.8 1.8
(4
017)
28.3
69.4 2.3
(381
1)
48.2
50.1 1.8
(158
8)
54.2
43.9 1.9
(512
3)
39.6
58.6 1.8
(237
1)
43.9
54.0 2.1
(170
2)
40.1
57.8 2.2
(209
)
37.3
58.4 4.3
Res
pond
ents
who
hav
e cl
ose
bloo
d re
lativ
es d
iagn
osed
with
can
cer o
r le
ukae
mia
:N
8. W
ere
any
of y
our c
lose
c blo
od re
lativ
es
diag
nose
d be
fore
the
age
of 5
5?Ye
sN
oD
on’t
know
/Can
’t sa
y
(383
2)
51.3
46.7 2.1
(178
5)
46.4
51.3 2.3
(204
9)
55.5
42.7 1.9
(113
7)
67.4
30.7 1.9
(183
4)
46.9
51.0 2.1
(860
)
39.3
58.6 2.1
(202
9)
50.3
47.6 2.1
(104
1)
51.9
46.3 1.8
(682
)
52.2
45.6 2.2
(78)
57.7
38.5 3.8

Queensland Cancer Fund
V i e r t e l C e n t r e f o r R e s e a r c h i n C a n c e r C o n t r o l
Queensland Cancer Risk Study
112
Sex
Age
gro
up (y
ears
)r
emot
enes
s (A
riA
+ ca
tego
r�es)
b
(n)
%
mal
eFe
mal
e20
-39
40-5
960
-75
maj
or c
�tyin
ner
reg�
onal
Out
er
reg�
onal
rem
ote/
very
rem
ote
(n=4
698)
%(n
=472
1)%
(n=4
016)
%(n
=381
4)%
(n=1
589)
%(n
=512
6)%
(n=2
372)
%(n
=170
3)%
(n=2
09)
%
N9.
Hav
e an
y of
you
r ext
ende
dd blo
od
rela
tives
eve
r bee
n di
agno
sed
with
ca
ncer
or l
euka
emia
?
Yes
No
Don
’t kn
ow/C
an’t
say
(941
6)
52.5
40.4 7.1
(469
6)
44.8
47.0 8.2
(472
1)
60.1
34.0 6.0
(401
6)
59.2
35.0 5.8
(381
1)
51.4
41.0 7.5
(158
9)
38.1
52.8 9.1
(512
2)
52.0
41.2 6.8
(237
2)
52.3
39.8 8.0
(170
2)
53.9
39.1 6.9
(209
)
52.6
41.1 6.2
N10
. Has
any
one
else
you
kno
w
pers
onal
ly e
ver h
ad c
ance
r?Ye
sN
o
(941
7)
84.6
15.4
(469
5)
82.6
17.4
(472
1)
86.6
13.4
(401
7)
79.2
20.8
(381
2)
89.2
10.8
(158
8)
87.4
12.6
(512
3)
84.9
15.1
(237
2)
85.4
14.6
(170
2)
83.4
16.6
(209
)
82.8
17.2
a C
olum
n pe
rcen
tage
s ar
e st
anda
rdis
ed to
the
2003
Que
ensl
and
popu
latio
n by
age
, sex
and
geo
grap
hic
loca
tion.
b A
cces
sibi
lity/
Rem
oten
ess
Inde
x of
Aus
tralia
c C
lose
blo
od re
lativ
es w
ere
defin
ed a
s pa
rent
s, c
hild
ren,
or s
iblin
gs.
d E
xten
ded
bloo
d re
lativ
es w
ere
defin
ed a
s gr
andp
aren
ts, a
unts
, unc
les,
cou
sins
, nep
hew
s an
d ni
eces
– b
lood
rela
ted.

Queensland Cancer Risk Study
Queensland Cancer Fund
113
Queensland Cancer Risk Study
App
endi
x O
. Des
crip
tive
stat
istic
s for
Cha
pter
12:
KN
OW
LED
GE,
ATT
ITU
DES
AN
D P
ERC
EPTI
ON
Sa (n=
9419
)
Sex
Age
gro
up (y
ears
)r
emot
enes
s (A
riA
+ ca
tego
r�es)
b
(n)
%
mal
eFe
mal
e20
-39
40-5
960
-75
maj
or c
�tyin
ner
reg�
onal
Out
er
reg�
onal
rem
ote/
very
rem
ote
(n=4
698)
%(n
=472
1)%
(n=4
016)
%(n
=381
4)%
(n=1
589)
%(n
=512
6)%
(n=2
372)
%(n
=170
3)%
(n=2
09)
%
Bel
�ef �
n a
cure
and
trea
tmen
t for
ca
ncer
O1.
How
con
fiden
t are
you
that
ther
e w
ill b
e cu
res
for t
he M
OS
T co
mm
on
form
s of
can
cer w
ithin
you
r life
time?
Not
at a
ll co
nfide
ntS
light
ly c
onfid
ent
Mod
erat
ely
confi
dent
Very
con
fiden
tE
xtre
mel
y co
nfide
ntD
on’t
know
(940
4)
15.2
29.8
38.8
12.3 3.3
0.6
(469
1)
16.4
28.9
36.3
13.5 4.3
0.6
(471
3)
14.0
30.7
41.4
11.1 2.2
0.7
(401
1)
11.3
33.4
39.7
11.9 3.3
0.5
(380
8)
15.9
27.8
39.0
13.4 3.3
0.6
(158
4)
23.1
25.8
36.2
10.7 3.2
1.1
(512
1)
15.7
29.9
38.3
11.9 3.5
0.7
(236
4)
15.2
29.9
39.2
12.3 2.9
0.5
(170
2)
13.8
29.5
39.5
13.6 2.9
0.7
(208
)
11.5
29.8
41.3
12.5 4.8
0.0
O2.
Tre
atin
g ca
ncer
in th
e ea
rly s
tage
s in
crea
ses
a pe
rson
’s c
hanc
e of
su
rviv
al
Stro
ngly
agr
eeA
gree
Nei
ther
agr
ee n
or d
isag
ree
Dis
agre
eS
trong
ly d
isag
ree
Don
’t kn
owR
efus
ed
(941
6)
78.6
18.4 1.2
0.5
0.5
0.8
0.0
(469
5)
78.2
19.0 1.0
0.6
0.5
0.6
0.0
(472
0)
79.0
17.8 1.3
0.4
0.4
1.0
0.0
(401
6)
75.8
21.4 1.2
0.5
0.5
0.6
0.0
(381
2)
80.7
16.3 1.3
0.5
0.4
0.8
0.0
(158
8)
80.6
16.0 0.8
0.6
0.5
1.4
0.1
(512
3)
79.6
17.7 1.1
0.4
0.5
0.7
0.0
(236
9)
76.9
19.5 1.4
0.6
0.5
1.1
0.0
(170
3)
77.9
19.1 1.1
0.7
0.4
0.9
0.0
(209
)
79.4
18.7 1.0
0.0
0.5
0.5
0.0

Queensland Cancer Fund
V i e r t e l C e n t r e f o r R e s e a r c h i n C a n c e r C o n t r o l
Queensland Cancer Risk Study
114
Sex
Age
gro
up (y
ears
)r
emot
enes
s (A
riA
+ ca
tego
r�es)
b
(n)
%
mal
eFe
mal
e20
-39
40-5
960
-75
maj
or c
�tyin
ner
reg�
onal
Out
er
reg�
onal
rem
ote/
very
rem
ote
(n=4
698)
%(n
=472
1)%
(n=4
016)
%(n
=381
4)%
(n=1
589)
%(n
=512
6)%
(n=2
372)
%(n
=170
3)%
(n=2
09)
%
Bel
�ef �
n re
duc�
ng r�
sk o
f can
cer
O3.
Wha
t can
peo
ple
do p
erso
nally
to
redu
ce th
eir r
isk
of g
ettin
g ca
ncer
?c
Sun
pro
tect
ion
Eat
wel
lR
egul
ar c
heck
-ups
N
ot s
mok
eB
e ac
tive/
keep
a h
ealth
y w
eigh
tE
at m
ore
fruit/
vege
tabl
es/c
erea
lsLi
mit
alco
hol
Red
uce
stre
ssAv
oid
chem
ical
s/pe
stic
ides
Avoi
d pa
ssiv
e sm
okin
gO
ther
Can
’t do
any
thin
gD
on’t
know
(941
8)
67.5
50.1
43.6
34.7
31.7
26.9
13.0 8.3
7.3
1.7
42.9 2.3
4.2
(469
7)
68.2
48.1
36.7
35.0
27.9
25.8
11.3 6.3
8.6
1.9
39.4 2.3
4.8
(472
2)
66.8
52.1
50.5
34.3
35.5
28.1
14.7
10.2 6.0
1.5
46.4 2.2
3.5
(401
7)
70.1
50.1
45.2
40.3
35.3
23.6
14.1 7.7
7.9
2.0
42.7 2.0
3.7
(381
3)
66.6
52.6
45.0
32.4
32.6
30.1
12.5 9.8
7.8
1.4
44.6 2.4
3.6
(158
9)
63.2
44.5
36.4
26.1
20.3
28.0
11.6 6.0
4.7
1.8
39.6 2.8
6.8
(512
5)
67.2
50.4
42.8
36.3
33.8
29.2
14.0 9.7
6.9
2.0
43.8 1.9
3.7
(237
2)
65.2
47.3
48.9
31.3
27.8
26.2
11.3 6.4
7.5
1.1
42.8 2.9
5.2
(170
3)
71.1
53.4
38.4
34.2
31.3
21.6
12.5 7.2
8.5
1.7
41.5 2.3
3.8
(210
)
73.3
50.0
46.4
37.3
27.8
22.5
12.9 3.8
6.7
1.0
36.7 3.3
4.8
O4.
Ove
rall,
how
muc
h do
you
bel
ieve
th
at y
ou c
an p
erso
nally
redu
ce y
our
risk
of g
ettin
g ca
ncer
in th
e fu
ture
by
your
ow
n ac
tions
or b
ehav
iour
s?
Not
redu
ce a
t all
Slig
htly
redu
ceM
oder
atel
y re
duce
Gre
atly
redu
ceC
ompl
etel
y el
imin
ate
I don
’t kn
ow
(941
5) 3.8
22.3
38.4
30.1 2.4
2.9
(469
7)
4.1
21.8
37.4
31.4 2.6
2.7
(471
8)
3.5
22.9
39.4
28.9 2.2
3.1
(401
7)
2.2
22.8
38.9
32.5 2.1
1.5
(381
1)
3.8
21.6
39.0
30.4 2.7
2.5
(158
7)
7.9
23.0
35.8
23.5 2.4
7.4
(512
3)
3.3
22.6
39.0
30.3 2.3
2.4
(237
1)
4.6
22.0
36.4
30.9 2.2
3.8
(170
3)
4.1
22.0
39.7
28.8 2.7
2.8
(209
)
4.3
22.5
36.8
28.2 3.8
4.3

Queensland Cancer Risk Study
Queensland Cancer Fund
115
Queensland Cancer Risk Study
Sex
Age
gro
up (y
ears
)r
emot
enes
s (A
riA
+ ca
tego
r�es)
b
(n)
%
mal
eFe
mal
e20
-39
40-5
960
-75
maj
or c
�tyin
ner
reg�
onal
Out
er
reg�
onal
rem
ote/
very
rem
ote
(n=4
698)
%(n
=472
1)%
(n=4
016)
%(n
=381
4)%
(n=1
589)
%(n
=512
6)%
(n=2
372)
%(n
=170
3)%
(n=2
09)
%
perc
ept�o
n of
r�sk
Res
pond
ents
who
hav
e ne
ver b
een
diag
nose
d w
ith c
ance
r: O
5. W
hat a
re y
ou c
hanc
es o
f get
ting
canc
er (o
ther
than
ski
n ca
ncer
) du
ring
your
life
time?
d
No
chan
ceS
light
cha
nce
Mod
erat
e ch
ance
Hig
h ch
ance
Cer
tain
to h
appe
nD
on’t
know
Ref
used
(800
5) 4.0
34.1
43.4
12.7 1.9
3.7
0.1
(404
6)
3.2
33.7
44.2
12.8 2.3
3.6
0.1
(396
1)
4.7
34.6
42.6
12.7 1.5
3.7
0.1
(376
5)
2.4
35.2
42.4
15.2 2.2
2.4
0.1
(314
5)
4.3
31.8
46.0
11.7 2.0
4.0
0.2
(109
6)
8.4
37.1
39.5 7.1
0.6
7.0
0.2
(436
9)
3.9
33.8
44.3
12.4 1.8
3.7
0.1
(201
7)
4.3
34.9
42.6
12.8 1.6
3.7
0.0
(143
5)
3.4
34.8
42.2
13.6 2.3
3.6
0.1
(178
)
2.8
29.8
43.3
12.4 6.7
4.5
0.6
Res
pond
ents
who
hav
e ne
ver b
een
diag
nose
d w
ith c
ance
r: O
6. W
hat a
re y
our c
hanc
es o
f get
ting
skin
can
cer d
urin
g yo
ur li
fetim
e?d
No
chan
ceS
light
cha
nce
Mod
erat
e ch
ance
Hig
h ch
ance
Cer
tain
to h
appe
nD
on’t
know
Ref
used
(800
6) 5.8
32.2
37.1
19.7 4.2
0.9
0.1
(404
7)
5.6
29.5
35.9
22.7 5.3
1.0
0.1
(396
1)
6.1
35.0
38.3
16.7 3.1
0.8
0.1
(376
5)
3.9
30.6
38.4
22.4 4.1
0.6
0.0
(314
5)
6.0
32.0
37.5
18.8 4.6
1.0
0.1
(109
7)
12.1
38.2
31.2
13.4 3.4
1.5
0.2
(437
0)
5.9
32.6
38.1
18.9 3.5
0.9
0.0
(201
5)
6.2
31.8
36.6
19.9 4.5
0.9
0.1
(143
4)
4.9
32.3
34.7
21.9 5.4
0.8
0.0
(178
)
6.2
26.4
38.2
21.3 7.3
0.6
0.0
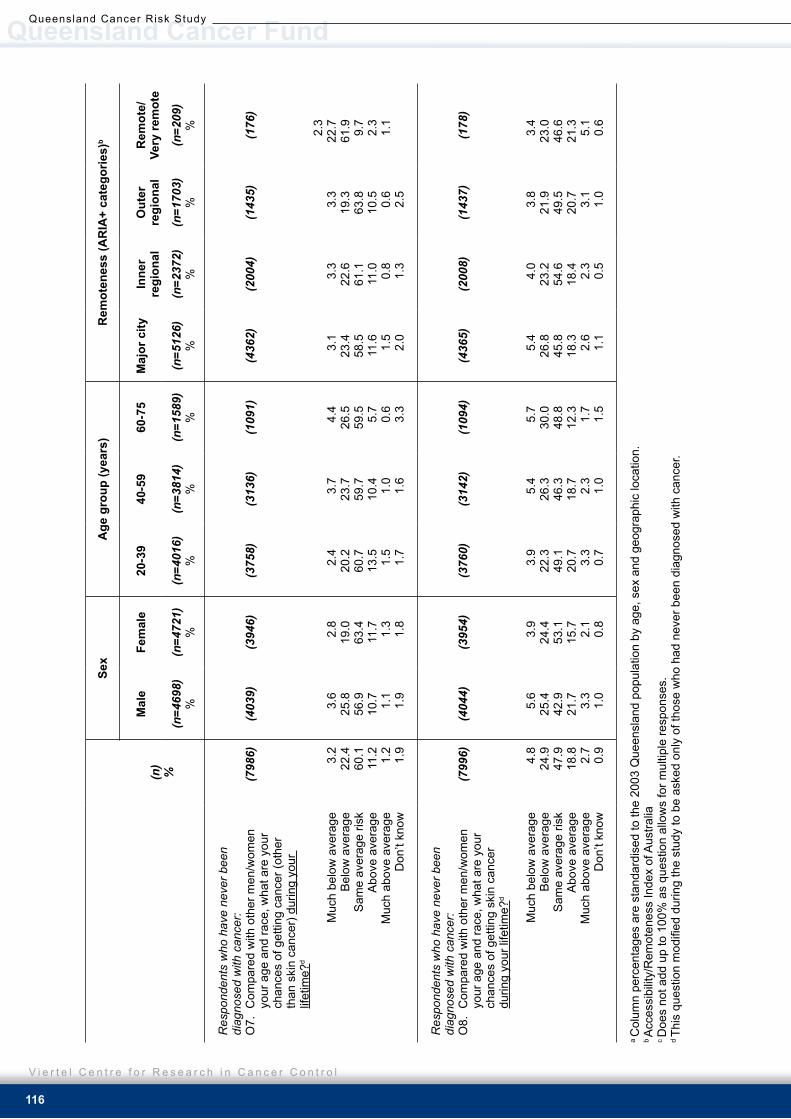
Queensland Cancer Fund
V i e r t e l C e n t r e f o r R e s e a r c h i n C a n c e r C o n t r o l
Queensland Cancer Risk Study
116
Sex
Age
gro
up (y
ears
)r
emot
enes
s (A
riA
+ ca
tego
r�es)
b
(n)
%
mal
eFe
mal
e20
-39
40-5
960
-75
maj
or c
�tyin
ner
reg�
onal
Out
er
reg�
onal
rem
ote/
very
rem
ote
(n=4
698)
%(n
=472
1)%
(n=4
016)
%(n
=381
4)%
(n=1
589)
%(n
=512
6)%
(n=2
372)
%(n
=170
3)%
(n=2
09)
%
Res
pond
ents
who
hav
e ne
ver b
een
diag
nose
d w
ith c
ance
r: O
7. C
ompa
red
with
oth
er m
en/w
omen
yo
ur a
ge a
nd ra
ce, w
hat a
re y
our
chan
ces
of g
ettin
g ca
ncer
(oth
er
than
ski
n ca
ncer
) dur
ing
your
lif
etim
e?d
Muc
h be
low
ave
rage
Bel
ow a
vera
geS
ame
aver
age
risk
Abo
ve a
vera
geM
uch
abov
e av
erag
eD
on’t
know
(798
6) 3.2
22.4
60.1
11.2 1.2
1.9
(403
9)
3.6
25.8
56.9
10.7 1.1
1.9
(394
6)
2.8
19.0
63.4
11.7 1.3
1.8
(375
8)
2.4
20.2
60.7
13.5 1.5
1.7
(313
6)
3.7
23.7
59.7
10.4 1.0
1.6
(109
1)
4.4
26.5
59.5 5.7
0.6
3.3
(436
2)
3.1
23.4
58.5
11.6 1.5
2.0
(200
4)
3.3
22.6
61.1
11.0 0.8
1.3
(143
5)
3.3
19.3
63.8
10.5 0.6
2.5
(176
)
2.3
22.7
61.9 9.7
2.3
1.1
Res
pond
ents
who
hav
e ne
ver b
een
diag
nose
d w
ith c
ance
r: O
8. C
ompa
red
with
oth
er m
en/w
omen
yo
ur a
ge a
nd ra
ce, w
hat a
re y
our
chan
ces
of g
ettin
g sk
in c
ance
r du
ring
your
life
time?
d
Muc
h be
low
ave
rage
Bel
ow a
vera
geS
ame
aver
age
risk
Abo
ve a
vera
geM
uch
abov
e av
erag
eD
on’t
know
(799
6) 4.8
24.9
47.9
18.8 2.7
0.9
(404
4)
5.6
25.4
42.9
21.7 3.3
1.0
(395
4)
3.9
24.4
53.1
15.7 2.1
0.8
(376
0)
3.9
22.3
49.1
20.7 3.3
0.7
(314
2)
5.4
26.3
46.3
18.7 2.3
1.0
(109
4)
5.7
30.0
48.8
12.3 1.7
1.5
(436
5)
5.4
26.8
45.8
18.3 2.6
1.1
(200
8)
4.0
23.2
54.6
18.4 2.3
0.5
(143
7)
3.8
21.9
49.5
20.7 3.1
1.0
(178
)
3.4
23.0
46.6
21.3 5.1
0.6
a C
olum
n pe
rcen
tage
s ar
e st
anda
rdis
ed to
the
2003
Que
ensl
and
popu
latio
n by
age
, sex
and
geo
grap
hic
loca
tion.
b A
cces
sibi
lity/
Rem
oten
ess
Inde
x of
Aus
tralia
c D
oes
not a
dd u
p to
100
% a
s qu
estio
n al
low
s fo
r mul
tiple
resp
onse
s.d Th
is q
uest
ion
mod
ified
dur
ing
the
stud
y to
be
aske
d on
ly o
f tho
se w
ho h
ad n
ever
bee
n di
agno
sed
with
can
cer.