2. united states dam inventory data - fema.gov 2012 2-1 summary of existing guidelines for...
TRANSCRIPT
July 2012 2-1
Summary of Existing Guidelines for Hydrologic Safety of Dams
2. United States Dam Inventory Data 2.1. Background The purpose of this section is to provide a summary of basic information related to the inventory of dams within the United States. This data is helpful for establishing new guidelines for the hydrologic safety of existing and new dams as it provides general information on the location, age, ownership, hazard classification and size of dams in the United States. This summary of dams is based on information cataloged and reported by the Association of State Dam Safety Officials (ASDSO), the US Army Corps of Engineers (USACE), the American Society of Civil Engineers (ASCE) and the Federal Emergency Management Agency (FEMA) as described in the following paragraphs. Data from each of these entities does vary; therefore, there are inconsistencies in the data presented from various sources in this chapter.
National Inventory of Dams
The National Inventory of Dams (NID) is a database of dams in the United States which was developed and is maintained by the USACE. Congress authorized the USACE to inventory dams as part of the 1972 National Dam Inspection Act. Several subsequent acts have authorized maintenance of the NID and provided funding. The USACE collaborates with FEMA and state regulatory offices to collect data on dams. The goal of the NID is to include all dams in the United States which meet at least one of the following criteria:
1. High hazard classification - loss of at least one human life is likely if the dam fails
2. Significant hazard classification - possible loss of human life and likely significant property or environmental destruction
3. Equal or exceed 25 feet in height and exceed 15 acre-feet in storage
4. Equal or exceed 50 acre-feet storage and exceed 6 feet in height
Low hazard dams which do not meet the criteria specified in number 3 or 4 are not included in the NID even if they are regulated according to state criteria. In some states, the number of these dams is several times the number of dams included in the NID.
Association of State Dam Safety Officials
In addition to using information collected as part of the NID, ASDSO annually collects additional information on dams in the United States by survey for their State Dam Safety Program Performance Information Report. ASDSO data focuses on dams within the jurisdiction of each state regardless of whether or not they are included in the NID.
American Society of Civil Engineers
Since 1998, ASCE has issued four reports titled “Report Card for America’s Infrastructure.” These reports depict the condition and performance of the nation’s infrastructure, including dams, and
2-2 July 2012
Federal Emergency Management Agency
were prepared by an advisory panel of the nation’s leading civil engineers. This panel analyzed hundreds of reports and studies in the process of assigning grades as well as surveying thousands of engineers.
Federal Emergency Management Agency
As part of the U.S. Department of Homeland Security, FEMA also has an interest in dam safety in the United States. In their 2010 biennial report to Congress, “Dam Safety in the United States, A Progress Report on the National Dam Safety Program,” FEMA describes the achievements of the states, the federal agencies, and their partners in Fiscal Year (FY) 2008 and FY 2009 in meeting the vision, mission, and objectives of the National Dam Safety Program. This document contains many interesting statistics and graphics that are useful in summarizing the dam inventory of the United States.
2.2. Summary of Significant Statistics for Dams in the United States
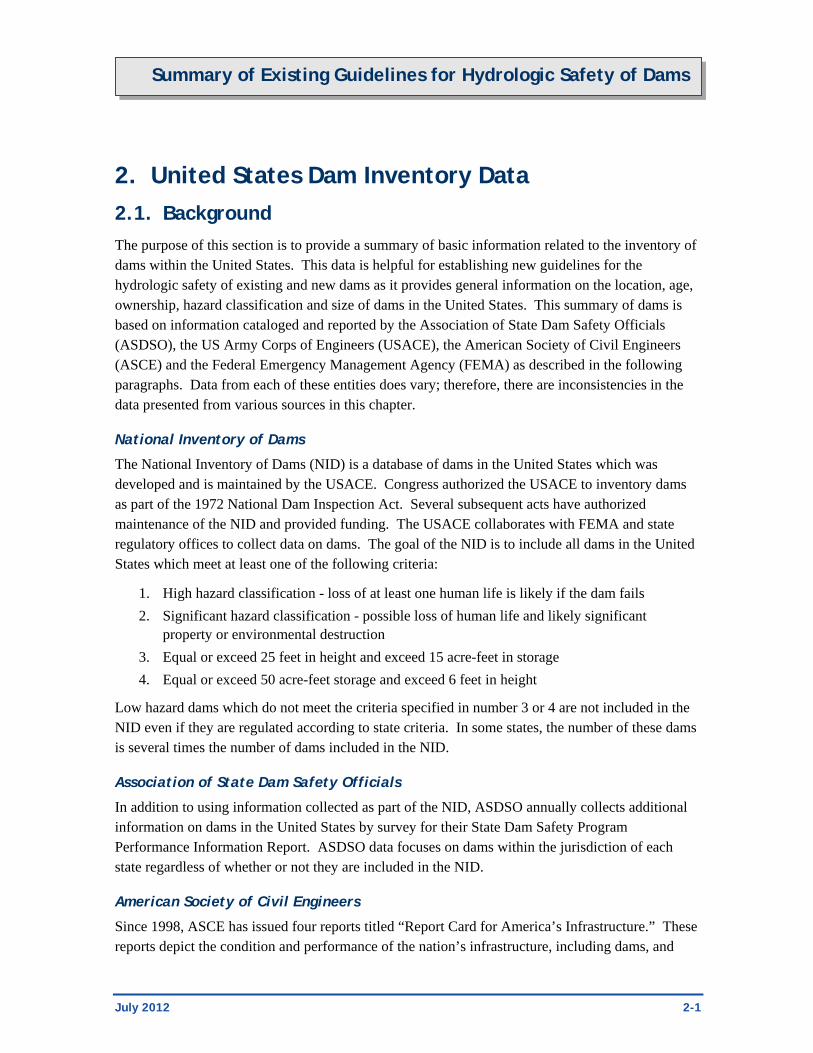
Dam construction in the United States began in earnest in the second half of the 19th century and peaked with the surge in the American economy and population following World War II. The current NID contains data on nearly 84,000 dams. The average age of these dams is over 50 years. Figure 2.1 shows the relative construction date of dams based on data in the NID.
Figure 2.1 Year Dams Were Completed in the United States [USACE, 2009]
The 2009 Report Card for America’s Infrastructure on Dams, prepared by ASCE, indicates that age has a two-fold effect on the determination of deficiency of a dam. First, the age of a dam contributes to deterioration. Second, design criteria and loadings which were considered

July 2012 2-3
Summary of Existing Guidelines for Hydrologic Safety of Dams
appropriate at the time of design, may now be considered insufficient, leading to dams being considered unsafe or deficient. The same publication reports that the number of dams determined to be unsafe or deficient is rising and now stands at more than 4,400 dams. ASCE’s 2009 Report Card states, “Over the past six years, for every deficient, high hazard potential dam repaired, nearly two more were declared deficient.”
Not only are dams in the United States aging and being declared deficient, but, at the same time, the number of high hazard potential dams is also increasing at a significant rate. According to statistics maintained by ASDSO, for the 10-year period from 2000 through 2009, the number of dams listed in the NID increased by about 9 percent. During this same period, the number of high-hazard, state-regulated dams increased by almost 14 percent. ASCE’s 2009 Report Card on Dams states that the trend of increasing number of high hazard dams is a result of higher consequences of failure spurred by new downstream development. Development both upstream and downstream of dams is a widespread concern.
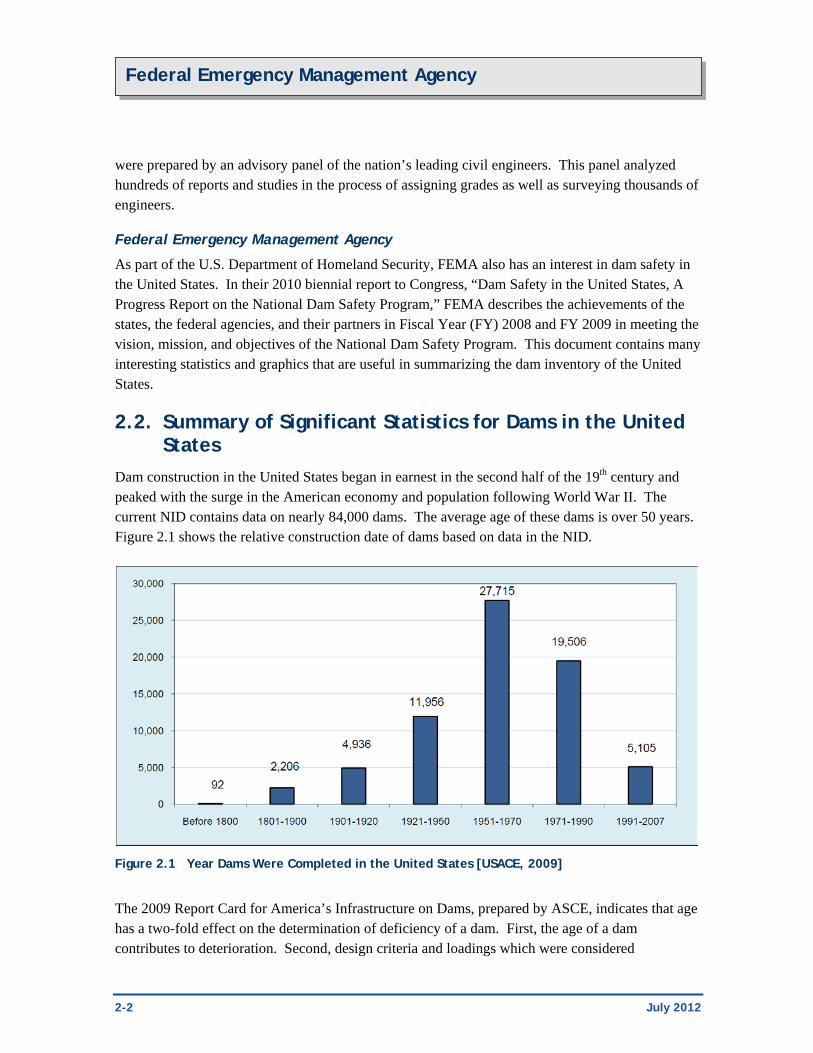
Within the United States, dams are owned and regulated by a variety of organizations. Most dams are privately or municipally-owned and are state-regulated. Figure 2.2 is a map of the United States showing the distribution of low, significant and high hazard potential dams. Figure 2.3 is a similar map showing only state-regulated high hazard potential dams.
Figure 2.2 State-Regulated Dams in the United States According to Hazard Potential [FEMA, 2010]
□ = high-hazard potential □ = significant-hazard potential □ = low-hazard potential
2-4 July 2012
Federal Emergency Management Agency
Figure 2.3 Map Showing Only State-Regulated High-Hazard Potential Dams [FEMA, 2010]
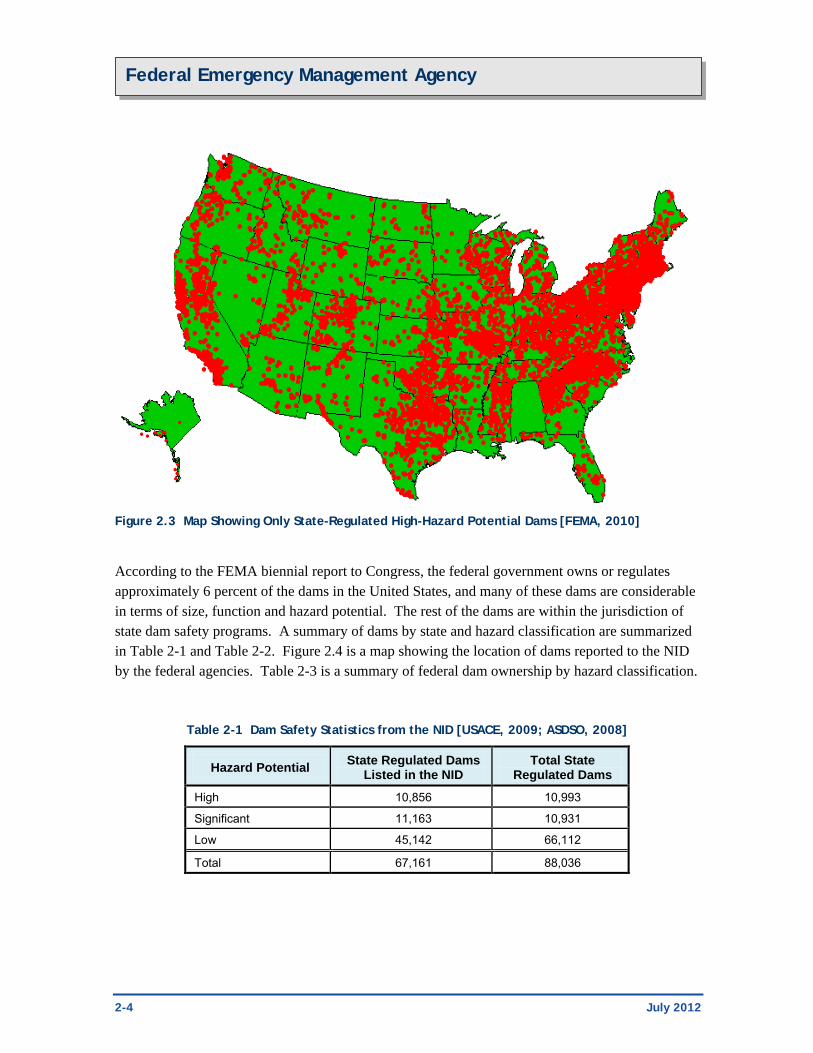
According to the FEMA biennial report to Congress, the federal government owns or regulates approximately 6 percent of the dams in the United States, and many of these dams are considerable in terms of size, function and hazard potential. The rest of the dams are within the jurisdiction of state dam safety programs. A summary of dams by state and hazard classification are summarized in Table 2-1 and Table 2-2. Figure 2.4 is a map showing the location of dams reported to the NID by the federal agencies. Table 2-3 is a summary of federal dam ownership by hazard classification.
Table 2-1 Dam Safety Statistics from the NID [USACE, 2009; ASDSO, 2008]
Hazard Potential State Regulated Dams Listed in the NID
Total State Regulated Dams
High 10,856 10,993
Significant 11,163 10,931
Low 45,142 66,112
Total 67,161 88,036

July 2012 2-5
Summary of Existing Guidelines for Hydrologic Safety of Dams
Table 2-2 State Dam Safety Program Statistics [ASDSO, 2008]
State State Regulated Dams NID Dams
High Hazard
Significant Hazard
Low Hazard Total High
Hazard Significant
Hazard Low
Hazard Total
Alabama 0 0 0 0 0 0 0 0
Alaska 18 33 32 83 18 32 27 77
Arizona 100 36 116 252 93 39 120 252
Arkansas 103 95 208 406 102 92 209 403
California 688 274 285 1,247 334 708 211 1,253
Colorado 352 322 1,261 1,935 335 312 1,233 1,880
Connecticut 226 462 499 1,187 226 452 28 706
Delaware 58 5 0 63 9 27 1 37
Florida 72 330 472 874 72 321 412 805
Georgia 474 0 3,452 3,926 437 0 3,424 3,861
Hawaii 123 3 12 138 96 22 17 135
Idaho 107 149 313 569 94 129 140 363
Illinois 187 299 999 1,485 184 297 801 1,282
Indiana 240 249 599 1,088 241 250 500 991
Iowa 83 193 3,049 3,325 78 191 3,043 3,312
Kansas 202 238 5,618 6,058 183 247 5,474 5,904
Kentucky 178 217 671 1,066 161 193 600 954
Louisiana 31 69 443 543 28 65 440 533
Maine 28 67 573 668 25 80 545 650
Maryland 68 87 227 382 66 80 207 353
Massachusetts 308 746 536 1,590 324 741 554 1,619
Michigan 84 138 812 1,034 81 137 553 771
Minnesota 23 126 1,012 1,161 39 147 747 933
Mississippi 261 84 3,390 3,735 310 81 3,083 3,474
Missouri 469 137 68 674 455 132 66 653
Montana 105 152 2,636 2,893 102 131 2,377 2,610
Nebraska 124 212 1,972 2,308 129 212 1,886 2,227
Nevada 162 143 461 766 127 118 180 425
New Hampshire 122 174 2,779 3,075 89 193 344 626
New Jersey 215 338 1,168 1,721 202 366 226 794
New Mexico 181 88 129 398 170 92 96 358
New York 390 750 4,484 5,624 384 757 720 1,861
North Carolina 1,078 649 2,824 4,551 1,006 657 1,092 2,755
North Dakota 30 94 1,041 1,165 28 91 707 826
Ohio 375 543 679 1,597 411 559 558 1,528
Oklahoma 315 166 3,957 4,438 187 82 4,191 4,460
Oregon 126 197 995 1,318 122 181 530 833
2-6 July 2012
Federal Emergency Management Agency
Table 2-2 (continued) State Dam Safety Program Statistics [ASDSO, 2008]
State State Regulated Dams NID Dams
High Hazard
Significant Hazard
Low Hazard Total High
Hazard Significant
Hazard Low
Hazard Total
Pennsylvania 782 277 2,154 3,213 785 257 350 1,392
Puerto Rico 34 0 1 35 34 1 0 35
Rhode Island 97 83 470 650 17 41 136 194
South Carolina 153 481 1,683 2,317 153 481 1,683 2,317
South Dakota 47 144 2,158 2,349 47 144 2,158 2,349
Tennessee 150 210 302 662 266 330 465 1061
Texas 964 779 5,406 7,149 867 794 6,491 8,152
Utah 192 202 211 605 188 203 184 575
Vermont 57 136 379 572 57 133 161 351
Virginia 130 191 313 634 136 278 1,007 1,421
Washington 160 201 626 987 145 196 270 611
West Virginia 253 80 22 355 267 75 17 359
Wisconsin 189 170 3,294 3,653 196 138 604 938
Wyoming 79 112 1,321 1,512 79 116 1,153 1,348
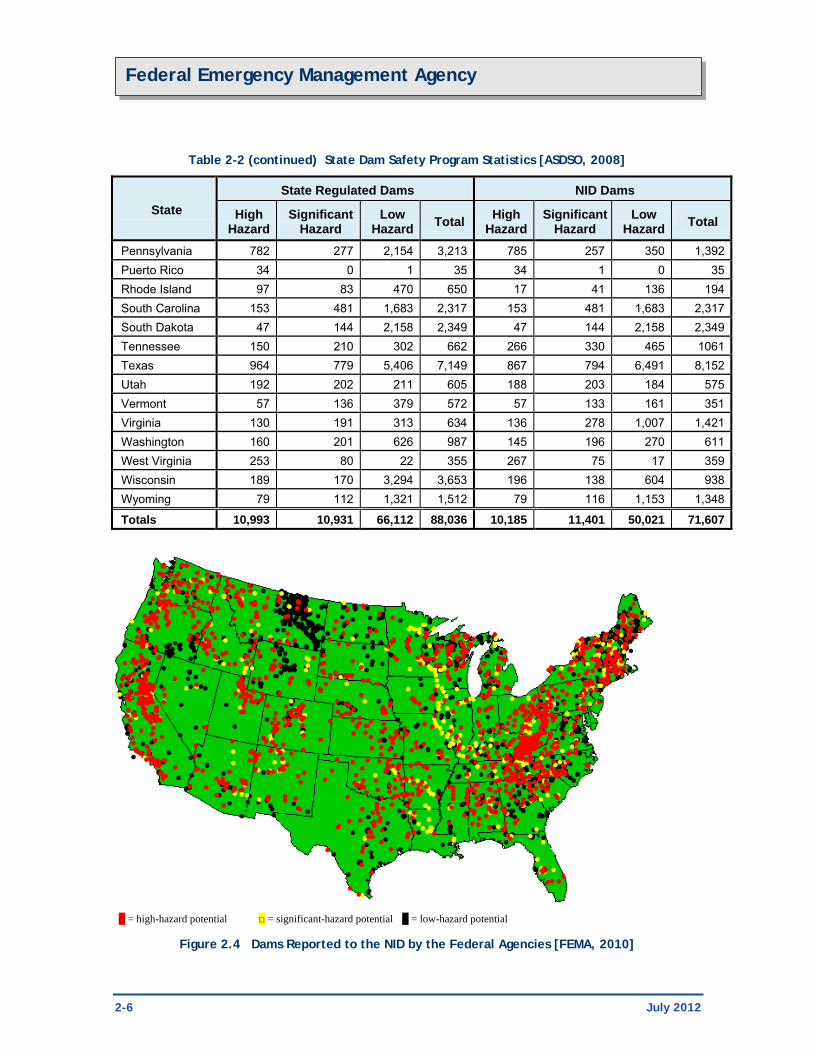
Totals 10,993 10,931 66,112 88,036 10,185 11,401 50,021 71,607
□ = high-hazard potential □ = significant-hazard potential □ = low-hazard potential
Figure 2.4 Dams Reported to the NID by the Federal Agencies [FEMA, 2010]

July 2012 2-7
Summary of Existing Guidelines for Hydrologic Safety of Dams
Table 2-3 Dams Owned and/or Regulated by Federal Agencies1 [FEMA, 2010]
Agency Total High Hazard
Significant Hazard
Low Hazard
United States Department of Agriculture Agricultural Research Service 1 1
USFS Owned 547 40 109 398
USFS Regulated 580 140 273 167
Natural Resources Conservation Service 27,254 2,233 2,299 22,722
Rural Housing Service2 25
Rural Utilities Service2 25
USDA Total: 28,462 2,413 2,631 22,387 Department of Defense
United States Army Corps of Engineers 6693 500 133 31
Army 230 35 20 175
Navy 314 5 3 20
Air Force 22 2 5 15
DOD Total: 952 542 161 241 Department of Education 14 2 1 11 Department of the Interior Bureau of Indian Affairs 895 102 29 764
Bureau of Land Management 609 8 1 600
Bureau of Reclamation 476 332 38 106
United States Fish and Wildlife Service 214 15 20 179
National Park Service 436 17 26 393
Office of Surface Mining 69 10 11 48
United States Geologic Survey 1 1
DOI Total: 2,700 485 125 2,090
Federal Energy Regulatory Commission 2,524 771 195 1,558 International Boundary Water Commission 7 3 1 3 Mine Safety and Health Administration Coal 626 216 63 347
Metal and Nonmetal 1,903 144 175 1,584
MSHA Total: 2,529 360 238 1,931
Nuclear Regulatory Commission 9 9
Tennessee Valley Authority 495 36 10 3 1 Totals provided in Table 2-3 are reported exactly as listed in the source document. 2 Breakdown of dams by hazard classification not available. 3 Five USACE dams need to have a hazard classification determined. 4 Three Navy dams need to have a hazard classification determined. 5 Includes only main dam projects. Total, including associated saddle dams and dikes, is 84.

2-8 July 2012
Federal Emergency Management Agency
July 2012 3-1
Summary of Existing Guidelines for Hydrologic Safety of Dams
3. Evolution of Design Flood Selection for Spillways 3.1. Background This Chapter focuses on the history and development of various methodologies for selecting the Spillway Design Flood (SDF) in the United States. The regulatory framework of dam safety guidelines and regulations is discussed in Chapter 4. An understanding of the timeframe of the development of the methodologies is helpful to understanding the history of dam safety guidelines since each type of design flood selection methodology must first be introduced and evaluated by the dam safety community before it becomes accepted and included in the guidelines.
3.2. Pre-United States Dam Building Laws related to the performance of dams have existed since before 1700 BC. The Babylonian Code of Hammurabi is the earliest discovered example of a set of written laws, two of which (Law Nos. 53 and 54) specifically address the responsibility of dam owners to maintain their dams and provide restitution should their dam fail and flood downstream fields [King, 1910]. Engineers up until the 1800s appear to have had no known rationale for their spillway designs [Schnitter, 1994]. Many early Roman dams, mostly of modest height and of masonry with a stepped downstream face, appear to have been designed to be overtopped.
3.3. The Early Period (Before ~1900) In the United States, few notable dams were constructed until the second half of the 19th century. In this early period, the design engineer had to rely on his own judgment as little or no streamflow or rainfall data were available. Usually the only available information was historical or anecdotal in terms of a past peak flood stage (high water mark) information. The corresponding flood discharge rates at a site were subsequently estimated from the high water mark or from past recorded flood levels transposed from adjacent streams. Early reports seem to provide a sense that the less cautious engineer had a confidence that the flood record was somewhat stable and that nature had shown what could be expected on a particular stream in terms of maximum flood potential in relatively few decades. Others believed the evaluation of major floods was impossible given the accepted techniques and resources available at that time [Myers, 1967].
During this early period, it should be recognized that the consequences of a dam failure were generally less severe than they are today. Early dams were typically constructed to limited heights. They were often constructed using rock-filled timber-cribs, stone masonry, or concrete and were resistant to erosion from overtopping. Many dams were constructed for the purpose of providing irrigation or power in remote areas where downstream development was insignificant. There may also have been an acceptance of the idea that some natural events are so extreme that man is not responsible for their consequences. The degree of conservatism of the design was generally
3-2 July 2012
Federal Emergency Management Agency
unknown. In 1889, 2,209 lives were lost when South Fork Dam, an earth embankment dam near Johnstown, Pennsylvania, overtopped and breached. The 72-foot-high structure was initially constructed between 1838 and 1853. This man-made catastrophe focused much needed attention on the importance of adequate spillway design capacity.
During the period between 1800 and 1900, several governmental agencies with an interest in hydrology were founded in the United States, including the Army Corps of Engineers (1802), the Fish and Wildlife Service (1871), the Geological Survey (1879), the Weather Bureau under the Department of Agriculture (1891), and the Mississippi River Commission (1893). These organizations helped to advance the field of surface water measurement and ushered in the beginning of stream gauging and precipitation gauging data collection [Chow, 1964]. Significant flow measurements were made in many rivers, and a comprehensive program to perform topographical and hydrographical surveys throughout the United States was initiated. The American Society of Civil Engineers and Architects (1852) was also founded during the Croton Aqueduct project for the City of New York, and soon emerged as a leading organization for organizing lectures and publishing technical papers on dam engineering.
3.4. Period of Empiricism or the Regional Discharge Period (1900-1930)
During the last part of the 19th century and the first 30 years of the 20th century, many formulas were developed to predict peak flood discharge based on the size and hydrologic characteristics of the drainage basin [Schnitter, 1994]. Ven Te Chow notes that although much work on the modernization of hydrology had been started, the development of quantitative hydrology was still immature. He refers to this period as the “Period of Empiricism.” Hundreds of empirical formulas were proposed and the selection of their coefficients and parameters depended mainly on judgment and experience [Chow, 1964].
By analyzing the maximum discharges observed at hundreds of streams regionally rather than at a single stream, regional flood frequency formulas were developed. The concepts of extrapolation, transposition and envelopment were applied in the development of the formulas and recognized the random-chance nature of major storms occurring over a watershed. These concepts also recognized that hydrologic data observed at one location could serve as a basis for estimates at other locations. The most famous and widely used enveloping formula was the Myers’ and Jarvis’ ratings in which peak discharges are proportional to the square root of the drainage area and a coefficient that varies with region and geology. By transposing the largest observed values of peak discharge to drainage area within a particular geological and climatological area, it was assumed that these values approached the largest that could occur, or that they provided an adequate degree of safety [Myers, 1967].
One example of a dam designed during this period is the Gilboa Dam (Schoharie County, New York) which was designed and constructed during the period of 1917 to 1926 to impound a water
July 2012 3-3
Summary of Existing Guidelines for Hydrologic Safety of Dams
supply storage reservoir for New York City. With a height of 183.0 feet and a normal pool storage of approximately 60,000 acre-feet, the dam’s construction was a noteworthy achievement in dam engineering during this period. For the hydrologic design of Gilboa Dam, regional floods were analyzed and the maximum event was transposed to the 314 square mile drainage area of the dam. This transposed flood event was then multiplied by a factor of three to provide a margin of safety per the engineer’s judgment. The resulting flood flow of 168,000 cubic feet per second was referred to in 1917 design documents as the “probable maximum flood.” This design flood compares favorably to current industry standards for calculating the probable maximum event [USACE, 1978].
Additional major governmental agencies were founded in the United States during this period that relied on hydrologic investigations to perform their functions including the Bureau of Reclamation (1902), the Forest Service (1906), the Miami Conservancy District (1914), and the U.S. Army Engineers Waterways Experiment Station (1928). The National Research Council of the National Academy of Sciences (1919), the Federal Power Commission (1920) the International Commission on Large Dams (1928), and USCOLD (1928), now the United States Society on Dams (2001), were also established during this period.
3.5. Period of Rationalization or Period of Statistical Frequency Analysis and Storm Transposition (1930-1950)
During this period, additional important government agencies were organized in the United States such as the Tennessee Valley Authority (1933), the Soil Conservation Service (1935), now known as the Natural Resources Conservation Service (1994), and the Weather Bureau (1940).
Systematic nationwide collection of surface water data began in earnest by the Geologic Survey in 1934 when the New Deal Federal Public Works Administration obtained funds to perform detailed studies of floods, rainfall, and runoff. The publication Floods in the United States provided information on floods, flood peaks, and river discharges for most of the major rivers in the country while the publication Rainfall and Run-Off in the United States provided minimum, maximum, and other precipitation statistics from precipitation stations throughout the country. Together, the two volumes covered the major areas of surface water hydrology as it was understood and significantly increased the data available to dam engineers [Reuss, 2002].
Several great hydrologists emerged during this period who used rational analysis instead of empiricism to solve hydrologic problems. In 1932, L. K. Sherman demonstrated the use of the unit hydrograph for translating rainfall excess into a runoff hydrograph. In 1933, R. E. Horton developed an approach to determine rainfall excess based on infiltration theory. In 1941, E. J. Gumbell proposed the use of the extreme-value distribution for frequency analysis of hydrologic data, and along with many others promoted the use of statistics in hydrology [Chow, 1964].

3-4 July 2012
Federal Emergency Management Agency
During a brief portion of this period, flood-frequency curves were extrapolated to estimate flood flows with return periods as large as 10,000 years. The flood selected for setting the spillway design capacity depended on the judgment of the engineer [ASCE, 1988]. Developing a SDF for a dam by straight frequency analysis of discharges from a long record initially showed great promise. After several major floods, however, the recorded peak discharges were found to exceed maximum recorded floods by several orders of magnitude and fall far outside of the defined flood frequency relationships. In 1942, the Boston Society of Civil Engineers examined the use of flood frequency relationships developed from flood records extending back 100 years, and concluded that it was difficult and uncertain to assign return periods to extreme observed floods. They also concluded that it would be even more difficult and uncertain to extrapolate to the long return period that would be required for a SDF [Myers, 1967].
Figure 3.1 provides an example of the difficulties in using statistics alone, and shows the maximum annual peak discharge for the Pecos River near Comstock, Texas for the 54-year period from 1900 to 1954. Based on the observed annual peak discharges at this gaging station no one could have predicted the observed peak discharge for the 1954 flood by extrapolating prior flood frequency data (statistics) alone.
Figure 3.1 Maximum Annual Peak Discharge, Pecos River near Comstock [Myers, 1967]
With the innovation of the unit hydrograph, it became possible to estimate flood flows from storm rainfall. This led to storm transposition whereby precipitation recorded from major storms within a

July 2012 3-5
Summary of Existing Guidelines for Hydrologic Safety of Dams
region are transposed or centered over the basin under study. Runoff is then computed using unit hydrograph theory. This method was developed and advocated by members of the Corps of Engineers and Weather Bureau as a powerful tool for engineers in determining events which “could happen” over basins, but cautioned that this does not necessarily yield a “limiting storm.” In the late 1930s, the Tennessee Valley Authority used the Myer’s rating to establish the peak design discharge (plus generous freeboard) and storm transposition for flood volume [Myers, 1967].
3.6. The Probable Maximum Precipitation Period Using Prescriptive Standards (1950-~2000)
After 1950, the Agricultural Research Service (1953) was established, the Federal Power Commission was reorganized to form the Federal Energy Regulatory Commission (1978), and the federal government’s disaster-recovery efforts were consolidated to form the Federal Emergency Management Agency (1979). Under FEMA’s leadership, the Interagency Committee on Dam Safety (1980) was formed and the National Dam Safety Program was established (1980). In March 2003, FEMA joined 22 other federal agencies, programs, and offices in becoming the Department of Homeland Security (2003).
The Association of Dam Safety Officials (1983) was also formed during this period and initially had 34 member states. Today ASDSO is a leading non-profit organization with more than 3,000 members representing every state dam safety regulatory agency, federal and local governments, academia, dam owners, consultants, contractors, manufacturers and suppliers.
The development of elegant theoretical and mathematical approaches to solve hydrologic problems along with the advancement of computers to perform computationally demanding analyses led to greater use of watershed modeling using unit hydrographs and precipitation. This period also coincided with a rapid increase in population and the greatest period of dam building in the United States, where dam building passed from a project-by-project emphasis to a continuous program. During this period, engineers turned to meteorologists to establish limiting rates of precipitation for design purposes. By performing air mass analyses, limits on the amount of precipitation from a storm were estimated using humidity of the incoming air, wind velocity, and the percent of water vapor that could be precipitated. In 1959, the definition of the term Probable Maximum Precipitation appeared in the Glossary of Meteorology published by the American Meteorological Society as follows [Meyers, 1967]:
“The theoretical greatest depth of precipitation for a given duration that is physically possible over a particular drainage area at a certain time of year” [American Meteorological Society, 1959].
The resulting Probable Maximum Flood was defined as:
“The flood that may be expected from the most severe combination of critical meteorologic and hydrologic conditions that are reasonably possible in the drainage basin under study” [FEMA, 2004].

3-6 July 2012
Federal Emergency Management Agency
In the early years the terms “maximum possible precipitation (MPP)” and “maximum possible flood (MPF)” were sometimes used. In 1956 this terminology was changed to probable maximum precipitation (PMP) and probable maximum flood (PMF) to recognize the uncertainties in the precipitation and runoff estimates, and that the worst combination of events was not assumed when translating rainfall into runoff [ASCE, 1988; Tomlinson & Kappel, 2009]. PMP was viewed as an estimate as there remain unknowns and unmeasured atmospheric parameters that are important to extreme rain storms [NRC, 1985]. Similarly, the PMF is less than the maximum possible flood to the extent that the combinations of natural factors assumed in the determination are less than a theoretical maximum, and the reduction tends to vary depending on the person performing the analysis and/or agency or company policy [ASCE, 1988].
Between 1963 and 1984, a series of Hydrometeorological Reports (HMR) were subsequently developed for the Continental United States by the U.S. Weather Bureau, now the National Weather Service (NWS). The oldest of these reports is HMR 39 prepared for Hawaii in 1963. The most recent is HMR 59 for California which was updated in 1999. Figure 3.2 illustrates the coverage of the HMR studies.
Figure 3.2 Hydrometeorological Reports prepared by the NWS for the Continental United States
[NOAA, 2011]

July 2012 3-7
Summary of Existing Guidelines for Hydrologic Safety of Dams
Most of the HMRs use analyses of individual storm depth-area-duration rainfall patterns to evaluate spatial and temporal rainfall distributions and include a multiplication factor to address orographic effects. HMR 51, which covers the eastern two-thirds of the U.S., does not include any orographic adjustments but identifies two “stippled regions” in which the authors of the HMRs acknowledged that terrain effects were not evaluated and suggest that future NWS studies examine these regions more closely.
PMP estimates developed using HMRs and site specific studies in conjunction with watershed models to compute flood runoff, have been widely accepted as the basis for design of spillways for dams where failure of the structure by overtopping cannot be tolerated, and has resulted in progressively more conservative design requirements for spillways. The adoption of this standard has raised difficult questions as to what should be done with existing dams constructed before this standard where the spillways do not satisfy this criterion.
Site specific PMP studies have also been performed by private contractors recognizing the fact that the published HMRs provide generalized rainfall values that are not basin-specific and tend to represent the largest PMP values across broad regions. Many recent site-specific studies have produced PMP values significantly different from the HMR values. Reasons for the differences (mostly reductions) are attributed to using basin characteristics that are specific to the topography and local climate of the watershed being studied, new storm data like NWS NEXRAD, improved analysis procedures, and technology advances such as new computer models, weather radar, and geographic information system (GIS) software to analyze depth-area-duration tables. Site specific PMP study values are generally 5 to 15 percent lower than values from the published HMRs, although some studies have shown minimal reductions. The largest PMP reductions from site specific studies have been for long duration storms for large drainage areas, and have been greater than 50 percent lower [Tomlinson & Kappel, 2009; Applied Weather Associates, 2008].
Statewide studies of extreme storm events have also been performed in an effort to support risk-based design criteria for spillways. The states of Washington, Montana, California and Wisconsin have authorized statewide studies. For example, beginning in 1981, the state of Washington began collecting and analyzing data to define the characteristics of extreme storms for use in developing risk-based criteria for spillway design. This work was led by Dr. Mel Shaefer and resulted in the publication of “Technical Note 3” in 1993 which provided engineering guidance for developing design storms for use in computing IDFs using rainfall-runoff computer models. This document was updated in 2009 using more than 700 precipitation gages and high resolution mapping techniques within a GIS framework, and includes probabilistic based procedures for generating precipitation magnitude-frequency relationships for any location within the state [MGS Engineering Consultants, 2009].
In a letter dated June 1, 1984 to the NRC Committee on Safety Criteria for Dams, the NWS provided some additional information regarding the extensive material on PMP estimates and

3-8 July 2012
Federal Emergency Management Agency
techniques that they developed to provide the basis for the most conservative criteria for spillway design. The following is extracted from their letter to the NRC Committee:
“Theoretically the PMP has zero probability of actual occurrence. A report (Riedel, J. T., and Shreiner, L. C. 1980) compares the greatest known storm rainfall depths with generalized PMP estimates for the United States east of the 105th meridian and west of the Continental Divide. This was done for rainfall depths averaged over six area sizes (10, 200, 1,000, 5,000, 10,000, and 20,000 mi2) each for durations (6, 12, 24, 48 and 72 hours) covering the eastern United States. A similar comparison was made for the western United States, but with fewer combinations. A summary of the results is presented in [Table 3-1].”
Another comparison shows that for the eastern and western United States there were 170 and 66 separate storms that occurred from 1819 to 1979 which had depths exceeding 50% of PMP for at least one area size and duration, respectively. Riedel and Schreiner also pointed out that the greatest rainfall amount in a storm may not have been observed and documented, especially in the west. In a few recorded storms, total rainfall amounts have exceeded 100% of the PMP. These include the Smethport, PA storm of July 17-18, 1942 in which 30.8 inches of rain fell in 4.5 hours, and the Cherry Creek, CO storm of May 30-31, 1935 where 24 inches of rain was observed in a period of less than 6 hours [Huffman, 1999].
Table 3-1 Comparison of Greatest Known Storm Rainfall Depths with Generalized
PMP Estimates within the United States [Riedel & Shreiner, 1980]
Location Number of Storms Exceeding Various Percentages of PMP
70% 80% 90%
East of the 105th Meridian 160 49 4
West of the Continental Divide 16 5 0
3.7. Risk-Informed Decision Making Period (2000-Present) Although the period of time beginning in 2000 can be considered the period of risk-informed decision making, several advances and publications prior to 2000 paved the way for the introduction of risk into SDF selection. The earliest reference to using risk-based analyses to determine the SDF appears to be in a 1964 manual prepared by the American Water Works Association (AWWA) titled: Manual M13 – Spillway Design Practice. The AWWA guidelines presented in this manual stress that for water supply dams, “the selection of a spillway capacity less than the maximum probable flood is a very serious decision for the designer and for management,” and recommends the use of a “thorough cost study to evaluate the variable costs of (1) repairs to the dam and spillway, (2) lost water during periods of repairs, (3) damages caused by insufficient

July 2012 3-9
Summary of Existing Guidelines for Hydrologic Safety of Dams
spillway, and (4) construction of spillways of specific capacity” [AWWA, 1964]. Although the concepts of risk, flood probability, and consequences are discussed in the manual, procedures for performing a formal risk analysis and establishing decision criteria are not addressed in Manual M13. The AWWA guidelines indicate that this type of cost analysis is largely subjective and almost entirely a matter of judgment.
In 1973, an ASCE Task Committee on the Reevaluation of the Adequacy of Spillways of Existing Dams published a report in the Journal of the Hydraulics Division [ASCE, 1973]. In the report, the Task Committee advocated “risk taking” in spillway capacity design and recommended that spillway capacities for new and existing dams of all sizes be based on a thorough economic analysis of the “social cost of risks and the cost of modification” computed on an average annual basis. An evaluated level of risk at which the total of all social costs will be at a minimum was proposed. The Task Committee recommended use of a monetary value for human life and injury in the analysis based on practices of courts in awarding damages in cases involving accidental deaths and injury. The ASCE Task Committee’s report generated much controversy and their recommended approach was viewed as a “radical departure” from accepted standards [Williams, 1973]. The recommendation to place a monetary value on human life and suffering in the economic analysis was ultimately not accepted by the engineering profession or by regulatory agencies. Other factors contributing to the lack of interest for the recommended approach included the need to select an interest rate for the analysis of equivalent present-day costs, and the problem of assigning probabilities for extreme flood events.
From the time the ASCE Task Committee on the Reevaluation of the Adequacy of Spillways of Existing Dams published their report in 1973 through the present, there has been much discussion, debate and controversy on the use of risk-based analyses for dams. Between 1979 and 2000, several studies and guidelines on selecting acceptable flood capacity for dams were published by various individuals and agencies including the following:
1979 – Federal Guidelines for Dam Safety, FEMA ad hoc ICODS (Reprinted 2004) 1985 – Flood and Earthquake Criteria, NRC Committee on Safety Criteria for Dams 1986 – Federal Guidelines for Selecting and Accommodating Inflow Design Floods
for Dams, FEMA (ICODS) 1988 – Evaluation Procedures for Hydrologic Safety of Dams, ASCE Task Committee
on Spillway Design Flood Selection 1996 – Dam Safety Policy for Spillway Design Floods, Dubler, James & Neil S. Grigg 1998 – Selecting and Accommodating Inflow Design Floods for Dams, FEMA Federal
Guidelines for Dam Safety (Reprinted 2004)
Summaries of each of these documents as well as the aforementioned AWWA manual and the ASCE Task Committee report as they relate to spillway flood design criteria are presented in Chapter 4. Each of the documents listed above make reference to the use of risk-based analyses for selection of SDFs for dams. Most of these documents provide general guidelines and discussions

3-10 July 2012
Federal Emergency Management Agency
on the issues involved in the decision analysis procedures. None of the documents provide risk tolerance criteria for making a final safety design decision.
The U.S. Bureau of Reclamation (Reclamation) appears to be the first agency to seriously apply risk-based decision making to dam safety and have emerged as world leaders in this approach. Beginning around 1995, Reclamation adopted the use of risk analysis as the primary support for their dam safety decision-making and have developed several important publications related to risk analysis including the following:
1998 – Implementation of Risk Analysis Principles into the Bureau of Reclamation’s Dam Safety Program Actions
1999 – A Framework for Characterizing Extreme Floods for Dam Safety Risk Assessment
2000 – Risk Based Profiling System 2003 – Guidelines for Achieving Public Protection in Dam Safety Decision-making 2006 – Guidelines for Evaluating Hydrologic Hazards 2010 – Dam Safety Risk Analysis Best Practices Training Manual
Reclamation has devoted significant resources to the development of risk-based hydrologic hazard methods and guidelines related to extreme rainfall probabilities. A framework for the characterization of extreme flood events has also been developed which considers various types of flood estimation procedures ranging from paleoflood hydrology to regional precipitation frequency with L-Moments. The resultant reports and guidelines created by Reclamation facilitate the incorporation of hydrologic data in risk analysis.
In 2003, because of the growing interest in the use of risk assessment methods for dam safety, the USSD published a white paper titled “Dam Safety Risk Assessment: What Is It?, Who Is Using It and Why?, Where Should We Be Going With It?” [USSD, 2003]. The paper represented a consensus position of a diverse group of USSD members and other dam safety professionals at that time. The overall purpose of the paper was to assess the state-of-the-practice in dam safety risk assessment, and to provide commentary on appropriate types of applications and ways to facilitate and strengthen its use [USSD, 2003].
The USSD paper identified and described four risk assessment application categories: (1) Failure Modes Identification; (2) Index Prioritization; (3) Portfolio Risk Assessment; and (4) Quantitative Risk Assessment. Of the four risk assessment application categories, only the Quantitative Risk Assessment approach has been used as an analytical method to help select acceptable spillway design capacity for dams. The other three methods have been used primarily as a means of identifying dam deficiencies and prioritizing their repair or resolution. The USSD white paper emphasizes that limitations must be fully considered and that risk assessment approaches should be used only as a supplement and not as a replacement for the traditional approach. The USSD white paper concluded that this “risk-enhanced” approach provides a way for the benefits of improved

July 2012 3-11
Summary of Existing Guidelines for Hydrologic Safety of Dams
understanding and management of dam safety risks to be realized, while maintaining a reference to established practice [Bowles et al, 2003].
Another leader in the forefront of risk-based methods is the U.S. Army Corps of Engineers (USACE). In the 1990s, USACE held workshops and invested research to evaluate risk analysis frameworks and began publishing regulations and documents supporting the use of risk analysis including the following:
1996 – Risk Analysis for Dam Safety Evaluation: Hydrologic Risk 1996 – Risk-Based Analysis for Flood Damage Reduction Studies, EM 1110-2-1619 1997 – Dam Safety Assurance Program, Regulation No. 1110-2-1155 2001 – Hydrologic Research Needs for Dam Safety 2003 – Application of Paleohydrology to Corps Flood Frequency Analysis 2007 – Updated Principles for Risk Analysis 2007 – Draft Inflow Hydrographs Toolbox 2007 – Interim Risk Reduction Measures for Dam Safety 2009 – Interim Tolerable Risk Guidelines for US Army Corps of Engineers Dams 2010 – Safety of Dams – Policy and Procedures, ER 1110-2-1156 (DRAFT)
In 1997, USACE replaced the PMF standard with an incremental procedure to provide a framework for evaluating the benefits of mitigating hazards presented by hydrologic deficiencies in high hazard situations, as described in their Dam Safety Assurance Program, Regulation No. 1110-2-1155 [USACE, 1997]. The PMF standard was replaced because it did not provide analysis of the benefits versus costs of design as compared to a lesser flood and recognition of the fact that the PMF design does not result in zero risk [Eiker et al, 1998]. The new USACE policy was a compromise between the desire to provide a risk-based analysis of the benefits gained from mitigating the hazard and the traditional approach of requiring a design that is capable of safely passing the PMF.
The incremental procedure required by the 1997 USACE policy included two phases. Phase I was used to determine the Base Safety Conditions (BSC) as follows:
“…. A comparative hazard analysis in which the threshold flood (TF) and the BSC are established. The TF is the flood that fully utilizes the existing dam, i.e., the flood that just exceeds the design maximum water surface elevation at the dam (top of dam minus freeboard). The BSC is determined by comparing the loss of life for various floods, expressed as percentages of the PMF, with and without dam failure. PMF is determined in accordance with standard Hydrometeorological procedures. The flood, expressed as a percentage of PMF for which loss of life is not different for with and without dam failure conditions, is the BSC, but should never be more than 100% of the PMF” [USACE, 1997].
Phase II was the risk-cost analysis required if modifications for a flood greater than the BSC were recommended. An important aspect of the new USACE policy was the focus on loss of life as the
3-12 July 2012
Federal Emergency Management Agency
criteria for determining the BSC in the incremental analysis. Economic damage was not considered.
Although the USACE’s incremental analysis represented a significant advance in developing an IDF for dam design, it was recognized by the USACE that it did not provide a means for comparing the benefits and costs to mitigate spillway capacity deficiencies within their portfolio of dams. Given the limitations on annual funding available for mitigating dam deficiencies, the USACE subsequently adopted the use of Risk Assessment to provide decision variables that relate the hazard and remediate measures for a particular dam deficiency to other dams. This approach was pursued as it allowed decision makers to develop a ranking system for prioritizing the implementation of the remediation measures. The remediation of the hazard would then depend on the ranking and funding available for implementing the remediation measure [Eiker et al, 1998].
The USACE later began working closely with Reclamation, the Federal Energy Regulatory Commission (FERC), and the Tennessee Valley Authority (TVA) to develop a common dam safety risk management framework and policies for its portfolio of dams that includes tolerable risk guidelines. In 2010, the USACE published a draft form of ER 1110-2-1156; Safety of Dams – Policy and Procedures. This document prescribes the guiding principles, policy, organization, responsibilities, and procedures for implementation of risk-informed dam safety program activities and a dam safety portfolio risk management process within the USACE and represents a significant paradigm shift. As explained in the Guidelines on Risk Assessment prepared by the Australian National Committee on Large Dams (ANCOLD) in 2003,
“The USACE is moving from a solely standards-based approach for its dam safety program to a dam safety portfolio risk management approach. The standards-based or essential guidelines approach is included in the risk-informed approach to the dam safety program and dam safety program decisions will now be risk-informed. One of the bases for a risk-informed decision, and prioritization of the work, is a consideration of the achievement of tolerable risk guidelines following implementation of risk reduction measures. In addition, it should be recognized that other non-quantitative factors will influence practical decision making for the dam safety program. “There was previously a view in some quarters that risk assessment was a means to justify less costly safety upgrades of dams than those required by the traditional approach. It is now recognized that such a view seriously misunderstands the true aim of risk assessment, which is more informed decision-making than would be possible from reliance on the traditional approach alone. It may be that the additional understanding that comes from the risk assessment process, will reveal that a less costly solution to a dam safety problem could be justified, though a decision that way should be made with great care and having regard to all of the community risk and business risk considerations. But it could as easily be the case that risk assessment shows that a more stringent safety level, and thus a more costly solution, ought to be implemented.”

July 2012 3-13
Summary of Existing Guidelines for Hydrologic Safety of Dams
The USACE’s tolerable risk guidelines are based on an adaptation of the 2003 Reclamation guidelines, the risk evaluation guidelines published by the Australian National Committee on Large Dams [ANCOLD, 2003], and adaptations of the ANCOLD guidance implemented by the New South Wales Government Dam Safety Committee (NSW DSC) Risk Management Policy Framework for Dam Safety [NSW DSC, 2006]. According to the Tolerable Risk Guidelines, a dam is considered to be “Adequately Safe” (DSAC Class V) when residual risk is considered tolerable and meets all essential USACE guidelines with no dam safety issues. A summary of these guidelines is included in Chapter 8.
For determining the probability associated with the PMF and lesser events, the current interim USACE procedure is to perform statistical smoothing as described in EM 1110-2-1415 Hydrologic Frequency Analysis and the Draft Inflow Hydrographs Toolbox [USACE, 2007]. The PMF is assigned a probability of 1 in 10,000 (0.0001) per year.
Today, many professionals consider risk assessment to be a useful way to provide dam safety as it requires dam owners to investigate failure modes in detail and understand where the greatest risks lie. However, the main drawback of this approach is that it is technically challenging, time-consuming, and difficult to administer. Because of this, the traditional standards based approach is generally still adopted by the states. Note that the federal agencies who have led the way in developing risk analysis procedures and tolerances are owners of a significant number of dams. The administrative processes and reviews of regulatory agencies, such as FERC and most of the states, differ significant from that of dam owners like USACE and Reclamation. The application of quantitative risk analysis for dam design by regulatory agencies may be burdensome or even unnecessary. The state dam regulatory agencies of California, Washington and Montana have recently developed risk-based indices to determine acceptable flood capacity; however, none of the states use quantitative risk assessment.

3-14 July 2012
Federal Emergency Management Agency

July 2012 4-1
Summary of Existing Guidelines for Hydrologic Safety of Dams
4. Origins of Dam Safety Design Guidelines 4.1. Overview Chapter 3 presented a history of SDF selection for dams in the United States without regard for the actual regulatory framework. That chapter described the state of the practice as far as methodology used to evaluate SDFs. Chapter 4 focuses on the application of the methodology in formal guidelines within the United States.
4.2. General Standard of Practice Prior to 1950 Prior to approximately 1950, hydrologic design standards for dams were based mainly on judgment and experience. In general, the probable maximum flood, as best determined at that time, was generally accepted as the standard for dams where the consequences of failure required the greatest conservatism. Pennsylvania enacted the first known dam safety legislation in the United States in 1913, and California’s Division of Safety of Dams was created in 1929. Both states were prompted to action by catastrophic dam failures that occurred in their respective states. A U.S. Committee on Large Dams (USCOLD) survey on practices and regulations within the United States found that as of 1964, a fourth of the states exercised no supervision over dams at all, and a third exercised no responsibility over operation and maintenance of a dam once it was constructed. USCOLD then organized a committee to draft a model law to be considered by states for enactment. In 1968, the committee completed a proposed law that was modeled after the 1929 California law [Golze, 1973].
4.3. ASCE Task Force on Spillway Design Floods (1955) The first organized effort to document SDF policy and criteria in the United States appears to have occurred in June 1955 when the first ASCE Task Force on Spillway Design Floods was organized. This committee attempted to formulate a questionnaire for submission to government agencies, utilities, private engineering firms, and technical groups with an interest in dam design in order to review and summarize existing spillway design policy and criteria. The task force was unsuccessful in developing a questionnaire and collecting the data; however, they developed the following three classifications of spillway requirements for dams [ASCE, 1988]:
Class 1: Dams where failure cannot be tolerated Class 2: Dams where failure would result in serious economic loss Class 3: Dams where structural failure would result in minor damage
The task force’s final report was presented in four papers in a symposium on the Hydrology of Spillway Design on May 16, 1962 as part of the first ASCE Water Resources Engineering Conference. The papers were published in the Journal of the Hydraulics Division in May 1964 and summarized the existing practice for designing new dams. With respect to Class 1 dams, Mr. Franklin Snyder, a member of the task force, made the following statement:

4-2 July 2012
Federal Emergency Management Agency
“For large major structures that would be subject to possible failure if the selected capacity were exceeded, there would be few instances, if any, where anything less than the provision for the probable maximum flood can be justified” [Snyder, 1964].
Snyder also published a dam classification and suggested the matrix as presented in Table 4-1 be used to select the minimum SDF. It is interesting to note that Snyder’s suggested classification matrix closely resembles the current classification criteria used by many states (See Chapter 9).
Table 4-1 Snyder’s Classification of Dams [Snyder, 1964]
Failure Category
Danger Potential Damage Potential SDF Storage
(Acre-Feet) Height (Feet) Loss of Life Damage
Minor <1,000 <50 None Cost of Dam 50-100 Year
Intermediate 1,000 – 50,000 40 to 100 Possible/small Within Capacity of Owner SPF(1)
Intolerable >50,000 >60 Considerable Excessive PMF
(1) The SPF is the Standard Project Flood which is the most severe storm “reasonably characteristic” of the
region.
4.4. AWWA Spillway Design Practice – Manual M13 (1964) In 1964, the AWWA published Manual M13 – Spillway Design Practice. The manual was intended to be a general reference for engineers in the water utility practice, and provides procedures for selecting SDFs for dams constructed on drainage areas less than 1,000 square miles. The guidelines stress that for water supply dams, “the selection of a spillway capacity less than the maximum probable flood is a very serious decision for the designer and for management” and recommends the use of a “thorough cost study to evaluate the variable costs of (1) repairs to the dam and spillway, (2) lost water during periods of repairs, (3) damages caused by insufficient spillway, and (4) construction of spillways of specific capacity” [AWWA, 1964]. The manual goes on to state that this type of cost analysis is largely subjective and almost entirely a matter of judgment.
As shown in Table 4-2, the AWWA manual presents three classifications of dams based on possible damages from overtopping to select the SDF. It is interesting to note that the AWWA criteria include an assessment of the anticipated damage to the dam following overtopping. The guidelines note that for smaller watersheds, the peak discharge computed from PMP may be ten or more times the maximum observed peak streamflow. In addition to the SDF requirements shown in Table 4-2, the AWWA indicated that “even under the most advantageous circumstances, the total freeboard above the maximum water level in the reservoir should not be less than 3-5 feet” [AWWA, 1964].

July 2012 4-3
Summary of Existing Guidelines for Hydrologic Safety of Dams
Table 4-2 Summary of 1964 AWWA Spillway Design Flood Guidelines [AWWA, 1964]
Possible Damages from Overtopping Spillway Design Flood
Destruction of dam and catastrophic losses at downstream urban areas
Probable maximum precipitation (PMP) on very wet ground
Moderate damage to dam and little loss at downstream urban areas
Greatest known storm on another watershed that can be transposed to the study watershed
Minor damage to dam or other structures and no losses possible downstream
Storm obtained by applying a reduction factor to the probable maximum precipitation, or frequency studies to past floods
4.5. USCOLD Workgroup on Criteria and Practices Utilized in Determining the Required Capacity of Spillways (1970)
In 1967, a USCOLD workgroup was formed to compile information and to prepare a report regarding criteria and practices used in the United States for determining the required capacity of spillways. The national survey titled “Criteria and Practices Utilized in Determining the Required Capacity of Spillways” was published in 1970. The workgroup surveyed the USACE, Reclamation, TVA, Soil Conservation Service, state agencies, investor-owned utility companies and private engineering firms using a questionnaire. Only two state agencies (Pennsylvania and California) were surveyed. The final report summarized spillway requirements or “standards” for new dams for four hazard categories.
The workgroup indicated that all respondents stated that their current policies were consistent with the following statements:
“… The policy of deliberately accepting a recognizable major risk in the design of a high dam simply to reduce the cost of the structure has been generally discredited from the ethical and public welfare standpoint, if the results of a failure would imperil the lives and lifesavings of the populace of the downstream floodplain. Legal and financial capability to compensate for economic losses associated with major dam failures are generally considered as inadequate justifications for accepting such risks, particularly when severe hazards to life are involved. Accordingly, it is the policy of this agency that high dams impounding large volumes of water be designed to conform with Security Standard 1” (design the dam and spillway large enough to assure that the dam will not be overtopped by floods up to the probable maximum) [USCOLD, 1970].
The workgroup also compared current (1970) criteria with past criteria and policies and concluded:
“The policies which are now generally accepted are not radically different from those followed 20 or more years ago by the responding organizations, even though procedures and techniques have been changed and improved and have been adopted rather uniformly as they have been developed. Accordingly, differences that do exist result largely from variations in interpretation of the policies, some differences in analytical technique, and designer’s judgment” [USCOLD, 1970].
4-4 July 2012
Federal Emergency Management Agency
The USCOLD report also provided a general summary of freeboard criteria and starting reservoir levels assumed in the SDF analyses, and identified erosion of spillway channels that could lead to breaching the spillway or eroding the toe of embankment dams as a common design concern.
4.6. National Dam Inspection Act, PL 92-367 and USACE Guidelines for Existing Dams (1972)
In the early 1970s a series of dam safety incidents occurred resulting in significant loss of life including the failure of Buffalo Creek Dam (West Virginia) in February 1972 and Canyon Lake Dam (South Dakota) in June 1972. In June of 1972, severe flooding caused by Hurricane Agnes endangered many dams. Large areas in Pennsylvania and New York experienced rainfall rates that were within 90 percent of PMP values [Riedel, 1973]. The Black Hills, South Dakota storm of June 1972 resulted in rainfalls that were 75 percent of the PMP [Riedel, 1973]. Following these events, the Congress enacted the National Dam Inspection Act (PL 92-367) and it became law on August 8, 1972. At that time many states did not have laws regarding dam safety and often did not require a review of the dam design prior to construction or require construction inspection or post-construction inspection. It was also found that dam safety in most states was inadequate with a wide variation of practices, regulations and capabilities of all agencies supervising dam safety. There was also little or no overall coordination of dam safety efforts.
Dams subject to PL 92-367 were those having a height 25 feet or greater, or a maximum impounding capacity greater than 50-acre-feet. Dams less than six feet high or storing less than 15 acre-feet were excluded. Congress charged the USACE with implementing the provisions of the Act. In addition to carrying out a national program of inspection of dams for the purpose of protecting human life and property, the act also required: (1) an inventory of all dams located in the United States; (2) a review of each inspection made; and (3) recommendations for a comprehensive national program for the inspection and regulation of dams, and the respective responsibilities which should be assumed by Federal, State, and local governments and by public and private interests.
Because of the scale of the program, the USACE developed a classification system to screen the adequacy of spillway capacity. The selected classification system used the dam size based on dam height and impoundment volume as shown in Table 4-3, and the hazard potential based on loss of life and economic loss as presented in Table 4-4. Table 4-5 presents the USACE’s recommended SDF based on the Hazard and Size classification. A comparison of the criteria in the Tables 4-3 through 4-5 with that proposed by Snyder in 1964 in Table 4-1 shows remarkable similarities.
Where a range of SDF is indicated, the USACE guidelines specify that the magnitude that most closely relates to the involved risk should be selected. The use of partial PMF values are not discussed. For “Significant Hazard” dams, no more than six single-family type inhabitable structures were permitted in the downstream and upstream inundation zones, and consideration was

July 2012 4-5
Summary of Existing Guidelines for Hydrologic Safety of Dams
to be given to probable future development in order to select a conservative but realistic category [Hagen, 1973]. The original USACE guidelines also contained freeboard criteria, but these were deleted from the final guidance documents. The decision on freeboard allowance for each project was left to the inspection team [Hagen, 1973]. The USACE guidelines were reported to be based on a professional consensus [Dubler, 1995].
Table 4-3 USACE Dam Classification [USACE, 1979]
Category Impoundment
Storage (Acre-Feet)
Height (Feet)
Small <1,000 and 50 <40 and 25
Intermediate 1,000 and < 50,000 40 and <100
Large 50,000 100
Table 4-4 USACE Hazard Potential [USACE, 1979]
Category Loss of Life (Extent of Development)
Economic Loss (Extent of Development)
Low None expected Minimal
Significant Few Appreciable
High More than a few Excessive
Table 4-5 USACE Hydrologic Evaluation Guidelines Recommended Spillway Design Floods [USACE, 1979]
Hazard Potential Size Spillway Design Flood
(SDF)
Low
Small
Intermediate
Large
50 to 100-Year Flood
100-Year to ½ PMF
PMF
Significant
Small
Intermediate
Large
100-year to PMF
½ PMF to PMF
PMF
High
Small
Intermediate
Large
½ PMF to PMF
PMF
PMF
In developing the spillway capacity guidelines, the USACE made a distinction between new and existing dams and emphasized that the proposed guidelines were intended for existing dams. As stated in a discussion paper presented by the USACE, the “analysis of hydrologic and hydraulic
4-6 July 2012
Federal Emergency Management Agency
competency of existing structures should not be as rigorous as the design requirements for new dams. Costs associated with extra conservatism in a new project are almost always a small fraction of the cost required to modify an existing structure” [Hagen, 1973].
4.7. ASCE Task Committee on the Reevaluation of the Adequacy of Spillways of Existing Dams (1973)
In 1973, following four years of study, the ASCE Task Committee on the Reevaluation of the Adequacy of Spillways of Existing Dams published their report in the Journal of the Hydraulics Division [ASCE, 1973]. In the report, the Task Committee advocated “risk taking” in spillway capacity design and recommended that spillway capacities for new and existing dams of all sizes be based on a thorough economic analysis of the “social cost of risks and the cost of modification” computed on an average annual basis. An evaluated level of risk at which the total of all social costs will be at a minimum was proposed. The Task Committee recommended use of a monetary value for human life and injury in the analysis. Mr. Bob Buehler, Chief of the Flood Control Branch of the TVA and member of the committee, subsequently published a paper on “The Monetary Value of Life and Health” [Buehler, 1973]. Values assigned by Mr. Buehler in an example economic analysis presented in a paper titled Reevaluation Spillway Adequacy of Existing Dams showed values of $150,000, $200,000, and $10,000 for deaths, disabling injuries, and non-disabling injuries, respectively [Buehler, 1973].
Assigning a probability to extreme floods was a concern expressed by engineers reviewing the report. For expediency, the ASCE Task Committee’s solution to the problem of assigning probability to extreme events was to arbitrarily assign an average return interval of 10,000 years to the PMF. This was considered by the committee to be a conservatively low return period, yet high enough to accomplish the purposes of the analysis process. Assigning a 10,000-year probability to the PMF at that time was suggested and supported by others as well [Beard, 1973]. With the upper extreme fixed arbitrarily at 10,000 years and the lower extreme defined by observed data, a curve on probability paper provided probabilities for all in-between floods.
An interesting and intriguing argument presented by the committee, and demonstrated with analysis examples, was that risk costs can increase as additional dam safety is provided, since improved safety is often provided by raising the dam and/or increasing spillway capacity with a resulting increase in downstream flood flow. The economic analysis approach was recommended to avoid mistakes where circumstances exist in which modification to reduce failure probability would increase rather than decrease potential average annual losses, and that “modification with good intent to increase safety would be an incorrect move” [Buehler, 1973].
The ASCE Task Committee’s report generated much controversy and 13 published discussions which was said to be a record number. The discussions were equally divided in favor and against the proposed approach [Buehler, 1973]. The recommendation to place a monetary value on human life and suffering in the economic analysis was ultimately not accepted by the engineering
July 2012 4-7
Summary of Existing Guidelines for Hydrologic Safety of Dams
profession or by regulatory agencies. The approach was viewed as a “radical departure” from accepted standards [Williams, 1973]. For dams where loss of life was not expected, the risk-based economic analysis proposed by the ASCE Task Committee was supported by the Bureau of Reclamation with the provision that the public be kept aware of the possibility of failure, that a land use plan be enforced that ensured the minimum hazard to life, and that a periodic re-examination must be scheduled and made to verify that the downstream hazard and damage assumptions continue to be valid [Bertle, 1973]. The economic analysis proposed by the ASCE Task Committee was also viewed as impractical for smaller dam projects as the cost to perform the analysis could approach the cost of the structural modifications [Williams, 1973].
4.8. FEMA ad hoc ICODS – Federal Guidelines for Dam Safety (1979, Reprinted 2004)
In 1979, the ad hoc Interagency Committee on Dam Safety (ICODS) issued “Federal Guidelines for Dam Safety.” This document provided the first guidelines for federal agency dam owners and dam owners regulated by federal agencies. As stated in the preface:
“These guidelines apply to Federal practices for dams with a direct Federal interest and are not intended to supplant or otherwise conflict with State or local government responsibilities for safety of dams under their jurisdiction.”
For flood selection for design or evaluation, the federal guidelines supported the use of risk analysis, and stated:
“The selection of the design flood should be based on an evaluation of the relative risks and consequences of flooding, under both present and future conditions. Higher risks may have to be accepted for some existing structures because of irreconcilable conditions” [FEMA, 1979].
The guidelines were clear, however, that the spillway design standard to be adopted for dams where loss of life or major property damage could be significant was the PMF. The following statement concerning selection of the flood for design for spillways is in the 1979 guidelines:
“When flooding could cause significant hazards to life or major property damage, the flood selected for design should have virtually no chance of being exceeded. If lesser hazards are involved, a smaller flood may be selected for design. However, all dams should be designed to withstand a relatively large flood without failure even when there is apparently no downstream hazard involved under present conditions of development” [FEMA, 1979].
For existing dams, “risk-based analyses should be considered in establishing priorities for examining and rehabilitating the dams, or for improving their safety” [FEMA, 1979]. The guidelines did not provide a specific framework for classifying dams or for assigning SDFs using risk-based analyses.

4-8 July 2012
Federal Emergency Management Agency
4.9. National Research Council Committee on Safety Criteria for Dams, Safety of Dams – Flood and Earthquake Criteria (1985)
In response to a request by the Assistant Secretary of the Interior for Water and Science and the Assistant Secretary of the Army for Civil Works, the National Research Council (NRC) established an ad hoc Committee on Safety Criteria for Dams to prepare an inventory of currently used criteria for dams relating to safety from hazards of extreme floods and earthquakes, and to identify and evaluate alternative criteria for safety of federal dams. The committee was made up of experts in risk assessment, regulation of dams, law, science, and engineering. A comprehensive survey of design criteria in use for dams relative to hazards of extreme floods was performed for 35 states, 10 federal agencies, four technical societies (ASCE, ICOLD, and USCOLD), nine firms, and one foreign country (England).
The following key findings were made by the Committee as they relate to selecting spillway inflows for dams:
• Current dam practices reflect a great variety of standards used to classify dams relative to hazards and in the criteria for evaluation of safety from extreme floods.
• While simple hazard rating categories based on downstream development may be useful for identifying dams for high-priority safety evaluation and study, they do not reflect the potential for incremental loss of life and damage caused by failure of a dam due to an inadequate spillway when a river is already in flood.
• More uniformity is needed among the several federal and state agencies establishing size and hazard definitions and correlative design standards.
• New concepts and improved methods for estimating floods have resulted in generally larger flood estimates and future estimates of magnitude for extreme floods can be expected to increase. However, unless the runoff characteristics of the watershed were to change, increments in future flood estimates should be less than those noted in the past. There have been instances where more intensive hydrometeorological studies have resulted in reductions in estimates of PMP by earlier investigations.
• A dam designed for the PMF using the PMP does not provide absolute assurance that the dam is safe for every possible flood.
• The federal government has become increasingly involved in risk management issues and a number of federal agencies have developed various risk management standards, but these are not applicable to risk management for dams. Adaptation of these concepts to dam safety requires research.
• Court decisions relating to dam failures in general have held the owner liable for the damages resulting from a failure.
July 2012 4-9
Summary of Existing Guidelines for Hydrologic Safety of Dams
The Committee made the following recommendations:
• To the extent practicable, reservoir safety evaluations should strike a balance among project benefits, construction costs, social costs, and public safety. Currently available technology does not permit this balancing with full confidence in the results.
• Safety evaluation standards for existing dams and new dams do not need to be the same.
• The use of PMFs based on estimated PMP as the general design standard for new high-hazard dams should be continued. Instances may be encountered where a lower standard may be justified if failure of a dam during floods of PMF magnitude would cause no significant increase in potential loss of life or property damage.
• For existing high-hazard dams, the adopted SDF should take into account estimated flood probabilities, expected project performance, and incremental damages that would result from dam failure for a range of floods up to and including the PMF.
• In the design of new dams and spillways when design alternatives of approximately equal cost are available, a selection among these alternatives should give consideration to potential future needs for increased safety against floods.
• Periodic reviews of hazard determinations and safety decisions for all dams should be required, especially when safety evaluations are based on criteria less conservative than the PMF.
• As advances occur in hydrology, meteorology, and the relevant databases, and as changes are noted in public attitudes toward risk, federal agencies should periodically undertake a review of dam safety practices and standards by an independent body representing the professions involved in engineering for dams and experts from other relevant disciplines.
For new high-hazard dams, the Committee recommended the PMF be adopted for the SDF unless risk analyses that examine the incremental impact of overtopping and dam failure during an extraordinary flood demonstrate that little or nothing is gained by such a high standard. The SDF would be the smallest value that ensures that a dam breach results in no significant increase in potential for loss of life or major property damage.
For existing high-hazard dams, the Committee concluded that there was no universally satisfactory approach to establishing spillway capacity criteria. The Committee therefore recommended that risk-based analysis be considered for existing high-hazard dams “for which the PMF is not required.” A section describing risk-based analyses was included in the report.
No specific recommendations were made by the Committee for spillway design requirements for intermediate hazard and low hazard dams.
4.10. FEMA (ICODS) – Federal Guidelines for Selecting and Accommodating Inflow Design Floods for Dams (1986)
This publication was prepared by an ICODS working group on inflow design floods to supplement the FEMA Federal Guidelines for Dam Safety which was published in 1979. The primary purpose
4-10 July 2012
Federal Emergency Management Agency
of the document was to provide general guidelines on procedures for selecting and accommodating inflow design floods for use by federal agencies in developing agency criteria and to ensure more nationwide uniformity in application. The guidelines apply to both proposed and existing dams.
For existing and proposed dams where failure is expected to result in loss of life or extensive property damage, the guidelines specified using the PMF as the IDF. The evaluation dam failure impacts are based on both existing and future conditions. Key statements made in the guidelines with respect to evaluating dam failure impacts and selection of the IDF follow:
“The PMF should be adopted as the IDF in those situations where consequences attributable to dam failure from overtopping are unacceptable. The determination of unacceptability exists when the area affected is evaluated and factors indicate loss of human life, extensive property and environmental damage, or serious social impact may be expected as a result of dam failure” [FEMA, 1986]. “Dams and their appurtenant structures should be designed to give satisfactory performance and to practically eliminate the probability of failure” [FEMA 1986]. “The presence of public facilities within the potential area inundated by dam failure that would attract people on a temporary basis (e.g., campgrounds, State or National parks, etc.) requires special consideration” [FEMA, 1986]. “The presence of an emergency action plan and/or a warning system should not be substituted for safe design practice or for use in reducing the potential for loss of life in the analysis for selecting the IDF” [FEMA, 1986]. “Re-evaluation of an existing dam with respect to selecting and accommodating the IDF should normally be based on the same basic guidelines as for proposed dams” [FEMA, 1986].
The guidelines make a specific distinction between service, auxiliary, and emergency spillways. For the design of auxiliary and emergency spillways, infrequent limited damage during passage of the IDF is acceptable provided the damage does not endanger the dam or usefulness of the service spillway and the control section of the spillway is not degraded to the extent it results in an unacceptable loss of storage or uncontrolled discharges which exceed the peak inflow. According to the guidelines, emergency spillways may be permitted to sustain significant damage when used and may be designed to a lower structural standard than auxiliary spillways.
Consideration for floods less than the PMF were permitted only when there were no existing permanent human habitations, commercial or industrial development, or such developments that were projected to occur within the foreseeable future, and transient population was not expected to be affected within the hazard area. An exception was made for a few permanent human habitations located within the flood hazard area provided there was no significant increase in the hazard resulting from the occurrence of floods larger than the proposed IDF up to the PMF (for example, where failure would not add appreciable volume to the outflow hydrograph and the downstream

July 2012 4-11
Summary of Existing Guidelines for Hydrologic Safety of Dams
inundation would be essentially the same with or without failure). For selection of the IDF less than the PMF, “the spillway capacity should be not less than some minimum standard to reduce the risk of loss of benefits during the life of the project; to hold O&M costs to a reasonable level; to maintain public confidence in agencies responsible for dam design, construction, and operation; and to be in compliance with local, State, or other regulations applicable to the facility” [FEMA, 1986].
The guidelines also made provisions for Federal agencies to develop agency-specific criteria and allowed the use of risk analyses as an approach to evaluating spillway inflow requirements less than the PMF on a case-by-case basis for existing dams.
“It is recognized that for some existing dams which do not meet current hydrologic design criteria but have been soundly designed and well constructed, it may be prudent to select an IDF smaller than the PMF. … However, any relaxation of design criteria should be undertaken on a case-by-case basis after the consequences of dam failure have been thoroughly evaluated and quantified. … Local interests should be made aware of the possibility of larger floods occurring when a flood smaller than the PMF is selected as the IDF” [FEMA, 1986].
A section describing risk-based analyses was included in the guidelines.
4.11. ASCE Task Committee on Spillway Design Flood Selection (1988)
This ASCE Task Committee was formed in 1984 in response to the growing national concern for dam safety and the lack of uniformity in the hydrologic procedures used in dam safety evaluation. The charge of the Task Committee was to develop standards for selecting SDFs which could be readily implemented and applied nationwide. Their objective was to identify an acceptable procedure for selecting the SDF which, in addition to the traditional economic analysis, would permit the inclusion of loss of life, owner liability, social disruption, and the magnitude of destruction. The committee consisted of 14 persons. The final report was submitted to nearly 60 outside peer reviewers and was revised six times.
The ASCE Committee developed a quantitative risk assessment approach for selecting the SDF that applies to both new and existing dams. The Committee’s design selection process was based on dividing dams into three categories depending on their failure consequences as summarized in Table 4-6.
The quantitative risk assessment proposed by the Committee for Category 2 dams does not provide specific risk guidelines or thresholds for the potential for loss of life and economic damage but assumes them to be “a matter of judgment.” The Committee provides a tabulation of population at risk (PAR) from dam failure versus warning time for use in the initial screening of Category 1 dams. The values range from a PAR of 50 for a flood wave arrival time less than 2 hours to a PAR of 1,000 or more for a time of flood wave arrival of less than 12 hours.

4-12 July 2012
Federal Emergency Management Agency
Table 4-6 Summary of ASCE Committee’s Spillway Design Flood Selection Process [ASCE, 1988]
Category Description Spillway Design Flood
1 Dams where failure consequences include loss of life or other social and economic losses that warrant the use of the PMF as the spillway design flood.
PMF
2 Dams where the social and economic consequences of failure are not large enough to require use of the PMF as the spillway design flood.
PMF unless quantitative risk assessment shows smaller flood is justified
3 Small dams where the cost of construction is small and the failure damage is low and confined to the owner.
10- to 100-year flood1
1 The committee suggests that the owner may benefit from a quantitative risk assessment to determine the spillway design flood. However, it may not warrant the cost of the analysis. Guidelines adapted from the SCS were offered with the provision that the owner should consider the chances the investment will be lost during the planned project life.
It is unclear how loss of life is to be addressed for a Category 2 dam since there is no explicit accounting for loss of life in the proposed quantitative risk assessment or in the examples provided; only economic losses that can be quantified in dollars are explicitly considered, although loss of life estimates are shown in the summary of consequences. The committee does state that “the relative weighing of nonmonetary consequences and their comparison to dollar savings is a matter of judgment which will vary among decision makers for each site examined.”
A requirement attached to adopting a SDF less than the PMF for Category 2 dams is that the dam owner must consider the cost of indemnifying possible victims of dam failure against financial losses. The cost of indemnification, rather than the flood damage, is taken as the proper measure of damage sustained by parties other than the dam owner. In addition to the loss of project benefits and physical damages created by the dam failure, the indemnification costs include income losses, emergency response, flood fighting, disaster assistance, reoccupation, cleanup, personal trauma, and post-disaster studies. The ASCE Committee concluded that the procedure requires a regulatory mechanism to make sure that the dam owner maintains the capability throughout the project life to fully compensate all victims should the dam fail.
A criticism of the ASCE Task Committee’s proposed procedure is that the relative weighing of non-monetary consequences and their comparison to dollar savings were assumed to be a matter of judgment, and no criteria were provided for making a final design decision [Graham, 2000].
4.12. FEMA Federal Guidelines for Dam Safety – Selecting and Accommodating Inflow Design Floods for Dams (1998 – Reprinted 2004)
In 1994, an ICODS subcommittee was formed to review and update the existing Federal Guidelines for Dam Safety to meet current dam safety challenges and to ensure consistency across agencies and users. With the passage of the National Dam Safety Program Act in 1996 (Public Law 104-303), ICODS and its Subcommittees were reorganized to reflect the objectives and requirements of
July 2012 4-13
Summary of Existing Guidelines for Hydrologic Safety of Dams
Public Law 104-303. In 1998, the newly convened ICODS Subcommittees completed work on the update of the Federal Guidelines for Dam Safety: Selecting and Accommodating Inflow Design Floods for Dams. The ICODS Subcommittees were also made responsible for maintaining the guidelines to help achieve the objectives of the National Dam Safety Program.
The current (1998 – reprinted 2004) Federal Guidelines for Dam Safety: Selecting and Accommodating Inflow Design Floods for Dams places an emphasis on basing the selection of the SDF on an accurate hazard potential determination that evaluates the consequences of dam failure based on the dam being in place, and comparing the impacts of with-failure and without-failure conditions on existing development and prospective future development. The guidelines stipulate that the flood wave created by a dam failure should be routed downstream to the point where the incremental effect of a failure no longer results in unacceptable consequences. The IDF is then selected based on the results of the incremental hazard evaluation. This evaluation involves simulating a flood event during existing and dam failure conditions. The additional downstream consequences due to the incremental increase in flood flows downstream are assessed for each dam failure scenario. The above procedure is to be repeated until the flood inflow condition is identified such that a failure at that flow or larger flows (up to the PMF) will no longer result in unacceptable additional consequences. The resultant flow is the IDF for the dam. The maximum IDF is always the PMF. The guidelines provide specific guidance and procedures, including a comprehensive flowchart, for conducting an incremental hazard evaluation to select the appropriate IDF.
The guidelines stipulate that the PMF should be adopted as the IDF in those situations where consequences of a dam failure for floods less than the PMF are unacceptable. A flood less than the PMF may be adopted as the IDF in situations where the consequences of dam failure at flood flows larger than the selected IDF are acceptable as determined by the incremental hazard evaluation. When an IDF less than the PMF is selected, the consequences of a dam failure resulting from floods in excess of the IDF must be limited to the dam owner’s facilities. The guidelines stipulate that acceptable consequences exist when evaluation of the area affected indicates either of the following two conditions:
1. There are no permanent human habitations, known national security installations, or commercial or individual developments, nor are such habitations or commercial or industrial developments projected to occur within the potential hazard area in the foreseeable future.
2. There are permanent human habitations within the potential hazard area that would be affected by failure of the dam, but there would be no significant incremental increase in the threat to life or property resulting from the occurrence of a failure during floods larger than the proposed IDF.
The guidelines indicate that when a dam break analysis shows downstream incremental effects of approximately two feet or more, engineering judgment and further analysis are necessary to finally evaluate the need for modification of the dam. In general, the consequences of failure are considered acceptable when the incremental effects (depth) of failure on downstream structures are
4-14 July 2012
Federal Emergency Management Agency
less than two feet. The consequence analysis should also include consideration of impacts to vital community services such a municipal water or energy supply and may require increasing the spillway capacity to ensure those services are continued during and following extreme flood conditions. The guidelines suggest that it would not be appropriate to set the IDF for a spillway with an exceedance flood frequency less than the 100-year flood, including low-hazard dams.
The guidelines note that “there are times when selection (of the IDF) becomes difficult and it may be necessary to conduct further analyses with a risk-based approach,” but follows by stating that “incremental hazard evaluation is, in essence, a risk-based approach.” No guidelines were provided for performing an alternate type of risk-based analysis.
The guidelines indicate that it may be appropriate to perform site-specific PMP studies or regional PMP studies to better define existing NWS HMR estimates, provided the additional analysis costs are warranted.
The guidelines address minimum freeboard requirements (the difference between the top of dam and the maximum pool elevation during the IDF) and note that it is generally not necessary to prevent splashing or occasional overtopping of a dam by waves under extreme conditions, however, the number and duration of such occurrences should not threaten the structural integrity of the dam. The guidelines for minimum freeboard allowance do, however, recommend consideration of combinations of components that have a reasonable probability of simultaneous occurrence including: wind-generated wave run-up, effects of possible malfunction of the spillway and outlet works, settlement of the embankment, and landslide-generated waves.
4.13. FEMA Federal Guidelines for Dam Safety – Hazard Potential Classification System for Dams (1998 – Reprinted 2004)
The ICODS Subcommittee on Federal/Non-Federal Dam Safety Coordination was also tasked to develop a new guideline, Hazard Potential Classification System for Dams, which was subsequently published in 1998 and reprinted in 2004. Three classification levels were adopted: Low, Significant, and High. The hazard potential classification system categorizes dams based on the probable loss of human life and the impacts on economic, environmental, and lifeline interests and is summarized in Table 4-7. The assigned classification of a dam is based on failure consequences that will result in the assignment of the highest hazard potential classification of all probable failure and misoperation scenarios. The guidelines state that the probable scenarios considered are to be reasonable, justifiable, and consistent with the FEMA Federal Guidelines for Dam Safety: Selecting and Accommodating Inflow Design Floods for Dams.

July 2012 4-15
Summary of Existing Guidelines for Hydrologic Safety of Dams
Table 4-7 Summary of Proposed ICODS Hazard Potential Classification System for Dams [FEMA, 1998]
Hazard Potential Classification Loss of Human Life Economic, Environmental,
Lifeline Losses
Low None expected Low and generally limited to owner
Significant None expected Yes
High Probable. One or more expected. Yes (but not necessary for this classification)
The ICODS Subcommittee recommended that the proposed Hazard Potential Classification System be adopted in lieu of existing numerical and alphabetical systems to eliminate confusion in the dam safety community and to educate the public on the importance of dam safety. The guidelines do not establish how the system should be used, such as prescribing specific spillway design criteria.
4.14. FEMA Model State Dam Safety Program (2007) This document was prepared by ASDSO to outline key components of an effective dam safety program. The first edition of this document was published in 1987 with amendments in 1998 to reflect the experience of state programs. Spillway design criteria for dams are not provided in this document.

4-16 July 2012
Federal Emergency Management Agency