200 years of sovereign haircuts - uni-bonn.de · 200 years of sovereign haircuts ... dom dom dom...
TRANSCRIPT

1
200 Years of Sovereign Haircuts(research in progress)
47th Konstanz Seminar onMonetary Theory and Monetary Policy
May 12th, 2016
Josefin Meyer Univ. of Munich& Sciences Po
Christoph TrebeschUniv. of Munich
& CEPR
Carmen M. ReinhartHarvard University
& NBER, CEPR
2
Motivation
Why does sovereign debt exist? Not obvious:• Limited enforcement• No collateral
Classic answer: reputation and the cost of default (costs: financial, economic, political and legal, see Panizza et al. 2009)
Insight in this paper: sovereign debt exists because it is a lucrative investment (here: we abstract from the cost of default)

3
Our research agenda
We are creating a new archive of external debt, default, and haircuts, worldwide, and for >200 years (1800-2014)
– Census of external sovereign debt restructurings, haircuts– Process of default and restructurings (start/end, terms)– Expanded dataset of debt/GDP (external, domestic)
Three research goals:1. Study role of debt, default and relief for macroeconomy.
How best to resolve debt overhang and debt crises? Consider private and official debt relief
2. Understanding capital flows: “new“ lending vs. evergreening3. Sovereign debt as an asset class: investor losses and returns
in the very long run. How did creditors fare?

4
This paper
Under which circumstances did creditors suffer losses on sovereign debt?
– Move away from simple, binary coding of default– Magnitude of losses (LGD) matters. Relevant for
investors, risk pricing and financial stability – First paper to compute losses in the short-run (haircuts)
and long-run (returns)
Why 200 years?
– Debt crises are rare events, e.g. in advanced economies– Learn from past experiences, e.g. in crisis resolution– Sovereign bonds are central today, just as pre-1945

5
Haircuts, restructurings, bonds, 1815-2013New database expands Sturzenegger/Zettelmeyer (2006), Reinhart/ Rogoff (2009), Cruces/Trebesch (2013), Reinhart/Trebesch (2015)
Sample:– Census of sovereign restructurings & haircuts: 1815-2013– Focus on external private debt (to foreign banks/bondholders)– In total: >300 restructurings in >80 countries– Details on more than 1000 defaulted bonds– Work in progress: data on non-defaulted bonds, prices
Main sources:– Reports of creditor organisations of UK, US, France:
CFB (1876-1986), FBPC (1934-1964/67), ANPVM (1935-1970)– Manuals: Moody‘s (1926-1970), Kimber‘s (1921-1934), Fenn‘s
Compendium (1837, 1874, 1876, 1869, 1883)– Dozens of additional country sources, agreement contracts, etc

6
Main take aways (so far)
1) There is a large variation in haircut size.Average: 40-50% over the past 200 years
2) Debt repudiation and full defaults are very rare. “Recontracting” (Bulow/Rogoff) is the norm
3) Haircuts are “debt booms gone bust”
4) Investor returns on defaulted bonds (ex-post) are >0 despite high haircuts, creditors do not fare badly

7
Stylized Fact 1:
There is a large variation in haircut size

8
Computing haircuts
Sturzenegger-Zettelmeyer Approach:
𝐻𝐻𝑆𝑆𝑆𝑆𝑡𝑡𝑖𝑖 = 1 −
Present Value of 𝑁𝑁𝑁𝑁𝑁𝑁 Debt 𝑟𝑟𝑡𝑡𝑖𝑖
Present Value of 𝑂𝑂𝑂𝑂𝑂𝑂 Debt (𝑟𝑟𝑡𝑡𝑖𝑖)
Alternative: • Face Value Haircut (“Write Offs“)–ignores maturity extension
Discount rate varies by time and country “exit yield“ fromsecondary bond markets

9
ALB
DZA
DZA
ARG
ARG
ARG
ARG
ARG
ARG
ARG
AUT
BLZ BLZ
BOL
BOL
BOL
BOL
BIH
BRA
BRA
BRA
BRA
BRA
BRA
BRABRA
BRA
BGR
BGR
BGR
CHL
CHL
CHL
CHLCHL
CHL
CHN
CHN
CHN
COL
COL
COL
COL
COL
COL
COD
COG
COD
CODCOD
CODCOD
COD
COG
CRI CRI
CRI
CRI
CRI
CRI
CRI
CRI
CRI
CRI
CRI CIV
CIV
CIV
HRV
CUB
CUBCUB
CUB
CUB
CZK
CZK
CZK
DOM DOM
DMA
DOM
DOM
DOM
DOM
DOM
ECU
ECU
ECU
ECU
ECU
ECU
ECU
ECU
ECU
ECU
ECU
ECU
EGY
EGY
EGY
SLV
SLV
SLV
SLV
SLVSLV
EST
ETH
FIN
GAB
GAB
GMBDEU
GRC
GRC
GRC
GRC
GRD
GTM
GTM
GTM
GTM
GTM
GIN
GINGUY
GUYHND
HND
HND
HND
HUN
HUN
IRQ
ITA
JAM
JAM
JAMJAM
JAM
JAM
JAMJPN
JOR
KEN
LVA
LBR
LBR
LBR
LBR
LBR
LTU
MKD
MDG
MDG
MDG
MDG
MWI
MWI
MRT
MEX
MEX
MEX
MEX
MEX
MEX
MEX
MEX
MEX
MEX
MEX
MEX
MEX
MEX
MDA
MDA
MARMAR
MAR
MOZMOZ
NIC
NIC
NIC
NIC
NIC
NIC
NIC
NIC
NIC
NIC
NIC
NGA
NER
NER
NGA
NER
NGA
NGA
NGA
NGA
PAK
PAN
PAN
PAN
PRY
PRY
PRY
PRY
PRY
PER
PER
PER
PER
PER
PER
PER
PER
PHLPHL
PHL
PHL
POL
POL
POLPOL
POL
POL
POL
PRT
PRT
PRT
PRT
ROU
ROU
ROU
ROU
RUSRUS
RUS
STP
SENSEN
SEN
SEN
SRB
SYC
SLE
SVN
ZAF
ZAF
ZAF
ESPESP
ESP
KNA
SDN
TZA
THA
TGO
TGO
TTO
TUR
TUR
TUR
TUR
TUR
TUR
TUR
UGA
UKR
UKR
UKR
URY
URY
URY
URY
URY
URY
URY
URYVEN
VEN
VEN
VEN
VENVEN
VENVEN
VEN
VNM
YEM
YUG
YUG
YUG
YUG
YUG
ZMB
ZWE
0
50
100
1815 1835 1855 1875 1895 1915 1935 1955 1975 1995 2015
Haircuts (Cruces/Trebesch): 1970-2014
Circle size=debt volume (real 2009 US$)
Average Haircut: 43%Average Haircut: 37%
haircut
10
ALB
DZA
DZA
ARG
ARG
ARG
ARG
ARG
ARG
ARG
AUT
BLZ BLZ
BOL
BOL
BOL
BOL
BIH
BRA
BRA
BRA
BRA
BRA
BRA
BRABRA
BRA
BGR
BGR
BGR
CHL
CHL
CHL
CHLCHL
CHL
CHN
CHN
CHN
COL
COL
COL
COL
COL
COL
COD
COG
COD
CODCOD
CODCOD
COD
COG
CRI CRI
CRI
CRI
CRI
CRI
CRI
CRI
CRI
CRI
CRI CIV
CIV
CIV
HRV
CUB
CUBCUB
CUB
CUB
CZK
CZK
CZK
DOM DOM
DMA
DOM
DOM
DOM
DOM
DOM
ECU
ECU
ECU
ECU
ECU
ECU
ECU
ECU
ECU
ECU
ECU
ECU
EGY
EGY
EGY
SLV
SLV
SLV
SLV
SLVSLV
EST
ETH
FIN
GAB
GAB
GMBDEU
GRC
GRC
GRC
GRC
GRD
GTM
GTM
GTM
GTM
GTM
GIN
GINGUY
GUYHND
HND
HND
HND
HUN
HUN
IRQ
ITA
JAM
JAM
JAMJAM
JAM
JAM
JAMJPN
JOR
KEN
LVA
LBR
LBR
LBR
LBR
LBR
LTU
MKD
MDG
MDG
MDG
MDG
MWI
MWI
MRT
MEX
MEX
MEX
MEX
MEX
MEX
MEX
MEX
MEX
MEX
MEX
MEX
MEX
MEX
MDA
MDA
MARMAR
MAR
MOZMOZ
NIC
NIC
NIC
NIC
NIC
NIC
NIC
NIC
NIC
NIC
NIC
NGA
NER
NER
NGA
NER
NGA
NGA
NGA
NGA
PAK
PAN
PAN
PAN
PRY
PRY
PRY
PRY
PRY
PER
PER
PER
PER
PER
PER
PER
PER
PHLPHL
PHL
PHL
POL
POL
POLPOL
POL
POL
POL
PRT
PRT
PRT
PRT
ROU
ROU
ROU
ROU
RUSRUS
RUS
STP
SENSEN
SEN
SEN
SRB
SYC
SLE
SVN
ZAF
ZAF
ZAF
ESPESP
ESP
KNA
SDN
TZA
THA
TGO
TGO
TTO
TUR
TUR
TUR
TUR
TUR
TUR
TUR
UGA
UKR
UKR
UKR
URY
URY
URY
URY
URY
URY
URY
URYVEN
VEN
VEN
VEN
VENVEN
VENVEN
VEN
VNM
YEM
YUG
YUG
YUG
YUG
YUG
ZMB
ZWE
0
50
100
1815 1835 1855 1875 1895 1915 1935 1955 1975 1995 2015
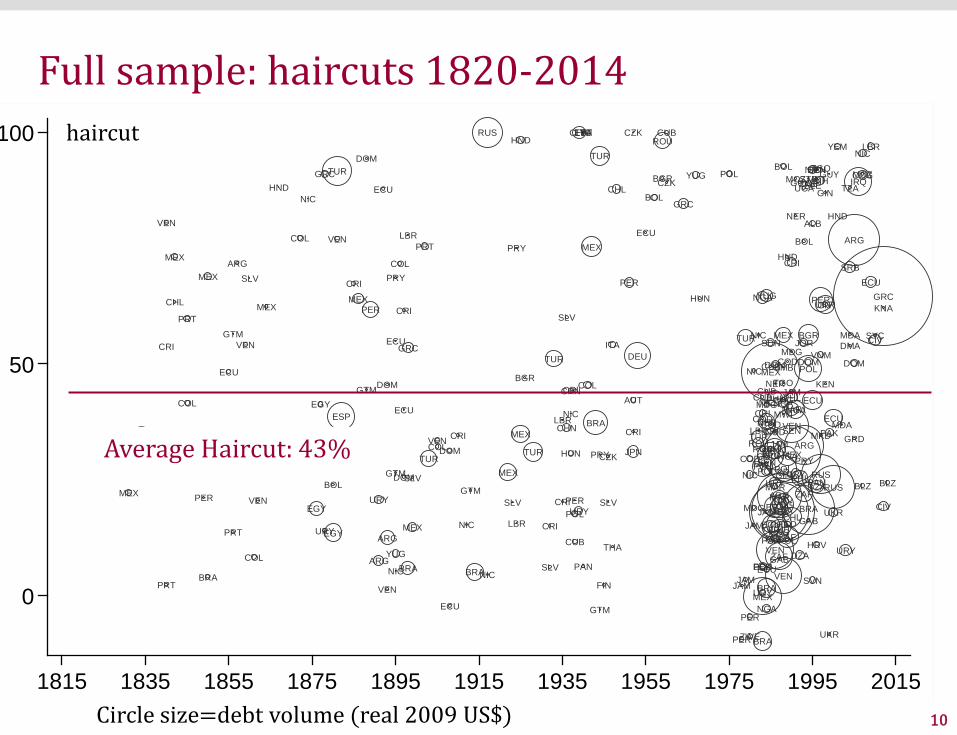
Full sample: haircuts 1820-2014
Circle size=debt volume (real 2009 US$)
Average Haircut: 43%
haircut

11
Cases Mean Median SD Min MaxFull Sample (1815-2014)Haircut (SZ - main measure) 300 43 37 29 -10 100Face Value Reduction 300 21 0 31 0 98Market Haircut 300 49 46 28 -10 100
Historical haircuts (1815-1970) - role of discount rate: Market yields (main measure) 128 45 41 31 -3 100Upper bound (10% interest) 128 48 43 30 -8 100Lower bound (risk free rate) 128 32 23 34 -43 100
By EraOld bond era (1815-1970) 128 45 41 31 -3 100
1815-1869 23 46 54 26 2 881870-1920 49 42 35 30 -2 1001921-1970 56 50 43 34 -3 100
Bank Lending (1971-1997) 138 36 31 26 -10 93Modern Bond Era (1998-2014) 34 57 59 28 -8 97
Haircuts: summary stats High vs. Low haircuts:Cut at the median of 37%

12
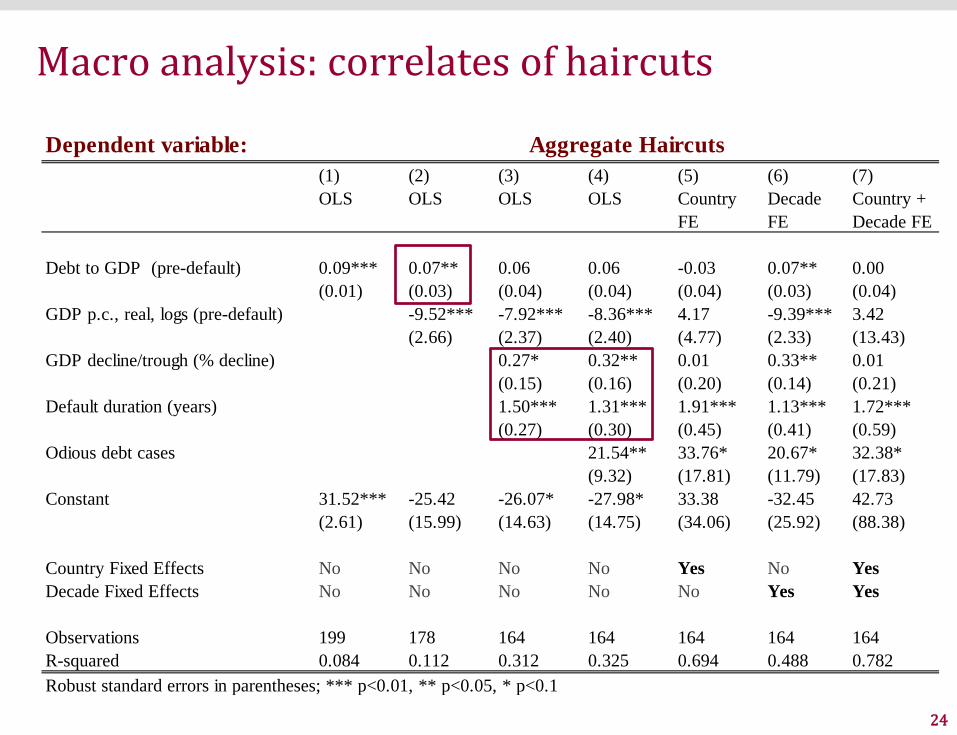
What explains the variation in haircuts?
Main correlates of haircut size:
1) Debt/GDP2) Output disasters (GDP decline peak to through)3) Delays (default duration)4) Revolutions: odious debt cases (rare)

13
Stylized Fact 2:
Sovereign haircuts are debt booms gone bust
Debt ratios and debt stocks are a goodpredictor of both default and haircut size

14
0
20
40
60
80
Normal -6 -5 -4 -3 -2 -1 Default Indefault
Exitdefault
Average external debt to GDP Average total debt to GDP in %
Debt to GDP (%) – before default

15
slope=0.18t=3.850
50
100
0 50 100 150 200
Haircuts & Debt/GDP before default
Total debt to GDP prior to default
haircut
16
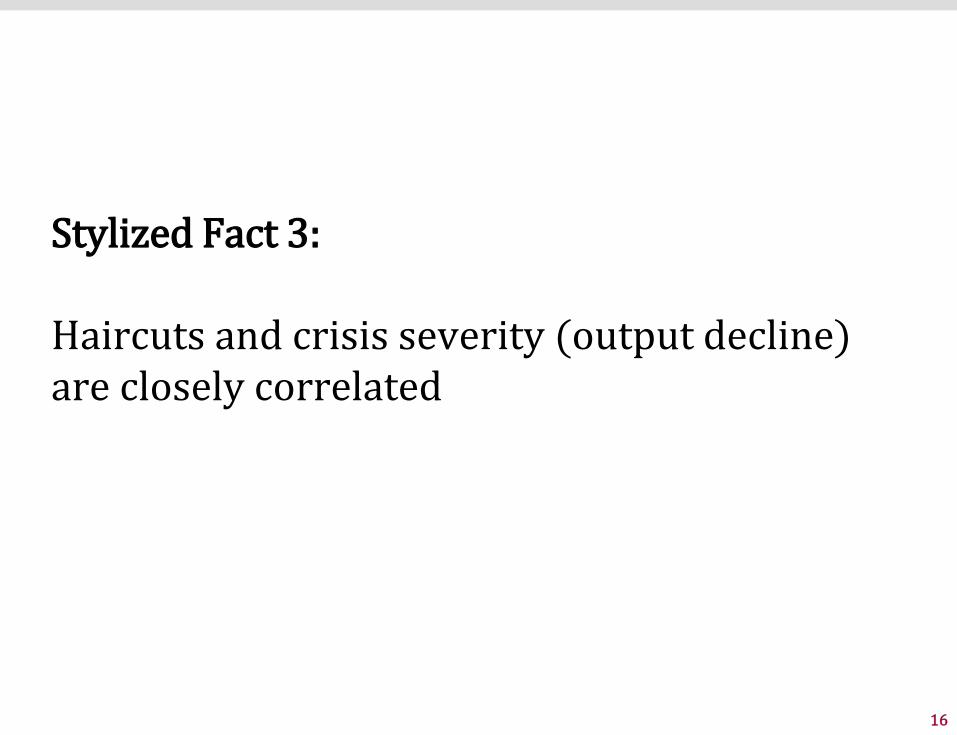
Stylized Fact 3:
Haircuts and crisis severity (output decline) are closely correlated

17
Haircuts & GDP decline (real p.c., in %)
slope=0.54t=3.960
50
100
-20 0 20 40Real GDP decline 5-year pre-default (avg) to through (deep point in crisis)

18
0
50
100
-50 0 50 100
Haircuts & export decline (real, in %)
Real Export decline 5-year pre-default (avg) to through (deep point in crisis)

19
Stylized Fact 4:
Longer defaults see higher haircuts

20
slope=1.60t=8.290
50
100
0 10 20 30 40
Haircuts and delay (default duration in years)
Default duration (in years)
Consistent withBenjamin and Wright (2009)

21
0 5 10 15 20
Default duration in years
After 1970
1870-1970
Before 1870
Delays (average by era) – high vs. low haircuts
Dark bars: high haircutcases (>37%)
22
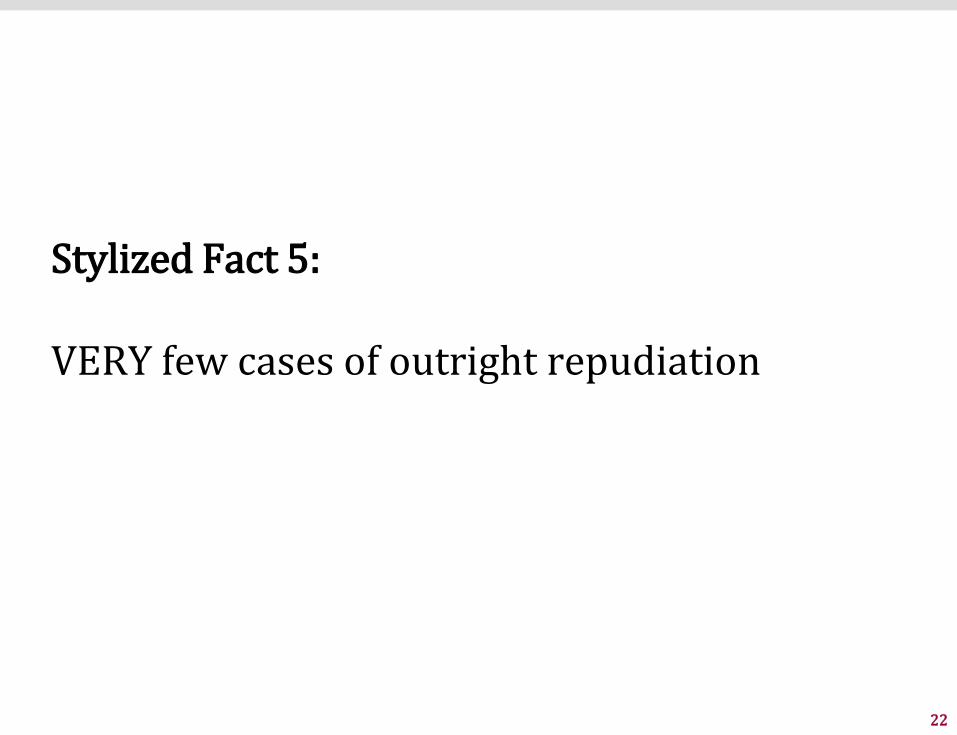
Stylized Fact 5:
VERY few cases of outright repudiation
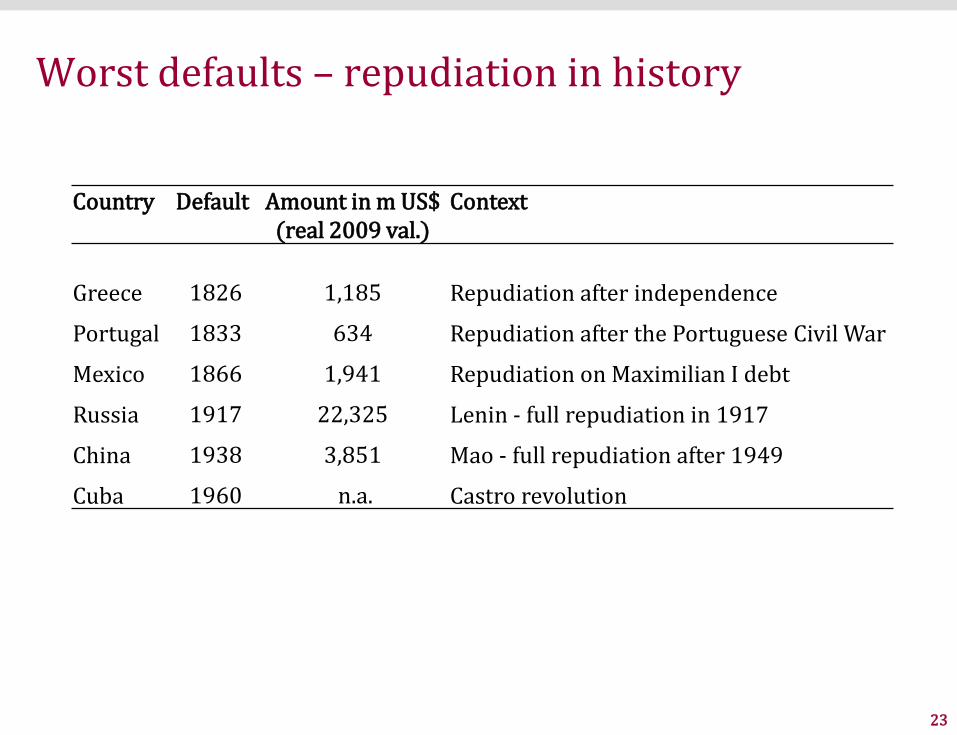
23
Worst defaults – repudiation in history
Country Default Amount in m US$ (real 2009 val.)
Context
Greece 1826 1,185 Repudiation after independence
Portugal 1833 634 Repudiation after the Portuguese Civil War
Mexico 1866 1,941 Repudiation on Maximilian I debt
Russia 1917 22,325 Lenin - full repudiation in 1917
China 1938 3,851 Mao - full repudiation after 1949
Cuba 1960 n.a. Castro revolution
24
Macro analysis: correlates of haircuts
<
Dependent variable:(1) (2) (3) (4) (5) (6) (7)OLS OLS OLS OLS Country
FEDecade FE
Country + Decade FE
Debt to GDP (pre-default) 0.09*** 0.07** 0.06 0.06 -0.03 0.07** 0.00(0.01) (0.03) (0.04) (0.04) (0.04) (0.03) (0.04)
GDP p.c., real, logs (pre-default) -9.52*** -7.92*** -8.36*** 4.17 -9.39*** 3.42(2.66) (2.37) (2.40) (4.77) (2.33) (13.43)
GDP decline/trough (% decline) 0.27* 0.32** 0.01 0.33** 0.01(0.15) (0.16) (0.20) (0.14) (0.21)
Default duration (years) 1.50*** 1.31*** 1.91*** 1.13*** 1.72***(0.27) (0.30) (0.45) (0.41) (0.59)
Odious debt cases 21.54** 33.76* 20.67* 32.38*(9.32) (17.81) (11.79) (17.83)
Constant 31.52*** -25.42 -26.07* -27.98* 33.38 -32.45 42.73(2.61) (15.99) (14.63) (14.75) (34.06) (25.92) (88.38)
Country Fixed Effects No No No No Yes No YesDecade Fixed Effects No No No No No Yes Yes
Observations 199 178 164 164 164 164 164R-squared 0.084 0.112 0.312 0.325 0.694 0.488 0.782
Aggregate Haircuts
Robust standard errors in parentheses; *** p<0.01, ** p<0.05, * p<0.1

25
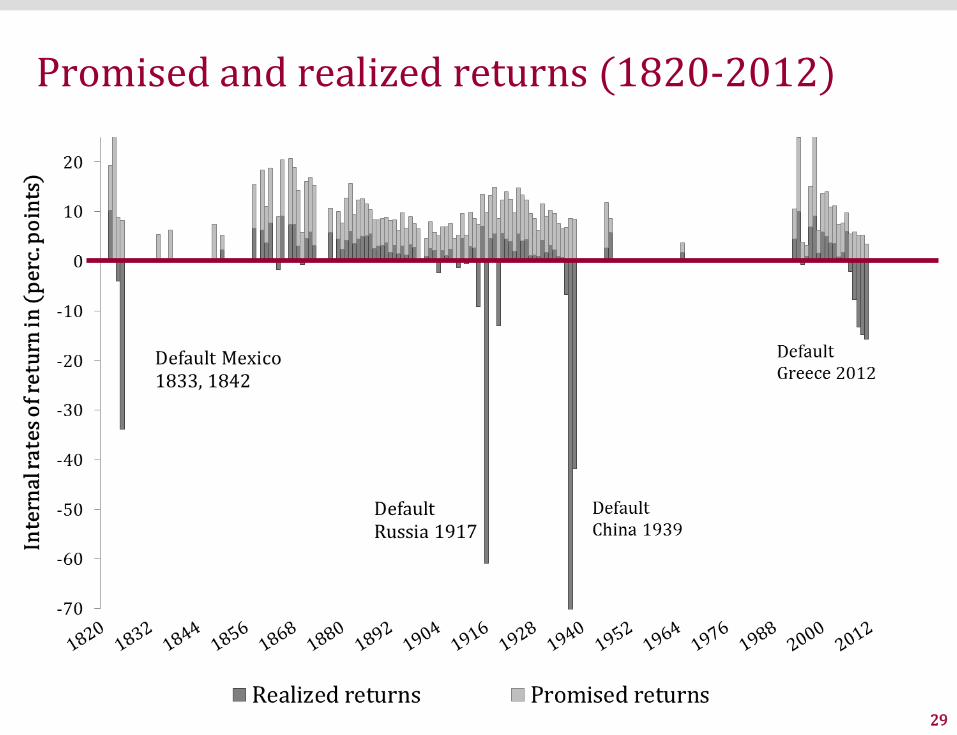
Stylized Fact 6 (micro level data):
Creditors achieve positive returns, despitedefaults and haircuts
26
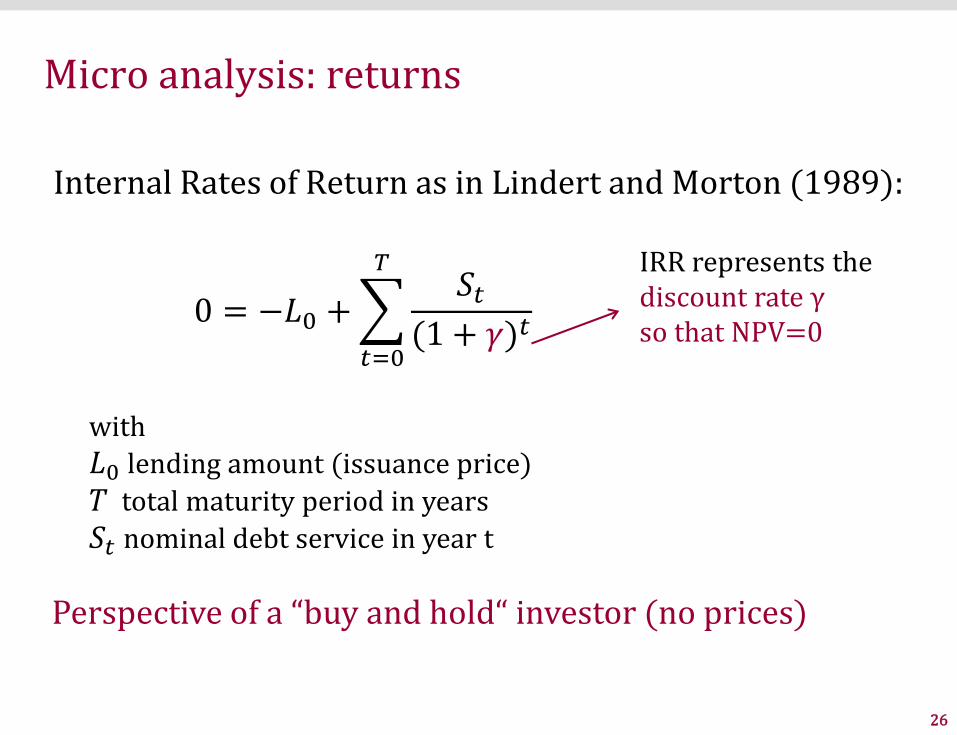
Micro analysis: returns
Internal Rates of Return as in Lindert and Morton (1989):
0 = −𝐿𝐿0 + �𝑡𝑡=0
𝑇𝑇𝑆𝑆𝑡𝑡
(1 + 𝛾𝛾)𝑡𝑡
IRR represents thediscount rate γso that NPV=0
with𝐿𝐿0 lending amount (issuance price)𝑇𝑇 total maturity period in years𝑆𝑆𝑡𝑡 nominal debt service in year t
Perspective of a “buy and hold“ investor (no prices)

27
Bonds Mean Median SD Min Max
Total sample: 1820 -2012Haircut (in %) 680 49 49 29 -20 100Realized return (ex-post, in %) 680 1 4 13 -95 27
Promised return (ex-ante in %) 680 7 6 3 1 30
Micro analysis: summary stats (bond level)
Returns look less dramatic than haircuts
Reason: returns account for pre-default payments

28
0.00
0.05
0.10
Den
sity
-100 -50 0 30
0.0
0.1
0.2
Den
sity
0 10 20 30
Defaulted bonds: promised vs. realizedreturns, nominal (1820-2012)
Promised avg.returns: 7%
Realized averagereturns: 1%,despite default
Realized returns all bonds: ca. 4%, see Lindert/Morton (1989), Eichengreen/Portes (1991)
Mean Median
29
Promised and realized returns (1820-2012)

30
Benchmarking to risk-free rate (UK or US yields)Risk free rates:- Until 1920: UK long-term bonds (consols)- After 1920: US long-term treasuries

31
Bonds Mean Median SD Min Max
Nominal returns (1820-2012)Realized return 680 0.9 3.6 13.0 -95 27(ex-post, in %)Promised return 680 6.8 6.5 3.1 1 30(ex-ante in %)
Premium over risk-free rate (1820-2012)680 -3.0 -0.1 13.2 -100 24
680 3.1 3.1 3.2 -5 24
Realized return (in %) - risk free rate (US/UK Promised return (in %) - risk free rate (US/UK
Risk free rates:- Until 1920: UK long-term bonds (consols)- After 1920: US long-term treasuries
Benchmarking to risk-free rate (UK or US yields)

32
Counterfactual: non-defaulted bonds (1850-1914)Realized returns of defaulted vs. non-defaulted bondsSubsample: 1850-1914
Country sample for non-defaulted bonds: Argentina, Bolivia, Brazil, Bulgaria, Chile, Colombia, Denmark, Egypt, Finland, Greece, Hungary, Italy, Japan, Mexico, Morocco, Netherlands, Norway, Peru, Portugal, Romania, Russia, Spain, Sweden, Thailand, Turkey, Venezuela.

33
Bonds Mean Median SD Min Max
Defaulted bonds 286 1.9 3.1 11 -93.5 27
Non-defaulted bondsTotal Sample 292 6.2 5.7 2.1 3.1 18.3Countries with default history 231 6.6 6 2 3.7 18.3Countries without default history 61 4.7 4.3 1.5 3.1 12.1
Counterfactual: non-defaulted bonds 1850-1914
Realized returns of defaulted vs. non-defaulted bondsSubsample: 1850-1914
Country sample for non-defaulted bonds: Argentina, Bolivia, Brazil, Bulgaria, Chile, Colombia, Denmark, Egypt, Finland, Greece, Hungary, Italy, Japan, Mexico, Morocco, Netherlands, Norway, Peru, Portugal, Romania, Russia, Spain, Sweden, Thailand, Turkey, Venezuela.

34
Adjusting for inflationCPI deflated (BoE data)
All returns in GBP, source inflation: Bank of England (2014) “Three centuries of macroeconomic data”
Bonds Mean Median SD Min Max
Nominal and real returns (1820-1914)
Defaulted bondsPromised nominal return (ex-ante in %)
130 7.3 6.6 2.9 2.6 15.5
Realized nominal return (ex-post, in %)
130 1.8 3.1 10.0 -62.7 16.5
Realized real return (ex-post, in %)
130 0.3 1.3 9.6 -59.9 16.8
Non-defaulted bondsRealized nominal return (ex-post, in %)
206 6.6 5.8 2.3 2.9 14.6
Realized real return (ex-post, in %)
206 5.2 5.1 3.3 -9.3 13.7

35
Stylized Fact 7:
Credit booms predict (high) haircuts and (low) returns
Indicative evidence for „This-Time-is-Different Syndrome“ (Reinhart Rogoff 2009, Gennaioli, Shleifer, and Vishny 2015, Baron and Xiong 2014, for stocks)

36
Credit boom today, higher haircuts tomorrow
Credit booms in financial center (GB, USA) usingdata by Schularick and Taylor (2010, AER)
0 20 40 60 80A h i t
Loss given default(average haircut in %)
Credit boom in year of issuance?
Yes
No

37
(1) (2) (3) (4) (5) (6) (7) (8)Country Country Country Country Country
OLS OLS OLS FE FE FE FE FE
Ex-ante returns -0.54 1.32***(0.87) (0.35)
Maturity (at issuance) -0.06 0.06 -0.13*** -0.05 -0.02 -0.11**(0.16) (0.17) (0.05) (0.05) (0.05) (0.05)
Bond size (amount in real US$, log) 1.22 0.82 -0.65 -0.92* -0.87* -0.53(1.25) (1.29) (0.49) (0.49) (0.51) (0.49)
Issue price (% of face) 0.12 0.27 -0.32*** -0.11 -0.11 -0.34***(0.20) (0.33) (0.12) (0.14) (0.14) (0.12)
Coupon rate (at issuance) -1.14 -0.89 1.75*** 0.90* 1.51*** 1.62***(1.21) (1.29) (0.51) (0.53) (0.53) (0.51)
Total debt to GDP (in %, at issuance) 0.11* 0.00 0.04 0.01 -0.00(0.06) (0.03) (0.03) (0.03) (0.03)
Credit growth in the core 46.86** (5 year moving average, Schularick/Taylor) (21.49)
Credit Boom in the core 7.29***(dummy, Schularick/Taylor) (2.63)
Commodity price boom in the core 5.77** (dummy, Reinhart/Rogoff) (2.27)Constant 57.35*** 40.87* 13.34 2.21 54.97** 38.70* 35.40 57.44**
(7.93) (23.03) (28.77) (8.72) (22.43) (23.01) (23.44) (22.34)
Observations 680 754 593 680 593 569 546 593R-squared 0.003 0.011 0.044 0.623 0.691 0.704 0.699 0.695Standard errors clustered on restructurings in parentheses*** p<0.01, ** p<0.05, * p<0.1
Dependent Variable: Bond-by-bond haircutsHaircuts, bond-level (1815-2013)
Bond characteristics alonehave little predictive value(without country FE)
Booms predicthaircutsize

38
Credit booms today, lower returns tomorrow
0 2 4 6 8
Commodity boom (in core)
Credit boom (in core)
No
Yes
No
Yes
Average ex-post returnAverage ex-ante return
Conditions at bond issuance
Promised returnRealized return

39
Conclusion
• Many parallels over the past two centuries (patterns of haircuts, returns, crisis resolution)
• Despite high haircuts, creditors do not fare too badly − Average ex-post-returns on defaulted bonds >0− Full repudiation very rare, settlement is the norm
• Warning signs for investors?− Level and increase in debt/GDP− Lending boom / strong credit growth at issuance− Avoid communist revolutions!

40
Next steps…
Investor returns:
- Compute total returns from secondary market prices overthe long run (1860-2015)
- Are returns higher in case of official bailouts and otherofficial interventions? (gunboats / diplomatic pressure)
- Compare returns to domestic bonds and other asset classes
Debt relief:
- Compare debt relief by official and private creditors- Solving debt crises: lessons from history (how can serial
restructurings and lengthy defaults be avoided?)