aoac slv metals protocol.doc
TRANSCRIPT

Guidelines for Single Laboratory Validation (SLV) of Chemical Methods for Metals in Food
Introduction
The application of analytical methods within a regulatory analysis or accredited
laboratory framework imposes certain requirements on both the analyst and laboratory. Under
ISO-17025, accredited laboratories are expected to demonstrate both “fitness for purpose” of the
methods for which they are accredited and competency of their assigned analysts in performance
of the methods1. The Codex Alimentarius Commission has issued a general guideline for
analytical laboratories involved in the import and export testing of foods which contains four
principles2:
Such laboratories should demonstrate internal quality control procedures which meet the
requirements of the Harmonised Guidelines for Internal Quality Control in Analytical
Chemistry3;
Such laboratories should be regular participants in appropriate proficiency testing schemes
which have been designed and conducted as per the requirements of the International
Harmonized Protocol for Proficiency Testing of (Chemical) Analytical Laboratories4;
Such laboratories should become accredited for tests routinely performed according to
ISO/IEC-17025:1999 General requirements for the competence of calibration and testing
laboratories (now ISO/IEC-17025Error: Reference source not found); and
Such laboratories should use methods which have been validated according to the principles
laid down by the Codex Alimentarius Commission whenever such methods are available.
General requirements for validation of analytical methods according to principles laid
down by the Codex Alimentarius Commission are provided in the Codex Manual of Procedures,
including provision for “single laboratory” validation of analytical methods5. However, there
remains considerable misunderstanding among analysts as to precisely what is meant and what is
required to demonstrate “method validation”. Additional guidance for possible future inclusion
in the Manual of Procedures is currently under discussion in the Codex Committee on Methods
1
123
4
5
6
7
8
9
10
11
12
13
14
15
16
17
18
19
20
21
22
23
24
25
26
27
28
29
30
31
1
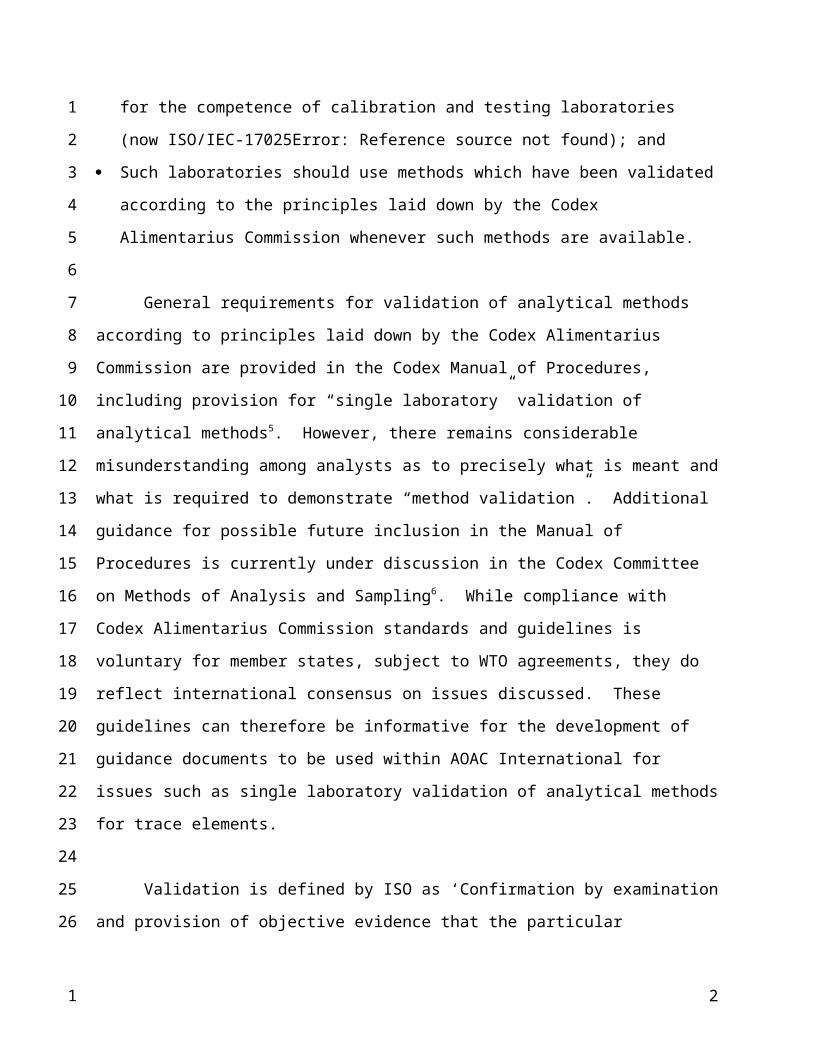
of Analysis and Sampling6. While compliance with Codex Alimentarius Commission standards
and guidelines is voluntary for member states, subject to WTO agreements, they do reflect
international consensus on issues discussed. These guidelines can therefore be informative for
the development of guidance documents to be used within AOAC International for issues such as
single laboratory validation of analytical methods for trace elements.
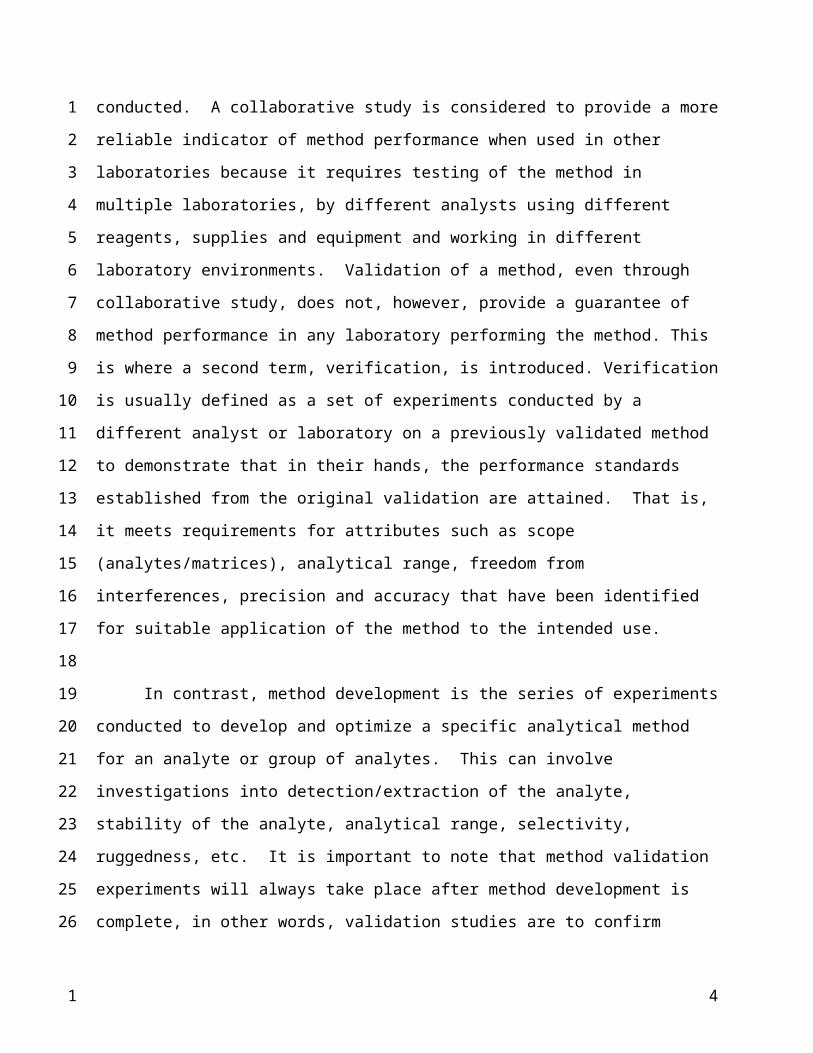
Validation is defined by ISO as ‘Confirmation by examination and provision of objective
evidence that the particular requirements for a specified intended use are fulfilled’ 7. Method
validation has been defined as:
“1.The process of establishing the performance characteristics and limitations of a
method and the identification of the influences which may change these characteristics and to
what extent. Which analytes can it determine in which matrices in the presence of which
interferences? Within these conditions what levels of precision and accuracy can be achieved?
2. The process of verifying that a method is fit for purpose, i.e. for use for solving a
particular analytical problem.”8
In addition, it is been stated in the IUPAC Harmonized Guidelines for Single Laboratory
Validation of Methods of Analysis9 that:
“Strictly speaking, validation should refer to an “analytical system” rather than an
“analytical method”, the analytical system comprising a defined method protocol, a defined
concentration range for the analyte, and a specified type of test material.”
Method validation can therefore be practically defined as a set of experiments conducted
to confirm that an analytical procedure used for a specific test is suitable for its intended purpose
on specific instrumentation and within a specific laboratory environment in which the set of
experiments have been conducted. A collaborative study is considered to provide a more reliable
indicator of method performance when used in other laboratories because it requires testing of
the method in multiple laboratories, by different analysts using different reagents, supplies and
equipment and working in different laboratory environments. Validation of a method, even
through collaborative study, does not, however, provide a guarantee of method performance in
any laboratory performing the method. This is where a second term, verification, is introduced.
2
1
2
3
4
5
6
7
8
9
10
11
12
13
14
15
16
17
18
19
20
21
22
23
24
25
26
27
28
29
30
31
1

Verification is usually defined as a set of experiments conducted by a different analyst or
laboratory on a previously validated method to demonstrate that in their hands, the performance
standards established from the original validation are attained. That is, it meets requirements for
attributes such as scope (analytes/matrices), analytical range, freedom from interferences,
precision and accuracy that have been identified for suitable application of the method to the
intended use.
In contrast, method development is the series of experiments conducted to develop and
optimize a specific analytical method for an analyte or group of analytes. This can involve
investigations into detection/extraction of the analyte, stability of the analyte, analytical range,
selectivity, ruggedness, etc. It is important to note that method validation experiments will
always take place after method development is complete, in other words, validation studies are to
confirm method performance parameters which were demonstrated during method development.
Validation should not begin until ruggedness testing has been completed. A ruggedness
design should identify steps of the analytical method where small changes are made to determine
if they affect method results. A common approach is to vary seven factors simultaneously and
measure these changes to determine how they may affect method performance10. Once method
development and ruggedness experiments are complete, the method cannot be changed during
the validation process.
When validating a method for metals in food products, many factors should be
considered during the planning phase of the validation experimental design. For example, is the
method to be used in a regulatory environment, and if so, does the analyte of interest have a
maximum residue limit (MRL) for which it is assessed for compliance? Is the intended purpose
of the method to achieve the lowest possible detection limit? Is the method to be used for the
determination of a single element in a particular matrix, or multi-element analyses? Can
authentic blank matrix be gathered as the test material? For example many elements are
naturally present in a test matrix, such as arsenic in shellfish tissue. The inability to obtain
authentic blank test material can cause many validation problems when assessing matrix effects,
limits of detection/quantitation, etc.
3
1
2
3
4
5
6
7
8
9
10
11
12
13
14
15
16
17
18
19
20
21
22
23
24
25
26
27
28
29
30
31
1
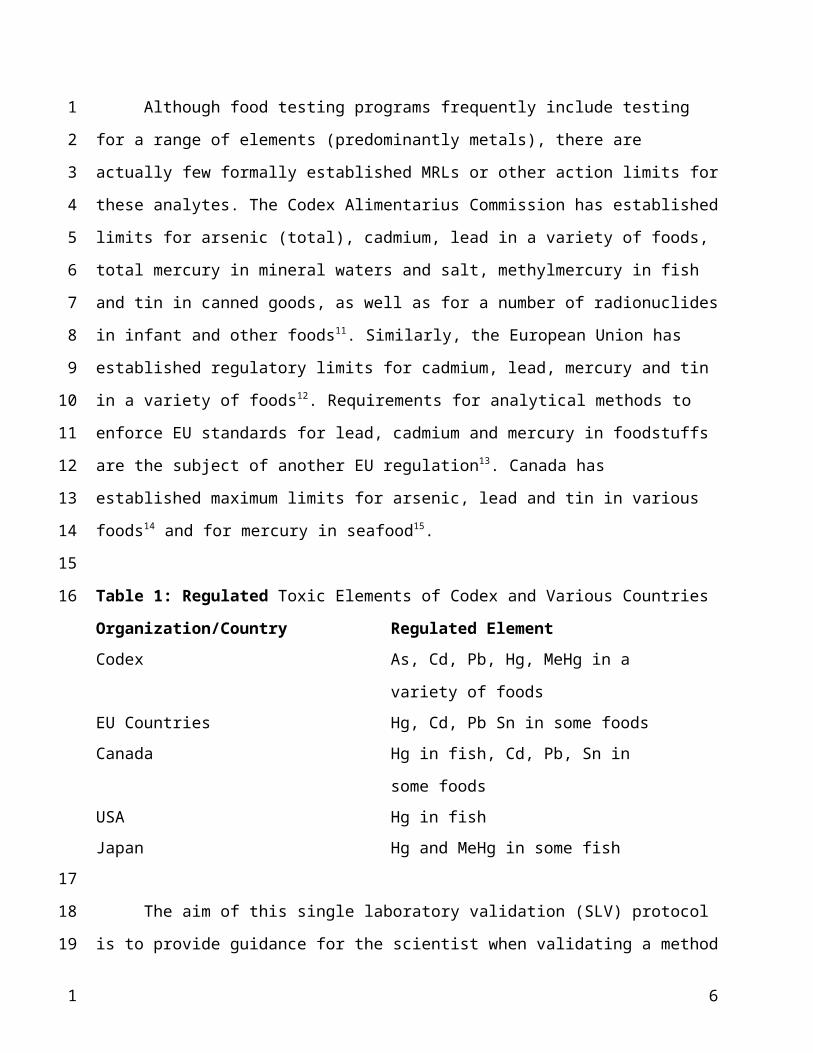
Although food testing programs frequently include testing for a range of elements
(predominantly metals), there are actually few formally established MRLs or other action limits
for these analytes. The Codex Alimentarius Commission has established limits for arsenic (total),
cadmium, lead in a variety of foods, total mercury in mineral waters and salt, methylmercury in
fish and tin in canned goods, as well as for a number of radionuclides in infant and other foods11.
Similarly, the European Union has established regulatory limits for cadmium, lead, mercury and
tin in a variety of foods12. Requirements for analytical methods to enforce EU standards for lead,
cadmium and mercury in foodstuffs are the subject of another EU regulation13. Canada has
established maximum limits for arsenic, lead and tin in various foods14 and for mercury in
seafood15.
Table 1: Regulated Toxic Elements of Codex and Various Countries
Organization/Country Regulated Element
Codex As, Cd, Pb, Hg, MeHg in a variety of foods
EU Countries Hg, Cd, Pb Sn in some foods
Canada Hg in fish, Cd, Pb, Sn in some foods
USA Hg in fish
Japan Hg and MeHg in some fish
The aim of this single laboratory validation (SLV) protocol is to provide guidance for the
scientist when validating a method for inorganic analytes in food or environmental matrices as
“fit-for-purpose” for an element or a group of elements in those products. This document
provides definitions of common terminology, procedures to be followed, technical guidelines
and recommended approaches, as well as an example of a SLV experimental plan. The protocol
addresses any specific requirements that are provided in Codex Alimentarius guidance
documents or in regulations or guidelines set by national or regional authorities, so is intended to
be generally applicable for a variety or potential users.
4
1
2
3
4
5
6
7
8
9
10
11
12
13
14
15
16
17
18
19
20
21
22
23
24
25
1

Definitions
It is recommended that definitions included in the Codex Alimentarius Commission
Manual of ProceduresError: Reference source not found should be used, when available,
as these have been adopted after extensive international consultation and are taken from
authoritative sources, such as ISO, IUPAC and AOAC International. A revised list of
definitions currently under consideration by the Codex Committee on Methods of Analysis
and Sampling (CCMAS) for inclusion in the Codex Manual of Procedures has also been
used as a source for the most current definitions which have acceptance within the
international analytical science communityError: Reference source not found.
Accuracy: Closeness of agreement between a measured quantity value and a true quantity value
of the measurand16. The Codex Manual of Procedures defines accuracy as “the closeness of
agreement between a test result and the accepted reference value.”Error: Reference source not
found The definition currently under consideration by CCMAS Error: Reference source not
found is:
“The closeness of agreement between a test result or measurement result and a
reference value.
Notes: The term “accuracy”, when applied to a set of test results or measurement results,
involves a combination of random components and a common systematic error or bias
component. (Footnote: When applied to a test method, the term accuracy refers to a
combination of trueness and precision.) Reference:ISO Standard 3534-2: Vocabulary and
Symbols Part 2: Applied Statistics, ISO, Geneva, 2006.”
Analytical function: A function which relates the measured value (Ca) to the instrument reading
(X) with the value of the interferants (Ci) remaining constant. This function is expressed by the
following regression of the calibration results: Ca = f(X)Error: Reference source not found.
Analytical Range: The range of an analytical procedure is the interval between the upper and
lower concentration (amounts) of analyte in the sample (including these concentrations) for
5
1
2
3
4
5
6
7
8
9
10
11
12
13
14
15
16
17
18
19
20
21
22
23
24
25
26
27
28
1
which it has been demonstrated that the analytical procedure has a suitable level of precision,
accuracy and linearity17.
ApplicabilityError: Reference source not found: “The analytes, matrices, and concentrations
for which a method of analysis may be used satisfactorily.
Note: In addition to a statement of the range of capability of satisfactory performance for
each factor, the statement of applicability (scope) may also include warnings as to known
interference by other analytes, or inapplicability to certain matrices and situations.
Reference:Codex Alimentarius Commission, Procedural Manual, 17th edition, 2007.”
BiasError: Reference source not found: “The difference between the expectation of the test
result or measurement result and the true value.
Note: Bias is the total systematic error as contrasted to random error. There may be one or
more systematic error components contributing to bias. A larger systematic difference from
the accepted reference value is reflected by a larger bias value.
The bias of a measuring instrument is normally estimated by averaging the error of
indication over the appropriate number of repeated measurements. The error of indication
is the: “indication of a measuring instrument minus a true value of the corresponding input
quantity”. In practice the accepted reference value is substituted for the true value.
Expectation is the expected value of a random variable, e.g. assigned value or long term
average {ISO 5725- 1}.
Reference: ISO Standard 3534-2: Vocabulary and Symbols Part 2: Applied Statistics, ISO,
Geneva, 2006.”
CalibrationError: Reference source not found: “Operation that, under specified conditions, in
a first step, establishes a relation between the values with measurement uncertainties provided by
measurement standards and corresponding indications with associated measurement uncertainties
and in a second step uses this information to establish a relation for obtaining a measurement
result from an indication.
Notes: A calibration may be expressed by a statement, calibration function, calibration
diagram, calibration curve, or calibration table. In some cases it may consist of an
6
1
2
3
4
5
6
7
8
9
10
11
12
13
14
15
16
17
18
19
20
21
22
23
24
25
26
27
28
29
30
1

additive or multiplicative correction of the indication with associated measurement
uncertainty.
Calibration should not be confused with adjustment of a measuring system often
mistakenly called “self calibration”, nor with verification of calibration. Often the first step
alone in the above definition is perceived as being calibration.
Reference: VIM, International vocabulary for basic and general terms in metrology, 3rd
edition, 2007”
Calibration function: The functional (not statistical) relationship for the chemical measurement
process, relating the expected value of the observed (gross) signal or response variable to the
analyte amountError: Reference source not found.
Certified Reference Material (CRM): A reference material of whose property values are
certified by a technically valid procedure, accompanied by, or traceable to, a certificate or other
documentation which is issued by a certifying bodyError: Reference source not found.
From CCMAS discussion documentError: Reference source not found:
“Reference material accompanied by documentation issued by an authoritative body and
providing one or more specified property values with associated uncertainties and
traceabilities, using valid procedures.
Notes: Documentation is given in the form of a “certificate” (see ISO guide 30:1992).
Procedures for the production and certification of certified reference materials are given,
e.g. in ISO Guide 34 and ISO Guide 35. In this definition, “uncertainty” covers both
measurement uncertainty and uncertainty associated with the value of the nominal
property, such as for identity and sequence. “ Traceability covers both metrological
traceability of a value and traceability of a nominal property value. Specified values of
certified reference materials require metrological traceability with associated measurement
uncertainty {Accred. Qual. Assur., 2006}. ISO/REMCO has an analogous definition
{Accred. Qual. Assur., 2006} but uses the modifiers metrological and metrologically to
refer to both quantity and nominal properties.
7
1
2
3
4
5
6
7
8
9
10
11
12
13
14
15
16
17
18
19
20
21
22
23
24
25
26
27
1

References:
VIM, International vocabulary for basic and general terms in metrology, 3rd edition, 2007.
New definitions on reference materials, Accreditation and Quality Assurance, 10:576-578,
2006.”
Critical value (LC)Error: Reference source not found: The value of the net concentration or
amount the exceeding of which leads, for a given error probability α, to the decision that the
concentration or amount of the analyte in the analyzed material is larger than that in the blank
material. It is defined as:
Pr ( >LC | L=0) ≤ α
Where is the estimated value, L is the expectation or true value and LC is the critical value.
Notes:
The critical value Lc is estimated by
LC = t1-ανso,
Where t1-αν is Student's-t, based on ν degrees of freedom for a one-sided confidence interval
of 1-α and so is the sample standard deviation. If L is normally distributed with known
variance, i.e. ν = ∞ with the default α of 0.05, LC = 1.645so.
A result falling below the LC triggering the decision “not detected” should not be construed
as demonstrating analyte absence. Reporting such a result as “zero” or as < LD is not
recommended. The estimated value and its uncertainty should always be reported.
References:
ISO Standard 11843: Capability of Detection-1, ISO, Geneva, 1997.
Nomenclature in evaluation of analytical methods, IUPAC, 1995.”
ErrorError: Reference source not found: Measured value minus a reference value.
Note:
The concept of measurement ‘error’ can be used both: when there is a single reference
value to refer to, which occurs if a calibration is made by means of a measurement standard
with a measured value having a negligible measurement uncertainty or if a conventional
value is given, in which case the measurement error is not known and if a measurand is
supposed to be represented by a unique true value or a set ot true values of negligible
range, in which case the measurement error is not known.
8
1
2
3
4
5
6
7
8
9
10
11
12
13
14
15
16
17
18
19
20
21
22
23
24
25
26
27
28
29
30
1

Reference: VIM, International vocabulary for basic and general terms in metrology, 3rd
Edition, 2007, ISO, Geneva.”
Fitness for purposeError: Reference source not found: Degree to which data produced by a
measurement process enables a user to make technically and administratively correct decisions
for a stated purpose.
Reference: Eurachem Guide: The fitness for purpose of analytical methods: A laboratory guide
to method validation and related topics, 1998.”
HorRatError: Reference source not found: The ratio of the reproducibility relative standard
deviation to that calculated from the Horwitz equation,
Predicted relative standard deviation (PRSD)R =2C-0.15:
HorRat(R) = RSDR/PRSDR ,
HorRat(r) = RSDr/PRSDR ,
where C is concentration expressed as a mass fraction (both numerator and denominator
expressed in the same units).
Notes:
The HorRat is indicative of method performance for a large majority of methods in
chemistry. Normal values lie between 0.5 and 2. (To check proper calculation of PRSDR, a
C of 10-6 should give a PRSDR of 16%.)
If applied to within-laboratory studies, the normal range of HorRat(r) is 0.3-1.3. For
concentrations less than 0.12 mg/kg the predictive relative standard deviation developed by
Thompson (The Analyst, 2000), should be used.
Reference:
A simple method for evaluating data from an inter-laboratory study, J AOAC, 81(6):1257-
1265, 1998
Recent trends in inter-laboratory precision at ppb and sub-ppb concentrations in relation to
fitness for purpose criteria in proficiency testing, The Analyst, 125:385-386, 2000.”
9
1
2
3
4
5
6
7
8
9
10
11
12
13
14
15
16
17
18
19
20
21
22
23
24
25
26
27
28
29
1

Intermediate Precision: The precision of an analytical procedure expresses the closeness of
agreement between a series of measurements obtained from multiple sampling of the same
homogeneous sample under the prescribed conditions. Intermediate precision expresses within-
laboratories variations: different days, different analysts, different equipment, etc.Error:
Reference source not found
Limit of Detection (LOD): The lowest concentration of analyte in a sample that can be detected,
but not necessarily quantitated under the stated conditions of the testError: Reference source not
found.
Limit of DetectionError: Reference source not found: “The true net concentration or
amount of the analyte in the material to be analyzed which will lead, with probability (1-β),
to the conclusion that the concentration or amount of the analyte in the analyzed material is
larger than that in the blank material. It is defined as:
Pr ( ≤LC | L=LD) = β
Where is the estimated value, L is the expectation or true value and LC is the critical value.
Notes: The detection limit LD is estimated by,
LD ≈ 2t1-ανσo [where α = β],
Where t1-αν is Student's-t, based on ν degrees of freedom for a one-sided confidence interval
of 1-α and σo is the standard deviation of the true value (expectation). LD = 3.29 σo, when
the uncertainty in the mean (expected) value of the blank is neglible, α = β = 0.05 and L is
normally distributed with known constant variance. However, LD is not defined simply as a
fixed coefficient (e.g. 3, 6, etc.) times the standard deviation of a pure solution background.
To do so can be extremely misleading. The correct estimation of LD must take into account
degrees of freedom, α and β, and the distribution of L as influenced by factors such as
analyte concentration, matrix effects and interference. This definition provides a basis for
taking into account exceptions to simple case that is described, i.e. involving non-normal
distributions and heteroscedasticity (e.g. “counting” (Poisson) processes as those used for
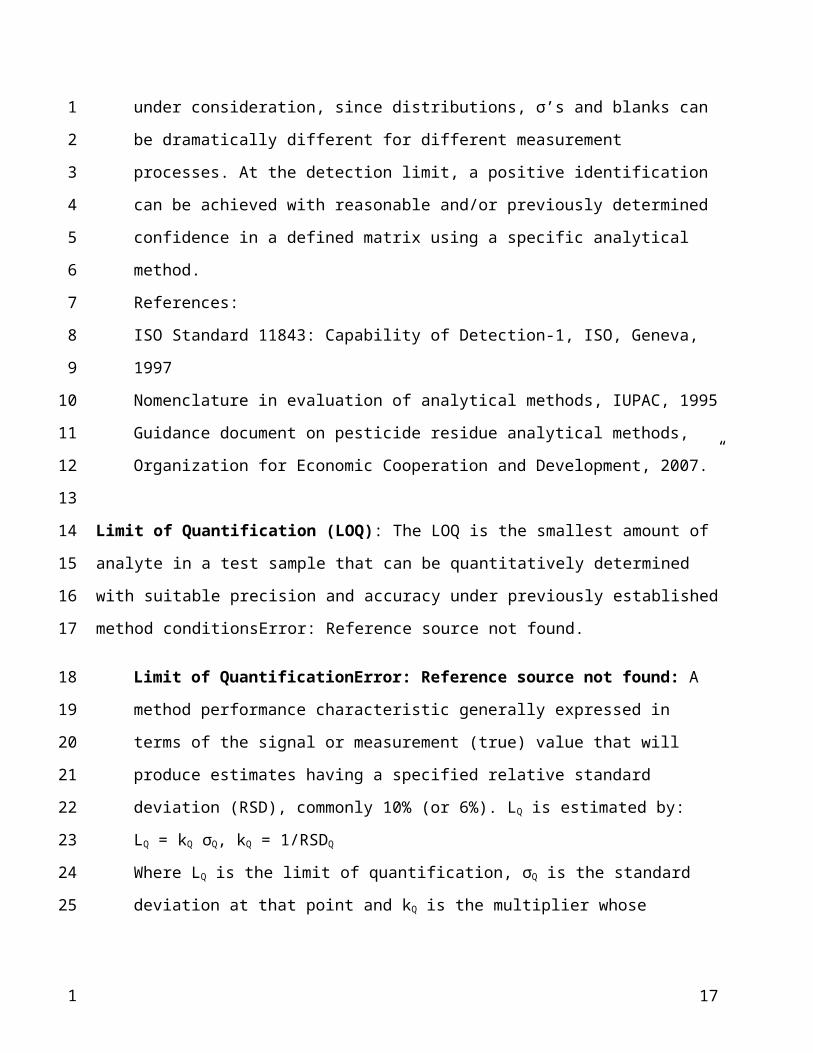
real time PCR). It is essential to specify the measurement process under consideration,
since distributions, σ’s and blanks can be dramatically different for different measurement
processes. At the detection limit, a positive identification can be achieved with reasonable
10
1
2
3
4
5
6
7
8
9
10
11
12
13
14
15
16
17
18
19
20
21
22
23
24
25
26
27
28
29
1

and/or previously determined confidence in a defined matrix using a specific analytical
method.
References:
ISO Standard 11843: Capability of Detection-1, ISO, Geneva, 1997
Nomenclature in evaluation of analytical methods, IUPAC, 1995
Guidance document on pesticide residue analytical methods, Organization for Economic
Cooperation and Development, 2007.”
Limit of Quantification (LOQ): The LOQ is the smallest amount of analyte in a test sample
that can be quantitatively determined with suitable precision and accuracy under previously
established method conditionsError: Reference source not found.
Limit of QuantificationError: Reference source not found: A method performance
characteristic generally expressed in terms of the signal or measurement (true) value that
will produce estimates having a specified relative standard deviation (RSD), commonly
10% (or 6%). LQ is estimated by:
LQ = kQ σQ, kQ = 1/RSDQ
Where LQ is the limit of quantification, σQ is the standard deviation at that point and kQ is
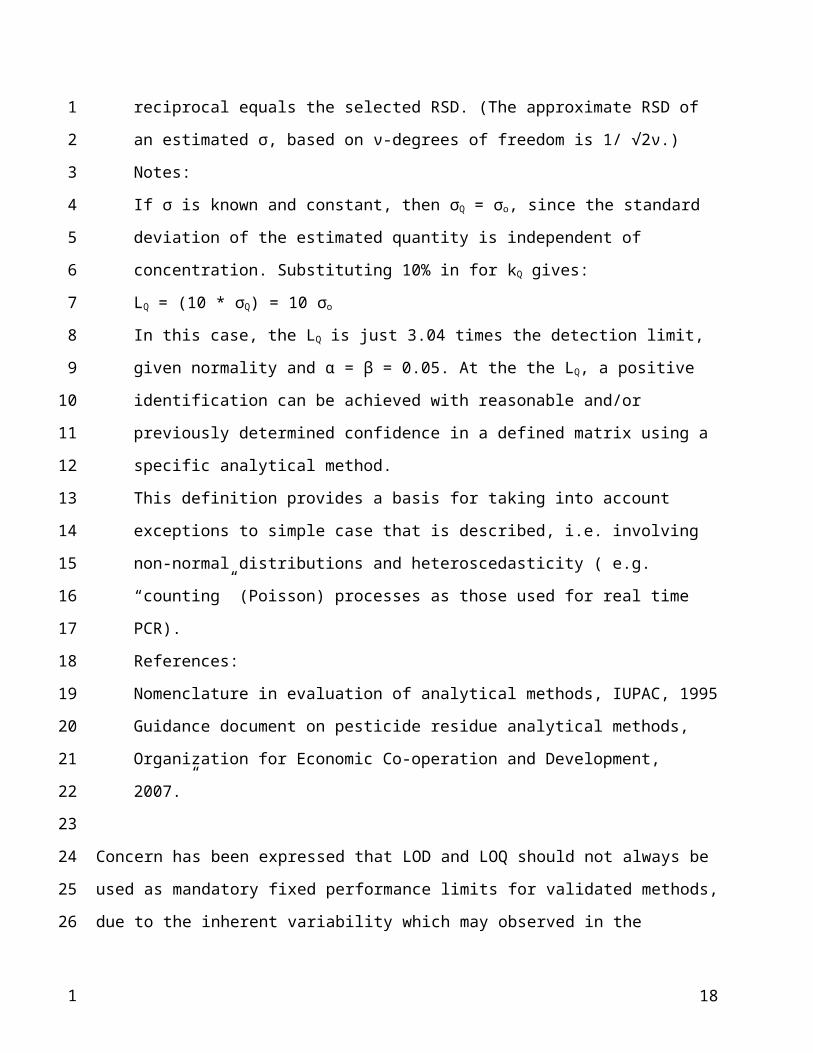
the multiplier whose reciprocal equals the selected RSD. (The approximate RSD of an
estimated σ, based on ν-degrees of freedom is 1/ √2ν.)
Notes:
If σ is known and constant, then σQ = σo, since the standard deviation of the estimated
quantity is independent of concentration. Substituting 10% in for kQ gives:
LQ = (10 * σQ) = 10 σo
In this case, the LQ is just 3.04 times the detection limit, given normality and α = β = 0.05.
At the the LQ, a positive identification can be achieved with reasonable and/or previously
determined confidence in a defined matrix using a specific analytical method.
This definition provides a basis for taking into account exceptions to simple case that is
described, i.e. involving non-normal distributions and heteroscedasticity ( e.g. “counting”
(Poisson) processes as those used for real time PCR).
References:
Nomenclature in evaluation of analytical methods, IUPAC, 1995
11
1
2
3
4
5
6
7
8
9
10
11
12
13
14
15
16
17
18
19
20
21
22
23
24
25
26
27
28
29
30
31
1

Guidance document on pesticide residue analytical methods, Organization for Economic
Co-operation and Development, 2007.”
Concern has been expressed that LOD and LOQ should not always be used as mandatory fixed
performance limits for validated methods, due to the inherent variability which may observed in
the determination of these limits by different analysts using different instruments. For example,
an expert consultation on the validation of analytical methods noted in its report that “LOD and
LOQ are estimates of variable parameters, the values of which depend on various factors,
including the conditions of measurement and the experience of the analyst. The use of these
estimates in client reports can be misleading. In view of this, it was requested that the
FAO/IAEA expert consultation following the Workshop would consider that the lowest
calibrated level of the analysis be recommended to be used in client reports as an alternative to
the LOD and LOQ.”18
The following terms were defined in the consultation report:
Accepted Limit (AL): Concentration value for an analyte corresponding to a regulatory limit or
guideline value which forms the purpose for the analysis, e.g. MRL, MPL; trading standard,
target concentration limit (dietary exposure assessment), acceptance level (environment) etc. For
a substance without an MRL or for a banned substance there may be no AL (effectively it may
be zero or there may be no limit ) or it may be the target concentration above which detected
residues should be confirmed (action limit or administrative limit).
Lowest Calibrated Level (LCL): Lowest concentration of analyte detected and measured in
calibration of the detection system. It may be expressed as a solution concentration or as a mass
ratio in the test sample and must not include the contribution from the blank.
Linearity: The ability of the method to obtain test results proportional to the concentration of
analyteError: Reference source not found.
12
1
2
3
4
5
6
7
8
9
10
11
12
13
14
15
16
17
18
19
20
21
22
23
24
25
26
27
28
29
30
1

LinearityError: Reference source not found: The ability of a method of analysis, within a
certain range, to provide an instrumental response or results proportional to the quantity of
analyte to be determined in the laboratory sample. This proportionality is expressed by a
prior defined mathematical expression. The linearity limits are the experimental limits of
concentrations between which a linear calibration model can be applied with an acceptable
uncertainty.
Reference:
Codex Alimentarius Commission, Procedural Manual, 17th edition, 2007.”
Linear Range: The range of analyte concentrations over which the method provides test results
proportional to the concentration of the analyteError: Reference source not found.
Matrix: The components of the sample other than the analyteError: Reference source not found.
Matrix Effect: The combined effect of all components in the sample other than the analyte on
the measurement of the quantity. If a specific component can be identified as causing an effect
then this is referred to as interferenceError: Reference source not found.
Matrix Fortified Calibration Curve: When a known concentration of the target analyte is
added to a blank matrix at various levels prior to extraction or digestion to generate a calibration
curve. This curve is used to determine the effect of the matrix on the response of the analyte.
Matrix Matched: When fortified blank matrix is extracted and carried through the method to
generate a calibration curve. This is used to correct for matrix effects. In metals testing, matrix
matched refers to matching diluent concentrations of standards to that of the sample digest.
Other elements that are known to be present in sample digest may be added as well.
Matrix-matched CalibrationError: Reference source not found: Calibration using standards
prepared in an extract of the commodity analysed (or of a representative commodity). The
objective is to compensate for the effects of co-extractives on the determination system. Such
effects are often unpredictable, but matrix-matching may be unnecessary where co-extractives
prove to be of insignificant effect.
MeasurandError: Reference source not found: Quantity intended to be measured.
13
1
2
3
4
5
6
7
8
9
10
11
12
13
14
15
16
17
18
19
20
21
22
23
24
25
26
27
1

Notes: The specification of a measurand requires knowledge of the kind of quantity,
description of the state of the substance carrying the quantity, including any relevant
component and the chemical entities involved. In chemistry, ‘analyte’ or the name of a
substance or compound are terms sometime used for measurand. This usage is erroneous
because these terms do not refer to quantities.
Reference: VIM, International vocabulary for basic and general terms in metrology, 3rd
Edition, 2007, ISO, Geneva.”
Measurement procedureError: Reference source not found: Detailed description of a
measurement according to one or more measurement principles and to a given measurement
method, based on a measurement model and including any calculation to obtain a result.
Notes: A measurement procedure is usually documented in sufficient detail to enable an
operator to perform a measurement. A measurement procedure can include a statement
concerning a target measurement uncertainty. A measurement procedure is sometimes
called a standard operating procedure (SOP).
Reference: VIM, International vocabulary for basic and general terms in metrology, 3rd
Edition, 2007, ISO, Geneva.”
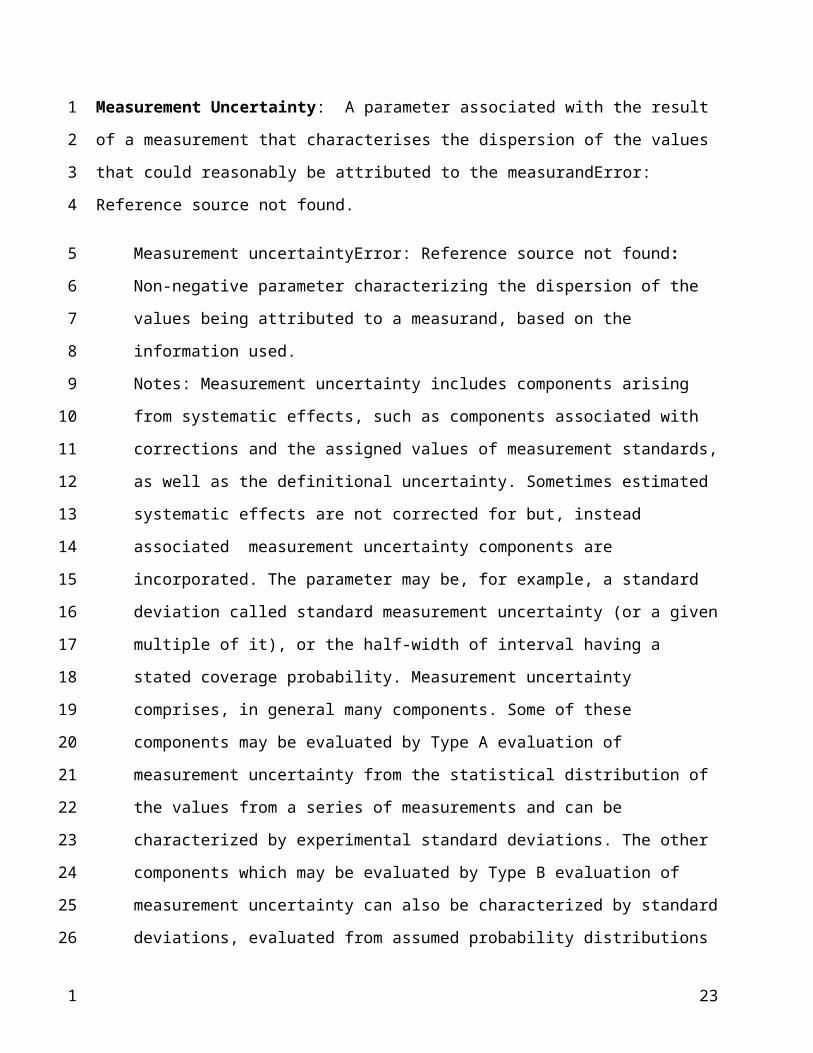
Measurement Uncertainty: A parameter associated with the result of a measurement that
characterises the dispersion of the values that could reasonably be attributed to the
measurandError: Reference source not found.
Measurement uncertaintyError: Reference source not found: Non-negative parameter
characterizing the dispersion of the values being attributed to a measurand, based on the
information used.
Notes: Measurement uncertainty includes components arising from systematic effects, such
as components associated with corrections and the assigned values of measurement
standards, as well as the definitional uncertainty. Sometimes estimated systematic effects
are not corrected for but, instead associated measurement uncertainty components are
incorporated. The parameter may be, for example, a standard deviation called standard
measurement uncertainty (or a given multiple of it), or the half-width of interval having a
stated coverage probability. Measurement uncertainty comprises, in general many
14
1
2
3
4
5
6
7
8
9
10
11
12
13
14
15
16
17
18
19
20
21
22
23
24
25
26
27
28
29
30
31
1

components. Some of these components may be evaluated by Type A evaluation of
measurement uncertainty from the statistical distribution of the values from a series of
measurements and can be characterized by experimental standard deviations. The other
components which may be evaluated by Type B evaluation of measurement uncertainty
can also be characterized by standard deviations, evaluated from assumed probability
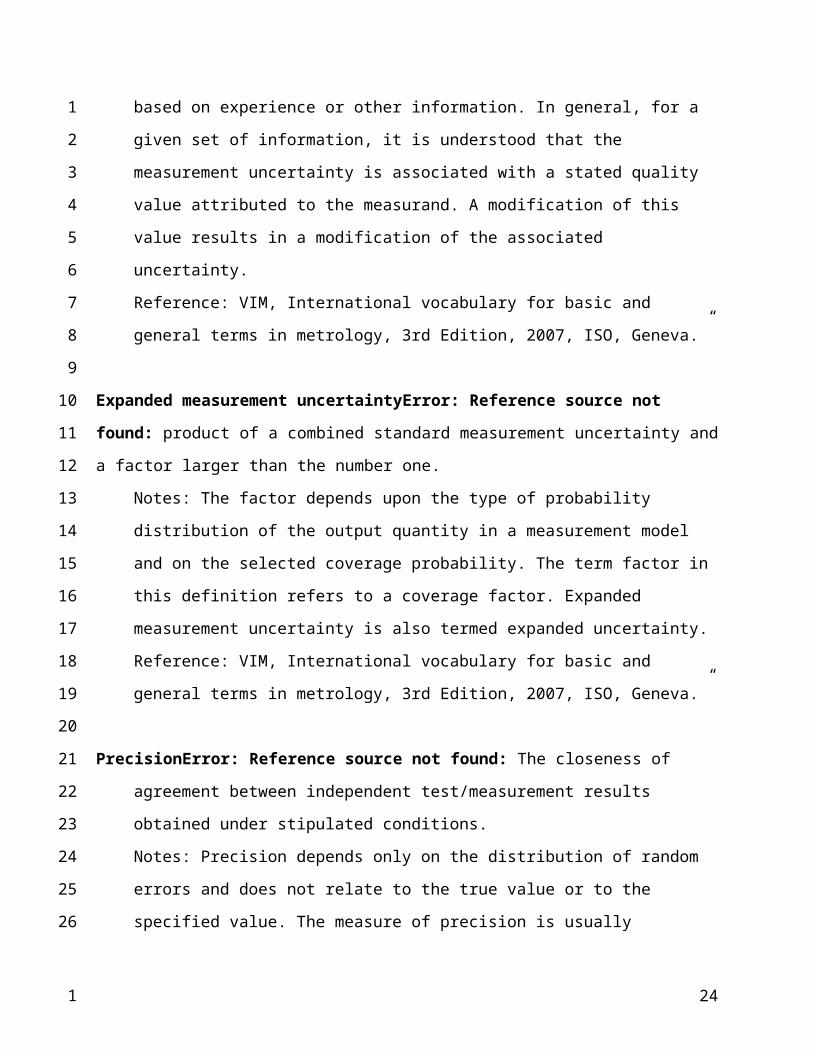
distributions based on experience or other information. In general, for a given set of
information, it is understood that the measurement uncertainty is associated with a stated
quality value attributed to the measurand. A modification of this value results in a
modification of the associated uncertainty.
Reference: VIM, International vocabulary for basic and general terms in metrology, 3rd
Edition, 2007, ISO, Geneva.”
Expanded measurement uncertaintyError: Reference source not found: product of a
combined standard measurement uncertainty and a factor larger than the number one.
Notes: The factor depends upon the type of probability distribution of the output quantity
in a measurement model and on the selected coverage probability. The term factor in this
definition refers to a coverage factor. Expanded measurement uncertainty is also termed
expanded uncertainty.
Reference: VIM, International vocabulary for basic and general terms in metrology, 3rd
Edition, 2007, ISO, Geneva.”
PrecisionError: Reference source not found: The closeness of agreement between
independent test/measurement results obtained under stipulated conditions.
Notes: Precision depends only on the distribution of random errors and does not relate to
the true value or to the specified value. The measure of precision is usually expressed in
terms of imprecision and computed as a standard deviation of the test results. Less
precision is reflected by a larger standard deviation. Quantitative measures of precision
depend critically on the stipulated conditions. Repeatability and reproducibility conditions
are particular sets of extreme conditions. Intermediate conditions between these two
extreme conditions are also conceivable, when one or more factors within a laboratory
(intra-laboratory- e.g. the operator, the equipment used, the calibration of the equipment
15
1
2
3
4
5
6
7
8
9
10
11
12
13
14
15
16
17
18
19
20
21
22
23
24
25
26
27
28
29
30
31
1

used, the environment, the batch of reagent and the elapsed time between measurements)
are allowed to vary and are useful in specified circumstances. Precision is normally
expressed in terms of standard deviation.
References:
ISO Standard 3534-2: Vocabulary and Symbols Part 2: Applied Statistics, ISO, Geneva,
2006
ISO Standard 5725-3: Accuracy (trueness and precision) of measurement methods and
results Part 3:
Intermediate measures of the precision of a standard measurement method, ISO, Geneva,
1994.”
Recovery: IUPAC defines it as a “term used in analytical and preparative chemistry to denote
the fraction of the total quantity of a substance recoverable following a chemical
procedure”Error: Reference source not found. It has also been defined in an EU Commission
Decision referring to requirements for analytical methods used for the determination of residues
of veterinary drugs in foods as the “percentage of the true concentration of a substance recovered
during the analytical procedure. It is determined during validation, if no certified reference
material is available.”19 Recovery has also been defined as the “proportion of the amount of
analyte, present in or added to the analytical portion of the test material, which is extracted and
presented for measurement.”20
RecoveryError: Reference source not found / recovery factors: Proportion of the amount of
analyte, present in, added to or present in and added to the analytical portion of the test
material, which is extracted and presented for measurement.
Notes: Recovery is assessed by the ratio R = Cobs / C ref of the observed concentration or
amount Cobs obtained by the application of an analytical procedure to a material containing
analyte at a reference level Cref . Cref will be: (a) a reference material certified value, (b)
measured by an alternative definitive method, (c) defined by a spike addition or (d)
marginal recovery. Recovery is primarily intended for use in methods that rely on
transferring the analyte from a complex matrix into a simpler solution, during which loss of
analyte can be anticipated.
References:
16
1
2
3
4
5
6
7
8
9
10
11
12
13
14
15
16
17
18
19
20
21
22
23
24
25
26
27
28
29
30
31
1
Harmonized guidelines for the use of recovery information in analytical measurement,
1998
Use of the terms “recovery” and “apparent recovery” in analytical procedures, 2002.”
Reference materialError: Reference source not found: Material, sufficiently homogeneous
and stable with respect to one or more specified properties, which has been established to be fit
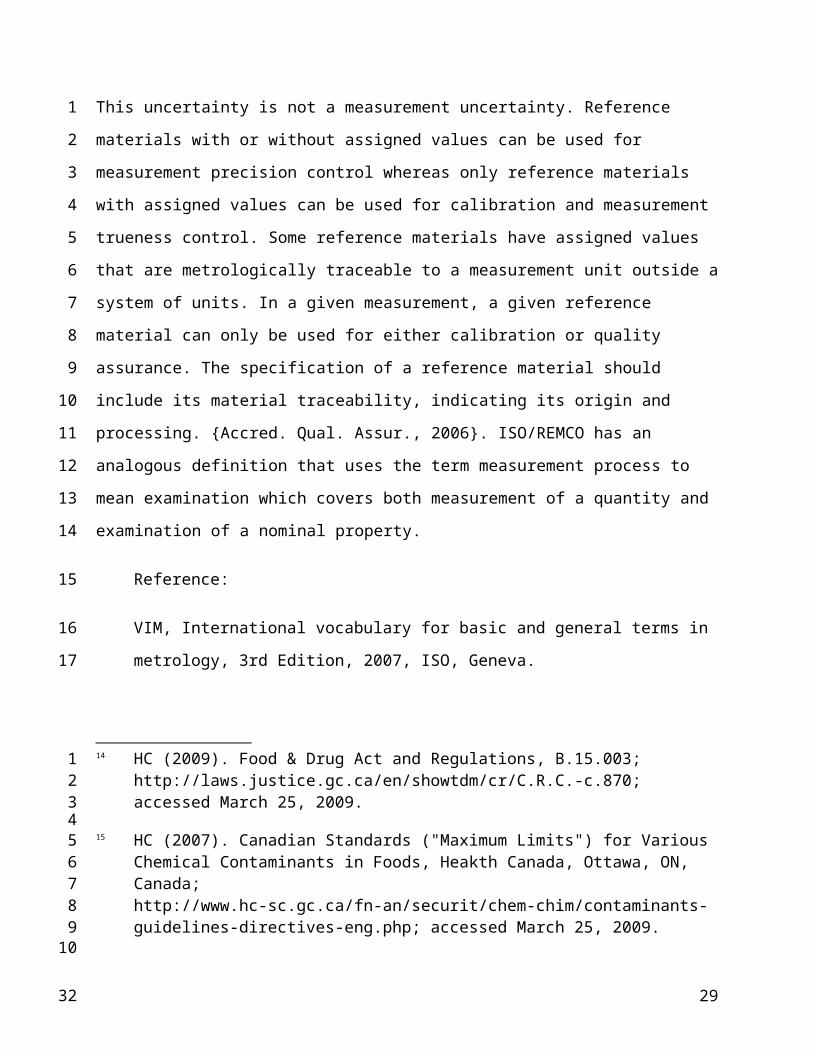
for its intended use in a measurement process or in examination of nominal properties. Notes:
Examination of a nominal property provides a nominal property value and associated
uncertainty. This uncertainty is not a measurement uncertainty. Reference materials with or
without assigned values can be used for measurement precision control whereas only reference
materials with assigned values can be used for calibration and measurement trueness control.
Some reference materials have assigned values that are metrologically traceable to a
measurement unit outside a system of units. In a given measurement, a given reference material
can only be used for either calibration or quality assurance. The specification of a reference
material should include its material traceability, indicating its origin and processing. {Accred.
Qual. Assur., 2006}. ISO/REMCO has an analogous definition that uses the term measurement
process to mean examination which covers both measurement of a quantity and examination of a
nominal property.
Reference:
VIM, International vocabulary for basic and general terms in metrology, 3rd Edition, 2007,
ISO, Geneva.
New definitions on reference materials, Accred. Qual. Assur., 10:576-578, 2006.”
Reference valueError: Reference source not found: Quantity value used as a basis of
comparison with values of quantity of the same kind.
Notes: A reference quantity value can be a true quantity value of a measurand, in which
case it is unknown, or a conventional quantity value in which case it is known. A reference
quantity value with an associated measurement uncertainty is usually provided with
reference to ( a) a material, e.g. a certified reference material (b) a reference measurement
procedure (c) a comparison of measurement standards.
17
1
2
3
4
5
6
7
8
9
10
11
12
13
14
15
16
17
18
19
20
21
22
23
24
25
26
27
28
1
Reference: VIM, International vocabulary for basic and general terms in metrology, 3rd
Edition, 2007, ISO, Geneva.”
Repeatability: This term is defined by the Codex Alimentarius Commission as “Conditions
where independent test results are obtained with the same method on identical test items in the
same laboratory by the same operator using the same equipment within short intervals of
time.”Error: Reference source not found
Reproducibility: The Codex Alimentarius Commission defines this as “Conditions where
independent test results are obtained with the same method on identical test items in different
laboratories with different operators using different equipment.”Error: Reference source not
found It is also defined in an EU Commission Decision as “The precision under conditions
where test results are obtained with the same method on identical test items in different
laboratories with different operators using different equipment. For Single Lab Validation
intermediate precision is determined with different operators on different equipment.”Error:
Reference source not found
From CCMAS discussion paperError: Reference source not found:
Repeatability (Reproducibility)Error: Reference source not found: Precision under
repeatability (reproducibility) conditions.
Reference:
ISO 3534-1 Statistics, vocabulary and symbols-Part 1: Probability and general statistical
terms, ISO, 1993
ISO Standard 78-2: Chemistry – Layouts for Standards – Part 2: Methods of Chemical
Analysis, 1999)
Codex Alimentarius Commission, Procedural Manual, 17th edition, 2007
AOAC International methods committee guidelines for validation of qualitative and
quantitative food microbiological official methods of analysis, 2002.”
Repeatability conditionsError: Reference source not found: Observation conditions where
independent test/measurement results are obtained with the same method on identical
18
1
2
3
4
5
6
7
8
9
10
11
12
13
14
15
16
17
18
19
20
21
22
23
24
25
26
27
28
1

test/measurement items in the same test or measuring facility by the same operator using the
same equipment within short intervals of time.
Note: Repeatability conditions include: the same measurement procedure or test procedure;
the same operator; the same measuring or test equipment used under the same conditions;
the same location and repetition over a short period of time.
Reference:
ISO Standard 3534-2: Vocabulary and Symbols Part 2: Applied Statistics, ISO, Geneva,
2006.”
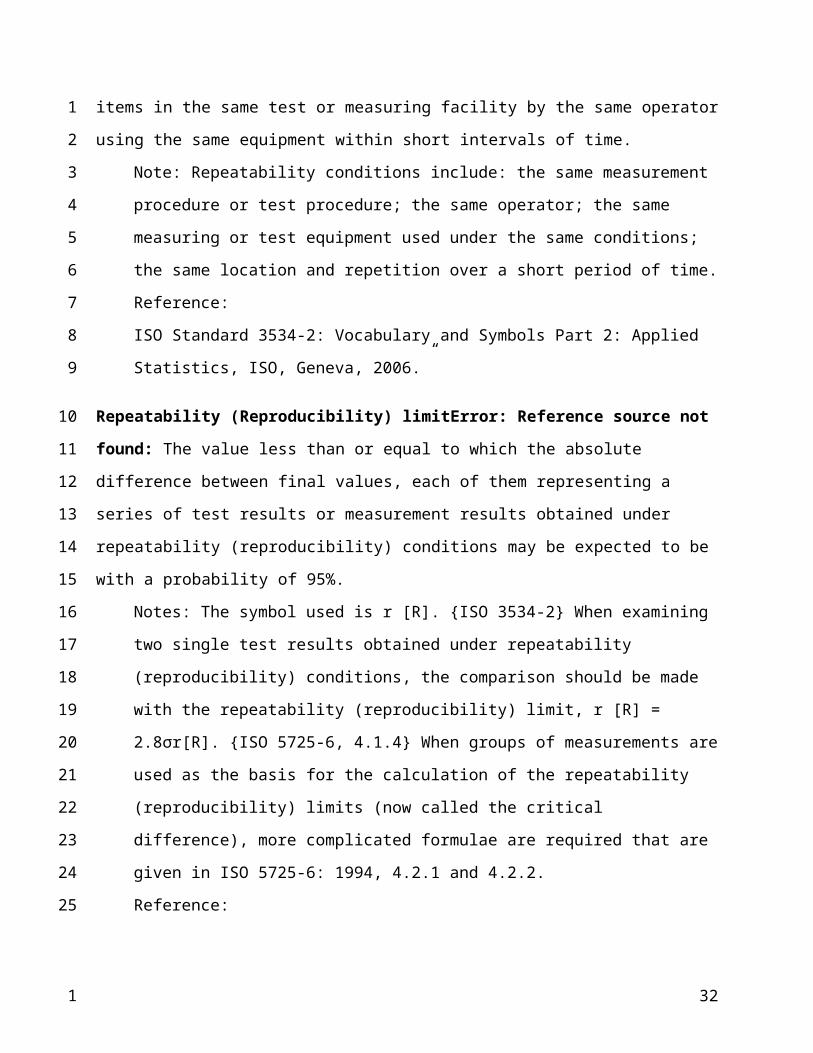
Repeatability (Reproducibility) limitError: Reference source not found: The value less than
or equal to which the absolute difference between final values, each of them representing a series
of test results or measurement results obtained under repeatability (reproducibility) conditions
may be expected to be with a probability of 95%.
Notes: The symbol used is r [R]. {ISO 3534-2} When examining two single test results
obtained under repeatability (reproducibility) conditions, the comparison should be made
with the repeatability (reproducibility) limit, r [R] = 2.8σr[R]. {ISO 5725-6, 4.1.4} When
groups of measurements are used as the basis for the calculation of the repeatability
(reproducibility) limits (now called the critical difference), more complicated formulae are
required that are given in ISO 5725-6: 1994, 4.2.1 and 4.2.2.
Reference:
ISO Standard 3534-2: Vocabulary and Symbols Part 2: Applied Statistics, ISO, Geneva,
2006
ISO 5 725-6 “Accuracy (trueness and precision) of a measurement methods and results—
Part 6: Use in practice of accuracy value”, ISO, 1994
Codex Alimentarius Commission, Procedural Manual, 17th edition, 2007.”
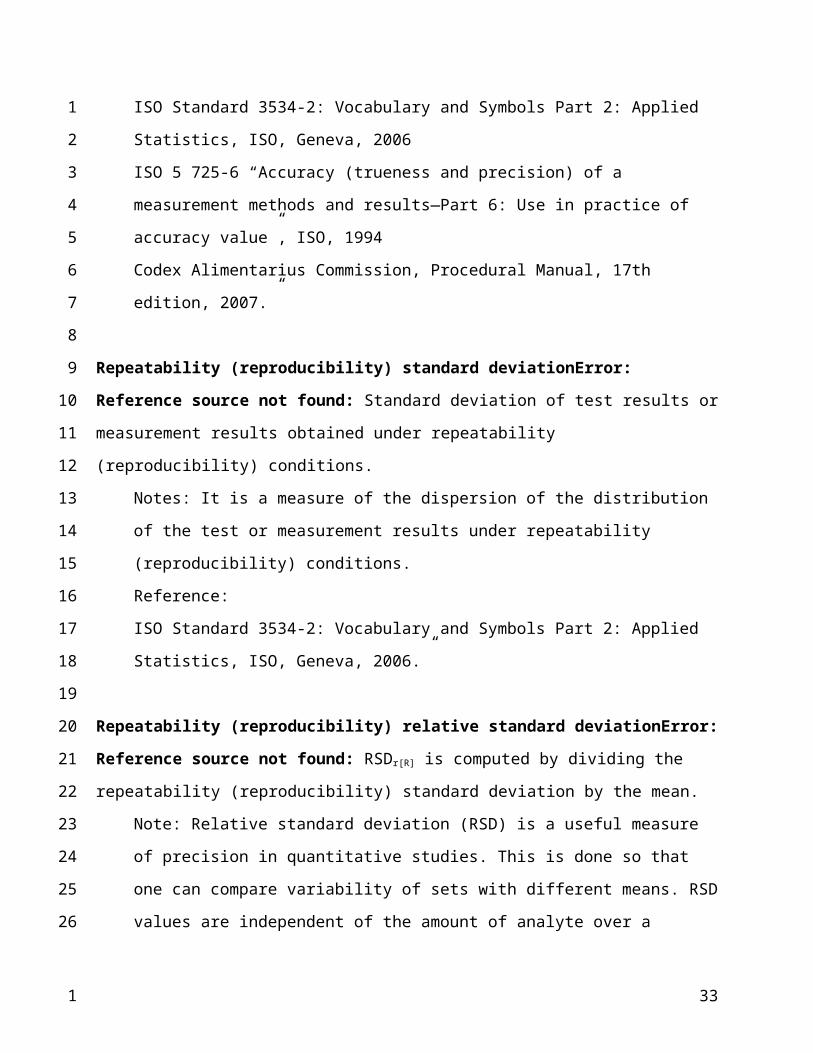
Repeatability (reproducibility) standard deviationError: Reference source not found:
Standard deviation of test results or measurement results obtained under repeatability
(reproducibility) conditions.
Notes: It is a measure of the dispersion of the distribution of the test or measurement
results under repeatability (reproducibility) conditions.
Reference:
19
1
2
3
4
5
6
7
8
9
10
11
12
13
14
15
16
17
18
19
20
21
22
23
24
25
26
27
28
29
30
31
1

ISO Standard 3534-2: Vocabulary and Symbols Part 2: Applied Statistics, ISO, Geneva,
2006.”
Repeatability (reproducibility) relative standard deviationError: Reference source not
found: RSDr[R] is computed by dividing the repeatability (reproducibility) standard deviation by
the mean.
Note: Relative standard deviation (RSD) is a useful measure of precision in quantitative
studies. This is done so that one can compare variability of sets with different means. RSD
values are independent of the amount of analyte over a reasonable range and facilitate
comparison of variabilities at different concentrations. The result of a collaborative test
may be summarized by giving the RSD for repeatability (RSDr) and RSD for
reproducibility (RSDR).
Reference:
AOAC International methods committee guidelines for validation of qualitative and
quantitative food microbiological official methods of analysis, 2002.”
Reproducibility conditionsError: Reference source not found: Observation conditions where
independent test/measurement results are obtained with the same method on identical
test/measurement items in different test or measurement facilities with different operators using
different equipment.
Reference:
ISO Standard 3534-2: Vocabulary and Symbols Part 2: Applied Statistics, ISO, Geneva,
2006.”
ResultError: Reference source not found: Set of values being attributed to a measurand
together with any other available relevant information
Notes: A result of measurement generally contains ‘relevant information’ about the set of
values, such that some may be more representative of the measurand than others. This may
be expressed in the form of a probability density function. A result of measurement is
generally expressed as a single measured value and a easurement uncertainty. If the
measurement uncertainty is considered to be negligible for some purpose, the measurement
result may be expressed as a single measured value. In many fields, this is the common
20
1
2
3
4
5
6
7
8
9
10
11
12
13
14
15
16
17
18
19
20
21
22
23
24
25
26
27
28
29
30
31
1

way of expressing a measurement result. In the traditional literature and in the previous
edition of the VIM, result was defined as a value attributed to a measurand and explained
to mean an indication or an uncorrected result or a corrected result according to the
context.
Reference:
VIM, International vocabulary for basic and general terms in metrology, 3rd Edition, 2007,
ISO, Geneva.”
Representative AnalyteError: Reference source not found: Analyte chosen to represent a
group of analytes which are likely to be similar in their behaviour through a multi-residue
analytical method, as judged by their physico-chemical properties e.g. structure, water solubility,
Kow, polarity, volatility, hydrolytic stability, pKa etc.”
Represented AnalyteError: Reference source not found: Analyte having physico-chemical
properties which are within the range of properties of representative analytes.”
Representative CommodityError: Reference source not found: Single food or feed used to
represent a commodity group for method validation purposes. A commodity may be considered
representative on the basis of proximate sample composition, such as water, fat/oil, acid, sugar
and chlorophyll contents, or biological similarities of tissues etc.”
Ruggedness: The ruggedness of an analytical method is the resistance to change in the results
produced by an analytical method when minor deviations are made from the experimental
conditions described in the procedure. It is tested by deliberately introducing small changes to
the procedure and examining the effect on the results. Ruggedness testing should not be used to
determine critical control points (these should be determined earlier during method development)
and critical control points should not be included in ruggedness testing, as they are known to
have a significant impact on the analysis.Error: Reference source not found, Error: Reference source not found
Robustness (ruggedness)Error: Reference source not found: A measure of the capacity of an
analytical procedure to remain unaffected by small but deliberate variations in method
parameters and provides an indication of its reliability during normal usage.
21
1
2
3
4
5
6
7
8
9
10
11
12
13
14
15
16
17
18
19
20
21
22
23
24
25
26
27
28
1

Reference:
ICH Topic Q2 Validation of Analytical Methods, the European Agency for the Evaluation
of Medicinal Products: ICH Topic Q 2 A - Definitions and Terminology
(CPMP/ICH/381/95), 1995
Harmonized guidelines for single laboratory validation of methods of analysis, Pure and
Appl. Chem., 2002.”
Selectivity: This term is defined in the Codex Manual of Procedures as “the extent to which a
method can determine particular analyte(s) in mixtures or matrices without interference from
other components of similar behaviour”.Error: Reference source not found Other definitions
include “The extent to which other substances interfere with the determination of a substance
according to a given procedure.”21 It has been defined in an AOAC guidance document as “the
extent to which the (analytical) method can determine particular analyte(s) in a complex mixture
without interference from the other components in the mixture.”Error: Reference source not
found
The IUPAC Gold BookError: Reference source not found defines selectivity in analysis as:
“(qualitative): The extent to which other substances interfere with the determination of a
substance according to a given procedure.
(quantitative): A term used in conjunction with another substantive (e.g. constant, coefficient,
index, factor, number) for the quantitative characterization of interferences.”
[It is important to note that while many analytical chemistry texts and older papers in scientific
journals use the term “specificity” for “selectivity”, the term “selectivity” is now recommended
and use of the term specificity is discouraged.Error: Reference source not found It is considered
that a method is either “specific” or it is “non-specific”, while the term selectivity implies that
there may be varying degrees of “selectivity”.]
SelectivityError: Reference source not found: Selectivity is the extent to which a method can
determine particular analyte(s) in a mixture(s) or matrice(s) without interferences from other
components of similar behaviour.
22
1
2
3
4
5
6
7
8
9
10
11
12
13
14
15
16
17
18
19
20
21
22
23
24
25
26
27
28
29
30
1
Note: Selectivity is the recommended term in analytical chemistry to express the extent to
which a particular method can determine analyte(s) in the presence other components.
Selectivity can be graded. The use of the term specificity for the same concept is to be
discouraged as this often leads to confusion.
Reference:
Selectivity in analytical chemistry, IUPAC, Pure Appl Chem, 2001
Codex Alimentarius Commission, Alinorm 04/27/23, 2004
Codex Alimentarius Commission, Procedural Manual, 17th edition, Food and Agriculture
Organization of the United Nations, World Health Organization, 2007.”
Sensitivity: Describes the change in instrument response for a given concentration change. It is
represented by the slope of the calibration curve and can be determined by a least squares
procedure, or experimentally, using samples containing various concentrations of the
analyteError: Reference source not found. (1) It is also defined as “change in the response
divided by the change in the concentration of a standard (calibration) curve; i.e., the slope si of
the analytical calibration curve”Error: Reference source not found. The IUPAC Gold BookError:
Reference source not found defines the term sensitivity, used “in metrology and analytical
chemistry”, as:
“The slope of the calibration curve. If the curve is in fact a 'curve', rather than a straight line, then
of course sensitivity will be a function of analyte concentration or amount. If sensitivity is to be a
unique performance characteristic, it must depend only on the chemical measurement process,
not upon scale factors.”
SensitivityError: Reference source not found: Quotient of the change in the indication of a
measuring system and the corresponding change in the value of the quantity being
measured.
Notes: The sensitivity can depend on the value of the quantity being measured. The change
considered in the value of the quantity being measured must be large compared with the
resolution of the measurement system.
Reference:
VIM, International vocabulary for basic and general terms in metrology, 3rd Edition, 2007,
ISO, Geneva.”
23
1
2
3
4
5
6
7
8
9
10
11
12
13
14
15
16
17
18
19
20
21
22
23
24
25
26
27
28
29
30
31
1
Surrogate matrix: When authentic blank tissue does not exist, a surrogate may be used for
validation experiments. This would consist of a closely related matrix (i.e., similar chemical
composition) which may have low or non-detected levels of the analyte(s) of interest. For
biological matrices, surrogates should have similar contents of protein, fat, carbohydrate,
moisture and salt.
SurrogateError: Reference source not found: Pure compound or element added to the test
material, the chemical and physical behavior of which is taken to be representative of the
native analyte.
Reference:
Harmonized guidelines for the use of recovery information in analytical measurement,
1998.”
Systematic errorError: Reference source not found: Component of measurement error that in
replicate measurements remains constant or varies in a predictable manner.
Notes: A reference value for a systematic error is a true quantity value, or a measured value
of a measurement standard of neglible measurement uncertainty, or a conventional value.
Systematic error and its causes can be known or unkown. A correction can be applied to
compensate for a known systematic error. Systematic error equals measurement error
minus random measurement error.
Reference:
VIM, International vocabulary for basic and general terms in metrology, 3rd edition,
2007.”
TruenessError: Reference source not found: The closeness of agreement between the
expectation of a test result or a measurement result and the true value.
Notes: The measure of trueness is usually expressed in terms of bias. Trueness has been
referred to as “accuracy of the mean”. This usage is not recommended. In practice the
accepted reference value is substituted for the true value. Expectation is the expected value
of a random variable, e.g. assigned value or long term average {ISO 5725-1}
Reference:
24
1
2
3
4
5
6
7
8
9
10
11
12
13
14
15
16
17
18
19
20
21
22
23
24
25
26
27
28
29
30
1

ISO Standard 3534-2: Vocabulary and Symbols Part 2: Applied Statistics, ISO, Geneva,
2006
ISO Standard 5725-1: Accuracy (trueness and precision) of measurement methods and
results, Part 1:
General principles and definitions, ISO, Geneva, 1994.”
True valueError: Reference source not found: Quantity value consistent with the definition of
a quantity.
Notes: In the error approach to describing measurement, a true quantity value is considered
unique and in practice unknowable. The uncertainty approach is to recognize that, owing to
the inherently incomplete amount of detail in the definition of quantity, there is not a single
true quantity value, but rather a set of quantity values consistent with the definition of a
quantity. However, this set of values is, in principle and in practice unknowable. Other
approaches dispense altogether with the concept of true quantity value and rely on the
concept of metrological compatibility of measurement results for assessing their validity.
When the definitional uncertainty associated with the measurand is considered to be
negligible compared to the other components of the measurement uncertainty the
measurand may be considered to have an essentially “unique” true value.
Reference:
VIM, International vocabulary for basic and general terms in metrology, 3rd Edition, 2007,
ISO, Geneva.”
ValidationError: Reference source not found: Verification, where the specified requirements
are adequate for an intended use.
References:
VIM, International vocabulary for basic and general terms in metrology, 3rd Edition, 2007,
ISO, Geneva.”
Validated Test MethodError: Reference source not found: An accepted test method for
which validation studies have been completed to determine the accuracy and reliability of this
method for a specific purpose.
25
1
2
3
4
5
6
7
8
9
10
11
12
13
14
15
16
17
18
19
20
21
22
23
24
25
26
27
28
29
30
31
1

Reference:
ICCVAM Guidelines for the nomination and submission of new, revised and alternative
test methods, 2003.”
Validated rangeError: Reference source not found: That part of the concentration range of an
analytical method which has been subjected to validation.
Reference:
Harmonized guidelines for single-laboratory validation of methods of analysis, 2002.”
VerificationError: Reference source not found: Provision of objective evidence that a given
item fulfills specified requirements.
Notes: When applicable method uncertainty should be taken into consideration. The item
may be e.g. a process, measuring procedure, material, compound or measuring system. The
specified requirement may be that a manufacturer’s specifications are met. Verification in
legal metrology, as defined in VIM and in conformity assessment in general pertains to the
examination and marketing and/or issuing of a verification certificate for a measuring
system. Verification should not be confused with calibration. Not every verification is a
validation. In chemistry, verification of the identity of the entity involved or of the activity,
requires a description of the structure and properties of that entity or activity.
References:
VIM, International vocabulary for basic and general terms in metrology, 3rd Edition, 2007,
ISO, Geneva.”
Performance Criteria
The Codex Committee on Methods of Analysis and Sampling is currently considering
new guidance for inclusion in the Codex Manual of Procedures with respect to implementation
of the criteria approach for analytical methodsError: Reference source not found. This guidance
is based on accepted approaches to the establishment of performance criteria for analytical
methods22,23,24 and will have been subject to extensive consultation by representatives of major
international organizations and national regulatory authorities prior to acceptance and
26
1
2
3
4
5
6
7
8
9
10
11
12
13
14
15
16
17
18
19
20
21
22
23
24
25
26
27
28
29
30
31
1

implementation and therefore it is recommended that these recommendations should be
considered for inclusion in guidance on single laboratory validation of methods developed for
use by this working group.
1 ISO (1999). ISO/IEC-17025: General requirements for the competence of calibration and testing laboratories. International Organization for Standardization, Geneva.
2 CAC (1997). CAC/GL 27-1997. Guidelines for the Assessment of the Competence of Testing Laboratories Involved in the Import and Export Control of Food.
3 Thompson, M., & Wood, R. (1995). Harmonized Guidelines for Internal Quality Control in Analytical Chemistry Laboratories. Pure & Appl. Chem. 67: 649-666.
4 Thompson, M. and Wood, R. 1993. International Harmonized Protocol for Proficiency Testing of (Chemical) Analytical Laboratories. Pure & Appl. Chem. 65: 2132-2144.
5 CAC (2009). Codex Alimentarius Commission Procedural Manual, 17th ed., Joint FAO/WHO Food Standards Program; ftp://ftp.fao.org/codex/Publications/ProcManuals/Manual_17e.pdf; accessed March 24, 2009.
6 CAC (2008). ALINORM 08/31/23; Report of the twenty-ninth session of the Codex Committee on Methods of Analysis and Sampling, Budapest, Hungary, 10 - 14 March 2008, Appendix II, pp. 31-33; http://www.codexalimentarius.net/download/report/699/al31_23e.pdf; accessed March 24, 2009.
7 ISO 8402 (1994).
8 Eurachem (1998). The Fitness for Purpose of Analytical Methods - A Laboratory Guide to Method Validation and Related Topics. http://www.eurachem.org/guides/valid.pdf; accessed March 24, 2009.
9
? Thompson, M., Ellison, S.L.R., and R. Wood. 2002. Harmonized Guidelines for Single Laboratory Validation of Methods of Analysis. (IUPAC Technical Report). Pure Appl. Chem., Vol. 74, No. 5, pp. 835–855.
10 Youden, W.J., & Steiner, E.H. (1975) Statistical Manual of the AOAC, pp.33-36.
27
1
2
3
4
5
6
123456789
1011121314151617181920212223242526272829
303132
333435
36

Table 2: Guidelines for establishing numeric values for analytical method performance criteria,
as proposed by the Codex Committee on Methods of Analysis and Sampling (CCMAS)Error:
Reference source not found:
11 AC (2007). Codex General Standard for Contaminants and Toxins in Foods - Codex Stan 193-1995, Rev.3-2007.
12 EU (2006). Commission Regulation (EC) No 1881/2006 of 19 December 2006 setting maximum levels for certain contaminants in foodstuffs. Official Journal of the European Union, L 364: 5-24.
13 EU (2001). COMMISSION DIRECTIVE 2001/22/EC of 8 March 2001 laying down the sampling methods and the methods of analysis for the official control of the levels of lead, cadmium, mercury and 3-MCPD in foodstuffs. Official Journal of the European Union, L77: 14-21
.14 HC (2009). Food & Drug Act and Regulations, B.15.003;
http://laws.justice.gc.ca/en/showtdm/cr/C.R.C.-c.870; accessed March 25, 2009.
15 HC (2007). Canadian Standards ("Maximum Limits") for Various Chemical Contaminants in Foods, Heakth Canada, Ottawa, ON, Canada; http://www.hc-sc.gc.ca/fn-an/securit/chem-chim/contaminants-guidelines-directives-eng.php; accessed March 25, 2009.
28
1
2
3
4
5
6
7
8
9
10
11
12
13
14
15
16
17
123456789
10111213141516
1718192021
38
Method Applicability The method has to be applicable for the specified provision, specified commodity and the specified level(s) (maximum and/or minimum) (ML). The minimum applicable range of the method depends on the specified level (ML) to be assessed, and can either be expressed in terms of the reproducibility standard deviation (sR) or in terms of LOD and LOQ.
Minimumapplicable range
For ML ≥ 0.1 mg/kg, [ML - 3 sR , ML + 3 sR ]For ML < 0.1 mg/kg, [ML - 2 sR , ML + 2 sR ]sR
a = standard deviation of reproducibilityLimit ofDetection (LOD)
For ML ≥ 0.1 mg/kg, LOD ≤ ML · 1/10For ML < 0.1 mg/kg, LOD ≤ ML · 1/5
Limit ofQuantification (LOQ)
For ML ≥ 0.1 mg/kg, LOQ ≤ ML · 1/5For ML < 0.1 mg/kg, LOQ ≤ ML · 2/5
Precision For ML ≥ 0.1 mg/kg, HorRat value ≤ 2For ML < 0.1 mg/kg, the RSDTR < 22%.RSDR
b = relative standard deviation of reproducibilityRecovery (R) Concentration Ratio Unit Recovery
(%)100 1 100% (100
g/100g)98 – 102
≥10 10-1 ≥ 10% (10 g/100g)
98 – 102
≥1 10-2 ≥ 1% (1 g/100g) 97 - 103≥0.1 10-3 ≥ 0.1% (1 mg/g) 95 – 1050.01 10-4 100 mg/kg 90 – 1070.001 10-5 10 mg/kg 80 – 1100.0001 10-6 1 mg/kg 80 – 1100.00001 10-7 100 μg/kg 80 – 1100.000001 10-8 10 μg/kg 60 – 1150.0000001 10-9 1 μg/kg 40 – 120Other guidelines are available for expected recovery ranges in specific areas of analysis. In cases where recoveries have been shown to be a function of the matrix other specified requirements may be applied.
Trueness For the evaluation of trueness preferably certified reference material should beused.
a The sR should be calculated from the Horwitz / Thompson equation. When the Horwitz / Thompson equation is
not applicable (for an analytical purpose or according to a regulation) or when “converting” methods into criteria
then it should be based on the sR from an appropriate method performance study.b The RSDR should be calculated from the Horwitz / Thompson equation. When the Horwitz / Thompson equation
is not applicable (for an analytical purpose or according to a regulation) or when “converting” methods into criteria
then it should be based on the RSDsR from an appropriate method performance study.
29
1
2
3
4
5
6
21

Performance Characteristics
In order for a method to be fit-for-purpose certain performance requirements should be evaluated
and met. Listed below are the requirements for a quantitative method. A screening or
confirmation method may require different, usually fewer, parameters.
Ruggedness (completed during method development phase)
Selectivity (completed during method development phase)
Matrix Effects (may be completed during method development phase)
Limit of Detection (LOD)
Limit of Quantitation (LOQ)
Analytical range
Linearity
Stability of analyte in standard solution
Stability of analyte in matrix
Stability of analyte in extract/digest
Accuracy
Repeatability of detection system (may be completed during method development phase)
Repeatability of method
Intermediate precision
Reproducibility (if appropriate)
Measurement Uncertainty
30
1
2
3
4
5
6
7
8
9
10
11
12
13
14
15
16
17
18
19
20
21
22
1

Technical Guidelines & Approaches
Linear Range and Calibration Curve
A typical chemical measurement process at trace concentrations involves two types of
calibration, one involving the determination of the detector response to changing concentrations
of pure standard (instrument response), while the second assesses the response to changes in
analyte concentration in the presence of matrix co-extractives and reagents. The first, referred to
as the calibration function, is defined as the “functional (not statistical) relationship for the
chemical measurement process, relating the expected value of the observed (gross) signal or
response variable E(y) to the analyte amount . The corresponding graphical display for a single
analyte is referred to as the calibration curve. When extended to additional variables or analytes
which occur in multicomponent analysis, the curve “becomes a calibration surface or
hypersurface”25. The limit of detection and the limit of quantification, when obtained from the
calibration function, are the instrumental detection and quantification limits. It should be
specified whether these determinations are based on pure analyte only or pure analyte in the
presence of reagents used in the method, as the detector responses may differ. This function is
commonly used when the method of “external calibration” is applied in a method.
The second type of calibration is referred to as the analytical function, defined as a
“function which relates the measured value Ca to the instrument reading, X, with the value of all
interferants, Ci, remaining constant. This function is expressed by the following regression of the
calibration results, Ca = f(X)”26. This is the calibration result obtained when the response of the
detector to the analyte is assessed in the presence of typical matrix co-extractives or digestion
products from the sample material in which the analyte concentration is being measured.
Detection and quantification limits derived from this calibration are the “method” detection and
quantification limits and are considered to provide a more accurate portrayal of the actual
performance capabilities of an analytical method. Since they reflect any interferences or matrix
enhancement or suppression effects, as well as analyte recovery from the matrix during the
performance of the analytical method, the detection and quantification limits determined from
31
1
2
3
4
5
6
7
8
9
10
11
12
13
14
15
16
17
18
19
20
21
22
23
24
25
26
27
28
29
1
these experiments are in most cases (the exception being matrix enhancement effects on the
detector) higher than the equivalent instrumental limits of detection and quantification
determined using pure analyte, or pure analyte in the presence of method reagents. This method
of calibration is used in internal standard calibration.
Instrument calibration may be determined by use of external or internal standard
calibrations, but the calibration approach used should be clearly stated. In most circumstances
involving elemental analysis, external standard calibration is the method of choice. Linear range
is determined by the injection of standard solutions in order to determine at what level the
instrument response no longer conforms to a linear equation (y = mx + b). This is determined in
the following manner:
Injections of calibration solutions (minimum six) made up in similar solvent/reagent as
the samples.
The concentrations of the solutions must be evenly spaced to determine the precise level
at which the calibration curve is no longer linear.
The range of concentration should encompass the expected concentration range from
routine samples if known.
The amount or concentration of analyte injected is plotted vs. the instrument response to
determine the linear portion of the curve.
The instrument linear range is used to determine the analyte concentration range for which the
method will be fit for purpose.
Matrix effect
Blank Matrix
Once the linearity has been determined the effect of the matrix on the instrument
response must be determined. The matrix may alter the results or create an enhanced or
32
1
2
3
4
5
6
7
8
9
10
11
12
13
14
15
16
17
18
19
20
21
22
23
24
25
26
1
suppressed response from the detector. In order to determine matrix effect, calibration curves of
neat and matrix fortified standards must be prepared and compared. The matrix fortified
calibration curves are prepared by using extracted/digested blank matrix as diluent. Prior to
reconstitution of the samples, fortify the extracts with aliquots of standards to provide the
required concentration in the final solution to be equivalent to that of neat standards. The
standards are analysed by duplicate or triplicate injections. When the results obtained for matrix-
fortified standards are lower (or higher) than the results obtained for pure standards taken
through the complete analysis, the results may be due to low recovery of analyte from the matrix
material (or the presence of interferences when high recoveries are obtained) or may be due to
matrix suppression or enhancement effects changing detector response. To check on these
possibilities, compare the results obtained for pure standards, pure standards taken through the
complete analysis, standards spiked into blank matrix extract and standards added to matrix prior
to extraction. The following comparisons can then be made:
Pure standards versus pure standards taken through the analysis is indicative of any losses
of analyte which are related to the method, while enhanced results may indicate reagent
contamination.
Pure standards taken through the analysis compared with pure standards added to
extracted or digested extracts provides an indication of matrix enhancement or
suppression effects on the detection system.
Pure standards added to blank matrix after extraction or digestion, compared to pure
standards fortified in matrix prior to extraction or digestion, provides an indication of
losses of analyte during processing.
Calibration curves for the neat and matrix fortified standards are prepared by plotting the
average response of the standard solution against the standard concentration. Differences
(>10%) of the slope of the matrix fortified calibration curve in relation to that of the neat
standards, or significant changes in the elution profile indicates that the matrix does indeed affect
the instrument response. If this is the case the routine analysis will have to be performed using
matrix fortified standards or possibly an internal standard.
33
1
2
3
4
5
6
7
8
9
10
11
12
13
14
15
16
17
18
19
20
21
22
23
24
25
26
27
28
1

There are several additional considerations which affect the experimental design and
specifically the choice of matrices and analytes for validation of method performance. In a
regulatory environment, such as testing of foods for the presence of residues or contaminants,
there are many sample materials which potentially require testing. Resources are usually not
available to fully validate each analytical method for all analytes and matrices to which it may be
applied. Therefore, the concepts of representative commodityError: Reference source not found
(matrix) and representative analytesError: Reference source not found have been proposed to
facilitate method validation and routine application. Using this approach, for example, in
validating a method for application to “fish”, representative matrices are salmon for “high fat”
finfish, tilapia for “low fat”, shrimp for “crustaceans”. Apples may be the representative matrix
for apples and pears, oranges for “citrus fruit” and strawberries for “berries”, while head lettuce
may represent “leafy vegetables” and carrots may represent “root crops”. Once the method has
been validated for an analyte or analytes on the “representative commodity”, it is considered to
be applicable to all commodities represented by that matrix until performance issues are
observed when the method is applied to for the first time to a less commonly analyzed member
of the group. When this happens, further work is required to adapt and validate the method for
that application.
Calibration using the analytical function, or internal standardization, approach usually
assumes and requires the availability of representative blank matrix. However, situations will be
encountered when no material is available for a particular commodity which is free of naturally
incurred analyte. Ideally, in such situations, a “representative commodity” which is free of the
analyte can be chosen as a surrogate material for the validation or to represent the commodity
grouping of which the material is considered a member. In some situations, there is no such
material available and mixing of materials may be required to approximate the composition of
the target commodity. The following sections provide some approaches which may be used when
no blank matrix material is available for use in method validation or for method calibration.
No Blank Matrix
If blank matrix cannot be found, such as the case in many elemental analysis techniques,
a different approach is needed. First, test material must be characterized to determine the analyte
34
1
2
3
4
5
6
7
8
9
10
11
12
13
14
15
16
17
18
19
20
21
22
23
24
25
26
27
28
29
1
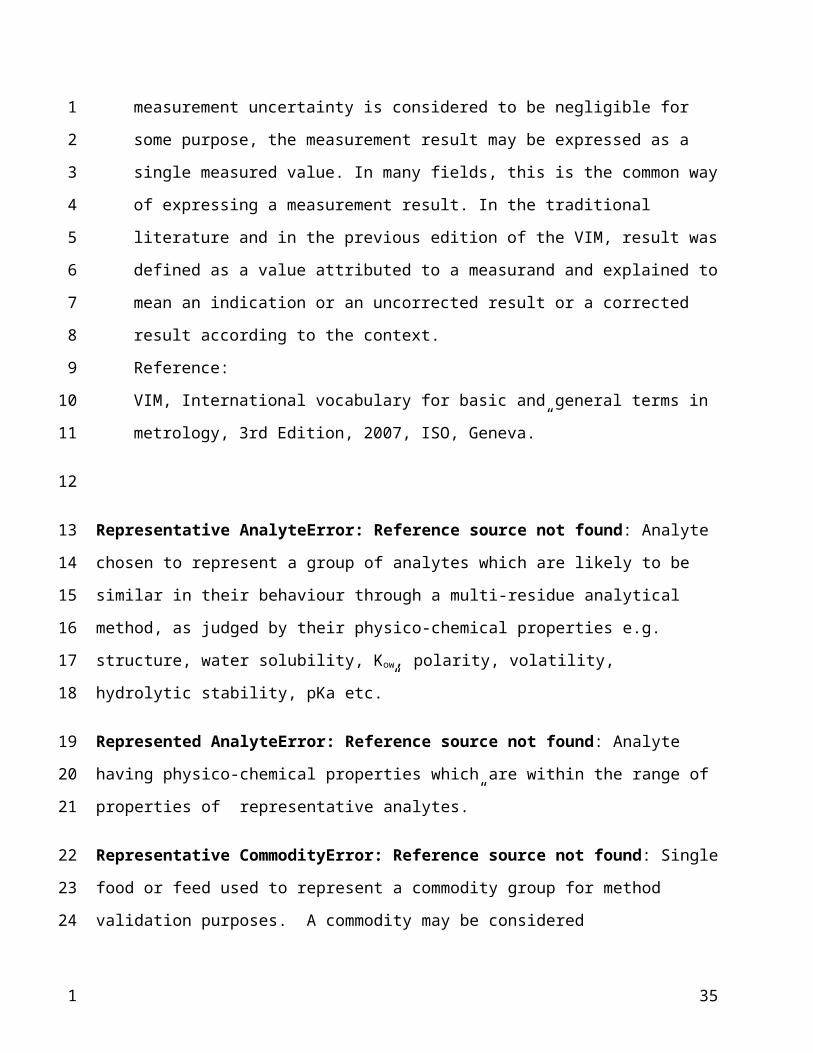
concentration in tissue by conducting a total of 20 determinations over 4 days. Then, prepare a
solution with similar analyte concentration to the matrix under investigation. Run matrix and
prepared solution with varying fortification levels (ie. 3 levels) in the same analytical run and
repeat on a second day. Plot analyte concentration versus instrument response for both matrix
and solution on the same graph. If the slopes of the curves diverge by >10% or final fortification
level concentrations show a >10% difference, then a matrix effect is evident. If curves do not
diverge (<10% difference in slopes), or final fortification level concentrations show a <10%
difference then no matrix effects are evident. When the response to standards (calibration
function) and matrix fortified standards (analytical function) does not differ, then response
related method performance parameters may be assessed using pure standards.
Limit of Detection and Limit of Quantification
There are many procedures typically used to determine LOD and LOQ, however, the
technique chosen can be used as long as it can be defended scientifically. It is recommended to
use an approach that is common to the field of analytical chemistry you are practicing and would
be accepted by other scientific colleagues.
Blank Matrix
The limit of detection (LOD) must be determined for each analyte for which the method
is validated. This is done by evaluating the noise level of 5 blank samples per run on 4 separate
instrument runs (n=20). One approach that could be used to determine the LOD for the analyte
in the matrix is by calculating the average noise of the 20 observations + 3SD. A procedure for
estimation of the LOD and the LOQ from the y-intercept of the calibration curve is used in many
laboratories27, as it is considered to provide a more realistic estimate of these parameters than a
direct calculation from the observed noise level. With some techniques, a reagent blank taken
through the method may be the only means of evaluating background noise. In this case 5
reagent blank samples per run on 4 separate instrument runs (n=20) would be completed and 3
standard deviations of the background analyte level may be used as a good indicator of LOD.
35
1
2
3
4
5
6
7
8
9
10
11
12
13
14
15
16
17
18
19
20
21
22
23
24
25
26
27
1

The limit of quantification (LOQ) can be a mathematical determination based on the LOD. The
LOQ is calculated by multiplying the LOD x 3 (in most cases).
No Authentic Blank Matrix
If no authentic blank matrix can be found and background levels of the analyte are
appreciable, a different approach will be needed. Run 5 reagent blanks per day, for 4 days,
through the digestion procedure and calculate the standard deviation (SD) of the background
noise for these blanks. LOD = 3SD; LOQ = 3LOD
Since all approaches may give varied results for LOQ, an experiment could be conducted
where solutions of the analyte of interest are prepared at increasing intervals between the lowest
and highest calculated LOQ. If multiple injections of a particular solution has acceptable
precision then this concentration would be indicative of the LOQ.
Method Recovery
The recovery of the analyte(s) by the method for each validated matrix is to be
determined by the analysis of that matrix fortified with a specified amount of the analyte(s)Error:
Reference source not found. Recovery studies are to be carried out on a minimum of three
fortification levels. These levels should be chosen depending on the intended use for the
method, and whether authentic blank matrix can be found. Five replicated analyses at each
fortification level shall be carried on 3 separate days. Calculate the mean, standard deviation and
% relative standard deviation for each of the three levels.
Blank Matrix with MRL/Target Level
If authentic blank material is available, and there is a published concentration of
importance (ie. Canadian MRL for mercury in fresh tuna is 0.5 ug/g) then spike levels should be
a factor of this MRL. Spike at ½MRL, 1MRL, and 2MRL with each level replicated 5 times
over three days.
Blank Matrix with no MRL/Target Level
36
1
2
3
4
5
6
7
8
9
10
11
12
13
14
15
16
17
18
19
20
21
22
23
24
25
26
1

If authentic blank material is available, and there is not a published concentration of
importance then spike levels should be a factor of the LOD. Spike at 3LOD, 10LOD, and the
tissue equivalent concentration of the upper limit of the calibration curve. Each level will be
replicated 5 times over three days.
No Blank Matrix with MRL/Target Level
If authentic blank material cannot be found, a surrogate matrix (one in which low or non-
detectable levels of the analyte(s) of interest are present) may be used to fulfill validation
requirements. If an appropriate surrogate matrix cannot be found, spike solution is added to
previously characterized tissue so that target concentration(s) (background level + spike added)
of tissue are equal to ½ MRL, 1MRL and 2MRL with each level replicated 5 times over three
days.
No Blank Matrix with no MRL/Target Level
If authentic blank matrix cannot be found and there is no published MRL or
concentration of interest a surrogate matrix (one in which low or non-detectable levels of the
analyte(s) of interest are present) may be used to fulfill validation requirements. If an
appropriate surrogate matrix cannot be found, spike levels will be determined based on the
previously characterized analyte concentration(s). A low, medium, and high spike level will be
used for this study, ie. spike equivalent to ½X, 1X, and 2X (or upper limit of the calibration
curve) of the analytical range of the characterized tissue concentration.
In all scenarios, spiking at the LOQ may be required for verification purposes (if
possible). Calculate average spike recovery for each level, standard deviation and percent
relative standard deviation (%RSD) and compare to Table 2 above.
Repeatability
As noted previously in the discussion of calibration approaches, there are two types of
repeatability that are to be determined. The first type is a function of the instrument. Instrument
repeatability is determined by repeat injections of the standards as well as a fortified sample at
37
1
2
3
4
5
6
7
8
9
10
11
12
13
14
15
16
17
18
19
20
21
22
23
24
25
26
27
1

each of the fortification levels. The second type is the method repeatability. It is determined by
replicate extraction and analysis of a fortified or incurred material at or near each of the
fortification levels. If a CRM is available, it may be used in repeatability experiments.
Instrument Repeatability
Inject each of the standard solutions that are used to prepare the working calibration
curve as well as an incurred or fortified sample at each of the spike levels 5 times. These
injections should be done in random order to prevent any sort of bias. Calculate average,
standard deviation and percent relative standard deviation (%RSD).
Method Repeatability
Prepare pools of sample material with levels of the analyte(s) at or near the same
concentrations that were used for the method recovery studies. This may be done by using
incurred material or by fortifying material (blank or incurred) with the required amount of the
analyte(s). Prepare five replicate extracts of each of these samples and analyse on the same day.
This process is to be repeated on two other days. Calculate average, standard deviation and
percent relative standard deviation (%RSD).
Intermediate Precision
This parameter is used to determine if there are biases in the method. The bias can come
from the analyst, instrumentation, or other sources. To study this parameter prepare pools of
sample material with, either incurred or fortified, levels of the analyte(s) at or near the same
concentrations that were used for the recovery and repeatability studies. The same material may
be used as was prepared for the repeatability studies if sufficient is remaining. As a minimum
the study must be carried out by an additional analyst over three separate days. The second
analyst is to prepare all fresh reagents and the samples are to be extracted and analysed in 5
replicates over three separate days by the second analyst. If multiple instruments are available
then the study by the second analyst must be carried out on the second instrument, to take into
account any instrument bias.
38
1
2
3
4
5
6
7
8
9
10
11
12
13
14
15
16
17
18
19
20
21
22
23
24
25
26
27
1

Measurement Uncertainty
The uncertainty of a result from a chemical analysis can be caused by many issues. In
practice the uncertainty on the result may arise from many possible sources, including examples
such as incomplete definition, sampling, matrix effects and interferences, environmental
conditions, uncertainties of masses and volumetric equipment, reference values, approximations
and assumptions incorporated in the measurement method and procedure, and random
variation.Error: Reference source not found, 28
A document which provides extensive guidance on the estimation of measurement
uncertainty in analytical methods is available from Eurachem29. Rather than attempting to
calculate the uncertainty from each factor independently and combining the results, our approach
is to the look at the methodology as a whole and group the uncertainty into two categories:
Accuracy and Precision.
Data sets that are to be considered for Accuracy are; recovery, CRM data, PT samples
etc. Data to be included with precision are; intermediate precision, in-house check samples,
CRM data, etc. The relative uncertainty for the method is calculated by determining square root
of the sum of the squares of the respective relative uncertainties for accuracy and precision.
Ruggedness
The ruggedness of an analytical method is the resistance to change in the results produced
by an analytical method when minor deviations are made from the experimental conditions
described in the procedure. The ruggedness of a method is tested by deliberately introducing
small changes to the procedure and examining the effect on the results. Methods should be
39
1
2
3
4
5
6
7
8
9
10
11
12
13
14
15
16
17
18
19
20
21
22
23
24
25
26
27
28
1
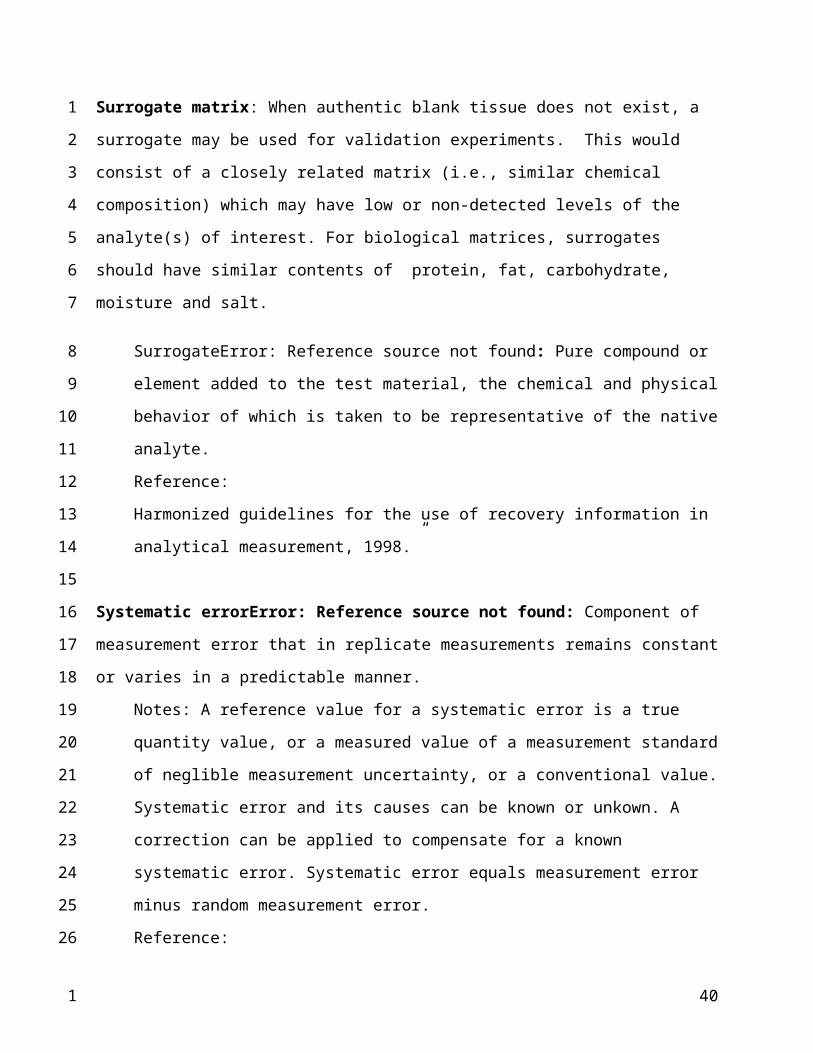
ruggedness tested as the last stage of method development, prior to method validation.
Ruggedness testing should not be used to determine critical control points (these should be
determined earlier during method development) and critical control points should not be included
in ruggedness testing, as they are known to have a significant impact on the analysis.
Ruggedness testing does not need to be performed for each matrix tested as this examination of
matrix effects should be performed in method development. The matrix used for ruggedness
testing should be as representative as possible of the proposed workload, i.e. the most common
matrix, or the matrix intermediate in a quality for which the typical matrices cover a wide variety
(non-fat, low-fat, high-fat).
Examples of variables to be tested include
pH
temperature (extraction, evaporation)
solvent/acids
reagents (age, source, concentrations)
delays in the method
analytical columns
SPE cartridges
sample weight
extraction/digestion (time, technique, solvents/acids)
different instruments
The easiest approach is to use Youden’s factorial approachError: Reference source not
found, where seven variables can be combined in a specific manner to determine the effects of
all seven variables using eight combinations in a single experiment. If the method has fewer
variables to be tested, then blanks can be included, or variables can be examined individually.
The experiment should also be carried out in duplicate in order to eliminate the possibility of a
single sample affecting the outcome. Values for each sample should be spike recoveries or
concentrations if incurred/fortified tissue is being used.
29 Ellison, S.L.R., Rosslein, M., & Williams, A., ed. (2000). Quantifying Uncertainty in Analytical Measurement, Second Edition. EURACHEM / CITAC Guide CG4; http://www.eurachem.org/guides/QUAM2000-1.pdf; accessed March 27, 2009.
40
1
2
3
4
5
6
7
8
9
10
11
12
13
14
15
16
17
18
19
20
21
22
23
24
25
26
27
28
29
131415
16
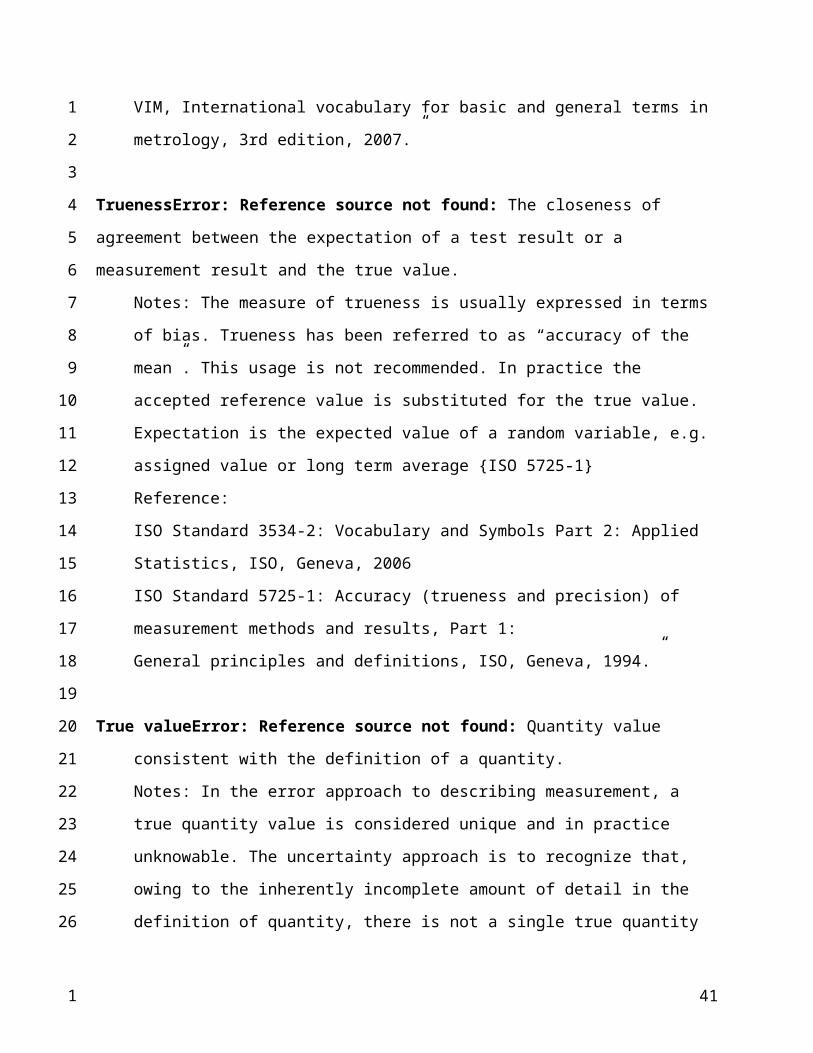
Sample Factor Combinations Measurement
1 A B C D E F G s
2 A B c D e f g t
3 A b C d E f g u
4 A b c d e F G v
5 a B C d e F g w
6 a B c d E f G x
7 a b C D e f G y
8 a b c D E F g z
To determine effect of individual factor,
Effect of A and a: [(s + t + u + v)/4] – [(w + x + y + z)/4] = J
This simplifies to: (4A/4) – (4a/4) = J
Effect of B and b: [(s + t + w + x)/4] – [(u + v + y + z)/4] = K
Effect of C and c: [(s + u + w + y)/4] – [(t + v + x + z)/4] = L
Effect of D and d: [(s + t + y + z)/4] – [(u + v + w + x)/4] = M
Effect of E and e: [(s + u + x + z)/4] – [(t + v + w + y)/4] = N
Effect of F and f: [(s + v + w + z)/4] – [(t + u + x + y)/4] = O
Effect of G and g: [(s + v + x + y)/4] – [(t + u + w + z)/4] = P
After calculating the differences between factors (J-P) examine those values. Small
changes in factors with larger differences can lead to significant changes in results. Determine
which factors create statistically significant changes by performing a two-sample t-test assuming
equal variance for each factor. If the p-value is <0.05 the factor is significant, if the p-value is
>0.15 the factor is not significant, and if 0.05<p<0.15 the factor may be significant.
If factors are determined to be significant the procedural instructions dealing with those
factors should be made more specific and the ruggedness testing repeated, including those factors
41
1
2
3
4
5
6
7
8
9
10
11
12
13
14
15
16
17
18
19
20
21
22
1

with intermediate p-values (0.05<p<0.15). These factors may be determined to be critical
control points, and if this is the case the procedural instructions should be changed to reflect an
acceptable variance.
If intermediate precision data are available then an additional comparison may be made.
Comparing the standard deviation of the method as determined in intermediate precision testing
to the standard deviation of the differences of factors examined during ruggedness testing may
reveal that a combination of factors has a significant effect on the method even though no
individual factors have a significant effect on the method. In this case the procedural instructions
should be made more specific and the ruggedness testing should be repeated using the more
specific instructions.
42
1
2
3
4
5
6
7
8
9
10
11
12
13
14
15
1617181920212223242526272829303132333435
1
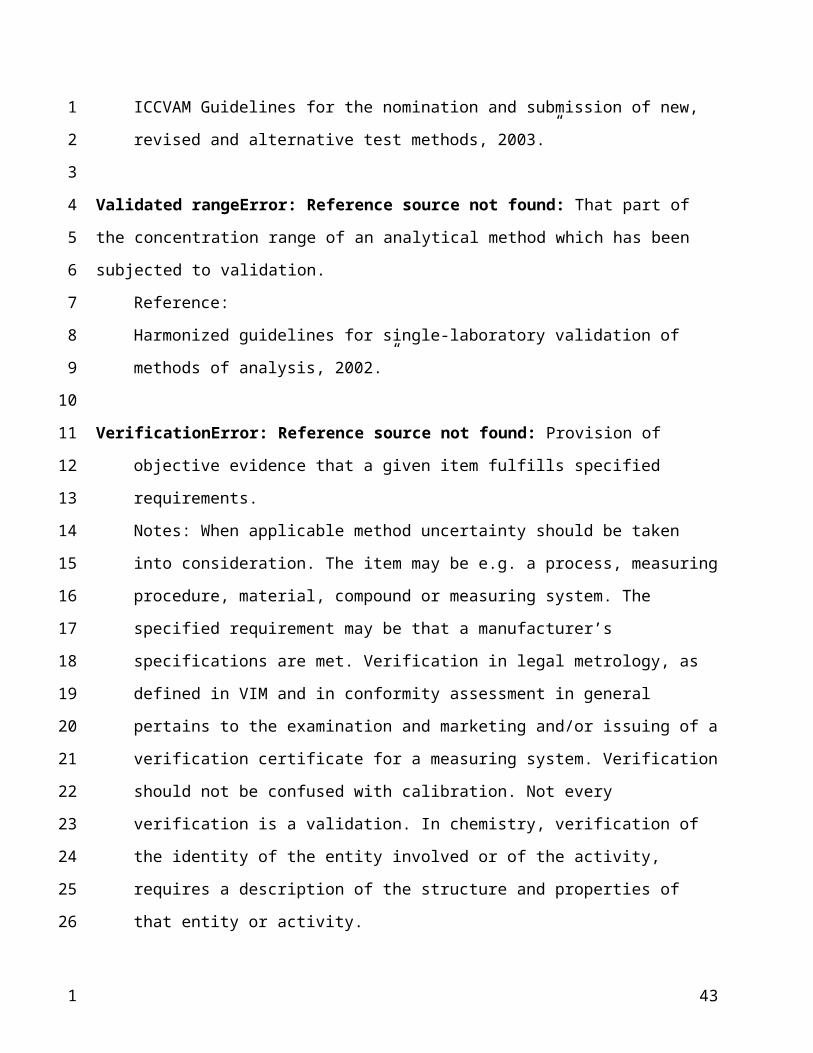
Example of an Experimental Method Validation Plan for Tin in Canned Foods
Method Title: Validation of a Method for the Determination of Tin (Sn) in Canned Pears
Project Participants: Analyst 1, Analyst 2, Analyst 3
Start Date: January 1, 2009
Projected Completion Date: March 31, 2009
Instrument(s): ICP-OES
MRL/Target Level: 250 ug/g
NOTE: For this validation plan, authentic blank pears for Sn was found.
Linearity Survey:
Analysis of standard solutions prepared at equal concentration intervals (minimum 6) to
determine at what concentration the calibration curve is no longer linear. Should include
expected concentration of samples if known.
Analytical Range:
Determined using the LOQ as the lower limit and the upper end of the linear range as the
upper limit.
Matrix Effects:
Blank pear material is digested and as per the method. The resulting digest is then used
as diluent to prepare a calibration curve. A neat standard curve (ie. 10% HCl) is also
prepared. The neat and matrix fortified standards are run on the same day on the ICP-
OES to determine if slope of curves are similar. If similar, then neat standards can be
prepared for the remainder of the validation experiments and for quantifying samples. If
slopes are different (>10% difference), then matrix fortified calibration curves will need
to be prepared for the remainder of the validation experiments and for quantifying
samples.
43
1234
5
6
7
8
9
10
11
12
13
14
15
16
17
18
19
20
21
22
23
24
25
26
27
28
29
30
1

LOD/LOQ:
Since authentic blank pears can be found, run 20 blank matrix tissue samples through
digestion over 4 days and measure the noise level for each. Calculate the average noise
and standard deviation of the 20 data points. LOD may be calculated several ways such
as LOD = 3SD or LOD = noise + 3SD, or using the approach as outlined by Miller and
Miller (1988). LOQ = 3LOD. Since all approaches may give varied results for LOQ, an
experiment should be conducted where solutions of tin are prepared at increasing
intervals between the lowest and highest calculated LOQ. If multiple injections of a
particular solution has an acceptable precision, then this concentration is the LOQ.
Stability:
Analyte in standard solution:
Compare a freshly prepared working standard to one that has been made and stored.
Measure at intervals over a specified time period to determine Sn stability in solution.
Analyte in matrix:
Run a canned pear sample at specified time intervals over the time that the sample would
typically be stored to see if Sn levels degrade or concentrate. Ensure standards used for
the calibration curve are not degraded or expired.
Analyte in sample digest:
Digest a sample with a known concentration of tin and measure daily for a period of a
week.
Recovery:
Since blank pear matrix is available and an MRL exists, fortify blank matrix at 3 levels:
½ MRL, 1MRL and 2MRL. Run five samples per level, on 3 separate days.
Repeatability:
44
1
2
3
4
5
6
7
8
9
10
11
12
13
14
15
16
17
18
19
20
21
22
23
24
25
26
27
28
29
30
1
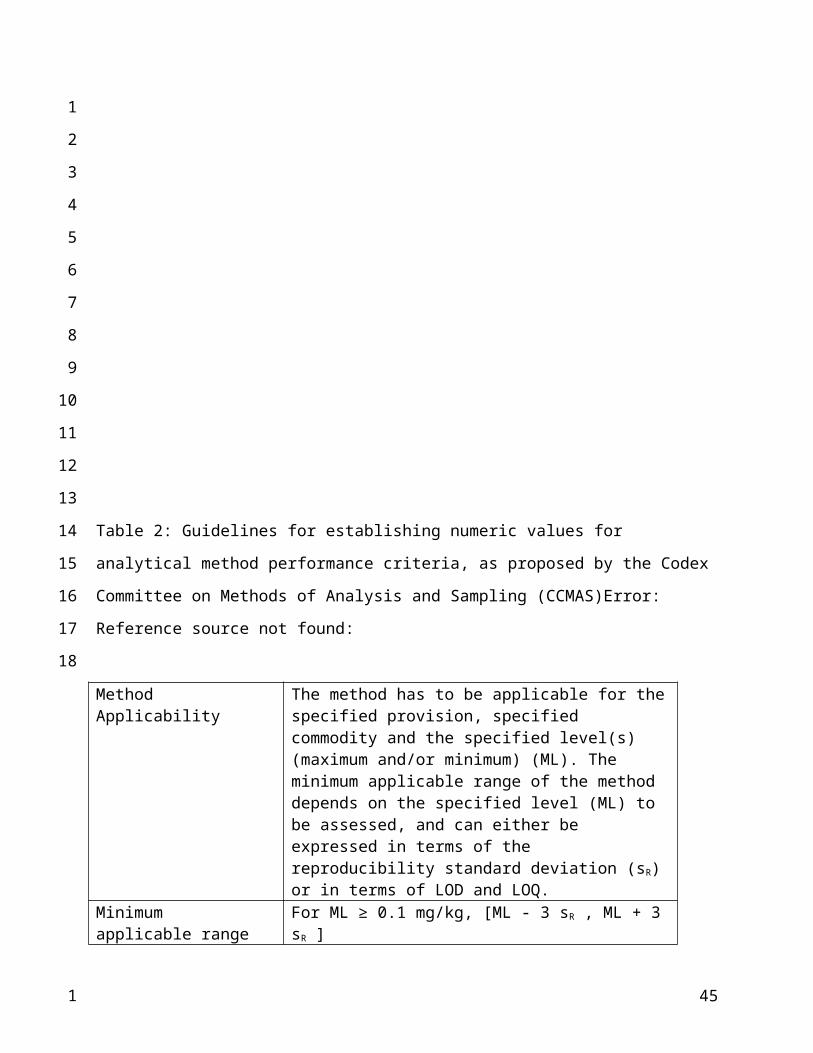
Instrument:
Inject each of the standards of the calibration curve, as well as a CRM or fortified
samples, five times in random order on the same day.
Method:
Make pooled pear material at three levels ½ MRL, 1MRL and 2MRL. Run five samples
per each level over 3 separate days. If a CRM exists for Sn in canned pears (or canned
fruit) incorporate this into these experiments.
Intermediate Precision:
A second analyst in the same laboratory repeats the procedure for method repeatability as
above. If possible use a different ICP-OES instrument.
Reproducibility:
Using our methodology, other laboratories would analyze pooled material at 3 levels as
well CRMs if available.
Measurement Uncertainty:
Data from recovery/repeatability experiments will be used to determine accuracy and
precision. Upon implementation of the method, these values will be updated with
analytical sample data as well as check sample data.
Other:
Other analyses may be required to further validate the method for use in the chemistry
section. Analysis of CRM, inter-laboratory samples, proficiency samples and in-house check
samples add to the method validation data and should be included as this data is available.
45
1
2
3
4
5
6
7
8
9
10
11
12
13
14
15
16
17
18
19
20
21
22
23
24
25
26
27
28
29
30
1

References
17 Anon (1998). AOAC PEER-VERIFIED METHODS PROGRAM- MANUAL ON POLICIES AND PROCEDURES. AOAC International.
18 Alder, L, Holland, PT, Lantos, J, Lee, M, MacNeil, JD, O’Rangers, J, van Zoonen, P, Ambrus, A. 2000. Guidelines for Single-Laboratory Validation of Analytical Methods for Trace-level Concentrations of Organic Chemicals in Principles and Practices of Method Validation, Fajgelj, A, & Ambrus, A (ed.).ISBN 0-85404-783-2. The Royal Society of Chemistry, Cambridge, UK, pp. 179-248 (see also: Alder, L, Holland, PT, Lantos, J, Lee, M, MacNeil, JD, O’Rangers, J, van Zoonen, P, Ambrus, A. 2000. Report of the AOAC/FAO/IAEA/IUPAC Expert Consultation on Single-Laboratory Validation of Analytical Methods for Trace-Level Concentrations of Organic Chemicals, Miskolc, Hungary, November 8-11, 1999. Report published on the website of the International Atomic Energy Agency (IAEA): http://www.iaea.org/trc)
16 IUPAC Compendium of Chemical Terminology (Gold Book). International Union of Applied Chemistry, copyright 2005-2008. http://goldbook.iupac.org
19 EU (2002). European Communities Commission Decision 2002/657/EC, implementing Council Directive 96/23/EC concerning the performance of analytical methods and the interpretation of results. Off. J. European Communities 17.8: L221/8- L221-36.
20 Thompson, M., Ellison, S.L.R., Fajgelj, A., WILLETTS, P. & WOOD, R. (1999). Harmonized guidelines for the use of recovery information in analytical measurement. Pure & Applied Chemistry 71 (2): 337-348.
22 Horwitz, W., Kamps, L. R. and Boyer, K. W. (1980) J. Assoc. Off. Anal.Chem., 1980, 63, 1344.
23 Horwitz, W. and Albert, R. (1996) J. AOAC Int., 79, 589.
24 Thompson, M. Analyst, 2000, 125, 385-386).
21 den Boef, G. & Hulanicki, A. (1983). Recommendations for the usage of selective, selectivity and related terms in analytical chemistry. Pure & Applied Chemistry 55 (3): 553-556.
46
1
456789
101112131415161718192021222324252627283334353637383940414243
44

25 IUPAC Compendium of Chemical Terminology, Electronic version, http://goldbook.iupac.org/C00778.html; accessed April 13, 2009.
26 IUPAC Compendium of Chemical Terminology, Electronic version; http://goldbook.iupac.org/A00332.html; accessed April 13, 2009.
27 Miller J.C., Miller J.N., 1988. Statistics for Analytical Chemistry, 2nd Edition, New York, Ellis Horwood Limited.
28 Standards Council of Canada. 2005. CAN-P-4E (ISO/IEC 17025:2005) General Requirements for the Competence of Testing and Calibration Laboratories.
47
123456789
101112
13