2000 military recruiter · pdf fileiii executive summary since the beginning of the all...
TRANSCRIPT

AUGUST 2002
OVERVIEW REPORT
2000 Military Recruiter Survey


JAMRS Report No. 2002-001August 2002
2000 MILITARY RECRUITER SURVEY:OVERVIEW REPORT
Michael J. Wilson, Kimya S. Lee, Martha G. Franklin, Cynthia V. Helba, and Shelley PerryWestat
Andrea B. ZuckerDefense Human Resources Activity
Sean M. MarshAon Consulting
Barbara J. GeorgeDefense Manpower Data Center
Department of DefenseDefense Human Resources Activity
Joint Advertising, Market Research and Studies4040 N. Fairfax Drive, Arlington, VA 22203-1613

ii
ACKNOWLEDGMENTS
This report was prepared for the Office of the Under Secretary of Defense for Personneland Readiness, Office of Accession Policy. The project officer for the study was Ms. AndreaZucker, Defense Human Resources Activity (DHRA). Mr. Sean Marsh of Aon Consulting andBJ George of the Defense Manpower Data Center also contributed to the report.
The work that was done to produce this report was a true collaboration between DHRA,Westat, and Aon Consulting. We would also like to acknowledge the helpful review of thisreport provided by Capt. Gwen Rutherford, Office of Accession Policy. Her suggestionsmaterially improved this report.
The authors would like to thank the many recruiters who shared their time and opinionswith us. We are collectively grateful for the opportunity to contribute to the body of knowledgeabout the quality of life of our military recruiters.

iii
EXECUTIVE SUMMARY
Since the beginning of the All Volunteer Force in 1973, military recruiters have facedmany challenges. Particularly difficult challenges in the late 1970s and 1980s, along with reportsof recruiter improprieties, led to increased attention from Congress on recruiter quality-of-lifeissues. In 1989, the Directorate for Accession Policy asked the Defense Manpower Data Centerto conduct a survey of recruiters. Subsequent surveys were administered in 1991, 1994, 1996,1998, and 2000. Survey topics have included quality-of-life issues, adequacy of training andresources, goal attainment, satisfaction with leadership, and perceptions of improprieties.
Recruiting Environment
In the fall of 2000, when the 2000 Military Recruiter Survey was administered, militaryrecruiters were facing one of the toughest recruiting environments since the end of conscription.Although the number of youth eligible for military service was on the rise, some militaryServices failed to achieve their missions in the preceding 2 years because of changingenvironmental factors.
A top indicator of recruiting difficulty—youth propensity to join the military—was muchlower, on average, in the 1990s than in the 1980s, partly because of increased options for highschool graduates. College enrollment rates rose steadily during the 1990s, a strong economybrought new civilian-sector job opportunities, and in 2000 the unemployment rate was at itslowest point since implementation of the All Volunteer Force. A continually declining numberof military veterans limited youths’ exposure to knowledgeable adults who could tell stories oranswer their questions about the military. In addition, military advertising budgets wereunstable, making delivery of consistent messages to youth impossible.
In 2000, the Department of Defense and the Services increased recruiting resources inresponse to the current recruiting environment and recent recruiting shortfalls.
Topline Findings
Changes in the recruiting environment and in the resources available to addresschallenges are often reflected in recruiters’ perceptions of their job performance and quality oflife. A set of core questions is asked in each Recruiter Survey to capture changes in recruiters’perceptions. The questions are grouped into five categories: goal achievement, job demands,improprieties, management/supervisory support, and job satisfaction. Overall, the resultsindicated improvement from 1998 to 2000 in recruiters’ attitudes about their jobs and their self-reported performance. Goal achievement was up, and recruiters’ perceptions about the difficultyof achieving goals were less negative. Job demands continued to be a challenge. Recruiterscontinued to work long hours, although fewer recruiters reported foregoing leave because of jobpressures. Perceptions of improprieties, or bending the rules to achieve goal, decreased from1998 levels. Support from management was mixed. Levels of negativity regarding supervisorysupport remained the same, while recruiters reported better teamwork with their superiors.Recruiters indicated no changes in dissatisfaction with recruiting or in their intentions to remainin recruiting.

iv
Model Development
For the 2000 Military Recruiter Survey, the overview report focuses on satisfaction, jobperformance, and strain among active duty production recruiters. Structural equation modelingwith latent variables (SEM) was used to identify the relative and independent strength of nineinfluencing factors (ease of meeting goals, control over duty assignment, hours worked, pressureto meet goals, office appearance, recognition for achievement, supervisor support, perceivedimportance of recruiting, and family concerns) and one mediating factor (perceived strain) ontwo major outcomes (performance and satisfaction with recruiting).
The model was developed in two stages. First, an iterative process was used todetermine how well survey items grouped together to form the 12 constructs. Second, anotheriterative process, informed by an understanding of the recruiting market, was conducted tospecify expected direct and indirect effects of the influencing variables on the outcome variables.For example, according to the model, decreased family concerns is expected to lead to highersatisfaction with recruiting. Model validation and goodness of fit tests indicated that the finalstructural model adequately represents the responses of active duty production recruiters.
Model Findings
Overall, the modeling effort was successful, particularly in explaining satisfaction withrecruiting. The findings indicate that increasing attention to family concerns, increasing supportfor the importance of recruiting, and decreasing strain will directly increase job satisfaction.Also, the job-related factors that most affect satisfaction through strain include, in order of theirrelative strength, decreasing excessive goal pressure, increasing control regarding dutyassignments, increasing recognition for work well done, increasing ease of meeting goals,decreasing the number of hours worked, and improving office appearance.
The model was less successful in predicting job performance (possibly because ofunmeasured factors such as variation in propensity by region and differences in school systemcharacteristics, unemployment rates, and socioeconomic and demographic makeup within andacross recruiting areas). The model constructs most strongly influencing performance includecontrol over duty assignment, ease of meeting goals, and hours worked. Model findings indicatea relatively minor, though statistically significant, influence of strain on performance.
Conclusions
The 2000 Military Recruiter Survey findings show overall improvement in recruiters’perceptions of their jobs and quality of life since 1998. In addition, the model captured manyimportant factors contributing to strain and satisfaction with recruiting. This information mayprove useful in guiding changes in policies and procedures to enhance future recruiters’ qualityof life. For example, the model findings indicate that policy makers and program managersshould continue their efforts to provide tools that aid the recruiting job, to address family issues,and to support the recruiting career field. If the model is to provide a better understanding offactors influencing performance, the current analysis may need to be expanded to includedemographic and economic indicators as well as other recruiting market characteristics.

v
Table of Contents
Chapter 1: Background, Topline Highlights, and Recruiter Profiles............................................. 1
Brief History of the Recruiter Survey ....................................................................................... 1
The FY 2000 Recruiting Environment ..................................................................................... 4
2000 Topline Findings: Highlights .......................................................................................... 8
Demographic and Assignment Profiles .................................................................................. 10
Chapter 2: The Analysis Model ................................................................................................... 15
The Model............................................................................................................................... 16
Concluding Comments............................................................................................................ 24
Chapter 3: The Structural Model ................................................................................................. 25
Model Construction ................................................................................................................ 25
Key Findings........................................................................................................................... 26
Other SEM Results and Information....................................................................................... 30
Chapter 4: Conclusion ................................................................................................................. 37
Further Research ..................................................................................................................... 38
Summary ................................................................................................................................. 39
References..................................................................................................................................... 41
Appendixes
A. Data Collection Procedures and Sampling.............................................................................A-1
B. 2000 Military Recruiter Survey..............................................................................................B-1
C. Topline Findings ....................................................................................................................C-1
D. Reserve Component Model Results.......................................................................................D-1
E. Correlation Matrix ..................................................................................................................E-1
F. Measurement Model ...............................................................................................................F-1
G. Analytic Method ....................................................................................................................G-1
H. Standardized Model Residuals...............................................................................................H-1

vi
Table of Contents (Continued)
List of Tables
Table 1.1 DoD Recruiter Survey: Data Collection Information. ................................................. 3
Table 2.1 Summary of Survey Items Used as Indicators of the Latent Constructs. ..................... 18
Table 3.1 Standardized Total and Indirect Effects of Influencing Constructs on Satisfaction With Recruiting and Performance. ............................................................................... 31
Table 3.2 Standardized Coefficients, Unstandardized Coefficients, and Standard Errors for the Structural Model. ................................................................................................... 33
List of Figures
Figure 1.1 Demographic Profiles: Active Duty DoD, Coast Guard, and Reserve Component Recruiters..................................................................................................................... 12
Figure 2.1 Recruiter Performance and Satisfaction Model........................................................... 17
Figure 3.1 Standardized Coefficients for the Active Duty Model. ............................................... 27

1
CHAPTER 1: BACKGROUND, TOPLINE HIGHLIGHTS, ANDRECRUITER PROFILES
This report contains findings from the 2000 Military Recruiter Survey. It is the latest in aseries of Recruiter Survey reports presenting recruiters’ perceptions about their work and itseffects on their lives.1 The findings in this report are presented primarily within a modelframework that indicates issues and situations that contributed to successful job performance andjob satisfaction among recruiters in 2000. First, however, we provide background informationon the Recruiter Survey, a snapshot of the FY 2000 recruiting environment, highlights on keyindicators from the 2000 Military Recruiter Survey, and profiles of recruiters included in the2000 survey data analysis.
Brief History of the Recruiter Survey
In the years immediately following implementation of the All-Volunteer Force in 1973,the job of military recruiters became much more challenging. Suddenly they were competingwith private industry, colleges and universities, and vocational training organizations to attractqualified youth to military service. Reports grew that pressures to meet accession goals werecreating high levels of stress among recruiters. Those issues were addressed by the HouseCommittee on Appropriations during a 1978 hearing and in subsequent hearings on recruiting(Maxfield, 1990).
In 1983–84, an economic upturn improved employment prospects in the private sector.That change, as well as a declining population of youth during the 1980s and fluctuations inrecruiting resources and accession goals, added to recruiters’ difficulties. Congressional concerngrew that pressures on recruiters to achieve their accession goals in a highly competitiveenvironment were contributing to recruiting improprieties (Maxfield, 1990).
The FY 1990 House Appropriations Conference Committee directed the Services toensure that, in their efforts to meet necessary accession goals, they did not subject recruiters andtheir families to undue pressure and a diminished quality of life (Maxfield, 1990). In response,in 1989 the Directorate for Accession Policy asked the Defense Manpower Data Center (DMDC)to design and administer a survey to enlisted military recruiters from all four active DoDServices. Findings on recruiters’ perceptions of recruiting policies and procedures,improprieties, and quality-of-life issues were provided to all personnel responsible forestablishing recruiting policy and managing recruiting programs (Zucker, 2001).
Accession policy worked with DMDC staff to develop the first survey, which wasadministered in late 1989. Follow-up surveys in 1991, 1994, 1996, 1998, and 2000 have addedto the baseline information collected in 1989 (Zucker, 2001).
1 The 1989 through 1998 surveys were titled DoD Recruiter Survey. In 2000, the name of the survey was changed
to Military Recruiter Survey. In this report, unless we speak specifically of the 2000 survey, we refer to thesurveys as Recruiter Survey.

2
Sample Frame and Target Population
The sampling frame for the 1989 survey included active duty Army, Navy, Air Force,and Marine Corps recruiters. The frame was expanded in 1991 to include Reserve and Guardrecruiters and in 1994 to include Coast Guard recruiters.2 In 1994 and 1996, in an effort to focusthe sampling frame on personnel who had been actively recruiting during the reference period forthe surveys, DMDC asked each Service to send a list of its production recruiters. Because thedefinition of production recruiter varied among the Services, the recruiting personnel lists for theServices that were included in the frames for those 2 years were somewhat inconsistent.However, the survey analysis results were based on a similar target population for each Service(Zucker, 2001; A. Zucker, personal communication, April 4, 2002).
The target population of recruiters in the 2000 survey was recruiters with monthly orannual goals/missions (production recruiters) and at least 1 year of recruiting experience.Similarly, the target population of recruiters in the 1994, 1996 and 1998 surveys was recruiterswith monthly goals or missions and at least 1 year of recruiting experience (Zucker, 2001). Thepopulation was defined more generally in the 1991 survey as officer/enlisted recruiters who hadat least 1 year of recruiting experience, and in the 1989 survey as active duty members currentlyassigned to recruiting duty who had at least 1 year of recruiting experience (Maxfield, 1990,1993).
Data Collection
For all of the Recruiter Surveys except the 1998 survey, the mode of data collection wasmailed paper surveys. In 1998, survey diskettes rather than paper surveys were mailed to96 percent of the sample (the Coast Guard completed paper surveys) (Condon, Girard,Feuerberg, & Zucker, 2000). Mailings for each of the surveys began in October/November, andfield operations closed between December and February.
The 2000 survey was mailed, following a notification letter, to a random sample of10,115 recruiters. The weighted response rate for the full sample was 56.9 percent (Flores-Cervantes, Valliant, George and Zucker, 2002). Among the 5,639 survey respondents, 4,706were eligible for the analysis sample. Data collection information for all of the surveys issummarized in Table 1.1 (see Appendix A for a more complete description of the data collectionprocedures and results in the 2000 survey).
Survey Content
The core content of the Recruiter Survey covers recruiters’ perceptions of (1) selection,training, and development procedures; (2) quality of life on and off the job; (3) job satisfactionand goal achievement; (4) organizational leadership, including reasonableness of goals/missions;(5) pressures to reach goals and rewards for doing so; (6) support in the form of recruitment
2 The Coast Guard is part of the Department of Transportation. In peacetime, it performs missions for that
department; in wartime, however, it may be placed under the command of the Department of Defense.

3
Table 1.1.DoD Recruiter Survey: Data Collection Information
Year Survey Mail Dates Field ClosedFrame
SizeSample
SizeNo. of
RespondentsNo. of Eligible
Analysis Casesa
1989 mid-Oct ; mid-Nov 20 Dec 1989 18,113 3,498 2,524 1,554
1991 30 Oct; 12 Dec 27 Jan 1992 24,219b 5,951 3,273 1,988c
1994 21 Oct; 22 Dec 23 Jan 1995 13,576d,e 7,255f 4,805 3,846
1996 5 Nov; 19 Dec 03 Feb 1997 13,897e 7,173f 4,822 4,008g
1998 mid-Nov; 19–22 Dec 23 Feb 1999 24,183 8,466f 5,163 4,343
2000 16–22 Nov; 15 Dec 09 Feb 2001 23,254 10,126f 5,639 4,706
Note. Data sources for this table include published and unpublished sources for the surveys (Condon, Dunlop, Girard, Sundel &Feuerberg, 1997; Condon, Girard & Feuerberg, 1998; Defense Manpower Data Center, 1995; Fink, Ghosh, Guterman & Sands,1995; and Smith, et al., 1995).aDefinitions of eligible analysis cases varied somewhat in the first 2 survey years. See report text. Descriptive analyses werebased on these cases. bReserve Components were added to the frame in 1991 (Army Reserve and National Guard, NavalReserve, Air Force Reserve, and National Guard). cArmy Reserve recruiters were not included in the analysis because only 12satisfied the selection criteria. dThe Coast Guard (part of the Department of Transportation) was added to the frame in 1994.eThe 1994 and 1996 sample frames differed from the frames in other years. The Services each provided a list of their“production recruiters,” and their definitions of those recruiters varied. fThe number of surveys mailed was less than the samplesize because some addresses were not usable: in 1994, 6,320 were mailed; in 1996, 7,162 were mailed; in 1998, 8,463 weremailed; and in 2000, 10,115 were mailed. gFor the multivariate analysis, the eligible sample was 4,029. Twenty-one casesmissing branch or Service designation were classified by using Master File data and were added to the multivariate analysissample.
advertising, incentives to attract qualified prospects, and adequate offices and equipment;and (7) improprieties in recruiting.
The questionnaire is continually updated. Questions are rewritten to improve clarity,dated items are removed from the survey, and new items are added to ensure that the surveymeets the changing needs of policy makers and program managers (Zucker, 2001). For example,in the 2000 survey, items about computer and Internet use, job stress, recruiting offices, and thepossibility of using civilian contractors to assist recruiters were expanded. Items were alsoadded to assess recruiters’ satisfaction with schools, availability of childcare, and spousalemployment opportunities in assigned duty areas. These new items reflect the increasingimportance of Internet communications in recruiting as well as initiatives by the active Servicesand Reserve Components to meet the needs of recruiters’ family members. A copy of the 2000Military Recruiter Survey is included in Appendix B.
Some other topics reflecting the dynamic recruiting environment that were added to thesurvey between 1991 and 1998 included the following: perspectives on the prospect andrecruiting markets; the effects of Desert Shield/Desert Storm, military downsizing, and resourcecutbacks on recruiting; working with schools; accessibility and attractiveness of recruitingoffices to prospects; unreimbursed job-related out-of-pocket expenses; healthcare access andcoverage for recruiters and their families; and the difficulty of recruiting women (a moreimportant issue following media coverage of improprieties in 1996).

4
Reports on Topline Findings
For each administration of the survey, DMDC reports key military indicators in fivetopical areas: goal achievement, job demands, improprieties, management/supervisory support,and job satisfaction. Trends in these indicators and significant differences between successivesurveys are noted (Zucker, 2001). Highlights from the topline findings for the 2000 survey arepresented later in this chapter.
The FY 2000 Recruiting Environment
This section of Chapter 1 contains information about recruiting pressures that helps toprovide context for findings from the 2000 Military Recruiter Survey. This section also includescomments from respondents to an open-ended question in the 2000 survey about recruiters’ mostpressing problems. The comments are presented simply as anecdotes that add the voices ofrecruiters to the description of pressures confronting them on the job. The comments have notbeen subjected to any qualitative or quantitative analysis and should not be consideredrepresentative of all recruiters.
Size of the Prospect Market
On the positive side, the total population of youth 18 to 24 years old grew by more than1 million from 1998 to April 2000, to slightly more than 27 million. The population of 25- to34-year-olds also increased by more than 1 million during that period (US Census Bureau,2001a, 2001b). Not all individuals in eligible age groups, however, meet enlistmentrequirements for active duty and Reserve service, so the increase in the qualified prospect poolwas less than the population increase.
Changes in postsecondary goals among youth and other changes in the country also offsetgains from having a larger pool of recruit-aged young adults. A respondent to the 2000 MilitaryRecruiter Survey summed up many of these changes when replying to an open-ended item aboutthe most pressing problems facing recruiters today: “Good economy. Low unemployment.College enrollment at an all time high. Negative news about military life.”
Declining Interest in Military Enlistment
Data from the Youth Attitude Tracking Study indicate that during the 1990s young adultswere proportionately less likely, on average, to express interest in serving in the military thanyouth were in the 1980s (Wilson et al., 2000). Because studies have shown a strongcorrespondence between expressed interest in the military and likelihood of actual enlistment,the change in attitude about military enlistment increases pressures on recruiters (Wilson et al.).Those pressures were indicated by many respondents to the 2000 survey, who cited decreasinginterest to enlist as their most pressing problem (e.g., “Recruiters are facing a bigger challengewith the young people now a days. They are not interested in the military as much as they werea few years ago.”).

5
Fewer Knowledgeable Adult Influencers
Adults who in the past served as role models and good sources of information about themilitary are scarcer today. In a 1996 research study conducted by the Navy, the presence ofveterans under age 65 was cited as the most important factor for explaining enlistment rates(DMDC, 2000). The veteran population, however, has been steadily declining in the UnitedStates. Veterans younger than 65 years old represented about 9.5 percent of the total USpopulation in 1990 and about 6.5 percent (approximately 15.9 million) in 2000. Also, among thenearly 16 million veterans under age 65 in 2000, only about 2.2 million were under age 35(Department of Veterans Affairs, 2001; US Census Bureau, 2001c).
Recruiters were also reporting in the mid- to late 1990s that civilian knowledge of themilitary is often incomplete or out-of-date and they must educate parents and school officialsabout the wide-ranging job assignments, training opportunities, and educational benefitsavailable in today’s military (Barrett, 1996). In recent polls conducted for the Department ofDefense, civilian adults confirmed those reports: A majority of adults reported they had little orno knowledge about current military programs and incentives (Wirthlin Worldwide, 2001a;Yankelovich Partners, 2001). In addition, recent poll results indicate that although many adultsexpress favorable opinions of the military generally, they are more likely to advise their childrenand students to attend college immediately after high school than to consider military service(Wirthlin Worldwide, 2001b). Various respondents to an open-ended question about pressingproblems facing recruiters commented on these issues:
“Common feedback from parents: ‘We support the U.S. and the military, but I would never let my son/daughter serve.’”“Attitudes of the parents. The kids will enlist but the parents discourage them.”“Misconceptions about military from friends and family who were teens and young adults during Viet-nam era.”“Educators, they only encourage students who do not do well to look into the military.”
Thus, recruiters have to persuade not only youth, but many adult influencers as well, of the valueof including military service in youths’ postsecondary plans.
Rising College Aspirations and Enrollments
Increasingly, teens aspire to attend college. The number of 18- and 19-year-old studentsin 2- and 4-year colleges rose from just under 3 million in 1990 to 3.4 million in 1999, with aprojected enrollment of 44,000 more in 2000. Rates of enrollment varied, however, amongsubgroups. More women than men have been entering college: For 18- and 19-year-oldstudents, the projections for 2000 were 1.9 million women versus slightly more than 1.5 millionmen (Snyder & Hoffman, 2002). Also, in 1999 the enrollment rates of young adults enteringcollege immediately after high school varied considerably by parents’ educational attainment:82 percent among students whose parents held a bachelor’s degree or higher; 54 percent amongstudents whose parents had completed high school, but not college; and 36 percent among

6
students whose parents had less than a high school diploma (National Center for EducationStatistics, 2001).
These developments have led to increased interest in recruiting college students. Moreattention has also been paid to home-schooled students and youth with high school equivalencydegrees who score high on the military qualification test. Those markets, however, can presentspecial challenges for recruiters (Philpott, 1999).
Strong Economy
The booming economy also contributed to recruiting pressures in late 1999 and 2000.The civilian unemployment rate in 2000 was 4.0, the lowest rate since 1969. The unemploymentrate for young adults, traditionally higher than that for the total civilian population, ranged from10.7 to12.5 for 18- to 19-year-olds and from 6.6 to 7.9 for 20- to 24-year-olds during 2000 (USBureau of Labor Statistics, 2002). Competition for both high school and college graduates waskeen. Various recruiters responding to the question about pressing problems wrote that themilitary was at a disadvantage because it could not effectively match the pay and benefitsavailable in the civilian sector:
“Most civilian companies offering better educational packages than the military.”“Not competitive with civilian employers.” “Competition, almost every enterprise, company & franchise offers the same or more in pay, benefits.”
Goal Achievement Pressures
Recruiters also felt increased pressures to meet their goals because, uncharacteristically,DoD failed to achieve its active enlisted accession goals in the late 1990s. In FY 1998 DoDattained only 97 percent of its goal, despite a decline in accession goals of about 4,700 from FY1997. The Navy reached only 88 percent of its goal in FY 1998, and the Army 99 percent. DoDalso failed to achieve its enlisted accession goals in FY 1999 (96 percent of goal). Goalsincreased from FY 1998 by about 2,500, to 195,000. Both the Army (92 percent) and the AirForce (95 percent) failed to reach their goals in FY 1999 (DoD, Office of Accession Policy,personal communication, March 21, 2002).
More pressures were to come in FY 2000, when DoD total active enlisted accession goalsincreased by nearly 7,000. The approximate change for each of the Services was as follows:Army, 5,500 increase; Navy, 2,500 increase; Marine Corps, 1,250 decrease; Air Force,200 increase (DoD, Office of Accession Policy, personal communication, March 21, 2002).
In addition to “meeting the numbers,” DoD recruiters were expected to adhere toeducational standards of recruit quality that had been in place since the mid-80s: At least90 percent of recruits should be high school diploma graduates, and at least 60 percent shouldscore 50 or above on their qualification tests. In comparison, among the general population, onlyabout 79 percent of 18- to 23-year-olds have high school degrees and only 50 percent would

7
score 50 or above on the military qualification test, according to the norms defined for the test(Office of the Assistant Secretary of Defense [Force Management Policy], 2002).
Recruiters also had to adhere to standards regarding enlistees’ medical fitness and legalviolations. Some of the respondents to the 2000 survey mentioned that finding qualified leadsand applicants was a pressing problem in their recruiting areas.
Clearly, recruiters were under strong pressures in FY 2000, particularly Army recruiters.Recruiters knew that they, unlike service members in many other jobs in the military, would beheld personally accountable for their individual performance by clearly measurablegoals/missions.
DoD Response to Recruiting Challenges
DoD and the Services responded to the challenges facing recruiters in FY 2000 byallocating more resources to the recruitment effort. For example, the Services increased thenumber of “on the street” recruiters and used a variety of temporary recruiting assignments tosupplement the ranks of recruiters: They deployed recruiters from headquarters and staffpositions, recalled former recruiters, and assigned recent graduates of basic training to theirhome areas. Also, civilian contractors were used on an experimental basis to assist withadministrative duties, calls to prospects, and guidance counseling. In addition, some recruiters’assignments were extended.
In response to the dwindling interest in and knowledge about military service, DoD andthe Services began reassessing their advertising programs and conducting market research onyouth and their influencers. DoD and the Services also began developing sophisticated Websites with information about today’s military and the individual Services. Some of those effortswere implemented in FY 2000 and prior years, but the effects of others would be more evident inlater years.
To attract youth aspiring to earn college degrees, the Services expanded existingeducation programs and implemented new ones, such as the Army’s College First and UniversityAccess Online programs. In combination, various programs provided enlistees withopportunities to earn college credits before, during, and after their terms of enlistment. Tocompete with civilian employers and to attract enlistees with special skills, particularly in high-tech and medical specialties, the Services increased bonuses and incentives (and sometimescombined them), implemented college loan repayment programs, and emphasized trainingopportunities.
DoD also addressed quality-of-life concerns among recruiters. Health care programswere improved for service members in remote locations (benefits under TRICARE Remotewould not be extended to family members until FY 2001), employment support was provided torecruiters’ spouses, and recruiters became eligible for reimbursement of recruiting-relatedparking expenses for privately owned vehicles. The Services relocated some recruiting stationsto better market areas, and supplied laptops, pagers, and cell phones to many more recruiters(Kozaryn, 2000; Williams, 2000; & Department of Defense, 2000a,b,c,d).

8
FY 2000 Results for Active Duty DoD Services
All of the forgoing challenges and developments in the recruiting environment set thestage for FY 2000. Recruiters had much to accomplish under extremely competitive conditions.Supported by increased resources, all active duty DoD Services did in fact meet or, in the case ofthe Air Force, exceed their enlisted accession goals in FY 2000. In addition, all of the Servicesmet or exceeded quality benchmarks regarding high school graduates and scores on qualificationtests (DoD, Office of Accession Policy, personal communication, March 21, 2002).
The topline findings from the 2000 Military Recruiter Survey provide information onhow the recruiting environment and the efforts undertaken by DoD and the Services, both Activeand Reserve Components, affected the performance and quality-of-life perceptions of individualproduction recruiters in FY 2000.
2000 Topline Findings: Highlights
The following highlights from the 2000 Military Recruiter Survey identify statisticallysignificant increases and decreases for key military indicators from 1998 to 2000 (seeAppendix C for more details on these key indicators).3
Goal achievement. Good news—The percentages of active duty DoD recruiters andReserve Component recruiters reporting they achieved their assigned goals in at least 9 monthsof the previous fiscal year rose between 1998 and 2000 (up by 8 percentage points, to 41 percent,and up by 5 percentage points, to 62 percent, respectively).4 Army, Air Force, and ArmyNational Guard recruiters reported higher achievement. Reported achievement varied greatlyacross Services and Components, ranging from a low of 24 percent for the Army to 79 percentfor the Naval Reserve.
In addition, both active duty DoD and Reserve Component recruiters, on average, wereless pessimistic in 2000 about the achievability of their goals/missions. The percentage of allactive duty DoD recruiters disagreeing that their goals were attainable declined by 9 percentagepoints, to 18 percent, the lowest proportion since 1991. For total Reserve and GuardComponents, there was an 8 percentage point decline, to 21 percent, also the lowest proportionsince 1991. All individual active duty DoD Services and the Army Reserve and Army NationalGuard reported declines in the percentage of recruiters who thought they could not attain theirgoals. Improvements were particularly notable in the Army (a 13 percentage point decline, to24 percent) and in the Army Reserve (a 19 percentage point decline, to 27 percent). 3 Results in this report for topline findings, recruiter profiles, and multivariate analysis apply only to respondents
who were defined as production recruiters, that is, respondents who had monthly goals/missions and at least 1 yearof recruiting experience. The findings are weighted percentages. T-tests with a cutoff of alpha equal to .05 wereused to determine statistically significant changes.
4 In the analysis findings, “active Services” include the Army, Navy, Marine Corps, Air Force, and Coast Guard.“Active duty DoD Services” exclude the Coast Guard, which is part of the Department of Transportation. The“Reserve Components” include the Army Reserve, Army National Guard, Naval Reserve, Air Force Reserve, andAir National Guard.

9
Job demands. Mixed news—The percentage of all active duty DoD recruiters whoreported working more than 60 hours per week did not change significantly from the high levelreported in 1998 (65 percent in 2000). The Air Force was the only active Service with adecrease (5 percentage points, to 37 percent), which helped to offset a 9 percentage pointincrease from 1996 to 1998. Both Army and Coast Guard recruiters, however, reported increasesin the percentage of recruiters working long hours. The story for Reserve Components wasdifferent. On average, the percentage of Reserve and Guard recruiters working more than 60hours per week increased by 6 percentage points, from 34 percent to 40 percent. The ArmyReserve, the Army National Guard, and the Air Force Reserve had increases in the percentage ofrecruiters reporting long work weeks. The only Reserve Component with a lower percentage ofrecruiters reporting they worked more than 60 hours per week was the Naval Reserve.
For the most part, findings were better regarding the percentage of recruiters voluntarilyforgoing leave because of job demands. On average, total active duty DoD recruiters reported adecrease (from 69 percent to 66 percent), as did Coast Guard recruiters (from 62 percent to54 percent). But two Reserve Components—the Army National Guard and Air Force Reserve—had increases in the percentage of recruiters choosing not to take leave because of job pressures(up to 83 percent and 79 percent, respectively).
Improprieties. More good news—The percentage of recruiters perceiving that bendingrules to achieve goal in their recruiting command occurs frequently declined from 1998 levels fortotal active DoD Services (from 28 percent to 22 percent), for Army and Marine Corpsrecruiters, for total Reserve Components (from 24 percent to 20 percent), and for the ArmyReserve. Of note, the 2000 percentages for active duty recruiters are similar to those reported in1996.
Management/Supervisory support. More mixed results—Improvement in negativereports about support from supervisors was spotty. Overall, about a quarter of active duty DoDrecruiters continued to provide negative reports—no significant change from 1998. The Navy,Air Force, and Coast Guard, however, had declining percentages of active duty recruiters whodisagreed that supervisor support was good. There was no improvement among ReserveComponent recruiters, either overall or within individual Components. In fact, the percentagedisagreeing that supervisor support was good increased by 6 percentage points (to 32 percent) forthe Army National Guard. Twenty-eight percent of all Reserve and Guard recruiters disagreedthat support from supervisors was good.
On the other hand, active duty recruiters reported better teamwork with superiors. Thepercentage of all active duty DoD recruiters disagreeing that they worked together with theirsuperiors as a team declined from 28 percent to 24 percent. Declines were also reported by allactive Services except the Marine Corps. No change occurred, however, for overall Reserve andGuard recruiters or for individual Reserve Components. Twenty-nine percent of all Reserve andGuard recruiters disagreed with the statement that they work with their superiors as a team.
Job satisfaction. Mostly more of the same—On average, for both Active Service andReserve Component recruiters, there was no change in dissatisfaction with recruiting (44 percent

10
for active duty DoD, 11 percent for the Coast Guard, and 24 percent for Reserve Components).Air Force recruiters, however, reported a 12 percentage point decline in dissatisfaction, to25 percent. In contrast, Air Force Reserve recruiters reported an 8 percentage point increase indissatisfaction, to 17 percent. That increase reversed the gains achieved between 1996 and 1998.
Most active duty DoD recruiters once again reported they would select a differentassignment or leave military service if they could do so. Only 27 percent of them would remainin recruiting if given a choice in the next month (unchanged from 1998). The Air Force andNavy were the only active Services to report significant changes—an increase of 6 percentagepoints for the Air Force (to 48 percent selecting recruiting) and a decrease of 5 percentage points(to 25 percent) for the Navy. On average, there was no significant change for ReserveComponents. A slight majority of Reserve and Guard recruiters continued to say they wouldremain in recruiting (51 percent). The percentage of Army Reserve recruiters reporting theywould select recruiting rose by 10 percentage points, to 32 percent.
The topline findings indicate progress on several fronts for individual recruiters.Reported goal achievement, perceptions of achievability, and perceptions about improprieties allshowed improvement. The additional resources provided by DoD and the Services appear tohave counterbalanced some of the difficulties in the recruiting environment. Recruiters’ jobs,however, remained demanding in FY 2000, and approximately a fourth of all recruiters weredissatisfied with the support they received from their supervisors. Also, job satisfactionremained mostly unchanged from 1998 to 2000. The findings from the structural equationmodeling of the 2000 survey responses (see Chapters 2 and 3) provide some indication of therelative importance of issues that contributed to job performance, satisfaction, and stress.
Demographic and Assignment Profiles
This section of the report contains summary demographic and recruiting assignmentprofiles for both active duty production recruiters and Reserve and Guard production recruiters,as well as highlights on various demographic subgroups. By definition, profiles of averagerecruiters obscure the diversity among recruiters both within and across their Services andComponents. In addition, these profiles are based on the recruiter population of interest:recruiters with goals/missions and one or more years of recruiting experience. Officers were alsoexcluded. More detailed demographic and recruiting assignment information for each of theactive Services and Reserve Components is available in the Tabulations of Responses from the2000 Military Recruiter Survey (Rockwell, et al., 2002).
Demographic Profiles
Active Duty Recruiters
DoD. The average active duty DoD recruiter was a married White male in his thirties inpaygrade E-6 or E-7 who had taken some college courses (see Figure 1.1).5 The average active
5 In the demographic profiles, Whites represent only non-Hispanic Whites, and Blacks represent only non-Hispanic
Blacks. Also, the following rule was used to determine “average”: The modal response category (the category

11
duty Air Force recruiter, however, was in paygrade E-5 or E-6 and had taken some collegecourses or completed an associate of arts (AA) degree.
Coast Guard. The average Coast Guard recruiter was a married White male in paygradeE-6 or E-7, was 35 to 44 years old and had taken some college courses or completed an AAdegree. Thirty-three percent of Coast Guard recruiters were more than 39 years old, in contrastto only 8 percent of active duty DoD recruiters. Also, 14 percent of Coast Guard recruiters had abachelor’s degree or higher, compared with 8 percent of active duty DoD recruiters.
Reserve and Guard Recruiters
The average Reserve and Guard recruiter was a married White male in paygrade E-7 whohad taken some college courses or completed an AA degree. Although the average ReserveComponent recruiter was in his thirties, about a third of Reserve Component recruiters wereolder than 39 (36 percent). Also, 17 percent of Reserve and Guard recruiters had a bachelor’sdegree or higher. The average paygrade was the same for all individual Reserve Components(E-7) except the Naval Reserve, where the average paygrade was E-5 to E-6.
In summary, the data from the 2000 survey indicate that, on average, active duty DoDrecruiters, compared with Coast Guard and Reserve Component recruiters, were relativelyyoung, proportionately less likely to be White, and proportionately less likely to have abachelor’s degree or higher. Reserve and Guard recruiters were proportionately more likely thanrecruiters in the other two groups to be in a higher paygrade.
Demographic Subgroups
Women. Six percent of all active-duty DoD recruiters were women. Although theproportion of women was highest in the Air Force (11 percent), the numbers of female recruitersin the Army and the Navy were greater than in the smaller sized Air Force. The proportion offemale active duty DoD recruiters was lowest in the Marine Corps (2 percent). The Coast Guardalso had a relatively high proportion of female recruiters (10 percent). Thirteen percent ofrecruiters in the Reserve Components were women; there were no significant differences acrossReserve Components.
Hispanics. Among all active duty DoD recruiters, 11 percent were Hispanic, with thehighest proportion in the Marine Corps (17 percent). Eight percent of Coast Guard recruiters and8 percent of all Reserve and Guard recruiters were Hispanic. There were no significantdifferences in the proportions of Hispanic recruiters in the Reserve Components.
Blacks. Twenty-five percent of all active duty DoD recruiters were Black. Theproportion was highest in the Army (30 percent). In the Coast Guard, the proportion of Blackrecruiters was 13 percent. In the Reserve Components, 12 percent of recruiters were Black, withthe highest proportions in the Air National Guard (20 percent) and the Army Reserve(17 percent).
with the greatest frequency) was selected. If that category did not represent at least 51 percent of the respondents,we collapsed it with the adjoining category having the higher percentage of respondents.

12
Figure 1.1Demographic Profiles: Active Duty DoD, Coast Guard, and Reserve Component Recruiters
Coast Guard
90%
79%
71%
67%
67%
76%
Male
Married
White
35 to 44 Years
Some College or AA
Paygrade E6 or E7
Active Duty DoD Services
77%
61%
77%
52%
74%
94%Male
Married
White
30 to 39 Years
Some College
Paygrade E6 or E7
Reserve Components
87%
81%
75%
52%
70%
60%
Male
Married
White
30 to 39 Years
Some College or AA
Paygrade E7

13
Recruiting Assignment Profiles
Active Duty Recruiters
DoD. The average active duty DoD recruiter had been assigned to recruiting duty morethan 1 year but less than 3 years (64 percent), was in the first tour of duty (80 percent), and hadteam monthly goals/missions (72 percent). When asked if they had volunteered to be recruiters,41 percent of active duty DoD recruiters said they volunteered for recruiting duty because theywanted it. An equal percentage said they were assigned to recruiting duty without any choice.When asked their reasons for becoming a recruiter, active-duty DoD recruiters checked the “Ihad no choice” response most often (37 percent). The next most prevalent response was “Ibelieve in my Service and want to share it with others” (29 percent).
Air Force recruiters diverged most from the average-recruiter profile. Only 45 percent ofAir Force recruiters had been assigned to recruiting more than 1 year but less than 3 (30 percenthad been assigned to recruiting duty for 6 years or more), and only 61 percent were in their firsttour of duty. In addition, 92 percent of Air Force recruiters said they had volunteered forrecruiting duty because they wanted it, in contrast to 30 percent of Army recruiters, 42 percent ofNavy recruiters, and 37 percent of Marine Corps recruiters. The other 8 percent of Air Forcerecruiters also volunteered for recruiting duty, but 7 percent reported they would have preferredanother assignment and 1 percent said they had “volunteered” for recruiting duty but “really hadno choice.”
Coast Guard. Like the average active duty DoD recruiter, the average Coast Guardrecruiter had been a production recruiter for more than 1 year but less than 3 years and was in thefirst tour of recruiting duty, although the percentages for the Coast Guard were lower:57 percent and 71 percent, respectively. The majority of Coast Guard recruiters had teammonthly goals/missions (75 percent). In contrast to the average active duty DoD recruiter, nearlyall Coast Guard recruiters volunteered for and wanted recruiting duty (97 percent). Noneindicated they had been assigned and not given a choice. Regarding their reasons for becomingrecruiters, nearly three fourths said “I believe in my Service and want to share it with others,”and 49 percent said “I want to help young people.”
Reserve and Guard Recruiters
The profile of the average Reserve and Guard recruiter reflects a seasoned group ofrecruiters—69 percent had been assigned to recruiting duty for 3 years or more (including41 percent who had been assigned 6 years or more), and only 52 percent were in their first tourof recruiting duty. A majority said they volunteered for and wanted recruiting duty (80 percent).Only 4 percent said they had been assigned to recruiting duty without any choice. Reserve andGuard recruiters most often checked “I believe in my Service and want to share it with others”(54 percent) and “I want to help young people” (45 percent) as their reasons for becomingrecruiters. Two thirds of Reserve and Guard recruiters had personal monthly goals (66 percent).
Air Force Reserve Component recruiters had been on the job a comparatively long time.A majority of Air Force Reserve (59 percent) and Air National Guard (54 percent) recruiters had

14
been assigned to recruiting duty for 6 years or more. Similarly, a majority of Air Force Reserve(73 percent) and Air National Guard (57 percent) recruiters were in their second or later tours ofrecruiting duty. More than 94 percent of Air Force Reserve and Air National Guard recruitersvolunteered for recruiting duty because they wanted it, in contrast to 66 percent of Army Reserverecruiters.

15
CHAPTER 2: THE ANALYSIS MODEL
In this chapter we describe a model-based approach we will use to analyze the datacollected from the 2000 Military Recruiter Survey. This approach is commonly known asstructural equation modeling with latent variables (SEM). The analyses focus on active dutyrecruiters with goals/missions and one or more year of recruiting experience.6 This modelingcenters on three pivotal issues: job performance, satisfaction with recruiting, and strainassociated with recruiting in a challenging environment. These three issues correspond to theconcerns that prompted the development of the first Recruiter Survey: the need to enlist enoughqualified young men and women to maintain the nation’s military forces without subjectingrecruiters and their families to highly stressful conditions that adversely affect their quality of lifeand their job performance (Maxfield, 1990). The other major components of the model are thefactors that may affect recruiters’ performance, satisfaction with recruiting, and job strain. Thesefactors are well represented in this survey because DoD and the Services have intentionallyincluded items in the various Recruiter Surveys to identify situations and concerns associatedwith high stress among recruiters (Maxfield, 1990).
This model-based approach to examining data from the Recruiter Survey departs fromprevious approaches that relied primarily on extensive crosstabulations with accompanyingcommentary.7 We chose the SEM approach because it offers the following advantages.
Comprehensive measurement of concepts. The major concepts discussed in thisreport—recruiter satisfaction, job performance, and strain—and the components influencingthem are relatively broad and multidimensional. We decided that single survey items wereinappropriate for measuring these complex concepts. For example, although there is an item inthe questionnaire that asks how satisfied the respondent is with recruiting, other items askwhether the respondent would encourage friends to become a recruiter, what the respondent’sfamily thinks of recruiting, and whether the respondent believes that the pay received forrecruiting is appropriate. The SEM approach captures all of these items, allowing measurementnot only of a personal global evaluation of satisfaction but also aspects related to family, friends,and compensation. Similar comprehensive measurement results can be achieved with all of thecomponents in the model.
Estimation of complex structural relationships. SEM allows the specification ofmultiple direct and indirect influences on multiple outcomes. With other more commonmodeling techniques (e.g., ordinary least squares multiple regression), analysts can assess thestructural relationships among influencing factors and outcomes, one outcome at a time. SEM
6 Because we recognize that active duty and Reserve and Guard recruiters have different missions, we determined
that separate analysis of the data for the two groups was appropriate. Following development of the structuralmodel for active duty recruiters, we then evaluated the appropriateness of that model for Reserve and Guardproduction recruiters. Results of this test are reported in Appendix D.
7 For the 1996 survey, a supplementary regression analysis was conducted to identify predictor variables for goalachievement and recruiter satisfaction (Condon, Dunlop, Girard, Sundel, & Feuerberg, 1997). The catalogue ofproducts for the 2000 Military Recruiter Survey includes tabulation volumes covering all questions in the survey.

16
allows analysts to assess these structural relationships simultaneously, taking theinterrelationships among the outcomes into account.
Estimation of the relative and independent strength of influencing factors. SEM notonly incorporates a sophisticated approach to measurement and the modeling of structuralrelationships, it also allows researchers to quantify the relative strength of major influencingfactors. For example, analysts can estimate the effects of one influencing factor on another whilestatistically controlling for the effects of other influencing factors. Thus, they can disentanglethe separate effects of related factors on outcomes such as strain, satisfaction with recruiting, andreported job performance. Regression analysis affords some of the same benefits; however,because the model in this report embodies multiple equations with variables subject tomeasurement error and three dependent constructs, use of traditional regression analysis, unlikeuse of structural equation modeling, would fail to estimate the model properly.8
The presentation of major survey findings is also simplified with the SEM approach. Intabular presentations, effects are presented individually for each survey item included in thedisplay. Analysts using the SEM technique can consider all model elements simultaneously andestimate the effects in concert with other effects. Thus, instead of having many tables and chartscontaining variable-by-variable results, the findings for a large number of survey items can beorganized by outcome and influencing factors and summarized in a relatively few exhibits.
This analysis will describe the relative strength of influencing factors on job-related stressand recruiting satisfaction and goal attainment. This information should provide insights thatwill be helpful to policy makers and program managers as they consider strategies for addressingrecruiters’ quality of life and job performance. Some of the factors are inherent to the recruiter’sjob and may not be alterable by recruiting managers. In this case, the information provided heremay only provide insight. However, other identified factors may include job characteristics andcircumstances under the control of recruiting managers or policy makers and, if found to beinfluential, may be considered for change.
The Model
The model in Figure 2.1 depicts the complex relationships among various influencingfactors and recruiters’ self-reported job performance, satisfaction with recruiting, and stress.Performance and satisfaction with recruiting are the two major outcomes. Perceived strain isdepicted as a mediator, channeling at least some of the effects of the influencing factors on the 8 SEM is an analysis technique that allows the complete and simultaneous tests of the relationships involved in a
complex modeling effort after eliminating undesired measurement error in the model. The issue of measurementerror and unreliable variable measurements and their effect on multiple regression--and, for that matter, on the fieldof statistics--has been discussed at length in the published literature (Cochran, 1968, and Subkoviak & Levin,1977). Werts, Rock, Linn, and Joreskog (1976) further examined correlations, variances, covariances, andregression weights with and without measurement error and concluded that the effects of measurement error onthese statistics can have a dramatic effect. The basic concern is that unreliable, measured variables maymisrepresent reality and mislead research. SEM removes this concern by explicitly estimating measurement errorand then removing it from calculations estimating the magnitude of construct relationships. (Schumacker &Lomax, 1996).

17
two major outcomes. The influencing factors include ease of meeting goals, control over dutyassignment, hours worked, pressure to meet goals, office appearance, recognition forachievement, supervisor support, perceived importance of recruiting, and family concerns.
The model comprises 12 influencing factors and outcomes, more generally calledconstructs. A construct uses multiple survey variables to represent a single concept, for example,several measures of satisfaction are combined to indicate overall satisfaction. In SEM,constructs may also be called latent constructs depending on the methods used to create theconstruct for use in the model. The constructs used in this model are latent constructs andinclude nine influencing constructs, a mediating construct—perceived strain, and the outcomeconstructs—performance and recruiting satisfaction. The following section providesdescriptions of these constructs and their expected interrelationships. For specific informationon the survey items used as indicators for each of these constructs, see Table 2.1.
Figure 2.1.Recruiter Performance and Satisfaction Model
Note. Control = Control Over Duty Assignment.
Performance
Satisfaction WithRecruiting
Recognition
FamilyConcerns
Ease of MeetingGoals
HoursWorked
SupervisorSupport
PerceivedStrain
OfficeAppearance
Control
Perceived GoalPressure
Importance ofRecruiting

18
Table 2.1.Summary of Survey Items Used as Indicators of the Latent ConstructsLatent Construct
(coding notes)Q # Question Text
Performance 33 In how many of the months of the past fiscal year did you achieve your monthly
goal/mission? 34 What percentage of your recruiting goal/mission did you achieve in the last fiscal year? (Higher score indicates
better performance) 36 Compared to other recruiters from your Service who work in the area served by yourMEPS, would you say you are: [responses range from below average to one of the best]
Satisfaction With Recruiting 42h Below is a list of statements that relate to aspects of life as a recruiter. I would
encourage my friends to become recruiters 46 If you had the freedom to select an assignment next month, which of the following
would you choose? 56 What do members of your household/immediate family think of your recruiting
assignment? 71a In general, how satisfied are you with recruiting?
(Lower score indicates greater satisfaction)
40i To what extent do you agree or disagree with the following statements? My pay isappropriate for the job I do
Perceived Strain 42i Below is a list of statements that relate to aspects of life as a recruiter. I feel
emotionally drained from my work 42j Below is a list of statements that relate to aspects of life as a recruiter. I feel fatigued
when I get up in the morning and have to face another day on the job 42k Below is a list of statements that relate to aspects of life as a recruiter. Working with
people all day is really a strain for me 42l Below is a list of statements that relate to aspects of life as a recruiter. I feel burned out
from my job 42m Below is a list of statements that relate to aspects of life as a recruiter. I feel frustrated
by my job
(Lower score indicates greater perceived strain)
42n Below is a list of statements that relate to aspects of life as a recruiter. I feel like I am atthe end of my rope
Ease of Meeting Goals 32a With reference to your recruiting goals/missions, to what extent do you agree or
disagree with the following statements? My monthly goals/missions are achievable 32b With reference to your recruiting goals/missions, to what extent do you agree or
disagree with the following statements? My assigned market area is adequate to makegoal/mission
(Lower score indicates greater ease of meeting goals)
35 All things considered, what is the likelihood that experienced recruiters can makegoal/mission in your zone/area?
Control Over DutyAssignment
6 Did you volunteer to be a recruiter? (Higher score indicates greater sense of control over duty assignment)
9 Do you think your preferences were considered in your current duty locationassignment?
Hours Worked10 On average, what is the total number of hours per week you spend performing
recruiting related duties?12 On average, what is the total number of hours per week you spend on the phone with
prospects?
(Higher score indicates more hours worked)
14 During the past year, did you request annual leave and have the request denied?

19
Table 2.1. (continued)Summary of Survey Items Used as Indicators of the Latent ConstructsLatent Construct
(coding notes)Q # Question Text
Perceived Goal Pressure 32c With reference to your recruiting goals/missions, to what extent do you agree or
disagree with the following statements? Success in reaching goal/mission has a “makeor break” effect on my military career
32d With reference to your recruiting goals/missions, to what extent do you agree ordisagree with the following statements? I am pressured to continue recruiting even afterreaching my monthly goal/mission
(Lower score indicates greater perceived goal pressure)
32e With reference to your recruiting goals/missions, to what extent do you agree ordisagree with the following statements? I am punished if I fall short of goal/mission
Office Appearance22a To what extent do you agree or disagree with the following statements about your
office? My recruiting office presents a professional environment for potentialapplicants
22b To what extent do you agree or disagree with the following statements about youroffice? My recruiting office presents a pleasant environment for potential applicants
(Lower score indicates greater perceived positive office appearance) 22c To what extent do you agree or disagree with the following statements about your
office? My recruiting office contributes to my success as a recruiterRecognition
42b Below is a list of statements that relate to aspects of life as a recruiter. Recruiters arerecognized for doing a good job
(Higher score indicates increased belief that good work will be recognized)
42g Below is a list of statements that relate to aspects of life as a recruiter. Promotionopportunity is better than it would have been without a recruiting assignment
Supervisor Support32i With reference to your recruiting goals/missions, to what extent do you agree or
disagree with the following statements? My supervisor will help me if I have troublemaking goal/mission
41b I have the freedom to personally plan my work and use my judgment as to the bestmethod for recruiting in my assigned area
41c The degree to which Recruiting Commands manage office level recruiting activitiesvaries. I receive good support from my supervisors
41d The degree to which Recruiting Commands manage office level recruiting activitiesvaries. My superiors and I work as a team
42a Below is a list of statements that relate to aspects of life as a recruiter. Supervisorsunderstand and help recruiters with problems
(Lower score indicates higher levels of support from supervisor)
66f To what extent do you agree or disagree with the following statements? I feel I amsupervised more closely than necessary
Importance of Recruiting42c Below is a list of statements that relate to aspects of life as a recruiter. Skills attained in
recruiting are helpful in securing a good civilian job42d Below is a list of statements that relate to aspects of life as a recruiter. Recruiting is
important work
(Lower score indicates greater perceived importance of recruiting) 42e Below is a list of statements that relate to aspects of life as a recruiter. Recruiting is
challenging workFamily Concerns
26b To what extent do you agree or disagree with the following statements about yourformal training and preparation for recruiting duty? Members of my family were wellprepared by my Service for the requirements and demands of my recruiting assignment
57 Are active attempts made by your recruiting command to involve your family in yourrecruiting job (e.g., special office social events for the entire family, discounted ticketsfor the family)?
(Lower score indicates greater perceived family support)
40g To what extent do you agree or disagree with the following statements? Recruiterleadership does a good job of keeping recruiters informed of initiatives to improvequality-of-life (e.g., housing, medical, pay, CONUS COLA, childcare)

20
The Constructs
The model comprises the following 12 constructs:
• Performance reflects recruiters’ self-reports of goal achievement and their ratings oftheir performance relative to that of other recruiters in their Service and MEPS areas.
• Satisfaction with Recruiting represents recruiters’ perceptions of their families’attitudes toward the recruiting assignment, recruiters’ own satisfaction with their payand recruiting, and recruiters’ inclination to remain in recruiting and to recommend itto others.
• Perceived Strain represents recruiters’ perceptions of fatigue, emotional drain, andburnout.
• Ease of Meeting Goals reflects recruiters’ perceptions of the adequacy of theirmarket for meeting goal, the reasonableness of their goals, and the likelihood thatexperienced recruiters could make goal in the zone or area.
• Control Over Duty Assignment assesses recruiters’ sense of control over theirsituation. It is based on reports of whether they volunteered or were assigned torecruiting duty and whether their preferences were considered in their duty-locationassignments.
• Hours Worked addresses work time, time spent on the phone with prospects, andannual leave requests that were denied.
• Perceived Goal Pressure represents perceived career consequences of goalachievement, pressures to continue recruiting after making goal/mission, andpunishment for failing to make goal/mission.
• Office Appearance draws on recruiters’ opinions about whether their office appearsprofessional and pleasant to potential applicants and whether office appearancecontributes to success in recruiting.
• Recognition represents recruiters’ perceptions that good performance isacknowledged and that recruiting assignments increase opportunities for promotion.
• Supervisor Support captures supervisor understanding and help with problems,supervisor expectations, working as a team member with one’s supervisor, andfreedom from micromanagement.
• Importance of Recruiting captures recruiters’ perceptions about the importance andchallenge of recruiting and whether they think recruiting duty equips them with skillsthat are transferable to the civilian sector.

21
• Family Concerns captures recruiters’ perceptions of family preparation for thechallenges associated with recruiting duty, efforts by their recruiting commands toinvolve families in office social events and other activities, and the effectiveness ofrecruiter leadership in informing recruiters about new quality-of-life initiatives.
Expected Interrelationships Among the Constructs
In the model depicted in Figure 2.1, the lines connecting the constructs indicate theirexpected interrelationships. The arrowheads indicate the expected direction of the influence oreffect. An effect occurs when a change in one variable results in a change in another variable.For example, the model shows that there is an expected direct effect of ease of meeting goals onperformance as well as an indirect effect on both performance and recruiting satisfaction throughperceived strain. An indirect effect suggests that the influencing construct affects the outcomethrough a mediating construct, in this case, strain.
In the paragraphs that follow, we describe more thoroughly the relationships that arebeing evaluated in this model and our rationale for identifying this structure of relationships. Webegin with the predictors of performance.
Influences on performance. In the model, four constructs are expected to have directeffects on performance: ease of meeting goals, sense of control over duty assignment, hoursworked, and perceived strain. In addition, ease of meeting goals, control over duty assignment,and hours worked are expected to affect performance indirectly through effects on strain. Thatis, ease of meeting goals, control over duty assignment, and fewer hours worked are expected todecrease strain. Decreased strain, in turn, is thought to positively affect performance. Each ofthese suggested impacts is described next.
• Ease of meeting goals is expected to increase performance directly as well asindirectly by decreasing strain. When recruiting is extremely difficult, we wouldexpect to see decreased performance and increased strain, which would furtherdecrease performance. As noted in Chapter 1, the recruiting environment in FY 2000was highly challenging for nearly all recruiters. They were competing with collegesand employers in a booming economy for young adults who seemed less and lessinterested in military service. Findings from the 1996 and 1998 DoD RecruiterSurveys indicated that many recruiters thought that even experienced recruiters haddifficulty meeting goal in their areas (Condon, Dunlop, et al., 2000). It is likely thatthis situation, a perception that goals were not achievable, was stressful for recruitersand may have affected their performance.
• Sense of control over duty assignment is also expected to influence performancedirectly as well as indirectly through perceived strain. Sense of control over dutyassignment may directly affect performance by placing those who desire to berecruiters or who have the necessary skills to be successful recruiters in the recruitingrole. Moreover, one also might expect that service members who choose to berecruiters will perhaps experience lower stress levels than recruiters who had no sayin the decision, because they have chosen the role. But recruiters, particularly in the

22
Army and the Marine Corps, are often assigned to recruiting duty without any choice.For some, the involuntary transition to recruiting duty asks them to perform tasks forwhich they are not well suited; for others, the potential long-term career effect of poorperformance is highly stressful and this stress may hinder their performance asrecruiters. Assignment to recruiting duty also may require individual or familymoves that may prove stressful and thus hinder performance.
• Hours worked is the third construct expected to affect performance both directly aswell as indirectly through perceived strain. It is likely that successful recruiters areworking long hours to accomplish their goals, as do many other military members,but that the hours they are working are not so numerous that their stress levels areincreased and their performance affected.9 It seems reasonable that excessive hoursspent in recruiting might actually hinder performance by increasing recruiter strain.Throughout most of the nineties, large numbers of recruiters reported working60 hours or more per week. This may have contributed to many recruiting successes.Elucidating the ways in which increased hours worked affects recruiting will be oneimportant contribution of this model.
In the model, four additional constructs are thought to indirectly influence performancethrough perceived strain: goal pressure, office appearance, recognition, and supervisor support.None of these constructs is thought to have a direct impact on performance. Absence of unduepressure to meet goals, a professional office appearance, a belief that good performance will berecognized, and support from one’s supervisor are believed to decrease strain and therebyincrease performance. The role of each of these constructs in the model is described below:
• Excessive pressure to meet or exceed goals is expected to influence performanceindirectly through its effect on perceived strain. Relentless pressure, a perception of apunitive atmosphere, and the long-term consequences on one’s military career of notmaking goal will increase strain and, in turn, affect performance. A work atmospherethat is more positive in these areas is expected to result in lower strain and morepositive performance.
• An office that contributes to successful recruiting is likely to decrease the strain onrecruiters and positively affect their performance. In the 1998 survey nearly60 percent or more of all Active and Reserve Component recruiters thought theiroffices were inviting to prospects. To recruiters, a fully outfitted office may representtangible validation by their Service for the importance of their recruiting job.
• The belief that good work will be recognized is expected to decrease strain andthereby have a positive impact on performance.
9 Average hours worked by officers and enlisted members across active duty DoD Services in 1999 was 54.7 hours.
For E5–E6s, the average across all Services was 54.3 hours; for E7–E9s, the average was 55.1 hours. Thus, thelong work week for recruiters may not be atypical among military members (Helba et al., 2001).

23
• Support by one’s supervisor is expected to decrease the strain felt by recruiters andthrough this decrease in strain affect self-reported performance. We expect that asuccessful recruiter will have decreased strain because he or she believes thatadequate and appropriate support is available from his or her supervisor.
Influences on satisfaction. In the model, the second outcome variable is satisfactionwith recruiting. The model indicates that strain is expected to have an effect on satisfaction withrecruiting. Because of the expected relationship between strain and satisfaction with recruiting,the same influencing constructs that indirectly influence performance through strain are alsothought to affect satisfaction with recruiting indirectly through strain. These include ease ofmeeting goals, control over duty assignment, hours worked, perceived goal pressure, officeappearance, recognition, and supervisor support. Each construct will have the same effect onstrain as described earlier with regard to performance. As a result of their influence on strain,these constructs are also expected to influence satisfaction. In general, it is expected that withlower levels of strain will come increased satisfaction.
As an example of these relationships, one can trace the path from perceived goal pressureto satisfaction through strain in much the same way that we did with regard to performance.Excessive pressure to meet or exceed goals is expected to influence satisfaction indirectlythrough its effect on perceived strain. We expect that successful recruiters will perceive littleundue pressure on themselves to meet or exceed goal. Without this excessive pressure, they arelikely to experience less significant levels of stress. Lower stress levels, in turn, will be relatedto higher levels of satisfaction. The same logic can be used to trace pathways from ease ofmeeting goals, control over duty assignment, hours worked, office appearance, and recognitionthrough perceived strain to satisfaction.
Three constructs are expected to directly affect satisfaction with recruiting: supervisorsupport, importance of recruiting, and family concerns. In the points that follow, we describe theexpected relationships between satisfaction with recruiting and supervisor support, importance ofrecruiting, and family concerns:
• Support by one’s supervisor is expected to directly affect a recruiters’ satisfactionwith recruiting. We expect that a recruiter who is adequately supported by his or hersupervisor will be more satisfied with recruiting than a recruiter who lacks supportfrom his or her supervisor.
• Importance of recruiting is expected to have a direct effect on satisfaction. Recruiterswith positive attitudes about the importance of their jobs and the value of recruitingare likely to be more satisfied than recruiters who look upon the job less positively.
• Decreased family concerns is expected to lead to higher satisfaction with recruiting.Recruiters’ assignments sometimes cause hardship for their families. Among thesehardships are the long hours recruiters spend away from home and the stressesassociated with being assigned to high cost-of-living areas or areas isolated frommilitary bases and their amenities. We expect that if recruiters believe that the

24
military is giving support to their families in the face of these difficulties, they will bemore satisfied with their recruiting assignments.
Concluding Comments
The model described in this chapter was developed in consultation with DoD personnelafter preliminary modeling efforts that explored measurement issues and potential linkagesrelated to these research questions. For our preliminary modeling and the final modelingreported in the next chapter, we used SAS PROC CALIS, a structural equation modelingsoftware package. PROC CALIS allows us to evaluate two important aspects of a model: thevalidity of the measurement structure of the model (which is the assignment of specific surveyitems as indicators for the constructs); and the interrelationships among the constructs describedabove. As we worked with the data, PROC CALIS provided us with important informationabout how the model could be improved, how well our specified model mirrored therelationships that exist in the data, and the relative and actual strengths of the relationshipsbetween our constructs.
In the next chapter we describe the process we used to finalize the model, ourassessments of how well it actually “fits” the data derived from 3,640 recruiters’ surveyresponses, and what the model can tell us about the interrelationships among the nine influencingconstructs, perceived strain, self-reported job performance, and satisfaction with recruiting.

25
CHAPTER 3: THE STRUCTURAL MODEL
In this chapter we briefly describe the method used to construct the 2000 MilitaryRecruiter Survey (MRS) model, highlight key findings, and present other modeling results andinformation. The model discussed in this chapter covers active duty production recruiters (thosewith goals/missions and at least 1 year of recruiting experience). Reserve Component recruitersare discussed in Appendix D.
Model Construction
We adopted a two-stage approach for model construction. In the first stage we evaluatedthe measurement of the constructs.10 That is, we assessed the degree to which model indicatorsgrouped together to form the 12 constructs specified in Chapter 2. Each construct was firstevaluated separately to determine its measurement characteristics.11 After we completed thistask we conducted a confirmatory factor analysis to assess the overall integrity of the constructsas a group. That analysis provided support that the 42 indicators in the model measured thecorresponding latent variables, or constructs. This was important because if the measurementmodel of constructs is statistically or substantively unsound, any measure of the structuralrelations among constructs is literally meaningless.12
In the second stage of model construction we developed the structural model, whichidentifies the interrelationships or paths of influence among the constructs. Once again, themodel development process was exploratory. Although achieving good fit between the modeland our data was an important goal, that goal was not the overriding determinant of changes inthe model. During each iteration of the development process, we assessed potential changes forsubstantive intelligibility on the basis of our knowledge of the questionnaire and recruitingrealities. We made changes in the structural model only when they were supported by ourunderstanding of the dynamics of the recruiting environment. For example, even though modeldiagnostics suggested that a direct link between hours worked and satisfaction with recruitingwould improve model fit, we did not add this path to the model because we expected that hoursworked would be one of several constructs that influence satisfaction only indirectly, throughperceived strain.
After we obtained the final structural model, we cross-validated it by using a subset ofsampled recruiters to determine further whether the findings presented in this report reflect
10Descriptive statistics and zero-order correlations for indicator variables can be found in Appendix E.11Separate principal components analyses were conducted for each construct. The results of the first principal
components analyses were reviewed carefully. Where appropriate, some survey items included as observedindicators of a construct were deleted and others were added. This was done for both statistical and substantivereasons. See Appendix F for standardized estimates for the active duty recruiter measurement model by factors.
12During testing of the measurement model, the covariance matrix of the constructs was unconstrained andcoefficients were estimated with a maximum likelihood technique. We concluded from the results that the fit wasadequate and structural modeling could proceed. Fit statistics included chi-square (χ2) = 3814 (p < .0001), agoodness of fit index (GFI) equal to 0.93, and a comparative fit index (CFI) of 0.92.

26
recruiters’ perceptions of their jobs and quality of life or whether the findings are an artifact ofour modeling strategy. Our conclusion, reported in the model validation description inAppendix G, is that the full model holds and is representative of active duty productionrecruiters.
Overall, modeling was successful. All but two of the expected relationships amongconstructs (e.g., that increases in perceived strain negatively affect satisfaction with recruiting)were confirmed by the model.13 The model was also successful, to varying degrees, inexplaining the variance of the mediating and outcome constructs. The influencing constructs inthe MRS model explained most of the variance in satisfaction with recruiting (R2 = .85) and halfof the variance in perceived strain (R2 = .50). The model constructs proved somewhat lesssuccessful in accounting for variation in self-reported performance (R2 = .34).
In addition, some of the goodness of fit tests that we used to evaluate model qualityindicated a good fit between the model and the 2000 survey data for active duty productionrecruiters. The chi-square test and model residuals, however, indicated that the model’s fit is lessthan perfect. We discuss our evaluation of model quality and related caveats in more detail laterin this chapter.
Taking all these factors into account, we concluded that the model accurately reflects thedirection and relative influence of factors affecting perceptions of recruiter strain, performance,and satisfaction with recruiting. We also believe the model findings will be useful to officialsresponsible for making decisions about recruiting policies and programs.
The results of the structural equation modeling (SEM) effort are displayed in Figure 3.1.14
Key Findings
The standardized structural coefficients in Figure 3.1 indicated the relative directinfluence of constructs on performance and satisfaction with recruiting. For example, the direct 13Two model paths, from supervisor support to satisfaction with recruiting and from importance of recruiting to
performance, yielded estimates that were different from our expectations. We did not expect a relationshipbetween perceived importance of recruiting and performance, and expected that increases in supervisor supportwould be associated with increases in satisfaction with recruiting. Although the supervisor-satisfactionrelationship was contrary to expectations and, therefore, problematic, it should be noted that neither importance ofrecruiting nor supervisor support was relatively influential in explaining performance and satisfaction withrecruiting, respectively.
14One technique used during model construction, the use of parcels, is identified but not explained in this figure.Parcels result from combining observed indicators (survey items) and using the average of two indicators as inputto the modeling process rather than using each indicator separately. In this figure parceling is indicated byquestion labels such as 42I42J (which indicates the average of items 42I and 42J). The use of parcels wasintroduced into the modeling process as a strategy to condense the complexity of the model. The constructsperceived strain and supervisor support both had a large number of indicator variables used in their identification.Literature on the use of parcels suggests that, when used for simplification of a construct, inter-item variability isreduced and measurement of the latent construct may be enhanced (MacCallum, Widaman, Zhang and Hong,1999). Comparison of model solutions with and without the use of parcels indicated that the substantive findings,regardless of method, were the same.

27
Figure 3.1.Standardized Coefficients for the Active Duty Model
.57
.75
.48
.89
.16
.85
.59.59
.36
-.29
.91
.73
.61
.33
.77
.81
-.65
.66
-.47
.60
.44
.51
.66
.89
.64
.77
.82
-.51
.79
.24
.48
.68
.86
PerceivedStrain
42I42J 42K42L 42M42
.83 .87 .85
Performance
33
34
36
Satisfaction WithRecruiting
42H
46
56
71A
40I
Importance ofRecruiting
42E
42D
42C
FamilyConcerns
57
40G
26B
42A32I
Supervisor
Support41B66F
41C41
OfficeAppearance
22C
22B
22A
Perceived GoalPressure
32
32
32C
HoursWorked
14
12
10
42BRecognition
42
Control OverDuty Assignment
9
6
Ease of MeetingGoals
35
32B
32A
-.385
.476
.336
-.090
.099
.077
-.470
-.137
.228
.372
-.053
-.145
.175
-.169
.600
X 2(543) = 3933GFI = .93CFI = .92NFI = .90NNFI = .90RMSEA = .044
effect of hours worked on performance should be interpreted as follows: A one standarddeviation increase in hours worked will lead to an increase of .336 standard deviations inperformance (differences between standardized and unstandardized coefficients are discussedlater in this chapter). Coefficient values can range between – 1.0 and 1.0; the higher the absolutevalue, the greater the influence of the construct. For these constructs, the positive or negativesign of a coefficient usually indicates the direction of influence (i.e., a positive sign indicates thatthe influencing and outcome constructs both move in the same direction, whereas a negative signindicates that they move in opposite directions).

28
The interpretation of a construct coefficient’s sign, however, must be carefully appliedwhen reviewing survey data, including the 2000 Military Recruiter Survey data. Many surveyresponses are coded directionally—for example, from very satisfied to not at all satisfied or fromstrongly agree to strongly disagree. The actual coding of questions must be consulted todetermine the direction of influence. For example, in our model, the structural coefficient for theinfluence of hours worked on perceived strain is –.090, seemingly indicating an inverserelationship between the two constructs. However, the coding of perceived strain is opposite ofwhat might be expected: As numeric values of strain increase, strain itself substantivelydecreases as measured by the survey questions (e.g., responses range from 1 = strongly agree to5 = strongly disagree for “I feel ‘emotionally drained,’ ‘burned out,’ ‘fatigued’”). Thus, thecoefficient –.090 actually indicates that as hours worked increases, perceived strain increases.See Table 2.1 for information on coding of all indicators included in our model.
From the information in Figure 3.1 and Table 2.1, we drew the following majorconclusions about influences on performance and satisfaction with recruiting.
Influences on performance. Of the five constructs modeled as influencing performance,two—importance of recruiting and perceived strain—were substantially less influential than easeof meeting goals, hours worked, and control over duty assignment. For example, the coefficientfor hours worked (.336) is more than three times that estimated for perceived strain (.099).Stated as predictions based on the direction of influence, the major direct influences onperformance were:
• The more control recruiters had over their duty assignments, the higher theirperformance (structural coefficient of .476).
• The greater their perceived ease of meeting goals, the higher their performance(-.385).
• The more hours recruiters worked, the higher their performance (.336).
The structural coefficient linking strain and performance had the expected direction(i.e. as strain increased, performance declined), but perceived strain was less influential thanexpected, as indicated by the relatively low structural coefficient (.099). Because the substantiveinfluence of perceived strain on performance was quite small, the indirect effects of the sixconstructs influencing perceived strain also had a limited impact on performance.
The linkage between perceived importance of recruiting and performance was relativelysmall in terms of influence (.077) and the direction of influence was counter-intuitive. While therelationship was not in our expected model (Figure 2.1) it was included in the model forstatistical reasons. Future research should be cognizant of this relationship and its counter-intuitive finding.
Influences on satisfaction with recruiting. Reviewing the constructs influencingsatisfaction with recruiting, we see that they fall into one of two groups based on the magnitudeof the estimated structural coefficients. Family concerns and perceived strain clearly influenced

29
satisfaction with recruiting more than supervisor support or importance of recruiting did. Themajor findings, then, were:
• Recruiters perceiving that family concerns were being addressed were more satisfiedwith recruiting (.600).
• The lower the perceived level of stress, the higher the satisfaction with recruiting(-.470).
• The higher recruiters’ perceptions about the challenge, importance, and value ofrecruiting, the more satisfied they were with recruiting. However, the influence ofimportance of recruiting on satisfaction with recruiting was relatively weak (.175).
• The influence of supervisor support on satisfaction with recruiting was also weak(-.169). In addition, its influence was in a direction counter to our expectations. Assupervisor support increased, satisfaction with recruiting decreased. Upon reflection,there are reasonable questions regarding the meaning of the support construct, as itcontains survey indicators regarding both support and micromanagement.
Because perceived strain was a strong predictor of satisfaction with recruiting, the sixconstructs influencing perceived strain also had important indirect effects on satisfaction withrecruiting. These indirect effects exhibited a somewhat more complex series of influences thanthe direct influences on performance and satisfaction with recruiting. Our interpretation is thatthere are three groups of influencers with indirect effects on satisfaction with recruiting; they canbe categorized on the basis of their direct influences on perceived strain as highly influential,moderately influential, and marginally influential. Goal pressure and control over dutyassignment fall into the first highly influential group. Recognition and ease of meeting goals fallinto the second group. Major findings regarding constructs influencing perceived strain (withindirect effects on satisfaction with recruiting) presented in order of relative strength were:
• As perceived goal pressures increased, perceived strain increased (.372).
• As control over duty assignment increased, perceived strain decreased (.228).
• As perceptions of ease of meeting goals increased, perceived strain decreased (–.137).
• As perceptions that recruiting efforts are recognized and rewarded increasedperceived strain decreased (–.145).
The remaining two constructs fall into the third, marginally influential group thatindirectly influences satisfaction with recruiting through strain. These constructs had theexpected coefficient directions with strain, but relatively low levels of influence: As hoursworked increased, perceived strain increased (–.090); and favorable perceptions of officeappearance led to lower perceived strain (–.053).

30
Other SEM Results and Information
Findings on Indirect and Total Effects
Up to now we have presented standardized coefficients only for direct connectionsbetween adjacent latent constructs. In this section, we will discuss the indirect effects onperformance and satisfaction with recruiting of the constructs that are filtered through themediating construct of perceived strain (ease of meeting goals, control over duty assignment,hours worked, perceived goal pressure, office appearance, and recognition). Also, we have notconsidered the total effects on performance of the three influencing constructs that affect it bothdirectly and indirectly (ease of meeting goals, control over duty assignment, and hours worked).SEM uses a system of mathematical equations to model those multiple paths of influence. Thus,when considering effects on performance and recruiting satisfaction, analysts can considerfactors that have direct, indirect, or both direct and indirect (total) effects on the two outcomes.15
Ease of meeting goals, for example, had both direct and indirect influences onperformance. Its total effect on performance can be broken into direct and indirect parts that areeasily defined and calculated. The direct effect of ease of meeting goals on performance is thecoefficient connecting the two constructs (–.385). The indirect effect (–.014) is the product ofthe coefficients between, first, ease of meeting goals and strain (–.137) and, second, strain andperformance (.099). The total effect of perceived ease in meeting goals on performance is –.399,which is the sum of the direct (–.385) and indirect (–.014) effects. Including coefficients of totaleffects and indirect effects facilitates a more complete understanding of model relationships thanthat indicated by direct effects alone.
Table 3.1 presents calculated indirect and total effects of the influencing constructs onsatisfaction with recruiting and performance. The results presented in this table lend support intwo ways for our conclusion that the indirect effects through strain to performance are relativelyminor. First, there are only small differences between the total effects coefficients and the directeffects coefficients, indicating that adding in the indirect effect does not yield much change.Second, the calculated indirect effects on performance are extremely small (absolute valuesranging from .01 to .04) when compared with the size of the direct effect coefficients (absolutevalues ranging from .08 to .48) for performance.
The calculated indirect effects on satisfaction with recruiting shown in Table 3.1 lendsupport to our greater interest in the indirect effects of the influencing constructs on satisfactionwith recruiting through perceived strain. These coefficients are, on average, larger than theindirect effects on performance (absolute values ranging from .02 to .17). The most important ofthese effects (based on relative size of the coefficients) are the indirect effects of goal pressureand control over duty assignment on satisfaction through strain.
15See Asher (1983) for a discussion of the usefulness of measuring and comparing direct and indirect effects when
trying to identify operative causal mechanisms in a model.

31
Table 3.1.Standardized Total and Indirect Effects of Influencing Constructs on Satisfaction WithRecruiting and Performance
Type of Effect
Influencing ConstructIndirect Effect on
SatisfactionIndirect Effect on
PerformanceTotal Effect onPerformance
Office Appearance 0.025 – 0.005
Recognition 0.068 – 0.014
Goal Pressure – 0.175 0.036
Ease of Meeting Goals 0.064 – 0.013 – 0.398
Hours Worked 0.042 – 0.009 0.327
Control Over Duty Assignment – 0.107 0.023 0.499
Standardized Versus Unstandardized Coefficients
The standardized and unstandardized results of the structural model are presented inTable 3.2. Figure 3.1 presents only standardized results. Both types of coefficients areinterpreted similarly to the interpretation of coefficients estimated by using traditional linearregression. That is, a one-unit change in an independent variable (our influencing and mediatingconstructs) is expected to lead to a θ unit change in the dependent variable (our outcomeconstructs). The value θ is the coefficient associated with the independent variable, and themagnitude of change is expressed in terms of the metric of the dependent variable. Thestandardized and unstandardized coefficients differ, however, with respect to the metric used forinterpretation.
To illustrate the difference, imagine that height is regressed on weight and the resultingunstandardized coefficient estimated for height is 5.5. The results can be interpreted in terms ofthe metric used to measure both height and weight. If height is measured in inches and weight ismeasured in pounds, then the results of the regression produce an expectation that, on average,an increase of 1 inch in height results in a predicted increase in weight of 5.5 pounds. Forstandardized coefficients, the metric is the standard deviation of the measures involved. In theexample just presented, a 1.0 standard deviation increase in height would correspond to a5.5 standard deviation increase in weight.
The interpretational framework just presented, in the example is complicated by the factthat SEM deals with latent constructs that do not have inherent metrics, such as height andweight. Instead, their metrics, for modeling purposes, are set by the observed responses tosurvey questions that are considered to be influenced by these latent constructs. The metric ofthe constructs is set by constraining the coefficient of one observed variable to equal one. This

32
means that variation in the construct is measured in the metric of that variable.16 All of theresponse variables used to set the metric for the constructs are Likert scales. Most are 5-pointscales ranging from strongly agree to strongly disagree. Two constructs, control over dutyassignment and hours worked, are anchored on 4- and 6-point Likert scales, respectively.
Similar to the height and weight example, one can interpret structural coefficients inbehavioral terms by using unstandardized coefficients or in statistical terms by usingstandardized coefficients. In Table 3.2, the unstandardized and standardized coefficientsrepresenting the effect of perceived strain on satisfaction with recruiting are –.54 and –.47,respectively. The unstandardized coefficient indicates that a one-point increase in strain can beexpected to produce a .54-point decrease in satisfaction (an inverse relation). Similarly, theunstandardized coefficient indicates that a one standard deviation increase in strain can beexpected to produce a decrease of .47 standard deviations in satisfaction.
Evaluations of Model Quality
We used a variety of diagnostic tests to evaluate the quality of the active duty MRSmodel. From the perspective of face validity, the model is successful because all but one of thecoefficients matched expectations. That is, the direction of influence expected was confirmed bythe model. For the construct that did not match expectations, it contained survey indicators withconflicting directions.
Other evaluations of model quality included: consideration of the percentage of varianceexplained for each dependent construct; a chi-square test assessing the degree to which theimplied model covariance matrix matched the observed covariance matrix; an examination ofmodel residuals; and consideration of several other goodness of fit indexes. The results obtainedwere mixed. Some test results indicated that this model fits the data well. Other results wereless favorable. We describe and interpret the findings from our evaluations of the model andindicate possible ways to address identified problems in future modeling efforts.
Explanatory Power
As indicated earlier, the explanatory power of the model varied for the three outcomeconstructs. The measurement and modeling of satisfaction with recruiting were quite good.
Perceived strain was less completely explained but was, nonetheless, well modeled by theconstructs. It might be appropriate, however, to consider additional sources of perceived strainin future efforts to develop a more complete model of this construct. The amount of variance inself-reported performance explained by the model was the least strong of the three outcomeconstructs—just slightly more than one third (34 percent).
16A technical note: In the computer code used to estimate the model, the coefficient for the linkage between one
observed variable and the latent construct is set at one. For the unstandardized coefficients this constraint isreported as a coefficient equal to one. In the standardized estimates, the estimate most often will not equal one.

33
Table 3.2.Standardized Coefficients, Unstandardized Coefficients, and Standard Errors for theStructural Model
Outcome Constructs
Perceived Strain PerformanceSatisfaction
With RecruitingInfluencing Construct STD UNSTD STD UNSTD STD UNSTD
Office Appearance –.053 –.045(0.015)
Recognition –.145 –.201(0.036)
Goal Pressure .372 .551(0.056)
Ease of Meeting Goals –.137 –.131 –.385 -.411(0.023) (0.031)
Hours Worked –.090 –.102 .336 .425(0.054) (0.036)
.228 .213 .476 .499Control Over DutyAssignment (0.031) (0.054)
Importance of Recruiting .077 .146 .175 .337(0.060) (0.040)
Supervisor Support –.169 –.168(0.032)
Family Concerns .600 .814(0.060)
Perceived Strain* .099 .111 –.470 –.538(0.036) (0.024)
*Mediating construct.Notes. STD = standardized coefficients; UNSTD = unstandardized coefficients; standard errors are enclosed inparentheses.
The influences of three of the constructs used to predict performance (ease of meetinggoals, control over duty assignment, and hours worked) were strong, as reflected in modelcoefficients. These findings lead to two lines of thought. The first considers factors unmeasuredby the survey that could have considerable influence on performance. Among the potentialfactors influencing performance is geographic region (e.g., West, South, Northeast). Thepropensity of youth to enlist in the military varies by region (Wilson et al., 2000), so it isreasonable to expect that performance may vary similarly. Within a particular region, manyfactors can affect an individual recruiter’s performance, such as school system characteristics,unemployment rates, socioeconomic status (SES), and the demographic makeup of a recruiter’s

34
area. One of the most attractive features of this line of thought is that it is testable. Although itwould require a fair amount of effort, indicators related to geographic region could be appendedto survey records and the model could then be reestimated with those factors included. Anothertestable factor is Service. Each Service recruits different numbers of recruits and has slightlydifferent requirements and styles of recruiting. These are just a few ideas for additional factorsto explain recruiter performance.
The second line of thought considers the possibility that the performance construct itselfis problematic. We recommend an examination of the psychometric qualities of the measuresused for performance and consideration of the possible use of external, rather than self-report,measures of performance. This suggestion is also testable. The model can be reestimated afterincorporating external measures of performance into the 2000 MRS data.
Measures of Model Fit
The first four goodness of fit indexes described are easy to interpret because theytypically range from zero to one, with one indicating perfect model fit. The SEM literatureindicates that an index value higher than .90 indicates a good fit for a structural model with latentvariables. The goodness of fit index (GFI), provides “a measure of the relative amount ofvariances and covariances jointly accounted for by the model” (Jöreskog & Sörbom, 1981,p. I.41).
Bentler and Bonnet’s (1980) normed fit index (NFI) has been proposed in the literature asan alternative to the chi-square test, which has disadvantages regarding sample size and modelcomplexity that we discuss below. Although the NFI has the advantage of being easilyinterpreted, it has the disadvantage of sometimes underestimating goodness of fit in smallsamples. A variation on this measure is the non-normed fit index (NNFI), which has been shownto be a better measure of model fit for all sample sizes. The comparative fit index (CFI) issimilar to the NNFI in that it provides an accurate assessment of fit regardless of sample size.
The root mean square residual represents the average of the fitted residuals and may beused to compare models fitted to the same data. The root mean square error of approximation(RMSEA) is a goodness of fit index which Browne and Cudeck (1993) described as “a measureof the discrepancy per degree of freedom for the model” (p. 144). For RMSEA, perfect model fitis indicated by the lower bound value of zero. As a rule of thumb, a value of the RMSEA of .05or less indicates a close fit of the model in realation to degrees of freedom.
We used all of these indexes to measure the results of the MRS modeling effort. All ofthem had values indicating that our structural model accurately represents interrelationshipsamong constructs measured by the 2000 MRS data. These measures are presented in Figure 3.1.
Chi-Square Test and Model Residuals
In addition to the GFI, NFI, NNFI, CFI, and RMSEA measures, we used two others thatare more sensitive to sample size and model complexity: the chi-square test and the examinationof model residuals. These measures suggested a less-than-perfect model fit.

35
A chi-square test compares the observed covariance matrix for the survey to that impliedby the structural model. If these two matrices do not differ significantly, model fit is consideredto be satisfactory. The results for this model, however, indicated a significant difference: Thechi-square value was 3934, with p > .0001. Even when we divided chi-square by the degrees offreedom for the test, 543, the resulting value, 7.2, did not meet conventional rule-of-thumbstandards (should be less than 2) in the test of no difference between the observed and modelcovariance matrices (Hatcher, 1994). We did not conclude, however, that we needed to modifyour model because of this finding. Although the chi-square test is considered useful, it is alsogenerally acknowledged that chi-square values should be interpreted with caution andsupplemented with other measures of model fit because the chi-square test is influenced byfactors other than the validity of the theoretical model. These factors include sample size (thelarger the sample size, the more likely the rejection of the model) and the complexity of theestimated model (the more complex the model, the less likely a good fit). Given our largesample size (more than 3,000 active duty respondents) and model complexity and given that ourother measures indicated adequate fit, we decided that judging model adequacy solely on thebasis of the chi-square findings would not be appropriate.
Another indicator of fit—model residuals—is more visual. Although model residuals areless affected than the chi-square test by sample size, they also indicated possible problems in ourmodel. Figure H.1 (in Appendix H) presents standardized residuals in a bar chart. Residuals inthis figure are centered about zero, as they should be, but a large number of residuals exceed twostandard deviations (thereby representing significant deviations from the predictions one wouldobtain from a model perfectly fitting the observed survey data). The interpretation we offer ofthis figure is that, while the model is centered or oriented correctly, there are significant sourcesof “noise” in the model as estimated. This “noise” is not centralized in any one or two conceptsbut is, rather, a feature of this complex multivariate, multi-equation model assessing theinterrelationships among 12 constructs and 42 survey items.
Because of the known difficulties with the chi-square test and the observed distribution ofmodel residuals, we place more importance on the results we achieved with the fit indexes thatare less sensitive to sample size and model complexity. Thus, despite the results of the chi-square and model residual results, we continue to believe that our structural model accuratelyrepresents interrelationships among constructs measured by the 2000 MRS data. This judgmentis made with the caveats noted earlier that alternative indicators of performance and moreinfluences on perceived strain should be considered in future MRS modeling efforts.
In this chapter we presented the statistical results obtained from our effort to use a model-based approach to summarize important 2000 MRS findings. In the discussion of modelconstruction we outlined the post hoc nature of our modeling effort, and in the precedingdiscussion of model quality we noted both favorable and unfavorable indicators. We believe thatfuture revisions to the MRS questionnaire and reports of survey findings could profit from acareful consideration of the constructs (as distinguished from individual questions) that might beincluded in future models. If possible, existing scales or indexes representing constructs ofinterest with known properties and reliabilities might be used in the MRS. Focusingquestionnaire construction on the comprehensive measurement of important constructs would,we believe, yield more precise and useful reports of survey findings.

36

37
CHAPTER 4: CONCLUSION
The analyses presented in this report significantly extend the quantitative understandingof factors influencing active duty members’ self-reported performance and satisfaction withrecruiting, as well as the role of strain in explaining differences in performance and satisfaction.Based on what recruiters say, we have identified job characteristics and factors that mightinfluence these important outcomes either directly or indirectly.
Performance. The model does not predict differences in reported job performance aswell as it predicts differences in satisfaction with recruiting, but shows that these factors, in orderof their strength in the model, will increase performance:
• increasing the sense of control over duty assignment,• increasing ease of meeting goals, and• increasing the number of hours worked.
The influence of perceived strain on performance is not substantively important, though itis statistically significant. Thus, the indirect effects of job characteristics and factors onperformance through strain are less noteworthy than the indirect effect on satisfaction throughperceived strain.
Satisfaction with Recruiting. The model shows that these factors will directly increasesatisfaction with recruiting. In order of their strength in the model, they are:
• increasing attention to family concerns and• increasing emphasis on the importance of recruiting.
The model also indicates that one of the strongest influences on satisfaction is perceivedstrain; therefore decreasing strain will directly increase satisfaction with recruiting. In order oftheir strength in the model, the following job characteristics and factors will decrease strain,thereby increasing satisfaction:
• decreasing excessive goal pressure,• increasing control regarding duty assignments,• increasing recognition for work well done,• increasing ease of meeting goals,• decreasing the number of hours worked, and• improving office appearance.

38
What do the findings imply for possible strategies for increasing satisfaction andperformance and decreasing strain? The following items provide suggestions translated fromrecruiter survey responses through the model findings:
Providing the tools to aid the recruiting job:
• Increasing recognition or reinforcement for work well done,• Emphasizing positive consequences of making goal and deemphasizing the
negative consequences of missing goal, particularly when performance in mostmonths is good,
• Recognizing that not all recruiting markets are equal, and giving consideration ofthat fact in providing recognition, and
• Ensuring that the recruiting office supports the recruiting mission image andmessages.
Continuing to address family issues:
• Showing command concern for families through family involvement andeducation on the demands of the job.
Supporting the recruiting career field:
• Emphasizing the importance and value of recruiting,• Providing (additional) incentives for volunteering or extending the tour of
recruiting duty,• Allowing recruiters to exercise some influence on duty location assignment, and• Allowing unsuccessful recruiting salespersons who give their best effort to
transfer without penalty.
Further Research
Analytic Groups
Despite the strength of this model, further analyses would be useful in two areas. Thismodel is based only on data from active duty recruiters. Initial testing on Reserve recruitersindicated that this model is not as strongly predictive for these recruiters (see Appendix D).Developing a model of interrelationships for Reserve recruiters would provide policy-relevantinformation tailored to this important group of recruiters.
Along a similar line, previous recruiter surveys as well as tabulations from the 2000Military Recruiter Survey clearly show Service-related differences in demographics, jobcharacteristics, and issues. Given these findings, it is reasonable to assume that the way in whichstrain, performance, and satisfaction are influenced by factors identified in this model may differfor the individual Services. In future analyses, identifying these Service-related differences

39
could help policy makers develop Service-specific policy recommendations for improvingrecruiters’ quality of life.
Additional Model Development
The prediction of performance by this model, as discussed, was not as strong as theprediction of strain or satisfaction. It is likely that other important factors influence self-reportedperformance. This raises another important issue. This analysis included only self-reportedperformance, available from the survey results. An additional, more powerful, analysis thatcould yield useful results would be to use actual performance data as an outcome variable.Further, the addition of economic indicators and market characteristics that might influencerecruiters’ actual performance, such as unemployment rate and socioeconomic status of therecruiting market, could add to the explanatory power of this model.
Overall recruiting success, as measured by meeting accession goals, has varied over timeand varies, as noted, by Service. Individual recruiting success also varies. There will always beexceptional performers, even under the most difficult job demands. An analysis using data fromthe 2000 MRS that could provide useful information to policy makers would be to expand thecurrent analysis to include Service-level analyses, demographic factors, actual performance data,and recruiting market data to develop an expanded profile of successful recruiters and the typesof markets in which different types of recruiters succeed.
Survey Refinement
These analyses have also provided insight into ways that the survey instrument itselfcould be improved to facilitate modeling efforts. The constructs used in this analysis weredeveloped post hoc, based on the available survey items. This analysis was somewhat limited bythe lack of questions on some issues that are believed to be important to recruiting performanceor satisfaction. For example, satisfaction with supervision was identified as a likely construct forinclusion in this model. It could not be included because there was only a single indicator of thisconstruct. 17 Should modeling be planned for future recruiter surveys, identifying constructs to betested and developing survey questions to measure those constructs a priori would likelyimprove analytic power.
Summary
The predictive capability of the model is quite good. It explains much of the variation instrain and satisfaction with recruiting and somewhat less in self-reported performance. Thispredictive power suggests that the model has captured many important factors contributing to
17Use of a single indicator assumes a perfect correlation between that indicator and the underlying construct. In
reality, perfect measurement is highly unlikely. Most measures actually include a component of error along withthe true construct. The use of multiple indicators for each construct allows that error component of each indicatorto be excluded (i.e., modeled separately) so that the relationships being assessed in the broader model represent therelationships among constructs measured without error (Hatcher, 1994).

40
strain and satisfaction with recruiting. Because the predictive power is weaker for self-reportedperformance, it is likely that other important factors affect self-reported performance.
Given the model’s strengths, policy makers and program managers can have increasedconfidence that the results point toward recruiters’ perceptions of their work and quality of lifeand possible strategies for improving their quality of life. While the nature of the recruiting jobis undergoing some change in the movement toward civilian recruiters, it remains a stressful andchallenging job.
The need to understand recruiters’ perceptions of their quality of life has been a majorimpetus for the ongoing Recruiter Surveys. The findings in this report provide information onissues and situations that contributed to successful job performance and job satisfaction amongrecruiters in FY 2000. This information may prove useful in guiding changes in policies andprocedures to enhance future recruiters’ quality of life.

41
REFERENCES
Asher, H. B. (1983). Causal modeling (2nd ed.). Beverly Hills, CA: Sage.
Barrett, S. (1996, August 6). Perceptions making it tough on service recruiters. AmericanArmed Forces Information Service. Retrieved January 31, 2002, from the World Wide Web:http://www.defenselink.mil/news/Aug1996/n0827 1996_9608276.html
Bentler, P. M., & Bonnet, D. G. (1980). Significance tests and goodness of fit in the analysis ofcovariance structures. Psychological Bulletin, 88, 588–606.
Browne, M. W., & Cudeck, R. (1993). Alternative ways of assessing model fit. In K. A. Bollen& J. S. Long (Eds.), Testing structural equation models (pp. 136–162). Newbury Park, CA:Sage.
Cochran, W. G. (1968). Errors of measurement in statistics. Technometrics, 10, 637-666.
Condon, K. M., Dunlop, B. D., Girard, C., Sundel, M., & Feuerberg, G. (1997). 1996 DoDRecruiter Survey: Profiles and trends (DMDC Report No. 97-019). Arlington, VA: DefenseManpower Data Center. (DTIC/NTIS No. ADA 335671)
Condon, K. M., Dunlop, B. D., Girard, C., Sundel, M., Feuerberg, G., & Zucker, A. (2000).1998 DoD Recruiter Survey: Profiles and trends (DMDC Report No. 2000-022). Arlington,VA: Defense Manpower Data Center. (DTIC-BRR, ADA 391610)
Condon, K. M., Girard, C., & Feuerberg, G. (1998). Technical manual for the 1996 DoDRecruiter Survey: Documentation of the data set preparation (Report No. 97-018).Arlington, VA: Defense Manpower Data Center.
Condon, K. M., Girard, C., Feuerberg, G., & Zucker, A. (2000). Technical manual for the 1998DoD Recruiter Survey: Statistical methodology report. Unpublished manuscript, DefenseManpower Data Center.
Defense Manpower Data Center. (1995). January, 1995 monthly progress report from theoperational contractor (CCC). Unpublished manuscript.
Defense Manpower Data Center. (2000). 1998 DoD Recruiter Survey, survey operationsdocumentation and codebook. Unpublished manuscript.
Defense Manpower Data Center. (2001). Youth Attitude Tracking Study. Arlington, VA:Author.
Department of Veterans Affairs. (2001). VetPop2000 (Version 2.07) [CD-ROM]. Washington,DC: Office of the Actuary, Department of Veterans Affairs.

42
Fink, S., Ghosh, D., Guterman, S. S., & Sands, W. A. (1995). Analytic support for the 1994Recruiter Survey: Working paper three, nonresponse analysis for the 1994 Recruiter Survey.Unpublished manuscript, Defense Manpower Data Center.
Flores-Cervantes, I., Valliant, R., George, B. J., & Zucker, A. B. (2002). Weighting report forthe 2000 Military Recruiter Survey. Arlington, VA: Defense Human Resources Activity.
Hatcher, L. (1994). A step-by-step approach to using the SAS system for factor analysis andstructural equation modeling. Cary, NC: SAS Institute.
Helba, C., Keyes, C., Lee, K., Hintze, W., O’Brien, J., Wright, L. C., & Williams, K. H. (2001.).Overview of the 1999 Survey of Active Duty Personnel (DMDC Report No. 2000-008).Arlington, VA: Defense Manpower Data Center.
Jöreskog, K. G., & Sörbom, D. (1981). LISREL V: Analysis of linear structural relationshipsby maximum likelihood and least squares methods. Chicago: National Education Resources.Distributed by International Educational Services, Chicago.
Kozaryn, L. D. (2000, December 8). Recruiters welcome new age approach. American ForcesInformation Service. Retrieved February 2, 2002, from the World Wide Web:http://www.defenselink.mil/cgi-bin/dlprint.cgi.
MacCallum, R. C., Widaman, K. F., Zhang, S. and Hong, S. (1999). Sample size in factoranalysis. Psychological Methods, 4, 84-99.
Maxfield, B. D. (1990). Military recruiters and their perceptions of recruiting duty. Arlington,VA: Department of Defense, Office of the Assistant Secretary of Defense.
Maxfield, B. D. (1993). DoD Recruiter Survey: Comparative analyses of the 1991 and 1989surveys (Report No. 93-008). Arlington, VA: Defense Manpower Data Center.
National Center for Education Statistics. (2001). Essay 2001—Students whose parents did notgo to college: Postsecondary access, persistence, and attainment. Washington, DC: Author.Retrieved April 16, 2002, from the World Wide Web:http://nces.ed.gov/programs/coe/2001/essay/index.html.
Office of the Assistant Secretary of Defense (Force Management Policy). (2002). Populationrepresentation in the military services fiscal year 2000. Washington, DC.
Philpott, T. (1999). Military update: Blistering economy, changing attitudes tighten recruitmarket. Retrieved May 16, 2002, from the World Wide Web: http://www.fra.org/mil-up/milup-archive/12-09-99-milup.html
Rockwell, D., Deak, M. A., Helba, C., Windle, R., Adebayo, A., Perry, S., Hintze, W., & Zucker,A. B. (2002). Tabulations of responses from the 2000 Military Recruiter Survey. Arlington,VA: Defense Manpower Data Center.

43
SAS (Version 8) [Computer software] (2000). Cary, NC: SAS Institute, Inc.
Schumacker, R. E., & Lomax, R. G. (1996). A beginner’s guide to structural equationmodeling. Mahwah, NJ: Lawrence Erlbaum Associates.
Smith, W., Sands, W. A., Fink, S., Ghosh, D., Scanlon, B. R., & Barnes, J. (May 1995).Analytic support for the 1994 Recruiter Survey: Working paper one. Unpublishedmanuscript, Defense Manpower Data Center.
Snyder, T. D., & Hoffman, C. M. (2002). Digest of education statistics, 2001. Washington,DC: National Center for Education Statistics. (NCES 2002130) Retrieved April 3, 2002,from the World Wide Web: http://nces.ed.gov/pubsearch/pubsinfo.asp?pubid=2002130
Subkoviak, M. J., & Levin, J. R. (1977). Fallibility of measurement and the power of astatistical test. Journal of Educational Measurement, 14, 47-52.
US Bureau of Labor Statistics. (2002). BLS Web site: Labor force statistics from the CurrentPopulation Survey [Data tables generated by Westat]. Washington, DC: US Department ofLabor. Retrieved March 17, 2002, from the World Wide Web: http://www.bls.gov
US Census Bureau. (2001a). Census 2000 summary 1 file. Total population by age, sex, race,and Hispanic or Latin origin for the United States: 2000 [Table, Census 2000 PHC-T-9].Washington, DC: Author. Retrieved April 15, 2002, from the World Wide Web:www.Census.gov
US Census Bureau. (2001b). Statistical abstract of the United States: 2001 [Table 12,Population section]. Washington, DC: Author. Retrieved April 15, 2002, from the WorldWide Web: http://www.census/gov/prod/2002pubs/01statab/pop.pdf
US Census Bureau. (2001c). Statistical abstract of the United States: 2001 [Table 11,Population section]. Washington, DC: Author. Retrieved May 8, 2002, from the WorldWide Web: http://www.census/gov/prod/2002pubs/01statab/pop.pdf
US Department of Defense. (2000a, May 5). Air Force offers $10K college repayment to newrecruits. Retrieved February 12, 2002, from the World Wide Web:http://www.defenselink.mil/cgi-bin/dlprint.cgi
US Department of Defense. (2000b, February 3). DoD news briefing. Retrieved February 11,2002, from the World Wide Web: http://www.defenselink.mil/cgi-bin/dlprint.cgi
US Department of Defense. (2000c, September 28). DoD news briefing. Retrieved February12, 2002, from the World Wide Web:http://www.defenselink.mil/news//sep2000/t09282000_t0928arm.html

44
US Department of Defense. (2000d, August 9). Military recruiting improves. RetrievedFebruary 11, 2002, from the World Wide Web: http://www.defenselink.mil/cgi-bin/dlprint.cgi
Werts, C. E., Rock, D. A., Linn, R. L., & Jöreskog, K. G. (1976). Comparison of correlations,variances, covariances, and regression weights with or without measurement error.Psychological Bulletin, 83(6), 1007-1013.
Williams, R. (2000, July 12). Recruiters discuss problems with top DoD officials. AmericanForces Information Service. Retrieved February 11, 2002, from the World Wide Web:http://www.defenselink.mil/news/Jul2000/n07122000_20007123.html.
Wilson, M. J., Greenlees, J. B., Hagerty, T., Helba, C. V., Hintze, D. W., & Lehnus, J. D.(2000). Youth Attitude Tracking Study 1999: Propensity and advertising report(CDES/YATS, DASW01-96-C-0041, Item No. 0020BA). Arlington, VA: DefenseManpower Data Center.
Wirthlin Worldwide. (2001a). Youth and adult polls: Research summary (presentationprepared, under contract, for Defense Manpower Data Center). Arlington, VA: DefenseManpower Data Center.
Wirthlin Worldwide. (2001b). Department of Defense adult poll: Wave 2 (September 2001)(report prepared, under contract, for Defense Manpower Data Center). Arlington, VA:Defense Manpower Data Center.
Yankelovich Partners. (2001). OmniPlus results: June 2001 (presentation prepared, undercontract, for Defense Manpower Data Center). Arlington, VA: Defense Manpower DataCenter.
Zucker, A. B. (2001). Information paper (Preliminary results on recruiter quality of life fromthe 2000 Military Recruiter Survey). Arlington, VA: Defense Manpower Data Center.

Appendix A
Data Collection Procedures and Sampling


A-1
Data Collection Procedures and Sampling
The target population for the 2000 Military Recruiter Survey was recruiters who hadgoals or missions and at least 1 year of recruiting experience. The sampling frame consisted ofmilitary personnel identified by the active Services and Reserve Components as being recruiters.A 56 percent stratified simple random sample was drawn from the frame (10,126 out of 23,254).Notification letters were mailed to 10,1151 respondents on November 1, 2000. The first wave ofsurveys was mailed November 16–22. Reminder/thank-you letters were sent the first ofDecember, and a second wave of surveys was mailed 2 weeks later to recruiters whosecompleted forms had not yet been received. The survey field was closed on February 9, 2001.
The number of returned, usable surveys was 5,639, yielding an unweighted response rateof 56.5 percent (the weighted response rate was 56.9 percent).2 Among those respondents, 23were officers and another 910 did not meet eligibility criteria for inclusion in the targetpopulation (i.e., no goals/missions and/or less than 1 year of recruiting experience), leaving4,706 cases in the data analysis respondent group.
The distribution of survey cases by eligibility status is shown in Table A.1. Thedistribution of eligible analysis cases by Service/Component is displayed in Table A.2.
Table A.1.Unweighted Distribution of Survey Cases by Eligibility Status
Number
Total Sample 10,126Eligible Nonrespondents Returned blank questionnaire 8 Returned substantially incomplete questionnaire 31Ineligible Respondents as Reported by Self or Proxy No longer a recruiter or separated/retired from the military 86Unknown Eligibility Not locatable 481 Other nonresponse 3,881 Subtotal Nonusable Sample Cases 4,487
Eligible Respondents Who Returned Usable Surveys 5,639
Respondents Ineligible for Survey Data Analysis 933 (Less than 1 year of recruiting experience, or no goals/missions, and/or no response to questions on experience or goals/missions)
Total Eligible Cases for Analysis 4,706
1 Eleven recruiters in the sample had addresses that were not usable.2 For information on weighting, see the Weighting Report for the 2000 Military Recruiter Survey.

A-2
Table A.2.Unweighted Distribution of Eligible Analysis Cases by Service and Component
Service/Component Number
Percentage ofActive Servicesor of ReserveComponents
Active Services 3,640 (77.35%) 99.9
Army 1,129 31.0 Navy 1,046 28.7 Marine Corps 713 19.6 Air Force 584 16.0 Coast Guard 168 4.6
Reserve and Guard Components 1,066 (22.65%) 100.1 Army Reserve 223 20.9 Army National Guard 459 43.1 Naval Reserve 149 14.0 Air Force Reserve 99 9.3 Air National Guard 136 12.8
Total Number of Survey Analysis Cases 4,706 Note. Percentages may not add to 100 because of rounding.

Appendix B
2000 Military Recruiter Survey


B-1
2000 MILITARY RECRUITER SURVEY2000 MILITARY RECRUITER SURVEY2000 MILITARY RECRUITER SURVEY2000 MILITARY RECRUITER SURVEY
The purpose of the 2000 survey is to ask experienced production recruiters their views on key issues that affect the quality ofThe purpose of the 2000 survey is to ask experienced production recruiters their views on key issues that affect the quality ofThe purpose of the 2000 survey is to ask experienced production recruiters their views on key issues that affect the quality ofThe purpose of the 2000 survey is to ask experienced production recruiters their views on key issues that affect the quality oftheir work lives. The questions ask about management support, training, working conditions and stress. A similartheir work lives. The questions ask about management support, training, working conditions and stress. A similartheir work lives. The questions ask about management support, training, working conditions and stress. A similartheir work lives. The questions ask about management support, training, working conditions and stress. A similarquestionnaire was given five times before (1989, 1991, 1994, 1996 and 1998) and is being fielded this year to (1) track changes,questionnaire was given five times before (1989, 1991, 1994, 1996 and 1998) and is being fielded this year to (1) track changes,questionnaire was given five times before (1989, 1991, 1994, 1996 and 1998) and is being fielded this year to (1) track changes,questionnaire was given five times before (1989, 1991, 1994, 1996 and 1998) and is being fielded this year to (1) track changes,(2) adjust policies and procedures, and (3) direct resources toward improving the working conditions and effectiveness of(2) adjust policies and procedures, and (3) direct resources toward improving the working conditions and effectiveness of(2) adjust policies and procedures, and (3) direct resources toward improving the working conditions and effectiveness of(2) adjust policies and procedures, and (3) direct resources toward improving the working conditions and effectiveness ofmilitary recruiters. Therefore, it is important that you fill this survey out honestly.military recruiters. Therefore, it is important that you fill this survey out honestly.military recruiters. Therefore, it is important that you fill this survey out honestly.military recruiters. Therefore, it is important that you fill this survey out honestly.
INSTRUCTIONS FOR COMPLETING THE SURVEYINSTRUCTIONS FOR COMPLETING THE SURVEYINSTRUCTIONS FOR COMPLETING THE SURVEYINSTRUCTIONS FOR COMPLETING THE SURVEY
! THIS IS NOT A TEST, SO TAKE YOUR TIME.
! Select answers that best fit you.
! Use pencil or pen to complete the survey. Make your marks dark so that they are easily read.
! Note that sometimes you will be asked to mark only one response and sometimes, you may be asked to mark all that apply.
! Fill in the appropriate answer.
! To change an answer using pencil, erase the wrong answer completely and fill in the correct answer.
! To change an answer using pen, put an “X” through the wrong answer and fill in the correct answer.
CORRECT ANSWER INCORRECT ANSWER
! !Answers to some questions will be on a 5-point scale.
Example:Example:Example:Example:
To what extent do you agree or disagree with the followingTo what extent do you agree or disagree with the followingTo what extent do you agree or disagree with the followingTo what extent do you agree or disagree with the followingstatements about your office?statements about your office?statements about your office?statements about your office?
Strongly disagreeStrongly disagreeStrongly disagreeStrongly disagreeDisagreeDisagreeDisagreeDisagree
Neither agree nor disagreeNeither agree nor disagreeNeither agree nor disagreeNeither agree nor disagreeAgreeAgreeAgreeAgree
Strongly agreeStrongly agreeStrongly agreeStrongly agree
My recruiting office presents aprofessional environment forpotential applicants......……….. " ! # $ %
Sometimes you will be asked to choose one answer foryourself and one for your family member. When thisinstruction appears, select one answer in each column.
Example:Example:Example:Example:
At your current duty assignment, what type of treatmentAt your current duty assignment, what type of treatmentAt your current duty assignment, what type of treatmentAt your current duty assignment, what type of treatmentfacility do you and members of your family facility do you and members of your family facility do you and members of your family facility do you and members of your family usuallyusuallyusuallyusually go to go to go to go towhen sick or in need of health advice? Please mark onewhen sick or in need of health advice? Please mark onewhen sick or in need of health advice? Please mark onewhen sick or in need of health advice? Please mark oneanswer in each column.answer in each column.answer in each column.answer in each column.
YourselfYourselfYourselfYourselfMembers ofMembers ofMembers ofMembers ofyour familyyour familyyour familyyour family
A military clinic or hospital…. " "Off-base, DoD contractedclinic (e.g., PRIMUS)………… ! &A civilian clinic or doctor(not contracted by DoD)…….. # !Some other type oftreatment facility.…………….. $ $Not applicable, haven'tneeded medical care at mycurrent duty assignment........ % %
PRIVACY ACT STATEMENTPRIVACY ACT STATEMENTPRIVACY ACT STATEMENTPRIVACY ACT STATEMENT
In accordance with the Privacy Act of 1974 (Public Law 93-579), this notice informs you of the purpose of the survey and how the findings will be used.Please read it carefully.
AUTHORITY:AUTHORITY:AUTHORITY:AUTHORITY: 10 USC 136 and 2358
PRINCIPAL PURPOSE:PRINCIPAL PURPOSE:PRINCIPAL PURPOSE:PRINCIPAL PURPOSE: Information collected in this survey will be used to assess attitudes and perceptions of military recruiting life. This informationwill assist in the formulation of policies which may be needed to improve the military working environment and relevant recruiting policies.
ROUTINE USES:ROUTINE USES:ROUTINE USES:ROUTINE USES: None.
DISCLOSURE:DISCLOSURE:DISCLOSURE:DISCLOSURE: Providing information on this survey is voluntary. There is no penalty if you choose not to respond. However, maximum participation isencouraged so that data will be complete and representative. Your survey instrument will be treated as confidential. Identifying information will be usedonly by persons engaged in, and for the purpose of, the survey. Only group statistics will be reported.
X

B-2
Assignment InformationAssignment InformationAssignment InformationAssignment Information
1.1.1.1. What is your branch of Service/Reserve Component?What is your branch of Service/Reserve Component?What is your branch of Service/Reserve Component?What is your branch of Service/Reserve Component?
" Army ' Army Reserve & Navy ( Army National Guard # Marine Corps ) Naval Reserve $ Air Force * Air Force Reserve % Coast Guard + Air National Guard
2.2.2.2. How long have you been assigned to recruiting dutyHow long have you been assigned to recruiting dutyHow long have you been assigned to recruiting dutyHow long have you been assigned to recruiting duty(include all tours in recruiting)?(include all tours in recruiting)?(include all tours in recruiting)?(include all tours in recruiting)?
" Less than one year & 1 year, but less than 2 # 2 years, but less than 3 $ 3 years, but less than 6 % 6 or more years
3.3.3.3. Is this your first tour in recruiting?Is this your first tour in recruiting?Is this your first tour in recruiting?Is this your first tour in recruiting?
" Yes & No
4.4.4.4. Do you have specific monthly/annual goals/missions?Do you have specific monthly/annual goals/missions?Do you have specific monthly/annual goals/missions?Do you have specific monthly/annual goals/missions?(MARK ALL THAT APPLY)(MARK ALL THAT APPLY)(MARK ALL THAT APPLY)(MARK ALL THAT APPLY)
" Yes, personal monthly goals/missions & Yes, personal annual goals/missions # Yes, team monthly goals/missions $ Yes, team annual goals/missions % No, neither personal nor team goals/missions
5.5.5.5. What were your reasons for becoming a recruiter?What were your reasons for becoming a recruiter?What were your reasons for becoming a recruiter?What were your reasons for becoming a recruiter?(MARK ALL THAT APPLY)(MARK ALL THAT APPLY)(MARK ALL THAT APPLY)(MARK ALL THAT APPLY)
" I was able to choose the location of my duty station & I wanted a change from my military specialty/occupation # Recruiting duty is career enhancing $ Recruiting duty is necessary for promotion % I believe in my Service and want to share it with others ' I want to help young people ( I had no choice ) Other, please specify _______________________
6.6.6.6. Did you volunteer to be a recruiter?Did you volunteer to be a recruiter?Did you volunteer to be a recruiter?Did you volunteer to be a recruiter?
" I was assigned to recruiting duty and not given a choice & I “volunteered,” but really had no choice # I volunteered, but would have preferred an assignment
other than recruiting $ I volunteered and wanted recruiting duty
7.7.7.7. How many other recruiters (any Service) have offices inHow many other recruiters (any Service) have offices inHow many other recruiters (any Service) have offices inHow many other recruiters (any Service) have offices inthe same location (i.e., building, strip-mall) as yourthe same location (i.e., building, strip-mall) as yourthe same location (i.e., building, strip-mall) as yourthe same location (i.e., building, strip-mall) as yourrecruiting station?recruiting station?recruiting station?recruiting station?
" None, just myself & 1 other recruiter # 2 other recruiters $ 3 to 5 other recruiters % 6 or more other recruiters
8.8.8.8. How many other recruiters of your own ServiceHow many other recruiters of your own ServiceHow many other recruiters of your own ServiceHow many other recruiters of your own ServiceBranch/Component are located in your recruitingBranch/Component are located in your recruitingBranch/Component are located in your recruitingBranch/Component are located in your recruitingstation?station?station?station?
" None, just myself & 1 other recruiter # 2 other recruiters $ 3 to 5 other recruiters % 6 or more other recruiters
9.9.9.9. Do you think your preferences were considered in yourDo you think your preferences were considered in yourDo you think your preferences were considered in yourDo you think your preferences were considered in yourcurrent duty location assignment?current duty location assignment?current duty location assignment?current duty location assignment?
" Yes & No
10.10.10.10. On average, what is the total number of hours per weekOn average, what is the total number of hours per weekOn average, what is the total number of hours per weekOn average, what is the total number of hours per weekyou spend performing recruiting related duties?you spend performing recruiting related duties?you spend performing recruiting related duties?you spend performing recruiting related duties?
" 40 hours or less & 41-50 hours # 51-60 hours $ 61-70 hours % 71-80 hours ' More than 80 hours
11.11.11.11. On average, what is the total number of hours perOn average, what is the total number of hours perOn average, what is the total number of hours perOn average, what is the total number of hours perweek you spend performing administrative duties?week you spend performing administrative duties?week you spend performing administrative duties?week you spend performing administrative duties?
" None & Some but less than 6 hours # 6-10 hours $ 11-20 hours % More than 20 hours
12.12.12.12. On average, what is the total number of hours per weekOn average, what is the total number of hours per weekOn average, what is the total number of hours per weekOn average, what is the total number of hours per weekyou spend on the phone with prospects?you spend on the phone with prospects?you spend on the phone with prospects?you spend on the phone with prospects?
" None & Some but less than 6 hours # 6-10 hours $ 11-20 hours % More than 20 hours
13.13.13.13. During the past year, have you voluntarily not takenDuring the past year, have you voluntarily not takenDuring the past year, have you voluntarily not takenDuring the past year, have you voluntarily not takenleave due to the demands of your job?leave due to the demands of your job?leave due to the demands of your job?leave due to the demands of your job?
" Yes & No
14.14.14.14. During the past year, did you request annual leave andDuring the past year, did you request annual leave andDuring the past year, did you request annual leave andDuring the past year, did you request annual leave andhave the request denied?have the request denied?have the request denied?have the request denied?
" Yes & No
15.15.15.15. How many days of annual leave did you take last year?How many days of annual leave did you take last year?How many days of annual leave did you take last year?How many days of annual leave did you take last year?
" 0 to 3 days & 4 to 7 days # 8 to 14 days $ 15 to 29 days % 30 or more days

B-3
16.16.16.16. In the past year, of the number of annual leave daysIn the past year, of the number of annual leave daysIn the past year, of the number of annual leave daysIn the past year, of the number of annual leave daystaken, what percentage did you work at least part of thetaken, what percentage did you work at least part of thetaken, what percentage did you work at least part of thetaken, what percentage did you work at least part of theday on work-related tasks?day on work-related tasks?day on work-related tasks?day on work-related tasks?
" 0% & 1-25% # 26-50% $ 51-75% % 76-100%
17.17.17.17. How many days of annual leave did you lose in the lastHow many days of annual leave did you lose in the lastHow many days of annual leave did you lose in the lastHow many days of annual leave did you lose in the lastfiscal year due to the demands of your recruiting duty?fiscal year due to the demands of your recruiting duty?fiscal year due to the demands of your recruiting duty?fiscal year due to the demands of your recruiting duty?
" None & 1-5 days # 6-10 days $ 11-20 days % 21+ days
Housing/ResidenceHousing/ResidenceHousing/ResidenceHousing/Residence
18.18.18.18. Compared with living conditions in base housing, howCompared with living conditions in base housing, howCompared with living conditions in base housing, howCompared with living conditions in base housing, howdo you rate your current living conditions with respectdo you rate your current living conditions with respectdo you rate your current living conditions with respectdo you rate your current living conditions with respectto quality and cost?to quality and cost?to quality and cost?to quality and cost?
" Not applicable, I have never lived on base GO TO QUESTION 19 & Not applicable, I am currently living on base GO TO QUESTION 19
QualityQualityQualityQuality CostCostCostCost
" Better
" More
& Same & Same
# Worse # Less
19.19.19.19. What is the average ONE-WAY driving time from yourWhat is the average ONE-WAY driving time from yourWhat is the average ONE-WAY driving time from yourWhat is the average ONE-WAY driving time from yourresidence to your duty location?residence to your duty location?residence to your duty location?residence to your duty location?
" Less than 15 minutes & 15-30 minutes # 31-60 minutes $ More than 1 hour
20.20.20.20. How long does it usually take you to travel from yourHow long does it usually take you to travel from yourHow long does it usually take you to travel from yourHow long does it usually take you to travel from yourresidence to your nearest…?residence to your nearest…?residence to your nearest…?residence to your nearest…?
More than 2 hoursMore than 2 hoursMore than 2 hoursMore than 2 hours 91 minutes to 2 hours91 minutes to 2 hours91 minutes to 2 hours91 minutes to 2 hours
61-90 minutes61-90 minutes61-90 minutes61-90 minutes 31-60 minutes31-60 minutes31-60 minutes31-60 minutes
15-30 minutes15-30 minutes15-30 minutes15-30 minutes Less than 15 minutesLess than 15 minutesLess than 15 minutesLess than 15 minutes
a. Military exchange.....…...… " & # $ % '
b. Commissary....................... " & # $ % '
c. Military hospital/clinic......... " & # $ % '
21.21.21.21. How satisfied are you with the following characteristicsHow satisfied are you with the following characteristicsHow satisfied are you with the following characteristicsHow satisfied are you with the following characteristicsof your current residence and community at yourof your current residence and community at yourof your current residence and community at yourof your current residence and community at yourpermanent duty station?permanent duty station?permanent duty station?permanent duty station?
Not applicableNot applicableNot applicableNot applicable Very dissatisfiedVery dissatisfiedVery dissatisfiedVery dissatisfied
DissatisfiedDissatisfiedDissatisfiedDissatisfied Neither satisfied nor dissatisfiedNeither satisfied nor dissatisfiedNeither satisfied nor dissatisfiedNeither satisfied nor dissatisfied
SatisfiedSatisfiedSatisfiedSatisfied Very satisfiedVery satisfiedVery satisfiedVery satisfied
a. Cost of residence................ " & # $ % '
b. Schools............................... " & # $ % '
c. Availability of childcare....... " & # $ % '
d. Spouse employment........... " & # $ % '

B-4
Your WorkplaceYour WorkplaceYour WorkplaceYour Workplace
22.22.22.22. To what extent do you agree or disagree with theTo what extent do you agree or disagree with theTo what extent do you agree or disagree with theTo what extent do you agree or disagree with thefollowing statements about your office?following statements about your office?following statements about your office?following statements about your office?
Not applicableNot applicableNot applicableNot applicableStrongly disagreeStrongly disagreeStrongly disagreeStrongly disagree
DisagreeDisagreeDisagreeDisagreeNeither agree nor disagreeNeither agree nor disagreeNeither agree nor disagreeNeither agree nor disagree
AgreeAgreeAgreeAgreeStrongly agreeStrongly agreeStrongly agreeStrongly agree
a. My recruiting officepresents a professionalenvironment for potentialapplicants......……………… " & # $ % '
b. My recruiting officepresents a pleasantenvironment for potentialapplicants...........………….. " & # $ % '
c. My recruiting officecontributes to mysuccess as a recruiter.…… " & # $ % '
d. My recruiting office getsvery few walk-in potentialapplicants…………..……… " & # $ % '
e. I could successfully recruitmore applicants if my officelooked “high-tech”………… " & # $ % '
f. There is a goodrelationship between myoffice and other tenants(non-Service) in the area… " & # $ % '
g. There is a goodrelationship between myrecruiting office’s landlordand the assignedrecruiters…………..….…… " & # $ % '
h. My recruiting office isconveniently located.......… " & # $ % '
i. Prospective applicantshave little trouble findingmy recruiting office.........… " & # $ % '
j. My recruiting office islocated close to highschools…........................… " & # $ % '
k. My recruiting office isaccessible to potentialapplicants.......................… " & # $ % '
l. Parking is available forapplicants at my office....... " & # $ % '
m. Parking is convenient forapplicants at my office….... " & # $ % '
n. Parking is available forrecruiters at my office....…. " & # $ % '
o. Parking is convenient forrecruiters at my office...….. " & # $ % '
23.23.23.23. How much do you spend monthly to park your POV atHow much do you spend monthly to park your POV atHow much do you spend monthly to park your POV atHow much do you spend monthly to park your POV atwork?work?work?work?
" Not applicable, I use other transportation to get to work & None, free parking # $1-$50 $ $51-$100 % $101 or more per month
24.24.24.24. How much do you spend monthly to use publicHow much do you spend monthly to use publicHow much do you spend monthly to use publicHow much do you spend monthly to use publictransportation for work?transportation for work?transportation for work?transportation for work?
" Not applicable, I do not use public transportation & $1-$50 # $51-$100 $ $101 or more per month
25.25.25.25. If not located near a military installation, does yourIf not located near a military installation, does yourIf not located near a military installation, does yourIf not located near a military installation, does yourRecruiting Headquarters provide fitness center accessRecruiting Headquarters provide fitness center accessRecruiting Headquarters provide fitness center accessRecruiting Headquarters provide fitness center accessto you at to you at to you at to you at nononono out-of-pocket expense? out-of-pocket expense? out-of-pocket expense? out-of-pocket expense?
" Not applicable, I am located near a military installation & Yes # No
TrainingTrainingTrainingTraining
26.26.26.26. To what extent do you agree or disagree with theTo what extent do you agree or disagree with theTo what extent do you agree or disagree with theTo what extent do you agree or disagree with thefollowing statements about your formal training andfollowing statements about your formal training andfollowing statements about your formal training andfollowing statements about your formal training andpreparation for recruiting duty?preparation for recruiting duty?preparation for recruiting duty?preparation for recruiting duty?
Not applicableNot applicableNot applicableNot applicable
Strongly disagreeStrongly disagreeStrongly disagreeStrongly disagree DisagreeDisagreeDisagreeDisagree
Neither agree nor disagreeNeither agree nor disagreeNeither agree nor disagreeNeither agree nor disagree AgreeAgreeAgreeAgree
Strongly agreeStrongly agreeStrongly agreeStrongly agree
a. I was given a realisticpreview of what recruitingduty would be like..........…. " & # $ % '
b. Members of my familywere well prepared bymy Service for therequirements anddemands of my recruitingassignment………………… " & # $ % '
c. I was given goodprofessional training formy job as a recruiter......…. " & # $ % '
d. The training I receivedwas helpful and relevant formy job as a recruiter..… " & # $ % '
e. The training I receivedwas insufficient for whatI needed to know to doeffective recruiting.........….. " & # $ % '
f. My allocated time intraining was sufficient….…. " & # $ % '

B-5
27.27.27.27. Did your immediate supervisor train you for your job asDid your immediate supervisor train you for your job asDid your immediate supervisor train you for your job asDid your immediate supervisor train you for your job asa recruiter?a recruiter?a recruiter?a recruiter?
" Yes & No
28.28.28.28. How frequently did an experienced recruiter help youHow frequently did an experienced recruiter help youHow frequently did an experienced recruiter help youHow frequently did an experienced recruiter help youduring on-the-job training?during on-the-job training?during on-the-job training?during on-the-job training?
" Frequently & Occasionally # Seldom $ Never
29.29.29.29. How much do you agree or disagree with the followingHow much do you agree or disagree with the followingHow much do you agree or disagree with the followingHow much do you agree or disagree with the followingstatements about refresher (i.e., TDY, in-house,statements about refresher (i.e., TDY, in-house,statements about refresher (i.e., TDY, in-house,statements about refresher (i.e., TDY, in-house,monthly, weekly) training?monthly, weekly) training?monthly, weekly) training?monthly, weekly) training?
Not applicableNot applicableNot applicableNot applicable Strongly disagreeStrongly disagreeStrongly disagreeStrongly disagree
DisagreeDisagreeDisagreeDisagree Neither agree nor disagreeNeither agree nor disagreeNeither agree nor disagreeNeither agree nor disagree
AgreeAgreeAgreeAgree Strongly agreeStrongly agreeStrongly agreeStrongly agree
a. I receive adequaterefresher training……........ " & # $ % '
b. I receive adequaterefresher trainingfrom my supervisor……….. " & # $ % '
c. I receive adequaterefresher training frommy recruiter instructor/trainer................………….. " & # $ % '
30.30.30.30. Which of the following would make refresher trainingWhich of the following would make refresher trainingWhich of the following would make refresher trainingWhich of the following would make refresher trainingbetter? (MARK ALL THAT APPLY)better? (MARK ALL THAT APPLY)better? (MARK ALL THAT APPLY)better? (MARK ALL THAT APPLY)
" More frequent training sessions & Establish regularly scheduled training # Have recruiter instructors conduct more All Hands training $ Have recruiter instructors conduct more individual training % Have recruiters prepare and present training to each other ' Shadow experienced recruiter ( Other, please specify _______________________
31.31.31.31. On average, how long do you think it takes before theOn average, how long do you think it takes before theOn average, how long do you think it takes before theOn average, how long do you think it takes before thetypical new recruiter can perform at top efficiency?typical new recruiter can perform at top efficiency?typical new recruiter can perform at top efficiency?typical new recruiter can perform at top efficiency?
" Less than 6 months & 6 months to less than 1 year # 1-2 years $ More than 2 years
Goal/MissionGoal/MissionGoal/MissionGoal/Mission
32.32.32.32. With reference to your recruiting goals/missions, toWith reference to your recruiting goals/missions, toWith reference to your recruiting goals/missions, toWith reference to your recruiting goals/missions, towhat extent do you agree or disagree with the followingwhat extent do you agree or disagree with the followingwhat extent do you agree or disagree with the followingwhat extent do you agree or disagree with the followingstatements?statements?statements?statements?
Not applicableNot applicableNot applicableNot applicable Strongly disagreeStrongly disagreeStrongly disagreeStrongly disagree
DisagreeDisagreeDisagreeDisagree Neither agree nor disagreeNeither agree nor disagreeNeither agree nor disagreeNeither agree nor disagree
AgreeAgreeAgreeAgree Strongly agreeStrongly agreeStrongly agreeStrongly agree
a. My monthly goals/missionsare achievable..................… " & # $ % '
b. My assigned market areais adequate to make goal/mission......................……… " & # $ % '
c. Success in reachinggoal/mission has a “makeor break” effect on mymilitary career......………….. " & # $ % '
d. I am pressured to continuerecruiting even afterreaching my monthlygoal/mission......................… " & # $ % '
e. I am punished if I fall shortof goal/mission..................… " & # $ % '
f. If I miss my goal/missionone month, I can make itup the next month........……. " & # $ % '
g. I receive adequate support(e.g., cars, telephone,promotional items) to helpme accomplish mygoal/mission.........…............. " & # $ % '
h. Required paperworkinterferes with my effortsto make goal/mission.......…. " & # $ % '
i. My supervisor will help meif I have trouble makinggoal/mission......................… " & # $ % '
33.33.33.33. In how many of the months of the past fiscal year didIn how many of the months of the past fiscal year didIn how many of the months of the past fiscal year didIn how many of the months of the past fiscal year didyou achieve your monthly goal/mission?you achieve your monthly goal/mission?you achieve your monthly goal/mission?you achieve your monthly goal/mission?
" Less than 3 months & 3-5 months # 6-8 months $ 9-11 months % All 12 months ' Not applicable

B-6
34.34.34.34. What percentage of your recruiting goal/mission didWhat percentage of your recruiting goal/mission didWhat percentage of your recruiting goal/mission didWhat percentage of your recruiting goal/mission didyou achieve in the last fiscal year?you achieve in the last fiscal year?you achieve in the last fiscal year?you achieve in the last fiscal year?
" 0 to 75% & 76 to 100% # 101 to 125% $ 126 to 150% % More than 150% ' Not applicable
35.35.35.35. All things considered, what is the likelihood thatAll things considered, what is the likelihood thatAll things considered, what is the likelihood thatAll things considered, what is the likelihood thatexperienced recruiters can make goal/mission in yourexperienced recruiters can make goal/mission in yourexperienced recruiters can make goal/mission in yourexperienced recruiters can make goal/mission in yourzone/area?zone/area?zone/area?zone/area?
" Extremely difficult & Difficult but can be made with extra effort # Should be able to make goal/mission but difficult to
exceed $ Not only achievable, but good chance to exceed % Very excellent chance to exceed goal/mission
36.36.36.36. Compared to other recruiters from Compared to other recruiters from Compared to other recruiters from Compared to other recruiters from your Serviceyour Serviceyour Serviceyour Service who who who whowork in the area served by your MEPS, would you saywork in the area served by your MEPS, would you saywork in the area served by your MEPS, would you saywork in the area served by your MEPS, would you sayyou are:you are:you are:you are:
" One of the best (exceed 95 percentile) & Better than most (66 to 95 percentile) # Average (35 to 65 percentile) $ Below average (below 35 percentile)
37.37.37.37. In your current assignment, do you recruit Non-PriorIn your current assignment, do you recruit Non-PriorIn your current assignment, do you recruit Non-PriorIn your current assignment, do you recruit Non-PriorService (NPS) applicants?Service (NPS) applicants?Service (NPS) applicants?Service (NPS) applicants?
" Yes & No GO TO QUESTION 40
38.38.38.38. If YES to previous question,If YES to previous question,If YES to previous question,If YES to previous question,
a.a.a.a. How many NPS applicants did you recruit in theHow many NPS applicants did you recruit in theHow many NPS applicants did you recruit in theHow many NPS applicants did you recruit in thepast fiscal year?past fiscal year?past fiscal year?past fiscal year?
Write the number of NPS applicants you recruitedWrite the number of NPS applicants you recruitedWrite the number of NPS applicants you recruitedWrite the number of NPS applicants you recruitedin the boxes. For example, if you recruited 20 NPSin the boxes. For example, if you recruited 20 NPSin the boxes. For example, if you recruited 20 NPSin the boxes. For example, if you recruited 20 NPSapplicants, you would enter "020" .applicants, you would enter "020" .applicants, you would enter "020" .applicants, you would enter "020" .
NPS IN PAST FISCAL YEARNPS IN PAST FISCAL YEARNPS IN PAST FISCAL YEARNPS IN PAST FISCAL YEAR
b.b.b.b. How many of these applicants resulted from theHow many of these applicants resulted from theHow many of these applicants resulted from theHow many of these applicants resulted from theASVAB Student Testing Program (STP) leads?ASVAB Student Testing Program (STP) leads?ASVAB Student Testing Program (STP) leads?ASVAB Student Testing Program (STP) leads?
Write the number of NPS applicants you recruitedWrite the number of NPS applicants you recruitedWrite the number of NPS applicants you recruitedWrite the number of NPS applicants you recruitedfrom the ASVAB STP in the boxes. For example, iffrom the ASVAB STP in the boxes. For example, iffrom the ASVAB STP in the boxes. For example, iffrom the ASVAB STP in the boxes. For example, ifyou recruited two applicants from the ASVAB STPyou recruited two applicants from the ASVAB STPyou recruited two applicants from the ASVAB STPyou recruited two applicants from the ASVAB STPleads, you would enter "002" .leads, you would enter "002" .leads, you would enter "002" .leads, you would enter "002" .
NPS APPLICANTS FROMNPS APPLICANTS FROMNPS APPLICANTS FROMNPS APPLICANTS FROMASVAB STP LEADSASVAB STP LEADSASVAB STP LEADSASVAB STP LEADS
39.39.39.39. How would you rate the overall importance of each ofHow would you rate the overall importance of each ofHow would you rate the overall importance of each ofHow would you rate the overall importance of each ofthe following lead sources for attaining your NPSthe following lead sources for attaining your NPSthe following lead sources for attaining your NPSthe following lead sources for attaining your NPSrecruiting goals/missions?recruiting goals/missions?recruiting goals/missions?recruiting goals/missions?
Not applicableNot applicableNot applicableNot applicableVery unimportantVery unimportantVery unimportantVery unimportantUnimportantUnimportantUnimportantUnimportant
Neither important nor unimportantNeither important nor unimportantNeither important nor unimportantNeither important nor unimportantImportantImportantImportantImportant
Very importantVery importantVery importantVery important
a. ASVAB Student TestingProgram..........................… " & # $ % '
b. High School lists/studentdirectories....................…… " & # $ % '
c. Referrals fromapplicants....
" & # $ % '
d. Local advertising...........….. " & # $ % '
e. National leads (e.g., directmailouts, 800 number,Internet).........................….. " & # $ % '
f. Community colleges..….…. " & # $ % '
g. 4-year colleges/universities………………… " & # $ % '
h. Local merchants/community contacts............ " & # $ % '
i. Recruiter Assistance(HRAP, HARP, RAP,PRASP, Boot Leave, etc.)… " & # $ % '
j. Recruiting stationwalk-ins…………………….. " & # $ % '

B-7
Job DemandsJob DemandsJob DemandsJob Demands
40.40.40.40. To what extent do you agree or disagree with theTo what extent do you agree or disagree with theTo what extent do you agree or disagree with theTo what extent do you agree or disagree with thefollowing statements?following statements?following statements?following statements?
Not applicableNot applicableNot applicableNot applicableStrongly disagreeStrongly disagreeStrongly disagreeStrongly disagree
DisagreeDisagreeDisagreeDisagreeNeither agree nor disagreeNeither agree nor disagreeNeither agree nor disagreeNeither agree nor disagree
AgreeAgreeAgreeAgreeStrongly agreeStrongly agreeStrongly agreeStrongly agree
a. I have the opportunityto earn an award forproduction.......................… " & # $ % '
b. The awards available tome have important effectson my career....…...........… " & # $ % '
c. Some recruiters are notsuccessful because theylack aptitude for sales.....… " & # $ % '
d. The good recruiters in myoffice make up for otherswho can’t make theirquotas.............................… " & # $ % '
e. The contract quotas I amgiven reflect the actualaccession requirements.… " & # $ % '
f. Working hard just makesmore work for me in thefuture.......................…....… " & # $ % '
g. Recruiter leadership doesa good job of keepingrecruiters informed ofinitiatives to improvequality-of-life (e.g., housing,medical, pay, CONUSCOLA, childcare)………….. " & # $ % '
h. The morale of therecruiters I work with isgood...........…………….….. " & # $ % '
i. My pay is appropriatefor the job I do..............…... " & # $ % '
j. If a recruit was not qualifiedfor my Service, I wouldrefer him or her to anotherService..........…...…………. " & # $ % '
41.41.41.41. The degree to which Recruiting Commands manageThe degree to which Recruiting Commands manageThe degree to which Recruiting Commands manageThe degree to which Recruiting Commands manageoffice level recruiting activities varies. For eachoffice level recruiting activities varies. For eachoffice level recruiting activities varies. For eachoffice level recruiting activities varies. For eachstatement, indicate whether you agree or disagree.statement, indicate whether you agree or disagree.statement, indicate whether you agree or disagree.statement, indicate whether you agree or disagree.
Not applicableNot applicableNot applicableNot applicableStrongly disagreeStrongly disagreeStrongly disagreeStrongly disagree
DisagreeDisagreeDisagreeDisagreeNeither agree nor disagreeNeither agree nor disagreeNeither agree nor disagreeNeither agree nor disagree
AgreeAgreeAgreeAgreeStrongly agreeStrongly agreeStrongly agreeStrongly agree
a. The mileage restrictionplaced on governmentvehicles interferes with myability to do my job...… " & # $ % '
b. I have the freedom topersonally plan my workand use my judgment asto the best method forrecruiting in my assignedarea...............................… " & # $ % '
c. I receive good supportfrom my supervisors......… " & # $ % '
d. My superiors and I workas a team…………………. " & # $ % '

B-8
42.42.42.42. Below is a list of statements that relate to aspects of lifeBelow is a list of statements that relate to aspects of lifeBelow is a list of statements that relate to aspects of lifeBelow is a list of statements that relate to aspects of lifeas a recruiter. For each statement, indicate whetheras a recruiter. For each statement, indicate whetheras a recruiter. For each statement, indicate whetheras a recruiter. For each statement, indicate whetheryou agree or disagree.you agree or disagree.you agree or disagree.you agree or disagree.
Not applicableNot applicableNot applicableNot applicableStrongly disagreeStrongly disagreeStrongly disagreeStrongly disagree
DisagreeDisagreeDisagreeDisagreeNeither agree nor disagreeNeither agree nor disagreeNeither agree nor disagreeNeither agree nor disagree
AgreeAgreeAgreeAgreeStrongly agreeStrongly agreeStrongly agreeStrongly agree
a. Supervisors understandand help recruiters withproblems.....................….… " & # $ % '
b. Recruiters are recognizedfor doing a good job..…..… " & # $ % '
c. Skills attained in recruitingare helpful in securing agood civilian job...….......… " & # $ % '
d. Recruiting is importantwork................................… " & # $ % '
e. Recruiting is challengingwork................................… " & # $ % '
f. Recruiters’ pay is sufficientto meet expenses..........…. " & # $ % '
g. Promotion opportunity isbetter than it would havebeen without a recruitingassignment....................…. " & # $ % '
h. I would encourage myfriends to becomerecruiters.........................… " & # $ % '
i. I feel emotionally drainedfrom my work..................… " & # $ % '
j. I feel fatigued when Iget up in the morning andhave to face another dayon the job............….……… " & # $ % '
k. Working with people allday is really a strain forme..................................…. " & # $ % '
l. I feel burned out from myjob...................................… " & # $ % '
m. I feel frustrated by my job... " & # $ % '
n. I feel like I am at the endof my rope.......…............… " & # $ % '
43.43.43.43. This section of questions asks how your work hasThis section of questions asks how your work hasThis section of questions asks how your work hasThis section of questions asks how your work haschanged since 1998 or since you began, if after 1998.changed since 1998 or since you began, if after 1998.changed since 1998 or since you began, if after 1998.changed since 1998 or since you began, if after 1998.
Much lessMuch lessMuch lessMuch lessLessLessLessLess
SameSameSameSameGreaterGreaterGreaterGreater
Much greaterMuch greaterMuch greaterMuch greater
a. The amount of contact you havewith key influencers such as theparents of prospects is..............… " & # $ %
b. The number of times you visit thehigh schools in your market is...… " & # $ %
c. The types and values of incentivepackages you can discuss withyour prospects are....................… " & # $ %
d. The overseas assignmentopportunities you can discussare………………………………….. " & # $ %
e. The amount of time you spendpre-prospecting (e.g., boy scouts,cub scouts, coaching youthfootball) is.................................… " & # $ %
f. The amount of time you spendprospecting is............................… " & # $ %
g. The number of hours per weekyou spend performing duty-related tasks is.............................. " & # $ %
h. The amount of participation incommunity events to support yourrecruiting job is.........................…. " & # $ %
i. The number of work hoursrequired to meet goal/mission is... " & # $ %
j. The amount of paperworkrequired to get reimbursed forrecruiting expenses is.............….. " & # $ %
k. The amount of money recruitershave to pay for medical expensesis.............................................….. " & # $ %
l. The amount of free time recruitershave to attend to personal dutiesis............................................…... " & # $ %
m. The staffing level for recruiters inyour office is.............................…. " & # $ %
n. The experience level of yourfellow recruiters is......................... " & # $ %
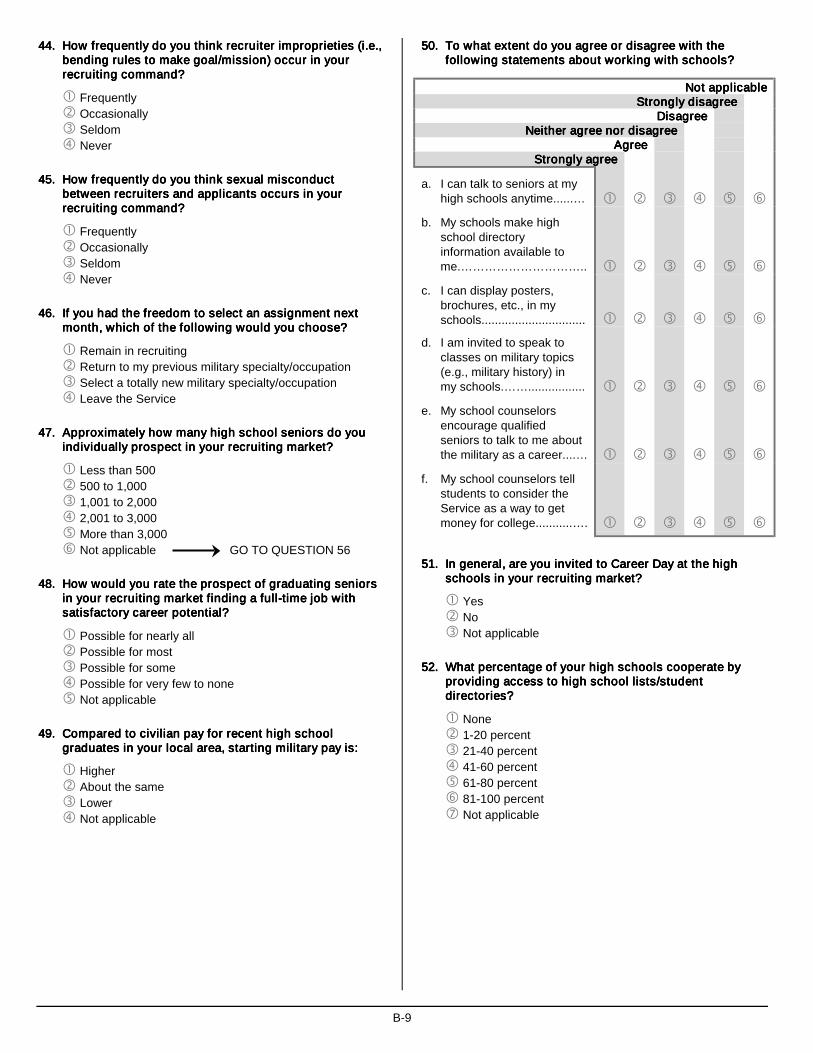
B-9
44.44.44.44. How frequently do you think recruiter improprieties (i.e.,How frequently do you think recruiter improprieties (i.e.,How frequently do you think recruiter improprieties (i.e.,How frequently do you think recruiter improprieties (i.e.,bending rules to make goal/mission) occur in yourbending rules to make goal/mission) occur in yourbending rules to make goal/mission) occur in yourbending rules to make goal/mission) occur in yourrecruiting command?recruiting command?recruiting command?recruiting command?
" Frequently & Occasionally # Seldom $ Never
45.45.45.45. How frequently do you think sexual misconductHow frequently do you think sexual misconductHow frequently do you think sexual misconductHow frequently do you think sexual misconductbetween recruiters and applicants occurs in yourbetween recruiters and applicants occurs in yourbetween recruiters and applicants occurs in yourbetween recruiters and applicants occurs in yourrecruiting command?recruiting command?recruiting command?recruiting command?
" Frequently & Occasionally # Seldom $ Never
46.46.46.46. If you had the freedom to select an assignment nextIf you had the freedom to select an assignment nextIf you had the freedom to select an assignment nextIf you had the freedom to select an assignment nextmonth, which of the following would you choose?month, which of the following would you choose?month, which of the following would you choose?month, which of the following would you choose?
" Remain in recruiting & Return to my previous military specialty/occupation # Select a totally new military specialty/occupation $ Leave the Service
47.47.47.47. Approximately how many high school seniors do youApproximately how many high school seniors do youApproximately how many high school seniors do youApproximately how many high school seniors do youindividually prospect in your recruiting market?individually prospect in your recruiting market?individually prospect in your recruiting market?individually prospect in your recruiting market?
" Less than 500 & 500 to 1,000 # 1,001 to 2,000 $ 2,001 to 3,000 % More than 3,000 ' Not applicable GO TO QUESTION 56
48.48.48.48. How would you rate the prospect of graduating seniorsHow would you rate the prospect of graduating seniorsHow would you rate the prospect of graduating seniorsHow would you rate the prospect of graduating seniorsin your recruiting market finding a full-time job within your recruiting market finding a full-time job within your recruiting market finding a full-time job within your recruiting market finding a full-time job withsatisfactory career potential?satisfactory career potential?satisfactory career potential?satisfactory career potential?
" Possible for nearly all & Possible for most # Possible for some $ Possible for very few to none % Not applicable
49.49.49.49. Compared to civilian pay for recent high schoolCompared to civilian pay for recent high schoolCompared to civilian pay for recent high schoolCompared to civilian pay for recent high schoolgraduates in your local area, starting military pay is:graduates in your local area, starting military pay is:graduates in your local area, starting military pay is:graduates in your local area, starting military pay is:
" Higher & About the same # Lower $ Not applicable
50.50.50.50. To what extent do you agree or disagree with theTo what extent do you agree or disagree with theTo what extent do you agree or disagree with theTo what extent do you agree or disagree with thefollowing statements about working with schools?following statements about working with schools?following statements about working with schools?following statements about working with schools?
Not applicableNot applicableNot applicableNot applicableStrongly disagreeStrongly disagreeStrongly disagreeStrongly disagree
DisagreeDisagreeDisagreeDisagreeNeither agree nor disagreeNeither agree nor disagreeNeither agree nor disagreeNeither agree nor disagree
AgreeAgreeAgreeAgreeStrongly agreeStrongly agreeStrongly agreeStrongly agree
a. I can talk to seniors at myhigh schools anytime......… " & # $ % '
b. My schools make highschool directoryinformation available tome.………………………….. " & # $ % '
c. I can display posters,brochures, etc., in myschools............................... " & # $ % '
d. I am invited to speak toclasses on military topics(e.g., military history) inmy schools.……................. " & # $ % '
e. My school counselorsencourage qualifiedseniors to talk to me aboutthe military as a career....… " & # $ % '
f. My school counselors tellstudents to consider theService as a way to getmoney for college...........…. " & # $ % '
51.51.51.51. In general, are you invited to Career Day at the highIn general, are you invited to Career Day at the highIn general, are you invited to Career Day at the highIn general, are you invited to Career Day at the highschools in your recruiting market?schools in your recruiting market?schools in your recruiting market?schools in your recruiting market?
" Yes & No # Not applicable
52.52.52.52. What percentage of your high schools cooperate byWhat percentage of your high schools cooperate byWhat percentage of your high schools cooperate byWhat percentage of your high schools cooperate byproviding access to high school lists/studentproviding access to high school lists/studentproviding access to high school lists/studentproviding access to high school lists/studentdirectories?directories?directories?directories?
" None & 1-20 percent # 21-40 percent $ 41-60 percent % 61-80 percent ' 81-100 percent ( Not applicable

B-10
53.53.53.53. What percentage of your high schools cooperate byWhat percentage of your high schools cooperate byWhat percentage of your high schools cooperate byWhat percentage of your high schools cooperate byproviding access to students?providing access to students?providing access to students?providing access to students?
" None & 1-20 percent # 21-40 percent $ 41-60 percent % 61-80 percent ' 81-100 percent ( Not applicable
54.54.54.54. What percentage of high school senior names do youWhat percentage of high school senior names do youWhat percentage of high school senior names do youWhat percentage of high school senior names do youhave as a result of all lead sources (e.g., ASVAB STP,have as a result of all lead sources (e.g., ASVAB STP,have as a result of all lead sources (e.g., ASVAB STP,have as a result of all lead sources (e.g., ASVAB STP,high school lists, referrals, advertising lead cards)?high school lists, referrals, advertising lead cards)?high school lists, referrals, advertising lead cards)?high school lists, referrals, advertising lead cards)?
" None & 1-20 percent # 21-40 percent $ 41-60 percent % 61-80 percent ' 81-100 percent ( Not applicable
55.55.55.55. Do your supervisors actively assist recruiters in gettingDo your supervisors actively assist recruiters in gettingDo your supervisors actively assist recruiters in gettingDo your supervisors actively assist recruiters in gettingschools to cooperate by visiting schools, writingschools to cooperate by visiting schools, writingschools to cooperate by visiting schools, writingschools to cooperate by visiting schools, writingletters, talking with teachers, counselors, school boardletters, talking with teachers, counselors, school boardletters, talking with teachers, counselors, school boardletters, talking with teachers, counselors, school boardmembers, etc?members, etc?members, etc?members, etc?
" Yes, frequently & Sometimes # No, never $ Not applicable
56.56.56.56. What do members of your household/immediate familyWhat do members of your household/immediate familyWhat do members of your household/immediate familyWhat do members of your household/immediate familythink of think of think of think of youryouryouryour recruiting assignment? Are they: recruiting assignment? Are they: recruiting assignment? Are they: recruiting assignment? Are they:
" Very positive & Somewhat positive # Neutral, neither positive nor negative $ Somewhat negative % Very negative ' Not applicable
57.57.57.57. Are active attempts made by your recruiting commandAre active attempts made by your recruiting commandAre active attempts made by your recruiting commandAre active attempts made by your recruiting commandto involve your family in your recruiting job (e.g., specialto involve your family in your recruiting job (e.g., specialto involve your family in your recruiting job (e.g., specialto involve your family in your recruiting job (e.g., specialoffice social events for the entire family, discountedoffice social events for the entire family, discountedoffice social events for the entire family, discountedoffice social events for the entire family, discountedtickets for the family)?tickets for the family)?tickets for the family)?tickets for the family)?
" Yes, frequently & Sometimes # No, never $ Not applicable
ResourcesResourcesResourcesResources
58.58.58.58. With respect to recruiting, how important are theWith respect to recruiting, how important are theWith respect to recruiting, how important are theWith respect to recruiting, how important are thefollowing factors?following factors?following factors?following factors?
Not applicableNot applicableNot applicableNot applicableVery unimportantVery unimportantVery unimportantVery unimportantUnimportantUnimportantUnimportantUnimportant
Neither important nor unimportantNeither important nor unimportantNeither important nor unimportantNeither important nor unimportantImportantImportantImportantImportant
Very importantVery importantVery importantVery important
a. Formal training............…..… " & # $ %
b. On-the-job training............... " & # $ %
c. Advertising........................... " & # $ %
d. Promotional items................ " & # $ %
e. Educational benefits forprospects.......................….. " & # $ % '
f. Enlistment bonus................. " & # $ % '
g. Seasonal shipping bonus.... " & # $ % '
h. MEPS processing................ " & # $ %
i. Office computer andsoftware...........................… " & # $ %
j. Beeper or cellular phone..... " & # $ % '
k. Recruiter Internet access…. " & # $ % '
l. Recruiting stationlocation.............................… " & # $ %
m. Recruiting stationappearance......................… " & # $ %
n. Access to own Governmentvehicle..............................… " & # $ % '
o. Positive media publicity....... " & # $ %
p. Pro-military community/influencers......……………… " & # $ %
q. High school access............. " & # $ %
r. High school student lists..... " & # $ %

B-11
59.59.59.59. To what extent do you agree or disagree that theTo what extent do you agree or disagree that theTo what extent do you agree or disagree that theTo what extent do you agree or disagree that thefollowing recruiting resources are following recruiting resources are following recruiting resources are following recruiting resources are in need ofin need ofin need ofin need ofimprovementimprovementimprovementimprovement????
Not applicableNot applicableNot applicableNot applicableStrongly disagreeStrongly disagreeStrongly disagreeStrongly disagree
DisagreeDisagreeDisagreeDisagreeNeither agree nor disagreeNeither agree nor disagreeNeither agree nor disagreeNeither agree nor disagree
AgreeAgreeAgreeAgreeStrongly agreeStrongly agreeStrongly agreeStrongly agree
a. Formal training................… " & # $ %
b. On-the-job training.............. " & # $ %
c. Advertising.......................... " & # $ %
d. Promotional items............... " & # $ %
e. Educational benefits forprospects.......................…. " & # $ % '
f. Enlistment bonus................ " & # $ % '
g. Seasonal shipping bonus... " & # $ % '
h. MEPS processing............... " & # $ %
i. MEPS medical screening... " & # $ %
j. MEPS testing...................... " & # $ %
k. MEPS liaisons.................... " & # $ %
l. Office computer andsoftware..........................… " & # $ %
m. Beeper or cellular phone.... " & # $ % '
n. Recruiter Internet access... " & # $ % '
o. Recruiting stationlocation...........................… " & # $ %
p. Recruiting stationappearance.....................… " & # $ %
q. Access to own Governmentvehicle.............................… " & # $ % '
r. Positive media publicity...... " & # $ %
s. Pro-military community/influencers.....……………… " & # $ %
t. High school access.....….... " & # $ %
u. High school student lists..... " & # $ %
60.60.60.60. If it was your decision, would you expand, keep theIf it was your decision, would you expand, keep theIf it was your decision, would you expand, keep theIf it was your decision, would you expand, keep thesame, reduce, or eliminate the following advertisingsame, reduce, or eliminate the following advertisingsame, reduce, or eliminate the following advertisingsame, reduce, or eliminate the following advertisingelements in supporting your recruiting efforts?elements in supporting your recruiting efforts?elements in supporting your recruiting efforts?elements in supporting your recruiting efforts?
EliminateEliminateEliminateEliminateReduceReduceReduceReduce
Keep the sameKeep the sameKeep the sameKeep the sameExpandExpandExpandExpand
a. Local newspaper ads..............………. " & # $
b. Billboards.................................……… " & # $
c. Television advertising..............……… " & # $
d. Internet recruiting websites.....………. " & # $
e. Radio advertising.....................……… " & # $
f. Magazine advertising..............………. " & # $
g. Locally producedflyers/mailings…………………………. " & # $
h. Flyers/mailings produced bythe Recruiting Service…......………… " & # $
i. Joint (all Services together)advertising........................…....……… " & # $
j. Major local events....................……… " & # $
61.61.61.61. In your experience, how would you rate the followingIn your experience, how would you rate the followingIn your experience, how would you rate the followingIn your experience, how would you rate the followingbenefits/incentives in terms of importance to benefits/incentives in terms of importance to benefits/incentives in terms of importance to benefits/incentives in terms of importance to prospectsprospectsprospectsprospectsyou have dealt with in the past fiscal year?you have dealt with in the past fiscal year?you have dealt with in the past fiscal year?you have dealt with in the past fiscal year?
Not applicableNot applicableNot applicableNot applicableVery unimportantVery unimportantVery unimportantVery unimportantUnimportantUnimportantUnimportantUnimportant
Neither important nor unimportantNeither important nor unimportantNeither important nor unimportantNeither important nor unimportantImportantImportantImportantImportant
Very importantVery importantVery importantVery important
a. Enlistment bonus................ " & # $ %b. Seasonal shipping
bonus………………………. " & # $ % 'c. Montgomery GI Bill
benefits…………………….. " & # $ %d. Service college fund.…..…. " & # $ % 'e. Military pay and
allowances…………………. " & # $ %f. Medical benefits…………… " & # $ %g. Job training and
experience…………………. " & # $ %h. In-Service educational
opportunities (on or offduty)…………………......…. " & # $ % '
i. Subsequent civilianemployment opportunities… " & # $ %
j. Physical/mentalchallenge….….….………… " & # $ %
k. Opportunity to travel.......…. " & # $ %l. Choice of first duty
station………………………. " & # $ % '

B-12
62.62.62.62. DoD is discussing the possibility of using civilianDoD is discussing the possibility of using civilianDoD is discussing the possibility of using civilianDoD is discussing the possibility of using civiliancontractors to assist recruiters. How much do youcontractors to assist recruiters. How much do youcontractors to assist recruiters. How much do youcontractors to assist recruiters. How much do youagree or disagree with the following statements?agree or disagree with the following statements?agree or disagree with the following statements?agree or disagree with the following statements?
Strongly disagreeStrongly disagreeStrongly disagreeStrongly disagreeDisagreeDisagreeDisagreeDisagree
Neither agree nor disagreeNeither agree nor disagreeNeither agree nor disagreeNeither agree nor disagreeAgreeAgreeAgreeAgree
Strongly agreeStrongly agreeStrongly agreeStrongly agree
a. Using a civilian contractor fortelemarketing potential recruitswould be helpful to me..........… " & # $ %
b. Using a civilian contractor fortelemarketing potential recruitswould be convenient for me….. " & # $ %
c. Using a civilian contractor fortelemarketing potential recruitswould help me make mygoal/mission......……………….. " & # $ %
d. Using a civilian contractor asan administrative assistantwould be helpful to me.....……. " & # $ %
e. Using a civilian contractor asan administrative assistantwould be convenient for me….. " & # $ %
f. Using a civilian contractor asan administrative assistantwould help me make mygoal/mission......………………… " & # $ %
63.63.63.63. DoD is evaluating putting recruiting stations in largeDoD is evaluating putting recruiting stations in largeDoD is evaluating putting recruiting stations in largeDoD is evaluating putting recruiting stations in largeenclosed malls. These stations would have attractiveenclosed malls. These stations would have attractiveenclosed malls. These stations would have attractiveenclosed malls. These stations would have attractive"storefronts" to attract visitors and computer terminals"storefronts" to attract visitors and computer terminals"storefronts" to attract visitors and computer terminals"storefronts" to attract visitors and computer terminalswith information about military careers and benefits.with information about military careers and benefits.with information about military careers and benefits.with information about military careers and benefits.They would also have administrative assistants whoThey would also have administrative assistants whoThey would also have administrative assistants whoThey would also have administrative assistants whowould assist all Services. How much do you agree orwould assist all Services. How much do you agree orwould assist all Services. How much do you agree orwould assist all Services. How much do you agree ordisagree with the following statements?disagree with the following statements?disagree with the following statements?disagree with the following statements?
Strongly disagreeStrongly disagreeStrongly disagreeStrongly disagreeDisagreeDisagreeDisagreeDisagree
Neither agree nor disagreeNeither agree nor disagreeNeither agree nor disagreeNeither agree nor disagreeAgreeAgreeAgreeAgree
Strongly agreeStrongly agreeStrongly agreeStrongly agree
a. Locating my station where thereare a lot of potential applicantswho could visit the station wouldhelp me recruit………..………… " & # $ %
b. In the right mall, with a gooddesign, the station would reflectwell on the military andgenerate new leads…………….. " & # $ %
c. A mall location would be ahindrance for meeting withprospects………………………… " & # $ %
d. I would prefer a location in alarge mall to my current stationlocation…………………….…….. " & # $ %
e. If I could choose any locationfor my station, it would not bein a mall………………………….. " & # $ %
f. Teenagers would visit a mallrecruiting station if it looked“high-tech”……………………….. " & # $ %
g. Teenagers today are moreimpressed by appearanceand style…………………………. " & # $ %
h. Proper visibility in a mallwould positively impress keyinfluencers………………………. " & # $ %
i. DoD should modernize itsrecruiting facilities………………. " & # $ %
j. I would prefer working in astation that was easilyaccessible to the public…..……. " & # $ %
k. Sharing an administrativeassistant between recruitersfrom different Services wouldcreate friction in the office..……. " & # $ %

B-13
64.64.64.64. How many hours per week do you spend phone callingHow many hours per week do you spend phone callingHow many hours per week do you spend phone callingHow many hours per week do you spend phone callingpotential recruits that could be hired out to a civilianpotential recruits that could be hired out to a civilianpotential recruits that could be hired out to a civilianpotential recruits that could be hired out to a civiliantelemarketing contractor?telemarketing contractor?telemarketing contractor?telemarketing contractor?
" None & Some but less than 6 hours # 6-10 hours $ 11-20 hours % More than 20 hours
65.65.65.65. How many hours per week do you spend performingHow many hours per week do you spend performingHow many hours per week do you spend performingHow many hours per week do you spend performing
administrative duties that could be hired out to aadministrative duties that could be hired out to aadministrative duties that could be hired out to aadministrative duties that could be hired out to acivilian office administrative assistant?civilian office administrative assistant?civilian office administrative assistant?civilian office administrative assistant?
" None & Some but less than 6 hours # 6-10 hours $ 11-20 hours % More than 20 hours
SupervisionSupervisionSupervisionSupervision 66.66.66.66. To what extent do you agree or disagree with theTo what extent do you agree or disagree with theTo what extent do you agree or disagree with theTo what extent do you agree or disagree with the
following statements?following statements?following statements?following statements?
Strongly disagreeStrongly disagreeStrongly disagreeStrongly disagreeDisagreeDisagreeDisagreeDisagree
Neither agree nor disagreeNeither agree nor disagreeNeither agree nor disagreeNeither agree nor disagreeAgreeAgreeAgreeAgree
Strongly agreeStrongly agreeStrongly agreeStrongly agree
a. My immediate supervisorexpects too much fromme.......…
" & # $ %
b. My immediate supervisorcoaches me if I need it.............… " & # $ %
c. My immediate supervisorcriticizes me even when Iam doing a good job................… " & # $ %
d. My immediate supervisordoes a poor job of maintainingmorale among recruiters..........… " & # $ %
e. My immediate supervisorstands up for me......................… " & # $ %
f. I feel I am supervised moreclosely than necessary................ " & # $ %
g. My immediate supervisorunderstands the salesbusiness.………………………….. " & # $ %
67.67.67.67. If you supervise at least one other production recruiterIf you supervise at least one other production recruiterIf you supervise at least one other production recruiterIf you supervise at least one other production recruiteron a routine basis, to what extent do you agree oron a routine basis, to what extent do you agree oron a routine basis, to what extent do you agree oron a routine basis, to what extent do you agree ordisagree with the following statements?disagree with the following statements?disagree with the following statements?disagree with the following statements?
" Not applicable, I do not supervise at least one otherproduction recruiter on a routine basis GO TO
QUESTION 68
Strongly disagreeStrongly disagreeStrongly disagreeStrongly disagreeDisagreeDisagreeDisagreeDisagree
Neither agree nor disagreeNeither agree nor disagreeNeither agree nor disagreeNeither agree nor disagreeAgreeAgreeAgreeAgree
Strongly agreeStrongly agreeStrongly agreeStrongly agree
a. Recruiters should not botheroverworked supervisors withtheir problems........…...........…. " & # $ %
b. In reaching recruitinggoals/missions, teamworkis as important as eachperson’s own effort.....…............ " & # $ %
c. It is my job to motivaterecruiters to make theirgoals/missions….………………. " & # $ %
d. When I listen to subordinates,I do my job better................…… " & # $ %
e. It is my job to teach recruiterswho have not learnedeverything necessary fromtheir training…………………...... " & # $ %
f. Recruiters need constantpressure in order for them tomake their goals/missions...…... " & # $ %
g. Supervisors who inspirerecruiters make the differencebetween goal/missionachievement and failure..…..…. " & # $ %
h. Once properly trained,recruiters should be allowedto make their own decisions...… " & # $ %
i. Supervisors can do only somuch to encourage recruiterswho fail to make their recruitinggoals/missions..............…......… " & # $ %
j. Punishing recruiters who donot make their goals/missionscan be counterproductive..….… " & # $ %

B-14
SatisfactionSatisfactionSatisfactionSatisfaction
68.68.68.68. In general, how satisfied are you currently with theIn general, how satisfied are you currently with theIn general, how satisfied are you currently with theIn general, how satisfied are you currently with thesupervision/leadership within your recruitingsupervision/leadership within your recruitingsupervision/leadership within your recruitingsupervision/leadership within your recruitingcommand?command?command?command?
Very dissatisfiedVery dissatisfiedVery dissatisfiedVery dissatisfiedDissatisfiedDissatisfiedDissatisfiedDissatisfied
Neither satisfied nor dissatisfiedNeither satisfied nor dissatisfiedNeither satisfied nor dissatisfiedNeither satisfied nor dissatisfiedSatisfiedSatisfiedSatisfiedSatisfied
Very satisfiedVery satisfiedVery satisfiedVery satisfied
a. Immediate supervisor.........….. " & # $ %
b. Recruiting command beyondimmediate supervisor...........… " & # $ %
69.69.69.69. In general, how satisfied were you with militaryIn general, how satisfied were you with militaryIn general, how satisfied were you with militaryIn general, how satisfied were you with militarysupervision/leadership before you became a recruiter?supervision/leadership before you became a recruiter?supervision/leadership before you became a recruiter?supervision/leadership before you became a recruiter?
Very dissatisfiedVery dissatisfiedVery dissatisfiedVery dissatisfiedDissatisfiedDissatisfiedDissatisfiedDissatisfied
Neither satisfied nor dissatisfiedNeither satisfied nor dissatisfiedNeither satisfied nor dissatisfiedNeither satisfied nor dissatisfiedSatisfiedSatisfiedSatisfiedSatisfied
Very satisfiedVery satisfiedVery satisfiedVery satisfied
a. Immediate supervisor..........…. " & # $ %
b. Leadership beyond immediatesupervisor................................ " & # $ %
70.70.70.70. Do you plan to make recruiting a career?Do you plan to make recruiting a career?Do you plan to make recruiting a career?Do you plan to make recruiting a career?
" Yes & No # Undecided
71.71.71.71. In general, how satisfied are you with…?In general, how satisfied are you with…?In general, how satisfied are you with…?In general, how satisfied are you with…?
Very dissatisfiedVery dissatisfiedVery dissatisfiedVery dissatisfiedDissatisfiedDissatisfiedDissatisfiedDissatisfied
Neither satisfied nor dissatisfiedNeither satisfied nor dissatisfiedNeither satisfied nor dissatisfiedNeither satisfied nor dissatisfiedSatisfiedSatisfiedSatisfiedSatisfied
Very satisfiedVery satisfiedVery satisfiedVery satisfied
a. Recruiting.…………….. " & # $ %
b. Military life..…………… " & # $ %
MedicalMedicalMedicalMedical
72.72.72.72. In the past fiscal year, how much did you spend onIn the past fiscal year, how much did you spend onIn the past fiscal year, how much did you spend onIn the past fiscal year, how much did you spend onmedical and dental care for you and your dependentsmedical and dental care for you and your dependentsmedical and dental care for you and your dependentsmedical and dental care for you and your dependentsthat was NOT reimbursed?that was NOT reimbursed?that was NOT reimbursed?that was NOT reimbursed?
Write your yearly expense in the boxes. For example, ifWrite your yearly expense in the boxes. For example, ifWrite your yearly expense in the boxes. For example, ifWrite your yearly expense in the boxes. For example, ifyou spent $100 in the past fiscal year, you would enteryou spent $100 in the past fiscal year, you would enteryou spent $100 in the past fiscal year, you would enteryou spent $100 in the past fiscal year, you would enter"0100" ."0100" ."0100" ."0100" .
$ NON-REIMBURSED MEDICAL AND NON-REIMBURSED MEDICAL AND NON-REIMBURSED MEDICAL AND NON-REIMBURSED MEDICAL AND DENTAL EXPENSES DENTAL EXPENSES DENTAL EXPENSES DENTAL EXPENSES
73.73.73.73. What do you spend (on average) each month in theWhat do you spend (on average) each month in theWhat do you spend (on average) each month in theWhat do you spend (on average) each month in theperformance of your official duties (e.g., driving relatedperformance of your official duties (e.g., driving relatedperformance of your official duties (e.g., driving relatedperformance of your official duties (e.g., driving relatedexpenses, applicant meals, phone, etc.) that is NOTexpenses, applicant meals, phone, etc.) that is NOTexpenses, applicant meals, phone, etc.) that is NOTexpenses, applicant meals, phone, etc.) that is NOTreimbursed to you?reimbursed to you?reimbursed to you?reimbursed to you?
Write your monthly expense in the boxes. For example,Write your monthly expense in the boxes. For example,Write your monthly expense in the boxes. For example,Write your monthly expense in the boxes. For example,if you spend $100 each month, you would enter "0100" .if you spend $100 each month, you would enter "0100" .if you spend $100 each month, you would enter "0100" .if you spend $100 each month, you would enter "0100" .
$ NON-REIMBURSED RECRUITING NON-REIMBURSED RECRUITING NON-REIMBURSED RECRUITING NON-REIMBURSED RECRUITING RELATED EXPENSES RELATED EXPENSES RELATED EXPENSES RELATED EXPENSES
74.74.74.74. How much do you spend monthly on housing costs,How much do you spend monthly on housing costs,How much do you spend monthly on housing costs,How much do you spend monthly on housing costs,including utilities, above your Basic Allowance forincluding utilities, above your Basic Allowance forincluding utilities, above your Basic Allowance forincluding utilities, above your Basic Allowance forHousing (BAH)?Housing (BAH)?Housing (BAH)?Housing (BAH)?
Write your monthly expense in the boxes. For example,Write your monthly expense in the boxes. For example,Write your monthly expense in the boxes. For example,Write your monthly expense in the boxes. For example,if you spend $100 each month, you would enter "0100" .if you spend $100 each month, you would enter "0100" .if you spend $100 each month, you would enter "0100" .if you spend $100 each month, you would enter "0100" .
$ HOUSING EXPENSES BEYOND HOUSING EXPENSES BEYOND HOUSING EXPENSES BEYOND HOUSING EXPENSES BEYOND BAH BAH BAH BAH
75.75.75.75. At your current duty assignment, what type of treatmentAt your current duty assignment, what type of treatmentAt your current duty assignment, what type of treatmentAt your current duty assignment, what type of treatmentfacility do you and members of your family facility do you and members of your family facility do you and members of your family facility do you and members of your family usuallyusuallyusuallyusually go to go to go to go towhen sick or in need of health advice? Please markwhen sick or in need of health advice? Please markwhen sick or in need of health advice? Please markwhen sick or in need of health advice? Please markone answer in each column.one answer in each column.one answer in each column.one answer in each column.
YourselfYourselfYourselfYourselfMembers ofMembers ofMembers ofMembers ofyour familyyour familyyour familyyour family
A military clinic or hospital….. " "
Off-base, DoD contractedclinic (e.g., PRIMUS)………… & &
A civilian clinic or doctor(not contracted by DoD)…….. # #
Some other type oftreatment facility……………… $ $
Not applicable, haven'tneeded medical care at mycurrent duty assignment....…. % %

B-15
76.76.76.76. How long does it How long does it How long does it How long does it usuallyusuallyusuallyusually take you or members of your take you or members of your take you or members of your take you or members of yourfamily to travel to this treatment facility to receivefamily to travel to this treatment facility to receivefamily to travel to this treatment facility to receivefamily to travel to this treatment facility to receivemedical care? Please mark one answer in eachmedical care? Please mark one answer in eachmedical care? Please mark one answer in eachmedical care? Please mark one answer in eachcolumn.column.column.column.
YourselfYourselfYourselfYourselfMembers ofMembers ofMembers ofMembers ofyour familyyour familyyour familyyour family
Less than 15 minutes.………… " "
15 to 30 minutes………………. & &
31 minutes to 60 minutes..…… # #
61 minutes to two hours.……... $ $
More than two hours……….…. % %
Not applicable…………….…… ' '
77.77.77.77. In general, how satisfied are you with the medical careIn general, how satisfied are you with the medical careIn general, how satisfied are you with the medical careIn general, how satisfied are you with the medical careprovided by TRICARE for yourself and/or members ofprovided by TRICARE for yourself and/or members ofprovided by TRICARE for yourself and/or members ofprovided by TRICARE for yourself and/or members ofyour family? Please mark one answer in each column.your family? Please mark one answer in each column.your family? Please mark one answer in each column.your family? Please mark one answer in each column.
YourselfYourselfYourselfYourselfMembers ofMembers ofMembers ofMembers ofyour familyyour familyyour familyyour family
Very satisfied........................... " "
Satisfied………….................… & &
Neither satisfied nordissatisfied………………….….. # #
Dissatisfied..….....................… $ $
Very dissatisfied………............ % %
Not applicable………….……... ' '
78.78.78.78. What is your current TRICARE health plan?What is your current TRICARE health plan?What is your current TRICARE health plan?What is your current TRICARE health plan?
" TRICARE Standard & TRICARE Extra # TRICARE Prime
79.79.79.79. Are you or your family now covered by TRICAREAre you or your family now covered by TRICAREAre you or your family now covered by TRICAREAre you or your family now covered by TRICARESupplemental Insurance?Supplemental Insurance?Supplemental Insurance?Supplemental Insurance?
" Yes & No # Not applicable
80.80.80.80. Are you or your family now covered by PRIVATEAre you or your family now covered by PRIVATEAre you or your family now covered by PRIVATEAre you or your family now covered by PRIVATEmedical insurance or an HMO, such as those operatedmedical insurance or an HMO, such as those operatedmedical insurance or an HMO, such as those operatedmedical insurance or an HMO, such as those operatedby Blue Cross, Prudential, or Kaiser?by Blue Cross, Prudential, or Kaiser?by Blue Cross, Prudential, or Kaiser?by Blue Cross, Prudential, or Kaiser?
" Yes & No # Not applicable
81.81.81.81. Is TRICARE Prime available to you at your currentIs TRICARE Prime available to you at your currentIs TRICARE Prime available to you at your currentIs TRICARE Prime available to you at your currentassignment?assignment?assignment?assignment?
" Yes GO TO QUESTION 83 & No
82.82.82.82. If no, would you use TRICARE Prime if it were availableIf no, would you use TRICARE Prime if it were availableIf no, would you use TRICARE Prime if it were availableIf no, would you use TRICARE Prime if it were availableto you?to you?to you?to you?
" Yes & No
Computer UsageComputer UsageComputer UsageComputer Usage
83.83.83.83. Do you have a personal desktop computer (PC) in yourDo you have a personal desktop computer (PC) in yourDo you have a personal desktop computer (PC) in yourDo you have a personal desktop computer (PC) in youroffice that was issued to you?office that was issued to you?office that was issued to you?office that was issued to you?
" Yes & No
84.84.84.84. Do you have a PC in your office that is shared by youDo you have a PC in your office that is shared by youDo you have a PC in your office that is shared by youDo you have a PC in your office that is shared by youand others?and others?and others?and others?
" Yes & No
85.85.85.85. Do you have access to a laptop computer for recruitingDo you have access to a laptop computer for recruitingDo you have access to a laptop computer for recruitingDo you have access to a laptop computer for recruitingpurposes?purposes?purposes?purposes?
" Yes & No
86.86.86.86. Do you have a computer in your home or residence?Do you have a computer in your home or residence?Do you have a computer in your home or residence?Do you have a computer in your home or residence?
" Yes & No GO TO QUESTION 88
87.87.87.87. Do you use your home computer for work tasks?Do you use your home computer for work tasks?Do you use your home computer for work tasks?Do you use your home computer for work tasks?
" Yes & No

B-16
88.88.88.88. Do you…Do you…Do you…Do you…
Yes,Yes,Yes,Yes, Yes,Yes,Yes,Yes, Yes,Yes,Yes,Yes, NoNoNoNoatatatat
officeofficeofficeofficeonlyonlyonlyonly
atatatathomehomehomehomeonlyonlyonlyonly
both atboth atboth atboth atoffice andoffice andoffice andoffice and
homehomehomehome
a. Have access tothe Internet…… " & # $
b. Use theInternet........….. " & # $
89.89.89.89. How many hours per week do you spend at work or atHow many hours per week do you spend at work or atHow many hours per week do you spend at work or atHow many hours per week do you spend at work or athome on each of the following for your recruitinghome on each of the following for your recruitinghome on each of the following for your recruitinghome on each of the following for your recruitingrelated duties?related duties?related duties?related duties?
4 or more4 or more4 or more4 or more2 to less than 42 to less than 42 to less than 42 to less than 4
1 to less than 21 to less than 21 to less than 21 to less than 2Less than 1Less than 1Less than 1Less than 1NoneNoneNoneNone
a. Word processing......................... " & # $ %
b. Spreadsheets.............................. " & # $ %
c. Database applications................. " & # $ %
d. Chat rooms/electronicbulletin boards.........................… " & # $ %
e. Own recruiting commandweb site....................................… " & # $ %
f. Personal/Local web site...........… " & # $ %
g. Exchanging e-mail withpotential recruits......................… " & # $ %
h. Work related e-mail, otherthan with potential recruits.......… " & # $ %
i. Distance learning......................... " & # $ %
j. Filling out electronic forms........... " & # $ %
k. Other........................................... " & # $ %
Background InformationBackground InformationBackground InformationBackground Information
90.90.90.90. What is your current paygrade?What is your current paygrade?What is your current paygrade?What is your current paygrade?
" E-4 & E-5 # E-6 $ E-7 % E-8 ' E-9 ( Officer
91.91.91.91. What is the highest grade or degree you haveWhat is the highest grade or degree you haveWhat is the highest grade or degree you haveWhat is the highest grade or degree you havecompleted? (MARK ONLY ONE)completed? (MARK ONLY ONE)completed? (MARK ONLY ONE)completed? (MARK ONLY ONE)
" Less than 12 years of school (no diploma) & GED or High School Certificate # High School Diploma $ Some college, but did not graduate % Associate's degree (e.g., AA, AS) ' Bachelor's degree (e.g., BA, AB, BS) ( Master's, doctoral degree or professional school degree
(e.g., MA/MS/PhD/MD/JD/DVM)
92.92.92.92. Are you Spanish/Hispanic/Latino? (MARK "NO" IF NOTAre you Spanish/Hispanic/Latino? (MARK "NO" IF NOTAre you Spanish/Hispanic/Latino? (MARK "NO" IF NOTAre you Spanish/Hispanic/Latino? (MARK "NO" IF NOTSPANISH/HISPANIC/LATINO)SPANISH/HISPANIC/LATINO)SPANISH/HISPANIC/LATINO)SPANISH/HISPANIC/LATINO)
" No, not Spanish/Hispanic/Latino & Yes, Mexican, Mexican American, Chicano # Yes, Puerto Rican $ Yes, Cuban % Yes, Other Spanish/Hispanic/Latino

B-17
93.93.93.93. What is your race? (MARK ONE OR MORE RACES toWhat is your race? (MARK ONE OR MORE RACES toWhat is your race? (MARK ONE OR MORE RACES toWhat is your race? (MARK ONE OR MORE RACES toindicate what you consider yourself to be)indicate what you consider yourself to be)indicate what you consider yourself to be)indicate what you consider yourself to be)
" White & Black or African-American # American Indian or Alaskan Native $ Asian (e.g., Asian Indian, Chinese, Filipino, Japanese,
Korean, Vietnamese) % Native Hawaiian or other Pacific Islander (e.g., Samoan,
Guamanian or Chamorro)
94.94.94.94. Are you:Are you:Are you:Are you:
" Male & Female
95.95.95.95. What is your marital status?What is your marital status?What is your marital status?What is your marital status?
" Now married & Separated # Divorced $ Widowed % Never married GO TO QUESTION 97
96.96.96.96. What was your marital status when you began your firstWhat was your marital status when you began your firstWhat was your marital status when you began your firstWhat was your marital status when you began your firsttour of recruiting duty?tour of recruiting duty?tour of recruiting duty?tour of recruiting duty?
" Married & Separated # Divorced $ Widowed % Never married
97.97.97.97. How old were you on your last birthday?How old were you on your last birthday?How old were you on your last birthday?How old were you on your last birthday?
" Less than 25 years & 25-29 years # 30-34 years $ 35-39 years % 40-44 years ' 45 years or older
98.98.98.98. Would you like to know the results of this survey? If you are interested in being notified when a brief summary of theWould you like to know the results of this survey? If you are interested in being notified when a brief summary of theWould you like to know the results of this survey? If you are interested in being notified when a brief summary of theWould you like to know the results of this survey? If you are interested in being notified when a brief summary of theresults is available on the Web, please print your e-mail address below. This e-mail address will be used for no otherresults is available on the Web, please print your e-mail address below. This e-mail address will be used for no otherresults is available on the Web, please print your e-mail address below. This e-mail address will be used for no otherresults is available on the Web, please print your e-mail address below. This e-mail address will be used for no otherpurpose than this notification. (OPTIONAL)purpose than this notification. (OPTIONAL)purpose than this notification. (OPTIONAL)purpose than this notification. (OPTIONAL)
Please print
99.99.99.99. On what date did you complete this survey?On what date did you complete this survey?On what date did you complete this survey?On what date did you complete this survey?
M M D DYYYY

B-18
COMMENTS SECTION – PLEASE PRINTCOMMENTS SECTION – PLEASE PRINTCOMMENTS SECTION – PLEASE PRINTCOMMENTS SECTION – PLEASE PRINT
100.100.100.100. What do you believe are the most pressing problems facing recruiters today?What do you believe are the most pressing problems facing recruiters today?What do you believe are the most pressing problems facing recruiters today?What do you believe are the most pressing problems facing recruiters today?
101.101.101.101. What can DoD and your Service do to help your recruiting efforts?What can DoD and your Service do to help your recruiting efforts?What can DoD and your Service do to help your recruiting efforts?What can DoD and your Service do to help your recruiting efforts?
102.102.102.102. If you have comments that you were not able to express in answering the survey, please write them in the spaceIf you have comments that you were not able to express in answering the survey, please write them in the spaceIf you have comments that you were not able to express in answering the survey, please write them in the spaceIf you have comments that you were not able to express in answering the survey, please write them in the spaceprovided.provided.provided.provided.
THANK YOU FOR YOUR PARTICIPATION!THANK YOU FOR YOUR PARTICIPATION!THANK YOU FOR YOUR PARTICIPATION!THANK YOU FOR YOUR PARTICIPATION!
Please mail the questionnaire in the envelope provided.Please mail the questionnaire in the envelope provided.Please mail the questionnaire in the envelope provided.Please mail the questionnaire in the envelope provided.
If the envelope is missing, mail your completed survey to:If the envelope is missing, mail your completed survey to:If the envelope is missing, mail your completed survey to:If the envelope is missing, mail your completed survey to:
WESTATWESTATWESTATWESTAT1650 RESEARCH BLVD.1650 RESEARCH BLVD.1650 RESEARCH BLVD.1650 RESEARCH BLVD.
RE 133RE 133RE 133RE 133ROCKVILLE, MD 20850ROCKVILLE, MD 20850ROCKVILLE, MD 20850ROCKVILLE, MD 20850

Appendix C
Topline Findings


C-1
TOPLINE FINDINGS
This appendix contains findings for key military recruiter indicators reported for fivetopical areas: Goal Achievement, Job Demands, Improprieties, Management/SupervisorySupport, and Job Satisfaction. Statistically significant changes (those not attributable tosampling variability) in the indicators from 1998 to 2000 are noted.* Trend data are presented incharts for active duty recruiters for the 1994, 1996, 1998, and 2000 surveys. Total active dutyDoD Services includes only the Army, Navy, Marine Corps, and Air Force. Total activeServices include those four Services as well as the Coast Guard, which is part of the Departmentof Transportation.
This topline report excludes findings for other 2000 survey items. Readers can consultthe Tabulations of Responses from the 2000 Military Recruiter Survey for that information.
Goal Achievement
Recruiters’ principal task is to meet assigned recruiting goals/missions. As noted inChapter 1 of this report, the DoD implemented a number of changes in 2000 to help recruiterswith the highly challenging task of recruiting prospects in a very competitive environment.
The 2000 Military Recruiter Survey included several questions to measure goalachievement. Findings for two of those questions are included in this topline report: Onequestion asked for self-reports on actual goal achievement, and the other addressed recruiters’perceptions of the achievability of their monthly goals/mission. Findings on the percentages ofrecruiters reporting they met their goals 9 or more months of the previous year and whodisagreed that their goals/missions were achievable are reported here.
Actual Goal Achievement
Q33. In how many of the months of the past fiscal year did you achieve your monthlygoal/mission? (percentage who indicated 9 or more months)
Active Duty Recruiters
Reported goal achievement improved in 2000. Forty-one percent of all active DoDrecruiters reported achieving their assigned goals/missions in at least 9 months of the previousfiscal year, a significant increase from the 33 percent reported in 1998 and a reversal of thedecline in achievement that occurred between 1996 and 1998. Although all five Servicesshowed improvement from 1998 levels, the increases were significant only for the Army and AirForce. Reported achievement in 2000 varied greatly across the Active Services, ranging from24 percent for Army recruiters to 57 percent for Air Force and Coast Guard recruiters.
* T-tests with a cutoff of alpha equal to .05 were used to determine statistically significant changes between 1998
and 2000. The frequencies and statistical significance calculations in this Appendix were performed on weighteddata using SUDAAN® Software for the Statistical Analysis of Correlated Data, Research Triangle Park, NC:Research Triangle Institute.

C-2
Figure C.1.Goal Achievement: Percentage Reporting Achievement of Monthly Goals 9+ Months inPast 12 Months
Reserve and Guard Recruiters
More Reserve and Guard recruiters also reported meeting their goals/missions inFY 2000. The percentage of all Reserve Component recruiters who reported achieving theirgoals/missions in at least 9 months of the previous fiscal year rose from 57 percent in 1998 to 62percent in 2000. This statistically significant gain helped to offset the decline in reportedachievement that occurred from 1996 (64 percent achievement) to 1998. The percentage ofrecruiters in each Reserve Component who reported achieving goal in 2000 increased from 1998levels except among Naval Reserve recruiters. Only the 9 percentage point increase (up to 71percent) for Army National Guard recruiters, however, was significant. Reported achievementamong Reserve Components, which was generally higher than among active Components,ranged from a low of 38 percent for Army Reserve recruiters to a high of 79 percent for NavalReserve recruiters in 2000.
�������������������������������������������������
��������������������������������
��������������������������������������������������������������������������������
���������������������������������������������������������������
��������������������������������������������������������������������������������
��������������������������������������������������������������������������������
53 51
6471
504951 50
62 63
29
42
5145 50 53
17
33
49
57* 5755
24*
41*
0
10
20
30
40
50
60
70
80
90
100
DoD Army Navy Marine Corps Air Force Coast Guard
* Statistically significant differences from 1998 estimate at the alpha = .05 level.Note. Question number: 2000 Q33, 1998 Q21, 1996 Q20, 1994 Q19.
1994 1996����
1998 2000

C-3
Achievability of Goals
Q32A. My monthly goals/missions are achievable. (percentage who disagree or stronglydisagree)
Active Duty Recruiters
Active duty DoD recruiters were less pessimistic about goal/mission achievability in2000. Overall, the percentage who disagreed or strongly disagreed that their goals/missions wereachievable declined significantly, from 27 percent in 1998 to 18 percent in 2000, the lowest levelsince 1991. All Services except the Coast Guard had significant declines. The Armyexperienced the largest percentage point decline (13 percentage points, to 24 percent). In each ofthe other Services, the percentage of recruiters who believed their goals were unattainable wasrelatively low: Air Force, 20 percent; Navy, 13 percent; Coast Guard and Marine Corps, 9percent.
Figure C.2.Goal Achievement: Percentage Disagreeing That Monthly Goals Were Achievable
Reserve and Guard Recruiters
Reserve Component recruiters, on average, were also less pessimistic about theachievability of their goals/missions in 2000. The percentage of all Reserve and Guard recruiterswho believed they could not achieve their goals declined significantly, from 29 percent in 1998
������������������������������������������
�������������������������������������������������
����������������������������
��������������������������������
����������������������������������������
������������������������
1622 25
2026
202028
38
222024
27
37
13
26
141718*24*
13*
9
20*
9*
0
10
20
30
40
50
60
70
80
90
100
DoD Army Navy Marine Corps Air Force Coast Guard
* Statistically significant difference from 1998 estimate at the alpha = .05 level.Note. Question number: 2000 Q32a, 1998 Q20a, 1996 Q19a, 1994 Q18a.
1994 1996
��������
1998 2000

C-4
to 21 percent in 2000. The percentage of recruiters in the Army Reserve sharing that perceptiondeclined by 19 percentage points, to 27 percent, and the percentage of like-minded ArmyNational Guard recruiters declined by 6 percentage points, to 19 percent. The changes for otherReserve Components were not significant. In 2000, 26 percent of Air Force Reserve recruiters,18 percent of Air National Guard recruiters, and 13 percent of Naval Reserve recruiters werepessimistic about achieving their goals/missions.
Job DemandsFrom the outset, the Recruiter Survey has tried to measure various aspects of job
pressures confronting recruiters in their challenging task of meeting goals/missions. Two of thesurvey items addressing job demands are included in the topline key indicators. They askrecruiters how many hours they work per week and if they have voluntarily not taken leavebecause of job pressures. Responses for those who report working more than 60 hours a weekand those who voluntarily forgo leave because of job demands are tracked in the topline findings.
Hours Worked
Q10. On average, what is the total number of hours per week you spend performing recruitingrelated duties? (percentage working more than 60 hours)
Active Duty Recruiters
Recruiting clearly remained a difficult duty assignment in 2000 despite the allocation ofadditional resources to the recruiting effort. The percentage of total active DoD recruiters whoreported working more than 60 hours a week (65 percent) did not change significantly from the66 percent reported in 1998. But gains in achievement in 2000 had costs for some Services. Thepercentage of recruiters in the Army and the Coast Guard who reported working more than60 hours a week rose by 5 and 6 percentage points, respectively, a significant increase for bothServices. The Air Force was the only active Service in which the percentage reporting more than60 hours declined significantly (by 5 percentage points), which helped to offset a 9 percentagepoint increase between 1996 and 1998. No change in percentage occurred among Navyrecruiters, and the slight increase among Marine Corps recruiters was not significant. TheServices varied greatly in the percentage of recruiters reporting long workweeks in 2000: 12percent for the Coast Guard, 37 percent for the Air Force, 56 percent for the Navy, 73 percent forthe Army, and 87 percent for the Marine Corps (see Figure C.3).
Reserve and Guard Recruiters
More Reserve and Guard recruiters worked long hours in 2000 than in 1998. In contrastto the overall stability in reported length of duty workweek between 1996 and 1998, thepercentage of recruiters in the Reserve Component who reported very long workweeks rosesignificantly, from 34 percent in 1998 to 40 percent in 2000. Significant increases were reportedby Army Reserve (up by 8 percentage points, to 68 percent), Army National Guard (up by 8percentage points, to 35 percent), and Air Force Reserve (up by 10 percentage points, to 25percent) recruiters. In contrast, the percentage of Naval Reserve recruiters working long hours

C-5
declined by 10 percentage points, to 22 percent. The Air National Guard continued to have onlya small percentage of recruiters working long hours (13 percent).
Figure C.3.Job Demands: Percentage Working More Than 60 Hours per Week on RecruitingRelated Duties
Effect of Job Demands on Leave
Q13. During the past year, have you voluntarily not taken leave due to the demands ofyour job? (percentage saying yes)
Active Duty Recruiters
Fewer active duty recruiters are voluntarily not taking leave because of the demands oftheir job. Between 1998 and 2000, the percentage of recruiters forgoing leave declinedsignificantly for total active DoD recruiters (from 69 percent to 66 percent) and for Coast Guardrecruiters (from 62 percent to 54 percent). The four DoD active Services also had slightdeclines, but the changes were not significant. Despite the good news, the fact remains thatnotable numbers of recruiters did voluntarily forgo leave in 2000 because of job demands:
��������������������������������������������������������������������������������������������������������
��������������������������������������������������������������������������������������������������������
�����������������������������������������������������������������������������
���������������������������������������������������������������������������������������������������������
��������������������������������������������������������
����������������
5656 58
49
8
32
79
6367
3
33
76
66 68
6
42
80
56
65
73*
56
12*
37*
83
0
10
20
30
40
50
60
70
80
90
100
DoD Army Navy Marine Corps Air Force Coast Guard
* Statistically significant difference from 1998 estimate at the alpha = .05 level. Note. Question number: 2000 Q10, 1998 Q9, 1996 Q09, 1994 Q9.
1994 1996
������
1998 2000

C-6
73 percent of Marine Corps recruiters, 67 percent of Navy recruiters, 66 percent of Air Forcerecruiters, 62 percent of Army recruiters, and 54 percent of Coast Guard recruiters.
Figure C.4.Job Demands: Percentage Reporting Voluntarily Not Taking Leave Due to Job Demands
Reserve and Guard Recruiters
The good news does not apply to Reserve Component recruiters. There was nosignificant change from 1998 to 2000 in the percentage of total Reserve and Guard recruiterswho reported that job demands caused them to voluntarily forego leave. In 2000, 77 percent oftotal Reserve Components reported voluntarily not taking leave. But overworked recruiters intwo Components—the Army National Guard and the Air Force Reserve—increased significantlybetween 1998 and 2000 to new highs of 83 percent and 79 percent, respectively. Percentages ofrecruiters forgoing leave were also high in the Army Reserve (68 percent), the Naval Reserve(72 percent), and the Air National Guard (72 percent).
������������������������������������������������������������������������������������������������������������
������������������������������������������������������������������������������������������������������������
������������������������������������������������������������������������������������������������������������
������������������������������������������������������������������������������������������������������������������������������
������������������������������������������������������������������������������������������������������������
����������������������������������������������������������������������������������������������������
7168 66
6962
737269
6562
6875
66*
62
54*
66
7367
0
10
20
30
40
50
60
70
80
90
100
DoD Army Navy Marine Corps Air Force Coast Guard
* Statistically significant difference from 1998 estimate at the alpha = .05 level.Notes. Question number: 2000 Q13, 1998 Q11, 1996 Q10. 1994 results not represented because of differences in question wording.
1996 1998
������ 2000

C-7
Improprieties
Congress and the Services remain concerned that recruiter improprieties are associatedwith trying to meet goals/missions in a highly competitive and stressful environment. Thetopline tracks responses to a key-indicator item that addresses recruiters’ perceptions about howfrequently improprieties occur in their recruiting command.
Frequency of Occurrence
Q44. How frequently do you think recruiter improprieties (i.e., bending rules to makegoal/mission) occur in your recruiting command? (percentage indicating frequently)
Active Duty Recruiters
Perceptions that recruiting improprieties occur frequently declined significantly for totalactive duty DoD Services—from 28 percent in 1998 to 22 percent in 2000. Most of the declinestemmed from significant declines in perceptions reported by Army (11 percentage point drop, to21 percent) and Marine Corps (6 percentage point drop, to 18 percent) recruiters. Changes for allthe other active Services were not significant. The Coast Guard continued to have a lowpercentage of recruiters reporting frequently occurring improprieties (5 percent).
Figure C.5.Improprieties: Percentage Reporting That Recruiter Improprieties Occur Frequently inTheir Recruiting Command
������������������������������������������
�������������������������������������������������
������������������������������������������
������������������������������������������������
������������������������������������������������
����������������
26
19 1823
4
1914
2427
7
2018
2832
3
24242622*
21* 24
5
2018*
0
10
20
30
40
50
60
70
80
90
100
DoD Army Navy Marine Corps Air Force Coast Guard
* Statistically significant difference from 1998 estimate at the alpha = .05 level.Note. Question number: 2000 Q44, 1998 Q27, 1996 Q28, 1994 Q27.
1994 1996���
1998 2000

C-8
Reserve and Guard Recruiters
All Reserve and Guard Component recruiters except the Air Force Reserve also hadlower percentages of recruiters perceiving that improprieties in their recruiting command occurfrequently. The changes were significant, however, only for total Reserve Component recruiters(dropped from 24 percent in 1998 to 20 percent in 2000) and for Army Reserve recruiters (from31 percent to 23 percent). Percentages for other Reserve Components in 2000 ranged from a lowof 3 percent for the Air National Guard to a high of 23 percent for the Army National Guard.
Management/Supervisory Support
Recruiters rely on supervisors for information, training, and other support that helps themto succeed in their jobs. The topline findings include responses regarding recruiters whodisagree that their supervisors provide good support and recruiters who disagree that they workwith their superiors as a team.
Support From Supervisors
Q41C. I receive good support from my supervisors. (percentage who disagree or stronglydisagree)
Active Duty Recruiters
Among all active duty DoD recruiters, no significant changes occurred between 1998 and2000: Nearly a quarter remained dissatisfied with their supervisors’ support (23 percent).However, significant declines in negative reports about supervisor support occurred in the Navy(down by 5 percentage points, to 20 percent) and in the Air Force (down by 4 percentage points,to 14 percent), as well as in the Coast Guard (down by 8 percentage points, to 16 percent). Thepercentage of Army recruiters who disagreed that their supervisors’ support was good remainedat 30 percent in 2000; 15 percent of Marine Corps recruiters expressed the same negative opinion(see Figure C.6).
Reserve and Guard Recruiters
Between 1998 and 2000 the percentage of total Reserve and Guard recruiters whodisagreed that they had good support from their supervisors did not change significantly (28percent in 2000). The only significant change was a 6 percentage point increase (to 32 percent)in the percentage of Army National Guard recruiters who felt that they were not receivingenough help from their supervisors. The 2000 percentages for other individual ReserveComponents varied as follows: Army Reserve, 28 percent; Naval Reserve, 22 percent; AirNational Guard, 19 percent; and Air Force Reserve, 12 percent.

C-9
Figure C.6.Supervisory Support: Percentage Who “Disagree” or “Strongly Disagree” That TheyReceive Good Support From Their Supervisors
Teamwork
Q41D. My superiors and I work together as a team. (percentage who disagree or stronglydisagree)
Active Duty Recruiters
Recruiters reported better teamwork with their superiors in 2000. The percentage of totalactive duty DoD recruiters disagreeing with the statement “My superiors and I work together as ateam” declined significantly, from 28 percent in 1998 to 24 percent in 2000. Significant declinesoccurred for all Services except the Marine Corps. The Air Force declined 10 percentage points,to 18 percent; the Coast Guard 9 percentage points, to 16 percent (thereby offsetting a largeincrease between 1996 and 1998); the Navy 5 percentage points, to 21 percent; and the Army 4percentage points, to 30 percent. Sixteen percent of Marine Corp recruiters reported they did notwork as a team with their superiors.
�����������������������������������
������������������������������������������
������������������������������������������
����������������������������
����������������������������
�����������������������������������
2826 27
30
11
2017
2831
15
232224
3024
18162523
30
20*
16*14*15
0
10
20
30
40
50
60
70
80
90
100
DoD Army Navy Marine Corps Air Force Coast Guard
* Statistically significant difference from 1998 estimate at the alpha = .05 level.Note. Question number: 2000 Q41c, 1998 Q25c, 1996 Q24c, 1994 Q23c.
1994 1996���
1998 2000

C-10
Figure C.7.Supervisory Support: Percentage Who “Disagree” or “Strongly Disagree” That TheyWork as a Team With Their Superiors
Reserve and Guard Recruiters
There were no significant changes in reports about teamwork between 1998 and 2000 forReserve and Guard recruiters overall or for any individual Reserve Components. Twenty-ninepercent of all Reserve and Guard recruiters reported they did not work as a team with theirsuperiors, compared with 24 percent for all active Services. The percentage of recruitersreporting a lack of teamwork varied across Reserve Components: Army National Guard,33 percent; Army Reserve recruiters, 31 percent; Naval Reserve, 20 percent; Air National Guard,18 percent; Air Force Reserve, 17 percent.
������������������������������������������
�������������������������������������������������
����������������������������������������
��������������������������������
������������������������������������������������
����������������������������������������
3129 30 31
11
3023
31 33
14
3326
2834
252818
2624*30*
21*
16*18*
16
0
10
20
30
40
50
60
70
80
90
100
DoD Army Navy Marine Corps Air Force Coast Guard
* Statistically significant difference from 1998 estimate at the alpha = .05 level.Note. Question number: 2000 Q41d, 1998 Q25d, 1996 Q24d, 1994 Q23d.
1994 1996���
1998 2000

C-11
Job Satisfaction
Two survey items included in the topline findings measure recruiters’ satisfaction withrecruiting. The first simply asks how satisfied they are, and the second asks whether they wouldopt for another assignment if given the choice. Percentages who are dissatisfied with recruitingand percentages who would remain in recruiting by choice are reported in the topline findings.
Dissatisfaction With Recruiting
Q71A. In general, how satisfied are you with recruiting? (percentage dissatisfied or verydissatisfied)
Active Duty Recruiters
Dissatisfaction with recruiting remained mostly unchanged since 1998. In 2000,44 percent of all active duty DoD recruiters reported they were dissatisfied or very dissatisfiedwith their assignments. The Air Force was the only Service to have a significant decline inreports of dissatisfaction: a 12 percentage point drop, from 37 percent to 25 percent. Again,reports varied by Service: Coast Guard, 11 percent; Marine Corps, 39 percent; Navy, 46 percent;Army, 48 percent. Although some of these percentages are relatively high, they represent adecline from the all-time high percentages reported by the active DoD Services in 1996.
Reserve and Guard Recruiters
The 2000 results for overall Reserve Components mirror those for total active Services:no significant change in dissatisfaction with recruiting. The Reserve Components, however,continue to have a relatively low level of dissatisfaction (24 percent). The only significantchange that occurred from 1998 to 2000 was an 8 percentage point increase in dissatisfactionamong Air Force Reserve recruiters. That increase overturned the gains the Air Force Reservemade between 1996 and 1998. The percentage of recruiters expressing dissatisfaction withrecruiting varied across the Reserve Components: Army Reserve, 39 percent; Naval Reserve, 22percent; Army National Guard, 20 percent, Air Force Reserve, 17 percent, and Air NationalGuard, 8 percent.

C-12
Figure C.8.Satisfaction With Recruiting: Percentage “Dissatisfied” or “Very Dissatisfied” WithRecruiting
Recruiting Versus Other Assignments
Q46. If you had the freedom to select an assignment next month, which of the following wouldyou choose? (percentage who would remain in recruiting)
Active Duty Recruiters
Given the choice to opt out of their current recruiting duty, most active duty DoDrecruiters would do so. Only 27 percent of them would remain in recruiting if they had thechoice to select another assignment in the next month. There was no significant change in theoverall percentage from 1998 to 2000, but the percentage of Air Force recruiters who wouldchoose recruiting duty increased significantly, from 42 percent in 1998 to 48 percent in 2000.On the downside, the percentage of Navy recruiters who said they would remain in recruitingdecreased significantly, from 30 percent in 1998 to 25 percent in 2000. The Coast Guard onceagain had a relatively high percentage of recruiters who would continue in their currentassignment (68 percent). Percentages for the other active Services did not change significantly:
���������������������������������������������������������������
�����������������������������������������������������������������������������
���������������������������������������������������������������
����������������������������������������������������������������
����������������������������������������������������������������
��������������������������������
5146 48 45
7
4349
5458
13
4750
4552
15
37394244
48 46
11
25*
39
0
10
20
30
40
50
60
70
80
90
100
DoD Army Navy Marine Corps Air Force Coast Guard
* Statistically significant difference from 1998 estimate at the alpha = .05 level.Note. Question number: 2000 Q71a, 1998 Q43a, 1996 Q49a, 1994 Q48a.
1994 1996����
1998 2000

C-13
25 percent of Marine Corps recruiters and 24 percent of Army recruiters would select recruitingduty (see Figure C.9).
Reserve and Guard Recruiters
The only significant change for total or individual Reserve Components between 1998and 2000 was a 10 percentage point increase in the percentage of Army Reserve recruiterschoosing to remain in recruiting. That gain helped to close the relatively large gap betweenArmy Reserve recruiters and recruiters in other Components: Army Reserve, 32 percent; NavalReserve, 53 percent; Army National Guard, 56 percent; Air National Guard, 67 percent; AirForce Reserve, 73 percent.
Figure C.9.Satisfaction With Recruiting: Percentage Who Would Choose to Remain in Recruiting
������������������������������������������
�����������������������������������
������������������������������������������������
����������������������������������������
������������������������������������������������������������������������
����������������������������������������������������������������������������������������������������������������
3027 26
29
64
39
222320
69
31
18
27 25
71
42
2430
2724 25*
68
48*
25
0
10
20
30
40
50
60
70
80
90
100
DoD Army Navy Marine Corps Air Force Coast Guard
* Statistically significant difference from 1998 estimate at the alpha = .05 level.Note. Question number: 2000 Q46, 1998 Q29, 1996 Q31, 1994 Q30.
1994 1996����
1998 2000

C-14

Appendix D
Reserve Component Model Results


D-1
RESERVE COMPONENT MODEL RESULTS
The structural model presented in this report was developed using survey data fromactive duty production recruiters only. Active and Reserve recruiter survey responses were notcombined for the analysis because we believed they did not share common structuralrelationships among the constructs in the model. Specifically, we felt that the Active andReserve Component recruiting environments were so dissimilar that constructs relevant formodeling active recruiters would not work for Reserve recruiters.
Even a broad characterization of active and Reserve recruiting duty reveals fundamentaldifferences. Considering who is recruited, active duty recruiters concentrate on youth in highschool or shortly beyond while most Reserve recruits have prior military experience and areolder. The recruiting processes are very different as well. Oversimplified, it can becharacterized as the difference between cold calling and receiving referrals. Where active dutyrecruiters must canvas potential recruits, Reserve Component recruiters receive significantnumbers of recruits as a consequence of exit interviews conducted at the time members areleaving active duty. Because of such differences, data from active and Reserve Componentrecruiters were not combined for modeling.
In this appendix we present results from an examination we conducted to test ourassumption that Military Recruiter Survey (MRS) data on Reserve Component recruiters shouldbe excluded from our analysis. We applied the statistical model developed for active recruitersto Reserve and Guard recruiter MRS data and assessed how well the model fit ReserveComponent data. Specifically, we used the same computer code that was used to estimate theactive recruiter model, but we used Reserve Component survey data only.
Our evaluation focused exclusively on the statistical significance of paths specified by themodel. Table D.1 presents estimated unstandardized coefficients and their associated t statistics.The threshold value of t for a statistically significant coefficient is 1.96 (with p = .05). Of the 15coefficients estimated, only 5 were statistically significant. Of these, 4 were constructsinfluencing satisfaction with recruiting. The other significant path was that from recognition tostrain. This path was consistent with our original assumption, at least with respect to therelationship between recognition and strain. Strain was reduced if recruiters were recognized fordoing a good job and if promotion opportunities were considered better than average.
Satisfaction with recruiting for both Reserve and Active Component recruiters wasinfluenced by the same factors. Although the specific values of the coefficients for the twomodels differ, their relative magnitudes and directions were the same. The most influentialconstruct was family concerns, followed by the influence of strain on satisfaction with recruiting.As in the active model, the coefficients for both importance of recruiting and supervisor supportwere less than half the magnitude of the effect of strain on satisfaction with recruiting.
The only portion of the model adequately fitting both active and Reserve recruiters wasthat portion focusing on satisfaction with recruiting. Neither performance nor strain, with oneexception, was influenced by factors such as ease of meeting goals, hours worked, and others

D-2
that proved influential in modeling active duty recruiter survey responses. It appears that thedecision not to combine active and Reserve data was prudent.
Table D.1.Reserve Component Recruiter Model: Structural Equation Modeling Results
Unstandardized Coefficients With t Statistics
Influencing ConstructPerceived
StrainSatisfaction
w/RecruitingSelf-ReportedPerformance
Ease of Meeting 0.199 0.112Goals (0.976) (0.337)
Control Over Duty 3.680 6.578Assignment (1.484) (1.571)
Hours Worked 0.831 2.133(0.898) (1.590)
Perceived Goal 0.327Pressure (1.941)
Office Appearance -0.029 0.177(-0.960) (0.587)
Recognition -0.378(-3.477)
Importance of 0.241Recruiting (2.562)
Supervisor Support -0.175(-2.699)
Family Concerns 0.919 (6.308)
Perceived Strain -0.449 -0.008(-9.058) (-0.038)
Notes. Boldfaced, italicized coefficients are statistically significant at alpha = .05.T statistics are presented within parentheses.

Appendix E
Correlation Matrix


Table E.1.
Variable 1 2 3 4 5 6 7 8 9 10 11 12 13 14 15 16 17 18 19 20 21 22 23 24 25 26 27 28 29 30 31 32 33 34 35 36 37 38 39
1. Q6 1.00
2. Q9 -0.32 1.00
3. Q10 -0.20 0.16 1.00
4. Q12 -0.17 0.13 0.30 1.00
5. Q14 0.05 -0.06 -0.16 -0.10 1.00
6. Q22a 0.00 0.06 0.04 0.03 -0.05 1.00
7. Q22b -0.04 0.07 0.08 0.03 -0.07 0.81 1.00
8. Q22c -0.06 0.09 0.08 0.07 -0.09 0.56 0.58 1.00
9. Q26b -0.27 0.20 0.20 0.20 -0.14 0.13 0.14 0.20 1.00
10. Q32a -0.11 0.14 0.13 0.08 -0.10 0.19 0.20 0.22 0.22 1.00
11. Q32b -0.14 0.16 0.18 0.14 -0.12 0.17 0.19 0.23 0.26 0.65 1.00
12. Q32c 0.08 -0.06 -0.24 -0.12 0.13 -0.05 -0.07 -0.08 -0.14 -0.10 -0.08 1.00
13. Q32d 0.11 -0.07 -0.22 -0.15 0.15 -0.11 -0.12 -0.14 -0.28 -0.11 -0.12 0.35 1.00
14. Q32e 0.14 -0.15 -0.28 -0.17 0.20 -0.10 -0.13 -0.15 -0.26 -0.20 -0.21 0.39 0.47 1.00
15. Q33 0.20 -0.15 -0.03 -0.04 0.03 -0.06 -0.08 -0.11 -0.12 -0.28 -0.26 0.01 -0.05 0.07 1.00
16. Q34 0.23 -0.17 -0.07 -0.10 0.04 -0.04 -0.05 -0.09 -0.15 -0.21 -0.22 0.01 -0.05 0.10 0.66 1.00
17. Q35 0.14 -0.17 -0.15 -0.14 0.11 -0.13 -0.14 -0.20 -0.20 -0.47 -0.52 0.10 0.10 0.21 0.37 0.34 1.00
18. Q36 -0.19 0.09 -0.01 0.11 -0.02 0.05 0.06 0.12 0.14 0.14 0.15 -0.01 0.00 -0.06 -0.37 -0.43 -0.21 1.00
19. Q40g -0.14 0.17 0.14 0.14 -0.16 0.16 0.16 0.22 0.34 0.20 0.23 -0.05 -0.23 -0.24 -0.07 -0.07 -0.20 0.04 1.00
20. Q40i -0.03 0.08 0.19 0.06 -0.08 0.09 0.11 0.11 0.21 0.15 0.15 -0.14 -0.18 -0.19 0.00 0.01 -0.12 -0.11 0.22 1.00
21. Q42b -0.11 0.14 0.07 0.12 -0.14 0.19 0.18 0.23 0.26 0.25 0.26 0.00 -0.15 -0.19 -0.09 -0.07 -0.22 0.05 0.38 0.16 1.00
22. Q42c -0.14 0.13 0.01 0.11 -0.04 0.14 0.15 0.19 0.22 0.21 0.22 0.02 -0.10 -0.13 -0.10 -0.09 -0.20 0.20 0.21 0.04 0.29 1.00
23. Q42d -0.17 0.10 0.01 0.06 -0.05 0.12 0.14 0.12 0.16 0.19 0.16 0.03 -0.06 -0.10 -0.11 -0.12 -0.11 0.20 0.14 0.01 0.21 0.40 1.00
24. Q42e -0.03 0.04 -0.10 -0.06 0.00 0.08 0.07 0.04 0.00 0.05 0.02 0.12 0.06 0.03 -0.04 -0.05 0.00 0.10 0.05 -0.09 0.10 0.21 0.44 1.00
25. Q42g 0.04 0.03 -0.11 -0.03 -0.02 0.10 0.08 0.13 0.10 0.14 0.13 0.06 -0.06 -0.05 -0.02 -0.01 -0.13 0.07 0.16 0.06 0.22 0.23 0.13 0.10 1.00
26. Q42h -0.31 0.18 0.20 0.20 -0.15 0.16 0.17 0.25 0.43 0.30 0.30 -0.17 -0.29 -0.33 -0.19 -0.22 -0.31 0.26 0.34 0.17 0.32 0.33 0.29 0.05 0.26 1.00
27. Q46 -0.14 0.11 0.10 0.12 -0.09 0.12 0.12 0.15 0.25 0.17 0.16 -0.09 -0.19 -0.18 -0.09 -0.11 -0.17 0.13 0.19 0.11 0.17 0.14 0.17 0.01 0.07 0.38 1.00
28. Q50e -0.02 0.03 0.06 0.02 -0.02 0.03 0.04 0.05 0.07 0.07 0.08 -0.02 0.00 -0.02 -0.05 -0.04 -0.07 -0.01 0.05 0.02 0.06 0.05 0.04 0.02 0.00 0.07 0.03 1.00
29. Q50f -0.02 0.05 0.03 -0.01 0.00 0.01 0.02 0.04 0.03 0.05 0.04 0.00 0.01 -0.01 -0.05 -0.02 -0.05 -0.01 0.03 0.01 0.05 0.03 0.03 0.04 0.04 0.05 0.02 0.58 1.00
30. Q56 -0.26 0.21 0.27 0.17 -0.14 0.17 0.17 0.22 0.41 0.25 0.25 -0.19 -0.29 -0.30 -0.15 -0.16 -0.27 0.21 0.27 0.19 0.25 0.25 0.20 0.01 0.10 0.51 0.33 0.06 0.03 1.00
31. Q57 -0.05 0.10 0.03 0.08 -0.12 0.09 0.07 0.12 0.23 0.14 0.14 -0.03 -0.18 -0.13 -0.01 -0.01 -0.15 0.04 0.28 0.15 0.25 0.15 0.07 0.05 0.13 0.19 0.14 0.01 0.01 0.19 1.00
32. Q71a -0.35 0.23 0.22 0.24 -0.16 0.19 0.21 0.26 0.46 0.33 0.33 -0.17 -0.30 -0.35 -0.22 -0.25 -0.34 0.33 0.34 0.16 0.31 0.34 0.32 0.06 0.18 0.67 0.42 0.05 0.04 0.58 0.19 1.00
33. Q42I42J* 0.24 -0.15 -0.32 -0.22 0.17 -0.14 -0.17 -0.21 -0.35 -0.27 -0.27 0.28 0.37 0.39 0.16 0.16 0.28 -0.16 -0.25 -0.21 -0.21 -0.18 -0.15 0.08 -0.03 -0.47 -0.32 -0.02 0.00 -0.50 -0.14 -0.54 1.00
34. Q42K42L* 0.28 -0.17 -0.29 -0.23 0.15 -0.14 -0.17 -0.19 -0.33 -0.25 -0.27 0.22 0.31 0.34 0.17 0.17 0.26 -0.21 -0.24 -0.15 -0.20 -0.21 -0.22 0.02 -0.02 -0.46 -0.32 -0.03 -0.01 -0.46 -0.11 -0.57 0.74 1.00
35. Q42M42N* 0.24 -0.16 -0.24 -0.20 0.16 -0.19 -0.21 -0.24 -0.35 -0.31 -0.32 0.23 0.32 0.38 0.21 0.19 0.32 -0.23 -0.29 -0.17 -0.27 -0.27 -0.26 -0.02 -0.10 -0.52 -0.35 -0.05 -0.02 -0.50 -0.15 -0.63 0.68 0.75 1.00
36. Q29B66A* 0.01 0.04 -0.12 -0.01 0.04 0.09 0.07 0.11 0.10 0.00 0.02 0.13 0.06 0.10 -0.03 -0.06 0.01 0.05 0.14 -0.02 0.12 0.07 0.02 0.10 0.11 0.03 -0.03 -0.01 0.02 -0.02 0.13 0.03 0.08 0.09 0.05 1.00
37. Q41C41D* -0.14 0.17 0.14 0.15 -0.19 0.24 0.25 0.32 0.31 0.30 0.30 -0.10 -0.26 -0.34 -0.17 -0.18 -0.27 0.16 0.45 0.15 0.45 0.26 0.22 0.11 0.16 0.38 0.22 0.07 0.04 0.34 0.24 0.44 -0.32 -0.31 -0.42 0.17 1.00
38. Q42A32I* -0.13 0.15 0.14 0.12 -0.18 0.23 0.24 0.33 0.31 0.29 0.30 -0.09 -0.27 -0.31 -0.14 -0.14 -0.26 0.12 0.44 0.16 0.45 0.22 0.18 0.08 0.17 0.36 0.21 0.06 0.05 0.30 0.25 0.38 -0.30 -0.28 -0.38 0.20 0.76 1.00
39. Q41B66F* -0.03 0.04 -0.03 0.04 -0.04 0.06 0.05 0.05 0.09 0.11 0.09 0.06 0.02 0.01 -0.06 -0.08 -0.07 0.04 0.11 0.00 0.12 0.07 0.04 0.06 0.05 0.06 0.00 -0.01 -0.01 0.04 0.01 0.06 0.01 0.01 0.00 0.16 0.18 0.09 1.00
MEAN 2.677 1.310 3.822 2.375 1.845 2.060 2.039 2.712 3.639 2.466 2.708 2.191 2.004 2.483 3.140 2.114 2.709 2.106 3.147 3.869 2.391 2.198 1.646 1.285 3.124 3.590 2.061 3.722 3.847 3.306 2.388 3.109 2.090 2.783 2.924 2.903 2.557 2.706 2.734
STD 1.370 0.462 1.239 1.040 0.362 1.112 1.020 1.209 1.207 0.957 1.091 1.119 0.998 1.105 1.195 1.025 1.070 0.855 1.202 1.146 0.998 0.883 0.694 0.515 1.255 1.260 0.937 3.776 4.544 1.347 0.619 1.275 1.022 1.046 1.104 0.655 1.095 0.988 0.620
N 3621 3622 3632 3621 3627 3579 3575 3507 3196 3526 3563 3563 3512 3519 3293 3451 3610 3587 3583 3583 3618 3600 3610 3613 3583 3608 3571 3128 3118 3433 3364 3624 3602 3600 3576 3506 3577 3486 3551* Parcels used as indicators
Descriptive Statistics and Zero-Order Correlations for Indicator Variables (Active Duty Recruiters)


Appendix F
Measurement Model


F-1
Table F.1.Standardized Estimates for Active Duty Recruiter Measurement Model by Factor
QuestionItem Performance
SatisfactionW/Recruiting
PerceivedStrain
OfficeAppearance
Ease ofMeeting Goals
HoursWorked
Control OverDuty Assignment Recognition
Perceived GoalPressure
SupervisorSupport
Importanceof Recruiting
FamilyConcerns
Q33 0.94Q34 0.84Q36 -0.44Q71a 1.10Q42h 0.97Q56 0.91Q46 0.45Q40I 0.27Q42M42N* 0.94Q42K42L* 0.91Q42I42J* 0.85Q22a 0.99Q22b 0.93Q22c 0.77Q32b 0.89Q32a 0.74Q35 -0.70Q10 0.77Q12 0.46Q14 -0.11Q6 0.94Q9 0.22Q42b 0.64Q42g 0.42Q32e 0.80Q32d 0.66Q32c 0.57Q1C41D* 0.98Q42A32I* 0.84Q41B66F* 0.10Q42d 0.53Q42c 0.50Q42e 0.25Q40g 0.74Q26b 0.71Q57 0.23
*Parcels used as indicators.


Appendix G
Analytic Method


G-1
ANALYTIC METHOD
In this appendix we describe the analytic method we used to estimate and evaluate themodel of active duty recruiter satisfaction and performance displayed in Figure 3.1. The firstsection includes an overview of the statistical technique used in the modeling process, includingbackground, steps involved in model specification, model estimation, and model evaluation. Inthe second section we discuss the analysis strategy that yielded the findings presented in Chapter 3.
The statistical method adopted for our modeling of recruiter satisfaction and performanceis generally referred to as structural equation modeling (SEM) with latent variables. SEM isused to systematically identify the possible relationships among a set of unobserved constructs(referred to in SEM as latent variables) and their indicators (observed variables). Eachstructural equation model describes a different “structure” of relationships. Researchers check tosee how well their data fit the structural model.
SEM can be characterized as a sophisticated amalgam of systems regression and factoranalysis techniques. The procedures for measuring latent variables are similar to those used infactor analysis. Also, the statistical relationships among latent variables in the structural modelare similar to the statistical relationships among variables in systems regression analysis. SEM,however, differs from the regression and factor analysis analogy in two important respects. First,both the structural and measurement models are estimated simultaneously. Second, the errorstructures (i.e., correlated or not) for both the measurement and structural models must bespecified prior to estimation.
The SEM technique thus requires a comprehensive interaction between theoreticalexpectation and statistical specification, estimation, and evaluation. Model specification mustaddress the hypothesized relationships among major latent variables, measurement of the latentvariables, and the expected error/covariance structure among both observed and unobservedmeasures. Because of these features, structural equation models are much more flexible andmore practically demanding than traditional regression or factor analyses. They are also a morepowerful alternative to multiple regression, path analysis, and factor analysis.
Several statistical software packages support SEM analyses. The prominent programsinclude the SAS, LISREL®, EQS, and AMOS. In this study we used SAS system’s PROCCALIS (Covariance Analysis of Linear Structural Equations) procedure in conjunction with themaximum likelihood method of parameter estimation.
In the following section, we use a hypothetical model to describe the components of theSEM technique more fully. We then use that description as a platform for considering the modelof military recruiter satisfaction and performance.
Overview of Statistical Method
Structural equation models require the specification (parameterization) of three categoriesof matrices: measurement matrices, structural matrices, and error/covariance matrices.Figure G.1 displays a hypothetical structural equation model in the form of a path diagram.

G-2
Latent variables are represented by oval shapes, observed measures by rectangles, and errorterms by ε’s, δ’s, and ζ’s. The structural coefficients and measurement coefficients areassociated with path arrows. Next, we describe the components (measurement, structure, error)of this hypothetical model.
Figure G.1.Hypothetical Structural Equation Model
Model Components
Measurement Model
A measurement model in its purest form is a confirmatory factor analysis. Themeasurement model operationalizes the relationship between observed variables (indicators) andlatent variables; in other words, the analyst specifies how each observed variable is related to theunderlying latent variable that it measures. This is usually a four-step process: The analyst(1) defines or gives meaning to the latent variable by naming it, (2) indicates the dimensions andvariables that represent the latent variable, (3) forms the measures and the operational definition,and (4) specifies the relation between the measures and the latent variables (Bollen, 1989).
Although most researchers acknowledge the existence of errors in variable measurement,many statistical procedures do not allow modeling of this property. Even more advancedmodeling procedures, such as systems regression analysis, generally assume variables aremeasured without error. That assumption often forces researchers to disregard useful measuresthat do not meet strict reliability requirements, yet hold utility for investigative purposes.Typically, observed variables, such as those in surveys, are measured with error. SEM explicitlyacknowledges measurement error by incorporating error components for all observed variables.As with latent variables, the arrows pointing from error terms to observed variables denote thaterror represents a causal component of the observed variable. This feature of SEM allows theanalyst to isolate the non-error component—that portion of the variable of most interest to
ξ1
ξ2
ξ3
δ1 x1
x2
x3
x4
x5
x6
x7
δ2
δ3
δ4
δ5
δ6
δ7
1
1
1
λ21
λ31
λ32
λ52
λ73
γ11
γ21
γ12
γ23
β12ζ1
ζ2
y1
y2
y3
y4
ε1
ε2
ε3
ε4
η1
η2
λ21
λ42
Observed Variable
Latent Variable
1
1

G-3
researchers. Furthermore, if the reliability of the variable is known (e.g., from past research),then the specific portion of variability representing error can be preset.
Another component of the measurement model is the parameter coefficients, which depictthe strength of the relationship between latent variables and observed variables. In themeasurement model, parameter coefficients are analogous to regression coefficients or factorscores. Goodness-of-fit measures are used to evaluate both the measurement model and thestructural model, which is discussed next. Once the fit of the measurement model is found to beacceptable, the researcher tests the structural model.
Structural Model
The second component of SEM—the structural model—depicts the causal relationshipsamong latent variables. Within the structural model, two types of latent variables aredistinguished: Endogenous latent variables have hypothesized predictors within the model,whereas exogenous latent variables are not explained by the model but influence other variablesin the model. Endogenous latent variables may interact causally, but exogenous latent variablesfunction only as causal antecedents. Arrows indicate the hypothesized causal directions andrelationships among the latent variables in the structural model.
Endogenous latent variables can be influenced by exogenous latent variables, otherendogenous latent variables, or both. The paths between latent variables are represented bystructural coefficients depicting the strength and nature of the relationship. Structural models,like regression models, contain a measurement error component. Thus, a structural modeldepicts each endogenous latent variable in terms of its hypothesized causal antecedents and ameasurement error component.
As the preceding discussion indicates, analysts using SEM can simultaneously measurelatent variables and estimate relationships among the latent variables. Thus, a primary advantageof SEM is that it allows for the simultaneous estimation of path coefficients that result in overallestimates of model appropriateness and structural coefficients that account for multicollinearityamong predictors (Tabachnick & Fidell, 1996).
Error Variance/Covariance Model
The third component of SEM that must be specified is the error variance/covariancestructure among observed and latent variables. For simple recursive (unidirectional) models,such as the one tested, covariances should not be estimated for residual terms (Hatcher, 1994).For the model, error covariances were set to zero since no relationships between the errors wereexpected.
Model Specification and Estimation of Parameters
SEM employs a variety of “full information” techniques to estimate parameters(Maruyama, 1997). When analysts apply these techniques to multiple equation systems, they cansolve a single equation while accounting for restrictions specified in other equations. Thus, SEM

G-4
controls for the possibility that simultaneous causation effects may be misinterpreted if “betweenequation” restrictions are overlooked. This amounts to full, simultaneous assessment of modelsas opposed to piecemeal assessment of multivariate relationships.
Prior to estimating model parameters, analysts must fully specify the form of the modelaccording to expectations set forth in a theoretical framework. This task is accomplished with aseries of equations describing the hypothesized relationships among latent and observedvariables. These equations pertain to all relationships in the measurement and structuralcomponents of a model. Using equation notation and terminology corresponding to PROCCALIS output for model specification and parameter estimates, we discuss parameter estimationin each of the three components of the SEM model displayed in Figure G.1.
Measurement Model
In the measurement model three parameters are estimated: the factor loadings (pathcoefficients), the variance for the exogenous and endogenous latent variables, and the covariancebetween latent variables. The equation to estimate the exogenous and endogenous latentvariables are represented as:
x = Λx ξ + δy = Λy η + ε
where x = observed indicators of the exogenous latent variables, y = observed indicators of theendogenous latent variables, Λx = the coefficients of the regression of x on ξ, Λy = thecoefficients of the regression of y on η, ξ = the exogenous latent variables, η = endogenouslatent variables, δ = measurement errors in x, and ε = measurement errors in y. Please note:Boldface symbols denote that the matrix contains all the model estimates represented by thatparticular symbol. Hence, ξ represents the matrix containing all exogenous latent variables ξi.
In the measurement model, latent variable variance is not estimated because latentvariables are hypothetical concepts that have no established metric or scale (the scaleindeterminacy problem; Hatcher, 1994). The model can be identified despite this problem byfixing variance to one.
Structural Model
The components of the structural model are represented by the following equation:
η = Β η + Γ ξ + ζ
In this equation a vector of endogenous latent variables (η) is depicted in terms of theeffects from other endogenous and exogenous latent variables, plus a disturbance factor. Theeffects of endogenous latent variables are represented by the structural coefficient vector, Β,which represents the effects from the corresponding vector of endogenous latent variables, η.Similarly, the effect of exogenous latent variables are represented by the structural coefficientvector, Γ, which represents the effects the corresponding vector of exogenous latent variables, ξ.

G-5
Finally, ζ represents a vector of disturbance terms accounting for error in the structuralequations. That is, endogenous latent variables result from the influence of other endogenouslatent variables, exogenous latent variables, and some error in equations. This component ofSEM resembles path analytic models.
Variance/Covariance Model
Unlike path analytic or factor analyses, specification of variance and covariances (amongconstructs, observed indicators, and error terms) is a major activity in SEM. Another term forstructural equation techniques is analysis of covariance structures. There are four matrices thatmust be specified for a structural equation model. These matrices, shown below, represent thefollowing relationships:
φ Covariance among the exogenous latent variablesϕ Error covariance among the endogenous latent variablesθ Error covariance among the exogenous observed variablesθδ Error covariance among the endogenous observed variables
The specific nature of these four matrices is also determined by theoretical considerations.For instance, error terms for observed variables are typically assumed to be uncorrelated. Thus,the off-diagonal elements of any matrix containing error components for observed variableswould not be estimated.
Parameter Estimation
Estimation occurs when an implied, or hypothesized, covariance matrix is specified basedon the model adopted. This computed matrix is compared with the covariance matrix among theobserved variables. Structural equation modeling provides an assessment of the extent to whichthe observed variable covariance matrix reflects the hypothesized variable covariance matrix(Long, 1983).
Methods of parameter estimation available in the PROC CALIS program includemaximum likelihood and a two-part estimation method in which PROC CALIS first computesunweighted least-square estimates, then uses them as initial values to compute either maximumlikelihood or generalized least-square estimates.
Model restrictions and underlying variable characteristics determine the appropriateness ofeach estimation procedure. Regardless of the specific procedure, each operates from the samebasic theoretical goal: to produce an implied covariance matrix that closely approximates theobserved covariance matrix. In this study, the maximum likelihood method was used to obtainparameter estimates.

G-6
Model Evaluation
After parameter estimates are obtained, analysts can use various fit indexes to evaluatethe CALIS solutions. To date, there is no single optimal test; therefore, several tests are used toevaluate the fit of a specified model. One class of fit indexes pertains to the overall fit of themodel, where “fit” concerns the closeness between the implied and observed covariancematrixes. Chi-square represents one of several overall model fit indexes. Actually, chi-square isa “badness-of-fit” measure, and, if significant, the model is usually interpreted as beingimplausible for the sample data. A more definitive statement concerning this measure is notwarranted because of the chi-square test’s substantial dependence on sample size. For instance,if a sample is very large (e.g., n = 3,000), the power for the test is great and virtually any valuewill be significant, meaning almost no model will fit.
A second overall fit measure, the goodness of fit index (GFI), provides “a measure of therelative amount of variances and covariances jointly accounted for by the model” (Jöreskog &Sörbom, 1981, p. I.41). This index is easier to interpret because it typically ranges from zero toone, with one indicating perfect model fit. The normed fit index (NFI) has the advantage ofbeing easily interpreted, and also has the disadvantage of sometimes underestimating goodnessof fit in small samples. A variation on this measure is the non-normed fit index (NNFI), whichhas been shown to be a better measure of model fit for all sample sizes. The comparative fitindex (CFI) is similar to the NNFI in that it provides an accurate assessment of fit regardless ofsample size.
A final set of overall fit indexes involves residuals, or the difference between values in theimplied and observed covariance matrices. The root mean square residual represents the averageof the fitted residuals and may be used to compare models fitted to the same data. CALISprovides a point estimate of the root mean square error of approximation (RMSEA; Steiger,1990), which Browne and Cudeck (1993) described as “a measure of the discrepancy per degreeof freedom for the model” (p. 144). For these latter indexes, perfect model fit is indicated by thelower bound value of zero.
Beyond the overall fit indexes, model solutions should be evaluated according to criteriathat are similar to those used in evaluating outcomes from other multivariate statisticalprocedures. For example, anomalies such as negative error variances, extremely large standarderrors for parameter estimates, or correlations greater than one signal poor model fit ormisspecification. Similarly, the internal structure of the model should be evaluated. Forinstance, individual item and composite reliabilities should be adequate.
Interpreting Coefficients/Direct and Indirect Effects
As stated earlier, the measurement model is essentially a confirmatory factor analysis.Thus, the resulting parameter coefficients are interpreted in the same way as regression or factorscore coefficients. Hence, the coefficient represents how much a unit change in a particularlatent variable affects the respective observed indicator.

G-7
While the same logic holds for the structural model, additional facets of SEM must beconsidered. Namely, the structural coefficients, beta (βij) and gamma (γij), represent only thedirect effects of endogenous and exogenous latent variables on a particular endogenous latentvariable. Restricting consideration to direct effects only may be problematic for multiequationstructural models. For this reason, structural effects are often spoken of in terms of direct,indirect, and total effects.
Figure G.1 can be used to define direct, indirect, and total effects. The direct effect of ξ1
on η1 is measured by the coefficient γ11. It represents the direct effect of a one-unit change of ξ1
on η1. The indirect effect of ξ1 on η1 is the product γ12*β12. This is the mediated effect of ξ1 onη1 through η2. Note that, depending on the signs of the structural coefficients, the indirect effectcan be either positive or negative in value. The total effect of ξ1 on η1 is the sum of the direct(γ11) and indirect (γ12*β12) effects. As part of its output, CALIS provides measures of direct,indirect, and total effects.
2000 MRS Analysis Strategy
Structural equation modeling ideally enforces a correspondence between theory and theempirical data being summarized. As indicated earlier, the model specification stage is usuallyguided by some theoretical considerations. Traditionally, structural equation modeling employsestablished scales with appropriate levels of reliability and validity for measuring specific latentvariables. The shared variance among the set of items making up those scales is used tomathematically build latent variables. The latent variables, not the individual questions, are usedto examine relationships. However, the design of the 2000 Military Recruiter Survey did notinclude scales that were designed, a priori, to measure specific latent variables. Consequently,we used a post hoc procedure to develop the latent variables—questions were grouped togetheron the basis of (a) an initial examination of content and understanding of recruiting issues and(b) follow-up exploratory factor analytic work. Careful attention was given to both the conceptsand the empirical indicators supplied by the MRS data. We then proceeded according to thefollowing general strategy.
Specification of Initial Model
In Chapter 2 we describe the constructs (latent variables) and observed variables in detailand discuss the initial identification and specification of the constructs.
Estimation of the Measurement Model for Each Latent Variable
The properties of the latent variables were assessed prior to full-scale modeling efforts.This task basically involved preliminary analysis of distribution properties and measurementanomalies among various groups of variables. This phase provided an initial check on modelviability. Following suggestions made by James, Mulaik, and Brett (1982) and Anderson andGerbing (1988), we used a two-step modeling approach to examine the overall measurement andstructural properties of the survey questions and the interrelationships among their correspondinglatent variables. This approach emphasizes the analysis of two conceptually distinct latentvariable models that, in combination, provide assessment of convergent, discriminant, andpredictive validity. The first step, which involved testing the measurement model, was, in

G-8
essence, a confirmatory test of the work that was conducted in our initial exploratory factoranalytic work. However, it would be meaningless to test the structural model without firstestablishing that the measurement model holds. If the chosen indicator variables from thequestionnaire do not measure the specified latent variable, the specified theory must be modifiedbefore it can be tested. Therefore, we tested the measurement model before examining thestructural relationships. During this first step, the covariance matrix of the latent variables wasunconstrained, as recommended by Joreskog and Sorbom (1993), and maximum likelihoodestimation was used. Support for the measurement model was found: χ2(528, N = 3,640) =3814.09, p < .0001; GFI = .93; RMSEA = .044; and comparative fit index (CFI) = .92.
Estimation of the Structural Model
After testing the measurement model, we tested the structural model. In the structuralmodel displayed in Figure 3.1, ovals represent latent variables (constructs) and rectanglesrepresent measured variables. The absence of a line connecting variables implies nohypothesized direct effect. We used the maximum likelihood method to estimate the structuralmodel. An independence model that tests the hypothesis that the variables are uncorrelated withone another was easily rejected, χ2(630, N = 3,640) = 40854, p < .01. Next, we tested thestructural model. A chi-square difference test indicated a significant improvement in fit betweenthe independence model and the structural model and provided strong support for the structuralmodel in terms of GFI, CFI, and RMSEA: χ2(543, N = 3,640) = 3933.54, p < .0001; GFI = .93;RMSEA = .044; and CFI = .92.
In his review of the existing literature on structural equation modeling, Breckler (1990)observed several shortcomings—namely, that goodness of fit can be identical for a potentiallylarge number of models and that sample size can have strong effects on results. Given theseshortcomings, Breckler (1990) and others (Schumacker & Lomax, 1996) have emphasized theneed for cross-validation procedures to ensure that parameter estimates obtained from amodeling effort are appropriate. The emphasis on cross-validation is particularly necessary incases where post hoc modifications are made to the structural model, as was the case in ouranalysis of 2000 MRS data.
Cross-Validation
In traditional cross-validation procedures, estimates from one sample are obtained andthen tested on a second sample to examine their stability. For example, a structural equationmodel is employed on the first sample, typically called the screening sample (Lord & Novick,1968), and all estimates in the model are freely estimated. These estimates are then applied to asecond sample, typically called the calibration sample (Lord & Novick, 1968). If, afterconstraining the estimates in the calibration sample to be equal to the estimates obtained from thescreening sample, the overall reduction in fit is small, the obtained estimates may be applied infuture predictions with greater confidence (Pedhazur, 1997).
Cross-validation, however, is a costly process. Moreover, long delays in assessing thefindings may occur because of difficulties in obtaining a second sample. As an alternative, someresearchers recommend splitting a large sample (typically defined as more than 500) into two

G-9
subsamples, with one subsample used as the screening sample and the other as the calibrationsample (Green, 1978; Stevens, 1996). Mosier (1951) pointed out that if evidence is found forcross-validation, a regression equation based on the combined samples (the screening andcalibration samples) is more stable because of the larger number of subjects on which it is based.Thus, if two samples are cross validated, researchers recommend re-combining the two samplesand using the estimates from the combined sample in future predictions.
In the case of structural equation modeling, this process can be accomplished by usingmultisample (also referred to as multiple-group) analysis (Schumacker & Lomax, 1996). In themultisample approach, analysts use a series of tests to investigate the various segments of theoverall structural and measurement model. In this process, cross-validation is accomplishedthrough a seven-step procedure (these steps are detailed below). For the 2000 MRS analysis, twodata sets were created through a random 2/3 and 1/3 split of the original full dataset. Thecomputations were completed by using estimates and fit indexes from these two datasets, whichwill be referred to as Set 2/3 and Set 1/3 for the rest of the discussion.
During each of the following steps, constraints were imposed on Set 1/3. The constraintsvaried depending on the invariance that was being tested in each of the seven steps. In each step,all elements that were being constrained to test invariance were fixed to corresponding estimatesthat were obtained when freely testing the model in Set 2/3.
Step 1. Before analysts begin to estimate invariance models, they need to establish that amodel without any invariances is a reasonable model. In our analysis, we first tested the modelon the full data set. We found acceptable fit for the model. Next, we tested the model on Set 2/3and Set 1/3. Acceptable fit was found for both sets. Thus we were able to use this structuralmodel as a baseline to test for invariance across samples.
Step 2. The first values to test for invariance are the factor loadings. If the factorloadings are not invariant, then it makes no sense to test the equality of the paths because the unitof measurement would differ across groups. To test for invariance, we obtained factor loadingestimates from Set 2/3 and used them to constrain the factor loadings in Set 1/3. This resulted inacceptable fit for the constrained model, suggesting that the two models’ factor loadings wereinvariant, χ2(567, N = 1,557) = 1956.46, p < .0001; GFI = .92; RMSEA = .042; and CFI = .92.
Step 3. The second set of invariances to test are the path coefficients in the structuralmodel. This test is executed only if the loadings are invariant. This step also resulted inacceptable fit, suggesting that the paths did not vary for the two sample groups, χ2(582, N =1,557) = 1972.83, p < .0001; GFI = .92; RMSEA = .041; and CFI = .92.
Step 4. Regardless of the results in Steps 2 and 3, it is meaningful to test whether theerror variances are the same in both groups. If the paths vary or if both the loadings and thepaths vary, such variation should be allowed at this step. In our case, however, neither wasfound to meaningfully vary, so they were allowed to remain fixed to estimates from Set 2/3.After constraining the error variances in Set 1/3 to equal those in Set 2/3, we found evidenceindicating that the error variances did not significantly vary across the two samples, χ2(618, N =1,557) = 2019.54, p < .0001; GFI = .91; RMSEA = .040; and CFI = .92.

G-10
Step 5. If the error variances are invariant, we can test whether the error covariances areequal. In essence, this tests the equality of the error correlations. We found evidence that theerror variances were invariant, so it was appropriate to test the error correlations. In our model,all error correlations were set to zero. Therefore, all error covariances were already equal.
Step 6. The next step is to test whether the factor variances are equal. All priorparameter invariances are not necessary for examining this step; however, latent variableloadings must be invariant for this step to be meaningful. Because it is necessary to test factorvariance equivalence with latent variable loadings, we tested Step 6 by fixing those parametersequal to Set 2/3 estimates. After constraining latent variable loadings and factor variances in Set1/3 to be equal to those in Set 2/3, we found evidence indicating that the factor variances did notsignificantly vary across samples, χ2(576, N = 1,557) = 1972.98, p < .0001; GFI = .92;RMSEA = .042; and CFI = .92.
Step 7. The final step involves examining factor covariance equivalence. This test ismeaningful only if the loadings and the factor variances are invariant. Given equality of thefactor variances, this test evaluates the equality of the factor correlations. In Step 6 we foundevidence for factor variance equality; therefore, it was meaningful to test this step. It isnecessary to test factor covariance equivalence with latent variable loadings set equal to factorvariance. After constraining factor loadings, factor variances, and factor covariances in Set 1/3to be equal to those in Set 2/3, we found evidence indicating that the factor covariances did notsignificantly vary across samples, χ2(612, N = 1,557) = 2034.85, p < .0001; GFI = .92;RMSEA = .041; and CFI = .92.
All estimates were fully cross-validated with the multisample analysis.

G-11
REFERENCES FOR APPENDIX G
AMOS® [Computer software] SPSS Inc., Chicago, IL.
Anderson, J. C., & Gerbing, D. W. (1988). Structural equation modeling in practice: A reviewand recommended two-step approach. Psychological Bulletin, 103, 411–423.
Bollen, K. A. (1989). Structural equations with latent variables. New York: Wiley.
Breckler, S. J. (1990). Applications of covariance structure modeling in psychology: Cause forconcern? Psychological Bulletin, 107, 260–273.
Browne, M. W., & Cudeck, R. (1993). Alternative ways of assessing model fit. In K. A. Bollen& J. S. Long (Eds.), Testing structural equation models (pp. 136–162). Newbury Park, CA:Sage.
EQS® [Computer software] Multivariate Software, Inc., Encino, CA.
Green, P. E. (1978). Analyzing multivariate data. Hinsdale, IL: The Dryden Press.
Hatcher, L. (1994). A step-by-step approach to using the SAS system for factor analysis andstructural equation modeling. Cary, NC: SAS Institute.
James, L. R., Mulaik, S. A., & Brett, J. M. (1982). Causal analysis: Assumptions, models, anddata. Beverly Hills, CA: Sage.
Jöreskog, K. G., & Sörbom, D. (1981). LISREL V: Analysis of linear structural relationshipsby maximum likelihood and least squares methods. Chicago: National Education Resources.Distributed by International Educational Services, Chicago.
Jöreskog, K. G., & Sörbom, D. (1993). LISREL8: Structural equation modeling with theSIMPLIS command language. Hillsdale, NJ: Erlbaum.
LISREL® [computer software] SPSS Inc., Chicago, IL.
Long, J. S. (1983). Covariance structural models: An introduction to LISREL. Beverly Hills,CA: Sage.
Lord, F. M., & Novick, M. R. (1968). Statistical theories of mental test scores. Reading, MA:Addison-Wesley.
Maruyama, G. M. (1997). Basics of structural equation modeling. Thousand Oaks, CA: Sage.
Mosier, C. I. (1951). Batteries and profiles. In E. F. Lindquist (Ed.), Educational measurement(pp. 764–808). Washington, DC: American Council on Education.
G-12
Pedhazur, E. J. (1997). Multiple regression in behavioral research: Explanation andprediction. Orlando, FL: Harcourt Brace.
SAS (Version 8) [Computer software] (2000). Cary, NC: SAS Institute, Inc.
Schumacker, R. E., & Lomax, R. G. (1996). A beginner's guide to structural equationmodeling. Mahwah, NJ: Erlbaum.
Steiger, J. H. (1990). Structural model evaluation and modification: An interval estimationapproach. Multivariate Behavioral Research, 25, 173–180.
Stevens, J. (1996). Applied multivariate statistics for the social sciences (3rd ed.). Mahwah,NJ: Erlbaum.
Tabachnick, B. G., & Fidell, L. S. (1996). Using multivariate statistics. New York:HarperCollins College Publishers.

Appendix H
Standardized Model Residuals


H-1
Figure H.1.Standardized Model Residuals
Standardized Residuals
0
10
20
30
40
50
60
70
-10.0 -9.5
-9.0
-8.4
-7.9
-7.4
-6.8
-6.3
-5.8
-5.3
-4.7
-4.2
-3.7
-3.2
-2.6
-2.1
-1.6
-1.1
-0.5 0.5 1.1 1.6 2.1 2.6 3.2 3.7 4.2 4.7 5.3 5.8 6.3 6.8 7.4 7.9 8.4 9.0 9.5 10.0
Residual Value
Res
idua
l Cou
nt


