20014 in review: recovery - new hampshire employment · pdf filenew hampshire employment...
TRANSCRIPT

State of New HampshireMargaret Wood Hassan, Governor
New Hampshire Employment SecurityGeorge N. Copadis, Commissioner
Economic and Labor Market Informati on BureauBruce R. DeMay, Director
February 2015
2014 In Review: RecoveryAn Analysis of New Hampshire’s Post-Recession Economy

New Hampshire Employment Security, Economic and Labor Market Informati on Bureau • (603) 228-4124 • www.nhes.nh.gov/elmi
2014 In Review: Recovery
This workforce product was funded by a grant awarded by the U.S. Department of Labor’s Employment and Training Administration. The product was created by the grantee and does not necessarily reflect the official position of the U.S. Department of Labor. The Department of Labor makes no guarantees, warranties, or assurances of any kind, express or implied, with respect to such information, including any information on linked sites and including, but not limited to, accuracy of the information or its completeness, timeliness, usefulness, adequacy, continued availability, or ownership. This product is copyrighted by the institution that created it. Internal use by an organization and/or personal use by an individual for non-commercial purposes is permissible. All other uses require the prior authorization of the copyright owner.
New Hampshire Employment Security, Economic and Labor Market Informati on Bureau • (603) 228-4124 • www.nhes.nh.gov/elmi
2014 In Review: Recovery 1
Economic Indicators
Unemployment in New Hampshire
The Skills Gap — Fact or Myth?
Table
of C
onte
nts
Monthly Time Series
Unemployment Stati sti cs . . . . . . . . . . . . . . . . . . . . . . . . . . . 3
Current Employment Stati sti cs . . . . . . . . . . . . . . . . . . . . . . . . 5
Housing Permits . . . . . . . . . . . . . . . . . . . . . . . . . . . . . . . 12
Initi al Claims and Conti nued Weeks Claimed . . . . . . . . . . . . . . . 13
Quarterly Time Series
Durati on of Employment . . . . . . . . . . . . . . . . . . . . . . . . . . 14
Business Employment Dynamics . . . . . . . . . . . . . . . . . . . . . . 15
Annual Time Series
Populati on . . . . . . . . . . . . . . . . . . . . . . . . . . . . . . . . . . 16
Conclusion. . . . . . . . . . . . . . . . . . . . . . . . . . . . . . . . . . . . . 19
Long-Term Unemployment. . . . . . . . . . . . . . . . . . . . . . . . . . . . 21
Changes in Durati on of Unemployment. . . . . . . . . . . . . . . . . . . . . 22
Characteristi cs of the Long-Term Unemployed. . . . . . . . . . . . . . . . . 23
Durati on of Unemployment by Demographic Group . . . . . . . . . . . . . 26
Durati on of Age Cohorts . . . . . . . . . . . . . . . . . . . . . . . . . . . . . 27
Part-Time Workers . . . . . . . . . . . . . . . . . . . . . . . . . . . . . . . . 28
Demographics of Involuntary Part-Time Workers . . . . . . . . . . . . . . . 29
Discouraged Workers . . . . . . . . . . . . . . . . . . . . . . . . . . . . . . . 31
Employer Percepti ons . . . . . . . . . . . . . . . . . . . . . . . . . . . . . . 32
Job Seeker Expectati ons . . . . . . . . . . . . . . . . . . . . . . . . . . . . . 35
Populati on and Workforce Implicati ons. . . . . . . . . . . . . . . . . . . . . 36
Educati on Pipeline . . . . . . . . . . . . . . . . . . . . . . . . . . . . . . . . 43

New Hampshire Employment Security, Economic and Labor Market Informati on Bureau • (603) 228-4124 • www.nhes.nh.gov/elmi
2 2014 In Review: Recovery

New Hampshire Employment Security, Economic and Labor Market Informati on Bureau • (603) 228-4124 • www.nhes.nh.gov/elmi
2014 In Review: Recovery 3Eco
nom
ic Indica
tors
1. For monthly counts, seasonally adjusted data from December 2007 will be compared with preliminary data from December 2014. On March 3, 2015, benchmarked data for Unemployment Statistics and Current Employment Statistics will be released.
Source: Local Area Unemployment Stati sti cs, Economic and Labor Market Informati on Bureau
The size of NH’s labor force has changed litt le since December 2007
Economic Indicators Are we there yet? New Hampshire’s economy has on many accounts regained what was lost during the Great Recession, but the problem of long-term unemployment seems to be a lingering scar from the damage created by the Great Recession. Hopefully it won’t be a lasting phenomenon.
What did the economy look like by the end of 2014? How is the health and strength of New Hampshire’s economy? These questions will be evaluated using several labor market-related indicators.
The labor market-related indicators presented below are grouped by the timeframe for which the indicator is regularly released (monthly, quarterly or annually). Data released monthly provide a more current outlook, whereas data released quarterly and annually identify differences that have occurred over the long term.
Monthly Time Series 1Unemployment Stati sti cs In December 2014, New Hampshire’s seasonally adjusted unemployment rate
was 4.0 percent. The US unemployment rate for December 2014 was 5.6 percent. At the onset of the Great Recession in December 2007, the unemployment rate in New Hampshire was 3.4 percent. As the Great Recession took its toll on employment in the state, the unemployment rate peaked at 6.7 percent, staying at that level between October 2009 and January 2010.
660,000
670,000
680,000
690,000
700,000
710,000
720,000
730,000
740,000
750,000
760,000
Dec
200
7
Mar
200
8
June
200
8
Sep
200
8
Dec
200
8
Mar
200
9
June
200
9
Sep
200
9
Dec
200
9
Mar
201
0
June
201
0
Sep
201
0
Dec
201
0
Mar
201
1
June
201
1
Sep
201
1
Dec
201
1
Mar
201
2
June
201
2
Sep
201
2
Dec
201
2
Mar
201
3
June
201
3
Sep
201
3
Dec
201
3
Mar
201
4
June
201
4
Sep
201
4
Dec
201
4
Resi
dent
Pop
ulat
ion
Civilian Labor Force (New Hampshire)
Employed (New Hampshire)
New Hampshire Employment Security, Economic and Labor Market Informati on Bureau • (603) 228-4124 • www.nhes.nh.gov/elmi
4 2014 In Review: Recovery Eco
nom
ic Indic
ato
rs The number of employed residents, seasonally adjusted, reached a high of
716,400 in February 2008, before drastically receding and dropping below 690,000 by December 2009. In December 2014, the number of employed residents was 714,400, very close to the pre-recession level.
The number of unemployed residents was just below 25,600 in December 2007, then climbed continuously until December 2009, reaching just shy of 50,000. The number of unemployed in New Hampshire receded to a post-recession low of about 29,800 in December 2014.
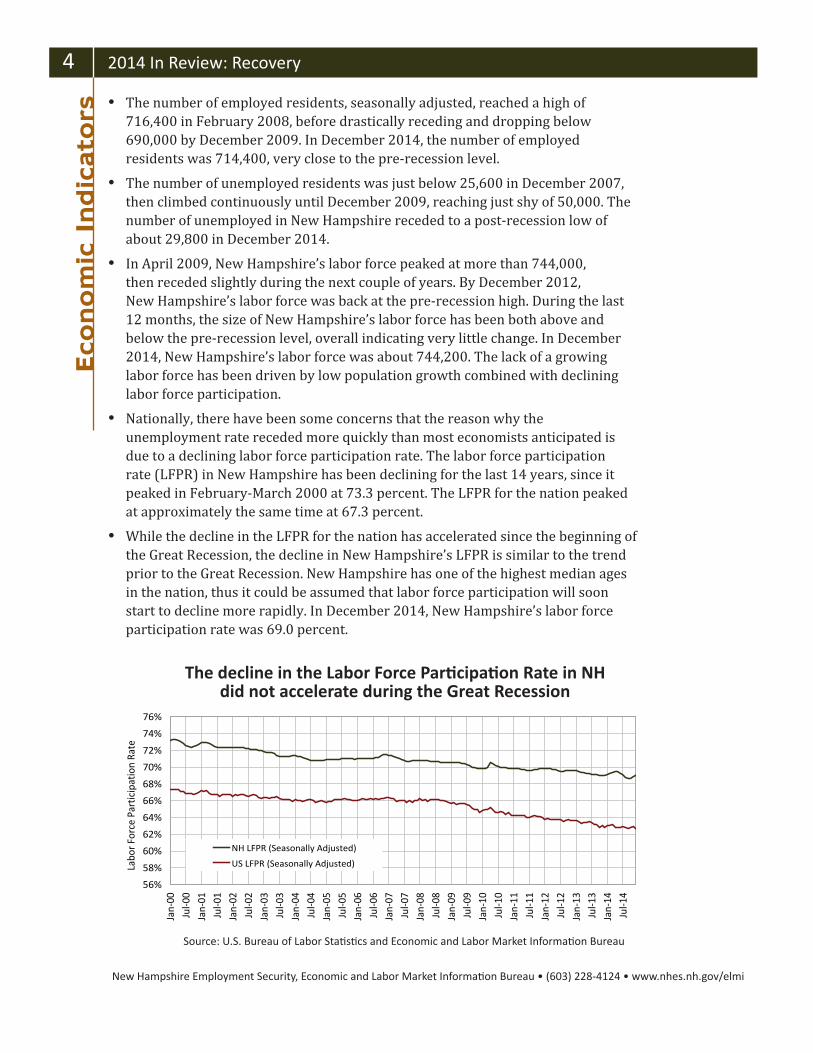
In April 2009, New Hampshire’s labor force peaked at more than 744,000, then receded slightly during the next couple of years. By December 2012, New Hampshire’s labor force was back at the pre-recession high. During the last 12 months, the size of New Hampshire’s labor force has been both above and below the pre-recession level, overall indicating very little change. In December 2014, New Hampshire’s labor force was about 744,200. The lack of a growing labor force has been driven by low population growth combined with declining labor force participation.
Nationally, there have been some concerns that the reason why the unemployment rate receded more quickly than most economists anticipated is due to a declining labor force participation rate. The labor force participation rate (LFPR) in New Hampshire has been declining for the last 14 years, since it peaked in February-March 2000 at 73.3 percent. The LFPR for the nation peaked at approximately the same time at 67.3 percent.
While the decline in the LFPR for the nation has accelerated since the beginning of the Great Recession, the decline in New Hampshire’s LFPR is similar to the trend prior to the Great Recession. New Hampshire has one of the highest median ages in the nation, thus it could be assumed that labor force participation will soon start to decline more rapidly. In December 2014, New Hampshire’s labor force participation rate was 69.0 percent.
Source: U.S. Bureau of Labor Stati sti cs and Economic and Labor Market Informati on Bureau
The decline in the Labor Force Parti cipati on Rate in NH did not accelerate during the Great Recession
56%
58%
60%
62%
64%
66%
68%
70%
72%
74%
76%
Jan-
00Ju
l-00
Jan-
01Ju
l-01
Jan-
02Ju
l-02
Jan-
03Ju
l-03
Jan-
04Ju
l-04
Jan-
05Ju
l-05
Jan-
06Ju
l-06
Jan-
07Ju
l-07
Jan-
08Ju
l-08
Jan-
09Ju
l-09
Jan-
10Ju
l-10
Jan-
11Ju
l-11
Jan-
12Ju
l-12
Jan-
13Ju
l-13
Jan-
14Ju
l-14
Labo
r For
ce P
artic
ipat
ion
Rate
NH LFPR (Seasonally Adjusted)
US LFPR (Seasonally Adjusted)

New Hampshire Employment Security, Economic and Labor Market Informati on Bureau • (603) 228-4124 • www.nhes.nh.gov/elmi
2014 In Review: Recovery 5Eco
nom
ic Indica
tors
Source: Current Employment Stati sti cs, U.S. Bureau of Labor Stati sti cs
Both total nonfarm employment and total private employment in NH have returned to pre-recession levels
2. Sander, Bob. Only one N.H. business filed for bankruptcy in December. New Hampshire Business Review, January 5, 2015. Accessed January 23, 2015 at <www.nhbr.com/January-9-2015/Only-one-NH-business-files-for-bankruptcy-in-December/>.
500,000
520,000
540,000
560,000
580,000
600,000
620,000
640,000
660,000
680,000
Dec-
07
Mar
-08
Jun-
08
Sep-
08
Dec-
08
Mar
-09
Jun-
09
Sep-
09
Dec-
09
Mar
-10
Jun-
10
Sep-
10
Dec-
10
Mar
-11
Jun-
11
Sep-
11
Dec-
11
Mar
-12
Jun-
12
Sep-
12
Dec-
12
Mar
-13
Jun-
13
Sep-
13
Dec-
13
Mar
-14
Jun-
14
Sep-
14
Dec-
14
Empl
oym
ent
(Cur
rent
Em
ploy
men
t Sta
tistic
s) New Hampshire's Nonfarm Employment (Seasonally Adjusted)
New Hampshire's Private Employment (Seasonally Adjusted)
Current Employment Stati sti cs Nonfarm Employment By December 2014 New Hampshire’s seasonally adjusted nonfarm employment
had reached the number of jobs seen before the onset of the Great Recession. The 652,700 nonfarm jobs in January 2008 were slightly surpassed by the 652,900 jobs in December. The nation had risen to its pre-recession level by May 2014.
Total private employment (seasonally adjusted) in New Hampshire was 563,100 jobs in December 2014, which is above the state’s pre-recession private employment level.
Population growth has been tepid over the last decade. Taken alone, this would have the effect of slowing demand for population-driven services such as Government, Retail trade, and Construction. A larger portion of the state’s population is now older than 50, and persons older than 50 tend to be into wealth preservation and more risk averse.
In this post-recessionary period, it seems that limited risk-taking among entrepreneurs or lack of new entrepreneurs in New Hampshire has become an obstacle to faster growth. The low number of bankruptcy filings (normally viewed as a positive economic indicator) in 2014 for New Hampshire 2 might be a symptom of a lower level of business start-ups or a lack of appetite for taking on debt associated with business expansion.

New Hampshire Employment Security, Economic and Labor Market Informati on Bureau • (603) 228-4124 • www.nhes.nh.gov/elmi
6 2014 In Review: Recovery
Employment by Supersector (seasonally adjusted)
Education and health care services is the only supersector that has had employment continuously above its December 2007 level. In December 2014, the employment level in this supersector was 118,800, 12.3 percent higher than at the onset of the Great Recession.
Three other supersectors that initially lost employment during the Great Recession have recovered, with an employment base higher now than in December 2007. In December 2014, employment in Other services was 11.8 percent higher than in December 2007. Similarly, in December 2014, employment in Leisure and hospitality and Professional and business services were 6.9 percent and 5.6 percent higher, respectively, than in December 2007.
Trade, transportation, and utilities, the largest employing supersector in New Hampshire, has barely recovered all jobs lost during the downturn.
Construction and Manufacturing experienced large employment losses during the Great Recession, and employment levels in these supersectors have stabilized at approximately 13 to 14 percent lower than their December 2007 counts.
Eco
nom
ic Indic
ato
rs
Source: Current Employment Stati sti cs, U.S. Bureau of Labor Stati sti cs
Employment growth in Educati on and Health Services has conti nued to grow steadily
75
80
85
90
95
100
105
110
115
Dec
-07
Mar
-08
Jun-
08Se
p-08
Dec
-08
Mar
-09
Jun-
09Se
p-09
Dec
-09
Mar
-10
Jun-
10Se
p-10
Dec
-10
Mar
-11
Jun-
11Se
p-11
Dec
-11
Mar
-12
Jun-
12Se
p-12
Dec
-12
Mar
-13
Jun-
13Se
p-13
Dec
-13
Mar
-14
Jun-
14Se
p-14
Dec
-14
Inde
xed
Empl
oym
ent (
100=
Dec
embe
r 200
7) Other Services
Education andHealth Services
Leisure andHospitality
Professional andBusiness Services
Trade,Transportation,and Utilities Information
FinancialActivities
Construction
Manufacturing
New Hampshire Employment Security, Economic and Labor Market Informati on Bureau • (603) 228-4124 • www.nhes.nh.gov/elmi
2014 In Review: Recovery 7
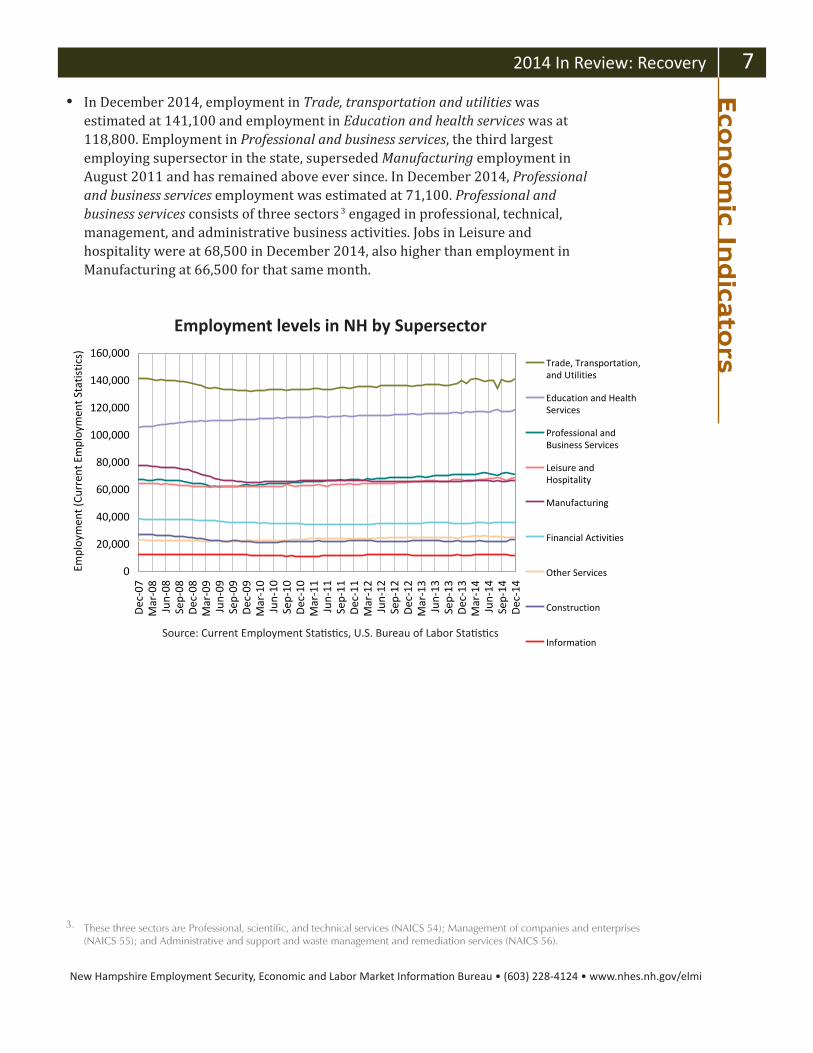
In December 2014, employment in Trade, transportation and utilities was estimated at 141,100 and employment in Education and health services was at 118,800. Employment in Professional and business services, the third largest employing supersector in the state, superseded Manufacturing employment in August 2011 and has remained above ever since. In December 2014, Professional and business services employment was estimated at 71,100. Professional and business services consists of three sectors 3 engaged in professional, technical, management, and administrative business activities. Jobs in Leisure and hospitality were at 68,500 in December 2014, also higher than employment in Manufacturing at 66,500 for that same month.
Eco
nom
ic Indica
tors
3. These three sectors are Professional, scientific, and technical services (NAICS 54); Management of companies and enterprises (NAICS 55); and Administrative and support and waste management and remediation services (NAICS 56).
Source: Current Employment Stati sti cs, U.S. Bureau of Labor Stati sti cs
Employment levels in NH by Supersector
0
20,000
40,000
60,000
80,000
100,000
120,000
140,000
160,000
Dec
-07
Mar
-08
Jun-
08Se
p-08
Dec
-08
Mar
-09
Jun-
09Se
p-09
Dec
-09
Mar
-10
Jun-
10Se
p-10
Dec
-10
Mar
-11
Jun-
11Se
p-11
Dec
-11
Mar
-12
Jun-
12Se
p-12
Dec
-12
Mar
-13
Jun-
13Se
p-13
Dec
-13
Mar
-14
Jun-
14Se
p-14
Dec
-14
Empl
oym
ent (
Curr
ent E
mpl
oym
ent S
tatis
tics)
Trade, Transportation,and Utilities
Education and HealthServices
Professional andBusiness Services
Leisure andHospitality
Manufacturing
Financial Activities
Other Services
Construction
Information

New Hampshire Employment Security, Economic and Labor Market Informati on Bureau • (603) 228-4124 • www.nhes.nh.gov/elmi
8 2014 In Review: Recovery
Hours worked 4 Not all jobs are the same in terms of number of hours worked and hourly earnings
The average weekly hours worked by production workers in Manufacturing is viewed as a leading indicator 5 for economic activity. Between December 2007 and December 2008, the average weekly hours worked by production workers in New Hampshire declined from 40.5 to 37.4 hours. As the economy started to mend, production workers’ average weekly hours increased, rising to a high of 42.7 hours in August 2011. From spring 2010 until summer 2014, the 12-month moving average of weekly hours worked have been above 41 hours. In December 2014, the average weekly hours for production workers was 41.5 hours.
Despite the improvement in the number of hours worked by production workers, significant job gains have yet to occur. The number of production workers in Manufacturing is about 17 percent below the December 2007 level, although there has been some growth since 2011.E
conom
ic Indic
ato
rs
4. Data on Average Weekly Hours and Earnings for New Hampshire are only available as Seasonally Adjusted estimates.5. Leading economic indicators as defined by the Conference Board, a nonprofit organization.
Source: Current Employment Stati sti cs, U.S. Bureau of Labor Stati sti cs
Producti on workers in NH Manufacturing and the hours worked
30.0
35.0
40.0
45.0
50.0
55.0
60.0
Jan-
07
Jun-
07
Nov
-07
Apr
-08
Sep-
08
Feb-
09
Jul-0
9
Dec
-09
May
-10
Oct
-10
Mar
-11
Aug
-11
Jan-
12
Jun-
12
Nov
-12
Apr
-13
Sep-
13
Feb-
14
Jul-1
4
Dec
-14
Production or Nonsupervisory Employees (In Thousands)
Average Weekly Hours of Production Employees
New Hampshire Employment Security, Economic and Labor Market Informati on Bureau • (603) 228-4124 • www.nhes.nh.gov/elmi
2014 In Review: Recovery 9
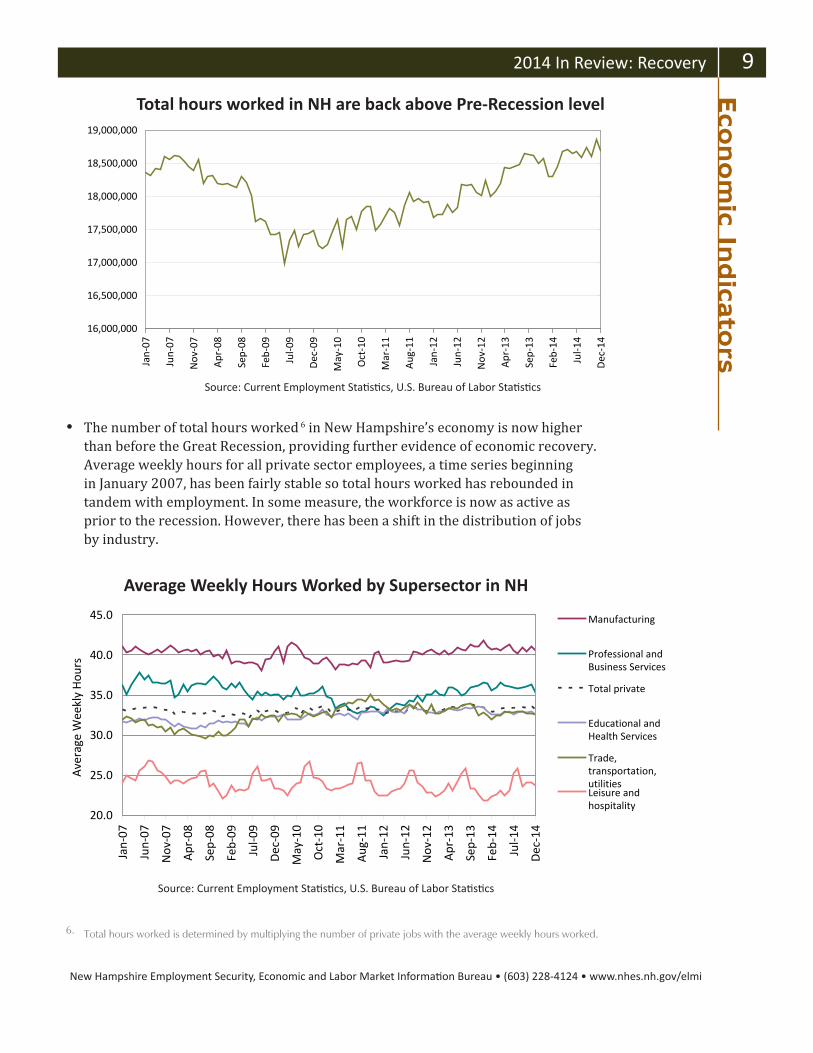
The number of total hours worked 6 in New Hampshire’s economy is now higher than before the Great Recession, providing further evidence of economic recovery. Average weekly hours for all private sector employees, a time series beginning in January 2007, has been fairly stable so total hours worked has rebounded in tandem with employment. In some measure, the workforce is now as active as prior to the recession. However, there has been a shift in the distribution of jobs by industry.
Eco
nom
ic Indica
tors
Source: Current Employment Stati sti cs, U.S. Bureau of Labor Stati sti cs
Source: Current Employment Stati sti cs, U.S. Bureau of Labor Stati sti cs
Average Weekly Hours Worked by Supersector in NH
16,000,000
16,500,000
17,000,000
17,500,000
18,000,000
18,500,000
19,000,000Ja
n-07
Jun-
07
Nov
-07
Apr
-08
Sep-
08
Feb-
09
Jul-0
9
Dec
-09
May
-10
Oct
-10
Mar
-11
Aug
-11
Jan-
12
Jun-
12
Nov
-12
Apr
-13
Sep-
13
Feb-
14
Jul-1
4
Dec
-14
Total hours worked in NH are back above Pre-Recession level
6. Total hours worked is determined by multiplying the number of private jobs with the average weekly hours worked.
20.0
25.0
30.0
35.0
40.0
45.0
Jan-
07
Jun-
07
Nov
-07
Apr
-08
Sep-
08
Feb-
09
Jul-0
9
Dec
-09
May
-10
Oct
-10
Mar
-11
Aug
-11
Jan-
12
Jun-
12
Nov
-12
Apr
-13
Sep-
13
Feb-
14
Jul-1
4
Dec
-14
Ave
rage
Wee
kly
Hou
rs
Manufacturing
Professional andBusiness Services
Total private
Educational andHealth Services
Trade,transportation,utilitiesLeisure andhospitality
New Hampshire Employment Security, Economic and Labor Market Informati on Bureau • (603) 228-4124 • www.nhes.nh.gov/elmi
10 2014 In Review: Recovery
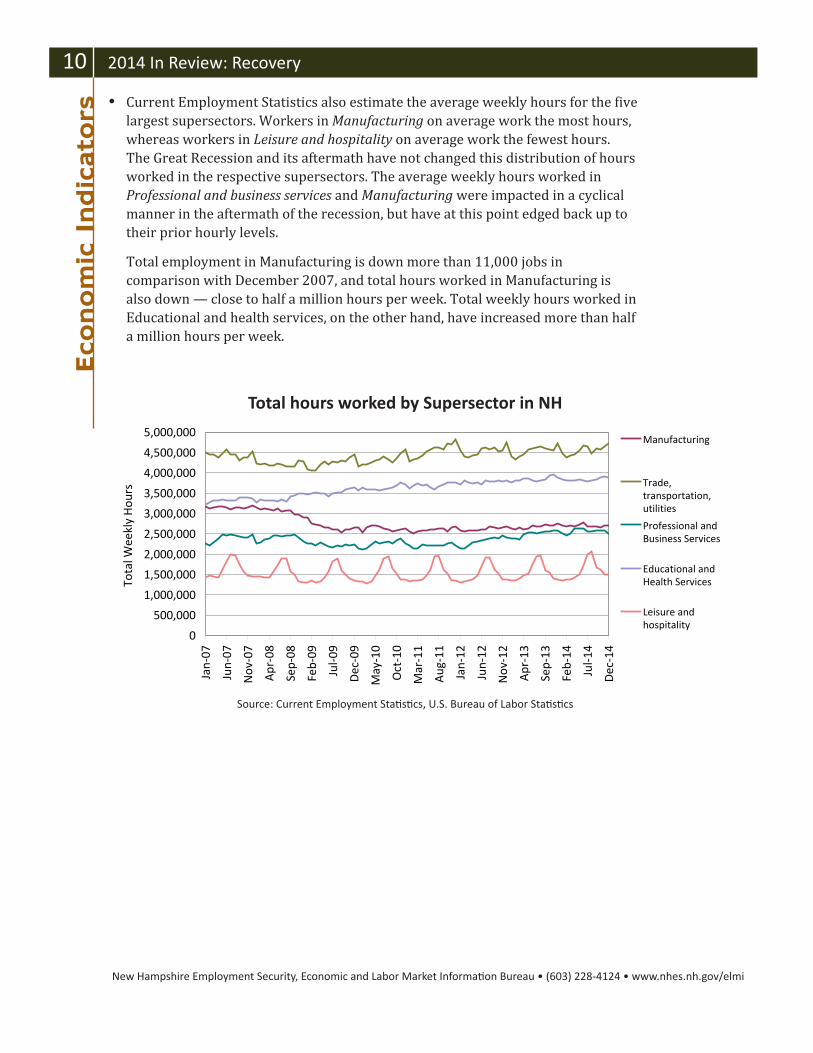
Current Employment Statistics also estimate the average weekly hours for the five largest supersectors. Workers in Manufacturing on average work the most hours, whereas workers in Leisure and hospitality on average work the fewest hours. The Great Recession and its aftermath have not changed this distribution of hours worked in the respective supersectors. The average weekly hours worked in Professional and business services and Manufacturing were impacted in a cyclical manner in the aftermath of the recession, but have at this point edged back up to their prior hourly levels.
Total employment in Manufacturing is down more than 11,000 jobs in comparison with December 2007, and total hours worked in Manufacturing is also down — close to half a million hours per week. Total weekly hours worked in Educational and health services, on the other hand, have increased more than half a million hours per week.
Eco
nom
ic Indic
ato
rs
Source: Current Employment Stati sti cs, U.S. Bureau of Labor Stati sti cs
Total hours worked by Supersector in NH
0
500,000
1,000,000
1,500,000
2,000,000
2,500,000
3,000,000
3,500,000
4,000,000
4,500,000
5,000,000
Jan-
07
Jun-
07
Nov
-07
Apr
-08
Sep-
08
Feb-
09
Jul-0
9
Dec
-09
May
-10
Oct
-10
Mar
-11
Aug
-11
Jan-
12
Jun-
12
Nov
-12
Apr
-13
Sep-
13
Feb-
14
Jul-1
4
Dec
-14
Tota
l Wee
kly
Hou
rs
Manufacturing
Trade,transportation,utilities
Professional andBusiness Services
Educational andHealth Services
Leisure andhospitality

New Hampshire Employment Security, Economic and Labor Market Informati on Bureau • (603) 228-4124 • www.nhes.nh.gov/elmi
2014 In Review: Recovery 11
Average Hourly Earnings 7
(Not Seasonally Adjusted)
The hourly earnings for New Hampshire workers in private industries have lagged slightly behind inflation over the past seven years. Average hourly earnings for private employment receded from $21.63 in December 2007 to $20.97 in December 2014, in inflation-adjusted dollars.
Hourly earnings, inflation adjusted, increased in Education and health services and in Trade, transportation and utilities but were reduced in Manufacturing and Professional and business services. The changes in hourly earnings may reflect a change in the industry mix. Hourly earnings in Leisure and hospitality kept pace with inflation over the last seven years.
Eco
nom
ic Indica
tors
Source: Current Employment Stati sti cs, and Consumer Price Index, U.S. Bureau of Labor Stati sti cs
Wages in NH have generally not kept up with infl ati on over the last seven years
7. Data on Average Weekly Hours and Earnings for New Hampshire are only available as Not Seasonally Adjusted estimates.
$0.00
$5.00
$10.00
$15.00
$20.00
$25.00
$30.00
$35.00
Jan-
07A
pr-0
7Ju
l-07
Oct
-07
Jan-
08A
pr-0
8Ju
l-08
Oct
-08
Jan-
09A
pr-0
9Ju
l-09
Oct
-09
Jan-
10A
pr-1
0Ju
l-10
Oct
-10
Jan-
11A
pr-1
1Ju
l-11
Oct
-11
Jan-
12A
pr-1
2Ju
l-12
Oct
-12
Jan-
13A
pr-1
3Ju
l-13
Oct
-13
Jan-
14A
pr-1
4Ju
l-14
Oct
-14
Ave
rage
Hou
rly
Earn
ings
(Inf
latio
n A
djus
ted
CPI-U
, NSA
)
Professional andBusiness Services
Manufacturing
Educational andHealth Services
Total Private
Trade,transportation,utilitiesLeisure andhospitality
New Hampshire Employment Security, Economic and Labor Market Informati on Bureau • (603) 228-4124 • www.nhes.nh.gov/elmi
12 2014 In Review: Recovery
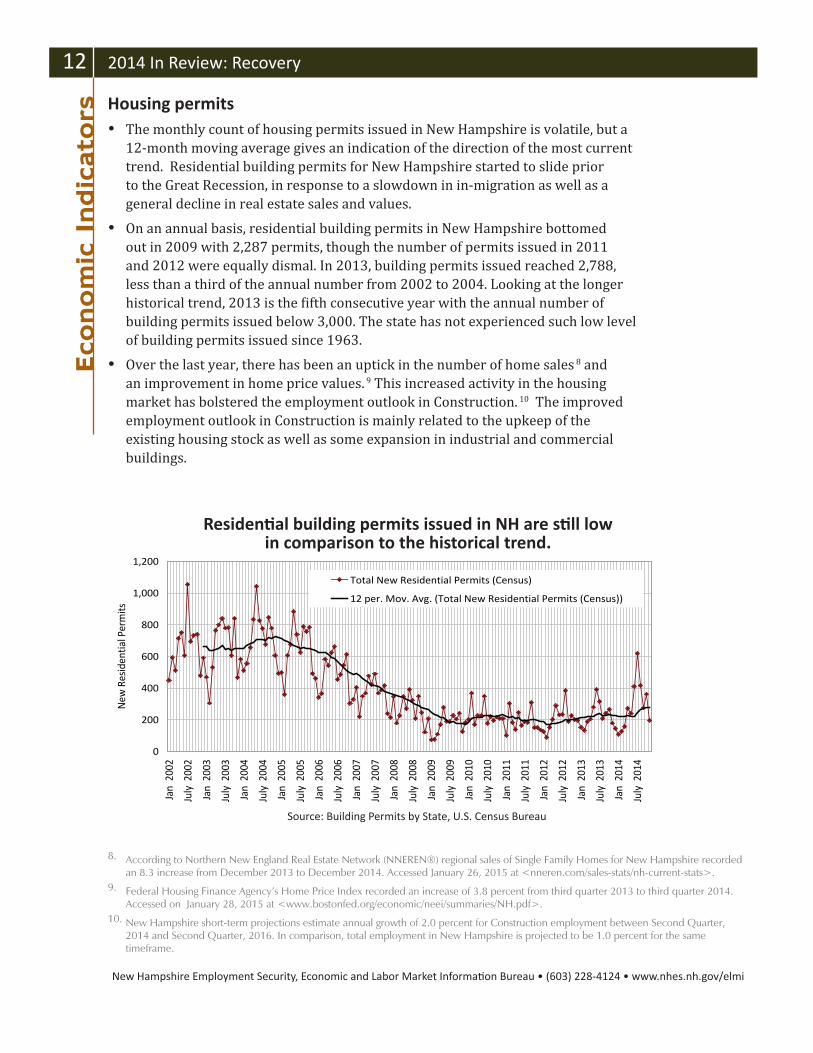
Housing permits The monthly count of housing permits issued in New Hampshire is volatile, but a
12-month moving average gives an indication of the direction of the most current trend. Residential building permits for New Hampshire started to slide prior to the Great Recession, in response to a slowdown in in-migration as well as a general decline in real estate sales and values.
On an annual basis, residential building permits in New Hampshire bottomed out in 2009 with 2,287 permits, though the number of permits issued in 2011 and 2012 were equally dismal. In 2013, building permits issued reached 2,788, less than a third of the annual number from 2002 to 2004. Looking at the longer historical trend, 2013 is the fifth consecutive year with the annual number of building permits issued below 3,000. The state has not experienced such low level of building permits issued since 1963.
Over the last year, there has been an uptick in the number of home sales 8 and an improvement in home price values. 9 This increased activity in the housing market has bolstered the employment outlook in Construction. 10 The improved employment outlook in Construction is mainly related to the upkeep of the existing housing stock as well as some expansion in industrial and commercial buildings.
Residenti al building permits issued in NH are sti ll low in comparison to the historical trend.
Source: Building Permits by State, U.S. Census Bureau
0
200
400
600
800
1,000
1,200
Jan
200
2
July
200
2
Jan
200
3
July
200
3
Jan
200
4
July
200
4
Jan
200
5
July
200
5
Jan
200
6
July
200
6
Jan
200
7
July
200
7
Jan
200
8
July
200
8
Jan
200
9
July
200
9
Jan
201
0
July
201
0
Jan
201
1
July
201
1
Jan
201
2
July
201
2
Jan
201
3
July
201
3
Jan
201
4
July
201
4
New
Res
iden
tial P
erm
its
Total New Residential Permits (Census)
12 per. Mov. Avg. (Total New Residential Permits (Census))
8. According to Northern New England Real Estate Network (NNEREN®) regional sales of Single Family Homes for New Hampshire recorded an 8.3 increase from December 2013 to December 2014. Accessed January 26, 2015 at <nneren.com/sales-stats/nh-current-stats>.
9. Federal Housing Finance Agency’s Home Price Index recorded an increase of 3.8 percent from third quarter 2013 to third quarter 2014. Accessed on January 28, 2015 at <www.bostonfed.org/economic/neei/summaries/NH.pdf>.
10. New Hampshire short-term projections estimate annual growth of 2.0 percent for Construction employment between Second Quarter, 2014 and Second Quarter, 2016. In comparison, total employment in New Hampshire is projected to be 1.0 percent for the same timeframe.
Eco
nom
ic Indic
ato
rs
New Hampshire Employment Security, Economic and Labor Market Informati on Bureau • (603) 228-4124 • www.nhes.nh.gov/elmi
2014 In Review: Recovery 13Eco
nom
ic Indica
tors
Initi al Claims and Conti nued Weeks Claimed (not seasonally adjusted)
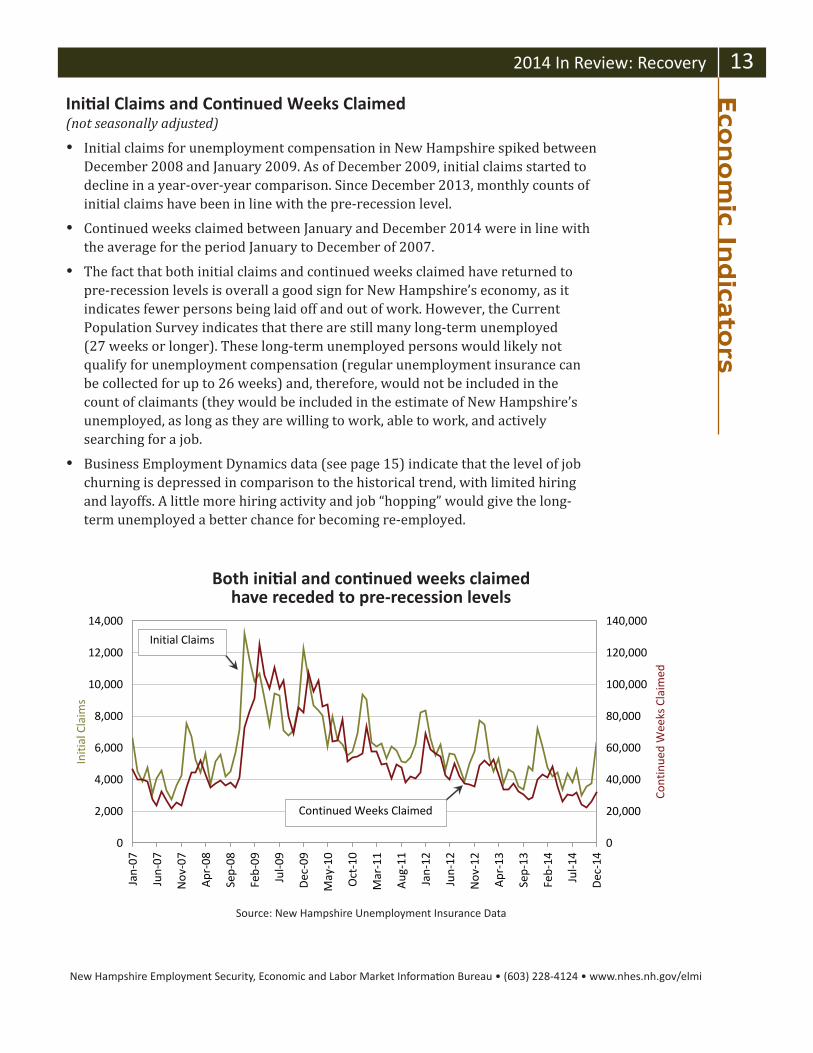
Initial claims for unemployment compensation in New Hampshire spiked between December 2008 and January 2009. As of December 2009, initial claims started to decline in a year-over-year comparison. Since December 2013, monthly counts of initial claims have been in line with the pre-recession level.
Continued weeks claimed between January and December 2014 were in line with the average for the period January to December of 2007.
The fact that both initial claims and continued weeks claimed have returned to pre-recession levels is overall a good sign for New Hampshire’s economy, as it indicates fewer persons being laid off and out of work. However, the Current Population Survey indicates that there are still many long-term unemployed (27 weeks or longer). These long-term unemployed persons would likely not qualify for unemployment compensation (regular unemployment insurance can be collected for up to 26 weeks) and, therefore, would not be included in the count of claimants (they would be included in the estimate of New Hampshire’s unemployed, as long as they are willing to work, able to work, and actively searching for a job.
Business Employment Dynamics data (see page 15) indicate that the level of job churning is depressed in comparison to the historical trend, with limited hiring and layoffs. A little more hiring activity and job “hopping” would give the long-term unemployed a better chance for becoming re-employed.
Source: New Hampshire Unemployment Insurance Data
Both initi al and conti nued weeks claimed have receded to pre-recession levels
0
2,000
4,000
6,000
8,000
10,000
12,000
14,000
Jan-
07
Jun-
07
Nov
-07
Apr
-08
Sep-
08
Feb-
09
Jul-0
9
Dec
-09
May
-10
Oct
-10
Mar
-11
Aug
-11
Jan-
12
Jun-
12
Nov
-12
Apr
-13
Sep-
13
Feb-
14
Jul-1
4
Dec
-14
Initi
al C
laim
s
0
20,000
40,000
60,000
80,000
100,000
120,000
140,000
Cont
inue
d W
eeks
Cla
imed
Initial Claims
Continued Weeks Claimed
New Hampshire Employment Security, Economic and Labor Market Informati on Bureau • (603) 228-4124 • www.nhes.nh.gov/elmi
14 2014 In Review: Recovery
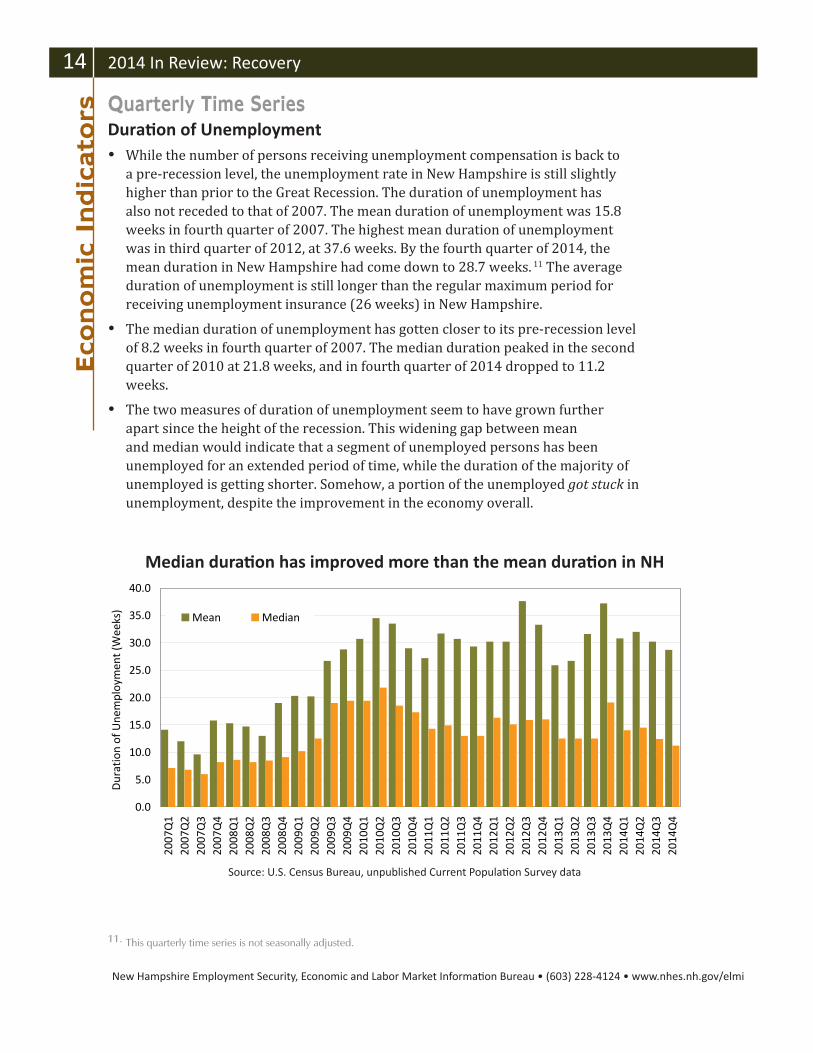
Quarterly Time SeriesDurati on of Unemployment While the number of persons receiving unemployment compensation is back to
a pre-recession level, the unemployment rate in New Hampshire is still slightly higher than prior to the Great Recession. The duration of unemployment has also not receded to that of 2007. The mean duration of unemployment was 15.8 weeks in fourth quarter of 2007. The highest mean duration of unemployment was in third quarter of 2012, at 37.6 weeks. By the fourth quarter of 2014, the mean duration in New Hampshire had come down to 28.7 weeks. 11 The average duration of unemployment is still longer than the regular maximum period for receiving unemployment insurance (26 weeks) in New Hampshire.
The median duration of unemployment has gotten closer to its pre-recession level of 8.2 weeks in fourth quarter of 2007. The median duration peaked in the second quarter of 2010 at 21.8 weeks, and in fourth quarter of 2014 dropped to 11.2 weeks.
The two measures of duration of unemployment seem to have grown further apart since the height of the recession. This widening gap between mean and median would indicate that a segment of unemployed persons has been unemployed for an extended period of time, while the duration of the majority of unemployed is getting shorter. Somehow, a portion of the unemployed got stuck in unemployment, despite the improvement in the economy overall.
Eco
nom
ic Indic
ato
rs
Source: U.S. Census Bureau, unpublished Current Populati on Survey data
Median durati on has improved more than the mean durati on in NH
0.0
5.0
10.0
15.0
20.0
25.0
30.0
35.0
40.0
2007
Q1
2007
Q2
2007
Q3
2007
Q4
2008
Q1
2008
Q2
2008
Q3
2008
Q4
2009
Q1
2009
Q2
2009
Q3
2009
Q4
2010
Q1
2010
Q2
2010
Q3
2010
Q4
2011
Q1
2011
Q2
2011
Q3
2011
Q4
2012
Q1
2012
Q2
2012
Q3
2012
Q4
2013
Q1
2013
Q2
2013
Q3
2013
Q4
2014
Q1
2014
Q2
2014
Q3
2014
Q4
Dur
atio
n of
Une
mpl
oym
ent (
Wee
ks)
Mean Median
11. This quarterly time series is not seasonally adjusted.
New Hampshire Employment Security, Economic and Labor Market Informati on Bureau • (603) 228-4124 • www.nhes.nh.gov/elmi
2014 In Review: Recovery 15
Source: Business Employment Dynamics, New Hampshire Employment Security
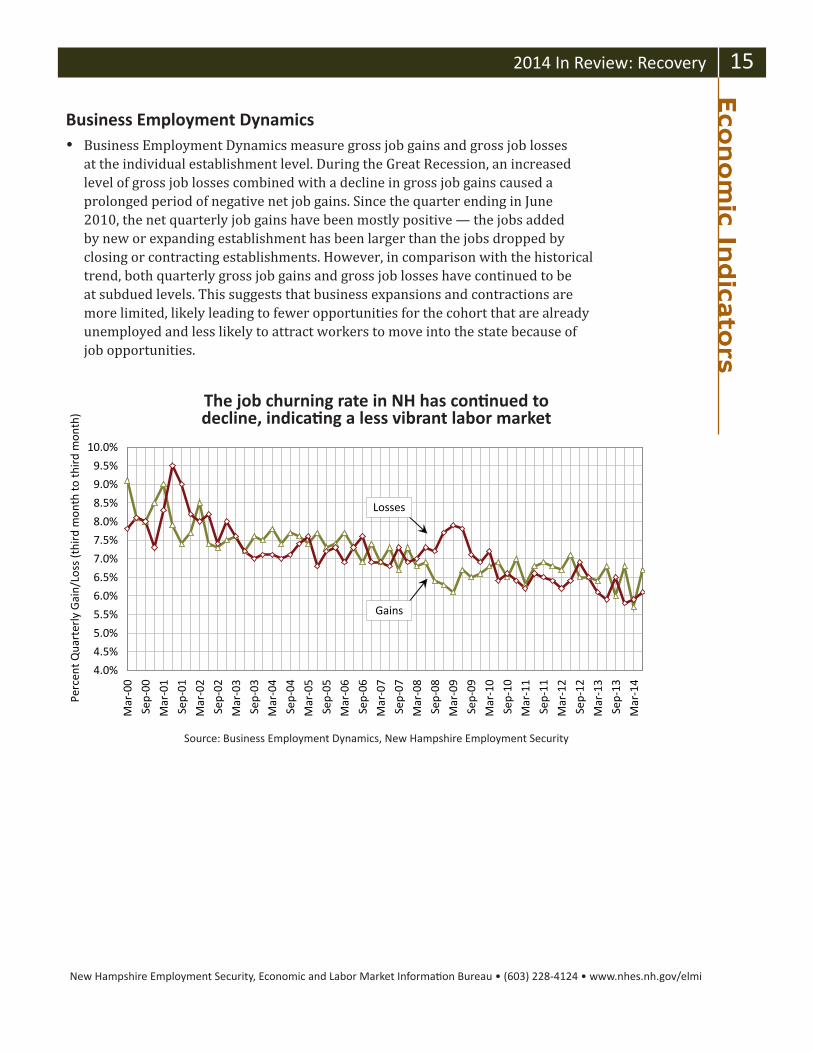
The job churning rate in NH has conti nued to decline, indicati ng a less vibrant labor market
Business Employment Dynamics Business Employment Dynamics measure gross job gains and gross job losses
at the individual establishment level. During the Great Recession, an increased level of gross job losses combined with a decline in gross job gains caused a prolonged period of negative net job gains. Since the quarter ending in June 2010, the net quarterly job gains have been mostly positive — the jobs added by new or expanding establishment has been larger than the jobs dropped by closing or contracting establishments. However, in comparison with the historical trend, both quarterly gross job gains and gross job losses have continued to be at subdued levels. This suggests that business expansions and contractions are more limited, likely leading to fewer opportunities for the cohort that are already unemployed and less likely to attract workers to move into the state because of job opportunities.
Eco
nom
ic Indica
tors
4.0%
4.5%
5.0%
5.5%
6.0%
6.5%
7.0%
7.5%
8.0%
8.5%
9.0%
9.5%
10.0%
Mar
-00
Sep-
00
Mar
-01
Sep-
01
Mar
-02
Sep-
02
Mar
-03
Sep-
03
Mar
-04
Sep-
04
Mar
-05
Sep-
05
Mar
-06
Sep-
06
Mar
-07
Sep-
07
Mar
-08
Sep-
08
Mar
-09
Sep-
09
Mar
-10
Sep-
10
Mar
-11
Sep-
11
Mar
-12
Sep-
12
Mar
-13
Sep-
13
Mar
-14
Perc
ent Q
uart
erly
Gai
n/Lo
ss (t
hird
mon
th to
thir
d m
onth
)
Losses
Gains

New Hampshire Employment Security, Economic and Labor Market Informati on Bureau • (603) 228-4124 • www.nhes.nh.gov/elmi
16 2014 In Review: Recovery
Annual Time SeriesPopulati on
The U.S. Census Bureau estimate of New Hampshire’s resident population was 1,326,813 as of July 1, 2014. From 2013 to 2014, New Hampshire’s population increased by 4,197 persons, which equals a 0.32 percent increase. The population growth in New Hampshire seems to have stagnated since 2004, and the over-the-year population growth has been slower than the nation. However, population growth is trending up.
Eco
nom
ic Indic
ato
rs
Source: U.S. Census Bureau, Annual Populati on data set
Since 2004, New Hampshire’s populati on growth has been slower than the nati on
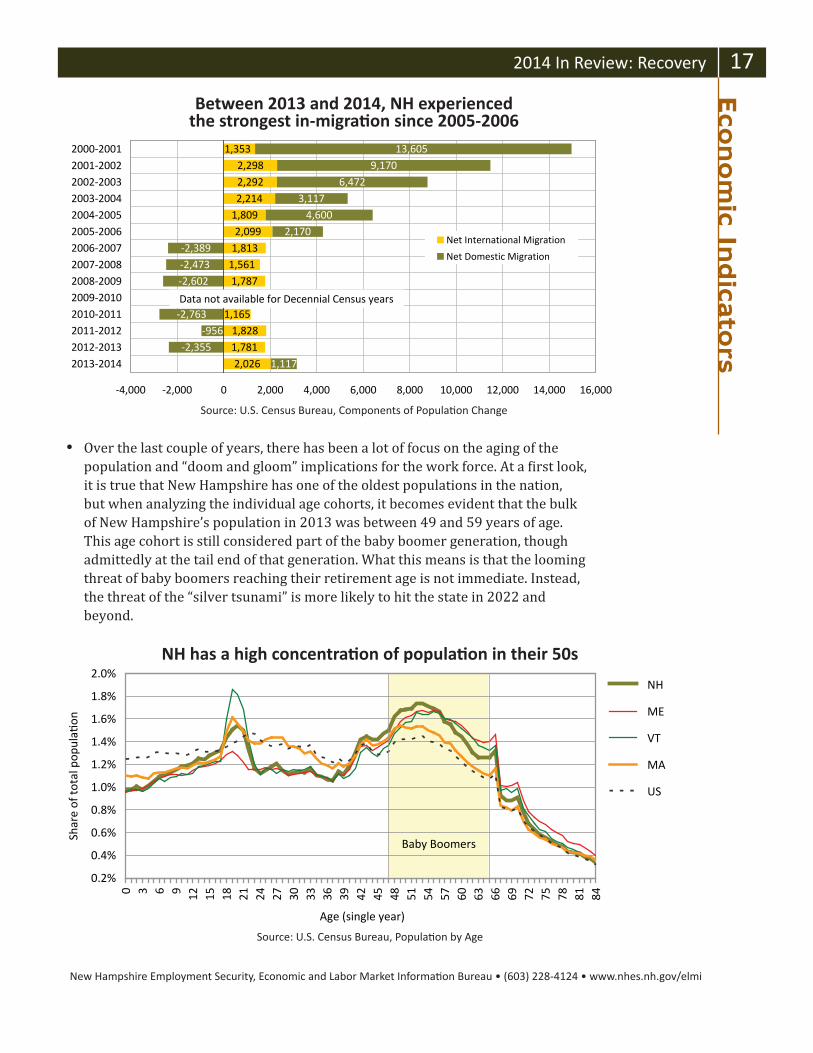
The slowdown in population growth has been partly due to fewer births and partly due to less positive net migration. Beginning in 2006-2007, net migration started to be negative over-the-year. Net migration is the sum of domestic migration and international migration. 12 Net international migration has been positive in all years since 2000-2001. Between 2013 and 2014, net domestic migration was positive for the first time since 2005-2006, leading to the strongest population growth in seven years.
0
200,000
400,000
600,000
800,000
1,000,000
1,200,000
1,400,000
1954
1957
1960
1963
1966
1969
1972
1975
1978
1981
1984
1987
1990
1993
1996
1999
2002
2005
2008
2011
2014
Popu
latio
n
0.0%
0.5%
1.0%
1.5%
2.0%
2.5%
3.0%
3.5%
Perc
ent c
hang
e
NH Population(left axis)
Over-the-yeargrowth NH(right axis)
Over-the-yeargrowth US(right axis)
12. Net domestic migration is the sum of persons moving into and out of New Hampshire from or to other states, while net international migration is the sum of persons moving into and out of New Hampshire from or to other countries. Net international migration includes both native- and foreign-born populations.
New Hampshire Employment Security, Economic and Labor Market Informati on Bureau • (603) 228-4124 • www.nhes.nh.gov/elmi
2014 In Review: Recovery 17
Over the last couple of years, there has been a lot of focus on the aging of the population and “doom and gloom” implications for the work force. At a first look, it is true that New Hampshire has one of the oldest populations in the nation, but when analyzing the individual age cohorts, it becomes evident that the bulk of New Hampshire’s population in 2013 was between 49 and 59 years of age. This age cohort is still considered part of the baby boomer generation, though admittedly at the tail end of that generation. What this means is that the looming threat of baby boomers reaching their retirement age is not immediate. Instead, the threat of the “silver tsunami” is more likely to hit the state in 2022 and beyond.
Source: U.S. Census Bureau, Populati on by Age
NH has a high concentrati on of populati on in their 50s
Eco
nom
ic Indica
tors
Source: U.S. Census Bureau, Components of Populati on Change
Between 2013 and 2014, NH experienced the strongest in-migrati on since 2005-2006
0.2%
0.4%
0.6%
0.8%
1.0%
1.2%
1.4%
1.6%
1.8%
2.0%
0 3 6 9 12 15 18 21 24 27 30 33 36 39 42 45 48 51 54 57 60 63 66 69 72 75 78 81 84
Age (single year)
Shar
e of
tota
l pop
ula
on
NH
ME
VT
MA
US
Baby Boomers
2,0261,7811,828
1,165
1,7871,5611,8132,099
1,8092,2142,2922,298
1,353
1,117-2,355
-956-2,763
-2,602-2,473-2,389
2,1704,600
3,1176,472
9,17013,605
-4,000 -2,000 0 2,000 4,000 6,000 8,000 10,000 12,000 14,000 16,000
2013-20142012-20132011-20122010-20112009-20102008-20092007-20082006-20072005-20062004-20052003-20042002-20032001-20022000-2001
Net International Migration
Net Domestic Migration
Data not available for Decennial Census years

New Hampshire Employment Security, Economic and Labor Market Informati on Bureau • (603) 228-4124 • www.nhes.nh.gov/elmi
18 2014 In Review: Recovery
New Hampshire Median Age
There are variations in median age by community throughout New Hampshire. Rural areas tend to be older than urban and more southern locations. Exceptions are towns where a college is located, which will push the median age lower. Also, on the older end of the scale, towns with higher average housing values, especially along New Hampshire’s seacoast, seem to push the median age up.
Some New Hampshire industry sectors have a very high concentration of older workers already and will have to prepare for the potential retirement of the experienced older workforce, sooner than later. Apprenticeship and on-the-job training should be explored as possible solutions to solve this problem of transferring skills, knowledge and experience to the next generation of workers.
Data Source: U.S. Census Bureau, 2009-2013 5-Year American Community Survey.
Eco
nom
ic Indic
ato
rs

New Hampshire Employment Security, Economic and Labor Market Informati on Bureau • (603) 228-4124 • www.nhes.nh.gov/elmi
2014 In Review: Recovery 19
ConclusionNew Hampshire’s economy has recovered the jobs lost during the Great Recession but the state’s current reality is that there is still some slack in the labor market. Slow projected job growth is not likely to absorb this slack in the near future. But an aging population will continue to drive the need for replacement workers.
The question phrased at the beginning was Are We There Yet? Yes, we are there. But as always, there is a lot more work to be done realigning the skills of the workers with the jobs of the future. That is the never ending story in an ever changing labor market.
Eco
nom
ic Indica
tors

New Hampshire Employment Security, Economic and Labor Market Informati on Bureau • (603) 228-4124 • www.nhes.nh.gov/elmi
20 2014 In Review: Recovery U
nem
plo
ym
ent
in N
ew
Ham
psh
ire Unemployment in New Hampshire
Becoming unemployed can be devastating for an individual. An unemployed person faces not only loss of income, but loss of routine, loss of self-respect, and even loss of self-identity. Becoming re-employed quickly is important, not only for resuming income, but also for an individual’s sense of self-worth. For some, however, re-employment has been elusive.
From 2001 through 2008 the number of unemployed persons (not seasonally adjusted) ranged roughly between 23,000 and 33,000 each month. Unemployment spiked to just over 54,000 in early 2010, then declined to about 40,000 mid-year. Early in 2013, the number of unemployed persons began to decline again. In October 2014, an estimated 26,700 New Hampshire residents were unemployed, the lowest monthly number of unemployed residents in New Hampshire since May 2008.
Note: Data for January through December 2014 are preliminary esti mates. Data for January 2001 through December 2013 refl ect revisions made during the benchmarking process.
Source: Economic and Labor Market Informati on Bureau, New Hampshire Employment Security
Unemployment, January 2001 - December 2014, Not Seasonally Adjusted
05,000
10,00015,00020,00025,00030,00035,00040,00045,00050,00055,00060,000
Jan
2001 Oct
Jul 2
002
Apr
Jan
2004 Oct
Jul 2
005
Apr
Jan
2007 Oct
Jul 2
008
Apr
Jan
2010 Oct
Jul 2
011
Apr
Jan
2013 Oct
Jul 2
014
New Hampshire 12 per. Mov. Avg. (New Hampshire)
New Hampshire Employment Security, Economic and Labor Market Informati on Bureau • (603) 228-4124 • www.nhes.nh.gov/elmi
2014 In Review: Recovery 21
Source: U.S. Census Bureau, unpublished Current Populati on Survey data
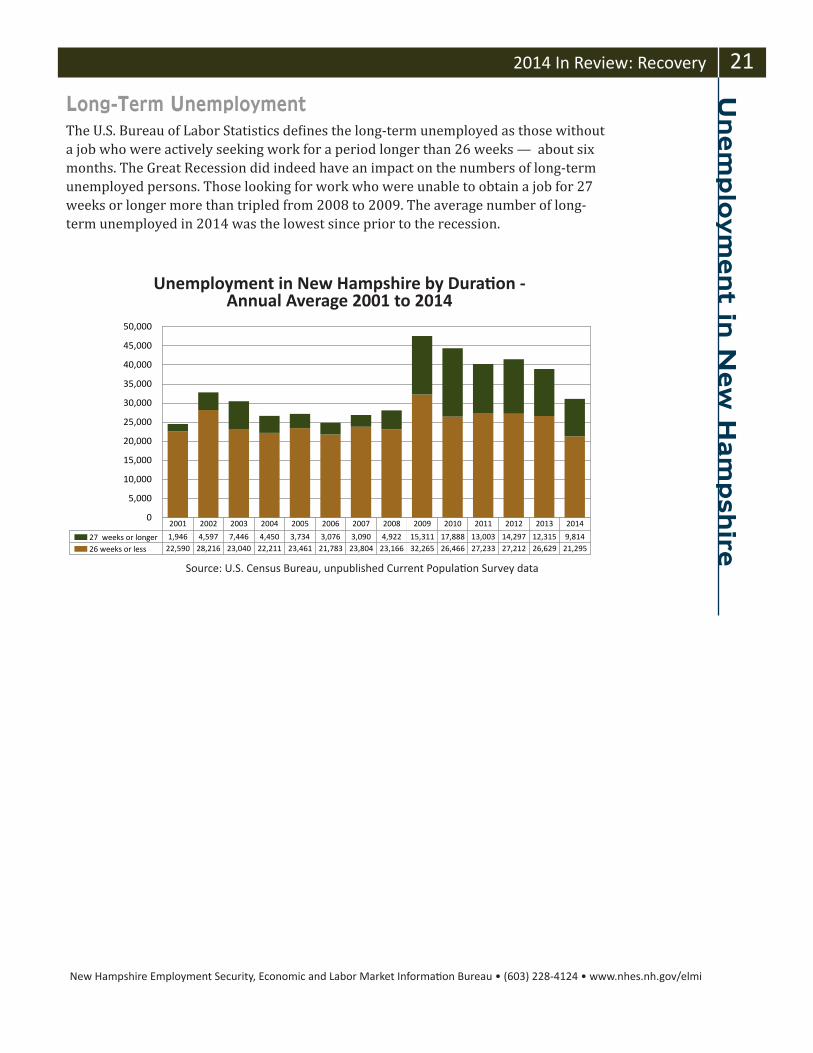
Long-Term Unemployment The U.S. Bureau of Labor Statistics defines the long-term unemployed as those without a job who were actively seeking work for a period longer than 26 weeks — about six months. The Great Recession did indeed have an impact on the numbers of long-term unemployed persons. Those looking for work who were unable to obtain a job for 27 weeks or longer more than tripled from 2008 to 2009. The average number of long-term unemployed in 2014 was the lowest since prior to the recession.
Unemployment in New Hampshire by Durati on - Annual Average 2001 to 2014
0
5,000
10,000
15,000
20,000
25,000
30,000
35,000
40,000
45,000
50,000
27 weeks or longer 1,946 4,597 7,446 4,450 3,734 3,076 3,090 4,922 15,311 17,888 13,003 14,297 12,315 9,814
26 weeks or less 22,590 28,216 23,040 22,211 23,461 21,783 23,804 23,166 32,265 26,466 27,233 27,212 26,629 21,295
2001 2002 2003 2004 2005 2006 2007 2008 2009 2010 2011 2012 2013 2014
Unem
plo
ym
ent in
New
Ham
psh
ire
New Hampshire Employment Security, Economic and Labor Market Informati on Bureau • (603) 228-4124 • www.nhes.nh.gov/elmi
22 2014 In Review: Recovery
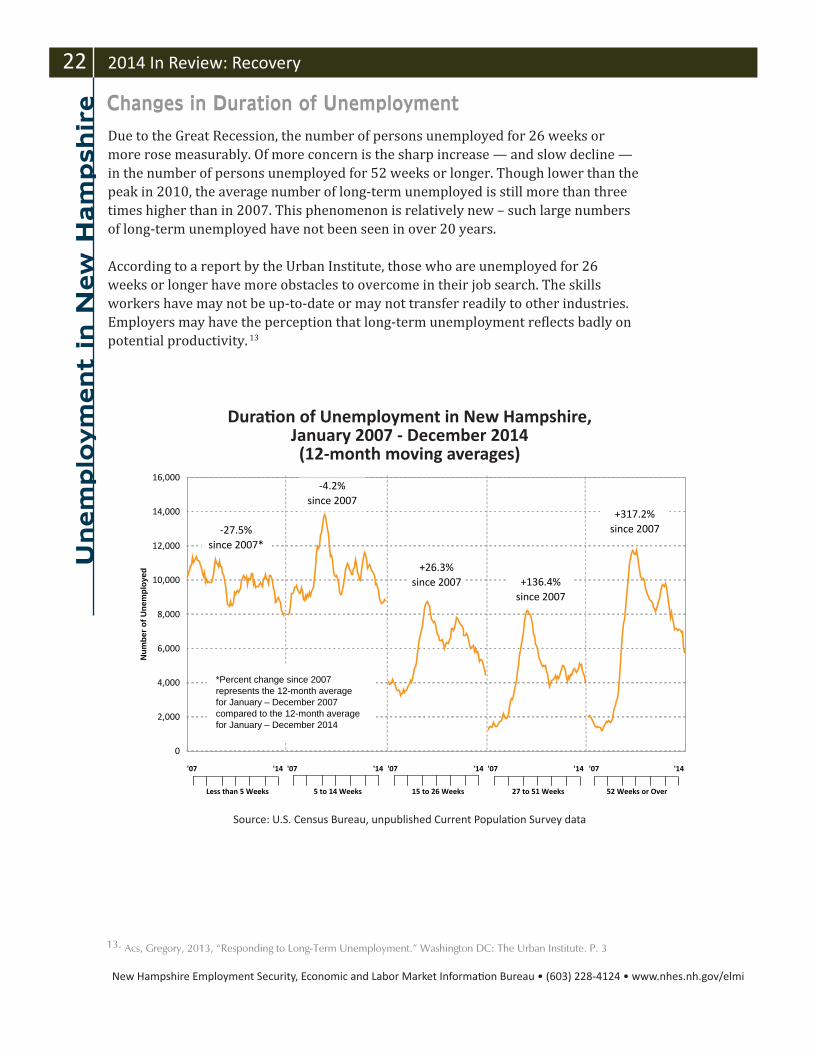
Due to the Great Recession, the number of persons unemployed for 26 weeks or more rose measurably. Of more concern is the sharp increase — and slow decline — in the number of persons unemployed for 52 weeks or longer. Though lower than the peak in 2010, the average number of long-term unemployed is still more than three times higher than in 2007. This phenomenon is relatively new – such large numbers of long-term unemployed have not been seen in over 20 years.
According to a report by the Urban Institute, those who are unemployed for 26 weeks or longer have more obstacles to overcome in their job search. The skills workers have may not be up-to-date or may not transfer readily to other industries. Employers may have the perception that long-term unemployment reflects badly on potential productivity. 13
13. Acs, Gregory, 2013, “Responding to Long-Term Unemployment.” Washington DC: The Urban Institute. P. 3
Source: U.S. Census Bureau, unpublished Current Populati on Survey data
Durati on of Unemployment in New Hampshire, January 2007 - December 2014 (12-month moving averages)
Changes in Duration of UnemploymentU
nem
plo
ym
ent
in N
ew
Ham
psh
ire
0
2,000
4,000
6,000
8,000
10,000
12,000
14,000
16,000
'07 '14 '07 '14 '07 '14 '07 '14 '07 '14
Less than 5 Weeks 5 to 14 Weeks 15 to 26 Weeks 27 to 51 Weeks 52 Weeks or Over
Num
ber o
f Une
mpl
oyed
-4.2% since 2007
+26.3% since 2007 +136.4%
since 2007
+317.2% since 2007-27.5%
since 2007*
*Percent change since 2007 represents the 12-month average for January – December 2007 compared to the 12-month average for January – December 2014
New Hampshire Employment Security, Economic and Labor Market Informati on Bureau • (603) 228-4124 • www.nhes.nh.gov/elmi
2014 In Review: Recovery 23U
nem
plo
ym
ent in
New
Ham
psh
ire
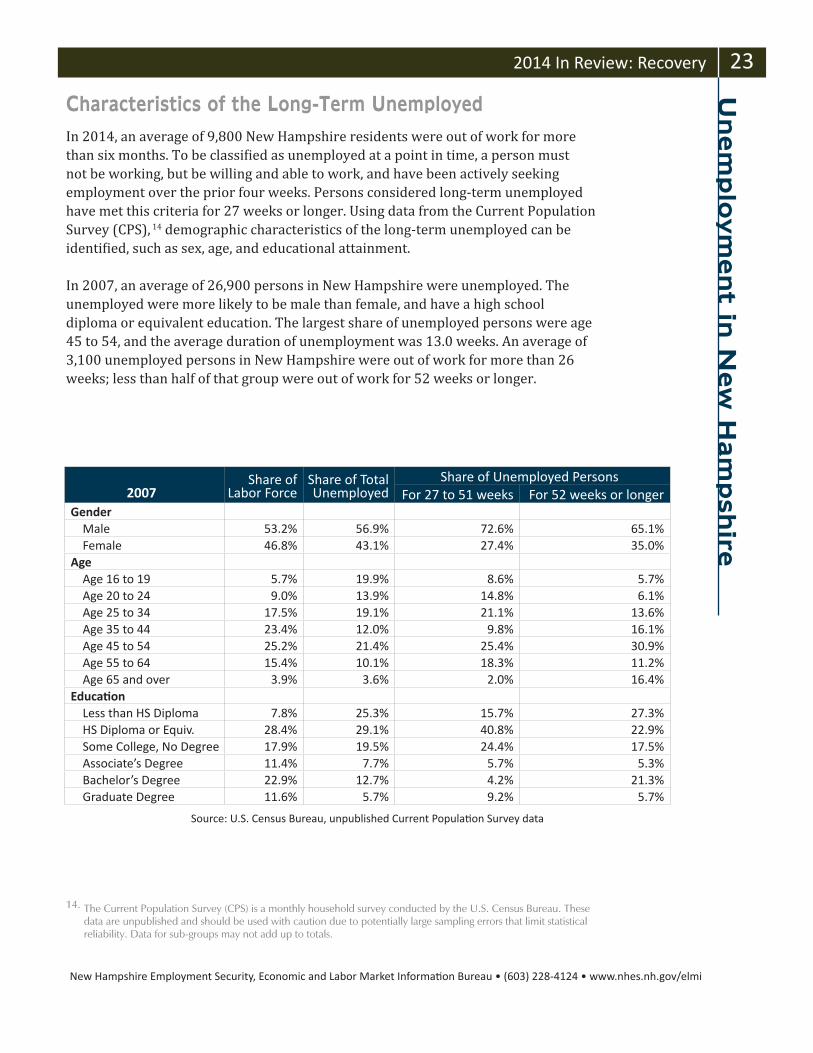
In 2014, an average of 9,800 New Hampshire residents were out of work for more than six months. To be classified as unemployed at a point in time, a person must not be working, but be willing and able to work, and have been actively seeking employment over the prior four weeks. Persons considered long-term unemployed have met this criteria for 27 weeks or longer. Using data from the Current Population Survey (CPS), 14 demographic characteristics of the long-term unemployed can be identified, such as sex, age, and educational attainment.
In 2007, an average of 26,900 persons in New Hampshire were unemployed. The unemployed were more likely to be male than female, and have a high school diploma or equivalent education. The largest share of unemployed persons were age 45 to 54, and the average duration of unemployment was 13.0 weeks. An average of 3,100 unemployed persons in New Hampshire were out of work for more than 26 weeks; less than half of that group were out of work for 52 weeks or longer.
Source: U.S. Census Bureau, unpublished Current Populati on Survey data
14. The Current Population Survey (CPS) is a monthly household survey conducted by the U.S. Census Bureau. These data are unpublished and should be used with caution due to potentially large sampling errors that limit statistical reliability. Data for sub-groups may not add up to totals.
2007Share of
Labor ForceShare of Total Unemployed
Share of Unemployed PersonsFor 27 to 51 weeks For 52 weeks or longer
GenderMale 53.2% 56.9% 72.6% 65.1%Female 46.8% 43.1% 27.4% 35.0%
AgeAge 16 to 19 5.7% 19.9% 8.6% 5.7%Age 20 to 24 9.0% 13.9% 14.8% 6.1%Age 25 to 34 17.5% 19.1% 21.1% 13.6%Age 35 to 44 23.4% 12.0% 9.8% 16.1%Age 45 to 54 25.2% 21.4% 25.4% 30.9%Age 55 to 64 15.4% 10.1% 18.3% 11.2%Age 65 and over 3.9% 3.6% 2.0% 16.4%
Educati onLess than HS Diploma 7.8% 25.3% 15.7% 27.3%HS Diploma or Equiv. 28.4% 29.1% 40.8% 22.9%Some College, No Degree 17.9% 19.5% 24.4% 17.5%Associate’s Degree 11.4% 7.7% 5.7% 5.3%Bachelor’s Degree 22.9% 12.7% 4.2% 21.3%Graduate Degree 11.6% 5.7% 9.2% 5.7%
Characteristics of the Long-Term Unemployed
New Hampshire Employment Security, Economic and Labor Market Informati on Bureau • (603) 228-4124 • www.nhes.nh.gov/elmi
24 2014 In Review: Recovery
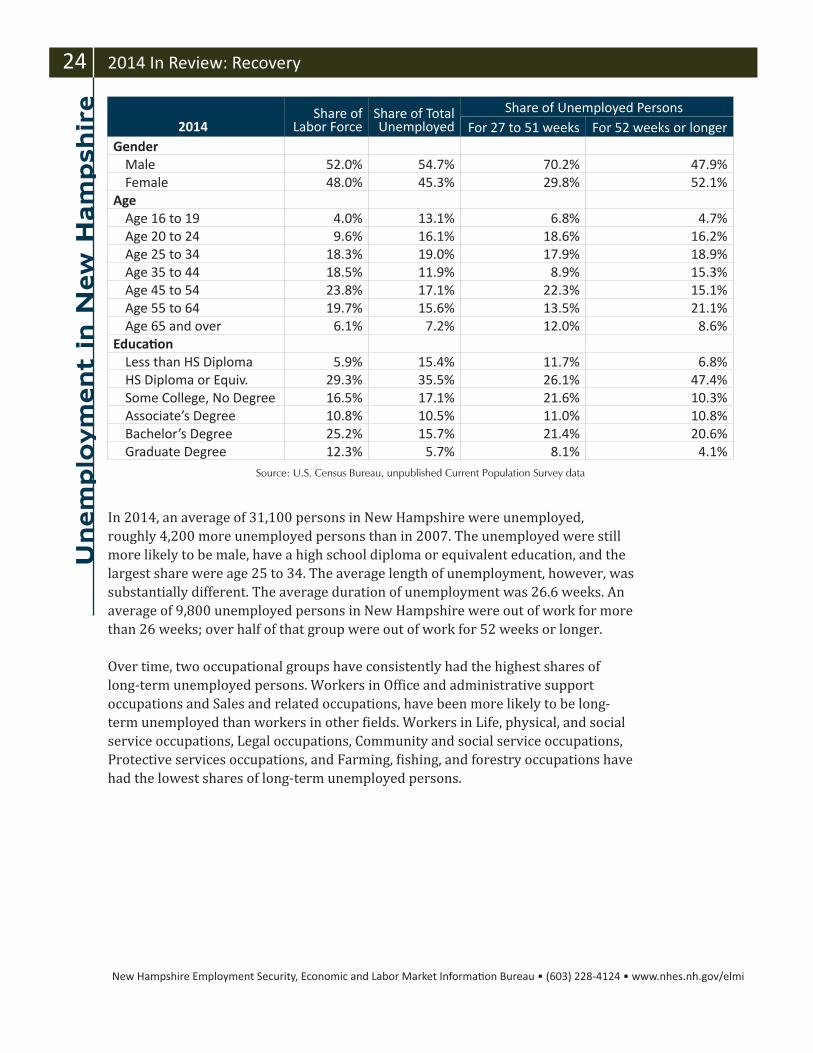
In 2014, an average of 31,100 persons in New Hampshire were unemployed, roughly 4,200 more unemployed persons than in 2007. The unemployed were still more likely to be male, have a high school diploma or equivalent education, and the largest share were age 25 to 34. The average length of unemployment, however, was substantially different. The average duration of unemployment was 26.6 weeks. An average of 9,800 unemployed persons in New Hampshire were out of work for more than 26 weeks; over half of that group were out of work for 52 weeks or longer.
Over time, two occupational groups have consistently had the highest shares of long-term unemployed persons. Workers in Office and administrative support occupations and Sales and related occupations, have been more likely to be long-term unemployed than workers in other fields. Workers in Life, physical, and social service occupations, Legal occupations, Community and social service occupations, Protective services occupations, and Farming, fishing, and forestry occupations have had the lowest shares of long-term unemployed persons.
2014Share of
Labor ForceShare of Total Unemployed
Share of Unemployed PersonsFor 27 to 51 weeks For 52 weeks or longer
GenderMale 52.0% 54.7% 70.2% 47.9%Female 48.0% 45.3% 29.8% 52.1%
AgeAge 16 to 19 4.0% 13.1% 6.8% 4.7%Age 20 to 24 9.6% 16.1% 18.6% 16.2%Age 25 to 34 18.3% 19.0% 17.9% 18.9%Age 35 to 44 18.5% 11.9% 8.9% 15.3%Age 45 to 54 23.8% 17.1% 22.3% 15.1%Age 55 to 64 19.7% 15.6% 13.5% 21.1%Age 65 and over 6.1% 7.2% 12.0% 8.6%
Educati onLess than HS Diploma 5.9% 15.4% 11.7% 6.8%HS Diploma or Equiv. 29.3% 35.5% 26.1% 47.4%Some College, No Degree 16.5% 17.1% 21.6% 10.3%Associate’s Degree 10.8% 10.5% 11.0% 10.8%Bachelor’s Degree 25.2% 15.7% 21.4% 20.6%Graduate Degree 12.3% 5.7% 8.1% 4.1%
Unem
plo
ym
ent
in N
ew
Ham
psh
ire
Source: U.S. Census Bureau, unpublished Current Population Survey data

New Hampshire Employment Security, Economic and Labor Market Informati on Bureau • (603) 228-4124 • www.nhes.nh.gov/elmi
2014 In Review: Recovery 25U
nem
plo
ym
ent in
New
Ham
psh
ire
Occupati onal Group
Long-Term Unemployed Persons by Occupati onal Group as a Percentage of All Persons Unemployed for 27 Weeks or Longer
2007 2008 2009 2010 2011 2012 2013 2014
Management occupati ons 9.8% 6.8% 7.6% 9.7% 10.9% 10.7% 8.0% 5.9%
Business and fi nancial operati ons occupati ons 12.1% 5.9% 5.7% 1.5% 1.3% 2.6% 7.5% 9.0%
Computer and mathemati cal science occupati ons 0.0% 3.1% 1.8% 3.0% 1.8% 2.4% 1.4% 4.2%
Architecture and engineering occupati ons 0.0% 5.0% 0.7% 1.7% 5.3% 2.1% 0.9% 3.2%
Life, physical, and social service occupati ons 0.0% 0.0% 0.0% 0.2% 1.1% 0.3% 1.0% 0.4%
Community and social service occupati ons 3.4% 0.0% 0.2% 0.0% 0.3% 0.3% 0.3% 1.1%
Legal occupati ons 0.0% 2.8% 0.0% 0.4% 0.3% 0.7% 0.0% 0.0%
Educati on, training, and library occupati ons 5.7% 2.9% 3.6% 2.4% 2.2% 2.0% 2.9% 3.3%
Arts, design, entertainment, sports, and media occupati ons 4.7% 0.7% 0.8% 1.5% 3.3% 1.7% 1.8% 0.8%
Healthcare practi ti oner and technical occupati ons 0.0% 0.0% 0.7% 1.8% 0.3% 1.7% 2.6% 4.2%
Healthcare support occupati ons 0.0% 0.0% 1.2% 1.3% 2.6% 2.6% 5.4% 1.5%
Protecti ve service occupati ons 0.0% 0.6% 0.0% 0.0% 1.1% 1.9% 1.0% 1.2%
Food preparati on and serving related occupati ons 5.1% 6.9% 5.7% 7.5% 6.7% 2.0% 4.2% 2.5%
Building and grounds cleaning and maintenance occupati ons 1.3% 4.9% 3.8% 4.7% 5.4% 4.3% 1.7% 6.1%
Personal care and service occupati ons 1.2% 3.1% 1.9% 2.5% 1.4% 1.1% 3.5% 3.5%
Sales and related occupati ons 5.1% 14.9% 10.9% 11.7% 11.5% 14.1% 11.8% 12.8%
Offi ce and administrati ve support occupati ons 12.1% 15.6% 14.4% 14.3% 12.6% 13.8% 12.0% 10.7%
Farming, fi shing, and forestry occupati ons 2.9% 0.0% 0.0% 0.8% 1.4% 0.0% 0.0% 0.0%
Constructi on and extracti on occupati ons 5.0% 10.2% 14.4% 15.7% 6.5% 7.3% 7.7% 7.2%
Installati on, maintenance, and repair occupati ons 2.5% 0.8% 2.6% 2.4% 4.1% 2.0% 3.9% 4.2%
Producti on occupati ons 16.8% 7.0% 14.6% 6.1% 6.2% 8.8% 5.6% 5.7%
Transportati on and material moving occupati ons 2.6% 4.4% 4.9% 4.8% 4.2% 7.2% 10.2% 9.4%
In Universe, Met No Conditi ons To Assign 5.1% 3.4% 4.6% 5.6% 9.4% 9.2% 6.9% 3.1%
Source: US Census Bureau, unpublished Current Populati on Survey data
New Hampshire Employment Security, Economic and Labor Market Informati on Bureau • (603) 228-4124 • www.nhes.nh.gov/elmi
26 2014 In Review: Recovery
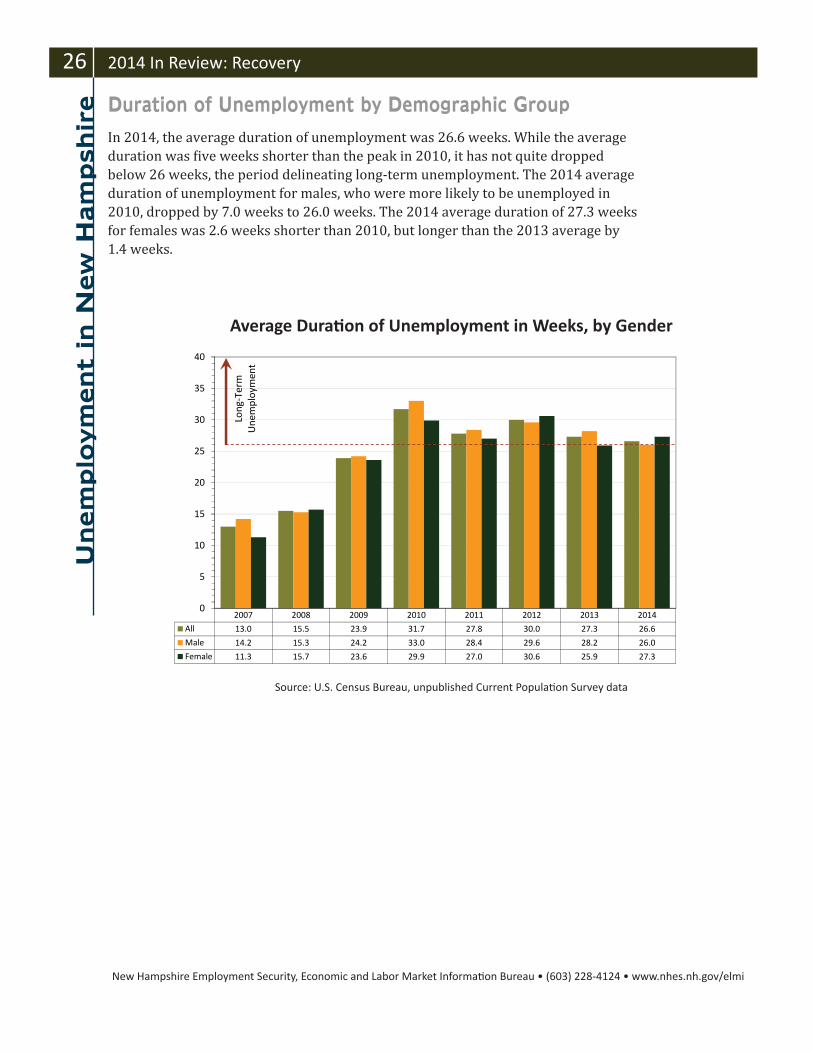
In 2014, the average duration of unemployment was 26.6 weeks. While the average duration was five weeks shorter than the peak in 2010, it has not quite dropped below 26 weeks, the period delineating long-term unemployment. The 2014 average duration of unemployment for males, who were more likely to be unemployed in 2010, dropped by 7.0 weeks to 26.0 weeks. The 2014 average duration of 27.3 weeks for females was 2.6 weeks shorter than 2010, but longer than the 2013 average by 1.4 weeks.
Source: U.S. Census Bureau, unpublished Current Populati on Survey data
Average Durati on of Unemployment in Weeks, by Gender
Duration of Unemployment by Demographic GroupU
nem
plo
ym
ent
in N
ew
Ham
psh
ire
2007 2008 2009 2010 2011 2012 2013 2014
All 13.0 15.5 23.9 31.7 27.8 30.0 27.3 26.6
Male 14.2 15.3 24.2 33.0 28.4 29.6 28.2 26.0
Female 11.3 15.7 23.6 29.9 27.0 30.6 25.9 27.3
0
5
10
15
20
25
30
35
40
Long
-Ter
m
Une
mpl
oym
ent
New Hampshire Employment Security, Economic and Labor Market Informati on Bureau • (603) 228-4124 • www.nhes.nh.gov/elmi
2014 In Review: Recovery 27U
nem
plo
ym
ent in
New
Ham
psh
ire
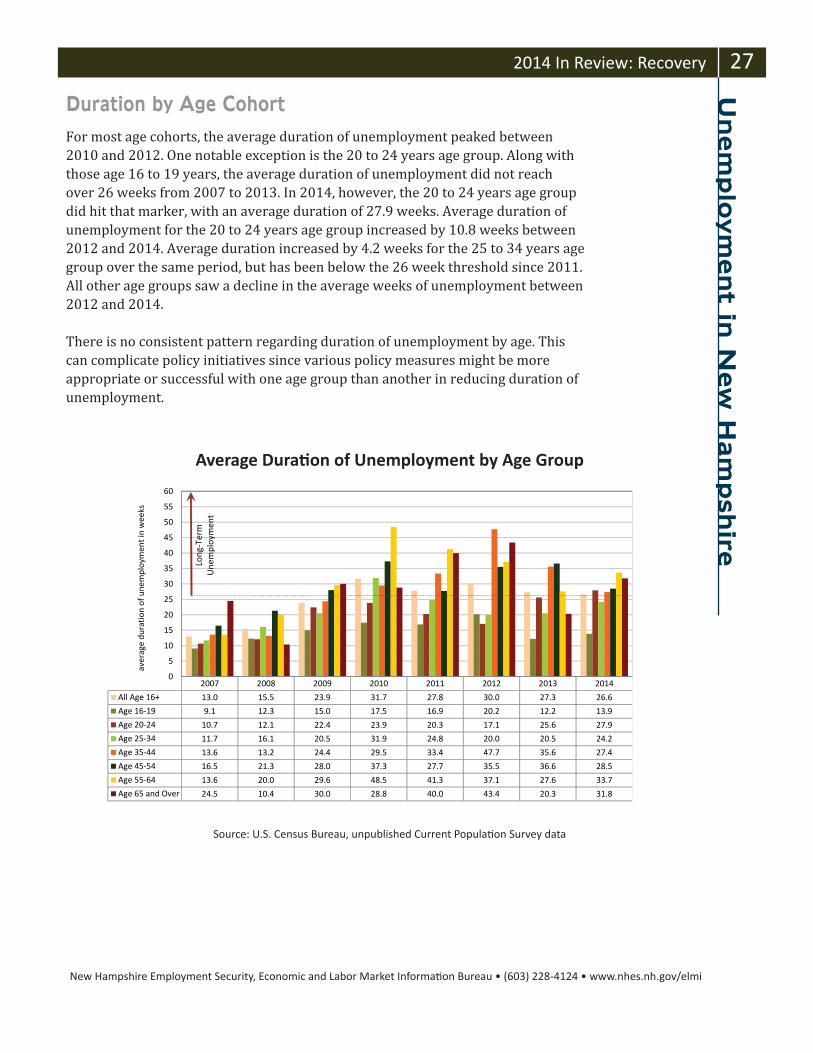
For most age cohorts, the average duration of unemployment peaked between 2010 and 2012. One notable exception is the 20 to 24 years age group. Along with those age 16 to 19 years, the average duration of unemployment did not reach over 26 weeks from 2007 to 2013. In 2014, however, the 20 to 24 years age group did hit that marker, with an average duration of 27.9 weeks. Average duration of unemployment for the 20 to 24 years age group increased by 10.8 weeks between 2012 and 2014. Average duration increased by 4.2 weeks for the 25 to 34 years age group over the same period, but has been below the 26 week threshold since 2011. All other age groups saw a decline in the average weeks of unemployment between 2012 and 2014.
There is no consistent pattern regarding duration of unemployment by age. This can complicate policy initiatives since various policy measures might be more appropriate or successful with one age group than another in reducing duration of unemployment.
Source: U.S. Census Bureau, unpublished Current Populati on Survey data
Average Durati on of Unemployment by Age Group
Duration by Age Cohort
2007 2008 2009 2010 2011 2012 2013 2014
All Age 16+ 13.0 15.5 23.9 31.7 27.8 30.0 27.3 26.6
Age 16-19 9.1 12.3 15.0 17.5 16.9 20.2 12.2 13.9
Age 20-24 10.7 12.1 22.4 23.9 20.3 17.1 25.6 27.9
Age 25-34 11.7 16.1 20.5 31.9 24.8 20.0 20.5 24.2
Age 35-44 13.6 13.2 24.4 29.5 33.4 47.7 35.6 27.4
Age 45-54 16.5 21.3 28.0 37.3 27.7 35.5 36.6 28.5
Age 55-64 13.6 20.0 29.6 48.5 41.3 37.1 27.6 33.7
Age 65 and Over 24.5 10.4 30.0 28.8 40.0 43.4 20.3 31.8
0
5
10
15
20
25
30
35
40
45
50
55
60
aver
age
dura
tion
of u
nem
ploy
men
t in
wee
ks
Long
-Ter
m
Une
mpl
oym
ent
New Hampshire Employment Security, Economic and Labor Market Informati on Bureau • (603) 228-4124 • www.nhes.nh.gov/elmi
28 2014 In Review: Recovery
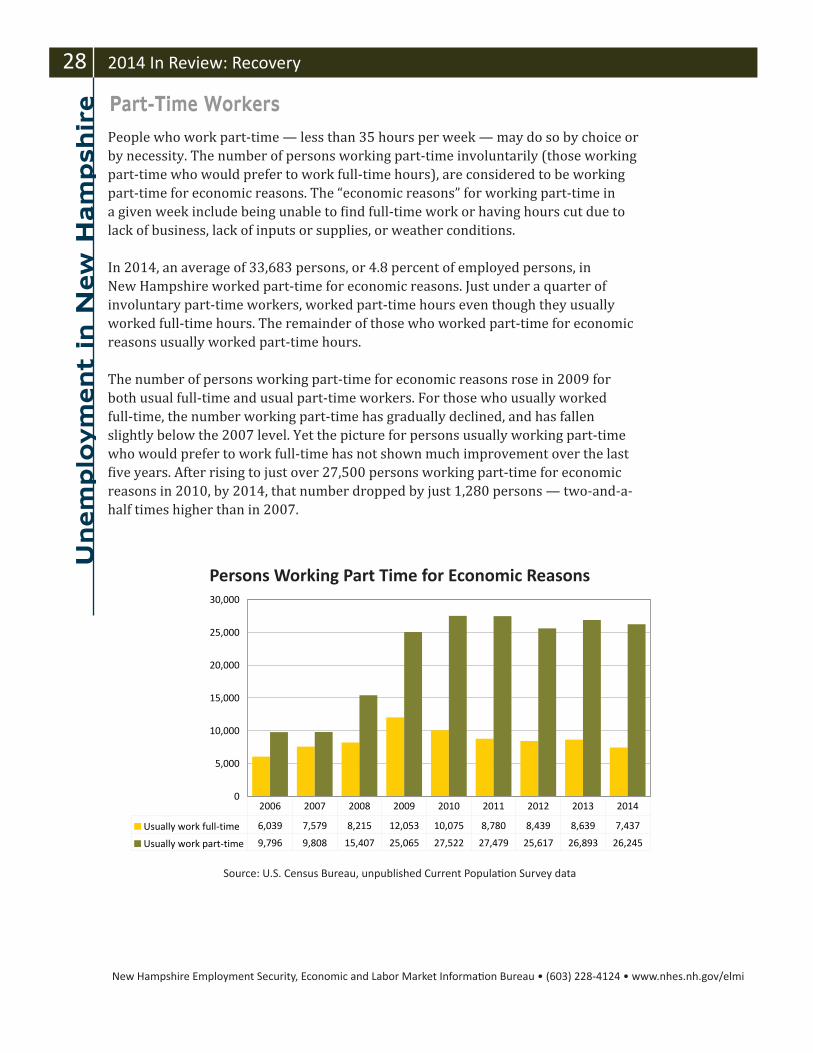
People who work part-time — less than 35 hours per week — may do so by choice or by necessity. The number of persons working part-time involuntarily (those working part-time who would prefer to work full-time hours), are considered to be working part-time for economic reasons. The “economic reasons” for working part-time in a given week include being unable to find full-time work or having hours cut due to lack of business, lack of inputs or supplies, or weather conditions.
In 2014, an average of 33,683 persons, or 4.8 percent of employed persons, in New Hampshire worked part-time for economic reasons. Just under a quarter of involuntary part-time workers, worked part-time hours even though they usually worked full-time hours. The remainder of those who worked part-time for economic reasons usually worked part-time hours.
The number of persons working part-time for economic reasons rose in 2009 for both usual full-time and usual part-time workers. For those who usually worked full-time, the number working part-time has gradually declined, and has fallen slightly below the 2007 level. Yet the picture for persons usually working part-time who would prefer to work full-time has not shown much improvement over the last five years. After rising to just over 27,500 persons working part-time for economic reasons in 2010, by 2014, that number dropped by just 1,280 persons — two-and-a-half times higher than in 2007.
Source: U.S. Census Bureau, unpublished Current Populati on Survey data
Persons Working Part Time for Economic Reasons
Part-Time WorkersU
nem
plo
ym
ent
in N
ew
Ham
psh
ire
0
5,000
10,000
15,000
20,000
25,000
30,000
Usually work full-time 6,039 7,579 8,215 12,053 10,075 8,780 8,439 8,639 7,437
Usually work part-time 9,796 9,808 15,407 25,065 27,522 27,479 25,617 26,893 26,245
2006 2007 2008 2009 2010 2011 2012 2013 2014

New Hampshire Employment Security, Economic and Labor Market Informati on Bureau • (603) 228-4124 • www.nhes.nh.gov/elmi
2014 In Review: Recovery 29U
nem
plo
ym
ent in
New
Ham
psh
ire
The number of females working part-time for economic reasons is usually higher than the number of males. In 2008 and 2009, the number of males working part-time for economic reasons was higher than the number of females. The number of males has declined gradually since 2009, while the number of females has stayed roughly the same, averaging about 18,000 annually.
Source: U.S. Census Bureau, unpublished Current Populati on Survey data
Persons working part-ti me for economic reasons by gender
0
5,000
10,000
15,000
20,000
25,000
Males 7,587 8,852 13,024 19,267 18,462 17,064 17,097 15,849 15,570
Females 8,247 8,536 10,598 17,850 19,134 19,195 16,958 19,683 18,112
2006 2007 2008 2009 2010 2011 2012 2013 2014
Demographics of Involuntary Part-Time Workers
New Hampshire Employment Security, Economic and Labor Market Informati on Bureau • (603) 228-4124 • www.nhes.nh.gov/elmi
30 2014 In Review: Recovery
Source: U.S. Census Bureau, unpublished Current Populati on Survey data
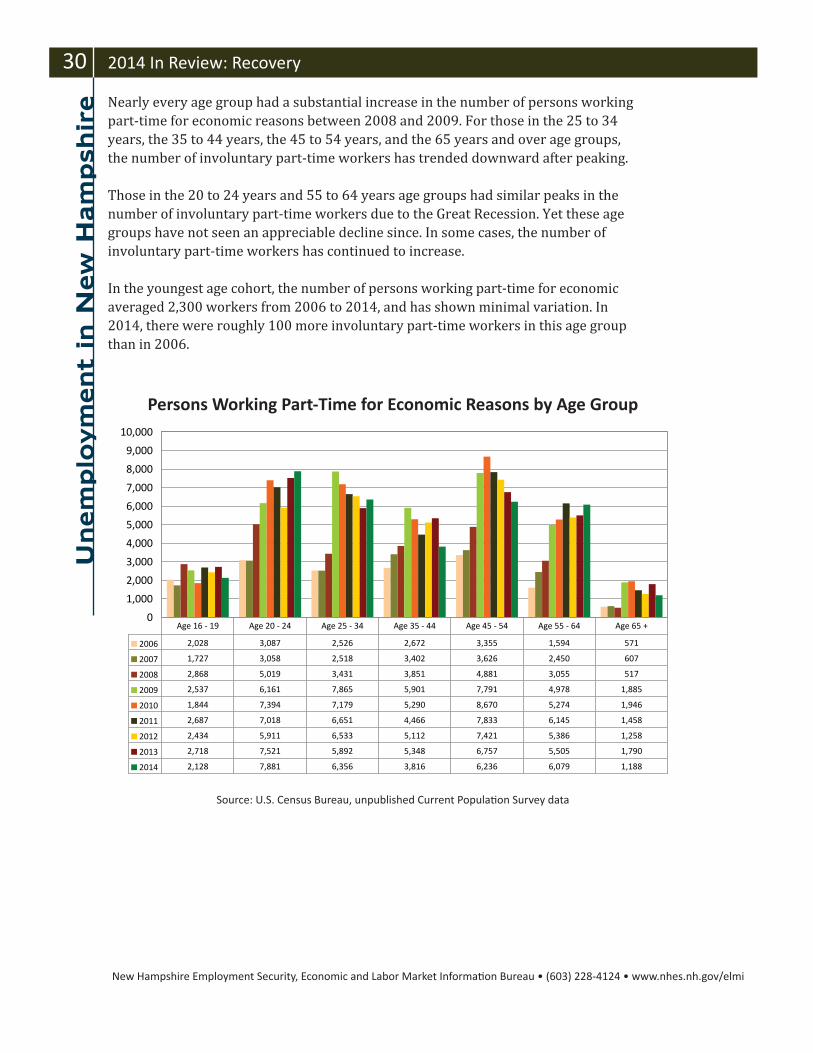
Persons Working Part-Time for Economic Reasons by Age Group
Unem
plo
ym
ent
in N
ew
Ham
psh
ire
0
1,000
2,000
3,000
4,000
5,000
6,000
7,000
8,000
9,000
10,000
2006 2,028 3,087 2,526 2,672 3,355 1,594 571
2007 1,727 3,058 2,518 3,402 3,626 2,450 607
2008 2,868 5,019 3,431 3,851 4,881 3,055 517
2009 2,537 6,161 7,865 5,901 7,791 4,978 1,885
2010 1,844 7,394 7,179 5,290 8,670 5,274 1,946
2011 2,687 7,018 6,651 4,466 7,833 6,145 1,458
2012 2,434 5,911 6,533 5,112 7,421 5,386 1,258
2013 2,718 7,521 5,892 5,348 6,757 5,505 1,790
2014 2,128 7,881 6,356 3,816 6,236 6,079 1,188
Age 16 - 19 Age 20 - 24 Age 25 - 34 Age 35 - 44 Age 45 - 54 Age 55 - 64 Age 65 +
Nearly every age group had a substantial increase in the number of persons working part-time for economic reasons between 2008 and 2009. For those in the 25 to 34 years, the 35 to 44 years, the 45 to 54 years, and the 65 years and over age groups, the number of involuntary part-time workers has trended downward after peaking.
Those in the 20 to 24 years and 55 to 64 years age groups had similar peaks in the number of involuntary part-time workers due to the Great Recession. Yet these age groups have not seen an appreciable decline since. In some cases, the number of involuntary part-time workers has continued to increase.
In the youngest age cohort, the number of persons working part-time for economic averaged 2,300 workers from 2006 to 2014, and has shown minimal variation. In 2014, there were roughly 100 more involuntary part-time workers in this age group than in 2006.

New Hampshire Employment Security, Economic and Labor Market Informati on Bureau • (603) 228-4124 • www.nhes.nh.gov/elmi
2014 In Review: Recovery 31
The label “discouraged worker” has been used to describe a variety of people who are not working. In terms of a statistical assessment, however, a person must meet a specific set of criteria to be considered discouraged. A person must, at a specific point in time, (1) want a job; (2) have looked for a job in the past year, but not during the latest four weeks; and (3) have been available to work in the past week. Respondents to the Current Population Survey (CPS) who meet these criteria, and who indicate that they believed there was no work available in their line of work or area, that there were no jobs available for which they would qualify, or that they just couldn’t find any work, are classified as discouraged workers. This standard set of criteria helps ensure comparability among the states.
The number of persons meeting these criteria has been very low over time. On average, males were more likely to be discouraged than females.
Discouraged WorkersU
nem
plo
ym
ent in
New
Ham
psh
ire
Number of Persons Meeti ng Criteria as Discouraged
2006 2007 2008 2009 2010 2011 2012 2013 2014
Discouraged Persons, Total 888 918 1,589 2,814 2,683 2,684 2,683 1,584 1,806
Believes No Work is Available in Their Line of Work or Area 257 381 489 1,025 1,360 770 1,190 450 656
Couldn’t Find Any Work 439 371 848 1,400 1,076 1,458 1,177 968 717
Lacks Necessary Schooling/Training 192 94 0 50 94 229 37 0 138
Employers Think Too Young, Or Too Old 0 72 252 304 72 156 279 167 295
Other Types Of Discriminati on 0 0 0 35 80 71 0 0 0
Total Discouraged Persons, Male 498 526 1,155 1,758 1,789 1,464 1,712 1,059 1,158
Total Discouraged Persons, Female 390 392 434 1,056 894 1,219 972 526 648
Source: U.S. Census Bureau, unpublished Current Population Survey data

New Hampshire Employment Security, Economic and Labor Market Informati on Bureau • (603) 228-4124 • www.nhes.nh.gov/elmi
32 2014 In Review: Recovery
The Skills Gap — Fact or Myth? There has been much discussion about the gap between the skills job applicants have and the skills employers need. Skilled job seekers claim they cannot find work, and employers claim they cannot find skilled workers to hire. But there is a great deal of confusion about whether or not a skills gap actually exists, why it may or may not exist, and what can be or should be done to solve the problem.
In a March 2014 New York Times op-ed article, Paul Krugman described the skills gap as “a zombie idea – an idea that should have been killed by evidence, but refuses to die.” 15
There is evidence that supports the perception of a skills gap, yet the evidence does not confirm that a lack of job seeker skills is the sole cause. The existence of a skills gap depends on an individual’s point of view. Employer and job seeker expectations, population, and the educational pipeline all contribute to the perception that job seekers do not have the skills employers desire, and that there are no jobs requiring the skills job seekers possess.
Employer PerceptionsAre employers experiencing a shortage of workers? Anecdotal evidence does support the idea that employers feel there is a lack of available talent. The Manpower Group’s 2014 talent shortage survey showed that 40 percent of surveyed employers in the U.S. and 36 percent of surveyed employers world-wide reported having difficulty filling jobs. Yet the survey also showed that 22 percent of employers around the world who reported difficulty filling jobs are not pursuing strategies to address the problem. 16
Source: Manpower Group, 2013 Talent Shortage Survey Research Results and 2014 Talent Shortage Survey Executi ve Summary
Percent of Employers Reporti ng Diffi culty Filling Jobs
15. Krugman, Paul, “Jobs and Skills and Zombies,” New York Times, March 30,2014.<www.nytimes.com/2014/03/31/opinion/krugman-jobs-and-skills-and-zombies.html?_r=0#>.
16. Manpower Group, 2014 Talent Shortage Survey Executive Summary. <www.manpowergroup.us/campaigns/talent-shortage-2014/assets/pdf/2014_Talent_Shortage_WP_US.pdf>.
The S
kills
Gap —
Fact
or
Myth
?
44%41%
22%19%
14%
52%49%
39% 40%40% 41%
31% 30% 31%34% 34% 35% 36%
2006 2007 2008 2009 2010 2011 2012 2013 2014
US Globally

New Hampshire Employment Security, Economic and Labor Market Informati on Bureau • (603) 228-4124 • www.nhes.nh.gov/elmi
2014 In Review: Recovery 33The S
kills G
ap —
Fact o
r Myth
?What are some of the factors in the disconnect between employer needs and available workers?
Replacing a Retiring Workforce. As incumbent workers reach retirement age, employers are faced with replacing those workers. If the job requires extensive, specific knowledge or a substantial training time, locating applicants who can step directly into the job is less likely. Employers must consider developing strategies to manage expected retirements, such as succession planning, cross-training, recruitment strategies, and in-house training.
Pre-Employment Screening. Many employers require a pre-employment drug screening or criminal background check. Businesses who contract for the federal government, as well as many government positions, may require a security clearance. These pre-employment screenings can present challenges to some job seekers. In the 60 day period between November 14, 2014 to January 12, 2015, out of 11,446 New Hampshire job postings, 543 (4.7 percent) indicated a background check was required; 613 (5.4 percent) indicated a drug test or screening was required. 17
Data from the 2008-2012 Behavioral Health Barometer for New Hampshire show that 7.0 percent of New Hampshire residents age 12 and over were dependent on or abused alcohol, and 3.3 percent were dependent on or abused illicit drugs. Among New Hampshire residents age 21 and over, 7.8 percent reported heavy alcohol use during the past month, higher than the national average of 6.9 percent. 18
Experience as a Proxy for Skills. Employers may have specific hiring preferences for applicants, asking for more years of experience than incumbent workers had at first hire. Some employers make the assumption that workers with more experience have better soft skills, such as communication, teamwork, problem solving, critical thinking, and a professional attitude.
For example, in the 60 day period between November 14, 2014 to January 12, 2015, there were 11,446 New Hampshire job ads posted online. About 38 percent, or 4,297 ads, specified years of experience desired of applicants. 19
17. Labor/Insight ™ (Burning Glass Technologies). Data representing the 60-day period of 11/14/2014 to 1/12/2015 extracted on 1/12/2015.18. Substance Abuse and Mental Health Services Administration. Behavioral Health Barometer: New Hampshire, 2013. HHS Publication No.
SMA-13-4796NH. Rockville, MD: Substance Abuse and Mental Health Services Administration, 2013.19. Labor/Insight ™ (Burning Glass Technologies). Data representing the 60-day period of 11/14/2014 to 1/12/2015 extracted on 1/12/2015.
Experience Specifi edNumber of
Posti ngsShare of Posti ngs
Less than two years of experience 2,181 50.8%
Two to fi ve years of experience 1,638 38.1%
Five to eight years of experience 238 5.5%
Eight or more years of experience 240 5.6%

New Hampshire Employment Security, Economic and Labor Market Informati on Bureau • (603) 228-4124 • www.nhes.nh.gov/elmi
34 2014 In Review: Recovery
Location, Location, Location. Some of the perceived skills gap can be attributed to a “location gap.” Job seekers with the skills desired by an employer may exist, but available job seekers do not reside within commuting distance of the employer. Internet job postings can help employers spread a wider net in the search for applicants with desired skills, allowing them to obtain talent from outside their local area. For that talent to be willing to move within commuting distance of the employer, however, more than a single job may be needed. Employment opportunities for a spouse or significant other, childcare, schools, adequate housing, and other quality of life opportunities are likely to be considered in the decision to accept a position requiring a move.
The S
kills
Gap —
Fact
or
Myth
?
New Hampshire Employment Security, Economic and Labor Market Informati on Bureau • (603) 228-4124 • www.nhes.nh.gov/elmi
2014 In Review: Recovery 35
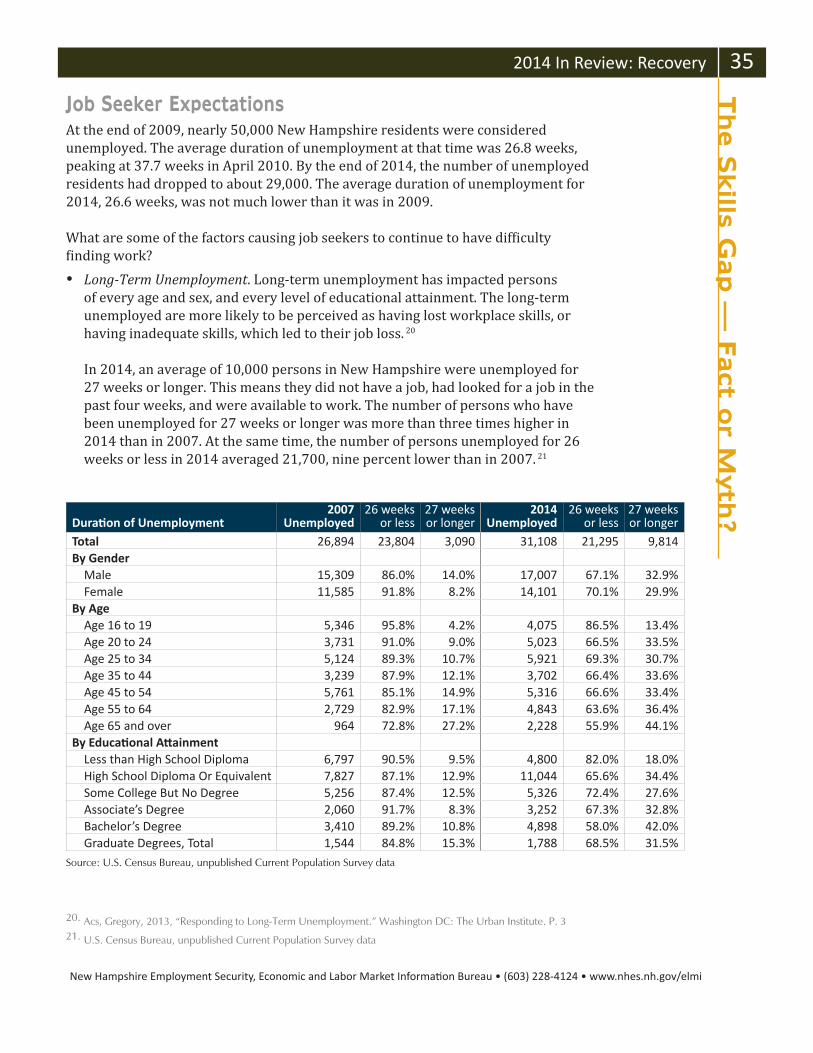
Durati on of Unemployment2007
Unemployed26 weeks
or less27 weeks or longer
2014 Unemployed
26 weeks or less
27 weeks or longer
Total 26,894 23,804 3,090 31,108 21,295 9,814By Gender
Male 15,309 86.0% 14.0% 17,007 67.1% 32.9%Female 11,585 91.8% 8.2% 14,101 70.1% 29.9%
By AgeAge 16 to 19 5,346 95.8% 4.2% 4,075 86.5% 13.4%Age 20 to 24 3,731 91.0% 9.0% 5,023 66.5% 33.5%Age 25 to 34 5,124 89.3% 10.7% 5,921 69.3% 30.7%Age 35 to 44 3,239 87.9% 12.1% 3,702 66.4% 33.6%Age 45 to 54 5,761 85.1% 14.9% 5,316 66.6% 33.4%Age 55 to 64 2,729 82.9% 17.1% 4,843 63.6% 36.4%Age 65 and over 964 72.8% 27.2% 2,228 55.9% 44.1%
By Educati onal Att ainmentLess than High School Diploma 6,797 90.5% 9.5% 4,800 82.0% 18.0%High School Diploma Or Equivalent 7,827 87.1% 12.9% 11,044 65.6% 34.4%Some College But No Degree 5,256 87.4% 12.5% 5,326 72.4% 27.6%Associate’s Degree 2,060 91.7% 8.3% 3,252 67.3% 32.8%Bachelor’s Degree 3,410 89.2% 10.8% 4,898 58.0% 42.0%Graduate Degrees, Total 1,544 84.8% 15.3% 1,788 68.5% 31.5%
Source: U.S. Census Bureau, unpublished Current Population Survey data
The S
kills G
ap —
Fact o
r Myth
?Job Seeker ExpectationsAt the end of 2009, nearly 50,000 New Hampshire residents were considered unemployed. The average duration of unemployment at that time was 26.8 weeks, peaking at 37.7 weeks in April 2010. By the end of 2014, the number of unemployed residents had dropped to about 29,000. The average duration of unemployment for 2014, 26.6 weeks, was not much lower than it was in 2009.
What are some of the factors causing job seekers to continue to have difficulty finding work? Long-Term Unemployment. Long-term unemployment has impacted persons
of every age and sex, and every level of educational attainment. The long-term unemployed are more likely to be perceived as having lost workplace skills, or having inadequate skills, which led to their job loss. 20
In 2014, an average of 10,000 persons in New Hampshire were unemployed for 27 weeks or longer. This means they did not have a job, had looked for a job in the past four weeks, and were available to work. The number of persons who have been unemployed for 27 weeks or longer was more than three times higher in 2014 than in 2007. At the same time, the number of persons unemployed for 26 weeks or less in 2014 averaged 21,700, nine percent lower than in 2007. 21
20. Acs, Gregory, 2013, “Responding to Long-Term Unemployment.” Washington DC: The Urban Institute. P. 321. U.S. Census Bureau, unpublished Current Population Survey data
New Hampshire Employment Security, Economic and Labor Market Informati on Bureau • (603) 228-4124 • www.nhes.nh.gov/elmi
36 2014 In Review: Recovery The S
kills
Gap —
Fact
or
Myth
?
22. WorkReadyNH is an initiative of the Community College System of New Hampshire, the Office of the Governor, the NH Department of Resources and Economic Development, the NH Department of Employment Security and the Department of Labor in partnership with NH Works. For more information, go to <www.ccsnh.edu/workforce-training/workready-nh>.
23. Offered by the Office of Workforce Opportunity through its contracted workforce provider, Southern New Hampshire Services, Inc. (SNHS). For more information, go to <www.nhworks.org/uploads/2014-OJT-QA-flyer.pdf>.
24. The Return to Work initiative is a voluntary program to provide a structured, supervised training opportunity to NH unemployed claimants while continuing to collect unemployment compensation. For more information, go to <www.nhes.nh.gov/nhworking/return/index.htm>.
25. Hires are defined as persons hired in one quarter who worked for the same firm throughout the next quarter. Includes both new hires and recall hires. Average monthly earnings do not consider hours worked.
Job Search Method. Job seekers may be approaching their job search using a limited scope, such as only searching for job openings online. While the Internet offers endless web sites with career and job search advice, professional and social networking, or job postings, it is not the only path to finding a job. Not all jobs are not posted online, and not all employers utilize social media or networking sites when looking for applicants. Professional networking groups, personal recommendations, organizations or associations, headhunters, and alumni newsletters are other avenues for job seekers to gain an inside track on job opportunities.
Skill Upgrades Needed. Some unemployed persons actually may not have the specific technical skills needed by expanding or hiring companies, even though they may have many years of experience in the occupation. Public workforce programs are ideally suited to help those needing additional or updated skills. In New Hampshire, Work Ready NH, 22 On-the-Job Training placements, 23 Return to Work, 24 and apprenticeship training are some of the training programs available to assist job seekers with skill upgrades.
Wage Rates. Unemployed persons actively seeking work may have expectations of being offered a wage similar to that of a lost job. However, new hires are unlikely to be offered the same wage as incumbent workers. In 2013, the estimated average monthly income needed, before taxes, for a family of two adults and two children in New Hampshire was $3,492. Yet only 15 percent of hires 25 in 2013 had average monthly earnings at or above the estimated income needs for a four-person family.
New Hampshire Statewide 1 Adult1 Adult,1 Child
1 Adult,2 Children
1 Adult,3 Children 2 Adults
2 Adults,1 Child
2 Adults,2 Children
2 Adults,3 Children
Esti mated required monthly income aft er taxes $1,414 $3,109 $3,944 $5,056 $2,190 $2,736 $2,942 $3,479 Esti mated required monthly income before taxes $1,678 $3,690 $4,681 $6,001 $2,599 $3,248 $3,492 $4,129
Source: Living Wage Calculator, livingwage.mit.edu. ©2015, Dr. Amy K. Glasmeier and the Massachusett s Insti tute of Technology
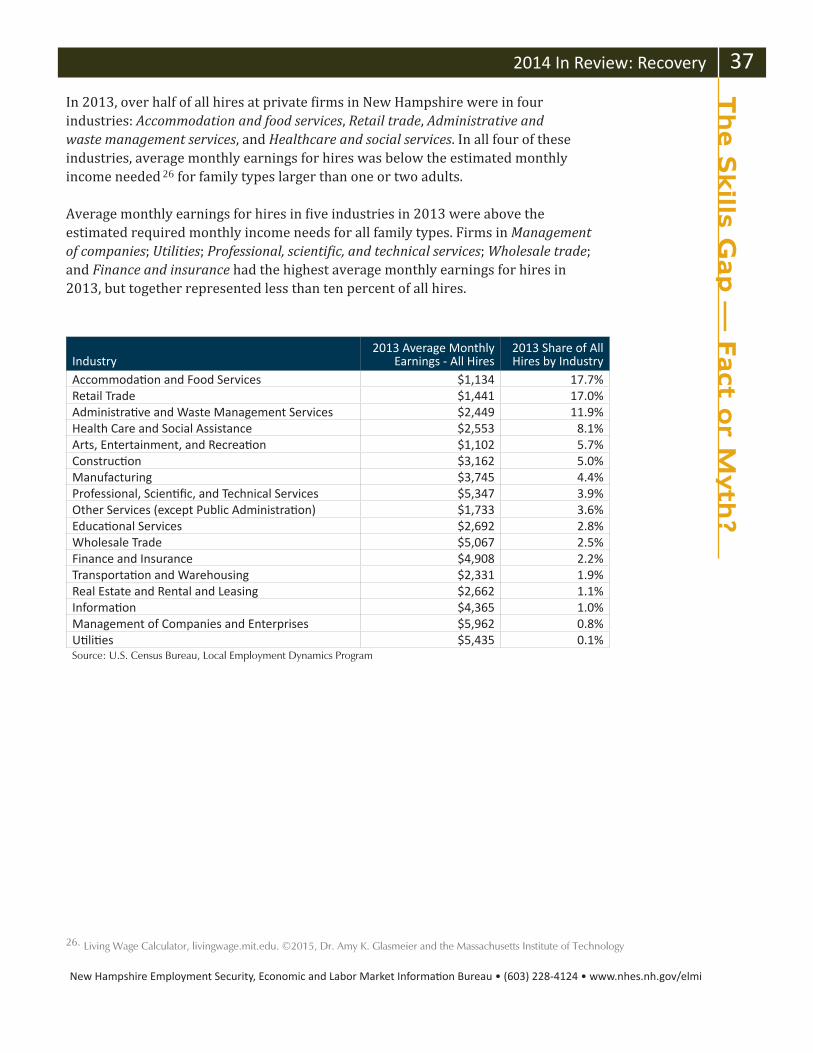
New Hampshire Employment Security, Economic and Labor Market Informati on Bureau • (603) 228-4124 • www.nhes.nh.gov/elmi
2014 In Review: Recovery 37
Industry2013 Average Monthly
Earnings - All Hires2013 Share of All Hires by Industry
Accommodati on and Food Services $1,134 17.7%Retail Trade $1,441 17.0%Administrati ve and Waste Management Services $2,449 11.9%Health Care and Social Assistance $2,553 8.1%Arts, Entertainment, and Recreati on $1,102 5.7%Constructi on $3,162 5.0%Manufacturing $3,745 4.4%Professional, Scienti fi c, and Technical Services $5,347 3.9%Other Services (except Public Administrati on) $1,733 3.6%Educati onal Services $2,692 2.8%Wholesale Trade $5,067 2.5%Finance and Insurance $4,908 2.2%Transportati on and Warehousing $2,331 1.9%Real Estate and Rental and Leasing $2,662 1.1%Informati on $4,365 1.0%Management of Companies and Enterprises $5,962 0.8%Uti liti es $5,435 0.1%Source: U.S. Census Bureau, Local Employment Dynamics Program
The S
kills G
ap —
Fact o
r Myth
?In 2013, over half of all hires at private firms in New Hampshire were in four industries: Accommodation and food services, Retail trade, Administrative and waste management services, and Healthcare and social services. In all four of these industries, average monthly earnings for hires was below the estimated monthly income needed 26 for family types larger than one or two adults.
Average monthly earnings for hires in five industries in 2013 were above the estimated required monthly income needs for all family types. Firms in Management of companies; Utilities; Professional, scientific, and technical services; Wholesale trade; and Finance and insurance had the highest average monthly earnings for hires in 2013, but together represented less than ten percent of all hires.
26. Living Wage Calculator, livingwage.mit.edu. ©2015, Dr. Amy K. Glasmeier and the Massachusetts Institute of Technology
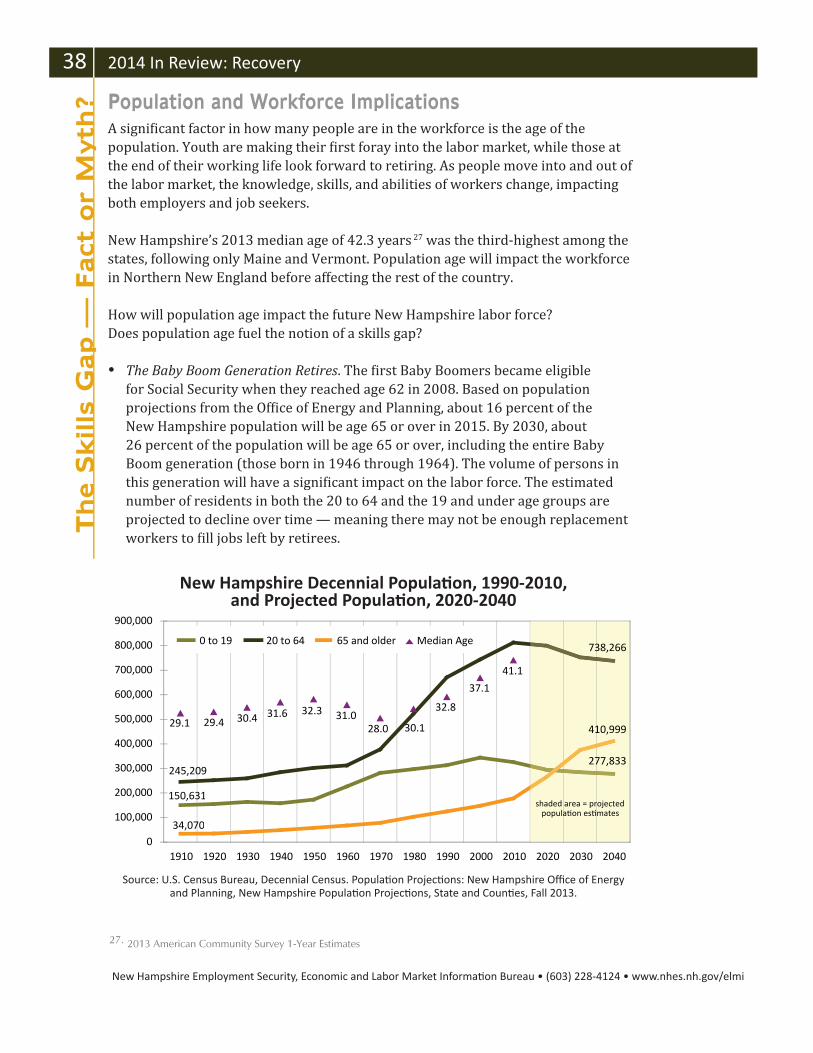
New Hampshire Employment Security, Economic and Labor Market Informati on Bureau • (603) 228-4124 • www.nhes.nh.gov/elmi
38 2014 In Review: Recovery
Source: U.S. Census Bureau, Decennial Census. Populati on Projecti ons: New Hampshire Offi ce of Energy and Planning, New Hampshire Populati on Projecti ons, State and Counti es, Fall 2013.
New Hampshire Decennial Populati on, 1990-2010, and Projected Populati on, 2020-2040
150,631
245,209
34,070
41.1
37.1
32.8
30.128.031.032.331.630.429.429.1
0
100,000
200,000
300,000
400,000
500,000
600,000
700,000
800,000
900,000
1910 1920 1930 1940 1950 1960 1970 1980 1990 2000 2010 2020 2030 2040
0 to 19 20 to 64 65 and older Median Age
shaded area = projected popula on es mates
738,266
410,999
277,833
Population and Workforce ImplicationsA significant factor in how many people are in the workforce is the age of the population. Youth are making their first foray into the labor market, while those at the end of their working life look forward to retiring. As people move into and out of the labor market, the knowledge, skills, and abilities of workers change, impacting both employers and job seekers.
New Hampshire’s 2013 median age of 42.3 years 27 was the third-highest among the states, following only Maine and Vermont. Population age will impact the workforce in Northern New England before affecting the rest of the country.
How will population age impact the future New Hampshire labor force? Does population age fuel the notion of a skills gap?
The Baby Boom Generation Retires. The first Baby Boomers became eligible for Social Security when they reached age 62 in 2008. Based on population projections from the Office of Energy and Planning, about 16 percent of the New Hampshire population will be age 65 or over in 2015. By 2030, about 26 percent of the population will be age 65 or over, including the entire Baby Boom generation (those born in 1946 through 1964). The volume of persons in this generation will have a significant impact on the labor force. The estimated number of residents in both the 20 to 64 and the 19 and under age groups are projected to decline over time — meaning there may not be enough replacement workers to fill jobs left by retirees.
27. 2013 American Community Survey 1-Year Estimates
The S
kills
Gap —
Fact
or
Myth
?
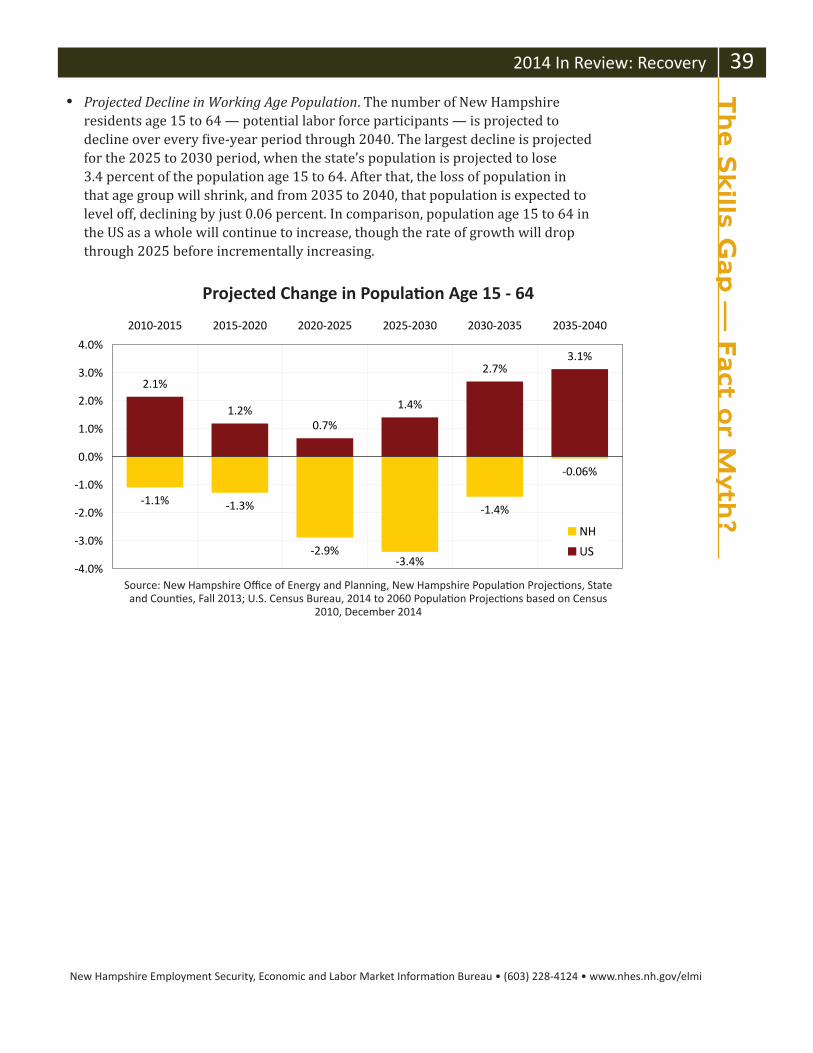
New Hampshire Employment Security, Economic and Labor Market Informati on Bureau • (603) 228-4124 • www.nhes.nh.gov/elmi
2014 In Review: Recovery 39
Projected Decline in Working Age Population. The number of New Hampshire residents age 15 to 64 — potential labor force participants — is projected to decline over every five-year period through 2040. The largest decline is projected for the 2025 to 2030 period, when the state’s population is projected to lose 3.4 percent of the population age 15 to 64. After that, the loss of population in that age group will shrink, and from 2035 to 2040, that population is expected to level off, declining by just 0.06 percent. In comparison, population age 15 to 64 in the US as a whole will continue to increase, though the rate of growth will drop through 2025 before incrementally increasing.
Source: New Hampshire Offi ce of Energy and Planning, New Hampshire Populati on Projecti ons, State and Counti es, Fall 2013; U.S. Census Bureau, 2014 to 2060 Populati on Projecti ons based on Census
2010, December 2014
Projected Change in Populati on Age 15 - 64
-1.1% -1.3%
-2.9%
-1.4%
2.1%
1.2%0.7%
1.4%
2.7%3.1%
-0.06%
-3.4%-4.0%
-3.0%
-2.0%
-1.0%
0.0%
1.0%
2.0%
3.0%
4.0%
2010-2015 2015-2020 2020-2025 2025-2030 2030-2035 2035-2040
NH
US
The S
kills G
ap —
Fact o
r Myth
?
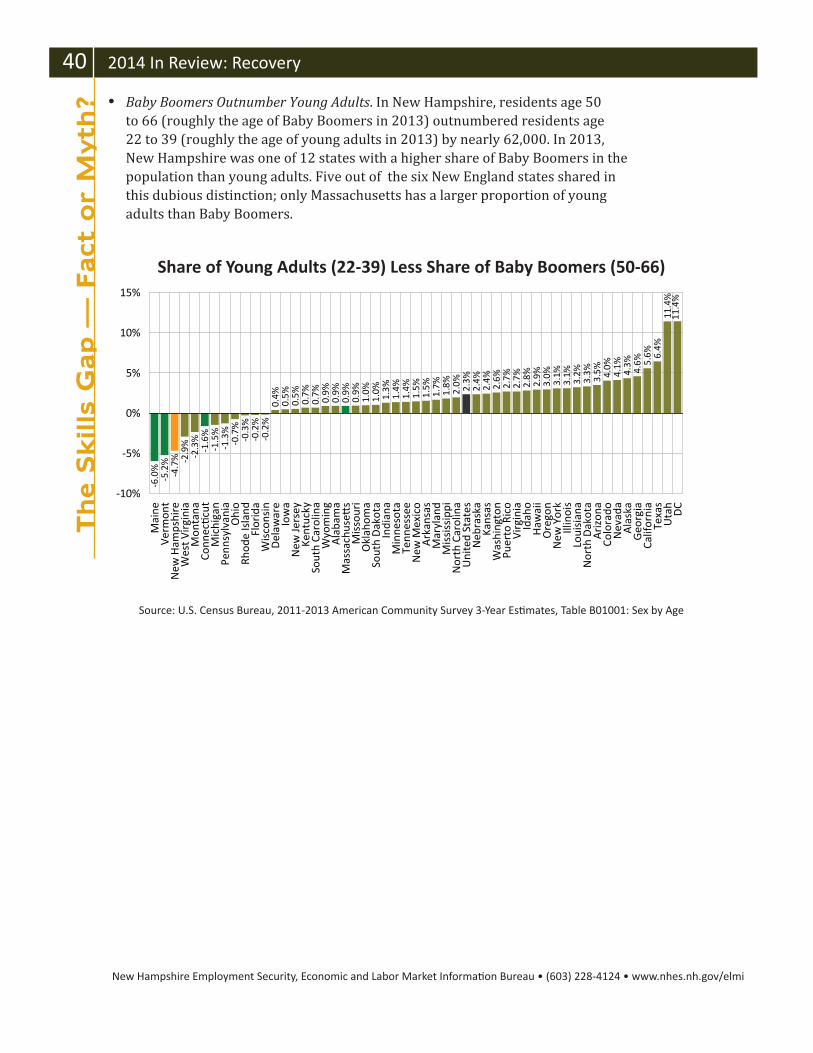
New Hampshire Employment Security, Economic and Labor Market Informati on Bureau • (603) 228-4124 • www.nhes.nh.gov/elmi
40 2014 In Review: Recovery
Baby Boomers Outnumber Young Adults. In New Hampshire, residents age 50 to 66 (roughly the age of Baby Boomers in 2013) outnumbered residents age 22 to 39 (roughly the age of young adults in 2013) by nearly 62,000. In 2013, New Hampshire was one of 12 states with a higher share of Baby Boomers in the population than young adults. Five out of the six New England states shared in this dubious distinction; only Massachusetts has a larger proportion of young adults than Baby Boomers.
Source: U.S. Census Bureau, 2011-2013 American Community Survey 3-Year Esti mates, Table B01001: Sex by Age
Share of Young Adults (22-39) Less Share of Baby Boomers (50-66)
-6.0
%-5
.2%
-4.7
% -2.9
%-2
.3%
-1.6
%-1
.5%
-1.3
%-0
.7%
-0.3
%-0
.2%
-0.2
%0.
4%0.
5%0.
5%0.
7%0.
7%0.
9%0.
9%0.
9%0.
9%1.
0%1.
0% 1.3%
1.4%
1.4%
1.5%
1.5%
1.7%
1.8%
2.0% 2.3%
2.4%
2.4%
2.6%
2.7%
2.7%
2.8%
2.9%
3.0%
3.1%
3.1%
3.2%
3.3%
3.5% 4.0%
4.1%
4.3% 4.6% 5.
6% 6.4%
11.4
%11
.4%
-10%
-5%
0%
5%
10%
15%
Mai
neVe
rmon
tN
ew H
amps
hire
Wes
t Vir
gini
aM
onta
naCo
nnec
cut
Mic
higa
nPe
nnsy
lvan
iaO
hio
Rhod
e Is
land
Flor
ida
Wis
cons
inD
elaw
are
Iow
aN
ew Je
rsey
Kent
ucky
Sout
h Ca
rolin
aW
yom
ing
Ala
bam
aM
assa
chus
es
Mis
sour
iO
klah
oma
Sout
h D
akot
aIn
dian
aM
inne
sota
Tenn
esse
eN
ew M
exic
oA
rkan
sas
Mar
ylan
dM
issi
ssip
piN
orth
Car
olin
aU
nite
d St
ates
Neb
rask
aKa
nsas
Was
hing
ton
Puer
to R
ico
Virg
inia
Idah
oH
awai
iO
rego
nN
ew Y
ork
Illin
ois
Loui
sian
aN
orth
Dak
ota
Ari
zona
Colo
rado
Nev
ada
Ala
ska
Geo
rgia
Calif
orni
aTe
xas
Uta
hD
C
The S
kills
Gap —
Fact
or
Myth
?

New Hampshire Employment Security, Economic and Labor Market Informati on Bureau • (603) 228-4124 • www.nhes.nh.gov/elmi
2014 In Review: Recovery 41
New Hampshire Occupati onal Projecti ons, 2012 to 2022SOC 2012 2022 Percent Average Annual OpeningsCode Occupati onal Group Esti mated Projected Change Growth Replacements Total
Total, All Occupati ons 668,268 736,999 10.3% 7,131 15,721 22,852
11-0000 Management 46,530 50,988 9.6% 452 939 1,391
13-0000 Business and Financial Operati ons 30,218 34,153 13.0% 396 584 980
15-0000 Computer and Mathemati cal 18,193 22,047 21.2% 387 286 673
17-0000 Architecture and Engineering 11,886 12,567 5.7% 77 278 355
19-0000 Life, Physical, and Social Science 4,001 4,458 11.4% 42 119 161
21-0000 Community and Social Services 10,247 12,019 17.3% 177 241 418
23-0000 Legal 4,106 4,406 7.3% 29 66 95
25-0000 Educati on, Training, and Library 43,946 47,618 8.4% 368 952 1,320
27-0000 Arts, Design, Entertainment, Sports, and Media 9,133 9,898 8.4% 81 215 296
29-0000 Healthcare Practi ti oners and Technical 36,373 43,760 20.3% 741 747 1,488
31-0000 Healthcare Support 19,374 23,762 22.6% 439 354 793
33-0000 Protecti ve Service 11,639 12,578 8.1% 92 331 423
35-0000 Food Preparati on and Serving Related 54,123 59,904 10.7% 576 1,995 2,571
37-0000 Building and Grounds Cleaning and Maintenance 25,064 28,245 12.7% 317 522 839
39-0000 Personal Care and Service 23,641 28,369 20.0% 472 485 957
41-0000 Sales and Related 84,346 89,633 6.3% 537 2,604 3,141
43-0000 Offi ce and Administrati ve Support 105,617 112,720 6.7% 856 2,364 3,220
45-0000 Farming, Fishing, and Forestry 1,914 1,929 0.8% 5 50 55
47-0000 Constructi on and Extracti on 23,401 26,787 14.5% 339 376 715
49-0000 Installati on, Maintenance, and Repair 25,812 28,016 8.5% 221 607 828
51-0000 Producti on 44,973 46,300 3.0% 217 872 1,089
53-0000 Transportati on and Material Moving 33,731 36,842 9.2% 310 734 1,044
Source: Employment Projections by Industry and Occupation, base year 2012 to projected year 2022, Economic and Labor Market Information Bureau, New Hampshire Employment Security, June 2014.
Replacement Needs Continue to Surpass New Job Growth. From 2012 to 2022, just under 70 percent of job openings are projected to be created from the need to replace workers, including those who retire. By 2022, the age group with the largest share of New Hampshire’s population — those age 45 to 54 in 2013 — will not yet have reached retirement age. This means that replacement job openings are likely to be a significant share of all job openings for many years to come. In order to have a pool of available workers to fill both replacement openings and potential growth openings as the economy continues to improve, training and education for those entering the labor market should begin now.
The largest numbers of replacement openings through 2022 will be in Sales and related occupations, Office and administrative support occupations, and Food preparation and serving occupations.
The S
kills G
ap —
Fact o
r Myth
?
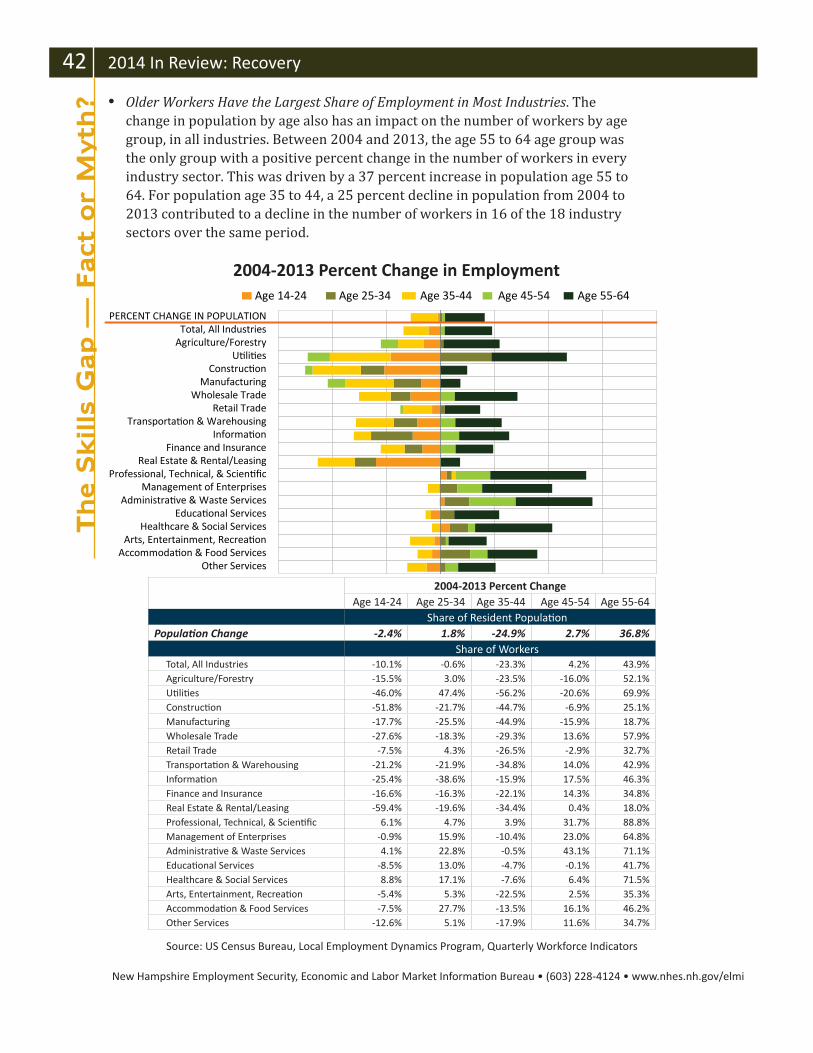
New Hampshire Employment Security, Economic and Labor Market Informati on Bureau • (603) 228-4124 • www.nhes.nh.gov/elmi
42 2014 In Review: Recovery
Source: US Census Bureau, Local Employment Dynamics Program, Quarterly Workforce Indicators
2004-2013 Percent Change in Employment
2004-2013 Percent ChangeAge 14-24 Age 25-34 Age 35-44 Age 45-54 Age 55-64
Share of Resident Populati onPopulati on Change -2.4% 1.8% -24.9% 2.7% 36.8%
Share of WorkersTotal, All Industries -10.1% -0.6% -23.3% 4.2% 43.9%Agriculture/Forestry -15.5% 3.0% -23.5% -16.0% 52.1%Uti liti es -46.0% 47.4% -56.2% -20.6% 69.9%Constructi on -51.8% -21.7% -44.7% -6.9% 25.1%Manufacturing -17.7% -25.5% -44.9% -15.9% 18.7%Wholesale Trade -27.6% -18.3% -29.3% 13.6% 57.9%Retail Trade -7.5% 4.3% -26.5% -2.9% 32.7%Transportati on & Warehousing -21.2% -21.9% -34.8% 14.0% 42.9%Informati on -25.4% -38.6% -15.9% 17.5% 46.3%Finance and Insurance -16.6% -16.3% -22.1% 14.3% 34.8%Real Estate & Rental/Leasing -59.4% -19.6% -34.4% 0.4% 18.0%Professional, Technical, & Scienti fi c 6.1% 4.7% 3.9% 31.7% 88.8%Management of Enterprises -0.9% 15.9% -10.4% 23.0% 64.8%Administrati ve & Waste Services 4.1% 22.8% -0.5% 43.1% 71.1%Educati onal Services -8.5% 13.0% -4.7% -0.1% 41.7%Healthcare & Social Services 8.8% 17.1% -7.6% 6.4% 71.5%Arts, Entertainment, Recreati on -5.4% 5.3% -22.5% 2.5% 35.3%Accommodati on & Food Services -7.5% 27.7% -13.5% 16.1% 46.2%Other Services -12.6% 5.1% -17.9% 11.6% 34.7%
Older Workers Have the Largest Share of Employment in Most Industries. The change in population by age also has an impact on the number of workers by age group, in all industries. Between 2004 and 2013, the age 55 to 64 age group was the only group with a positive percent change in the number of workers in every industry sector. This was driven by a 37 percent increase in population age 55 to 64. For population age 35 to 44, a 25 percent decline in population from 2004 to 2013 contributed to a decline in the number of workers in 16 of the 18 industry sectors over the same period.
Other ServicesAccommoda on & Food Services
Arts, Entertainment, Recrea onHealthcare & Social Services
Educa onal ServicesAdministra ve & Waste Services
Management of EnterprisesProfessional, Technical, & Scien c
Real Estate & Rental/LeasingFinance and Insurance
Informa onTransporta on & Warehousing
Retail TradeWholesale Trade
ManufacturingConstruc on
U li esAgriculture/ForestryTotal, All Industries
PERCENT CHANGE IN POPULATION
Age 14-24 Age 25-34 Age 35-44 Age 45-54 Age 55-64
The S
kills
Gap —
Fact
or
Myth
?
New Hampshire Employment Security, Economic and Labor Market Informati on Bureau • (603) 228-4124 • www.nhes.nh.gov/elmi
2014 In Review: Recovery 43
Educational PipelineOne source of new workers in the labor market are those completing an educational program at one of New Hampshire’s postsecondary institutions. The StayWorkPlay initiative 28 was started to encourage those attending school in New Hampshire to stay and work here, with the hopes of increasing the number of younger workers in the labor force. Yet in New Hampshire, large numbers of students are completing college with a degree unrelated to occupations in demand within the state. This hampers the ability of students to obtain work in their field of study in New Hampshire following graduation.
Educational Programs Compared to Occupations
To determine potential employment opportunities for these students, data on Bachelor’s degree completers by educational major in 2013 can be compared to projected annual job openings for 2012 through 2022. Educational programs that qualify graduates for employment in specific occupations, and entry-level educational requirements for occupations were used to determine the number of graduates that qualify for projected job openings in the state. For this study, the educational fields with the highest number of baccalaureates conferred will be examined.
The ten educational programs (first majors) with the largest number of students earning a Bachelor’s degree at New Hampshire postsecondary institutions during the 2012-2013 school year 29 were:
Biology
Business Administration and Management
Communications
Economics
Elementary Education and Teaching
English Language and Literature
History
Nursing
Political Science
Psychology
28. StayWorkPlay New Hampshire. <stayworkplay.org>.29. National Center for Education Statistics, Integrated Postsecondary Education Data System (IPEDS), IPEDS Data
Center, 2013 Preliminary Release Data. <nces.ed.gov/ipeds/datacenter/>.
The S
kills G
ap —
Fact o
r Myth
?
New Hampshire Employment Security, Economic and Labor Market Informati on Bureau • (603) 228-4124 • www.nhes.nh.gov/elmi
44 2014 In Review: Recovery
Out of these ten programs, nine have been on the list of programs with the largest number of students earning a baccalaureate at a New Hampshire postsecondary institution for six consecutive years; only Nursing was new to the list in 2013.
To determine if these fields of study qualified students for employment in the state, the ten programs were cross-matched to occupations in which the field of study prepared the graduate for entry-level employment. 30 The ten programs matched a total of 36 occupations; in some cases, multiple programs qualified graduates for a single occupation.
The next step is to filter the level of education to those qualifying the graduate for entry-level employment in the occupations. Baccalaureate graduates were qualified for employment in 17 of the 36 occupations. One occupation, Registered nurse, has an entry-level educational requirement of an Associate’s degree. Bachelor’s degree graduates may face competition from Associate’s degree graduates for the same job openings in this occupation.
Two occupations, both in management, required a high school diploma plus work experience in the field, thus new graduates would likely not be qualified. Graduates were unqualified for entry-level employment in the remaining 16 occupations, which required a minimum education of either a Master’s degree or a Doctorate. Among the latter group, nine occupations were postsecondary teachers.
Comparing 2013 graduate counts from New Hampshire postsecondary institutions to expected total annual job openings from the 2012 – 2022 long-term projections provides a rough assessment of competition for jobs among graduates seeking employment in-state 31 and in an occupation related to their major.
30. Guidelines for Using the CIP-SOC, National Center for Education Statistics and Bureau of Labor Statistics, March 2011. http://www.xwalkcenter.org/index.php/classifications/crosswalks. The Classification of Instructional Programs (CIP) to Standard Occupational Classification (SOC) crosswalk (CIP-SOC crosswalk) was developed jointly by NCES and BLS to identify the relationships between instructional programs and occupations. A CIP-SOC relationship must indicate a “direct” relationship, that is, programs in the CIP category are preparation directly for entry into and performance in jobs in the SOC category. The programs satisfy requirements for entry and/or prepare individuals to meet licensure or certification requirements to work in the occupation.
It is possible that there may be no direct correspondence between a CIP Code and a SOC code. This may occur because the occupation does not require any postsecondary education, because the CIP program is not career related, or because an insufficient number of institutions offer the program, to justify having a CIP Code.
Relationships between CIP and SOC may be one-to-one, one-to-many, many-to-one, or many-to-many. Since SOC codes tend to be more specific than CIP codes, it is likely that one CIP code will map to multiple SOC codes. This is in part because the CIP codes describe instructional programs that will often provide training that can be applied to multiple occupations.
31. There is no available data on New Hampshire graduates from another state who return to their home state to seek work; nor on graduates returning to New Hampshire from an out-of-state educational institution to seek work.
The S
kills
Gap —
Fact
or
Myth
?

New Hampshire Employment Security, Economic and Labor Market Informati on Bureau • (603) 228-4124 • www.nhes.nh.gov/elmi
2014 In Review: Recovery 45
Summing the number of students earning a Bachelor’s degree in 2013 and summing total average annual projected job openings for the 17 occupations requiring a baccalaureate for entry-level employment shows that 4,300 graduates from New Hampshire institutions were prepared for a projected 1,581 job openings — in total, about 2.7 graduates per job opening.
Registered Nurse presented a slightly different case. This occupation requires a minimum of an Associate’s degree for entry-level employment. In addition to the 210 Bachelor’s degree Nursing 32 graduates, there were 426 Associate’s degree Nursing graduates. These graduates were all qualified for the same 486 annual average job openings.
Field of Study
2013 Bachelor’s
Degrees Awarded
Occupati ons for which
Graduates Qualify
Annual Ave. Job Openings for
Occupati ons with Qualifi ed Graduates
Biology/Biological Sciences, General 280 4 56Business Admin. and Management, General 1,377 9 627Communicati ons, General 319 3 47Economics, General 268 0 --Elementary Educati on and Teaching 229 1 210English Language and Literature, General 350 1 50History, General 242 1 50Nursing/Registered Nurse 210 1 486Politi cal Science and Government, General 266 0 --Psychology, General 753 0 --
Comparisons do not consider factors such as students leaving the state for employment, those moving on to graduate school, those pursuing a post-baccalaureate certificate in education, those remaining in military service, or those seeking employment in New Hampshire who obtained their education out-of-state. There are also other programs that may qualify graduates for these same occupations.
Source: Bachelor’s degrees awarded: National Center for Educational Statistics, Integrated Postsecondary Education Data System (IPEDS) 2013 Early Release Data; Annual average job openings: New Hampshire Employment Projections by Industry and Occupation, 2012-2022, June 2014.
32. It is not uncommon for Associate’s degree nurses to continue their education and undertake an Associate’s of Science in Nursing to Bachelor’s of Science in Nursing transition program.
The S
kills G
ap —
Fact o
r Myth
?
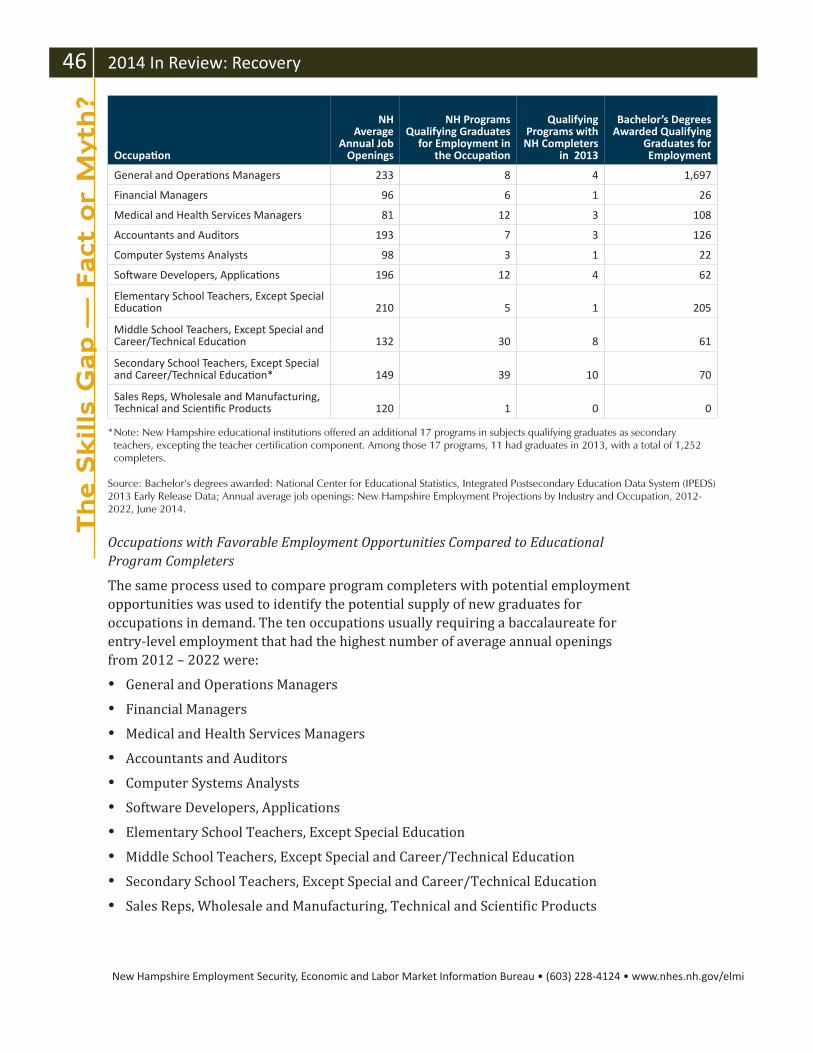
New Hampshire Employment Security, Economic and Labor Market Informati on Bureau • (603) 228-4124 • www.nhes.nh.gov/elmi
46 2014 In Review: Recovery
Occupations with Favorable Employment Opportunities Compared to Educational Program Completers
The same process used to compare program completers with potential employment opportunities was used to identify the potential supply of new graduates for occupations in demand. The ten occupations usually requiring a baccalaureate for entry-level employment that had the highest number of average annual openings from 2012 – 2022 were:
General and Operations Managers
Financial Managers
Medical and Health Services Managers
Accountants and Auditors
Computer Systems Analysts
Software Developers, Applications
Elementary School Teachers, Except Special Education
Middle School Teachers, Except Special and Career/Technical Education
Secondary School Teachers, Except Special and Career/Technical Education
Sales Reps, Wholesale and Manufacturing, Technical and Scientific Products
Occupati on
NHAverage
Annual Job Openings
NH Programs Qualifying Graduates
for Employment in the Occupati on
Qualifying Programs with
NH Completers in 2013
Bachelor’s Degrees Awarded Qualifying
Graduates for Employment
General and Operati ons Managers 233 8 4 1,697
Financial Managers 96 6 1 26
Medical and Health Services Managers 81 12 3 108
Accountants and Auditors 193 7 3 126
Computer Systems Analysts 98 3 1 22
Soft ware Developers, Applicati ons 196 12 4 62
Elementary School Teachers, Except Special Educati on 210 5 1 205
Middle School Teachers, Except Special and Career/Technical Educati on 132 30 8 61
Secondary School Teachers, Except Special and Career/Technical Educati on* 149 39 10 70
Sales Reps, Wholesale and Manufacturing, Technical and Scienti fi c Products 120 1 0 0
* Note: New Hampshire educational institutions offered an additional 17 programs in subjects qualifying graduates as secondary teachers, excepting the teacher certification component. Among those 17 programs, 11 had graduates in 2013, with a total of 1,252 completers.
Source: Bachelor’s degrees awarded: National Center for Educational Statistics, Integrated Postsecondary Education Data System (IPEDS) 2013 Early Release Data; Annual average job openings: New Hampshire Employment Projections by Industry and Occupation, 2012-2022, June 2014.
The S
kills
Gap —
Fact
or
Myth
?
New Hampshire Employment Security, Economic and Labor Market Informati on Bureau • (603) 228-4124 • www.nhes.nh.gov/elmi
2014 In Review: Recovery 47
In total, there were 123 educational programs that might prepare graduates for employment in these ten occupations. Among those 123 programs, 46 were offered at New Hampshire postsecondary institutions at the baccalaureate level. For two occupations — General and Operations Managers, and Medical and Health Services Managers — there were more graduates than expected job openings. Among the remaining eight occupations, the number of Bachelor’s degree graduates were lower than the expected annual job openings, creating a potential labor shortage.
This match indicates a labor over-supply for some occupations. There are, however, a number of other factors impacting the supply-to-demand relationship. For management jobs in particular, demand is impacted by companies that promote from within. This means that jobs may not be open to outside applicants, including new graduates. On the other hand, supply is impacted by incumbent workers who elect to attain higher education. Thus, not all educational program completers are in the open job market seeking work — they may already be employed. In cases where there are insufficient in-state employment opportunities for all graduates in the job market, those job seekers may leave the state or engage in some other occupation to obtain employment. In other cases, students obtaining a degree at a New Hampshire school may have done so due to either the school itself, or a specific program offered, and have no intention of seeking employment in the state.
This comparison makes many assumptions, but still it illustrates some of the issues behind the perception that college graduates cannot find work and employers are unable to find qualified workers. It becomes clear that it is not that new graduates have insufficient skills, but that in many cases, their course of study does not directly qualify them for demand occupations in New Hampshire. In cases where the graduates’ program of study does not match available jobs in the state or there is an over-supply of graduates, the likelihood of those graduates seeking work out-of-state is high. In cases where there are fewer graduates than there are job openings, there is a likelihood that employers will have difficulty finding applicants.
The S
kills G
ap —
Fact o
r Myth
?

New Hampshire Employment Security, Economic and Labor Market Informati on Bureau • (603) 228-4124 • www.nhes.nh.gov/elmi
48 2014 In Review: Recovery