2002 annual report quality. commitment. leadership
TRANSCRIPT

Quality. Commitment. Leadership.
2002 Annual Report

Company Profile
Cross Country, Inc. is one of the largest providers of healthcare staffing services in
the United States. Our healthcare staffing business segment, which represents
approximately 92% of our revenue, is comprised of travel nurse and allied health
staffing, per diem nurse staffing and clinical research trials staffing. Approximately
80% of our total revenue is derived from travel nurse staffing services.
Our other human capital management services business segment, which
represents approximately 8% of our revenues, consists of education and training
of healthcare professionals, healthcare consulting, and physician and healthcare
executive search services.
Our active client base includes more than 3,000 hospitals, pharmaceutical
companies and other healthcare providers across all 50 states. Our fees are
paid directly by our clients rather than by government or other third-party
payors. As a result, we have no direct exposure to Medicare or Medicaid
reimbursements. We are well positioned to take advantage of current industry
dynamics, including the growing shortage of nurses in the United States, the
growing demand for healthcare services due to an aging population and the
secular trend among healthcare providers toward outsourcing staffing services.

1
($ in 000’s, except per share data) 2002 2001* 2000*
Revenue from services $ 639,953 $ 504,364 $ 368,332
Adjusted EBITDA(a) $ 66,231 $ 57,239 $ 45,211
Income from continuing operations(b) $ 33,666 $ 14,404 $ 6,732
Net income(b) $ 29,783 $ 8,672 $ 4,598
Income from continuing operations per diluted share $ 1.00 $ 0.57 $ 0.29
Cash flow from operations $ 41,421 $ 19,795 $ 11,594
Debt ratio(c) 8% 14% 56%
FTEs(d) 5,535 4,816 4,167
Average healthcare staffing revenue per FTE per week(e) $ 2,046 $ 1,865 $ 1,619
Financial Highlights & Statistics
Healthcare Staffing
Other Human CapitalManagement Services
92%
20012002
Net Income(b)
($ in millions)
4.6
8.7
29.8
2000
Cash Flow From Operations($ in millions)
2002 Revenue MixRevenue From Services ($ in millions)
Income From Continuing Operations(b)
($ in millions)Adjusted EBIDTA(a)
($ in millions)
8%2001
2002
368.3
504.4
640.0
2000
20012002
45.2
57.2
66.2
20002001
2002
6.7
14.4
33.7
2000
2001
41.4
2000
19.8
11.6
* Certain amounts in the 2001 and 2000 information have been reclassified to conform to the 2002 presentation.(a) A non-GAAP financial measure defined as earnings before interest, income taxes, depreciation, amortization, non-recurring secondary offering costs and non-recurring
indirect transaction costs. Adjusted EBITDA should not be considered a measure of financial performance under generally accepted accounting principles. Refer to our Form 10-K for a more detailed description.
(b) Includes: (1) non-recurring secondary offering costs of $886 pre-tax ($543 after-tax) in 2002, and (2) non-recurring transaction costs of $1,289 pre-tax in 2001.(c) Defined as total debt less cash, divided by total stockholders’ equity plus total debt.(d) FTE’s represent the average number of contract staffing personnel on a full-time equivalent basis.(e) Average healthcare staffing revenue per FTE per week is calculated by dividing the healthcare staffing revenue by the number of weeks worked in the respective periods.
Healthcare staffing revenue includes revenue from permanent placement of nurses.
2002

2
Dear Fellow ShareholdersIn 2002, we achieved record annual revenue, net income and cash flow from opera-
tions. Revenue of $640 million in 2002 was 27% greater than in 2001 and nearly ten
times our revenue when I joined Cross Country in 1993. Our income from continuing
operations, excluding after-tax secondary offering costs, was $34.2 million, or $1.02 per
diluted share. Including such costs, income from continuing operations increased
134% to $33.7 million, or $1.00 per diluted share. Net income increased 243% to $29.8
million, or $0.88 per diluted share. Adjusted EBITDA (a non-GAAP measure defined
as earnings before interest, income taxes, depreciation, amortization and non-recur-
ring secondary offering costs) increased to $66.2 million and cash flow from operations
increased to $41.4 million. In addition, during the year we had an average of 5,535
full-time equivalent (FTE) nurses and other healthcare professionals working around
the country for our Company.
As we entered 2002, we identified an internal capacity constraint in the recruitment
area to maintaining strong top line growth in the future. During the course of 2002,
we grew our average recruiter count gradually from 75 at year-end 2001 to 121 at year-
end 2002. We also opened new avenues to nurse supply, expanding our overseas
recruitment through our Assignment America brand and through our acquisition of
NovaPro in January 2002, which allowed us to better segment the United States nurse
population with differentiated brand offerings.
Despite these achievements, we are disappointed that our shareholders – including
many of our employees – have had their investment in Cross Country impacted by,
among other things, an industry-wide decline in the valuation of healthcare staffing
companies, reflecting a slowdown in demand for outsourced nurse staffing. While
the current environment may continue for some time, we do not believe the current
conditions are long term in nature, as vacancy and turnover rates for full-time nursing
positions have not changed much from the double digit levels we have seen in recent
years. Moreover, we do not believe the nurse-staffing actions many hospitals have
undertaken are sustainable over the long term nor do they address the fundamental
issues surrounding the nursing shortage.
“...we believe the long-term fundamentalsdriving our businessesremain strong.”

3
As we continue to recruit nurses and allied healthcare professionals to fill thousands of
open orders that have been placed with us by our hospital clients, we believe opportu-
nities exist in the current reduced-demand market environment that will allow us to
increase market share, given our high quality service, brand recognition and reputa-
tion within the industry. Accordingly, we continue to be very focused on obtaining
preferred provider status with our acute care facility clients. And in doing so, we
believe that Cross Country has the ability to continue to grow not just
in supply constrained environments, but in demand constrained
environments as well.
We realize the ultimate benefits of our demand, supply and
internal capacity initiatives will take time. Our Company
has been in the healthcare staffing business for 20 years
and we believe the long-term fundamentals driving
our businesses remain strong. I believe in our
future and in our ability to continue growing.
In closing, I would like to express my appre-
ciation to our investors for their loyalty and
acknowledge our employees for their many
contributions to our success in 2002.
Sincerely,
Joseph A. BoshartPresident and Chief Executive Officer

4
VHA Member Hospitals
An Interview With VHAMany of our hospital clients are VHA members. We recently sat down with
Lillee Gelinas, RN, MSN, vice president and chief nursing officer at VHA.
Cross Country: What is the value proposition that VHA brings to its members?
Lillee Gelinas: VHA is a member-owned and member-driven health care cooperative.
Our mission is to help our members become the local provider of choice by offering them
products and services to help them improve their clinical and operational performance.
Our relationship with Cross Country clearly helps us achieve that objective.
CC: How significant is the nursing shortage for VHA members and what
initiatives are being undertaken to address it?
LG: The nursing shortage for us is profound. It is estimated that VHA institutions have
an RN shortfall every day that can’t be quantified in terms of impact. Our Tomorrow’s
Work Force initiative is receiving recognition in the healthcare industry for its focus on
achieving work force turnarounds. For example, the nurse turnover rate among VHA
member hospitals averages only 15% – many hospitals have two or more times this rate.
The annual cost to VHA members to replace nurses is $1.6 billion or roughly $717,000
per hospital.
Believe me, the problem is real. Society is in for a real shock. The industry dropped
the work force ball several years ago to meet the financial pressures of the day – now
hospitals are really paying the price. Travel and temporary staffing companies meet the
real needs of today’s nurse and other healthcare professionals. Hospitals just need to
understand that reality!
Lillee Gelinas, RN, MSN
Vice President and Chief Nursing Officer, VHA
Provider of Choice
VHA is a for-profit cooperative with a
nationwide network of more than 2,200
member community-owned health
care systems and their physicians. VHA
organizations are in 48 states representing
more than one-quarter of the nation’s
community-owned hospitals. VHA
member organizations range from single
50-bed facilities to large, integrated
health care systems made up of multiple
hospitals, physician clinics and support
care sites. VHA provides products, pro-
grams and services to help its members
improve operational efficiency and
clinical effectiveness. VHA also works
with hospital executives, physicians,
nurses and department heads in many
areas to provide them with programs and
services to help them do their jobs better.

5
Lillee Gelinas, RN, MSN, is vice president and chief nursing officer at VHA Inc. As a member of VHA’sClinical Services team, she leads clinical improvement efforts aimed at enhancing operational efficiency, financial performance and patient care delivery. Gelinas also leads VHA’s programs supporting nursing leadership and related activities, and also supports VHA local office nursing programs. She joined VHA in1991 as VHA’s first chief nursing officer. Gelinas is a nationally recognized speaker on clinical health care management and nursing issues. She has published numerous articles and has provided leadership for VHA’snational efforts focusing on clinical and nursing issues. Gelinas earned her bachelor’s degree in nursing fromthe University of Southern Louisiana in Lafayette and a master’s degree in nursing, with honors, from theUniversity of Pennsylvania. She also studied at the Wharton School of Business. In addition, Gelinas is a member of the board of directors of Exempla Health Care in Denver, Colorado.
CC: Looking ahead over the next five years, what are the future healthcare
staffing needs of VHA member hospitals?
LG: We’ve got to come to the recognition that we have too few nurses for too many
positions. We have to create hospitals that are “employers of choice” to attract the best
and brightest nursing talent. To accomplish that objective, we will have to do everything
we can to assure “best care for every patient, every day.” That means engaging traveling
and temporary staff to keep nurse-patient ratios at safe, quality levels.
CC: What are the attributes that led VHA to select Cross Country as an
approved nurse staffing provider?
LG: No people, no care. That means we can’t deliver quality patient care without
nurses! We think Cross Country can help us 1) define clearly today’s work force issues,
2) provide adequate numbers of nurses and other health care professionals to meet
today’s needs, and 3) redesign staffing models for the future.
CC: How can VHA member hospitals optimize their use of nurse staffing
services to better manage fluctuations in staffing demands, improve patient
outcomes, improve retention and reduce permanent staff turnover?
LG: Have an open mind. Temporary staffing resources are expensive – we know that.
So is the cost of turnover and replacement. Today’s “Generation X” nurse wants a life and
a profession that is different than the workers of previous years. Hospitals have to respect
that position, recruit for it, and retain it. That’s our current reality – and that’s our future.

6
Nurse StaffingWe provide hospitals and healthcare organizations with integrated fixed-term, flexible-
term and permanent nurse staffing solutions. We are a leading provider of travel nurse
staffing services in the U.S. We also provide per diem nurse staffing as well as staffing
of allied healthcare professionals, such as radiology technicians, rehabilitation therapists
and respiratory therapists.
In providing our staffing services, we supply credentialed nurses for contracted fixed-
term and flexible-term assignments at public and private, and for-profit and not-for-
profit healthcare facilities primarily located throughout the U.S. The majority of our
assignments are at acute care hospitals, including teaching institutions, trauma centers
and community hospitals located in major metropolitan areas.
In 2002, we organized the integrated delivery of our healthcare staffing services under
Cross Country Staffing to provide hospital clients with a single point of access to our
differentiated nurse recruitment brands. This allows our sales and marketing team to
focus on obtaining preferred provider relationships while consistently delivering an
array of high quality staffing services.
Nurse RecruitingWe operate differentiated nurse recruitment brands consisting of Cross Country
TravCorps, NovaPro, Cross Country Local and Assignment America. This strategy
allows us to segment the nurse population during the recruitment of nurses and allied
healthcare professionals on a domestic and international basis. We have an efficient
centralized operating structure that at year-end 2002 included a database of more than
170,000 nurses and other healthcare professionals who completed job applications with
us. More than half of our field employees have been referred by current or former
employees, with the remainder attracted by advertisements in trade publications and
online recruiting initiatives. Our applicant sourcing initiatives resulted in approxi-
mately 15,700 field staff applications added to our database last year alone.
Jackie Lara, RNNovaPro Nurse
Healthcare Staffing
“After 14 years at the same hospital, I
was ready for a change. So I took the
advice of some friends and joined
NovaPro. I’m glad I did. Looking
back, it’s hard to believe that at one
point in my life I was ready to leave
nursing behind altogether. Travel
nursing has given me the opportunity
to truly love being a nurse again.”

7
Loretta Ogden, RNCross Country Local Nurse
We provide nurses and other healthcare professionals a high level of customer service
in helping them manage their career path. To accomplish this, we offer a wide range of
diverse assignments at healthcare facilities in appealing locations, attractive compensa-
tion packages, housing and other benefits, as well as substantial training opportunities
through Cross Country University.
Our Cross Country TravCorps and NovaPro brands recruit credentialed nurses and
other healthcare professionals, including operating room technicians, therapists and
other allied health and advanced practice professionals such as radiology technicians,
rehabilitation therapists and respiratory therapists, for placement on fixed-term
travel assignments. Our purchase of NovaPro in January 2002 was our first step
towards segmenting the nurse population. The working nurses of Cross Country
Travcorps and NovaPro each fit a different demographic. Country TravCorps offers
nurses a more standardized benefits package while NovaPro targets nurses seeking
more customized benefits packages.
Our Cross Country Local brand recruits credentialed nurses and other healthcare
professionals for local per diem assignments at healthcare facilities to fill day-to-day
and varying-length shift coverage. We operate our per diem nurse staffing services
under a centralized model that leverages the quality of recruitment and credentialing
associated with the reputation and brand recognition of our travel nurse staffing
business while providing 24x7 call center service from our headquarters in Boca
Raton, Florida. In 2002, we provided per diem nurse staffing services to healthcare
facilities in 25 states.
“As a mother of four children,
I turned to nursing as a way to
manage my time as a wife, mother
and career woman. But after
several years as a staff nurse, I
realized I wasn’t in control of my
priorities. That’s when I joined
Cross Country Local.
I now choose my shifts, and the
flexibility has allowed me to
achieve balance between my
career and my lifestyle.”

8
In 2001, we initiated Assignment America, our international recruitment brand
designed to attract foreign-trained nurses and supplement U.S. and Canadian nurse
recruiting activities by our Cross Country TravCorps and NovaPro brands. Assignment
America currently recruits experienced acute-care nurses from English-speaking foreign
countries (the UK, Ireland, New Zealand and Australia), executes their licensure and
immigration requirements, and prepares them personally and professionally for their
transition into the U.S. prior to placing them on long-term domestic assignments in
acute care facilities. Assignment America is presently focused on recruiting certain
high-demand specialties and includes nurses that have completed their Commission on
Graduates of Foreign Nursing Schools Certificate Program to expedite U.S Boards of
Nursing licensing and current immigration procedures.
Our nurse recruiters are a vital component of our business. They are responsible
for establishing and maintaining key relationships with candidates throughout the
placement process on their first assignment as well as subsequent assignments. We
have a strong retention rate and believe it is a direct result of these relationships.
We substantially increased the number of our nurse recruiters from 75 at year-end
2001 to 121 at year-end 2002, thus increasing our internal capacity to match the
supply of qualified nurse candidates in our database with the demand of positions
from our hospital clients.
Clinical Research and Trials StaffingThrough our ClinForce brand, we provide clinical research professionals for fixed-
term contract assignments and permanent placement to many of the world's leading
companies in the pharmaceutical, biotechnology, medical device and related industries.
We provide an array of professionals in such areas as clinical research and clinical data
sciences, medical review and writing, and pharmacoeconomics and regulatory affairs.
Jean Turcotte, RNCross Country TravCorps Nurse
“Travel nursing started out as a perfect
way to beat the cold winters of
Canada. Now seven years and 16
assignments later, I figure I’ll probably
retire as a Cross Country TravCorps
travel nurse. They make it easy for me
to work where I want to work and
still pursue my professional goals. In
fact, for the last three and a half years,
I’ve been working as an Ambassador
for them. In this role, I’ve been able to
continue teaching and that’s something
I really wanted to accomplish.”

9
Lynne Venus, RNAssignment America Nurse
Search and RecruitmentWe provide both retained and contingency search and recruitment services to health-
care organizations throughout the U.S., including hospitals, pharmaceutical companies,
insurance companies and physician groups. Our search services include the placement
of physicians, healthcare executives and nurses.
Healthcare Consulting ServicesWe provide healthcare-oriented consulting services, including consulting related to
physician compensation, strategy, operations, facilities planning, work force manage-
ment and merger integration.
Education and Training ServicesCross Country University (CCU) provides continuing education programs to the
healthcare industry. CCU holds national conferences as well as multi- and one-day
seminars on topics relevant to nurses and other healthcare professionals. We also extend
these educational services to our field employees on favorable terms as a recruitment
and retention tool. In 2002, CCU produced 4,623 seminars and conferences that were
attended by approximately 143,700 registrants in 265 cities across the U.S.
“Leaving New Zealand to work in
the U.S. was not in my original
plan when I became a nurse. But
when two of my daughters came
here to attend college, I wanted to
be closer to them and Assignment
America made it happen. I accepted
an 18-month assignment with
them, and now they’re helping me
get my green card. Now I’ll be able
to stay in the states for as long as my
daughters are here…maybe longer.”
Other Human Capital Management Services

10
don’tYouhave to travel far
to go far
uccessS onfidenceCI’ve been a nurse for a long time and I have plenty ofexperience. But that doesn’t mean I don’t want tolearn new things. I still want to put my clinical skills tothe test, but I don’t want to travel far to do it. I choosethe assignments that offer me the challenges I’m looking for and the locations that work for me. I get exactly what I want – for my career and my life. That’s why I’m a travel nurse.
Welcome to your future!
Flexibility. Reliability. Respect. Travel nursing, redefined.
TM
Proud National Sponsor of
www.nursevillage.com
NurseVillage is information about nursing…about
your personal life…about life as a nurse. It’s things
you’ll want to know, things you’ll need to know and
everything in between. Here are just some of the great
features you’ll find:
■ Daily Clinical News■ Informative City Guides■ E-Cards for any occasion■ Health & Finance Special Features■ Professional Career Advice & Resources
www.crosscountrytravcorps.com(800) 530-6125 ext 8166
Local contracts available now!RNs in Critical Care, Med/Surg, Tele and ER
(888) 542-3210
Imagine a nursing career flexible enough
to fit into yourlifestyle.
Schedule Life.
Selected Cross Country Ads
Faced with a growing shortage of nursing professionals, hospitalsare struggling with ways to find qualified staff to serve their communities’ needs. Cross Country Staffing is responding with a cost-effective nurse staffing solutions.
Cross Country’s database of more than 170,000 highly qualified health care professionals makes finding candidates muchmore efficient. In addition, we eliminate the time you’d spend onscreening, credentialing and training because our rigorousrecruitment and evaluation process handles it all for you.
UNITED STATESSECURITIES AND EXCHANGE COMMISSION
Washington, D.C. 20549
FORM 10-K( ANNUAL REPORT PURSUANT TO SECTION 13 OR 15(d) OF THE
SECURITIES EXCHANGE ACT OF 1934For the Fiscal Year Ended December 31, 2002
or
9 TRANSITION REPORT PURSUANT TO SECTION 13 OR 15(d) OF THESECURITIES EXCHANGE ACT OF 1934
For the transition period from to Commission file number 0-33169
(Exact name of registrant as specified in its charter)
Delaware 13-4066229(State or other jurisdiction of (I.R.S. Employer Identification No.)incorporation or organization)
6551 Park of Commerce Boulevard, N.W.Boca Raton, Florida 33487
(Address of principal executive offices, zip code)Registrant’s telephone number, including area code: (561) 998-2232
Securities registered pursuant to Section 12(b) of the act: NoneSecurities registered pursuant to Section 12(g) of the act:
Common Stock, $.0001 Par Value Per ShareIndicate by check mark whether the Registrant: (1) has filed all reports required to be filed by
Section 13 or 15(d) of the Securities Exchange Act of 1934 during the preceding 12 months (or for suchshorter period that the Registrant was required to file such reports), and (2) has been subject to such filingrequirements for the past 90 days. Yes ( No 9
Indicate by check mark if disclosure of delinquent filers pursuant to Item 405 of Regulation S-K is notcontained herein, and will not be contained, to the best of Registrant’s knowledge, in definitive proxy orinformation statements incorporated by reference in Part III of this Form 10-K or any amendment to thisForm 10-K. 9
Indicate by check mark whether the registrant is an accelerated filer (as defined in Rule 12b-2 of theAct). Yes ( No 9
The aggregate market value of the voting stock held by non-affiliates of the Registrant, based on theclosing price of Common Stock on June 30, 2002 of $37.80 as reported on the Nasdaq National Market, was$787,450,242.60. This calculation does not reflect a determination that persons are affiliated for any otherpurpose.
As of March 18, 2003, 32,273,801 shares of Common Stock, $.0001 par value per share, wereoutstanding.
DOCUMENTS INCORPORATED BY REFERENCEPortions of the registrant’s definitive proxy statement pursuant to Regulation 14A, which statement will
be filed not later than 120 days after the end of the fiscal year covered by this Report, are incorporated byreference in Part III hereof.

TABLE OF CONTENTS
Page
PART IITEM 1. BUSINESS . . . . . . . . . . . . . . . . . . . . . . . . . . . . . . . . . . . . . . . . . . . . . . . . . . . . . . 1
RISK FACTORS . . . . . . . . . . . . . . . . . . . . . . . . . . . . . . . . . . . . . . . . . . . . . . . . . 12ITEM 2. PROPERTIES . . . . . . . . . . . . . . . . . . . . . . . . . . . . . . . . . . . . . . . . . . . . . . . . . . . 16ITEM 3. LEGAL PROCEEDINGS . . . . . . . . . . . . . . . . . . . . . . . . . . . . . . . . . . . . . . . . . . . 17ITEM 4. SUBMISSION OF MATTERS TO A VOTE OF SECURITY HOLDERS . . . . . . . 17
PART IIITEM 5. MARKET FOR REGISTRANT’S COMMON EQUITY AND RELATED
STOCKHOLDER MATTERS . . . . . . . . . . . . . . . . . . . . . . . . . . . . . . . . . . . . . . 17ITEM 6. SELECTED FINANCIAL DATA . . . . . . . . . . . . . . . . . . . . . . . . . . . . . . . . . . . . . 18ITEM 7. MANAGEMENT’S DISCUSSION AND ANALYSIS OF FINANCIAL
CONDITION AND RESULTS OF OPERATIONS . . . . . . . . . . . . . . . . . . . . . . . 21ITEM 7A. QUANTITATIVE AND QUALITATIVE DISCLOSURES ABOUT MARKET
RISK . . . . . . . . . . . . . . . . . . . . . . . . . . . . . . . . . . . . . . . . . . . . . . . . . . . . . . . . 34ITEM 8. FINANCIAL STATEMENTS AND SUPPLEMENTARY DATA . . . . . . . . . . . . . . . 34ITEM 9. CHANGES IN AND DISAGREEMENTS WITH ACCOUNTANTS ON
ACCOUNTING AND FINANCIAL DISCLOSURE . . . . . . . . . . . . . . . . . . . . . . 34
PART IIIITEM 10. DIRECTORS AND EXECUTIVE OFFICERS OF THE REGISTRANT . . . . . . . . 35ITEM 11. EXECUTIVE COMPENSATION . . . . . . . . . . . . . . . . . . . . . . . . . . . . . . . . . . . . . 35ITEM 12. SECURITY OWNERSHIP OF CERTAIN BENEFICIAL OWNERS AND
MANAGEMENT AND RELATED STOCKHOLDER MATTERS . . . . . . . . . . . 35ITEM 13. CERTAIN RELATIONSHIPS AND RELATED TRANSACTIONS . . . . . . . . . . . . 35ITEM 14. CONTROLS AND PROCEDURES . . . . . . . . . . . . . . . . . . . . . . . . . . . . . . . . . . . 35
PART IVITEM 15. EXHIBITS, FINANCIAL STATEMENT SCHEDULES AND REPORTS ON
FORM 8-K . . . . . . . . . . . . . . . . . . . . . . . . . . . . . . . . . . . . . . . . . . . . . . . . . . . . 36SIGNATURES . . . . . . . . . . . . . . . . . . . . . . . . . . . . . . . . . . . . . . . . . . . . . . . . . . . 37CERTIFICATIONS . . . . . . . . . . . . . . . . . . . . . . . . . . . . . . . . . . . . . . . . . . . . . . . 38
All references to ‘‘we, ‘‘us,’’ ‘‘our,’’ or ‘‘Cross Country’’ in this Report on Form 10-K means CrossCountry, Inc.
i

Forward-Looking Statements
In addition to historical information, this Annual Report on Form 10-K contains forward-lookingstatements. These forward-looking statements are subject to certain risks and uncertainties that couldcause actual results to differ materially from those reflected in these forward-looking statements.Factors that might cause such a difference include, but are not limited to; those discussed in the sectionentitled ‘‘Business-Risk Factors.’’ Readers are cautioned not to place undue reliance on these forward-looking statements, which reflect management’s opinions only as of the date hereof. The Companyundertakes no obligation to revise or publicly release the results of any revision to these forward-looking statements. Readers should carefully review the Risk Factors described in other documents theCompany files from time to time with the Securities and Exchange Commission, including theQuarterly Reports on Form 10-Q to be filed by the Company in fiscal year 2003.
PART I
ITEM 1. BUSINESS
Overview of Our Company
We are one of the largest providers of healthcare staffing services in the United States. Ourhealthcare staffing business segment, which represents approximately 92% of our revenue, is comprisedof travel nurse and allied health staffing, per diem nurse staffing and clinical research trials staffing.Approximately 80% of our revenue is derived from travel nurse staffing services. Our other staffingservices include the placement of allied healthcare professionals, such as radiology technicians,rehabilitation therapists and respiratory therapists, and the placement of clinical research professionals.Our other human capital management services business segment, which represents approximately 8% ofour revenues, consists of education and training, healthcare consulting, and physician and executivesearch services.
Our active client base includes more than 3,000 hospitals, pharmaceutical companies and otherhealthcare providers across all 50 states. Our fees are paid directly by our clients rather than bygovernment or other third-party payors. As a result, we have no direct exposure to Medicare orMedicaid reimbursements. We are well positioned to take advantage of current industry dynamics,including the growing shortage of nurses in the United States, the growing demand for healthcareservices due to an aging population and the secular trend among healthcare providers towardoutsourcing staffing services. For the year ended December 31, 2002, our revenue was $640.0 millionand our net income was $29.8 million, or $0.88 per diluted share.
Overview of Our Industry
The Staffing Industry Report, an independent staffing industry publication, estimates that thehealthcare segment of the temporary staffing industry was $8.5 billion in 2001, an increase of 18% from$7.2 billion in 2000. Nurse staffing represents over 70% of the revenue generated in the temporarymedical staffing industry.
The most common temporary nurse staffing alternatives available to hospital administrators aretravel nurses and per diem nurses.
• Travel nurse staffing involves placement of registered nurses on a contracted, fixed-term basis.Assignments may range from several weeks to one year, but are typically 13 weeks long andinvolve temporary relocation to the geographic area of the assignment. Travel nurses provide along-term solution to a nurse shortage, provide hospitals and other healthcare facilities with theflexibility to manage changes in their staffing needs due to shifts in demand, represent a pool ofpotential full-time job candidates and enable healthcare facilities to provide their patients with
1

continuity of care. The staffing company generally is responsible for providing travel nurses withcustomary employment benefits and for coordinating travel and housing arrangements.
• Per diem staffing comprises the majority of temporary healthcare staffing and involves placementof locally based healthcare professionals on very short-term assignments, often for daily shiftwork, with little advance notice of assignments by the client.
Industry Dynamics
Shortage of Nurses. There is a pronounced shortage of registered nurses, especially experiencedacute care specialty nurses, which staff operating rooms, emergency rooms, intensive care units andpediatric wards. The American Hospital Association currently estimates the shortage of nurses to beapproximately 126,000. The nurse shortage is expected to grow over the coming decades to anestimated 20% below requirements by the year 2015 and 29% below requirements by the year 2020,according to a report by the U.S. Department of Health and Human Services (July 2002). Similarly, a2002 report to the Joint Commission on Accreditation of Healthcare Organizations (JCAHO) titled‘‘Health Care at the Crossroads—Strategies for Addressing the Evolving Nursing Shortage,’’ quantifiedthis shortage stating that by the year 2020 there will be at least 400,000 fewer nurses available toprovide care than will be needed.
According to the July 2002 report mentioned above, the national shortage of registered nurses isnot evenly distributed across the U.S. In 2000, 30 states were estimated to have shortages. By the year2020, 44 states and the District of Columbia are projected to have shortages.
Several factors have contributed to the decline in the supply of nurses:
• The nurse pool is getting older and approaching retirement age. Several factors contribute to theaging of the registered nurse workforce: (1) the decline in number of nursing school graduates,(2) the higher age of recent graduates, and (3) the aging of the existing pool of licensed nurses.The largest source of new registered nurses, associate-degreed nurses, are on average 33 yearsold when they graduate and considerably older than in 1980 when the average age was 28. TheJCAHO report outlined the average age of a working registered nurse at 43.3 and increasing ata rate more than twice that of other workforces in this country. In contrast, 12% of registerednurses are under age 30, a 41% decline compared to a 1% decline for other occupations since1983. The slowing of new, young entrants combined with an accelerating retirement rate forolder registered nurses is expected to result in a national supply of nurses in the year 2020 thatwill not only be older, but no larger in number than the supply projected for the year 2005. Bythe year 2010, it is projected that the average age of working registered nurses will be 50.
• Approximately 60% of nurses work in hospitals. Many registered nurses are leaving the hospitalworkforce through retirement, death or by choosing careers outside of acute care hospitals or inprofessions other than nursing. There are currently more than 500,000 licensed nurses notemployed in nursing. According to a Peter D. Hart Research Associates study (April 2001), thetop reasons nurses leave patient care, besides retirement, is to seek a job that is less stressfuland less physically demanding (56%), seek more regular hours (22%) and desire morecompensation (18%). Among working hospital nurses, understaffing (39%) and the stress andphysical demands of the job (38%) were cited as the biggest problems with nursing.
• Enrollment levels in nursing schools declined in the last half of the 1990s, resulting in 26%fewer registered nurse graduates in 2000 than in 1995. Declines were seen across all degreeprograms—diploma, associate degrees and baccalaureate. Similarly, the numbers of domesticallyeducated candidates taking the registered nurse licensing examination (NCLEX) for the firsttime has declined at an average of 5.5% for each of the past six years, as reported by theNational Council of State Boards of Nursing, Inc. While the American Association of Colleges
2

of Nursing (AACN) reported a 3.7% increase in baccalaureate enrollment between 2000 and2001, there are approximately 21,000 fewer nursing students than in 1995. In addition, therelatively longer educational time frame required to complete baccalaureate studies increases thelength of time before students can take the NCLEX test and emerge as licensed nurses.
• The shortage of nurses is mirrored by a corresponding shortage of nursing faculty. As a result ofthe faculty shortage, nursing schools turned away 5,000 qualified baccalaureate programapplicants in 2001. Nursing school faculty members average age 51—eight years older than theaverage age of all registered nurses. Doctorally prepared faculty members are even older with anaverage age of 56 for professors, 54 for associate professors and 50 for assistant professors. Asthe supplier of a majority of the pool of nurse educators, the American Association of Collegesof Nurses reports that doctoral nursing enrollments grew by only 1.5% from 2001 to 2002. Theshortage of nurses drives demand for our services because hospitals turn to temporary nurses asa flexible way to manage changes in demand of their permanent staff and make up for budgetedshortfalls in staffing.
Increasing Utilization of Healthcare Services. There are a number of factors driving an increase inthe utilization of healthcare services, including:
• A projected 18% increase in population between the year 2000 and 2020, resulting in anadditional 50 million people who will require health care—19 million of which will be in the65-and-over age group (Report by US. Department of Health and Human Services—July 2002).
• The aging of Americans. Baby boomers are just entering the 55 to 64 age group, where inpatientdays per thousand are 58% higher than in the 45 to 54 age group, and 121% higher than in the35 to 44 age group. National spending on hospital services increased $83.6 billion between 1997and 2001. Of this increase, the most significant source of growth (55.4%) was volume—morepeople using hospital services. For the period 2001 to 2003, labor costs, pushed up by thenursing shortage, are projected to account for 38.8% of the increase in spending on hospital careand volume (population) growth is associated with 20% of the increase (Cost of Caring: KeyDrivers of Growth in Spending on Hospital Care by PriceWaterhouseCoopers—February 2003).
• Advances in medical technology and healthcare treatment methods that attract a greater numberof patients with complex medical conditions requiring higher intensity of care.
Spending on hospital services has grown 61% over the past 10 years. The Centers for Medicareand Medicaid Services project that annual growth in spending on hospital services will remain relativelyconstant at about 6% throughout the next decade while total healthcare expenditures are expected togrow by an average of 7.1% annually from 2001 through 2010. During the past few years, growth inspending on hospital services has moderated—from 8.3% in 2001 to 7.4% in 2002, and is expected tobe 5.5% in 2003.
Increased Outsourcing of Staffing Services. The use of temporary personnel enables healthcareproviders the flexibility to vary their staffing levels to match the changes in demand of their permanentstaff caused by both planned and unplanned vacancies. Healthcare providers also use temporarypersonnel to address budgeted shortfalls due to vacancy rates and are increasingly using temporarystaffing to manage seasonal fluctuations in demand for their services. The following factors havecreated seasonal fluctuations in demand for healthcare personnel:
• Seasonal population swings, in the sun-belt states of Florida, Arizona and California in thewinter months and the northeast in the summer months.
• Seasonal changes in occupancy rates that tend to increase during the winter months anddecrease during the summer months.
3
From 1997 to 2001, the growth in the number of agency nurses was 46% compared to 7% forhospital nurses, according to the PriceWaterhouseCoopers 2003 report. The healthcare staffing industryalso includes the temporary staffing of doctors and dentists, allied health personnel and professionals,and advanced practice professionals, but excludes home healthcare services.
Temporary Decrease in Demand. We believe that hospitals have taken nurse-staffing actions thathave decreased demand for travel nurse staffing, which we believe has temporarily slowed our rate ofrevenue growth during the later part of 2002. We believe these decisions have resulted in increasedreliance on staff nurse overtime, increased patient-to-nurse ratios and high wage and compensationincreases, including sign-on bonuses, by the hospitals. We also believe that due to present economicconditions, where many nurse’s spouses have been laid off and severance and unemployment benefitshave ended, many part-time nurses employed directly by hospitals who would have typically worked twoshifts or less per week have increased the number of shifts worked at their hospitals and are doing soat the prevailing hospital wage. Other factors that affect the demand for our services are patientoccupancy rates. As occupancy increases, temporary employees are often added before full-timeemployees are hired. As occupancy decreases, clients tend to reduce their use of temporary employeesbefore undertaking layoffs of their regular employees. Additionally, we may experience morecompetitive pricing pressure during these periods of decreased demand.
Legislation Change that will Increase Demand. In response to concerns by consumer groups overthe quality of care provided in healthcare facilities and concerns by nursing organizations about theincreased workloads and pressures on nurses, a number of states have either passed or introducedlegislation related to prohibiting mandatory overtime and addressing nurse-to-patient ratios. Thepassage of such legislation is expected to increase the demand for nurses. California, in particular, haspassed legislation requiring minimum nurse-to-patient ratios at all hospitals. Maine, New Jersey andOregon have passed legislation limiting mandatory overtime for nurses. Several states are considering,or have already introduced, similar legislation.
Our Competitive Strengths
Our competitive strengths include:
• Leader in Rapidly Growing Nurse Staffing Industry. We have operated in the travel nurse staffingindustry since the 1970s and have the leading brand name based on revenue. Our Cross CountryTravCorps brand is well recognized among leading healthcare providers and professionals. Webelieve that through our existing relationships with travel nurse staffing clients, we are positionedto effectively market our complementary services, which include staffing of allied health andclinical trial professionals, search and recruitment, consulting, and education and training to ourexisting client base.
• Strong and Diverse Client Relationships. We provide staffing solutions to an active client base ofover 3,000 hospitals, pharmaceutical companies and other healthcare providers across all 50states. No single client accounted for more than 3% of our revenue in 2002. In 2002, we workedwith over 70% of the nation’s top hospitals, as identified by ‘‘U.S. News & World Reports’’. Weprovide temporary staffing to our clients through assignments that typically have terms of 13weeks or longer.
• Fees Paid Directly by Clients. Our fees are paid directly by our clients rather than by governmentor other third-party payors. As a result, we have no exposure to Medicare or Medicaidreimbursements.
• Leader in Recruiting and Employee Retention. We are a leader in the recruitment and theretention of highly qualified healthcare professionals. We recruit healthcare professionals fromall 50 states and Canada. We also recruit registered nurses from English-speaking foreign
4
countries, assist them in obtaining U.S. nursing licenses, sponsor them for U.S. permanentresidency visas and then place them in domestic acute care hospitals. In 2002, approximately15,700 field staff completed applications were added to our database. Employee referralsgenerated a majority of our new candidates. We believe we offer appealing assignments,competitive compensation packages, attractive housing options and other valuable benefits. In2002, approximately 70% of our nurses accepted a new assignment with us within 35 days ofcompleting a previous assignment with us. In 1996, we established Cross Country University, thefirst educational program in the travel nurse industry to be accredited by the American NurseCredentialing Center. Cross Country University provides accreditation and continuing educationto our nurses and other healthcare professionals.
• Scalable and Efficient Operating Structure. We have an efficient centralized operating structurethat at year-end 2002 included a database of more than 170,000 nurses and other healthcareprofessionals who completed job applications with us. Our size and centralized structure provideus with operating efficiencies in key areas such as recruiting, advertising, marketing, training,housing and insurance benefits. Our integrated proprietary information system enables us tomanage virtually all aspects of our travel staffing operations. This system is designed toaccommodate significant future growth of our business.
• Quality Assurance. Our quality assurance department is structured to ensure that our healthcareclients receive professionals that are qualified to meet their needs. Each new candidate thatsubmits an application with us is screened before being placed at a healthcare facility. Ourinternal screening process requires that each new candidate has the experience, skills,credentials, education and licensing required generally of all of our candidates. Our qualityassurance department also verifies the work history and references of each candidate andensures that each candidate meets the specific requirements of each hospital client regarding,among other things, background checks, health records, drug screening, continuing educationand certifications. In addition, our quality assurance department evaluates our candidates on acontinual basis through a written evaluation process. Our healthcare clients deliver evaluationsto us after each candidate completes an assignment so that we have direct feedback from them.
• Strong Management Team with Extensive Healthcare Staffing and Acquisition Experience. Ourmanagement team has played a key role in the development of the travel nurse staffing industry.Our management team, which averages more than 10 years of experience in the healthcareindustry, has consistently demonstrated the ability to successfully identify and integrate strategicacquisitions.
Our Business
Healthcare Staffing Services
Nurse Staffing
We are a leading provider of travel nurse staffing services in the U.S. In 2002, we reorganized thedelivery of our healthcare staffing services under the Cross Country Staffing umbrella to providefixed-term, flexible-term and permanent staffing solutions on an integrated basis. Cross CountryStaffing provides hospital clients with a single point of access to our differentiated nurse recruitmentbrands consisting of Cross Country TravCorps, NovaPro, Cross Country Local and AssignmentAmerica, which allows us to recruit nurses and allied healthcare professionals on a domestic andinternational basis, and deliver an array of high quality staffing services. Nurse staffing servicesrepresented approximately 87% of this segment’s revenue in 2002.
We provide credentialed nurses for contracted fixed-term and flexible-term assignments at publicand private, and for-profit and not-for-profit facilities throughout the U.S., Canada, Bermuda and the
5

U.S. Virgin Islands. The majority of our assignments are at acute care hospitals, including teachinginstitutions, trauma centers and community hospitals located in major metropolitan areas. We alsoprovide other healthcare professionals, which include operating room technicians, therapists and otherallied health and advanced practice professionals, such as radiology technicians, rehabilitation therapistsand respiratory therapists, in a wide range of specialties. We also fill staffing assignments in non-acutecare settings, including nursing homes, skilled nursing facilities and sports medicine clinics, and, to alesser degree, in non-clinical settings, such as schools.
In addition, we provide contractual per diem nurse staffing services to healthcare facilities as astaffing solution to fill the immediate needs in managing both their day-to-day shift coverage andvarying-length local shift coverage. We operate our per diem nurse staffing services under a centralizedmodel that leverages the quality of recruitment and credentialing associated with the reputation andbrand recognition of our travel nurse staffing business while providing our hospital clients with 24x7centralized call center service from our headquarters in Boca Raton, Florida. We also operate 5 localoffices, which only conduct recruitment and credentialing. In contrast, traditional per diem staffingbusinesses operate fully staffed, full-service branches in the cities they serve. In 2002, we providedflexible-term per diem nurse staffing services to healthcare facilities in 25 states. While per diemservices accounted for less than 1% of our revenue in 2002, we believe this market presents asignificant growth opportunity.
Sales and Marketing
During 2002, we reorganized our sales and marketing efforts to respond to changing industrydynamics. To accomplish this task, Cross Country Staffing markets all the Company’s differentiatednurse and allied recruitment brands to hospitals on an integrated basis.
The Cross Country Staffing sales and marketing organization is focused on obtaining preferredprovider relationships with existing and new hospital clients and healthcare purchasing organizations.The organizational structure includes a National Accounts Team, Territory Sales Team, AccountManagers, and Product Specialists who provide a support function.
Brand Marketing. Our brand marketing initiatives help develop and foster Cross Country’s imagein the markets we serve. Our brand is reinforced by our professionally designed website, brochures andpamphlets, direct mail and advertising materials. We believe that our branding initiatives, coupled withour high-quality client service, differentiate us from our competitors and establish us as a leader, interms of brand recognition, in temporary nurse staffing.
Trade and Association Relationship Management. We actively manage trade and associationrelationships through attendance at numerous national, regional and local conferences and meetings,including National Association of Health Care Recruiters, Association of Critical Care Nurses,American Organization of Nurse Executives, American Society for Healthcare Human ResourceAdministration, American College of Healthcare Executives and Medical Group ManagementAssociation.
Nurse Recruiting
We operate differentiated nurse recruitment brands consisting of Cross Country TravCorps,NovaPro, Cross Country Local and Assignment America, which allow us to recruit nurses and alliedhealthcare professionals on a domestic and international basis, and deliver an array of high qualitystaffing services. We believe that these professionals are attracted to us because we offer them highlevels of customer service, as well as a wide range of diverse assignments at attractive locationsprimarily throughout the United States as well as in Canada, Bermuda and the U.S. Virgin Islands.
6

Our nurse recruiters are a vital component of our business, responsible for establishing andmaintaining key relationships with candidates from their introduction to the Company. Our recruiterswork with the candidates throughout the placement process on their first assignment as well assubsequent assignments. We believe our strong retention rate is a direct result of these relationships.During 2002, we substantially increased the number of our nurse recruiters from 75 to 121 at year-end,thus increasing our internal capacity to match the supply of qualified nurse candidates in our databasewith the demand of positions from our hospital clients. We believe we have an adequate number ofnurse recruiters to support the present level of demand.
Our Cross Country TravCorps and NovaPro brands recruit credentialed nurses and otherhealthcare professionals, including operating room technicians, therapists and other allied health andadvanced practice professionals such as radiology technicians, rehabilitation therapists and respiratorytherapists, for placement on fixed-term and flexible-term travel assignments away from their homes andlocal travel assignments. Our purchase of NovaPro in January of 2002 was our first step towardssegmenting the nurse population. The working nurses of Cross Country Travcorps and NovaPro each fita different demographic. Our Cross Country TravCorps brand offers nurses a more standardizedbenefits package while our NovaPro brand targets nurses seeking more customized benefits packages.
Our Cross Country Local brand recruits credentialed nurses and other healthcare professionals forflexible-term local per diem assignments at healthcare facilities made on short-notice to fill day-to-dayshift coverage and varying-length shift coverage. We operate our flexible-term per diem staffing on a24x7 basis from a centralized call center at our headquarters in Boca Raton, Florida. In 2002, weprovided flexible-term per diem nurse staffing services to healthcare facilities in 25 states. We alsooperated five local offices that only conduct recruitment and credentialing in Florida (two offices),Arizona, Illinois and Washington.
In 2001, we initiated Assignment America, our international recruitment brand designed to addressthe present shortage of nurses in the U.S. by attracting foreign-trained nurses and supplementing nurserecruiting activities in the U.S. and Canada by our Cross Country TravCorps and NovaPro brands.Assignment America currently recruits experienced acute-care nurses from English-speaking foreigncountries (the United Kingdom, Ireland, New Zealand and Australia), executes their licensure andimmigration requirements, and prepares them personally and professionally for their transition into theU.S. prior to placing them on long-term domestic assignments in acute care facilities. In January 2003,due to the current demand environment, Assignment America altered its recruitment model to focuson certain specialties. These specialties continue to have increases in demand year over year andinclude nurses that have completed their Commission on Graduates of Foreign Nursing SchoolsCertificate Program to better meet efficiencies of the U.S Boards of Nursing and current immigrationprocedures. Assignment America currently has 342 nurses in its pipeline at various stages of thelicensure and immigration process.
Recruiting and Retention
In 2002, approximately 15,700 completed field staff applications were added to our database. Morethan half of our field employees have been referred by current or former employees, with theremainder attracted by advertisements in trade publications and our internet website. Our internet siteallows potential applicants to review our business profile, apply on-line, view our company-providedhousing and participate in on-line forums. We offer appealing assignments, attractive compensationpackages, housing and other benefits, as well as substantial training opportunities through CrossCountry University.
Our recruiters are responsible for recruiting applicants, handling placements, maintaining a regulardialogue with nurses on assignment, making themselves available to address nurses’ concerns regardingcurrent assignments and future opportunities, and other significant job support and guidance.
7

Recognizing that a nurse’s relationship with the recruiter is the key to retaining qualified applicants,our recruiters establish lasting partnerships with the nurses. As part of the screening process, weconduct in-depth telephone interviews with our applicants and verify references to determinequalifications. Along with our hospital clients, we typically review our travel nurses’ performance aftereach assignment and use this information to maintain the high quality of our staffing.
Our recruiters utilize our sophisticated database of positions, which is kept up-to-date by ouraccount managers, to match assignment opportunities with the experience, skills and geographicpreferences of their candidates. Once an assignment is selected, the account manager reviews thecandidate’s resume package before submitting it to the client for review. Our educational and trainingservices give us a competitive advantage by enhancing both the quality of our nurses and theeffectiveness of our recruitment efforts. We typically monitor the quality of our workforce in the fieldthrough performance reviews after each assignment and further develop the capabilities of our recruitsthrough our Cross Country University brand. These services offer substantial benefits, such as:
• Improving the quality of our nurses by offering them substantial training opportunities;
• Enabling our nurses to easily complete state licensing requirements;
• Providing professional development opportunities to our nurses; and
• Enhancing our image within the industry.
Contracts With Field Employees and Clients
Each of our traveling field employees works for us under a contract. These contracts typically last13 weeks. Our traveling field employees that are payroll contract employees are hourly employeeswhose contract specifies the hourly rate they will be paid, including applicable overtime, and any otherbenefits they are entitled to receive during the contract period. For payroll contract employees, we billclients at an hourly rate and assume all employee costs, including payroll, withholding taxes, benefitsand professional liability insurance and OSHA requirements, as well as any travel and housingarrangements. Mobile contract employees are hourly employees of the hospital client and receive anagreement that specifies the hourly rates they will be paid by the hospital employer, as well as anybenefits they are entitled to receive from us. For mobile contract employees, we provide recruitment,housing in apartments we lease and travel services. Our contract with the healthcare professionalobligates us to provide these services to the healthcare professional. We are compensated for theservices we provide at a predetermined rate negotiated with our hospital client, without regard to ourcost of providing these services. Currently approximately 99% of our employees work for us underpayroll contracts. Our fees are paid directly by our clients rather than by government or other third-party payors. In 2002, we completed approximately 18,700 individual assignments, typically lasting 13weeks. In 2001, we completed approximately 17,000 individual assignments.
Operations
We operate from a centralized business model servicing all of the assignment needs of our fieldemployees and client facilities through operations centers located in Boca Raton and Tampa, FL andMalden, MA. These centers perform key support activities such as coordinating assignmentaccommodations, payroll processing, benefits administration, billing and collections, contract processing,client care, and risk management.
Hours worked by field employees are recorded by our operations system, which then transmits thedata directly to Automated Data Processing (ADP) for payroll processing. As a result, biweekly clientbillings are generated automatically once the payroll information is complete, enabling real timemanagement reporting capabilities as to hours worked, billings and payroll costs. Our payrolldepartment also provides customer support services for field employees who have questions.
8

We have approximately 3,100 apartments on lease throughout the U.S. Our client housingdepartment secures leases and arranges for furniture rental and utilities for field employees at theirassignment locations. Typically, we provide for shared accommodations at no cost to the healthcareprofessional on assignment with us, with lease terms that generally correspond to the length of theassignment. We believe that our economies of scale help us secure preferred pricing and favorable leaseterms.
We have also developed expertise in insurance, benefits administration and risk management.These programs are partially self-insured and are offered at no cost to our healthcare professionals.
Clinical Research and Trials Staffing
Through our ClinForce brand, we provide clinical research professionals for both fixed-termcontract assignments and permanent placement to many of the world’s leading companies in thepharmaceutical, biotechnology, medical device and related industries. We provide an array ofprofessionals in such areas as clinical research and clinical data sciences, medical review and writing,and pharmacoeconomics and regulatory affairs. Our understanding of the clinical research processenables us to provide responsive service to our clients and to offer greater opportunities to ourresearch professionals.
Other Human Capital Management Services
We provide an array of healthcare-oriented human capital management services, whichcomplement our core travel nurse staffing business. These services include:
Search and Recruitment. We provide both retained and contingency search and recruitmentservices to healthcare organizations throughout the U.S., including hospitals, pharmaceutical companies,insurance companies and physician groups. Our search services include the placement of physicians,healthcare executives and nurses.
Healthcare Consulting Services. We provide healthcare-oriented consulting services, includingconsulting related to physician compensation, strategy, operations, facilities planning, workforcemanagement and merger integration.
Education and Training Services. Cross Country University (CCU) provides continuing educationprograms to the healthcare industry. CCU holds national conferences, as well as one-day seminars, ontopics relevant to nurses and other healthcare professionals. In 2002, CCU produced 4,623 seminarsand conferences that were attended by approximately 143,700 registrants in 265 cities across the U.S.This compares to more than 3,300 CCU seminars and conferences that were attended by over 92,000registrants in more than 200 cities across the U.S. in 2001. In addition, we extend these educationalservices to our field employees on favorable terms as a recruitment and retention tool.
Systems
Our placement and support operations are supported by sophisticated information systems thatfacilitate smooth interaction between our recruitment and support functions. Our fully integratedproprietary information system enables us to manage virtually all aspects of our travel staffingoperations. The system is designed to accommodate significant future growth of our business. Inaddition, its parallel process design allows for the addition of further capacity to its existing hardwareplatform. We have proprietary software that handles most facets of our business, including contractpricing and profitability, contract processing, job posting, housing management, billing/payroll andinsurance. Our systems provide reliable support to our facility clients and field employees and enableus to efficiently fulfill and renew job assignments. Our systems also provide detailed information on thestatus and skill set of each registered field employee.
Our financial and management reporting is managed on the PeopleSoft Financial Suite. PeopleSoftis a leading enterprise resource planning software suite that provides modules used to manage our
9

accounts receivable, accounts payable, general ledger and billing. This system is designed toaccommodate significant future growth of our business.
Growth Strategy
Despite the reduction in overall demand for outsourced healthcare staffing, there still remains alevel of unmet demand for our fixed- and flexible-term healthcare staffing services. We are striving tomeet a greater portion of this demand by recruiting additional licensed nurses and other healthcareprofessionals, establishing preferred provider relationships with hospital clients, and managing ourinternal capacity to maximize the changing supply and demand requirements of the healthcare staffingmarketplace. We intend to continue to grow our businesses by:
• Enhancing Our Recruitment Efforts to Increase the Supply of Licensed Nurses and Other HealthcareProfessionals. Our recruitment strategy is focused on:
• Utilizing a segmented brand approach to recruit nurses and other healthcare professionalson a domestic and international basis while segmenting the nurse marketplace withdifferentiated brand offerings.
• Increasing the number of referrals from existing field employees by providing them withsuperior service.
• Expanding our advertising presence to reach more nursing professionals.
• Using the internet to accelerate the recruitment-to-placement cycle.
• Improving the productivity of staff dedicated to the recruitment of new nurses.
• Expanding the Range of Services We Offer our Clients. We plan to utilize Cross Country Staffingas a vehicle to provide hospital clients with a single point of access to our integrated delivery offixed-term, flexible-term and permanent healthcare staffing solutions.
• Preferred Provider Relationships. We plan to focus on establishing preferred provider relationshipswith our existing hospital clients and healthcare organizations that we do not presently providestaffing services for. We also plan to utilize our relationships with existing travel staffing clientsto more effectively market our complementary services, including staffing of clinical trials andallied health professionals, search and recruitment, consulting, and education and training.
• Increasing Our Market Presence in the Flexible-Term Per Diem Staffing Market. We intend to useour existing brand recognition, client relationships and database of nurses who have expressedan interest in flexible-term assignments to expand our per diem services to the acute carehospital market. While we have not historically had a significant presence in per diem staffingservices, we believe that this market presents a substantial growth opportunity.
• Acquiring Complementary Businesses. We continually evaluate opportunities to acquirecomplementary businesses to strengthen and broaden our market presence.
• Increasing Operating Efficiencies. We seek to increase our operating margins by increasing theproductivity of our administrative personnel, using our purchasing power to achieve greatersavings in key areas such as housing and benefits and continuing to invest in our informationsystems.
Competitive Environment
The fixed- and flexible-term travel and per diem nurse staffing industry is highly competitive, withlimited barriers to entry. Our principal competitor in the fixed-term travel nurse staffing industry isAMN Healthcare Services, Inc. We also compete with a number of nationally and regionally focusedtemporary nurse staffing companies that have the capabilities to relocate nurses geographically and, toa lesser extent, with local temporary nurse agencies. In addition, the markets for our clinical trials andallied staffing services and for our healthcare-oriented human capital management services are highlycompetitive and highly fragmented, with limited barriers to entry.
10

The principal competitive factors in attracting qualified candidates for temporary employment aresalaries and benefits, quality of accommodations, quality and breadth of assignments, speed ofplacements, quality of recruitment teams and reputation. We believe that persons seeking temporaryemployment through us are also pursuing employment through other means, including other temporarystaffing firms, and that multiple staffing companies have the opportunity to place employees with manyof our clients. Therefore, the ability to respond to candidate inquiries and submit candidates to clientsmore quickly than our competitors is an important factor in our ability to fill assignments. In addition,because of the large overlap of assignments, we focus on retaining field employees by providinglong-term benefits, such as 401(k) plans and cash bonuses. Although we believe that the relative size ofour database and economies of scale derived from the size of our operations make us an attractiveemployer for nurses seeking travel opportunities, we expect competition for candidates to continue toincrease.
The principal competitive factors in attracting and retaining temporary healthcare staffing clientsinclude the ability to fill client needs, price, quality assurance and screening capabilities, compliancewith regulatory requirements, an understanding of the client’s work environment, risk managementpolicies and coverages, and general industry reputation. In addition, the level of demand for outsourcednurse staffing is influenced by national healthcare spending and spending on hospital care; generaleconomic conditions and its impact on national, regional and local labor markets, and; thecorresponding supply of full- and part-time hospital-based nurses willing to work at prevailing hospitalwages.
Regulatory Issues
In order to service our client facilities and to comply with OSHA and JCAHO standards, we havea risk management program. The program is designed to protect against the risk of negligent hiring byrequiring a detailed skills assessment from each healthcare professional. In addition, we have a claims-based professional liability insurance policy pursuant to which we provide primary coverage of$2 million for each occurrence through a self-insured retention program that is guaranteed by a$2 million irrevocable letter of credit held by our excess insurance provider. We also provide up to$10 million in umbrella liability insurance coverage after the $2 million primary coverage has beenexhausted.
Professional Licensure. Nurses and most other healthcare professionals employed by us arerequired to be individually licensed or certified under applicable state law. In addition, the healthcareprofessionals that we staff frequently are required to have been certified to provide certain medicalcare, such as CPR and ACLS, depending on the positions in which they are placed. Our comprehensivecompliance program is designed to ensure that our employees possess all necessary licenses andcertifications, and we believe that our employees, including nurses and therapists, comply with allapplicable state laws.
Business Licenses. A number of states require state licensure for businesses that, for a fee, employand assign personnel, including healthcare personnel, to provide services on-site at hospitals and otherhealthcare facilities to support or supplement the hospitals’ or healthcare facilities’ work force. Anumber of states also require state licensure for businesses that operate placement services forindividuals attempting to secure employment. Failure to obtain the necessary licenses can result ininjunctions against operating, cease and desist orders, and/or fines. We endeavor to maintain in effectall required state licenses.
Regulations Affecting Our Clients. Many of our clients are reimbursed under the federal Medicareprogram and state Medicaid programs for the services they provide. In recent years, federal and stategovernments have made significant changes in these programs that have reduced reimbursement rates.In addition, insurance companies and managed care organizations seek to control costs by requiringthat healthcare providers, such as hospitals, discount their services in exchange for exclusive orpreferred participation in their benefit plans. Future federal and state legislation or evolving
11

commercial reimbursement trends may further reduce, or change conditions for, our clients’reimbursement. Such limitations on reimbursement could reduce our clients’ cash flows, hamperingtheir ability to pay us.
Immigration. Changes in immigration law and procedures following September 11, 2001 haveslowed down our ability to recruit foreign nurses to meet demand, and changes to such procedures inthe future could further hamper our overseas recruiting efforts. In addition, our use of foreign nursesmay entail greater difficulty in ensuring that each professional has the proper credentials and licensure.
Employees
As of February 21, 2003, we had approximately 820 corporate employees and approximately 5,500field employees. None of our employees is subject to a collective bargaining agreement. We considerour relationship with employees to be good.
Available Information
Financial reports and filings with the Securities and Exchange Commission (SEC) are availablefree of charge as soon as reasonably practicable after filing such material with, or furnishing it to, theSEC, via the internet at our website, www.crosscountry.com.
Risk Factors
In addition to the other information included in this Report on Form 10-K, you should considerthe following risk factors.
Although demand for outsourced nurse staffing has declined from higher than average levels duringthe past several years, industry dynamics are such that we are still unable to recruit enough nurses tomeet our clients’ demands for our nurse staffing services, limiting the potential growth of our staffingbusiness.
We rely significantly on our ability to attract, develop and retain nurses and other healthcarepersonnel who possess the skills, experience and, as required, licensure necessary to meet the specifiedrequirements of our healthcare staffing clients. We compete for healthcare staffing personnel with othertemporary healthcare staffing companies, as well as actual and potential clients, some of which seek tofill positions with either regular or temporary employees. Currently, there is a shortage of qualifiednurses in most areas of the United States and competition for nursing personnel is increasing. Althoughdemand has slowed down, at this time we still do not have enough nurses to meet our clients’ demandsfor our nurse staffing services. This shortage of nurses limits our ability to grow our staffing business.Furthermore, we believe that the aging of the existing nurse population and declining enrollments innursing schools will further exacerbate the existing nurse shortage. In addition, in the aftermath of theterrorist attacks on New York and Washington, we experienced a temporary interruption of normalbusiness activity. Similar events in the future could result in additional temporary or longer-terminterruptions of our normal business activity.
The costs of attracting and retaining qualified nurses and other healthcare personnel may raise morethan we anticipate.
We compete with other healthcare staffing companies for qualified nurses and other healthcarepersonnel. Because there is currently a shortage of qualified healthcare personnel, competition forthese employees is intense. To induce healthcare personnel to sign on with them, our competitors mayincrease hourly wages or other benefits. If we do not raise wages in response to such increases by ourcompetitors, we could face difficulties attracting and retaining qualified healthcare personnel. Inaddition, if we raise wages in response to our competitors’ wage increases and are unable to pass suchcost increases on to our clients, our margins could decline.
12

Our costs of providing housing for nurses and other healthcare personnel may be higher than weanticipate and, as a result, our margins could decline.
We currently have approximately 3,100 apartments on lease throughout the U.S. If the costs ofrenting apartments and furniture for our nurses and other healthcare personnel increase more than weanticipate and we are unable to pass such increases on to our clients, our margins may decline. To theextent the length of a nurse’s housing lease exceeds the term of the nurse’s staffing contract, we bearthe risk that we will be obligated to pay rent for housing we do not use. To limit the costs of unutilizedhousing, we try to secure leases with term lengths that match the term lengths of our staffing contracts,typically 13 weeks. In some housing markets we have had, and believe we will continue to have,difficulty identifying short-term leases. If we cannot identify a sufficient number of appropriateshort-term leases in regional markets, or, if for any reason, we are unable to efficiently utilize theapartments we do lease, we may be required to pay rent for unutilized housing or, to avoid such risk,we may forego otherwise profitable opportunities.
Decreases in patient occupancy at our clients’ facilities may adversely affect the profitability of ourbusiness.
The general level of patient occupancy at our clients’ facilities significantly affects demand for ourtemporary healthcare staffing services. When a hospital’s occupancy increases, temporary employees areoften added before full-time employees are hired. As occupancy decreases, clients may reduce their useof temporary employees before undertaking layoffs of their regular employees. We also may experiencemore competitive pricing pressure during periods of occupancy downturn. In addition, if a trendemerges toward providing healthcare in alternative settings, as opposed to acute care hospitals,occupancy at our clients’ facilities could decline. This reduction in occupancy could adversely affect thedemand for our services and our profitability.
We are dependent on the proper functioning of our information systems.
Our company is dependent on the proper functioning of our information systems in operating ourbusiness. Critical information systems used in daily operations identify and match staffing resources andclient assignments and perform billing and accounts receivable functions. Our information systems areprotected through physical and software safeguards and we have backup remote processing capabilities.However, they are still vulnerable to fire, storm, flood, power loss, telecommunications failures, physicalor software break-ins and similar events. In the event that critical information systems fail or areotherwise unavailable, these functions would have to be accomplished manually, which couldtemporarily impact our ability to identify business opportunities quickly, to maintain billing and clinicalrecords reliably and to bill for services efficiently.
If regulations that apply to us change, we may face increased costs that reduce our revenue andprofitability.
The temporary healthcare staffing industry is regulated in many states. In some states, firms suchas our company must be registered to establish and advertise as a nurse-staffing agency or must qualifyfor an exemption from registration in those states. If we were to lose any required state licenses, wecould be required to cease operating in those states. The introduction of new regulatory provisionscould substantially raise the costs associated with hiring temporary employees. For example, some statescould impose sales taxes or increase sales tax rates on temporary healthcare staffing services. Theseincreased costs may not be able to be passed on to clients without a decrease in demand for temporaryemployees. In addition, if government regulations were implemented that limited the amounts we couldcharge for our services, our profitability could be adversely affected.
Future changes in reimbursement trends could hamper our clients’ ability to pay us.
Many of our clients are reimbursed under the federal Medicare program and state Medicaidprograms for the services they provide. In recent years, federal and state governments have made
13

significant changes in these programs that have reduced reimbursement rates. In addition, insurancecompanies and managed care organizations seek to control costs by requiring that healthcare providers,such as hospitals, discount their services in exchange for exclusive or preferred participation in theirbenefit plans. Future federal and state legislation or evolving commercial reimbursement trends mayfurther reduce, or change conditions for, our clients’ reimbursement. Limitations on reimbursementcould reduce our clients’ cash flows, hampering their ability to pay us.
Competition for acquisition opportunities may restrict our future growth by limiting our ability tomake acquisitions at reasonable valuations.
Our business strategy includes increasing our market share and presence in the temporaryhealthcare staffing industry through strategic acquisitions of companies that complement or enhanceour business. We have historically faced competition for acquisitions. In the future, this could limit ourability to grow by acquisitions or could raise the prices of acquisitions and make them less accretive tous. In addition, restrictive covenants in our credit facility, including a covenant that requires us toobtain bank approval for any acquisition over $25.0 million, may limit our ability to complete desirableacquisitions. If we are unable to secure necessary financing under our credit facility or otherwise, wemay be unable to complete desirable acquisitions.
We may face difficulties integrating our acquisitions into our operations and our acquisitions may beunsuccessful, involve significant cash expenditures or expose us to unforeseen liabilities.
We continually evaluate opportunities to acquire healthcare staffing companies and other humancapital management services companies that complement or enhance our business and frequently havepreliminary acquisition discussions with some of these companies.
These acquisitions involve numerous risks, including:
• potential loss of key employees or clients of acquired companies;
• difficulties integrating acquired personnel and distinct cultures into our business;
• difficulties integrating acquired companies into our operating, financial planning and financialreporting systems;
• diversion of management attention from existing operations; and
• assumption of liabilities and exposure to unforeseen liabilities of acquired companies, includingliabilities for their failure to comply with healthcare regulations.
These acquisitions may also involve significant cash expenditures, debt incurrence and integrationexpenses that could have a material adverse effect on our financial condition and results of operations.Any acquisition may ultimately have a negative impact on our business and financial condition.
Significant legal actions could subject us to substantial uninsured liabilities.
In recent years, healthcare providers have become subject to an increasing number of legal actionsalleging malpractice, product liability or related legal theories. Our Company may be subject to liabilityin such cases even if the contribution to the alleged injury was minimal. Many of these actions involvelarge claims and significant defense costs. In addition, we may be subject to claims related to torts orcrimes committed by our employees or temporary staffing personnel. In some instances, we arerequired to indemnify clients against some or all of these risks. A failure of any of our employees orpersonnel to observe our policies and guidelines intended to reduce these risks, relevant client policiesand guidelines or applicable federal, state or local laws, rules and regulations could result in negativepublicity, payment of fines or other damages.
A key component of our business is the credentialing process. Ultimately, any hospital or otherhealth care provider is responsible for its own internal credentialing process, and the provider makesthe hiring decision. Nevertheless, in many situations, the provider will be relying upon the reputationand screening process of the Company. Errors in this process, or failure to detect a poor or incorrect
14
history, could have a material effect on our reputation. In addition, we do not have access to all of theresources that are available to hospitals to check credentials, such as the National Practitioner DataBank.
To protect ourselves from the cost of these types of claims, we maintain professional malpracticeliability insurance and general liability insurance coverage in amounts and with deductibles that webelieve are appropriate for our operations. Our coverage is, in part, self-insured. However, ourinsurance coverage may not cover all claims against us or continue to be available to us at a reasonablecost. If we are unable to maintain adequate insurance coverage, we may be exposed to substantialliabilities.
If our insurance costs increase significantly, these incremental costs could negatively affect ourfinancial results.
The costs related to obtaining and maintaining professional and general liability insurance andhealth insurance for healthcare providers has been increasing. The cost of our professional and generalliability insurance per FTE increased by approximately 64% in 2002. The cost of our healthcareinsurance per FTE increased by approximately 21% in 2002. If the cost of carrying this insurancecontinues to increase significantly, we will recognize an associated increase in costs, which maynegatively affect our margins. This could have an adverse impact on our financial condition.
If we become subject to material liabilities under our self-insured programs, our financial results maybe adversely affected.
We provide workers compensation coverage through a program that is partially self-insured. Inaddition, we provide medical coverage to our employees through a partially self-insured preferredprovider organization. If we become subject to substantial uninsured workers compensation or medicalcoverage liabilities, our financial results may be adversely affected.
Our clients may terminate or not renew their staffing contracts with us.
Our travel staffing arrangements with clients are generally terminable upon 30 or 90 days’ notice.We may have fixed costs, including housing costs, associated with terminated arrangements that we willbe obligated to pay post-termination.
Our clinical trials staffing business is conducted under long-term contracts with individual clientsthat may conduct numerous clinical trials. Some of these long-term contracts are terminable by theclients without cause upon 30 to 60 days’ notice.
Our indemnity from W. R. Grace, in connection with our acquisition of the assets of Cross CountryStaffing, may be materially impaired by Grace’s financial condition.
In connection with our acquisition from W. R. Grace & Co. of the assets of Cross CountryStaffing, our predecessor, Grace agreed to indemnify us against damages arising out of the breach ofcertain representations or warranties of Grace, as well as against any liabilities retained by Grace. InMarch 2001, Grace filed a voluntary petition under Chapter 11 of the United States Bankruptcy Code.This bankruptcy filing could materially impair Grace’s obligations to indemnify us.
Our principal stockholders will be able to substantially influence the outcome of all matters submittedto our stockholders for approval, regardless of the preferences of other stockholders.
Charterhouse Equity Partners III (CEP III) and investment funds managed by Morgan StanleyPrivate Equity together own approximately 35% of our outstanding common stock. Accordingly, actingtogether, they will be able to substantially influence:
• the election of directors;
• management and policies; and
15

• the outcome of any corporate transaction or other matter submitted to our stockholders forapproval, including mergers, consolidations and the sale of all or substantially all of our assets.
Currently, our board of directors is comprised of nine members, two of whom are designees ofCEP III and two of whom are designees of investment funds managed by Morgan Stanley PrivateEquity. Under our stockholders’ agreement, CEP III and the funds managed by Morgan Stanley PrivateEquity each have the right to designate two directors for nomination to our board of directors. Thisnumber decreases if either CEP III or the funds managed by Morgan Stanley Private Equity reducetheir respective ownership by more than 50% of their holdings prior to our initial public offering. Theirinterests may conflict with the interests of the other holders of common stock.
CEP III and investment funds managed by Morgan Stanley Private Equity each have demand rights tocause us to file a registration statement under the Securities Act covering resales of their stock andsales of this stock could cause our stock price to decline.
CEP III and investment funds managed by Morgan Stanley Private Equity each have demandrights to cause us to file, at our expense, a registration statement under the Securities Act coveringresales of their shares. These shares represent approximately 35% of our outstanding common stock.These shares may also be sold under Rule 144 of the Securities Act, depending on their holding periodand subject to significant restrictions in the case of shares held by persons deemed to be our affiliates.
In addition, we registered 4,398,001 shares of common stock for issuance under our stock optionplans. Options to purchase 2,937,043 shares of common stock were issued and outstanding as ofFebruary 28, 2003, of which, as of February 28, 2003, options to purchase 1,832,522 shares were vested.Common stock issued upon exercise of stock options, under our benefit plans are eligible for resale inthe public market without restriction.
We cannot predict what effect, if any, market sales of shares held by any stockholder or theavailability of these shares for future sale will have on the market price of our common stock.
If provisions in our corporate documents and Delaware law delay or prevent a change in control of ourCompany, we may be unable to consummate a transaction that our stockholders consider favorable.
Our certificate of incorporation and by-laws may discourage, delay or prevent a merger oracquisition involving us that our stockholders may consider favorable. For example, our certificate ofincorporation authorizes our board of directors to issue up to 10,000,000 shares of ‘‘blank check’’preferred stock. Without stockholder approval, the board of directors has the authority to attach specialrights, including voting and dividend rights, to this preferred stock. With these rights, preferredstockholders could make it more difficult for a third party to acquire us. Delaware law may alsodiscourage, delay or prevent someone from acquiring or merging with us.
ITEM 2. PROPERTIES
We do not own any real property. Our principal leases are listed below.
Location Function Square Feet Lease Expiration
Boca Raton, Florida . . . . . . . . . . . Headquarters 70,406 April 30, 2008Malden, Massachusetts . . . . . . . . . Staffing administration and 30,462 June 30, 2005
general office useClayton, Missouri . . . . . . . . . . . . . Search and recruitment 20,539 November 30, 2008
headquartersTampa, Florida . . . . . . . . . . . . . . . Staffing administration and 17,880 December 31, 2007
general office useAtlanta, Georgia . . . . . . . . . . . . . . Consulting headquarters 13,348 August 31, 2005Durham, North Carolina . . . . . . . . Clinical research and trials 12,744 December 31, 2004
staffing headquarters
16

ITEM 3. LEGAL PROCEEDINGS
We are not presently a party to any material legal proceedings.
ITEM 4. SUBMISSION OF MATTERS TO A VOTE OF SECURITY HOLDERS
There were no matters submitted to a vote of security holders during the fourth quarter of 2002.
PART II
ITEM 5. MARKET FOR REGISTRANT’S COMMON EQUITY AND RELATED STOCKHOLDERMATTERS
Our common stock commenced trading on the Nasdaq National Market under the symbol‘‘CCRN’’ on October 25, 2001. The following table sets forth, for the periods indicated, the high andlow closing sale prices per share of common stock on the Nasdaq National Market. (Such prices reflectinter-dealer prices, without retail mark-up, mark-down or commission and may not represent actualtransactions.)
ClosingSale Prices
Calendar Period High Low
2001Quarter Ended December 31, 2001 (from October 25, 2001) . . . . . . . . . . . . $28.00 $20.00
2002Quarter Ended March 31, 2002 . . . . . . . . . . . . . . . . . . . . . . . . . . . . . . . . . $30.97 $21.13Quarter Ended June 30, 2002 . . . . . . . . . . . . . . . . . . . . . . . . . . . . . . . . . . $38.86 $27.50Quarter Ended September 30, 2002 . . . . . . . . . . . . . . . . . . . . . . . . . . . . . . $36.51 $12.31Quarter Ended December 31, 2002 . . . . . . . . . . . . . . . . . . . . . . . . . . . . . . $16.80 $10.40
2003Quarter Ended March 31, 2003 (through March 25, 2003) . . . . . . . . . . . . . . $12.00 $ 9.98
As of March 7, 2003, there were approximately 132 stockholders of record of our common stock.In addition, there are approximately 5,100 beneficial owners of our common stock held by brokers orother institutions on behalf of stockholders.
We have never paid or declared cash dividends on our common stock. We currently intend to useavailable cash from operations for use in the operation and expansion of our business or to retire debt,to repurchase our common stock or to possibly pay cash dividends. Covenants in our credit facility limitour ability to repurchase our common stock and declare and pay cash dividends on our common stock.
During 2002, we granted options to purchase a total of 53,279 shares of common stock toemployees, including certain senior managers, at a weighted average exercise price of approximately$17.89 per share. Such grants were deemed exempt from registration under the Securities Act inreliance on either: (1) Rule 701 promulgated under the Securities Act as offers and sales of securitiespursuant to certain compensatory benefit plans and contracts relating to compensation in compliancewith Rule 701; or (2) Section 4(2) of the Securities Act, including Regulation D thereunder, astransactions by an issuer not involving any public offering.
17
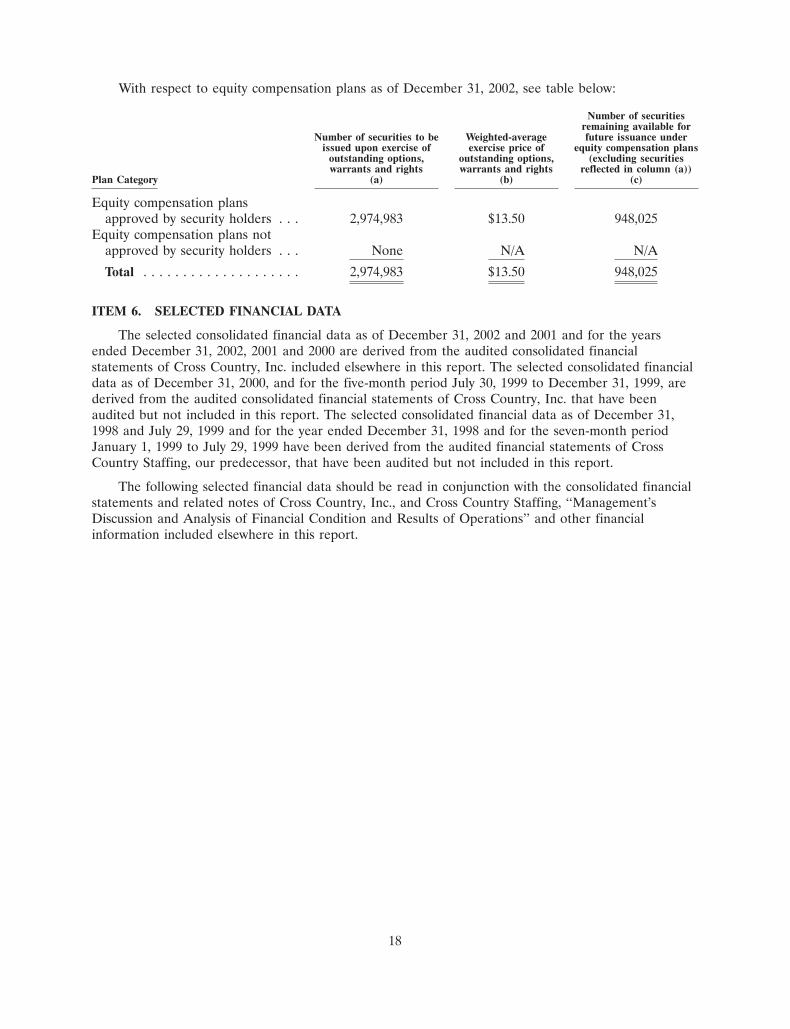
With respect to equity compensation plans as of December 31, 2002, see table below:
Number of securitiesremaining available for
Number of securities to be Weighted-average future issuance underissued upon exercise of exercise price of equity compensation plans
outstanding options, outstanding options, (excluding securitieswarrants and rights warrants and rights reflected in column (a))
Plan Category (a) (b) (c)
Equity compensation plansapproved by security holders . . . 2,974,983 $13.50 948,025
Equity compensation plans notapproved by security holders . . . None N/A N/A
Total . . . . . . . . . . . . . . . . . . . . 2,974,983 $13.50 948,025
ITEM 6. SELECTED FINANCIAL DATA
The selected consolidated financial data as of December 31, 2002 and 2001 and for the yearsended December 31, 2002, 2001 and 2000 are derived from the audited consolidated financialstatements of Cross Country, Inc. included elsewhere in this report. The selected consolidated financialdata as of December 31, 2000, and for the five-month period July 30, 1999 to December 31, 1999, arederived from the audited consolidated financial statements of Cross Country, Inc. that have beenaudited but not included in this report. The selected consolidated financial data as of December 31,1998 and July 29, 1999 and for the year ended December 31, 1998 and for the seven-month periodJanuary 1, 1999 to July 29, 1999 have been derived from the audited financial statements of CrossCountry Staffing, our predecessor, that have been audited but not included in this report.
The following selected financial data should be read in conjunction with the consolidated financialstatements and related notes of Cross Country, Inc., and Cross Country Staffing, ‘‘Management’sDiscussion and Analysis of Financial Condition and Results of Operations’’ and other financialinformation included elsewhere in this report.
18

Predecessor (a)
Period from Period fromJuly 30 January 1through through Year Ended
Years Ended December 31, December 31, July 29, December 31,
2002 2001 2000 1999(b) 1999 1998
(Dollars in thousands, except share and per share data)
Consolidated Statement of Operations DataRevenue from services . . . . . . . . . . . . . . . . . $ 639,953 $ 504,364 $ 368,332 $ 87,727 $106,047 $158,592Operating expenses:
Direct operating expenses . . . . . . . . . . . . . . 478,550 377,291 273,094 68,036 80,187 121,951Selling, general and administrative expenses (c) 94,930 68,560 49,594 9,257 12,688 19,070Bad debt expense . . . . . . . . . . . . . . . . . . . 242 1,274 433 511 157 722Depreciation . . . . . . . . . . . . . . . . . . . . . . 3,524 2,700 1,324 155 212 264Amortization . . . . . . . . . . . . . . . . . . . . . . 3,148 14,851 13,624 4,422 496 859Non-recurring secondary offering costs (d) . . . 886 — — — — —Non-recurring indirect transaction costs (e) . . . — — 1,289 — — —
Total operating expenses . . . . . . . . . . . . . . . 581,280 464,676 339,358 82,381 93,740 142,866
Income from operations . . . . . . . . . . . . . . . . 58,673 39,688 28,974 5,346 12,307 15,726Other expense:
Interest expense, net . . . . . . . . . . . . . . . . . 3,753 14,422 15,435 4,821 230 850Other expense . . . . . . . . . . . . . . . . . . . . . — — — — 190 183
Income from continuing operations beforeincome taxes . . . . . . . . . . . . . . . . . . . . . . 54,920 25,266 13,539 525 11,887 14,693
Income tax expense (f) . . . . . . . . . . . . . . . . . (21,254) (10,862) (6,807) (672) — —
Income (loss) from continuing operations . . . . . 33,666 14,404 6,732 (147) 11,887 14,693Discontinued operations, net of income tax
benefit:Loss from discontinued operations (g) . . . . . . (3,883) (741) (1,680) (195) — —Loss on disposal (g) . . . . . . . . . . . . . . . . . — (207) (454) — — —
Net income (loss) before extraordinary item . . . . 29,783 13,456 4,598 (342) 11,887 14,693Extraordinary loss on early extinguishment of
debt, net of income tax benefit (h) . . . . . . . . — (4,784) — — — —
Net income (loss) . . . . . . . . . . . . . . . . . . . . $ 29,783 $ 8,672 $ 4,598 $ (342) $ 11,887 $ 14,693
Net income (loss) per common share—basic (i):Income (loss) from continuing operations . . . . $ 1.04 $ 0.58 $ 0.29 $ (0.01)Discontinued operations . . . . . . . . . . . . . . . (0.12) (0.04) (0.09) (0.01)
Net income (loss) before extraordinary item . . . . 0.92 0.54 0.20 (0.02)Extraordinary loss on early extinguishments of
debt . . . . . . . . . . . . . . . . . . . . . . . . . . . . — (0.19) — —
Net income (loss) . . . . . . . . . . . . . . . . . . . . $ 0.92 $ 0.35 $ 0.20 $ (0.02)
Net income (loss) per common share—diluted (i):Income (loss) from continuing operations . . . . $ 1.00 $ 0.57 $ 0.29 $ (0.01)Discontinued operations . . . . . . . . . . . . . . . (0.12) (0.04) (0.09) (0.01)
Net income (loss) before extraordinary item . . . . $ 0.88 $ 0.53 $ 0.20 $ (0.02)Extraordinary loss on early extinguishments of
debt . . . . . . . . . . . . . . . . . . . . . . . . . . . . — (0.19) — —
Net income (loss) . . . . . . . . . . . . . . . . . . . . $ 0.88 $ 0.34 $ 0.20 $ (0.02)
Weighted-average common shares outstanding:Basic . . . . . . . . . . . . . . . . . . . . . . . . . . . 32,432,026 24,881,218 23,205,388 15,291,749Diluted . . . . . . . . . . . . . . . . . . . . . . . . . . 33,653,433 25,222,936 23,205,388 15,291,749
Other Operating DataAdjusted EBITDA (j) . . . . . . . . . . . . . . . . . . $ 66,231 $ 57,239 $ 45,211 $ 9,923 $ 13,015 $ 16,849Adjusted EBITDA as % of revenue . . . . . . . . . 10.3% 11.3% 12.3% 11.3% 12.3% 10.6%FTE’s (k) . . . . . . . . . . . . . . . . . . . . . . . . . . 5,535 4,816 4,167 2,789 2,466 2,264Weeks worked (l) . . . . . . . . . . . . . . . . . . . . . 287,820 250,432 216,684 61,358 73,980 117,728Average healthcare staffing revenue per FTE per
week (m) . . . . . . . . . . . . . . . . . . . . . . . . $ 2,046 $ 1,865 $ 1,619 $ 1,417 $ 1,429 $ 1,347Net cash flow provided by operating activities . . . $ 41,421 $ 19,795 $ 11,594 $ 6,301 $ 12,178 $ 14,434Net cash flow (used in) provided by investing
activities . . . . . . . . . . . . . . . . . . . . . . . . . $ (18,566) $ (42,321) $ (10,781) $ 1,370 $ (202) $ (977)Net cash flow (used in) provided by financing
activities . . . . . . . . . . . . . . . . . . . . . . . . . $ (8,381) $ 25,262 $ (5,641) $ (3,101) $(11,977) $(13,458)
19

As of As ofAs of December 31, July 29, December 31,2002 2001 2000 1999 1999 1998
(Dollars in thousands)
Consolidated Balance Sheet DataWorking capital . . . . . . . . . . . . . . . . . . . . . . . . . . . . . . . $ 78,148 $ 72,732 $ 36,436 $ 33,998 $ 9,752 $12,871Cash and cash equivalents . . . . . . . . . . . . . . . . . . . . . . . . 17,210 2,736 — 4,828 — —Total assets . . . . . . . . . . . . . . . . . . . . . . . . . . . . . . . . . . 390,600 361,980 317,626 309,695 44,464 41,901Total debt . . . . . . . . . . . . . . . . . . . . . . . . . . . . . . . . . . 42,815 48,865 157,272 159,074 7,874 13,173Stockholders’ equity (n) . . . . . . . . . . . . . . . . . . . . . . . . . . 300,832 269,927 123,340 118,742 19,466 13,451
(a) On July 29, 1999, we acquired the assets of Cross Country Staffing, which, for accounting and reporting purposes, is ourpredecessor. Financial data for the period prior to July 30, 1999 is that of Cross Country Staffing.
(b) Includes TravCorps results from December 16, 1999, the date of its acquisition, through December 31, 1999.
(c) Includes expenses related to a discontinued management incentive compensation plan of $2.1 million for the seven-monthperiod January 1-July 29, 1999. The management incentive compensation plan was discontinued on July 30, 1999.
(d) Non-recurring secondary offering costs were $0.9 million, all relating to expenses incurred as a result of our secondaryoffering in March 2002. We did not receive any proceeds from this offering and, accordingly, did not capitalize any of theassociated costs.
(e) Non-recurring indirect transaction costs consist of non-capitalizable transition bonuses and integration costs related to theTravCorps acquisition and expenses related to this transaction.
(f) Prior to July 30, 1999, our predecessor, Cross Country Staffing, operated as a partnership under the applicable provisions ofthe Internal Revenue Code, and, accordingly, income related to the operations of Cross Country Staffing was taxed directlyto its partners.
(g) Reflects the operating results of HospitalHub, Inc. and E-Staff, Inc. HospitalHub began operations in 1999. We completedthe divestiture of HospitalHub, Inc. during the second quarter of 2001. In March, 2002, we committed to a formal plan todispose of E-Staff, Inc.
(h) Extraordinary loss on early extinguishment of debt consists of a $1.6 million prepayment penalty from the early redemptionof the subordinated pay-in-kind notes and the write-off of $6.4 million of debt issuance costs related to the repayment ofborrowings under our credit facility, net of applicable taxes.
(i) The financial data contained herein for periods prior to July 30, 1999, is that of our predecessor, Cross Country Staffing, apartnership, for which share and per share amounts were not applicable.
(j) We define Adjusted EBITDA as income before interest, income taxes, depreciation, amortization, non-recurring secondaryoffering costs and non-recurring indirect transaction costs. Adjusted EBITDA should not be considered a measure offinancial performance under generally accepted accounting principles. Items excluded from Adjusted EBITDA are significantcomponents in understanding and assessing financial performance. Adjusted EBITDA is a key measure used by managementto evaluate our operations and provide useful information to investors. Adjusted EBITDA should not be considered inisolation or as an alternative to net income, cash flows generated from operating, investing or financing activities, or otherfinancial statement data presented in the consolidated financial statements as indicators of financial performance or liquidity.Because Adjusted EBITDA is not a measurement determined in accordance with generally accepted accounting principlesand is thus susceptible to varying calculations, Adjusted EBITDA as presented may not be comparable to other similarlytitled measures of other companies.
(k) FTE’s represent the average number of contract staffing personnel on a full-time equivalent basis.
(l) Weeks worked is calculated by multiplying the FTE’s by the number of weeks during the respective period.
(m) Average healthcare staffing revenue per FTE per week is calculated by dividing the healthcare staffing revenue by thenumber of weeks worked in the respective periods. Healthcare staffing revenue includes revenue from permanent placementof nurses.
(n) Consists of partners’ capital for periods prior to July 30, 1999, since our predecessor, Cross Country Staffing, was apartnership.
20

ITEM 7. MANAGEMENT’S DISCUSSION AND ANALYSIS OF FINANCIAL CONDITION ANDRESULTS OF OPERATIONS
The following discussion and analysis of our financial condition and results of operations should beread in conjunction with Selected Financial and Other Data and our consolidated financial statements andthe accompanying notes that appear elsewhere in this annual report on Form 10-K.
Certain prior year information has been reclassified to conform to the current year’s presentation.
Overview
We are one of the largest providers of healthcare staffing services in the United States. Ourhealthcare staffing business segment, which represents approximately 92% of our revenue, is comprisedof travel nurse and allied health staffing, per diem nurse staffing and clinical research trials staffing.Approximately 80% of our revenue is derived from travel nurse staffing services. Our other staffingservices include the placement of allied healthcare professionals, such as radiology technicians,rehabilitation therapists and respiratory therapists, and the placement of clinical research professionals.Our other human capital management services business segment, which represents approximately 8% ofour revenues, consists of education and training, healthcare consulting, and physician search services.For the year ended December 31, 2002, our revenue and income before interest, income taxes,depreciation, amortization, non-recurring secondary offering costs and non-recurring indirecttransaction costs as shown on the consolidated statement of operations (Adjusted EBITDA) were$640.0 million and $66.2 million, respectively.
History
In July 1999, an affiliate of Charterhouse Group International, Inc. and certain members ofmanagement acquired the assets of Cross Country Staffing, our predecessor, from W. R. Grace & Co.Upon the closing of this transaction, we changed from a partnership to a C corporation form ofownership. In December 1999, we acquired TravCorps Corporation (TravCorps), which was owned byinvestment funds managed by Morgan Stanley Private Equity and certain members of TravCorps’management and subsequently changed our name to Cross Country TravCorps, Inc. In May 2001, wechanged our name to Cross Country, Inc.
Revenue
Our travel and per diem nurse staffing revenue is received primarily from acute care hospitals. Ourclinical trials staffing revenue is received primarily from pharmaceutical and biotechnology companies,as well as medical device manufacturers. Revenue from allied health staffing services is received fromnumerous sources, including providers of radiation, rehabilitation and respiratory services at hospitals,nursing homes, sports medicine clinics and schools. Revenue from our search and recruitment,consulting and education and training services is received from numerous sources, including hospitals,physician group practices, insurance companies and individual healthcare professionals. Our fees arepaid directly by our clients rather than by government or other third-party payors.
During 2002, we adopted the provisions of the Financial Accounting Standard Board’s (FASB)Emerging Issues Task Force (EITF) Issue No. 01-14, Income Statement Characterization ofReimbursements Received for ‘‘Out-of-Pocket’’ Expenses Incurred. This EITF requires thatreimbursements received for out-of-pocket expenses should be characterized as revenue and acorresponding expense in the consolidated statements of operations. Prior to the adoption of this EITF,we reflected the reimbursement of out-of-pocket expenses as an offsetting reduction to direct operatingexpenses and selling, general, and administrative expenses. Accordingly, we have adjusted all periodsreported to reflect an increase in revenue, and an equal and offsetting increase in expenses, related to
21

reimbursable expenses. This change in classification has not had an effect on current or previouslyreported net income, or net income per share.
Revenue is recognized when services are rendered. Accordingly, accounts receivable includes anaccrual for employees’ time worked but not yet invoiced. Similarly, accrued compensation includes anaccrual for employees’ time worked but not yet paid. Each of our field employees on travel assignmentworks for us under a contract. These contracts typically last 13 weeks. Payroll contract employees arehourly employees whose contract specifies the hourly rate they will be paid, including applicableovertime, and any other benefits they are entitled to receive during the contract period. For payrollcontract employees, we bill clients at an hourly rate and assume all employee costs, including payroll,withholding taxes, benefits and professional liability insurance and Occupational Safety and HealthAdministration, or OSHA, requirements, as well as any travel and housing arrangements. Mobilecontract employees are hourly employees of the hospital client and receive an agreement that specifiesthe hourly rates they will be paid by the hospital employer, as well as any benefits they are entitled toreceive from us. For mobile contract employees, we provide recruitment, housing in apartments leasedby us and travel reimbursement. Our contract with the healthcare professional obligates us to providethese services to the healthcare professional. We are compensated for the services we provide at apredetermined rate negotiated with our hospital client, without regard to the our cost of providingthese services. Currently, approximately 99% of our employees work under payroll contracts.
Our healthcare staffing revenue and earnings are impacted by the relative supply of and demandfor nurses at healthcare facilities. We rely significantly on our ability to recruit and retain nurses andother healthcare personnel who possess the skills, experience and, as required, licensure necessary tomeet the specified requirements of our clients. Shortages of qualified nurses and other healthcarepersonnel could limit our ability to fill open assignments and grow our revenue and net income.
The relative demand for our services at client’s facilities may also affect the profitability of ourbusiness. Of late, many hospitals have taken nurse staffing actions that have decreased demand, whichwe believe has temporarily slowed our rate of revenue growth during the later part of 2002. We believethese decisions have resulted in increased reliance on staff nurse overtime, increased patient-to-nurseratios and high wage and compensation increases, including sign-on bonuses, by the hospitals. We alsobelieve that, due to present economic conditions, where many nurse’s spouses have been laid off andseverance and unemployment benefits have ended, many part-time nurses employed directly byhospitals who would have typically worked two shifts or less per week have increased the number ofshifts worked at their hospitals; and are doing so at the prevailing hospital wage. Other factors thataffect the demand for our services are patient occupancy rates. As occupancy increases, temporaryemployees are often added before full-time employees are hired. As occupancy decreases, clients tendto reduce their use of temporary employees before undertaking layoffs of their regular employees.Additionally, we may experience more competitive pricing pressure during these periods of decreaseddemand.
22

Acquisitions
The following table provides certain information relating to our acquisitions to date:
Potential Earnout EarnedAcquired Business Acquisition Date Primary Services Purchase Price(a) Earnout to date
Jennings, Ryan & Kolb, March 2002 Healthcare management $ 2.1 million $1.8 million $0.5 millionInc. . . . . . . . . . . . . . . consulting services over 34 months
NovaPro . . . . . . . . . . . . January 2002 Nurse staffing $ 7.6 million — —
Gill/Balsano Consulting, May 2001 Healthcare management $ 1.8 million $2.0 million $1.2 millionLLC. . . . . . . . . . . . . . consulting services over 3 years
ClinForce, Inc. . . . . . . . . March 2001 Clinical trials staffing $32.8 million — —
Heritage ProfessionalEducation, LLC . . . . . . December 2000 Continuing education for $ 6.6 million $6.5 million $3.5 million
healthcare professionals over 3 years
E-Staff (Discontinuedin 2002) . . . . . . . . . . . July 2000 Internet subscription based $ 1.5 million $3.8 million(b) $0.5 million
communication, scheduling, over 3 yearscredentialing and trainingservices
TravCorps Corporation . . . December 1999 Healthcare staffing- allied $77.1 million — —and nurse professionals
(a) Acquisition purchase price includes cash paid, the assumption of debt and post-closing adjustments. The Travcorpsacquisition price represents the approximate value of our common stock that was exchanged for all the outstanding shares ofTravcorps—$32.1 million, plus the assumption of $45.0 million of debt.
(b) Due to the discontinuance of the E-Staff business we do not expect additional earnout payments to be made.
Discontinued Operations
In March 2002, we committed to a formal plan to dispose of our subsidiary, E-Staff, through a saleof this business. E-Staff was previously included in our other human capital management servicessegment. E-Staff is an application service provider that has developed an internet subscription basedcommunication, scheduling, credentialing and training service business for healthcare providers. As anapplication service provider, E-Staff maintains a database of the client’s employees on E-Staff’s servers,and prospective E-Staff clients were concerned about placing their health care employees names andcredentials on servers owned or controlled by one of the nation’s largest healthcare staffing companies.Accordingly, we decided to sell this subsidiary. Pursuant to FASB Statement No. 144, our consolidatedfinancial statements have been reclassified to reflect the discontinuance of E-Staff. The costs andexpenses, assets and liabilities of E-Staff have been segregated and reported as discontinued operationsin the consolidated balance sheets and statements of operations.
In December 2000, we committed to a formal plan to divest HospitalHub, Inc., or HospitalHub,our electronic job board business, which began operations in 1999. The operating results ofHospitalHub have been accounted for as discontinued operations in our consolidated financialstatements and notes thereto and in the other financial information included herein. We completed thedivestiture of HospitalHub in the second quarter of 2001.
Goodwill and Other Identifiable Intangible Assets
Goodwill and other identifiable intangible assets from the acquisition of the assets of ourpredecessor, Cross Country Staffing, a Partnership, and from subsequent acquisitions were
23

$226.1 million and $22.9 million, respectively, at December 31, 2002. We adopted the provisions ofFASB No. 142, Goodwill and Other Intangible Assets, as of January 1, 2002. Accordingly, goodwill andcertain other identifiable intangible assets are no longer subject to amortization. Instead, we reviewimpairment annually. Other identifiable intangible assets, which are subject to amortization, are beingamortized using the straight-line method over their estimated useful lives ranging from 3 to 15 years.Goodwill and other intangible assets represented 82.8% of our stockholders’ equity as of December 31,2002. The amount of definite-lived intangible assets amortized equaled 4.6% of our income fromoperations for the year ended December 31, 2002.
Results of Operations
The following table summarizes, for the periods indicated, selected statement of operations dataexpressed as a percentage of revenue:
Year Ended December 31,
2002 2001 2000
Revenue from services . . . . . . . . . . . . . . . . . . . . . . . . . . . . . . . . 100.0% 100.0% 100.0%Direct operating expenses . . . . . . . . . . . . . . . . . . . . . . . . . . . . . . 74.8 74.8 74.1Selling, general and administrative expenses . . . . . . . . . . . . . . . . . 14.8 13.6 13.5Bad debt expense . . . . . . . . . . . . . . . . . . . . . . . . . . . . . . . . . . . . 0.1 0.3 0.1Adjusted EBITDA (a) . . . . . . . . . . . . . . . . . . . . . . . . . . . . . . . . . 10.3 11.3 12.3Depreciation and amortization . . . . . . . . . . . . . . . . . . . . . . . . . . . 1.0 3.4 4.1Non-recurring secondary offering and indirect transaction costs . . . 0.1 — 0.3Income from operations . . . . . . . . . . . . . . . . . . . . . . . . . . . . . . . 9.2 7.9 7.9Interest expense, net . . . . . . . . . . . . . . . . . . . . . . . . . . . . . . . . . . 0.6 2.9 4.2Income from continuing operations before income taxes . . . . . . . . 8.6 5.0 3.7Income tax expense . . . . . . . . . . . . . . . . . . . . . . . . . . . . . . . . . . . (3.3) (2.1) (1.9)Income from continuing operations . . . . . . . . . . . . . . . . . . . . . . . 5.3 2.9 1.8Loss from discontinued operations, net of income taxes . . . . . . . . (0.6) (0.2) (0.4)Loss on disposal of discontinued operations, net of income taxes . . — (0.0) (0.1)Net income before extraordinary item . . . . . . . . . . . . . . . . . . . . . 4.7 2.7 1.3Extraordinary loss on early extinguishment of debt . . . . . . . . . . . . — (1.0) —Net income . . . . . . . . . . . . . . . . . . . . . . . . . . . . . . . . . . . . . . . . 4.7% 1.7% 1.3%
(a) We define Adjusted EBITDA as income before interest, income taxes, depreciation, amortization,non-recurring secondary offering costs and non-recurring indirect transaction costs. AdjustedEBITDA should not be considered a measure of financial performance under generally acceptedaccounting principles. Items excluded from Adjusted EBITDA are significant components inunderstanding and assessing financial performance. Adjusted EBITDA is a key measure used bymanagement to evaluate our operations and provide useful information to investors. AdjustedEBITDA should not be considered in isolation or as an alternative to net income, cash flowsgenerated by operations, investing or financing activities, or other financial statement datapresented in the consolidated financial statements as indicators of financial performance orliquidity. Because Adjusted EBITDA is not a measurement determined in accordance withgenerally accepted accounting principles and is thus susceptible to varying calculations, AdjustedEBITDA as presented may not be comparable to other similarly titled measures of othercompanies.
24

Segment Information
The following table presents, for the periods indicated, selected statement of operations data bysegment:
Year Ended December 31,
2002 2001 2000
(dollars in thousands)
Revenue (a):Healthcare staffing . . . . . . . . . . . . . . . . . . . . . . . . . . . . . $588,743 $466,986 $350,856Other human capital management services . . . . . . . . . . . . 51,210 37,378 17,476
$639,953 $504,364 $368,332
Contribution income (b):Healthcare staffing . . . . . . . . . . . . . . . . . . . . . . . . . . . . . $ 81,160 $ 70,853 $ 61,937Other human capital management services . . . . . . . . . . . . 6,521 4,701 1,315
Unallocated corporate overhead . . . . . . . . . . . . . . . . . . . . . (21,450) (18,315) (18,041)
Adjusted EBITDA . . . . . . . . . . . . . . . . . . . . . . . . . . . . . . . $ 66,231 $ 57,239 $ 45,211
(a) We adopted EITF Issue No. 01-14, which states that reimbursements received for out-of-pocketexpenses should be characterized as revenue in the income statement. This required certainreclassifications of our revenue, cost of sales and selling, general and administrative expenses. Thischange has been reflected in all periods presented.
(b) We define contribution income as earnings before interest, income taxes, depreciation,amortization and corporate expenses not specifically identified to a reporting segment. During theyear ended December 31, 2002 we refined our methodology for allocating corporate overheadexpenses to our segments to more accurately reflect the profitability of each segment. Certain prioryear segment data has been reclassified to reflect this improvement in the allocation methodology.Segment information for 2000 was not reclassified as it would not have provided meaningfulcomparisons. This change in the allocation of overhead expenses does not impact prior yearconsolidated financial statements. Additionally, E-Staff, which was previously included in otherhuman capital management services, has been included in discontinued operations.
Year Ended December 31, 2002 Compared to Year Ended December 31, 2001
Revenue for the year ended December 31, 2002 totaled $640.0 million as compared to$504.4 million for the year ended December 31, 2001. Comparisons include revenue from theacquisitions in 2002 and 2001. Excluding the effects of these acquisitions, revenue for 2002 increased19.1% as compared with the year ended December 31, 2001.
Revenue from our healthcare staffing segment for the year ended December 31, 2002 totaled$588.7 million as compared to $467.0 million for the year ended December 31, 2001. Revenue fromNovaPro, acquired in January 2002, and a full year’s revenue, rather than 91⁄2 months of revenue fromClinForce in 2001 (as ClinForce was acquired on March 16, 2001) was included in 2002. Excluding theeffects of these acquisitions, revenue increased $88.6, million or 19.0%, as compared with 2001 revenue.The increase was attributable to a higher average hourly bill rate in all businesses and an increase inthe numbers of field employees in our nurse staffing and allied health staffing businesses, offset in partby a modest reduction in the hours billed per FTE per week. The average number of hours worked perweek per FTE continued to decrease in 2002 primarily as a result of an increase in the number ofnurses working three 12-hour shifts rather than five 8-hour shifts. For the year ended December 31,2002, 86.8% of our healthcare staffing revenue was generated by nurse staffing operations and 13.2%was generated by other operations. For the year ended December 31, 2001, 86.5% of our healthcare
25

staffing revenue was generated by nurse staffing operations and 13.5% was generated by otheroperations.
Revenue from our other human capital management services segment for the year endedDecember 31, 2002 totaled $51.2 million as compared to $37.4 million for the year endedDecember 31, 2001. Revenue in 2002 included JRK, which was acquired March 1, 2002, and 3 monthsmore of Gill/Balsano, which was acquired on April 1, 2001. Excluding the effects of these acquisitions,revenue increased $7.8 million, or 20.8%, as compared with the year ended December 31, 2001. Thisincrease is primarily due to an increase in revenues from our educational seminars business. Revenuefrom the educational seminars business increased due to an increase in number of seminars conductedand the number of attendees, partially offset by a lower average price per seminar.
Direct operating expenses are comprised primarily of field employee compensation expenses,housing expenses, travel expenses and field insurance expenses. Direct operating expenses totaled$478.6 million for the year ended December 31, 2002 as compared to $377.3 million for the year endedDecember 31, 2001. As a percentage of revenue, direct operating expenses represented 74.8% ofrevenue for the years ended December 31, 2002 and 2001.
Selling, general and administrative expenses for the year ended December 31, 2002 totaled$94.9 million as compared to $68.6 million for the year ended December 31, 2001. As a percentage ofrevenue, selling, general and administrative expenses represented 14.8% of revenue for the year endedDecember 31, 2002 compared with 13.6% for the year ended December 31, 2001. This increase isprimarily due to increased expenses in our healthcare staffing business. In 2002, we invested in ourcentralized per diem and international recruitment business and hired additional recruiters for our coretravel nurse staffing business.
Bad debt expense for the year ended December 31, 2002 totaled $0.2 million as compared to$1.3 million for the year ended December 31, 2001. As a percentage of revenue, bad debt expenserepresented 0.1% of revenue for 2002 compared with 0.3% for 2001. This decrease was due toimproved collections coupled with a decrease in write-offs.
Adjusted EBITDA, as a result of the above, totaled $66.2 million for the year ended December 31,2002 as compared to $57.2 million for the year ended 2001. As a percentage of revenue, AdjustedEBITDA represented 10.3% of revenue for the year ended December 31, 2002 compared with 11.3%for the year ended December 31, 2001.
Depreciation and amortization expense for the year ended December 31, 2002 totaled $6.7 millionas compared to $17.6 million for the year ended December 31, 2001. As a percentage of revenue,depreciation and amortization expense declined to 1.0% for the year ended December 31, 2002 from3.4% for the year ended December 31, 2001. This decrease was primarily due to a decrease inamortization of intangibles as a result of the adoption of FASB Statement No. 142 in January 2002 andthe write-off of $6.4 million of debt issuance costs in October 2001 as a result of our initial publicoffering. FASB Statement No. 142 promulgates that goodwill and certain intangible assets that haveindefinite lives should not be amortized. Instead, goodwill and certain intangible assets are reviewedannually for impairment. No impairment charges were necessary as of December 31, 2002.
Non-recurring secondary offering costs for the year ended December 31, 2002 were $0.9 million,all relating to expenses incurred as a result of our secondary offering in March 2002. We did notreceive any proceeds from this offering and, accordingly, did not capitalize any of the associated costs.
Income from operations for the year ended December 31, 2002 totaled $58.7 million as comparedto $39.7 million for the year ended December 31, 2001. As a percentage of revenue, income fromoperations represented 9.2% of revenue for the year ended December 31, 2002 compared with 7.9%for the year ended December 31, 2001.
26

Net interest expense for the year ended December 31, 2002 totaled $3.8 million as compared to$14.4 million for the year ended December 31, 2001. The decrease in 2002 was primarily due to therepayment of approximately $134.5 million of debt with the proceeds received from our initial publicoffering of common stock in October 2001.
Income from continuing operations before income taxes for the year ended December 31, 2002totaled $54.9 million as compared to $25.3 million for the year ended December 31, 2001.
Income tax expense for the year ended December 31, 2002 was $21.3 million as compared to$10.9 million for the year ended December 31, 2001. The Company’s effective tax rate was 38.7% forthe year ended December 31, 2002 and 43.0% for the year ended December 31, 2001. The tax rate hasbeen impacted by our adoption of FASB Statement No. 142. Certain non-tax deductible intangibleassets, which were being amortized for financial reporting purposes during the year endedDecember 31, 2001, were not amortized during the year ended December 31, 2002. The tax treatmentof these intangible assets remained the same. Accordingly, the effective tax rate was lower during theyear ended December 31, 2002.
As a result of the above, income from continuing operations totaled $33.7 million, or $1.00 perdiluted share, for the year ended December 31, 2002 as compared to $14.4 million, or $0.57 per dilutedshare for the year ended December 31, 2001.
Losses from discontinued operations, net of income tax benefits, for the years ended December 31,2002 and December 31, 2001, were $3.9 million and $0.9 million, respectively. Losses from discontinuedoperations in the year ended December 31, 2002 include E-Staff’s results of operations and animpairment charge of $2.5 million after-taxes relating to the development of our E-Staff technology, aweb-enabling scheduling business. Losses in the year ended December 31, 2001 include the results ofoperations of E-Staff and adjustments to the estimated loss on disposal of the HospitalHub business,which was sold in June 2001.
Net income for the year ended December 31, 2002 totaled $29.8 million, or $0.88 per dilutedshare, as compared to $8.7 million, or $0.34 per diluted share for the year ended December 31, 2001.
Year Ended December 31, 2001 Compared to Year Ended December 31, 2000
Revenue for the year ended December 31, 2001 totaled $504.4 million as compared to$368.3 million for the year ended December 31, 2000. Revenue included from ClinForce and Heritage,which were acquired on March 16, 2001 and December 26, 2000, respectively, totaled $43.7 million forthe year ended December 31, 2001. Excluding the effects of these acquisitions, revenue increased25.1%, as compared with the year ended December 31, 2000.
Revenue from our healthcare staffing segment for the year ended December 31, 2001 totaled$467.0 million as compared to $350.9 million for the year ended December 31, 2000. Revenue includedfrom ClinForce totaled $28.8 million for the year ended December 31, 2001. Excluding the effect ofthis acquisition, revenue increased $87.3 million or 24.9%, as compared with 2000 revenue. Theincrease was attributable to a higher average hourly bill rate in all businesses and increased numbers offield employees in both the travel nursing and allied health staffing businesses, offset in part by amodest reduction in the hours billed per FTE per week. The average number of hours worked perweek per FTE decreased primarily as a result of an increase in the number of nurses working three12-hour shifts rather than five 8-hour shifts. For the year ended December 31, 2001, 86.5% of ourhealthcare staffing revenue was generated by nurse staffing operations and 13.5% was generated byother operations. For the year ended December 31, 2000, 92.7% of our healthcare staffing revenue wasgenerated by nurse staffing operations and 7.3% was generated by other operations. This shift isprimarily a result of our expansion of healthcare staffing services into the clinical trials sector throughour acquisition of ClinForce.
27

Revenue from our other human capital management services segment for the year endedDecember 31, 2001 totaled $37.4 million as compared to $17.5 million for the year endedDecember 31, 2000. Revenue included from Heritage totaled $14.9 million for the year endedDecember 31, 2001. Excluding the effect of this acquisition, revenue increased $5.0 million, or 28.5%,as compared with the year ended December 31, 2000. This increase is primarily due to more favorablepricing in our physician search and existing consulting businesses, as well as our acquisition of Gill/Balsano.
Direct operating expenses are comprised primarily of field employee compensation expenses,housing expenses, travel expenses and field insurance expenses. Direct operating expenses totaled$377.3 million for the year ended December 31, 2001 as compared to $273.1 million for the year endedDecember 31, 2000. As a percentage of revenue, direct operating expenses represented 74.8% ofrevenue for the year ended December 31, 2001 compared with 74.1% for the year ended December 31,2000. The increase in direct operating expenses as a percent of revenue was mostly attributable to anincrease in field salaries, housing costs, and health and professional liability insurance, along with anincrease in the percentage of nurses working under staffing rather than mobile contracts. Theseincreases were partly offset by the relatively lower direct operating expenses as a percent of revenue foreach of ClinForce and Heritage.
Selling, general and administrative expenses for the year ended December 31, 2001 totaled$68.6 million as compared to $49.6 million for the year ended December 31, 2000. As a percentage ofrevenue, selling, general and administrative expenses represented 13.6% of revenue for the year endedDecember 31, 2001 compared with 13.5% for the year ended December 31, 2000.
Bad debt expense for the year ended December 31, 2001 totaled $1.3 million as compared to$0.4 million for the year ended December 31, 2000. As a percentage of revenue, bad debt expenserepresented 0.3% of revenue for 2001 compared with 0.1% for 2000. This increase is primarily due toan increase in the percentage of accounts receivable greater than 90 days.
Adjusted EBITDA, as a result of the above, totaled $57.2 million for the year ended December 31,2001 as compared to $45.2 million for the year ended December 31, 2000. As a percentage of revenue,Adjusted EBITDA represented 11.3% of revenue for the year ended December 31, 2001 comparedwith 12.3% for the year ended December 31, 2000.
Depreciation and amortization expense for the year ended December 31, 2001 totaled$17.6 million as compared to $14.9 million for the year ended December 31, 2000. The increase indepreciation and amortization expense in 2001 was due primarily to increased amortization of goodwilland other intangibles resulting from the Heritage and ClinForce acquisitions. As a percentage ofrevenue, depreciation and amortization expense represented 3.4% of revenue for 2001 compared with4.1% for the year ended December 31, 2000.
Non-recurring indirect transaction costs totaled $1.3 million for the year ended December 31, 2000,which consisted primarily of transition bonuses related to the TravCorps acquisition.
Income from operations for the year ended December 31, 2001 totaled $39.7 million as comparedto $29.0 million for the year ended December 31, 2000. As a percentage of revenue, income fromoperations represented 7.9% of revenue for the years ended December 31, 2001 and 2000.
Net interest expense for the year ended December 31, 2001 totaled $14.4 million as compared to$15.4 million for the year ended December 31, 2000. The decrease in 2001 was primarily due to therepayment of approximately $134.5 million debt with the proceeds received from our initial publicoffering of common stock in October 2001 and a decrease in interest rates.
Income from continuing operations before income taxes for the year ended December 31, 2001totaled $25.3 million as compared to $13.5 million for the year ended December 31, 2000.
28

Income tax expense for the year ended December 31, 2001 was $10.9 million as compared to$6.8 million for the year ended December 31, 2000. The Company’s effective tax rate was 43.0% forthe year ended December 31, 2001 and 50.3% for the year ended December 31, 2000. This decline inour effective tax rate was primarily a result of non-deductible amortization expenses representing asmaller proportion of our income from continuing operations before income taxes. For the year endedDecember 31, 2001 and 2000, amortization of non-deductible intangibles resulting from the TravCorpsacquisition was $2.0 million and $2.8 million, respectively.
As a result of the above, income from continuing operations totaled $14.4 million, or $0.57 perdiluted share, for the year ended December 31, 2001 as compared to $6.7 million, or $0.29 per dilutedshare for the year ended December 31, 2000.
Losses from discontinued operations, net of income tax benefits, for the years ended December 31,2001 and December 31, 2000, were $0.9 million and $2.1 million, respectively. Losses in the year endedDecember 31, 2001 include the results of operations of E-Staff and an adjustment to the estimated losson disposal of the HospitalHub business, which was sold in June 2001. Losses in the year endedDecember 31, 2000 include an estimated loss on disposal of HospitalHub and the 2000 results ofoperations of the HospitalHub and E-Staff businesses.
Extraordinary loss on the early extinguishment of debt totaled $4.8 million, after tax, for the yearended December 31, 2001. This amount represents the write off of $6.4 million in loan fees due to therepayment of $134.5 million of debt and a prepayment penalty of $1.6 million on the early terminationof $38.8 million of subordinated debt, less applicable taxes. The debt was repaid with proceeds fromour initial public offering of common stock in October 2001.
Net income for the year ended December 31, 2001 totaled $8.7 million, or $0.34 per diluted share,as compared to $4.6 million, or $0.20 per diluted share, for the year ended December 31, 2000.
Liquidity and Capital Resources
As of December 31, 2002, we had a current ratio, the amount of current assets divided by currentliabilities, of 2.6 to 1.0. Working capital increased by $5.4 million to $78.1 million as of December 31,2002, compared to $72.7 million as of December 31, 2001. The increase in working capital wasprimarily attributable to an increase in cash and accounts receivable partially offset by an increase inthe current portion of long-term debt and a decrease in our deferred tax asset and net assets ofdiscontinued operations. Part of the increase in accounts receivable was related to acquisitions.Excluding acquisitions, accounts receivable increased $6.9 million, however, days sales outstanding was56 days at December 31, 2002, down from 63 days at December 31, 2001. This reduction was due toimproved collections.
Our operating cash flows constitute our primary source of liquidity and historically have beensufficient to fund our working capital, capital expenditures, internal business expansion, and debtservice. We believe that our capital resources are sufficient to meet our working capital needs for thenext twelve months. We expect to meet our future needs for working capital, capital expenditures,internal business expansion, debt service, and any additional stock repurchases from a combination ofoperating cash flows and funds available under our credit facility. We also continue to evaluateacquisition opportunities that may require additional funding.
On October 30, 2001, we completed our initial public offering of 7,812,500 shares of common stockat $17.00 share. Additionally, the underwriters exercised the over-allotment option of 1,171,875 shares,bringing the total number of shares issued to 8,984,375. Total proceeds received by the Company, net ofexpenses related to the initial public offering were $138.8 million. The proceeds were used to repay$89.6 million of our outstanding balance under the term loan portion of our senior secured creditfacility, $6.1 million of our outstanding balance under the revolver portion of our senior secured credit
29

facility, and $40.3 million to redeem our outstanding senior subordinated pay-in-kind notes, includingthe associated redemption premium. The remainder of the proceeds was used for general corporatepurposes.
On March 20, 2002, an aggregate of 9,000,000 shares of our common stock were sold by existingshareholders pursuant to a registration statement filed by us with the Securities and ExchangeCommission. We did not sell any shares nor receive any of the proceeds from the sale of these sharesbut paid $0.9 million of expenses for such registration in 2002.
On November 5, 2002, our Board of Directors authorized a stock repurchase program, whereby,we may purchase up to 1,500,000 of our common shares at an aggregate price not to exceed$25.0 million. In November 2002, we amended our credit facility to increase our limitation onrepurchases of capital stock in order to allow us to proceed with this program. As of December 31,2002, we purchased and retired 435,000 shares of our common stock at an average cost of $13.83 pershare pursuant to the current authorization. The cost of such purchases was $6.0 million. Under thisprogram, the shares may be purchased from time to time on the open market. The repurchase programmay be discontinued at any time at the discretion of the Company.
Credit Facility
The credit facility is provided by a lending syndicate comprised of Citicorp USA, GE Capital,Wachovia Bank, Deutsche Bank, SunTrust Bank, Fleet Bank, Highland Capital Management, L.P., INGUS Capital, Sovereign Bank, Bank of America and Provident Bank of Maryland. We amended ourcredit facility in February and November, 2002. As of December 31, 2002, the amended credit facilitywas comprised of (i) a revolving credit facility of up to $30.0 million, including a swing-line sub-facilityof $7.0 million and a letter of credit sub-facility of $15.0 million, and (ii) a $42.6 million term loanfacility (which was reduced by $15.3 million after a 2003 repayment). The revolving facility matures onJuly 29, 2005 and the term loan facility has staggered maturities through 2005.
Borrowings under the amended credit facility bear interest at variable rates based, at our option,on LIBOR or the prime rate plus various applicable margins that are determined by the amendedcredit facility. As of December 31, 2002, the weighted average effective interest rate under theamended credit facility, including the effects of our interest rate swap, was 8.63%. We are required topay a quarterly commitment fee at a rate of 0.50% per annum on unused commitments under therevolving loan facility. As of December 31, 2002, we had no borrowings outstanding under ourrevolving credit facility and $9.8 million of outstanding letters of credit, leaving availability under ourrevolving credit facility of $20.2 million.
The terms of the credit facility include customary covenants and events of default. Our investmentscovenant requires us to obtain the consent of our lenders to complete any acquisition, the costs ofwhich exceeds $25.0 million. In the event of an event of default, our lenders may terminate theirlending commitments to us and declare our outstanding indebtedness under the credit facility due andpayable, together with accrued but unpaid interests and fees. Borrowings under the amended creditfacility are collateralized by substantially all our assets and the assets of our subsidiaries.
Year Ended December 31, 2002 Compared to Year Ended December 31, 2001
Net cash provided by operating activities during 2002 more than doubled to $41.4 millioncompared to $19.8 million during 2001. Investing activities used $18.6 million during 2002 compared to$42.3 million during 2001. Investing activities in 2002 were primarily attributable to current yearacquisitions and capital expenditures relating to upgrading our information systems. NovaPro and JRKwere acquired in the first quarter of 2002 using cash of approximately $9.8 million during the yearended December 31, 2002. The remainder of cash used in 2002 was primarily for earnout paymentsrelating to previous acquisitions. Investing activities in 2001 included approximately $32.8 million for
30

the acquisition of ClinForce and $2.1 million for the acquisitions of Heritage and Gill/Balsano. Netcash used in financing activities during 2002 totaled $8.4 million compared to cash provided byfinancing activities of $25.3 million in 2001. In 2002, we used $6.4 million to repay debt and$6.0 million to repurchase shares of our common stock in accordance with the approved programdescribed above. These uses were offset by cash received from the exercise of stock options in 2002. In2001, cash provided by financing activities came from our initial public offering and the proceeds fromissuance of debt for acquisitions; offset by repayments of debt using the offering proceeds and fundsgenerated by operations.
Year Ended December 31, 2001 Compared to Year Ended December 31, 2000
Net cash provided by operating activities during 2001 increased $8.2 million to $19.8 millioncompared to $11.6 million during 2000. Investing activities totaled $42.3 million during 2001 comparedto a use of $10.8 million during 2000. Investing activities in 2001 included approximately $32.8 millionfor the acquisition of ClinForce and $2.1 million for the acquisitions of Heritage and Gill/Balsano.Investing activities during 2000 included $6.2 million for the acquisition of Heritage and $2.6 millionrelating to our investment in E-Staff, now a discontinued business. Net cash provided by financingactivities during 2001 totaled $25.3 million compared to cash used in financing activities of $5.6 millionin 2000. The increase in cash provided by financing activities in 2001 was due to our initial publicoffering and the proceeds from issuance of debt for acquisitions; offset by repayments of debt using theoffering proceeds and funds generated by operations.
Commitments
The following table reflects our significant contractual obligations and other commitments as ofDecember 31, 2002:
Contractual Obligations Total 2003 2004 2005 2006 2007 Thereafter
(Dollars in thousands)
Term Loan . . . . . . . . . . . . . . . . . . . . . . . . $42,575 $14,289 $18,297 $ 9,989 $ — $ — $ —Operating Leases . . . . . . . . . . . . . . . . . . . 17,348 3,341 3,406 2,830 2,377 2,033 3,361
$59,923 $17,630 $21,703 $12,819 $2,377 $2,033 $3,361
Since December 31, 2002, we have repaid $15.3 million of our borrowings under the term loanportion of our credit facility, which have adjusted our scheduled maturities in accordance with theprovisions of our credit facility. Subsequent to the repayment, the scheduled maturities of the termloan, in thousands, are: 2003-$5,981; 2004-$14,031; and 2005-$7,274.
Critical Accounting Principles and Estimates
In response to the Securities and Exchange Commission’s Release Number 33-8040 ‘‘CautionaryAdvice Regarding Disclosure About Critical Accounting Policies’’ and Number 33-8056 ‘‘CommissionStatement about Management’s Discussion and Analysis of Financial Condition and Results ofOperations,’’ we have identified the following critical accounting policies that affect the more significantjudgments and estimates used in the preparation of our consolidated financial statements. Thepreparation of our financial statements in conformity with accounting principles generally accepted inthe United States of America requires us to make estimates and judgments that affect our reportedamounts of assets and liabilities, revenues and expenses, and related disclosures of contingent assetsand liabilities. On an on-going basis, we evaluate our estimates, including those related to assetimpairment, accruals for insurance, allowance for doubtful accounts, and contingencies and litigation.We state our accounting policies in the notes to the audited consolidated financial statements andrelated notes for the year ended December 31, 2002, contained herein. These estimates are based on
31

the information that is currently available to us and on various other assumptions that we believe to bereasonable under the circumstances. Actual results could vary from those estimates under differentassumptions or conditions.
We believe that the following critical accounting policies affect the more significant judgments andestimates used in the preparation of our consolidated financial statements:
• We have recorded goodwill and intangibles resulting from our acquisitions throughDecember 31, 2002. Through December 31, 2001, goodwill and other intangibles were amortizedon a straight-line basis over their estimated useful lives of 3 to 25 years. Upon the adoption ofFASB Statement No. 142 on January 1, 2002, we ceased amortizing goodwill and certain otherintangible assets with indefinite lives and performed a transitional impairment analysis as ofJanuary 1, 2002, to assess the recoverability of these intangibles, in accordance with theprovisions of FASB Statement No. 142. We also completed the annual impairment test ofgoodwill and indefinite lived intangible assets during the fourth quarter of 2002. Based on theresults of these tests, we determined that there was no impairment of goodwill or indefinite livedintangible assets as of January 1, or December 31, 2002. The calculation of fair value used inthese impairment assessments included a number of estimates and assumptions, includingprojections of future income and cash flows, the identification of appropriate market multiplesand the choice of an appropriate discount rate. If we are required to record an impairmentcharge in the future, it could have an adverse impact on our results of operations. Weperiodically evaluate the recovery of the carrying amount of net assets from discontinuedoperations to determine if the net assets are impaired. This evaluation can also be triggered byvarious indicators of impairment, including factors, which could cause the estimated discountedcash flows to be less than the carrying amount of net assets. During the year endedDecember 31, 2002, an impairment charge of approximately $2.5 million net of income taxbenefit of $1.6 million, was taken on the net assets of E-Staff and is included in our consolidatedstatement of operations as loss from discontinued operations. At December 31, 2002, fair valuewas based on the latest offer received for the sale of E-Staff and included the estimated cashflows from the sale to a potential buyer, adjusted for the estimated probability of the sale. Anyfurther impairment would be immaterial.
• We maintain accruals for our health, workers compensation and professional liability policiesthat are partially self-insured and are classified in accrued employee compensation and benefitsin our consolidated balance sheets. We determine the adequacy of these accruals by periodicallyevaluating our historical experience and trends related to health, workers compensation, andprofessional liability claims and payments, based on actuarial computations and industryexperience and trends. If such information indicates that our accruals are overstated orunderstated, we will reduce or provide for additional accruals as appropriate.
• We maintain an allowance for doubtful accounts for estimated losses resulting from the inabilityof our customers to make required payments, which results in a provision for bad debt expense.We determine the adequacy of this allowance by continually evaluating individual customerreceivables, considering the customer’s financial condition, credit history and current economicconditions. If the financial condition of our customers were to deteriorate, resulting in animpairment of their ability to make payments, additional allowances may be required.
• We are subject to various claims and legal actions in the ordinary course of our business. Someof these matters include professional liability and employee-related matters. Our hospital andhealthcare facility clients may also become subject to claims, governmental inquiries andinvestigations and legal actions to which we may become a party relating to services provided byour professionals. From time to time, and depending upon the particular facts andcircumstances, we may be subject to indemnification obligations under our contracts with our
32

hospital and healthcare facility clients relating to these matters. Although we are currently notaware of any such pending or threatened litigation that we believe is reasonably likely to have amaterial adverse effect on us, if we become aware of such claims against us, we will evaluate theprobability of an adverse outcome and provide accruals for such contingencies as necessary.
Recently Issued Accounting Standards
In June 2001, the FASB issued FASB Statement No. 142, Goodwill and Other Intangible Assets. Weadopted the provisions of FASB Statement No. 142, as of January 1, 2002. FASB Statement No. 142further clarifies the criteria to recognize intangible assets separately from goodwill and promulgatesthat goodwill and certain intangible assets with indefinite lives not be amortized. Instead, these assetsare reviewed for impairment annually with any related losses recognized in earnings when incurred.Other identifiable intangible assets continue to be amortized, under the provisions of this Statement,using the straight-line method over their estimated useful lives ranging from 3 to 15 years.
In August 2001, the FASB issued FASB Statement No. 144, Accounting for the Impairment orDisposal of Long-Lived Assets. We adopted the provisions of FASB Statement No. 144 as of January 1,2002. In accordance with this Statement, long-lived assets are reviewed for impairment whenever eventsor changes in circumstances indicate that the carrying amount may not be recoverable. We periodicallyreview long-lived assets, including identifiable intangible assets, to determine if any impairment existsbased upon projected, undiscounted net cash flows of the Company. Recoverability of intangible assetsis measured by comparison of the carrying amount of the asset to net future cash flows expected to begenerated from the asset. At December 31, 2002 and 2001, we believe that no impairment of long-livedassets or identifiable intangible assets exists.
In April 2002, the FASB issued FASB Statement No. 145, Rescission of Statements 4, 44, and 64,Amendment of FASB Statement No. 13, and Technical Corrections. This Statement rescinds FASBStatement No. 4, Reporting Gains and Losses from Extinguishment of Debt, and an amendment of thatStatement, FASB Statement No. 64, Extinguishments of Debt Made to Satisfy Sinking-Fund Requirements.This Statement also rescinds FASB Statement No. 44, Accounting for Intangible Assets of Motor Carriers.This Statement amends FASB Statement No. 13, Accounting for Leases, to eliminate an inconsistencybetween the required accounting for sale-leaseback transactions and the required accounting for certainlease modifications that have economic effects that are similar to sale-leaseback transactions. ThisStatement also amends other existing authoritative pronouncements to make various technicalcorrections, clarify meanings, or describe their applicability under changed conditions. We have notadopted the provisions of this statement as of December 31, 2002. The provisions of this Statementrelated to the rescission of Statement 4 are effective for fiscal years beginning after May 15, 2002. Anygain or loss on extinguishment of debt that was classified as an extraordinary item in prior periodspresented that does not meet the criteria in Opinion 30 for classification as an extraordinary item shallbe reclassified. Accordingly, our extraordinary loss on early extinguishment of debt will be reclassifiedupon adoption of this standard in the year ending December 31, 2003.
In July 2002, the FASB issued FASB Statement No. 146, Accounting for Costs Associated with Exitor Disposal Activities. FASB Statement No. 146 requires that a liability for a cost that is associated withan exit or disposal activity be recognized when the liability is incurred. It nullifies the guidance in EITFIssue No. 94-3, Liability Recognition for Certain Employee Termination Benefits and Other Costs to Exit anActivity (including Certain Costs Incurred in a Restructuring). Under EITF 94-3, an entity recognized aliability for an exit cost on the date that the entity committed itself to an exit plan. Under FASBStatement No. 146, an entity’s commitment to a plan does not, by itself, create a present obligation toother parties that meets the definition of a liability. FASB Statement No. 146 will be effective for exitor disposal activities that are initiated after December 31, 2002. We have not adopted the provisions ofFASB Statement No. 146 in the December 31, 2002 financial statements, or for any prior periods. The
33

adoption of FASB Statement No. 146 is expected to impact the timing of recognition of costs associatedwith future exit and disposal activities.
In December 2002, the FASB issued FASB Statement No. 148, Accounting for Stock BasedCompensation—Transition and Disclosure. FASB Statement No.148 amends FASB Statement No. 123,Accounting for Stock-Based Compensation, to provide alternative methods of transition for a voluntarychange to the fair value based method of accounting for stock-based employee compensation. Further,the Statement requires disclosure of comparable information for all companies regardless of whether,when, or how an entity adopts the preferable, fair value based method of accounting. These disclosuresare now required for interim periods in addition to the traditional annual disclosure. FASB StatementNo. 148 is effective for fiscal periods ending after December 15, 2002. We have adopted the additionaldisclosure requirements as of December 31, 2002.
Inflation
During the last several years, the rate of inflation in healthcare related services has exceeded thatof the economy as a whole. This inflation has increased our direct operating costs. We are alsoimpacted by fluctuations in housing costs and recently by increases in costs of professional, general andhealthcare insurance. Historically, we have been able to recoup the negative impact of such fluctuationsby increasing our billing rates. We may not be able to continue increasing our billing rates andincreases in our direct operating costs may adversely affect us in the future. In addition, our clients areimpacted by payments of healthcare benefits by federal and state governments as well as privateinsurers.
ITEM 7A. QUANTITATIVE AND QUALITATIVE DISCLOSURES ABOUT MARKET RISK
We are exposed to interest rate changes, primarily as a result of our credit facility, which bearsinterest based on floating rates. We are party to an interest rate swap agreement, which fixes theinterest rate paid on $45.0 million of borrowings under our credit facility at 6.705% plus the applicablemargin. The last swap payment was made in February 2003. Prior to January 2001, we accounted forthe swap agreement as a hedge, which means changes in the fair value of the swap were not requiredto be recognized in earnings. Effective January 1, 2001, we adopted FASB Statement No. 133,Accounting for Derivative Instruments and Hedging Activities. Upon adopting FASB Statement No. 133,we recorded a liability for the fair value of the swap, which reduced consolidated stockholders’ equityby $0.9 million. We recognized changes in the fair value of the swap in earnings to the extent suchchanges were greater or less than the corresponding change in the fair value of the future variableinterest payments on the portion of the debt underlying the swap. During the year ended December 31,2002, other comprehensive income increased by $0.8 million as a result of this interest rate swap. Thefair value of our interest rate swap at December 31, 2002 was $0.6 million and is separately stated inour consolidated balance sheets. Changes in interest rates, which result in a yield curve that is differentfrom those projected, may cause changes in the fair value of the swap.
A 1% change in interest rates on variable rate debt would have resulted in interest expensefluctuating approximately $0.5 million for 2002 and $1.2 million for 2001 and 2000.
ITEM 8. FINANCIAL STATEMENTS AND SUPPLEMENTARY DATA
See Item 15 of Part IV of this Report.
ITEM 9. CHANGES IN AND DISAGREEMENTS WITH ACCOUNTANTS ON ACCOUNTING ANDFINANCIAL DISCLOSURE
Not applicable.
34

PART III
ITEM 10. DIRECTORS AND EXECUTIVE OFFICERS OF THE REGISTRANT
Information with respect to directors and executive officers is included in Cross Country’s ProxyStatement (the ‘‘Proxy Statement’’) to be filed pursuant to Regulation 14A with the SEC and suchinformation is incorporated herein by reference.
ITEM 11. EXECUTIVE COMPENSATION
Information with respect to executive compensation is included in the Proxy Statement to be filedwith the SEC and such information is incorporated herein by reference.
ITEM 12. SECURITY OWNERSHIP OF CERTAIN BENEFICIAL OWNERS AND MANAGEMENTAND RELATED STOCKHOLDER MATTERS
Information with respect to the Company’s common stock is included in the Proxy Statement to befiled with the SEC and such information is incorporated herein by reference.
ITEM 13. CERTAIN RELATIONSHIPS AND RELATED TRANSACTIONS
Information with respect to certain relationships and related transactions is included in the ProxyStatement to be filed with the SEC and such information is incorporated herein by reference.
ITEM 14. CONTROLS AND PROCEDURES
Within 90 days prior to the date of this report, the Company carried out an evaluation, under thesupervision and with the participation of the Company’s Chief Executive Officer and Chief FinancialOfficer, of the effectiveness of the design and operation of the Company’s disclosure controls andprocedures (as defined in Rules 13a-14(c) and 15d-14(c) under the Securities Exchange Act of 1934, asamended (the ‘‘Exchange Act’’)). Based upon the evaluation, the Company’s Chief Executive Officerand Chief Financial Officer concluded that the Company’s disclosure controls and procedures areeffective. Disclosure controls and procedures are designed to ensure that information required to bedisclosed in Company reports filed or submitted under the Exchange Act is recorded, processed,summarized and reported within the time periods specified in the Securities and ExchangeCommission’s rules and forms.
There have been no significant changes in the Company’s internal controls or in other factors thatcould significantly affect the Company’s internal controls subsequent to the date of the evaluation.
35

PART IV
ITEM 15. EXHIBITS, FINANCIAL STATEMENT SCHEDULES AND REPORTS ON FORM 8-K
(a) See Index to Financial Statements immediately following Exhibit Index.
(b) Form 8-Ks have been filed pursuant to Item 5, Other Events and Required FD Disclosure onOctober 18, 2002 and November 6, 2002.
(c) Exhibits
See Exhibit Index immediately following certifications
36

Signatures
Pursuant to the requirements of Section 13 or 15(d) of the Securities Exchange Act of 1934, theRegistrant has duly caused this report to be signed on its behalf by the undersigned, thereunto dulyauthorized.
CROSS COUNTRY, INC.
By: /s/ JOSEPH A. BOSHART
Name: Joseph A. BoshartTitle: Chief Executive Officer and President
Dated: March 26, 2003
Pursuant to the requirements of the Securities Exchange Act of 1934, this report has been signedby the following persons in the capacities indicated and on the dates indicated:
Signature Title Date
President, Chief Executive Officer,/s/ JOSEPH A. BOSHARTDirector (Principal Executive March 26, 2003
Joseph A. Boshart Officer)
/s/ EMIL HENSEL Chief Financial Officer and Director March 26, 2003(Principal Financial Officer)Emil Hensel
/s/ DANIEL J. LEWISChief Accounting Officer March 26, 2003
Daniel J. Lewis
/s/ KAREN H. BECHTELDirector March 26, 2003
Karen H. Bechtel
/s/ W. LARRY CASHDirector March 26, 2003
W. Larry Cash
/s/ THOMAS C. DIRCKSDirector March 26, 2003
Thomas C. Dircks
/s/ A. LAWRENCE FAGANDirector March 26, 2003
A. Lawrence Fagan
/s/ FAZLE HUSAINDirector March 26, 2003
Fazle Husain
/s/ JOSEPH SWEDISHDirector March 26, 2003
Joseph Swedish
/s/ JOSEPH TRUNFIODirector March 26, 2003
Joseph Trunfio
37

CERTIFICATIONS PURSUANT TO SECTION 302 OF THE SARBANES-OXLEY ACT OF 2002
I, Joseph A. Boshart, certify that:
1. I have reviewed this annual report on Form 10K of Cross Country, Inc.;
2. Based on my knowledge, this report does not contain any untrue statement of a material fact oromit to state a material fact necessary to make the statements made, in light of the circumstancesunder which such statements were made, not misleading with respect to the period covered by thisannual report;
3. Based on my knowledge, the financial statements, and other financial information included in thisannual report, fairly present in all material respects the financial condition, results of operationsand cash flows of the registrant as of, and for, the periods presented in this annual report;
4. The registrant’s other certifying officers and I am responsible for establishing and maintainingdisclosure controls and procedures (as defined in Exchange Act Rules 13a-14 and 15d-14) for theregistrant and have:
a) designed such disclosure controls and procedures to ensure that material information relatingto the registrant, including its consolidated subsidiaries, is made known to us by others withinthose entities, particularly during the period in which this annual report is being prepared;
b) evaluated the effectiveness of the registrant’s disclosure controls and procedures as of a datewithin 90 days prior to the filing date of this annual report (the ‘‘Evaluation Date’’); and
c) presented in this annual report our conclusions about the effectiveness of the disclosurecontrols and procedures based on our evaluation as of the Evaluation Date;
5. The registrant’s other certifying officer and I have disclosed, based on our most recent evaluation,to the registrant’s auditors and the audit committee of registrant’s board of directors (or personsperforming the equivalent functions):
a) all significant deficiencies in the design or operation of internal controls which could adverselyaffect the registrant’s ability to record, process, summarize and report financial data and haveidentified for the registrant’s auditors any material weaknesses in internal controls; and
b) any fraud, whether or not material, that involves management or other employees who have asignificant role in the registrant’s internal controls; and
6. The registrant’s other certifying officer and I have indicated in this annual report whether or notthere were significant changes in internal controls or in other factors that could significantly affectinternal controls subsequent to the date of our most recent evaluation, including any correctiveactions with regard to significant deficiencies and material weaknesses.
Date: March 26, 2003
/s/ Joseph A. BoshartJoseph A. BoshartPresident and Chief Executive Officer
38

I, Emil Hensel, certify that:
1. I have reviewed this annual report on Form 10K of Cross Country,Inc.;
2. Based on my knowledge, this report does not contain any untrue statement of a material fact oromit to state a material fact necessary to make the statements made, in light of the circumstancesunder which such statements were made, not misleading with respect to the period covered by thisannual report;
3. Based on my knowledge, the financial statements, and other financial information included in thisannual report, fairly present in all material respects the financial condition, results of operationsand cash flows of the registrant as of, and for, the periods presented in this annual report;
4. The registrant’s other certifying officers and I are responsible for establishing and maintainingdisclosure controls and procedures (as defined in Exchange Act Rules 13a-14 and 15d-14) for theregistrant and have:
a) designed such disclosure controls and procedures to ensure that material information relatingto the registrant, including its consolidated subsidiaries, is made known to us by others withinthose entities, particularly during the period in which this annual report is being prepared;
b) evaluated the effectiveness of the registrant’s disclosure controls and procedures as of a datewithin 90 days prior to the filing date of this annual report (the ‘‘Evaluation Date’’); and
c) presented in this annual report our conclusions about the effectiveness of the disclosurecontrols and procedures based on our evaluation as of the Evaluation Date;
5. The registrant’s other certifying officer and I have disclosed, based on our most recent evaluation,to the registrant’s auditors and the audit committee of registrant’s board of directors (or personsperforming the equivalent functions):
a) all significant deficiencies in the design or operation of internal controls which could adverselyaffect the registrant’s ability to record, process, summarize and report financial data and haveidentified for the registrant’s auditors any material weaknesses in internal controls; and
b) any fraud, whether or not material, that involves management or other employees who have asignificant role in the registrant’s internal controls; and
6. The registrant’s other certifying officer and I have indicated in this annual report whether or notthere were significant changes in internal controls or in other factors that could significantly affectinternal controls subsequent to the date of our most recent evaluation, including any correctiveactions with regard to significant deficiencies and material weaknesses.
Date: March 26, 2003
/s/ Emil HenselEmil HenselChief Financial Officer
39

Exhibit Index
No. Description
2.1+ Cross Country Staffing Asset Purchase Agreement, dated June 24, 1999, by and among W. R.Grace & Co.-Conn., a Connecticut corporation, Cross Country Staffing, a Delaware generalpartnership, and the Registrant, a Delaware corporation
2.2+ Agreement and Plan of Merger, dated as of October 29, 1999, by and among the Registrant,CCTC Acquisition, Inc. and Certain Stockholders of Cross Country Staffing, Inc andTravCorps Corporation and the Stockholders of TravCorps Corporation
2.3+ Stock Purchase Agreement, dated as of December 15, 2000, by and between EdgewaterTechnology, Inc. and the Registrant
3.1+ Amended and Restated Certificate of Incorporation of the Registrant
3.2+ Amended and Restated By-laws of the Registrant
4.1+ Form of specimen common stock certificate
4.2+ Amended and Restated Stockholders Agreement, dated August 23, 2001, among theRegistrant, a Delaware corporation, the CEP Investors and the Investors
4.3+ Registration Rights Agreement, dated as of October 29, 1999, among the Registrant, aDelaware corporation, and the CEP Investors and the MSDWCP Investors
4.4+ Amendment to the Registration Rights Agreement, dated as of August 23, 2001, among theRegistrant, a Delaware corporation, and the CEP Investors and the MSDWCP Investors
4.5+ Stockholders Agreement, dated as of August 23, 2001, among the Registrant, Joseph Boshartand Emil Hensel and the Financial Investors
10.1+ Employment Agreement, dated as of June 24, 1999, between Joseph Boshart and theRegistrant
10.2+ Employment Agreement, dated as of June 24, 1999, between Emil Hensel and the Registrant
10.3+ Employment Agreement termination, dated as of December 21, 2000, between Bruce Cerulloand the Registrant
10.4+ Lease Agreement, dated April 28, 1997, between Meridian Properties and the Registrant
10.5+ Lease Agreement, dated October 31, 2000, by and between Trustees of the Goldberg BrothersTrust, a Massachusetts Nominee Trust and TVCM, Inc.
10.6+ 222 Building Standard Office Lease between Clayton Investors Associates, LLC and Cejka &Company
10.7* Amended and Restated 1999 Stock Option Plan of the Registrant
10.8* Amended and Restated Equity Participation Plan of the Registrant
10.9+ Second Amended and Restated Credit Agreement, dated as of March 16, 2001 (the ‘‘CreditAgreement’’), among the Registrant, the Lenders Party thereto, Salomon Smith Barney, Inc.,as Arranger, Citicorp USA, Inc. as Administrative Agent, Collateral Agent, Issuing Bank andSwingline Lender, Bankers Trust Company, as Syndication Agent, and Wachovia Bank, N.A.,as Documentation Agent
40
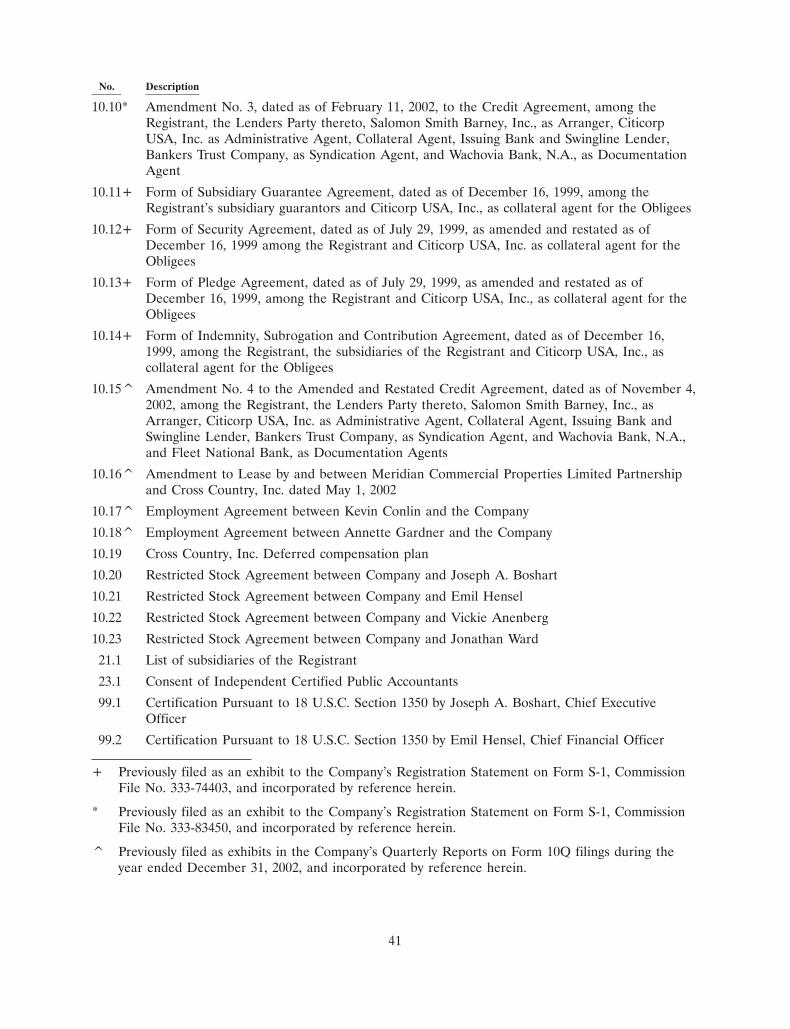
No. Description
10.10* Amendment No. 3, dated as of February 11, 2002, to the Credit Agreement, among theRegistrant, the Lenders Party thereto, Salomon Smith Barney, Inc., as Arranger, CiticorpUSA, Inc. as Administrative Agent, Collateral Agent, Issuing Bank and Swingline Lender,Bankers Trust Company, as Syndication Agent, and Wachovia Bank, N.A., as DocumentationAgent
10.11+ Form of Subsidiary Guarantee Agreement, dated as of December 16, 1999, among theRegistrant’s subsidiary guarantors and Citicorp USA, Inc., as collateral agent for the Obligees
10.12+ Form of Security Agreement, dated as of July 29, 1999, as amended and restated as ofDecember 16, 1999 among the Registrant and Citicorp USA, Inc. as collateral agent for theObligees
10.13+ Form of Pledge Agreement, dated as of July 29, 1999, as amended and restated as ofDecember 16, 1999, among the Registrant and Citicorp USA, Inc., as collateral agent for theObligees
10.14+ Form of Indemnity, Subrogation and Contribution Agreement, dated as of December 16,1999, among the Registrant, the subsidiaries of the Registrant and Citicorp USA, Inc., ascollateral agent for the Obligees
10.15^ Amendment No. 4 to the Amended and Restated Credit Agreement, dated as of November 4,2002, among the Registrant, the Lenders Party thereto, Salomon Smith Barney, Inc., asArranger, Citicorp USA, Inc. as Administrative Agent, Collateral Agent, Issuing Bank andSwingline Lender, Bankers Trust Company, as Syndication Agent, and Wachovia Bank, N.A.,and Fleet National Bank, as Documentation Agents
10.16^ Amendment to Lease by and between Meridian Commercial Properties Limited Partnershipand Cross Country, Inc. dated May 1, 2002
10.17^ Employment Agreement between Kevin Conlin and the Company
10.18^ Employment Agreement between Annette Gardner and the Company
10.19 Cross Country, Inc. Deferred compensation plan
10.20 Restricted Stock Agreement between Company and Joseph A. Boshart
10.21 Restricted Stock Agreement between Company and Emil Hensel
10.22 Restricted Stock Agreement between Company and Vickie Anenberg
10.23 Restricted Stock Agreement between Company and Jonathan Ward
21.1 List of subsidiaries of the Registrant
23.1 Consent of Independent Certified Public Accountants
99.1 Certification Pursuant to 18 U.S.C. Section 1350 by Joseph A. Boshart, Chief ExecutiveOfficer
99.2 Certification Pursuant to 18 U.S.C. Section 1350 by Emil Hensel, Chief Financial Officer
+ Previously filed as an exhibit to the Company’s Registration Statement on Form S-1, CommissionFile No. 333-74403, and incorporated by reference herein.
* Previously filed as an exhibit to the Company’s Registration Statement on Form S-1, CommissionFile No. 333-83450, and incorporated by reference herein.
^ Previously filed as exhibits in the Company’s Quarterly Reports on Form 10Q filings during theyear ended December 31, 2002, and incorporated by reference herein.
41

[THIS PAGE INTENTIONALLY LEFT BLANK]

INDEX TO FINANCIAL STATEMENTS
Page
Cross Country, Inc.Report of Independent Certified Public Accountants . . . . . . . . . . . . . . . . . . . . . . . . . . . . . . . F-2Consolidated Balance Sheets as of December 31, 2002 and 2001 . . . . . . . . . . . . . . . . . . . . . . . F-3Consolidated Statements of Operations for the Years Ended December 31, 2002,
2001 and 2000 . . . . . . . . . . . . . . . . . . . . . . . . . . . . . . . . . . . . . . . . . . . . . . . . . . . . . . . . . F-4Consolidated Statement of Stockholders’ Equity for the Years Ended December 31, 2002,
2001 and 2000 . . . . . . . . . . . . . . . . . . . . . . . . . . . . . . . . . . . . . . . . . . . . . . . . . . . . . . . . . F-5Consolidated Statements of Cash Flows for the Years Ended December 31, 2002,
2001 and 2000 . . . . . . . . . . . . . . . . . . . . . . . . . . . . . . . . . . . . . . . . . . . . . . . . . . . . . . . . . F-6Notes to the Consolidated Financial Statements . . . . . . . . . . . . . . . . . . . . . . . . . . . . . . . . . . . F-7
Financial Statements ScheduleSchedule II—Valuation and Qualifying Accounts for the Years Ended December 31, 2002,
2001 and 2000 . . . . . . . . . . . . . . . . . . . . . . . . . . . . . . . . . . . . . . . . . . . . . . . . . . . . . . . . . II-1
Schedules not filed herewith are either not applicable, the information is not material or theinformation is set forth in the financial statements or notes thereto.
F-1

Report of Independent Certified Public Accountants
The Board of Directors and StockholdersCross Country, Inc.
We have audited the accompanying consolidated balance sheets of Cross Country, Inc. as ofDecember 31, 2002 and 2001, and the related consolidated statements of operations, stockholders’equity and cash flows for each of the three years in the period ended December 31, 2002. Our auditsalso included the financial statement schedule listed in the index at Item 15(a). These financialstatements and schedule are the responsibility of the Company’s management. Our responsibility is toexpress an opinion on these financial statements based on our audits.
We conducted our audits in accordance with auditing standards generally accepted in the UnitedStates. Those standards require that we plan and perform the audit to obtain reasonable assuranceabout whether the financial statements are free of material misstatement. An audit includes examining,on a test basis, evidence supporting the amounts and disclosures in the financial statements. An auditalso includes assessing the accounting principles used and significant estimates made by management,as well as evaluating the overall financial statement presentation. We believe that our audits provide areasonable basis for our opinion.
In our opinion, the financial statements referred to above present fairly, in all material respects,the consolidated financial position of Cross Country, Inc. at December 31, 2002 and 2001, and theconsolidated results of their operations and their cash flows for each of the three years in the periodended December 31, 2002, in conformity with accounting principles generally accepted in the UnitedStates. Also, in our opinion, the related financial statement schedule, when considered in relation tothe basic financial statements taken as a whole, present fairly, in all material respects, the informationset forth therein.
As discussed in Note 2 to the financial statements, in 2002 the Company changed its method ofaccounting for goodwill.
/s/ Ernst & Young LLP
West Palm Beach, FloridaFebruary 5, 2003
F-2

Cross Country, Inc.
Consolidated Balance Sheets
December 31,
2002 2001
AssetsCurrent assets:
Cash and cash equivalents . . . . . . . . . . . . . . . . . . . . . . . . . . . . . . . . . . . . . . $ 17,209,946 $ 2,735,960Accounts receivable, less allowance for doubtful accounts of $2,250,047 in 2002
and $2,424,865 in 2001 . . . . . . . . . . . . . . . . . . . . . . . . . . . . . . . . . . . . . . . 97,641,426 87,414,713Deferred income taxes . . . . . . . . . . . . . . . . . . . . . . . . . . . . . . . . . . . . . . . . . 645,177 4,398,198Income taxes receivable . . . . . . . . . . . . . . . . . . . . . . . . . . . . . . . . . . . . . . . . 1,815,458 1,512,155Prepaid rent on employees’ apartments . . . . . . . . . . . . . . . . . . . . . . . . . . . . . 4,038,736 3,992,775Deposits on employees’ apartments, net of allowance of $261,782 in 2002 and
$512,562 in 2001 . . . . . . . . . . . . . . . . . . . . . . . . . . . . . . . . . . . . . . . . . . . 1,051,191 1,138,173Assets from discontinued operations, net . . . . . . . . . . . . . . . . . . . . . . . . . . . . 247,789 3,483,615Other current assets . . . . . . . . . . . . . . . . . . . . . . . . . . . . . . . . . . . . . . . . . . 5,428,138 3,954,507
Total current assets . . . . . . . . . . . . . . . . . . . . . . . . . . . . . . . . . . . . . . . . . . . . . 128,077,861 108,630,096Property and equipment, net of accumulated depreciation and amortization of
$12,928,611 in 2002 and $8,785,801 in 2001 . . . . . . . . . . . . . . . . . . . . . . . . . . . 12,394,162 8,501,933Trademark, net of accumulated amortization of $1,401,169 in 2002 and 2001 . . . . . . 15,748,831 15,398,831Goodwill, net of accumulated amortization of $20,873,294 in 2002 and 2001 . . . . . . 226,115,646 218,748,858Other identifiable intangible assets, net of accumulated amortization of $8,824,087
in 2002 and $6,114,775 in 2001 . . . . . . . . . . . . . . . . . . . . . . . . . . . . . . . . . . . 7,112,663 9,308,225Debt issuance costs, net of accumulated amortization of $1,236,562 in 2002 and
$797,921 in 2001 . . . . . . . . . . . . . . . . . . . . . . . . . . . . . . . . . . . . . . . . . . . . . 1,105,470 1,390,364Other assets . . . . . . . . . . . . . . . . . . . . . . . . . . . . . . . . . . . . . . . . . . . . . . . . . 45,180 1,200
Total assets . . . . . . . . . . . . . . . . . . . . . . . . . . . . . . . . . . . . . . . . . . . . . . . . . . $390,599,813 $361,979,507
Liabilities and stockholders’ equityCurrent liabilities:
Accounts payable and accrued expenses . . . . . . . . . . . . . . . . . . . . . . . . . . . . . $ 3,296,638 $ 3,172,152Accrued employee compensation and benefits . . . . . . . . . . . . . . . . . . . . . . . . . 29,663,232 26,699,668Current portion of long-term debt . . . . . . . . . . . . . . . . . . . . . . . . . . . . . . . . . 14,311,336 2,424,594Notes payable . . . . . . . . . . . . . . . . . . . . . . . . . . . . . . . . . . . . . . . . . . . . . . . 50,581 1,365,009Net liabilities from discontinued operations . . . . . . . . . . . . . . . . . . . . . . . . . . . 185,889 173,697Other current liabilities . . . . . . . . . . . . . . . . . . . . . . . . . . . . . . . . . . . . . . . . 2,422,642 2,062,674
Total current liabilities . . . . . . . . . . . . . . . . . . . . . . . . . . . . . . . . . . . . . . . . . . 49,930,318 35,897,794Interest rate swap . . . . . . . . . . . . . . . . . . . . . . . . . . . . . . . . . . . . . . . . . . . . . 606,356 2,508,877Deferred income taxes . . . . . . . . . . . . . . . . . . . . . . . . . . . . . . . . . . . . . . . . . . 10,778,749 8,570,361Long-term debt . . . . . . . . . . . . . . . . . . . . . . . . . . . . . . . . . . . . . . . . . . . . . . . 28,452,603 45,075,406
Total liabilities . . . . . . . . . . . . . . . . . . . . . . . . . . . . . . . . . . . . . . . . . . . . . . . . 89,768,026 92,052,438
Commitments and contingenciesStockholders’ equity:
Common stock—$.0001 par value; 100,000,000 shares authorized; 32,229,666 and32,211,745 shares issued and outstanding at December 31, 2002 and 2001,respectively . . . . . . . . . . . . . . . . . . . . . . . . . . . . . . . . . . . . . . . . . . . . . . . 3,223 3,221
Additional paid-in capital . . . . . . . . . . . . . . . . . . . . . . . . . . . . . . . . . . . . . . . 258,488,773 258,151,811Accumulated other comprehensive loss . . . . . . . . . . . . . . . . . . . . . . . . . . . . . . (371,687) (1,156,736)Retained earnings . . . . . . . . . . . . . . . . . . . . . . . . . . . . . . . . . . . . . . . . . . . . 42,711,478 12,928,773
Total stockholders’ equity . . . . . . . . . . . . . . . . . . . . . . . . . . . . . . . . . . . . . . . . 300,831,787 269,927,069
Total liabilities and stockholders’ equity . . . . . . . . . . . . . . . . . . . . . . . . . . . . . . . $390,599,813 $361,979,507
See accompanying notes.
F-3

Cross Country, Inc.
Consolidated Statements of Operations
Year ended December 31,
2002 2001 2000
Revenue from services . . . . . . . . . . . . . . . . . . . . . . . . . . $639,952,915 $504,363,637 $368,332,184Operating expenses:
Direct operating expenses . . . . . . . . . . . . . . . . . . . . . . 478,549,635 377,291,122 273,094,434Selling, general and administrative expenses . . . . . . . . . 94,930,045 68,559,671 49,594,082Bad debt expense . . . . . . . . . . . . . . . . . . . . . . . . . . . . 242,230 1,273,656 432,973Depreciation . . . . . . . . . . . . . . . . . . . . . . . . . . . . . . . 3,524,004 2,699,916 1,323,397Amortization . . . . . . . . . . . . . . . . . . . . . . . . . . . . . . . 3,147,952 14,851,382 13,624,161Non-recurring secondary offering costs . . . . . . . . . . . . 886,036 — —Non-recurring indirect transaction costs . . . . . . . . . . . . — — 1,289,217
Total operating expenses . . . . . . . . . . . . . . . . . . . . . 581,279,902 464,675,747 339,358,264Income from operations . . . . . . . . . . . . . . . . . . . . . . . . . 58,673,013 39,687,890 28,973,920Other expenses:
Interest expense, net . . . . . . . . . . . . . . . . . . . . . . . . . . 3,752,718 14,422,170 15,435,236Income from continuing operations before income taxes . 54,920,295 25,265,720 13,538,684Income tax expense . . . . . . . . . . . . . . . . . . . . . . . . . . . . (21,254,154) (10,862,257) (6,806,882)Income from continuing operations . . . . . . . . . . . . . . . . . 33,666,141 14,403,463 6,731,802Discontinued operations, net of income tax benefit:
Loss from discontinued operations . . . . . . . . . . . . . . . (3,883,436) (741,006) (1,679,774)Loss on disposal of HospitalHub . . . . . . . . . . . . . . . . . — (206,710) (453,832)
Net income before extraordinary item, net of income taxbenefit . . . . . . . . . . . . . . . . . . . . . . . . . . . . . . . . . . . . 29,782,705 13,455,747 4,598,196Extraordinary loss on early extinguishment of debt, net
of income tax benefit . . . . . . . . . . . . . . . . . . . . . . . — (4,783,705) —Net income . . . . . . . . . . . . . . . . . . . . . . . . . . . . . . . . . . $ 29,782,705 $ 8,672,042 $ 4,598,196
Net income (loss) per common share—basic:Income from continuing operations . . . . . . . . . . . . . . . $ 1.04 $ 0.58 $ 0.29Discontinued operations . . . . . . . . . . . . . . . . . . . . . . . (0.12) (0.04) (0.09)
Net income before extraordinary item . . . . . . . . . . . . . . . 0.92 0.54 0.20Extraordinary loss on early extinguishment of debt . . . . — (0.19) —
Net income . . . . . . . . . . . . . . . . . . . . . . . . . . . . . . . . . . $ 0.92 $ 0.35 $ 0.20
Net income (loss) per common share—diluted:Income from continuing operations . . . . . . . . . . . . . . . $ 1.00 $ 0.57 $ 0.29Discontinued operations . . . . . . . . . . . . . . . . . . . . . . . (0.12) (0.04) (0.09)
Net income before extraordinary item . . . . . . . . . . . . . . . 0.88 0.53 0.20Extraordinary loss on early extinguishment of debt . . . . — (0.19) —
Net income . . . . . . . . . . . . . . . . . . . . . . . . . . . . . . . . . . $ 0.88 $ 0.34 $ 0.20
Weighted average common shares outstanding—basic . . . 32,432,026 24,881,218 23,205,388
Weighted average common shares outstanding—diluted . . 33,653,433 25,222,936 23,205,388
See accompanying notes.
F-4

Cross Country, Inc.
Consolidated Statement of Stockholders’ Equity
Accumulated (AccumulatedAdditional Other Deficit) TotalCommon Stock Paid-In Comprehensive Retained Stockholders’
Shares Dollars Capital (Loss) Gain Earnings Equity
Balance at December 31, 1999 . . . . . . . . 23,205,298 $2,321 $119,080,880 $ — $ (341,465) $118,741,736Net income . . . . . . . . . . . . . . . . . . . — — — — 4,598,196 4,598,196
Balance at December 31, 2000 . . . . . . . . 23,205,298 2,321 119,080,880 — 4,256,731 123,339,932Initial public offering . . . . . . . . . . . . . 8,984,375 898 138,765,700 — — 138,766,598Exercise of stock options . . . . . . . . . . 22,072 2 305,231 — — 305,233Net income . . . . . . . . . . . . . . . . . . . — — — — 8,672,042 8,672,042Comprehensive loss:
FASB Statement No. 133 (derivative)transition adjustment . . . . . . . . . . — — — (910,009) — (910,009)
Net change in hedging transaction . . — — — (246,727) — (246,727)
Total comprehensive loss . . . . . . . . . . — — — (1,156,736) — (1,156,736)
Balance at December 31, 2001 . . . . . . . . 32,211,745 3,221 258,151,811 (1,156,736) 12,928,773 269,927,069Exercise of stock options . . . . . . . . . . 452,921 45 4,401,717 — — 4,401,762Tax benefit of stock option exercises . . — — 2,158,863 — — 2,158,863Stock repurchase and retirement . . . . . (435,000) (43) (6,014,790) — — (6,014,833)Other . . . . . . . . . . . . . . . . . . . . . . . — — (208,828) — — (208,828)Net income . . . . . . . . . . . . . . . . . . . — — — — 29,782,705 29,782,705Comprehensive gain:
Net change in hedging transaction . . — — — 785,049 — 785,049
Balance at December 31, 2002 . . . . . . . . 32,229,666 $3,223 $258,488,773 $ (371,687) $42,711,478 $300,831,787
See accompanying notes.
F-5

Cross Country, Inc.
Consolidated Statements of Cash Flows
Year Ended December 31,
2002 2001 2000
Operating activitiesNet income . . . . . . . . . . . . . . . . . . . . . . . . . . . . . . . . . . . . . . . . . . . . . . . $29,782,705 $ 8,672,042 $ 4,598,196Adjustments to reconcile net income to net cash provided by operating activities:
Amortization . . . . . . . . . . . . . . . . . . . . . . . . . . . . . . . . . . . . . . . . . . . . 3,147,952 14,851,382 13,624,161Depreciation . . . . . . . . . . . . . . . . . . . . . . . . . . . . . . . . . . . . . . . . . . . . 3,524,004 2,699,916 1,323,397Bad debt expense . . . . . . . . . . . . . . . . . . . . . . . . . . . . . . . . . . . . . . . . . 242,230 1,273,656 432,973Deferred income taxes expense (benefit) . . . . . . . . . . . . . . . . . . . . . . . . . . . 3,978,365 (169,137) (164,055)Loss from discontinued operations . . . . . . . . . . . . . . . . . . . . . . . . . . . . . . . 3,883,436 741,006 1,679,774Estimated loss on disposal of discontinued operations . . . . . . . . . . . . . . . . . . — 206,710 453,832Cumulative interest due at maturity . . . . . . . . . . . . . . . . . . . . . . . . . . . . . . — 4,321,000 3,839,000Extraordinary loss on early extinguishment of debt . . . . . . . . . . . . . . . . . . . . — 4,783,705 —Changes in operating assets and liabilities:
Accounts receivable . . . . . . . . . . . . . . . . . . . . . . . . . . . . . . . . . . . . . . (6,870,488) (17,627,379) (15,096,272)Prepaid rent, deposits, and other current assets . . . . . . . . . . . . . . . . . . . . . 4,559,599 (125,959) 1,215,833Accounts payable and accrued expenses . . . . . . . . . . . . . . . . . . . . . . . . . . 2,283,599 1,242,312 2,344,984Other current liabilities . . . . . . . . . . . . . . . . . . . . . . . . . . . . . . . . . . . . 359,968 832,835 79,621
Net cash provided by continuing operations . . . . . . . . . . . . . . . . . . . . . . . . . 44,891,370 21,702,089 14,331,444Loss from discontinued operations, net . . . . . . . . . . . . . . . . . . . . . . . . . . (3,883,436) (741,006) (1,679,774)Loss on impairment of discontinued operations . . . . . . . . . . . . . . . . . . . . . 4,142,750 — —Change in net assets from discontinued operations . . . . . . . . . . . . . . . . . . . (3,729,804) (1,166,224) (1,057,774)
Net cash used in discontinued operations . . . . . . . . . . . . . . . . . . . . . . . (3,470,490) (1,907,230) (2,737,548)
Net cash provided by operating activities . . . . . . . . . . . . . . . . . . . . . . . . . . . . 41,420,880 19,794,859 11,593,896
Investing activitiesAcquisition of Heritage Professional Education, LLC . . . . . . . . . . . . . . . . . . . . (1,500,000) (241,145) (6,200,000)Acquisition of Clinforce, Inc. . . . . . . . . . . . . . . . . . . . . . . . . . . . . . . . . . . . . — (32,824,592) —Acquisition of Gill/Balsano Consulting, L.L.C. . . . . . . . . . . . . . . . . . . . . . . . . . (498,750) (1,881,000) —Acquisition of NovaPro . . . . . . . . . . . . . . . . . . . . . . . . . . . . . . . . . . . . . . . (7,906,527) — —Acquisition of Jennings, Ryan & Kolb, Inc. . . . . . . . . . . . . . . . . . . . . . . . . . . . (1,876,008) — —Purchases of property and equipment . . . . . . . . . . . . . . . . . . . . . . . . . . . . . . (7,240,897) (5,783,283) (1,992,109)Other . . . . . . . . . . . . . . . . . . . . . . . . . . . . . . . . . . . . . . . . . . . . . . . . . . 72,266 99,949 —Investing activities of discontinued operations . . . . . . . . . . . . . . . . . . . . . . . . . 384,375 (1,691,093) (2,588,800)
Net cash used in investing activities . . . . . . . . . . . . . . . . . . . . . . . . . . . . . . . (18,565,541) (42,321,164) (10,780,909)
Financing activitiesDebt issuance costs . . . . . . . . . . . . . . . . . . . . . . . . . . . . . . . . . . . . . . . . . . (153,747) (981,833) —Exercise of stock options . . . . . . . . . . . . . . . . . . . . . . . . . . . . . . . . . . . . . . 4,401,762 205,598 —Initial public offering . . . . . . . . . . . . . . . . . . . . . . . . . . . . . . . . . . . . . . . . (208,828) 138,766,598 —Stock repurchase and retirement . . . . . . . . . . . . . . . . . . . . . . . . . . . . . . . . . (6,014,833) — —Repayment of debt . . . . . . . . . . . . . . . . . . . . . . . . . . . . . . . . . . . . . . . . . . (30,155,707) (320,193,108) (65,258,097)Proceeds from issuance of debt . . . . . . . . . . . . . . . . . . . . . . . . . . . . . . . . . . 23,750,000 207,465,010 59,617,233
Net cash (used in) provided by financing activities . . . . . . . . . . . . . . . . . . . . . . (8,381,353) 25,262,265 (5,640,864)Change in cash and cash equivalents . . . . . . . . . . . . . . . . . . . . . . . . . . . . . . . 14,473,986 2,735,960 (4,827,877)Cash and cash equivalents at beginning of year . . . . . . . . . . . . . . . . . . . . . . . . 2,735,960 — 4,827,877
Cash and cash equivalents at end of year . . . . . . . . . . . . . . . . . . . . . . . . . . . . $17,209,946 $ 2,735,960 $ —
Supplemental disclosure of noncash investing and financing activitiesIssuance of common stock in exchange for employee services . . . . . . . . . . . . . . . $ — $ 99,635 $ —
Tax benefit on stock option exercises . . . . . . . . . . . . . . . . . . . . . . . . . . . . . . . $ 2,158,863 $ — $ —
Supplemental disclosure of cash flow informationInterest paid . . . . . . . . . . . . . . . . . . . . . . . . . . . . . . . . . . . . . . . . . . . . . . $ 3,785,670 $ 11,779,213 $10,711,873
Income taxes paid . . . . . . . . . . . . . . . . . . . . . . . . . . . . . . . . . . . . . . . . . . $11,683,839 $ 5,972,007 $ 221,467
See accompanying notes.
F-6

Cross Country, Inc.
Notes to Consolidated Financial Statements
December 31, 2002
1. Organization and Basis of Presentation
On July 29, 1999, Cross Country Staffing, Inc. (CCS), a Delaware corporation, was establishedthrough an acquisition of certain assets and liabilities of Cross Country Staffing, a Delaware generalpartnership (the Partnership). The acquisition included certain identifiable intangible assets primarilyrelated to proprietary databases and contracts. The Partnership was engaged in the business ofproviding nurses and other allied health personnel to health care providers primarily on a contractbasis. CCS recorded the assets and certain assumed liabilities, as defined in the asset purchaseagreement, at fair market value. The purchase price of approximately $189,000,000 exceeded the fairmarket value of the assets less the assumed liabilities by approximately $167,537,000, which, wasrecorded as goodwill and other identifiable intangible assets.
On December 16, 1999, CCS entered into a Plan of Merger with TravCorps Corporation(TravCorps). TravCorps and its wholly-owned subsidiary, Cejka & Company (Cejka), provide flexiblestaffing, search, consulting, and related outsourced services to health care providers throughout theUnited States. Pursuant to the Plan of Merger on December 16, 1999, all outstanding shares ofTravCorps’ common stock were exchanged for common stock in CCS and TravCorps became a wholly-owned subsidiary of CCS. As a result of the transaction, there were approximately $1,300,000 ofnon-capitalizable transaction costs for the year ended December 31, 2000, which consisted primarily oftransition bonuses related to the TravCorps acquisition, which are included in non-recurring indirecttransaction costs in the consolidated statements of operations. The fair value of the shares of commonstock issued to the stockholders of TravCorps, as determined by a valuation of the common stock as ofDecember 16, 1999, was $32,102,000. The purchase price exceeded the fair value of the net tangibleassets acquired by approximately $66,575,000, of which $10,243,000 was allocated to certain identifiableintangible assets ($5,800,000—trademark, $2,910,000—databases, $630,000—workforce, $900,000—hospital relations, and $3,000—covenant not to compete). The remaining $56,332,000 was allocated togoodwill. Subsequent to the adoption of Financial Accounting Standards Board (FASB) StatementNo. 142, the amount originally recorded as workforce was reclassified to goodwill.
Effective October 1, 2000, TravCorps changed its name to TVCM, Inc. (TVCM). EffectiveOctober 10, 2000, CCS changed its name to Cross Country TravCorps, Inc. (CCT). Subsequent toDecember 31, 2000, CCT changed its name to Cross Country, Inc. (the Company). The Company isprimarily engaged in the business of providing temporary health care staffing services to acute andsubacute care facilities nationwide.
The consolidated financial statements include the accounts of the Company and its wholly-owneddirect and indirect subsidiaries: CC Staffing, Inc., Cross Country TravCorps, Inc., Cross CountryTravCorps, Inc. Ltd., TVCM, Inc. (f/k/a TravCorps), Cross Country Local, Inc. (f/k/a Flexstaff, Inc.),Cejka & Company, E-Staff, Inc. (E-Staff), CFRC, Inc., HospitalHub, Inc. (f/k/a AshleyOne, Inc.)(HospitalHub), NovaPro, Inc., Cross Country Consulting, Inc., Cross Country Seminars, Inc.(f/k/a CCS/Heritage Acquisition Corp.) (Cross Country Seminars), Clinforce, Inc. (ClinForce),Assignment America, Inc, and Vendor Management Solutions, Inc. At December 31, 2002, CFRC, Inc.and HospitalHub were dissolved. All material intercompany transactions and balances have beeneliminated in consolidation.
F-7

Cross Country, Inc.
Notes to Consolidated Financial Statements (Continued)
December 31, 2002
2. Summary of Significant Accounting Policies
Use of Estimates
The preparation of the consolidated financial statements in conformity with accounting principlesgenerally accepted in the United States requires management to make estimates and assumptions thataffect the reported amounts in the consolidated financial statements and accompanying notes. Actualresults could differ from those estimates.
Accounts Receivable and Concentration of Credit Risk
Financial instruments that potentially subject the Company to concentrations of credit risk asdefined by FASB Statement No. 105, Disclosure of Information About Financial Instruments WithOff-Balance-Sheet Risk and Financial Instruments With Concentrations of Credit Risk, consist principallyof accounts receivable. The Company’s customers are health care providers and accounts receivablerepresent amounts due from these providers. The Company performs ongoing credit evaluations of itscustomers’ financial conditions and, generally, does not require collateral. The allowance for doubtfulaccounts represents the Company’s estimate for uncollectible receivables based on a review of specificaccounts and the Company’s historical collection experience. The Company writes-off specific accountsbased on an ongoing review of collectibility as well as management’s past experience with the customer.The Company’s contract terms are typically between 30 to 60 days and will be considered past duebased on the particular negotiated contract terms.
Overall, based on the large number of customers in differing geographic areas throughout theUnited States and its territories, the Company believes the concentration of credit risk is limited. As ofDecember 31, 2002, an aggregate of approximately 9% of the Company’s outstanding accountsreceivable were due from five customers. As of December 31, 2001, an aggregate of approximately 8%of the outstanding accounts receivable were due from four customers.
Cash and Cash Equivalents
The Company considers all investments with original maturities of less than three months to becash and cash equivalents.
Prepaid Rent and Deposits
The Company leases a number of apartments for its employees under short-term agreements(typically three to six months), which generally coincide with each employee’s staffing contract. As acondition of these agreements, the Company places security deposits on the leased apartments. Prepaidrent and deposits relate to these short-term agreements.
Property and Equipment
Property and equipment are stated at cost, less accumulated depreciation. Depreciation isdetermined on a straight-line basis over the estimated useful lives of the assets, which generally rangefrom three to seven years. Leasehold improvements are depreciated over the lives of the related leasesor the useful life of an individual lease, whichever is shorter.
F-8

Cross Country, Inc.
Notes to Consolidated Financial Statements (Continued)
December 31, 2002
2. Summary of Significant Accounting Policies (Continued)
Certain software development costs are capitalized in accordance with the provisions of Statementof Position 98-1, Accounting for the Costs of Computer Software Developed or Obtained for Internal Use.Such costs include charges for consulting services and costs for personnel associated with programming,coding, and testing such software. Amortization of capitalized software costs begins when the softwareis placed into service and is included in depreciation expense in the accompanying consolidatedstatements of operations. Software development costs are being amortized using the straight-linemethod over five years. Certain software development costs related to the development of the E-Stafftechnology were capitalized in accordance with the provisions of FASB Statement No. 86, Accountingfor Costs of Computer Software to Be Sold, Leased, or Otherwise Marketed. Such costs include charges forconsulting services and costs for personnel associated with programming, coding, and testing suchsoftware. These costs are included in assets from discontinued operations, net, at December 31, 2002and 2001. See Note 16 for a further discussion on discontinued operations. Through December 31,2002, the Company has not recognized any revenue from the sale of software.
Reserves for Claims
Workers’ compensation, professional liability and health care benefits are provided under partiallyself-insured plans. The Company records its estimate of the ultimate cost of, and reserves for, workers’compensation and professional liability benefits based on actuarial computations using the Company’sloss history as well as industry statistics. Furthermore, in determining its reserves, the Companyincludes reserves for estimated claims incurred but not reported.
The ultimate cost of workers’ compensation and professional liability costs will depend on actualcosts incurred to settle the claims and may differ from the amounts reserved by the Company for thoseclaims.
In August 2001, the Company changed its professional liability coverage from an occurrence to aclaims made basis. The professional liability policy provides for coverage in the amount of $1,000,000per claim and $3,000,000 in the aggregate as well as excess coverage in the amount of $10,000,000 perclaim and $10,000,000 in the aggregate. In addition, there is a $100,000 deductible per occurrence.
In August 2002, the Company changed its professional and general liability policy to include aself-insured limit of $2,000,000 per claim through a self-insured retention, as well as excess coverage inthe amount of $10,000,000 in the aggregate. There is no deductible per occurrence.
Accruals for workers’ compensation claims, health care benefits and professional liability insuranceare included in accrued employee compensation and benefits in the consolidated balance sheets.
Goodwill and Other Identifiable Intangible Assets
Goodwill represents the excess of purchase price over the fair value of net assets acquired. TheCompany adopted the provisions of FASB Statement No. 142, Goodwill and Other Intangible Assets, asof January 1, 2002. FASB Statement No. 142 further clarifies the criteria to recognize intangible assetsseparately from goodwill and promulgates that goodwill and certain intangible assets with indefinitelives not be amortized. Instead, these assets are reviewed for impairment annually with any relatedlosses recognized in earnings when incurred. Other identifiable intangible assets continue to be
F-9

Cross Country, Inc.
Notes to Consolidated Financial Statements (Continued)
December 31, 2002
2. Summary of Significant Accounting Policies (Continued)
amortized, under the provisions of this Statement, using the straight-line method over their estimateduseful lives ranging from 3 to 15 years.
In accordance with FASB Statement No. 142, the Company completed the transitional impairmenttest of goodwill and indefinite-lived intangible assets during the first quarter of 2002. The transitionalimpairment test required the Company to determine the fair value of each reporting unit, as defined,and compare it to the reporting unit’s carrying amount. The Company estimated the fair value of itsreporting units using a discounted cash flow methodology. Based on the results of the initial test and asubsequent annual impairment test during the fourth quarter of 2002, the Company determined thatthere was no impairment of goodwill or indefinite-lived intangible assets as of January 1 orDecember 31, 2002.
Long-lived assets and identifiable intangible assets with definite lives are evaluated for impairmentin accordance with FASB Statement No. 144, Accounting for the Impairment or Disposal of Long-LivedAssets, adopted as of January 1, 2002. In accordance with this Statement, long-lived assets are reviewedfor impairment whenever events or changes in circumstances indicate that the carrying amount may notbe recoverable. The Company periodically reviews long-lived assets, including identifiable intangibleassets, to determine if any impairment exists based upon projected, undiscounted net cash flows of theCompany. Recoverability of intangible assets is measured by comparison of the carrying amount of theasset to net future cash flows expected to be generated from the asset. At December 31, 2002 and2001, the Company believes that no impairment of long-lived assets or identifiable intangible assetsexists.
Debt Issuance Costs
Deferred costs related to the issuance of debt are being amortized on a straight-line basis, whichapproximates the effective interest method, over the six-year term of the debt. Subsequent to theCompany’s initial public offering in 2001, the Company repaid $89,580,000 of its outstanding balanceunder the term loan portion of its senior secured credit facility, and paid $38,779,000 to redeem itsoutstanding senior subordinated pay-in-kind notes. Related debt issuance costs of $6,433,000, net, werewritten off and included in extraordinary loss on early extinguishment of debt in the 2001 consolidatedstatement of operations. At December 31, 2002 and 2001, debt issuance costs of approximately$1,105,000 and $1,390,000, net of accumulated amortization of approximately $1,237,000 and $798,000,respectively, are included in the consolidated balance sheets.
Revenue Recognition
Revenue from services consists primarily of temporary staffing revenues. Revenue is recognizedwhen services are rendered. Accordingly, accounts receivable includes an accrual for employees’ timeworked but not yet invoiced. At December 31, 2002 and 2001, the amounts accrued are approximately$17,982,000 and $15,051,000, respectively.
Revenues on permanent and temporary placements are recognized when services provided aresubstantially completed. The Company does not, in the ordinary course of business, give refunds. If acandidate leaves a permanent placement within a short period of time (i.e., one month), it is customaryfor the Company to seek a replacement at no additional cost. Allowances are established as considered
F-10

Cross Country, Inc.
Notes to Consolidated Financial Statements (Continued)
December 31, 2002
2. Summary of Significant Accounting Policies (Continued)
necessary to estimate significant losses due to placed candidates not remaining employed for theCompany’s guarantee period. During 2002, 2001 and 2000, such losses were not material and,accordingly, related allowances were not recorded.
Revenue from the Company’s education and training services is recognized as the instructor-ledseminars are performed and the related learning materials are delivered.
During 2002, the Company adopted the provisions of FASB’s Emerging Issues Task Force (EITF)Issue No. 01-14, Income Statement Characterization of Reimbursements Received for ‘‘Out-of-Pocket’’Expenses Incurred. This EITF requires that reimbursements received for out-of-pocket expenses shouldbe characterized as revenue and a corresponding expense in the consolidated statements of operations.Prior to the adoption of this EITF, the Company reflected the reimbursement of out-of-pocketexpenses as an offsetting reduction to direct operating expenses and selling, general, and administrativeexpenses. Accordingly, the Company has adjusted all periods reported to reflect an increase in revenue,and an equal and offsetting increase in expenses, related to reimbursable expenses. The associatedamount of reimbursable expenses that are included in revenue for the years ending December 31, 2002,2001 and 2000 was approximately $10,963,000, $3,861,000, and $642,000, respectively. Thecorresponding effect on selling, general and administrative expenses of the other human capitalmanagement services business segment in 2002, 2001 and 2000 was approximately $1,635,000,$1,221,000, and $642,000, respectively. The effect on direct costs of the healthcare staffing businesssegment for the years ending December 31, 2002 and 2001 was approximately $9,328,000 and$2,640,000, respectively. This change in classification has not had an affect on current or previouslyreported net income, or net income per share.
Stock-Based Compensation
The Company, from time to time, grants stock options for a fixed number of common shares toemployees. The Company accounts for employee stock option grants in accordance with AccountingPrinciples Board (APB) Opinion No. 25, Accounting for Stock Issued to Employees, and accordingly,recognizes no compensation expense for stock option grants when the exercise price of the optionsequals, or is greater than, the market value of the underlying stock on the close of business on the dateimmediately preceding the date of grant.
In December 2002, the FASB issued FASB Statement No. 148, Accounting for Stock BasedCompensation—Transition and Disclosure. FASB Statement No. 148 provides two additional transitionmethods for entities that adopt the preferable method of accounting for stock based compensation.Further, the Statement requires disclosure of comparable information for all companies regardless ofwhether, when, or how an entity adopts the preferable, fair value based method of accounting. Thesedisclosures are now required for interim periods in addition to the traditional annual disclosure. FASBStatement No. 148 is effective for fiscal periods ending after December 15, 2002. The pro-formadisclosure of stock based compensation required by this Statement is shown below.
The Company’s consolidated net income would have changed to the pro forma amounts set forthbelow had compensation cost for stock options granted during 2002, 2001 and 2000 been measured
F-11
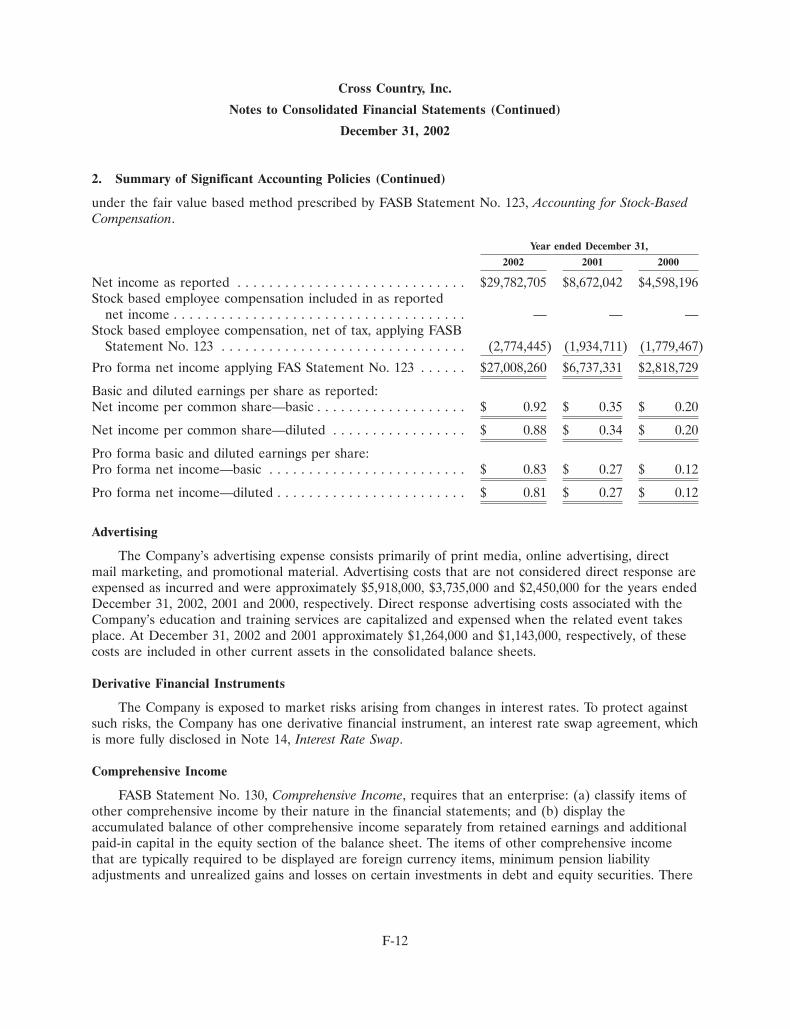
Cross Country, Inc.
Notes to Consolidated Financial Statements (Continued)
December 31, 2002
2. Summary of Significant Accounting Policies (Continued)
under the fair value based method prescribed by FASB Statement No. 123, Accounting for Stock-BasedCompensation.
Year ended December 31,
2002 2001 2000
Net income as reported . . . . . . . . . . . . . . . . . . . . . . . . . . . . . $29,782,705 $8,672,042 $4,598,196Stock based employee compensation included in as reported
net income . . . . . . . . . . . . . . . . . . . . . . . . . . . . . . . . . . . . . — — —Stock based employee compensation, net of tax, applying FASB
Statement No. 123 . . . . . . . . . . . . . . . . . . . . . . . . . . . . . . . (2,774,445) (1,934,711) (1,779,467)
Pro forma net income applying FAS Statement No. 123 . . . . . . $27,008,260 $6,737,331 $2,818,729
Basic and diluted earnings per share as reported:Net income per common share—basic . . . . . . . . . . . . . . . . . . . $ 0.92 $ 0.35 $ 0.20
Net income per common share—diluted . . . . . . . . . . . . . . . . . $ 0.88 $ 0.34 $ 0.20
Pro forma basic and diluted earnings per share:Pro forma net income—basic . . . . . . . . . . . . . . . . . . . . . . . . . $ 0.83 $ 0.27 $ 0.12
Pro forma net income—diluted . . . . . . . . . . . . . . . . . . . . . . . . $ 0.81 $ 0.27 $ 0.12
Advertising
The Company’s advertising expense consists primarily of print media, online advertising, directmail marketing, and promotional material. Advertising costs that are not considered direct response areexpensed as incurred and were approximately $5,918,000, $3,735,000 and $2,450,000 for the years endedDecember 31, 2002, 2001 and 2000, respectively. Direct response advertising costs associated with theCompany’s education and training services are capitalized and expensed when the related event takesplace. At December 31, 2002 and 2001 approximately $1,264,000 and $1,143,000, respectively, of thesecosts are included in other current assets in the consolidated balance sheets.
Derivative Financial Instruments
The Company is exposed to market risks arising from changes in interest rates. To protect againstsuch risks, the Company has one derivative financial instrument, an interest rate swap agreement, whichis more fully disclosed in Note 14, Interest Rate Swap.
Comprehensive Income
FASB Statement No. 130, Comprehensive Income, requires that an enterprise: (a) classify items ofother comprehensive income by their nature in the financial statements; and (b) display theaccumulated balance of other comprehensive income separately from retained earnings and additionalpaid-in capital in the equity section of the balance sheet. The items of other comprehensive incomethat are typically required to be displayed are foreign currency items, minimum pension liabilityadjustments and unrealized gains and losses on certain investments in debt and equity securities. There
F-12

Cross Country, Inc.
Notes to Consolidated Financial Statements (Continued)
December 31, 2002
2. Summary of Significant Accounting Policies (Continued)
are no other components of comprehensive income or loss other than the Company’s consolidated netincome for the years ended December 31, 2002, 2001 and 2000, and the accumulated derivative gain orloss for the years ended December 31, 2002 and 2001.
During 1998, the FASB issued Statement No. 133, Accounting for Derivative Instruments andHedging Activities, which was effective beginning January 1, 2001. FASB Statement No. 133 requirescompanies to recognize all of its derivative instruments as either assets or liabilities in the statement offinancial position at fair value. The accounting for changes in the fair value (i.e., gains or losses) of aderivative instrument depends on whether it has been designated and qualifies as part of a hedgingrelationship and further, on the type of hedging relationship. For those derivative instruments that aredesignated and qualify as hedging instruments, a company must designate the hedging instrument,based upon the exposure being hedged, as either a fair value hedge, cash flow hedge or a hedge of anet investment in a foreign operation. As the Company’s derivative instrument is designated andqualifies as a cash flow hedge (i.e., hedging the exposure to variability in expected future cash flowsthat is attributable to a particular risk), the effective portion of the gain or loss on the derivativeinstrument is reported as a component of other comprehensive income and reclassified into earnings inthe same period or periods during which the hedged transaction affects earnings. Any ineffectiveportion of a derivative instrument’s change in fair value is immediately recognized in earnings.
The Company implemented the provisions of FASB Statement No. 133 on January 1, 2001. Theimplementation of FASB Statement No. 133 resulted in a reduction in consolidated stockholders’ equityof approximately $910,000 as of January 1, 2001.
During 2002 and 2001, the Company reclassified to interest expense approximately $1,720,000 and$325,000, respectively, of the net amount recorded in other comprehensive loss.
Income Taxes
The Company accounts for income taxes under FASB Statement No. 109, Accounting for IncomeTaxes. Deferred income tax assets and liabilities are determined based upon differences between thefinancial reporting and tax bases of assets and liabilities and are measured using the enacted tax ratesand laws that will be in effect when the differences are expected to reverse.
Reclassifications
Certain 2001 and 2000 amounts have been reclassified to conform to the 2002 presentation.
Recently Issued Accounting Standards
In April 2002, the FASB issued FASB Statement No. 145, Rescission of Statements 4, 44, and 64,Amendment of FASB Statement No. 13, and Technical Corrections. This Statement rescinds FASBStatement No. 4, Reporting Gains and Losses from Extinguishment of Debt, and an amendment of thatStatement, FASB Statement No. 64, Extinguishments of Debt Made to Satisfy Sinking-Fund Requirements.This Statement also rescinds FASB Statement No. 44, Accounting for Intangible Assets of Motor Carriers.This Statement amends FASB Statement No. 13, Accounting for Leases, to eliminate an inconsistencybetween the required accounting for sale-leaseback transactions and the required accounting for certainlease modifications that have economic effects that are similar to sale-leaseback transactions. This
F-13

Cross Country, Inc.
Notes to Consolidated Financial Statements (Continued)
December 31, 2002
2. Summary of Significant Accounting Policies (Continued)
Statement also amends other existing authoritative pronouncements to make various technicalcorrections, clarify meanings, or describe their applicability under changed conditions. The Companyhas not adopted the provisions of this Statement as of December 31, 2002. The provisions of thisStatement related to the rescission of Statement 4 are effective for fiscal years beginning after May 15,2002. Any gain or loss on extinguishment of debt that was classified as an extraordinary item in priorperiods presented that does not meet the criteria in Opinion 30 for classification as an extraordinaryitem shall be reclassified. Accordingly, the extraordinary loss on early extinguishment of debt will bereclassified upon adoption of this standard in the year ending December 31, 2003.
In July 2002, the FASB issued FASB Statement No. 146, Accounting for Costs Associated with Exitor Disposal Activities. FASB Statement No. 146 requires that a liability for a cost that is associated withan exit or disposal activity be recognized when the liability is incurred. It nullifies the guidance in EITFIssue No. 94-3, Liability Recognition for Certain Employee Termination Benefits and Other Costs to Exit anActivity (including Certain Costs Incurred in a Restructuring). Under EITF 94-3, an entity recognized aliability for an exit cost on the date that the entity committed itself to an exit plan.
Under FASB Statement No. 146, an entity’s commitment to a plan does not, by itself, create apresent obligation to other parties that meets the definition of a liability. FASB Statement No. 146 willbe effective for exit or disposal activities that are initiated after December 31, 2002. The Company hasnot adopted the provisions of FASB Statement No. 146 in the December 31, 2002 consolidatedfinancial statements, or for any prior periods. The adoption of FASB No. 146 is expected to impact thetiming of recognition of costs associated with future exit and disposal activities.
3. Goodwill and Other Identifiable Intangible Assets
As of December 31, 2002 and 2001, the Company had the following acquired intangible assets:
December 31, 2002 December 31, 2001
Gross Carrying Accumulated Net Carrying Gross Carrying Accumulated Net CarryingAmount Amortization Amount Amount Amortization Amount
Intangible assetssubject toamortization:
Database . . . . . . . . . $ 11,445,000 $ 7,692,129 $ 3,752,871 $ 11,350,000 $ 5,382,526 $ 5,967,474Hospital relations . . . 3,988,750 813,402 3,175,348 3,820,000 548,694 3,271,306Non-compete
agreements . . . . . . 503,000 318,556 184,444 253,000 183,555 69,445
$ 15,936,750 $ 8,824,087 $ 7,112,663 $ 15,423,000 $ 6,114,775 $ 9,308,225
Intangible assets notsubject toamortization:
Goodwill . . . . . . . . . $246,988,940 $20,873,294 $226,115,646 $239,622,152 $20,873,294 $218,748,858Trademarks . . . . . . . . 17,150,000 1,401,169 15,748,831 16,800,000 1,401,169 15,398,831
$264,138,940 $22,274,463 $241,864,477 $256,422,152 $22,274,463 $234,147,689
F-14

Cross Country, Inc.
Notes to Consolidated Financial Statements (Continued)
December 31, 2002
3. Goodwill and Other Identifiable Intangible Assets (Continued)
Aggregate amortization expense for intangible assets subject to amortization was approximately$2,709,000, $2,626,000 and $2,602,000 for the years ended December 31, 2002, 2001 and 2000,respectively. Estimated annual amortization expense is approximately as follows:
Year ending December 31:2003 . . . . . . . . . . . . . . . . . . . . . . . . . . . . . . . . . . . . . . . . . . . . . . . . $2,653,0002004 . . . . . . . . . . . . . . . . . . . . . . . . . . . . . . . . . . . . . . . . . . . . . . . . 934,0002005 . . . . . . . . . . . . . . . . . . . . . . . . . . . . . . . . . . . . . . . . . . . . . . . . 722,0002006 . . . . . . . . . . . . . . . . . . . . . . . . . . . . . . . . . . . . . . . . . . . . . . . . 692,0002007 . . . . . . . . . . . . . . . . . . . . . . . . . . . . . . . . . . . . . . . . . . . . . . . . 267,000
Thereafter . . . . . . . . . . . . . . . . . . . . . . . . . . . . . . . . . . . . . . . . . . . . . 1,845,000$7,113,000
The changes in the carrying amount of goodwill by segment are as follows: Healthcare Other Human Capital Unamortized
Staffing Segment Management Services Goodwill
Balance as of December 31, 2001 . . . . . . . . . . . . . $200,873,357 $17,875,501 $218,748,858Goodwill acquired . . . . . . . . . . . . . . . . . . . . . . . . 4,668,127 699,911 5,368,038Earnout paid to Heritage . . . . . . . . . . . . . . . . . . . — 1,500,000 1,500,000Earnout paid to Gill/Balsano . . . . . . . . . . . . . . . . . — 498,750 498,750Balance as of December 31, 2002 . . . . . . . . . . . . . $205,541,484 $20,574,162 $226,115,646
The following reconciliation adjusts net income to exclude amortization expense related tointangible assets that would not have been amortized, under the provisions of FASB Statement No. 142,if the Company adopted the standard as of January 1, 2000:
Year Ended December 31,
2001 2000
Net income, as reported . . . . . . . . . . . . . . . . . . . . . . . . . . . . . . . $ 8,672,042 $ 4,598,196Goodwill amortization, net of tax . . . . . . . . . . . . . . . . . . . . . . . . 6,763,799 5,986,109Trademark amortization, net of tax . . . . . . . . . . . . . . . . . . . . . . . 399,245 358,680Adjusted net income . . . . . . . . . . . . . . . . . . . . . . . . . . . . . . . . . $15,835,086 $10,942,985
Basic earnings per share:Net income, as reported . . . . . . . . . . . . . . . . . . . . . . . . . . . . . . . $ 0.35 $ 0.20Goodwill amortization, net of tax . . . . . . . . . . . . . . . . . . . . . . . . 0.27 0.26Trademark amortization, net of tax . . . . . . . . . . . . . . . . . . . . . . . 0.02 0.01Adjusted net income . . . . . . . . . . . . . . . . . . . . . . . . . . . . . . . . . $ 0.64 $ 0.47
Diluted earnings per share:Net income, as reported . . . . . . . . . . . . . . . . . . . . . . . . . . . . . . . $ 0.34 $ 0.20Goodwill amortization, net of tax . . . . . . . . . . . . . . . . . . . . . . . . 0.27 0.26Trademark amortization, net of tax . . . . . . . . . . . . . . . . . . . . . . . 0.02 0.01Adjusted net income . . . . . . . . . . . . . . . . . . . . . . . . . . . . . . . . . $ 0.63 $ 0.47
Basic weighted average shares outstanding . . . . . . . . . . . . . . . . . . 24,881,218 23,205,388Diluted weighted average shares outstanding . . . . . . . . . . . . . . . . 25,222,936 23,205,388
F-15

Cross Country, Inc.
Notes to Consolidated Financial Statements (Continued)
December 31, 2002
4. Acquisitions
Effective December 26, 2000, Cross Country Seminars acquired substantially all of the assets ofHeritage Professional Education, LLC (Heritage), a Tennessee limited liability company. Heritageprovides continuing professional education courses to medical and healthcare personnel throughseminars and study programs servicing the healthcare industry. The acquisition met the accountingcriteria of a purchase and, accordingly, the accompanying consolidated financial statements include theresults of Heritage from the acquisition date. The consideration for this acquisition included $6,200,000in cash and a post-closing adjustment of approximately $422,000. The excess of the aggregate purchaseprice over the fair market value of the assets acquired of approximately $6,655,000 was allocated togoodwill and, prior to the adoption of FASB Statement No. 142, was being amortized over 25 years. Inaddition, the asset purchase agreement provides for potential earnout payments of approximately$6,500,000 based on adjusted earnings before interest, taxes, depreciation, and amortization (EBITDA)(as defined in the asset purchase agreement) of Heritage over a three-year period ending December 31,2003. This contingent consideration is not related to the seller’s employment. Upon payment, theearnouts will be allocated to goodwill as additional purchase price. To date, earnout payments were$3,500,000, of which $1,500,000 was paid in 2002 and $2,000,000 was paid in 2003.
On December 15, 2000, the Company entered into a stock purchase agreement to acquiresubstantially all of the outstanding stock of two subsidiaries that comprise ClinForce, Inc., a Delawarecorporation that provides temporary staffing and permanent placement of clinical trials support servicespersonnel. The acquisition was consummated on March 16, 2001 and met the accounting criteria of apurchase. Accordingly, the accompanying consolidated financial statements include the results ofClinForce from the acquisition date. The transaction was primarily funded through the issuance ofadditional debt. The purchase price of approximately $31,400,000 exceeded the fair value of assetsacquired less liabilities assumed by approximately $28,000,000 of which $3,400,000 was allocated tocertain identifiable intangible assets ($2,100,000—trademark, $890,000-workforce, and $410,000—hospital relations). The remaining $24,600,000 was allocated to goodwill and, prior to the adoption ofFASB Statement No. 142, was being amortized over 25 years. Subsequent to the adoption of FASBStatement No. 142, workforce was reclassified to goodwill. The purchase price was subject to apost-closing adjustment based on changes in the net working capital of the acquired companies betweenOctober 31, 2000 and March 16, 2001. The post closing adjustment of approximately $1,415,000 wascalculated and allocated to goodwill as additional purchase price.
In May 2001, Cejka acquired substantially all of the assets of Gill/Balsano Consulting, L.L.C. (Gill/Balsano), a Delaware limited liability company. Gill/Balsano provides management consulting servicesto the healthcare industry. The acquisition met the accounting criteria of a purchase, and, accordingly,the accompanying consolidated financial statements include the results of Gill/Balsano from theacquisition date. The consideration for this acquisition was $1,831,000 in cash. The excess of theaggregate purchase price over the fair market value of the assets acquired of approximately $1,674,000was allocated to goodwill and, prior to the adoption of FASB Statement No. 142, was being amortizedover 25 years. In addition, the asset purchase agreement provides for potential earnout payments ofapproximately $1,995,000 based on adjusted EBITDA (as defined in the asset purchase agreement) ofGill/Balsano over a 3 year period ending March 31, 2004. This contingent consideration is not relatedto the seller’s employment. Upon payment, the earnouts will be allocated to goodwill as additionalpurchase price. To date, earnout payments were $1,163,750, of which $665,000 was paid in 2003.
F-16

Cross Country, Inc.
Notes to Consolidated Financial Statements (Continued)
December 31, 2002
4. Acquisitions (Continued)
The Company adopted the provisions of FASB Statement No. 141, Business Combinations, as ofJanuary 1, 2002. FASB Statement No. 141 eliminates the pooling-of-interests method of accounting forbusiness combinations. In January 2002, the Company acquired substantially all of the assets ofNovaPro, the healthcare staffing division of HRLogic Holdings, Inc., a professional employerorganization, for approximately $7,100,000 in cash and a post-closing adjustment of approximately$544,000. Approximately $4,668,000 was allocated to goodwill, which is not subject to amortizationunder the provisions of FASB Statement No. 142. NovaPro targets nurses seeking more customizedbenefits packages.
In March 2002, the Company acquired all of the outstanding stock of Jennings, Ryan & Kolb, Inc.(JRK), a healthcare management consulting company, for approximately $1,800,000 in cash and theassumption of $300,000 in debt. Approximately $700,000 was allocated to goodwill, which is not subjectto amortization under the provisions of FASB Statement No. 142. In addition, the agreement providesfor potential earnout payments of approximately $1,800,000, of which approximately $530,000 wasearned in 2002 and was paid in 2003.
Both acquisitions were accounted for in accordance with FASB Statement No. 141 and,accordingly, their results of operations have been included in the 2002 consolidated statement ofoperations from their respective dates of acquisition.
The following unaudited pro forma summary presents the consolidated results of operations as ifthe Company’s acquisitions had occurred as of the beginning of each period presented, after givingeffect to certain adjustments, including amortization of goodwill and other specifically identifiableintangibles, interest expense incurred on additional borrowings and related income tax effects. E-Staff,Gill/Balsano, NovaPro and JRK’s results of operations have been excluded from the pro formafinancial information as amounts are considered immaterial to the Company. The pro forma financialinformation does not purport to be indicative of the results of operations that would have occurred hadthe transactions taken place at the beginning of the periods presented or of future results ofoperations.
Year ended December 31,
2001 2000
Revenue from services . . . . . . . . . . . . . . . . . . . . . . . . . . . . . . $512,056,388 $408,1374,982
Income before extraordinary item . . . . . . . . . . . . . . . . . . . . . $ 13,363,097 $ 4,611,097
Net income . . . . . . . . . . . . . . . . . . . . . . . . . . . . . . . . . . . . . . $ 8,579,392 $ 4,611,097
Net income per common share—basic and diluted . . . . . . . . . $ 0.34 $ 0.20
F-17
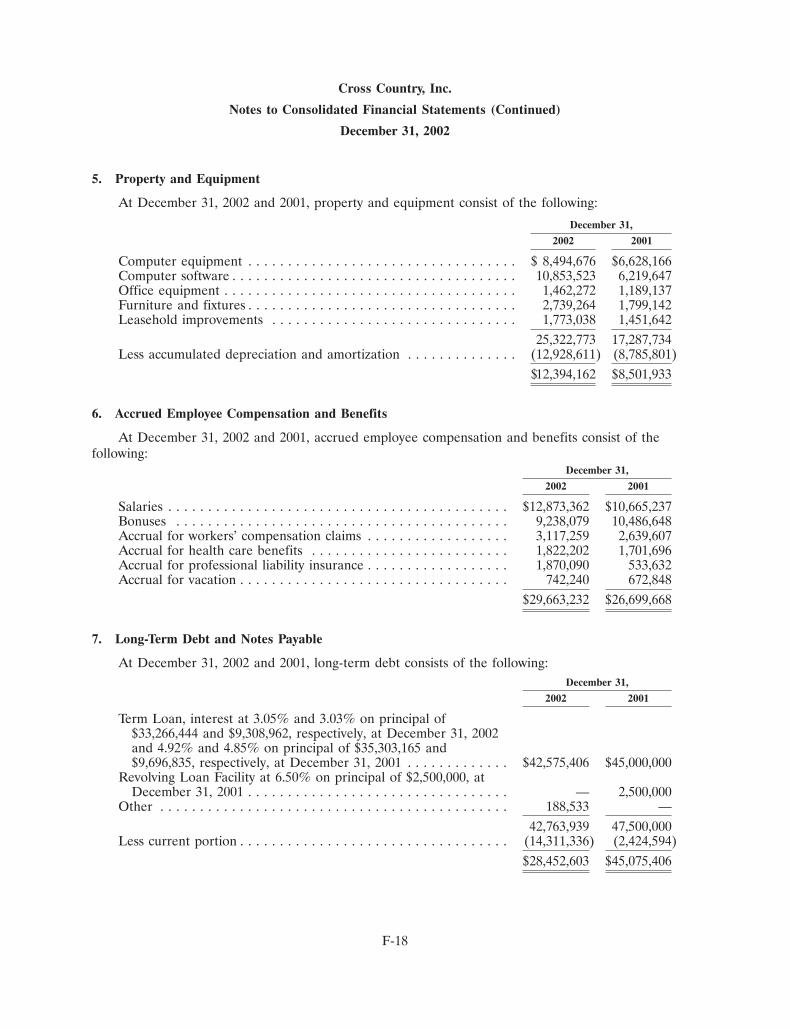
Cross Country, Inc.
Notes to Consolidated Financial Statements (Continued)
December 31, 2002
5. Property and Equipment
At December 31, 2002 and 2001, property and equipment consist of the following:
December 31,
2002 2001
Computer equipment . . . . . . . . . . . . . . . . . . . . . . . . . . . . . . . . . . $ 8,494,676 $6,628,166Computer software . . . . . . . . . . . . . . . . . . . . . . . . . . . . . . . . . . . . 10,853,523 6,219,647Office equipment . . . . . . . . . . . . . . . . . . . . . . . . . . . . . . . . . . . . . 1,462,272 1,189,137Furniture and fixtures . . . . . . . . . . . . . . . . . . . . . . . . . . . . . . . . . . 2,739,264 1,799,142Leasehold improvements . . . . . . . . . . . . . . . . . . . . . . . . . . . . . . . 1,773,038 1,451,642
25,322,773 17,287,734Less accumulated depreciation and amortization . . . . . . . . . . . . . . (12,928,611) (8,785,801)
$12,394,162 $8,501,933
6. Accrued Employee Compensation and Benefits
At December 31, 2002 and 2001, accrued employee compensation and benefits consist of thefollowing:
December 31,
2002 2001
Salaries . . . . . . . . . . . . . . . . . . . . . . . . . . . . . . . . . . . . . . . . . . . $12,873,362 $10,665,237Bonuses . . . . . . . . . . . . . . . . . . . . . . . . . . . . . . . . . . . . . . . . . . 9,238,079 10,486,648Accrual for workers’ compensation claims . . . . . . . . . . . . . . . . . . 3,117,259 2,639,607Accrual for health care benefits . . . . . . . . . . . . . . . . . . . . . . . . . 1,822,202 1,701,696Accrual for professional liability insurance . . . . . . . . . . . . . . . . . . 1,870,090 533,632Accrual for vacation . . . . . . . . . . . . . . . . . . . . . . . . . . . . . . . . . . 742,240 672,848
$29,663,232 $26,699,668
7. Long-Term Debt and Notes Payable
At December 31, 2002 and 2001, long-term debt consists of the following:December 31,
2002 2001
Term Loan, interest at 3.05% and 3.03% on principal of$33,266,444 and $9,308,962, respectively, at December 31, 2002and 4.92% and 4.85% on principal of $35,303,165 and$9,696,835, respectively, at December 31, 2001 . . . . . . . . . . . . . $42,575,406 $45,000,000
Revolving Loan Facility at 6.50% on principal of $2,500,000, atDecember 31, 2001 . . . . . . . . . . . . . . . . . . . . . . . . . . . . . . . . . — 2,500,000
Other . . . . . . . . . . . . . . . . . . . . . . . . . . . . . . . . . . . . . . . . . . . . 188,533 —42,763,939 47,500,000
Less current portion . . . . . . . . . . . . . . . . . . . . . . . . . . . . . . . . . . (14,311,336) (2,424,594)$28,452,603 $45,075,406
F-18

Cross Country, Inc.
Notes to Consolidated Financial Statements (Continued)
December 31, 2002
7. Long-Term Debt and Notes Payable (Continued)
On July 29, 1999, the Company entered into a $105,000,000 senior secured credit facility consistingof a $75,000,000 term loan and a $30,000,000 revolving loan facility. In March 2001, the senior creditfacility was amended to increase the term loan facility to $144,900,000. The Company is required to paya quarterly commitment fee at a rate of 0.50% per year on unused commitments under the revolvingloan facility. The term loan and the revolving loan facility bear interest based on either an alternatebase rate plus a margin of 0.63% and 1.75% at December 31, 2002 and 2001 respectively, or LIBORplus a margin of 1.63% and 2.75% at December 31, 2002 and 2001, respectively (each as defined in thesenior secured credit facility). During fiscal year 2002, the Company met certain covenants thatprovided for the above reduction in interest rates. The Company has pledged all of the assets of theCompany as collateral for the senior credit facility.
The senior credit facility allows for the issuance of letters of credit in an aggregate face amount atany time outstanding not in excess of $15,000,000 at December 31, 2002. Additionally, swingline loans,as defined in the senior credit facility, not to exceed an aggregate principal amount at any timeoutstanding of $7,000,000 are available under the senior credit facility. As of December 31, 2002,$9,774,693 was outstanding under the letter of credit facility.
The senior credit facility requires that the Company meet certain covenants, including themaintenance of certain debt and interest expense ratios, capital expenditure limits, and the maintenanceof a minimum level of EBITDA (as defined in the senior credit facility). The senior credit facility alsolimits the Company’s ability to repurchase its common stock and declare and pay cash dividends on itscommon stock.
On July 29, 1999, the Company issued $30,000,000 in senior subordinated pay-in-kind notes to twofinancial institutions. The proceeds of the loan were used by the Company solely to finance the CCSacquisition and to pay fees and expenses incurred in connection therewith. The interest rate on thesubordinated notes was 12% per annum, compounded quarterly. The Company made no interestpayments on the pay-in-kind notes; rather, accrued interest was converted into additional pay-in-kindnotes on a monthly basis. The maturity date was the earlier of six months after the final maturity of theterm and revolving debt issuances (January 29, 2006) or change in control of the Company.
In connection with the issuance of the subordinated debt, the Company issued 504,468 shares of itscommon stock to the financial institutions. Debt issuance costs of $6,920,000 relating to this transactionwere recorded in 1999, which represented the fair market value of the shares at the time of issuance.
On October 30, 2001, the Company completed its initial public offering of 7,812,500 shares ofcommon stock at $17.00 per share. Additionally, the underwriters exercised the over-allotment optionof 1,171,875 shares, bringing the total number of shares issued to 8,984,375. The proceeds were used torepay $89,580,000 of the outstanding balance under the term loan portion of the Company’s seniorsecured credit facility, $6,100,000 under the revolver portion of the Company’s senior secured creditfacility, and $38,779,000 to redeem the Company’s outstanding senior subordinated pay-in-kind notes.Prepayment of the pay-in-kind notes resulted in a $1,567,000 redemption premium, which, along withthe write-off of $6,433,000 of debt issuance costs discussed in Note 2, has been recorded as anextraordinary loss on early extinguishment of debt in the 2001 consolidated statement of operations.After a tax benefit of approximately $3,216,000, extraordinary loss on early extinguishment of debttotaled approximately $4,784,000 for the year ended December 31, 2001.
F-19

Cross Country, Inc.
Notes to Consolidated Financial Statements (Continued)
December 31, 2002
7. Long-Term Debt and Notes Payable (Continued)
Subsequent to December 31, 2002, the Company repaid $15,289,809 of its borrowings under theterm loan portion of the senior credit facility. The senior credit facility matures on July 29, 2005.Subsequent to the payments made in 2003 the aggregate scheduled maturities of long-term debt are asfollows:
Year ending December 31:2003 . . . . . . . . . . . . . . . . . . . . . . . . . . . . . . . . . . . . . . . . . . . . . . . $ 6,003,2482004 . . . . . . . . . . . . . . . . . . . . . . . . . . . . . . . . . . . . . . . . . . . . . . . 14,053,1452005 . . . . . . . . . . . . . . . . . . . . . . . . . . . . . . . . . . . . . . . . . . . . . . . 7,296,4042006 . . . . . . . . . . . . . . . . . . . . . . . . . . . . . . . . . . . . . . . . . . . . . . . 22,4002007 . . . . . . . . . . . . . . . . . . . . . . . . . . . . . . . . . . . . . . . . . . . . . . . 22,400
Thereafter . . . . . . . . . . . . . . . . . . . . . . . . . . . . . . . . . . . . . . . . . . . . 76,533
$27,474,130
On August 30, 2001, the Company entered into notes payable with a third-party. The proceedsfrom the notes payable were used to pay the Company’s insurance premiums. Principal and interest onthese notes are payable over an 11-month period at an interest rate of 5.75%. At December 31, 2001,the outstanding balance on these notes was $1,247,000. The entire balance was repaid during 2002.
8. Employee Benefit Plans
The Company maintains a voluntary defined contribution 401(k) profit-sharing plan covering alleligible employees as defined in the plan documents. The plan provides for a discretionary matchingcontribution, which is equal to a percentage of each contributing participant’s elective deferral, whichthe Company, at its sole discretion, determines from year to year. Eligible employees who elect toparticipate in the plan are generally vested in any matching contribution after three years of servicewith the Company. Contributions by the Company, net of forfeitures, under this plan amounted toapproximately $3,030,000, $2,467,000 and $885,000, for the years ended December 31, 2002, 2001 and2000, respectively.
TVCM employees were covered under a separate benefit plan for 2000. TVCM had a 401(k)defined contribution plan for eligible employees. Eligible employees made pretax savings contributionsto the 401(k) plan of up to 20% of their earnings to a certain statutory limit. TVCM matchedemployee contributions from 1% to 3% of compensation based on years of service. Contributions tothe 401(k) plan were approximately $630,000 for the year ended December 31, 2000. Effective fiscal2001, TVCM employees participated in the Company’s defined contribution 401(k) profit-sharing plan.
F-20

Cross Country, Inc.
Notes to Consolidated Financial Statements (Continued)
December 31, 2002
9. Commitments and Contingencies
The Company has entered into non-cancelable operating lease agreements for the rental of space.Certain of these leases include options to renew as well as rent escalation clauses. The rent escalationshave been reflected in the table below. Future minimum lease payments associated with theseagreements with terms of one year or more are approximately as follows:
Year ending December 31:2003 . . . . . . . . . . . . . . . . . . . . . . . . . . . . . . . . . . . . . . . . . . . . . . . $ 3,341,0002004 . . . . . . . . . . . . . . . . . . . . . . . . . . . . . . . . . . . . . . . . . . . . . . . 3,406,0002005 . . . . . . . . . . . . . . . . . . . . . . . . . . . . . . . . . . . . . . . . . . . . . . . 2,830,0002006 . . . . . . . . . . . . . . . . . . . . . . . . . . . . . . . . . . . . . . . . . . . . . . . 2,377,0002007 . . . . . . . . . . . . . . . . . . . . . . . . . . . . . . . . . . . . . . . . . . . . . . . 2,033,000
Thereafter . . . . . . . . . . . . . . . . . . . . . . . . . . . . . . . . . . . . . . . . . . . . 3,361,000
$17,348,000
Rent expense related to office facilities was approximately $3,345,000, $2,455,000 and $1,527,000,for the years ended December 31, 2002, 2001 and 2000, respectively.
The Company is subject to legal proceedings and claims that arise in the ordinary course of itsbusiness. In the opinion of management, the outcome of these matters will not have a significant effecton the Company’s consolidated financial position or results of operations.
10. Estimated Fair Value of Financial Instruments
The carrying amounts reported in the consolidated balance sheets for cash and cash equivalents,accounts receivable, and accounts payable and accrued expenses approximate fair value because of theirshort maturity. The carrying amount of the revolving credit note and term loan approximates fair valuebecause the interest rate is tied to a quoted variable index.
The Company’s interest rate swap agreement is carried at fair value in accordance with FASBStatement No. 133 as discussed in Note 14.
F-21

Cross Country, Inc.
Notes to Consolidated Financial Statements (Continued)
December 31, 2002
11. Income Taxes
The components of the Company’s income tax expense (benefit) are as follows:
Year ended December 31,
2002 2001 2000
Continuing operations:Current
Federal . . . . . . . . . . . . . . . . . . . . . . . . . . . . . . . . . . . . . . $15,061,237 $9,689,651 $5,966,385State . . . . . . . . . . . . . . . . . . . . . . . . . . . . . . . . . . . . . . . 2,214,552 1,341,743 1,004,552
17,275,789 11,031,394 6,970,937Deferred . . . . . . . . . . . . . . . . . . . . . . . . . . . . . . . . . . . . . . 3,978,365 (169,137) (164,055)
21,254,154 10,862,257 6,806,882
Discontinued operations—currentTax benefit on loss from discontinued operations . . . . . . . . . (2,451,696) (498,134) (1,235,871)Tax benefit on loss on disposal . . . . . . . . . . . . . . . . . . . . . . — (330,961) (327,963)
(2,451,696) (829,095) (1,563,834)Tax benefit on extraordinary item—current . . . . . . . . . . . . . . — (3,215,801) —
$18,802,458 $6,817,361 $5,243,048
Deferred income taxes reflect the net tax effect of temporary differences between the carryingamount of assets and liabilities for financial reporting purposes and the amounts used for income taxpurposes.
Significant components of the Company’s deferred tax assets and liabilities are as follows:
December 31,
2002 2001
Current deferred tax assets and (liabilities):Accrued and prepaid expenses . . . . . . . . . . . . . . . . . . . . . . . . $ 1,726,154 $ 3,263,323Allowance for doubtful accounts . . . . . . . . . . . . . . . . . . . . . . . 980,562 967,725Other . . . . . . . . . . . . . . . . . . . . . . . . . . . . . . . . . . . . . . . . . . (2,061,539) 167,150
645,177 4,398,198
Non-current deferred tax assets and (liabilities):Depreciation and amortization . . . . . . . . . . . . . . . . . . . . . . . . (7,911,383) (6,130,392)Identifiable intangibles . . . . . . . . . . . . . . . . . . . . . . . . . . . . . . (3,099,297) (3,448,537)Interest rate swap . . . . . . . . . . . . . . . . . . . . . . . . . . . . . . . . . 231,931 1,008,568
(10,778,749) (8,570,361)
Net deferred taxes . . . . . . . . . . . . . . . . . . . . . . . . . . . . . . . . . . . $(10,133,572) $(4,172,163)
FASB Statement No. 109 requires a valuation allowance to reduce the deferred tax assets reportedif, based on the weight of the evidence, it is more likely than not that some of or all of the deferred taxassets will not be realized. After consideration of all the evidence, both positive and negative,
F-22

Cross Country, Inc.
Notes to Consolidated Financial Statements (Continued)
December 31, 2002
11. Income Taxes (Continued)
management has determined that a valuation allowance at December 31, 2002 and 2001 is notnecessary.
The reconciliation of income tax computed at the U. S. federal statutory rate to income taxexpense is as follows:
December 31,
2002 2001
Tax at U.S. statutory rate . . . . . . . . . . . . . . . . . . . . . . . . . . . . . . . $19,222,103 $8,843,002State taxes, net of federal benefit . . . . . . . . . . . . . . . . . . . . . . . . . 1,784,910 884,300Non-deductible goodwill . . . . . . . . . . . . . . . . . . . . . . . . . . . . . . . . — 792,525Non-deductible meals and entertainment . . . . . . . . . . . . . . . . . . . . 43,579 61,122Non-deductible other . . . . . . . . . . . . . . . . . . . . . . . . . . . . . . . . . . 39,415 —Other . . . . . . . . . . . . . . . . . . . . . . . . . . . . . . . . . . . . . . . . . . . . . 164,147 281,308
21,254,154 10,862,257Benefit from discontinued operations and extraordinary loss . . . . . . (2,451,696) (4,044,896)
$18,802,458 $6,817,361
12. Stockholders’ Equity
Effective April 27, 2001, the 760,284 issued and outstanding shares of the Company’s Class Bcommon stock were converted to an equal number of shares of Class A common stock of theCompany. All common stock data in these consolidated financial statements have been adjusted to giveretroactive effect to the conversion.
Effective August 23, 2001, the Company amended and restated its certificate of incorporation toprovide for, among other things: 1) the reclassification of the common stock of the Company, whereby,the Class B common stock was converted into 5.80135 shares of common stock, par value $.0001 pershare; 2) authorization of 100,000,000 shares of common stock; and 3) authorization of 10,000,000shares of preferred stock of the Company, par value $0.01 per share. All common stock data in theseconsolidated financial statements have been adjusted to give retroactive effect to the stock split.
In March 2002, the Company filed a registration statement with the Securities and ExchangeCommission for the sale of 9,000,000 shares of common stock by existing shareholders. Additionally,the underwriters exercised the over-allotment option to purchase 700,000 shares from the sellingstockholders. The Company did not receive any of the proceeds from the sale of these shares. Costsassociated with this secondary offering of $886,036 are included in non-recurring secondary offeringcosts in the 2002 consolidated statement of operations.
On November 5, 2002, the Company’s Board of Directors authorized a stock repurchase programwhereby the Company may purchase up to 1,500,000 of its common shares at an aggregate price not toexceed $25,000,000. As of December 31, 2002, the Company purchased and retired 435,000 shares of itscommon stock at an average cost of $13.83 per share pursuant to the current authorization. The cost ofsuch purchases was approximately $6,000,000. Under this program, the shares may be purchased fromtime to time on the open market. The repurchase program may be discontinued at any time at thediscretion of the Company.
F-23

Cross Country, Inc.
Notes to Consolidated Financial Statements (Continued)
December 31, 2002
12. Stockholders’ Equity (Continued)
Stock Options
On December 16, 1999, the Company’s Board of Directors approved the 1999 Stock Option Planand Equity Participation Plan (collectively, the Plans), which was amended and restated on October 25,2001 and provides for the issuance of incentive stock options (ISOs) and non-qualified stock options toeligible employees and non-employee directors for the purchase of up to 4,398,001 shares of commonstock. Non-qualified stock options may also be issued to consultants. The Plans were approved by thesecurity holders at the Company’s 2002 Annual Meeting of Stockholders. Under the Plans, the exerciseprice of options granted is determined by the compensation committee of the Company’s Board ofDirectors. In the case of 10% or more stockholders, the exercise price of the ISOs granted may not beless than 110% of such fair market. Options granted during 2002, 2001 and 2000 under the Amendedand Restated 1999 Stock Option Plan generally vest ratably over 4 years. Options granted during 2002,2001 and 2000 under the Amended and Restated 1999 Equity Participation Plan vest 25% on the firstanniversary of the date of grant and then vest 12.5% every 6 months thereafter. All options expire onthe tenth (or, in the case of a 10% shareholder, the fifth) anniversary of the date of grant.
Changes under these stock option plans for 2002, 2001 and 2000 were as follows:
December 31, 2002 December 31, 2001 December 31, 2000
Weighted Weighted WeightedAverage Average Average
Option Exercise Option Exercise Option ExerciseShares Price Price Shares Price Price Shares Price Price
Options outstandingat beginning ofyear . . . . . . . . 3,520,068 $ 7.75-$37.13 $13.00 3,121,252 $ 7.75-$32.35 $11.93 3,465,817 $ 7.75-$23.25 $11.87
Granted . . . . . . . 53,279 $12.31-$26.15 $17.89 527,915 $10.13-$37.13 $18.19 173,450 $10.13-$32.35 $15.64Canceled . . . . . . (145,443) $ 7.75-$26.15 $14.74 (107,027) $ 7.75-$17.00 $ 8.11 (518,015) $ 7.75-$23.25 $12.80Exercised . . . . . . (452,921) $ 7.75-$23.25 $ 9.72 (22,072) $ 7.75-$10.13 $ 9.31 — — —
Options outstandingat end of year . . 2,974,983 $ 7.75-$37.13 $13.50 3,520,068 $ 7.75-$37.13 $13.00 3,121,252 $ 7.75-$32.35 $11.93
Options exercisableat end of year . . 1,856,412 $ 7.75-$37.13 $12.97 1,535,826 $ 7.75-$32.35 $12.02 823,936 $ 7.75-$23.25 $11.93
The following table represents information about stock options granted in each year:
Year Ended December 31,
2002 2001 2000
Weighted average exercise price of options granted during the year:Issued at market price . . . . . . . . . . . . . . . . . . . . . . . . . . . . . . . . . . . . . . . . . . . . . . . . $17.90 $16.69 $10.47Issued above market price . . . . . . . . . . . . . . . . . . . . . . . . . . . . . . . . . . . . . . . . . . . . . N/A 21.95 19.74Issued below market price . . . . . . . . . . . . . . . . . . . . . . . . . . . . . . . . . . . . . . . . . . . . . N/A 15.08 N/A
Weighted average fair value of options granted during the year:Issued at market price . . . . . . . . . . . . . . . . . . . . . . . . . . . . . . . . . . . . . . . . . . . . . . . . $10.72 $10.12 $ 6.35Issued above market price . . . . . . . . . . . . . . . . . . . . . . . . . . . . . . . . . . . . . . . . . . . . . N/A 11.43 4.96Issued below market price . . . . . . . . . . . . . . . . . . . . . . . . . . . . . . . . . . . . . . . . . . . . . N/A 6.03 N/A
F-24

Cross Country, Inc.
Notes to Consolidated Financial Statements (Continued)
December 31, 2002
12. Stockholders’ Equity (Continued)
The following table describes outstanding options as of December 31, 2002:
RemainingOptions Contractual Options
Exercise Price Outstanding Life Exercisable
$ 7.75 892,565 6.96 610,24010.13 34,440 7.50 14,79710.78 13,496 7.75 6,74810.78 15,995 7.79 7,00511.62 566,005 6.96 420,28912.31 30,400 9.60 —12.38 27,999 8.25 8,68712.38 16,610 8.29 6,22915.19 11,724 7.50 5,86315.50 568,286 6.96 422,57016.17 25,404 7.75 12,70217.00 268,443 8.50 67,13417.00 5,580 8.81 1,39517.00 37,500 8.82 9,37518.57 25,404 8.25 9,52718.57 31,266 8.29 11,72519.37 124,314 6.96 92,44220.26 11,724 7.50 5,86321.56 25,404 7.75 12,70223.25 124,314 6.96 92,44324.76 25,404 8.25 9,52724.76 31,266 8.29 11,72525.32 2,565 7.50 1,28426.15 20,400 9.23 —26.96 5,557 7.75 2,77930.39 2,567 7.50 1,28430.95 5,557 8.25 2,08430.95 6,840 8.29 2,56532.35 5,557 7.75 2,77937.13 5,557 8.25 2,08437.13 6,840 8.29 2,565
12.97 2,974,983 7.28 1,856,412
F-25

Cross Country, Inc.
Notes to Consolidated Financial Statements (Continued)
December 31, 2002
12. Stockholders’ Equity (Continued)
The fair value of options granted used to compute pro forma net income disclosures here andwithin footnote 2 were estimated on the date of grant using the Black-Scholes option-pricing modelbased on the following weighted average assumptions:
Year ended December 31,
2002 2001 2000
Expected dividend yield . . . . . . . . . . . . . . . . . . . . . . . . . . . . . . . 0.00% 0.00% 0.00%Expected volatility . . . . . . . . . . . . . . . . . . . . . . . . . . . . . . . . . . . 60.00 60.00 60.00Risk-free interest rate . . . . . . . . . . . . . . . . . . . . . . . . . . . . . . . . 4.28 5.19 5.19Expected life . . . . . . . . . . . . . . . . . . . . . . . . . . . . . . . . . . . . . . 6 years 6 years 6 years
The effect of applying FASB Statement No. 123 for providing pro forma disclosures is not likely tobe representative of the effect on reported net income in future years.
13. Earnings Per Share
In accordance with the requirements of FASB Statement No. 128, Earnings Per Share, basicearnings per share is computed by dividing net income by the weighted average number of sharesoutstanding and diluted earnings per share reflects the dilutive effects of stock options (as calculatedutilizing the treasury stock method). Certain shares of common stock that are issuable upon theexercise of options have been excluded from the 2002, 2001 and 2000 per share calculations becausetheir effect would have been anti-dilutive. Such shares amounted to 1,362,195, 268,565 and 3,121,252during the fourth quarters ending December 31, 2002, 2001 and 2000, respectively. For the years endedDecember 31, 2002 and 2001, respectively, 1,221,407 and 341,718, incremental shares of common stockwere included in diluted weighted average shares outstanding.
14. Interest Rate Swap
The Company’s senior credit facility required that the Company maintain an interest rateprotection agreement to manage the impact of interest rate changes on the Company’s variable rateobligations. Effective February 7, 2000, the Company entered into an interest rate swap agreement (theAgreement) with a financial institution. Interest rate swap agreements involve the exchange of floatinginterest rate payments for fixed interest rate payments over the life of the agreement without anexchange of the underlying notional amount. The Company entered into the Agreement to reduce theexposure to adverse fluctuations in floating interest rates on the underlying debt obligation as requiredby the senior credit facility and not for trading purposes.
The interest rate swap matures on February 7, 2003 and has an underlying notional amount of$45,000,000. The floating interest rate to be paid to the Company is based on the three-month U.S.dollar London Interbank Offered Rate (LIBOR), which is reset quarterly, while the fixed interest rate,through December 31, 2000, to be paid by the Company is 6.625% if the three-month US dollarLIBOR is less than 7.25%, the three-month U.S. dollar LIBOR if LIBOR is greater than or equal to7.25% but less than 8.5%, and 8.5% if the three-month U.S. dollar LIBOR is greater than or equal to8.5% over the term of the Agreement. Effective January 1, 2001, the Agreement was amended tochange the fixed rate to be paid by the Company to 6.705%. In addition, the maturity date of theAgreement was extended to February 28, 2003. Any differences paid or received under the terms of the
F-26

Cross Country, Inc.
Notes to Consolidated Financial Statements (Continued)
December 31, 2002
14. Interest Rate Swap (Continued)
Agreement are recognized as adjustments to interest expense over the life of the swap, therebyadjusting the effective interest rate on the underlying debt obligation.
For the period from February 7, 2000 through December 31, 2000, the Company paid a fixedinterest rate of 6.625% based on an underlying notional amount of $45,000,000. The floating interestrate paid by the financial institution to the Company approximated 6.7503%. The carrying value of theinterest rate swap at December 31, 2000 was immaterial as to the net amount due from the financialinstitution. The fair value of the interest rate swap approximated a $606,000 and $2,509,000 net payablebased on quoted market prices for similar instruments at December 31, 2002 and 2001, respectively.The estimated fair value of the swap fluctuated over time based on changes in floating interest rates;however, these fair value amounts should not be viewed in isolation but rather in relation to the overallreduction in the Company’s exposure to adverse fluctuations in floating interest rates. The Companyrecorded the fair value of the interest rate swap transaction at January 1, 2001, which resulted in areduction in consolidated stockholders’ equity of approximately $910,000. To test effectiveness of theinterest rate swap, the Company compared the present value of the cumulative change in the fair valueof the interest rate swap with the present value of the cumulative change in the expected variableinterest payments.
The Company was exposed to credit loss in the event of nonperformance by the counterparty tothe Agreement. The amount of such exposure was limited to the unpaid portion of amounts due to theCompany, if any, pursuant to the Agreement. However, management believed that this exposure wasmitigated by provisions in the Agreement that allow for the legal right of offset of any amounts due tothe Company from the counter party with any amounts payable to the counterparty by the Company.As a result, management considered the risk of counter-party default to be minimal. At December 31,2002 and 2001, the Company expected to reclassify approximately $606,000 and $1,939,000, respectively,of net losses on the interest rate swap from accumulated other comprehensive income to earningsduring the twelve months following December 31, 2002 and 2001, respectively. On February 28, 2003,the maturity date, the Company paid the last payment on the agreement.
15. Related Party Transactions
The Company provides services to three hospitals, which are affiliated with certain Board ofDirector members. Revenue related to these transactions amounted to approximately $6,323,000,$8,671,000, and $4,345,000 in 2002, 2001 and 2000, respectively. Accounts receivable due from thesehospitals at December 31, 2002 and 2001 were approximately $703,000 and $1,007,000, respectively.
16. Discontinued Operations
In August 2001, the FASB issued Statement No. 144, Accounting for the Impairment or Disposal ofLong-Lived Assets, which addresses financial accounting and reporting for the impairment or disposal oflong-lived assets and supercedes FASB Statement No. 121, Accounting for the Impairment of Long-LivedAssets and for Long-Lived Assets to be Disposed Of, and the accounting and reporting provisions of APBOpinion No. 30, Reporting the Results of Operations-Reporting the Effects of Disposal of a Segment of aBusiness and Extraordinary, Unusual and Infrequently Occurring Events and Transactions. The Companyadopted the provisions of FASB Statement No. 144 as of January 1, 2002.
F-27

Cross Country, Inc.
Notes to Consolidated Financial Statements (Continued)
December 31, 2002
16. Discontinued Operations (Continued)
On December 20, 2000, the Company committed itself to a formal plan to dispose of its wholly-owned subsidiary, HospitalHub, through a sale or liquidation of this business segment. Under theprovisions of FASB Statement No. 144, disposal activities that were initiated prior to the initialapplication of the Statement should continue to be accounted for in accordance with the priorpronouncement. Pursuant to APB Opinion No. 30, Reporting the Results of Operations-Reporting theEffects of Disposal of a Segment of a Business, and Extraordinary, Unusual and Infrequently OccurringEvents and Transactions, the consolidated financial statements of the Company have been reclassified toreflect the discontinuance of HospitalHub. Accordingly, the revenue and costs and expenses ofHospitalHub have been segregated and reported as discontinued operations in the accompanyingconsolidated statements of operations. There were no assets or liabilities relating to HospitalHub atDecember 31, 2002 or 2001. The divestiture was completed in the second quarter of 2001.
In March 2002, the Company committed itself to a formal plan to dispose of its subsidiary, E-Staff,a Pennsylvania corporation, through a sale of this business. E-Staff was previously included in theCompany’s other human capital management services segment. The Company had acquiredsubstantially all of the assets of E-Staff, effective July 31, 2000, for $1,500,000. The acquisition met theaccounting criteria of a purchase and, accordingly, the accompanying consolidated financial statementsinclude the results of E-Staff from the acquisition date. The consideration for this acquisition included$1,500,000 in cash. The excess of the aggregate purchase price over the fair market value of the assetsacquired of approximately $927,000 was allocated to goodwill and was being amortized over five yearsthrough December 31, 2001. In addition, the asset purchase agreement provided for potential earnoutpayments of up to $3,750,000 based on achievement of a defined development milestone and theprofits of E-Staff over a three-year period ending July 31, 2003. This contingent consideration is notrelated to the seller’s employment. The Company paid $500,000 upon achievement of thedevelopmental milestone in the first quarter of 2002. The amount was recorded to assets fromdiscontinued operations, net. Due to the discontinuance of the E-Staff business, the Company expectsno additional earnout payments to be made.
E-Staff is an application service provider that has developed an internet subscription basedcommunication, scheduling, credentialing and training service business for healthcare providers. As anapplication service provider E-Staff maintains the database of the client’s employees on E-Staff’sservers and prospective E-Staff clients are concerned about placing their healthcare employees’ namesand credentials on servers owned or controlled by one of the nation’s largest healthcare staffingcompanies. Accordingly, the Company decided to sell this subsidiary. Pursuant to FASB StatementNo. 144, the consolidated financial statements of the Company have been reclassified to reflect thediscontinuance of E-Staff. Accordingly certain costs and expenses, assets and liabilities of E-Staff havebeen segregated and reported as discontinued operations in the accompanying consolidated balancesheets and statements of operations.
In September 2002, the Company decided to retain a portion of the E-Staff software and relatedequipment for internal use. As a result, in September 2002, approximately $436,000 of related softwareand equipment were reclassified from assets from discontinued operations, net, to property andequipment, net. These assets and the related depreciation expense have been reclassified to continuingoperations for all periods presented in the accompanying consolidated balance sheets and statements ofoperations. These reclassifications did not have a material impact on the Company’s consolidated
F-28

Cross Country, Inc.
Notes to Consolidated Financial Statements (Continued)
December 31, 2002
16. Discontinued Operations (Continued)
financial position or results of operations. Based on discussions with potential buyers of the E-Stafftechnology during the three months ended September 30, 2002, the Company evaluated the ongoingvalue of E-Staff and determined that approximately $4,143,000 of the carrying amount of the net assetsfrom discontinued operations was impaired. The Company wrote down the net assets from discontinuedoperations to their estimated fair value of approximately $134,000. Fair value was based on the latestoffer received for the sale and included the estimated cash flows from the sale of E-Staff to a potentialbuyer, adjusted for the estimated probability of the sale. Because of deteriorating market conditions, itis reasonably possible that the estimate of discounted cash flows may change in the near term resultingin the need to adjust the determination of fair value. The effect of any additional charge would beimmaterial. The impairment charge of $2,539,506, net of income tax benefit of $1,603,244, is includedin the accompanying consolidated statement of operations as loss from discontinued operations for theyear ended December 31, 2002.
Loss from discontinued operations during the year ended December 31, 2000 representsHospitalHub operations as well as E-Staff results. E-Staff and HospitalHub operations generated anafter tax loss of approximately $76,000 and $1,604,000, respectively, for the year ended December 31,2000. HospitalHub, which was discontinued in December 2000, was sold in the second quarter of 2001and did not generate a loss from discontinued operations for the years ended December 31, 2002 or2001. Loss from discontinued operations for the year ended December 31, 2002 include the after taxE-Staff impairment charge of $2,539,506.
17. Segment Information
The Company has two reportable operating segments: healthcare staffing and other human capitalmanagement services. The healthcare staffing operating segment includes travel staffing, clinicalresearch and trials staffing and per diem staffing. This segment provides temporary staffing services ofhealthcare professionals primarily to hospitals, laboratories, and pharmaceutical and biotechnologycompanies. The other human capital management services segment includes the combined results ofour education and training, healthcare consulting services, physician search and resource managementservices.
The Company’s management evaluates performance of each segment primarily based on revenuesand contribution income (which is defined as earnings before interest, income taxes, depreciation,amortization and corporate expenses not specifically identified to a reported segment). The Company’smanagement does not evaluate, manage or measure performance of segments using asset information;accordingly, asset information by segment is not prepared or disclosed. The accounting policies of thesegments are the same as those described in the summary of significant accounting policies (seeNote 2). The information in the following table is derived from the segments’ internal financialinformation as used for corporate management purposes. Certain corporate expenses are not allocatedto and/or among the operating segments.
F-29

Cross Country, Inc.
Notes to Consolidated Financial Statements (Continued)
December 31, 2002
17. Segment Information (Continued)
Information on operating segments and a reconciliation of such information to income fromcontinuing operations for the periods indicated are as follows:
Year ended December 31,
2002 2001 2000
Revenue from unaffiliated customers (a):Healthcare staffing . . . . . . . . . . . . . . . . . . . . . . . . . . . $588,743,378 $466,985,416 $350,856,054Other human capital management services . . . . . . . . . . 51,209,537 37,378,221 17,476,130
$639,952,915 $504,363,637 $368,332,184
Contribution income (b):Healthcare staffing . . . . . . . . . . . . . . . . . . . . . . . . . . . $ 81,159,968 $ 70,852,551 $ 61,936,676Other human capital management services . . . . . . . . . . 6,520,861 4,701,442 1,315,188
Unallocated corporate overhead . . . . . . . . . . . . . . . . . . . (21,449,824) (18,314,805) (18,041,169)
Adjusted EBITDA . . . . . . . . . . . . . . . . . . . . . . . . . . . . . 66,231,005 57,239,188 45,210,695Interest expense, net . . . . . . . . . . . . . . . . . . . . . . . . . . . 3,752,718 14,422,170 15,435,236Depreciation and amortization . . . . . . . . . . . . . . . . . . . . 6,671,956 17,551,298 14,947,558Nonrecurring indirect transaction costs . . . . . . . . . . . . . . — — 1,289,217Nonrecurring secondary offering costs . . . . . . . . . . . . . . . 886,036 — —
Income from continuing operations before income taxes . $ 54,920,295 $ 25,265,720 $ 13,538,684
(a) The Company adopted EITF Issue No. 01-14, which states that reimbursements received forout-of-pocket expenses should be characterized as revenue in the income statement. This requiredcertain reclassifications of revenue, cost of sales and selling, general and administrative expenses asdescribed in footnote 2. This change has been reflected in all periods presented.
(b) The Company defines contribution income as earnings before interest, income taxes, depreciation,amortization and corporate expenses not specifically identified to a reporting segment.Contribution income is not a measure of financial performance under generally acceptedaccounting principles and is only used by management when assessing segment performance.During the year ended December 31, 2002, the Company refined its methodology for allocatingcorporate overhead expenses to its segments to more accurately reflect the profitability of eachsegment. Upon review, certain individuals’ salaries and related benefits were more specificallyidentified to the healthcare staffing segment. In addition, certain direct mail expenses were morespecifically identified. Prior year segment data has been reclassified to reflect this improvement inthe allocation methodology. Due to the organizational structure in 2000, post-merger and prior tothe Company’s initial public offering, allocations of general and administrative salaries to thesegments would not have provided meaningful comparisons. Additionally, direct mail expenseswere immaterial. Accordingly, 2000 segment data has not been reclassified for this change inallocation methodology. This change in the allocation of overhead expenses does not impact prioryear consolidated financial statements. In addition, E-Staff, which was previously included in otherhuman capital management services, has been included in discontinued operations.
F-30

Cross Country, Inc.
Notes to Consolidated Financial Statements (Continued)
December 31, 2002
18. Quarterly Financial Data (Unaudited)
First Quarter Second Quarter Third Quarter Fourth Quarter
2002Revenue from services (a) . . . . . . . . . . . . . . . . . . . $158,165,456 $158,738,288 $160,152,688 $162,896,483Gross profit (a) . . . . . . . . . . . . . . . . . . . . . . . . . . 38,010,786 40,670,059 40,702,880 42,019,555Income from continuing operations (b) . . . . . . . . . . 7,213,226 8,452,414 8,753,302 9,247,199Loss from discontinued operations (b) . . . . . . . . . . . (216,404) (420,643) (2,881,396) (364,993)Net income . . . . . . . . . . . . . . . . . . . . . . . . . . . . . $ 6,996,822 $ 8,031,771 $ 5,871,906 $ 8,882,206
Net income (loss) per common share-basic (b):Income from continuing operations . . . . . . . . . . . . . $ 0.23 $ 0.26 $ 0.27 $ 0.28Loss from discontinued operations . . . . . . . . . . . . . (0.01) (0.01) (0.09) (0.01)Net income . . . . . . . . . . . . . . . . . . . . . . . . . . . . . $ 0.22 $ 0.25 $ 0.18 $ 0.27
Net income (loss) per common share-diluted (b):Income from continuing operations . . . . . . . . . . . . . $ 0.21 $ 0.25 $ 0.26 $ 0.28Loss from discontinued operations . . . . . . . . . . . . . (0.00) (0.01) (0.09) (0.01)Net income . . . . . . . . . . . . . . . . . . . . . . . . . . . . . $ 0.21 $ 0.24 $ 0.17 $ 0.27
2001Revenue from services (a) . . . . . . . . . . . . . . . . . . . $104,135,971 $119,275,925 $133,954,471 $146,997,270Gross profit (a) . . . . . . . . . . . . . . . . . . . . . . . . . . 25,105,948 31,045,536 34,391,379 36,529,652Income from continuing operations (b) . . . . . . . . . . 1,208,631 2,324,800 4,097,428 6,772,604(Loss) income from discontinued operations (b) . . . . (1,200,080) 340,997 (175,384) 86,751Extraordinary loss on early extinguishment of debt . . — — — (4,783,705)Net income . . . . . . . . . . . . . . . . . . . . . . . . . . . . . $ 8,551 $ 2,665,797 $ 3,922,044 $ 2,075,650
Net income (loss) per common share-basic (b):Income from continuing operations . . . . . . . . . . . . . $ 0.05 $ 0.10 $ 0.18 $ 0.23(Loss) income from discontinued operations . . . . . . . (0.05) 0.01 (0.01) —Extraordinary loss on early extinguishment of debt . . — — — (0.16)Net income . . . . . . . . . . . . . . . . . . . . . . . . . . . . . $ 0.00 $ 0.11 $ 0.17 $ 0.07
Net income (loss) per common share-diluted (b):Income from continuing operations . . . . . . . . . . . . . $ 0.05 $ 0.10 $ 0.18 $ 0.22(Loss) income from discontinued operations . . . . . . . (0.05) 0.01 (0.01) —Extraordinary loss on early extinguishment of debt . . — — — (0.15)Net income . . . . . . . . . . . . . . . . . . . . . . . . . . . . . $ 0.00 $ 0.11 $ 0.17 $ 0.07
(a) The Company adopted EITF Issue No. 01-14, which states that reimbursements received for out-of-pocketexpenses should be characterized as revenue in the income statement. This required certain reclassifications ofthe Company’s revenue, gross profit and SG&A expenses. This change has been reflected in all periodspresented. The quarterly impact of these reclassifications are as follows:
First Quarter Second Quarter Third Quarter Fourth Quarter
2002Increase in revenue from services . . . . . . . . $3,304,425 $2,761,557 $2,495,975 $2,400,979Increase in gross profit . . . . . . . . . . . . . . . 305,449 542,620 422,127 364,510
2001Increase in revenue from services . . . . . . . . $ 264,232 $ 441,178 $ 467,571 $2,688,087Increase in gross profit . . . . . . . . . . . . . . . 235,615 308,277 291,512 385,629
(b) Pursuant to FASB Statement No. 144, the consolidated financial statements of the Company have beenreclassified in all periods presented to reflect the discontinuance of E-Staff.
F-31

Schedule II
Balance at Charged toBeginning Costs and Other Balance at End
Description of Period Expenses Write-offs Recoveries Changes of Period
Valuation and Qualifying Accounts (for continuing operations)
Allowance for Doubtful AccountsYear ended December 31, 2000 . . . $2,144,110 $ 432,973 $(565,012) $ 75,676 $ — $2,087,747Year ended December 31, 2001 . . . 2,087,747 1,273,656 (989,037) — 52,499(a) 2,424,865Year ended December 31, 2002 . . . 2,424,865 242,230 (599,332) 105,743 76,541(b) 2,250,047
(a) —Allowance for doubtful accounts for receivables acquired in ClinForce acquisition.
(b) —Allowance for doubtful accounts for receivables acquired in NovaPro acquisition.
II-1

Karen H. Bechtel (a)Managing Director of Morgan Stanley Private Equity and Morgan Stanley & Co. Incorporated
Joseph A. BoshartPresident and Chief Executive OfficerCross Country, Inc.
W. Larry Cash (b)Executive Vice President and Chief Financial Officer of Community Health Systems
Thomas C. Dircks (a)Managing Partner of Charterhouse Group International, Inc.
A. Lawrence FaganPartner of Charterhouse Group International, Inc.
Emil HenselChief Financial OfficerCross Country, Inc.
M. Fazle HusainManaging Director of Morgan Stanley Private Equity and Morgan Stanley & Co. Incorporated
Joseph Swedish (b)President, Chief Executive Officer and Director of Centura Health
Joseph Trunfio (b)President, Chief Executive Officerof Atlantic Health System
Joseph A. BoshartPresident and Chief Executive Officer
Emil HenselChief Financial Officer
Vickie AnenbergPresident, Cross Country Staffing
Kevin ConlinPresident, Consulting Division
Annette Gardner, RNPresident, Cross Country Local
Victor KalafaVice President, Corporate Development and Strategy
Daniel J. LewisPrincipal Accounting Officer
Dr. Franklin A. Shaffer, EdD, RN, FAANPresident, Education and Training Division
Tony SimsPresident, Clinical Trials Staffing Division
Carol D. WestfallPresident, Search and Recruitment Division
Jonathan W. WardExecutive Vice President, Cross Country Staffing
Board of Directors
Corporate Information
Executive Officers
Shareholders InquiriesNews releases, including those on financialperformance, as well as additional informationabout Cross Country are available at no costonline at our Web site. Current and prospectiveinvestors can register online to automaticallyreceive press releases by email and receive ourAnnual Report, Forms 10-K, 10-Q, and other SECfilings, as well as other information about theCompany either online at our Web site or bywriting or contacting:
Howard A. GoldmanDirector of Investor RelationsPhone: 561.998.2232Toll-Free: 877.686.9779Email: [email protected]
Corporate HeadquartersCross Country, Inc.
6551 Park of Commerce Blvd.
Boca Raton, Florida 33487
Phone: 561.998.2232
Web site: www.crosscountry.com
Transfer AgentSunTrust Bank
P.O. Box 4625
Atlanta, Georgia 30302-4625
Toll Free Phone: 800.568.3476
Independent AuditorsErnst & Young LLP
Phillips Point, West Tower
Suite 1200
777 South Flagler Drive
West Palm Beach, Florida 33401
Stock ListingThe Company’s Common Stock is listed
on the NASDAQ National Market®
and traded under the symbol CCRN.
Forward-Looking StatementsThe matters described herein contain forward-looking statements that are made pursuant to the SafeHarbor provisions of the Private Securities Litigation Reform Act of 1995. Forward-looking statementsare predictive in nature, that depend upon or refer to future events or conditions or that includewords such as “expects,” “anticipates,” “intends,” “plans,” “believes,” “estimates,” and similar expressionsare forward-looking statements. These statements involve known and unknown risks, uncertainties andother factors that may cause our actual results and performance to be materially different from anyfuture results or performance expressed or implied by these forward-looking statements. These factorsinclude, but are not limited to, our ability to attract and retain qualified nurses and other healthcarepersonnel, costs and availability of short-term leases for our travel nurses, demand for the healthcareservices we provide, both nationally and in the regions in which we operate, the functioning of ourinformation systems, the effect of existing or future government regulation and federal and statelegislative and enforcement initiatives on our business, our clients’ ability to pay us for our services, ourability to successfully implement our acquisition and development strategies, the effect of liabilities andother claims asserted against us, the effect of competition in the markets we serve, and other factors setforth under the caption “Risk Factors” in the Company’s 10-K for the year ended December 31, 2002.We undertake no obligation to release any revisions to any forward-looking statements.
(a) Member of the Compensation Committee(b) Member of the Audit Committee

6551 Park of Commerce Blvd. Boca Raton, FL 33487
561.998.2232www.crosscountry.com