2003 we’re cleaning up - s1.q4cdn.com · ... uninterruptible power supplies. 8 ... we estimate...
TRANSCRIPT

1
Power Integrat ions
2003 Annual Report
H o u s e h o l d p r o d u c t s p o w e r e d b y i n t e g r a t e d
c i r c u i t s ( I C s ) f r o m P o w e r I n t e g r a t i o n s :
Vacuum cleaners, rice cookers, electric toys,electric shavers, electric toothbrushes…
we’recleaning
up

21
andchilling
H o m e a p p l i a n c e s p o w e r e d b y o u r I C s :
Refrigerators, microwave ovens, cook tops, ovens, dishwashers, washers, dryers, toaster ovens, air conditioners

3 4
we’recomputing
C o m p u t i n g d e v i c e s p o w e r e d b y o u r I C s :
LCD monitors, PDAs, printers, WI-FIrouters, desktop PC’s, servers, modems

and building
6
B u i l d i n g a n d i n d u s t r i a l p r o d u c t s
p o w e r e d b y o u r I C s :
Power tools, lighting systems,security systems, motor controls, industrial controls, uninterruptible power supplies

8
E n t e r t a i n m e n t e q u i p m e n t p o w e r e d b y o u r I C s :
DVD players, audio sound systems, LCD TVs, satellite and cable set-top boxes, LCD projectors, video game consoles
we’re entertaining
7

10
M o b i l e d e v i c e s p o w e r e d b y o u r I C s :
Segways, handheld computers, cell phones, digital cameras, video cameras
andliberating
9

we’re saving
12
‘Link, the Energy Vampire Slayer,’ our superhero, continues to deliver on his global mission to cutenergy waste by eliminating the ‘energy vampires’found in our homes. As of March 2004 we estimatethat Power Integrations’ EcoSmart® technology hassaved consumers more than $500 million on theirenergy bills. The savings are growing each day asmore EcoSmart devices are used by manufacturersfor all types of products.

1413
and diversifying!
D i v e r s i f i e d I C F a m i l i e s :
TOPSwitch® I, II, FX and GX; TinySwitch® I and II, LinkSwitch®, DPA-Switch™
D i v e r s i f i e d M a r k e t S e g m e n t s :
Communications, Computing, Consumer, Industrial
W e h a v e b e e n s u c c e s s f u l i n d i v e r s i f y i n g o u r b u s i n e s s
b e c a u s e o f t h e m u l t i p l e b e n e f i t s w e b r i n g t o h u n d r e d s
o f p r o d u c t s . T h e s e a d v a n t a g e s i n c l u d e :
Increased ease of design, continuing enhanced functionality,improved energy efficiency/energy savings, smaller size and weight, design scalability, expanding technical support, simpler design/fewer components.
s a l e s b y m a r k e t
b a s e d o n a c t u a l d o l l a r s
c o m p u t e r
c o n s u m e r
c o m m u n i c a t i o n s
i n d u s t r i a l
o t h e r
1 2 5 . 7 m i l l i o n
t o t a l s a l e s 2 0 0 3
1 0 8 . 2 m i l l i o n
t o t a l s a l e s 2 0 0 2
2001 2002
36%
22%
28%
8%
6%
7%6%
43%
23%
21%
computer
c o n s u m e r
c o m m u n i c a t i o n s
i n d u s t r i a l
o t h e r

16
Dear Fellow Stockholders,
For Power Integrations, 2003 was a year of growth, record revenues, increased profitabilityand continuing market leadership. Growing demand for our integrated circuits (ICs)across an increasingly diverse range of markets and customers drove revenues to arecord $126 million. We doubled our operating income over 2002 and achieved earningsof $0.57 per share.
What drove our success in 2003? Our continued diversification of products, markets andcustomers; our ongoing reduction of manufacturing costs and associated increase in oper-ating leverage; and our continued leadership in energy efficiency. These will remain keyareas of focus going forward.
Power Integrations is a significantly more diversified company than it was a year ago. Weachieved both market expansion and market penetration in many end markets. In certainapplications, we grew revenues far in excess of end-market growth. Our revenues fromset-top boxes nearly doubled, our revenues from DVD players grew 43 percent and ourrevenues from home appliances increased 37 percent. Overall revenues in our consumer,computer and industrial market segments grew by nearly 30 percent from the prior year.New products coupled with our targeted design support and focused marketing programsallowed us to diversify our revenue base, while gaining significant market share.
Our chief revenue producing products, TOPSwitch-GX and TinySwitch-II, continued to capture a growing share of the AC-DC power supply market. Revenues from TOPSwitch-GX grew 230 percent and TinySwitch-II revenues were up 65 percent over 2002. Marketdiversity will allow us to continue the successful ramp of these products.
In the second half of the year, we began production shipment of our two newest products,DPA-Switch and LinkSwitch. These products significantly expand our addressable market,generating many new opportunities for growth. In 2003, the initial adoption of DPA-Switchinto all our target markets signaled our successful entry into DC-DC power conversion.
LinkSwitch, designed to replace the bulky, inefficient linear transformers, or “energy vampires,” commonly used to charge low power electronics, is beginning its design ramp.We estimate the lower power market to be more than one billion units a year. In 2003,LinkSwitch began to address this huge opportunity. In 2004, we expect the adoption ofLinkSwitch to be fueled by ever-tightening energy efficiency requirements.
Our close attention to manufacturing costs and operating efficiency also contributed to our strong financial performance in 2003. We reduced manufacturing costs through yieldimprovements, reduction of test time, other operational efficiencies, and reduced packageand silicon costs. In addition, we took significant steps to expand our long-term capacityby beginning offshore testing and by selecting ZMD, our third foundry. In 2004, ongoingcost reductions will provide us with the pricing flexibility to continue our market penetrationand profitable growth.
15
Our continued commitment to energy efficiency paid off in 2003 and will continue as animportant driver of growth. Ever-tightening global energy efficiency standards are acceler-ating the need to design energy efficient products. A new generation of power-consciousapplications, such as PCs, DVD players, LCD TVs and home appliances, all stand to benefit from our EcoSmart® solutions.
Our EcoSmart solutions enable manufacturers to cost effectively meet all existing and proposed energy conservation regulations. These standards will make Power Integrations’solutions even more cost competitive against the older technologies we are seeking toreplace. We believe that “energy vampires” (linear transformers) will not be able to meet a new 2005 European Union limit on standby power consumption without a significantincrease in cost. The additional costs required for older technologies to comply with the ever-tightening energy efficiency standards, along with the increasing cost of copperand iron — the raw materials used to make linear transformers — position our products for excellent growth over the next several years.
We are proud of our progress in capturing a growing share of our addressable portion of the power conversion market. We estimate this market opportunity to be $1.6 billion. In an industry that has been slow to adopt new technology, our innovative ICs are provingto be a compelling match for manufacturers’ complex portability, energy efficiency, designand manufacturing needs. Our commitment to saving energy also brings important benefitsto consumers and the environment. As of March 2004, we estimate that our EcoSmarttechnology has saved consumers worldwide more than $500 million on their energy bills.
Looking ahead, our roadmap remains clear: . Continue to penetrate current and additional markets and diversify our revenues; . Continuously reduce manufacturing costs and improve operating margins;. Harness the power of our market-leading ideas to develop new products, utilizing
EcoSmart technology to conserve energy.
As the leader in ICs for highly integrated power supplies, our prospects for expanding market share, revenue and profits remain outstanding.
Thanks to our partners, customers, employees and stockholders for your continued support,
Sincerely,
Balu Balakrishnan
President and Chief Executive Officer Power Integrations, Inc.
17
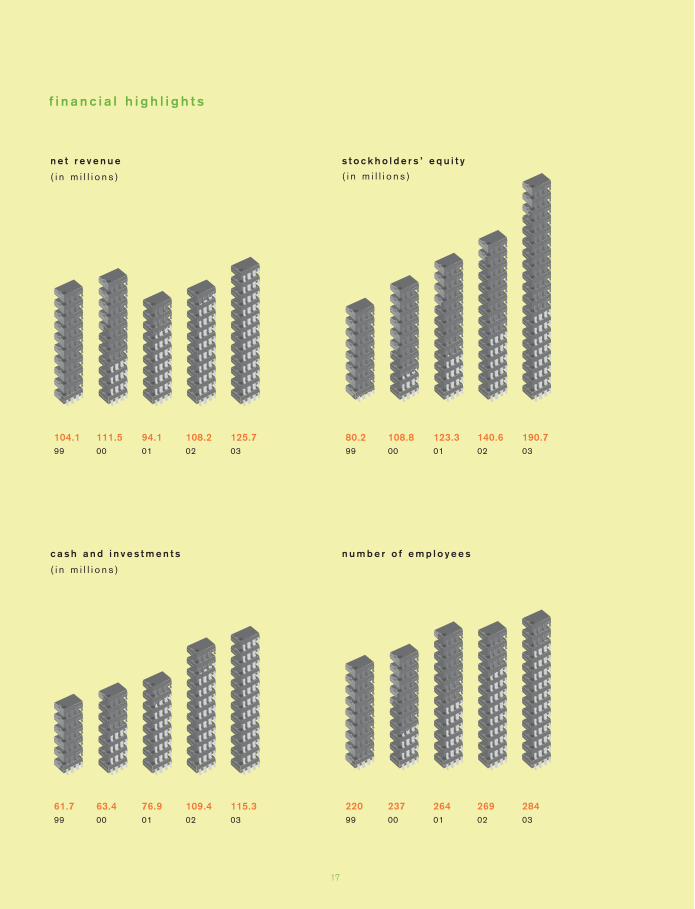
104.1 111.5 94.1 108.2 125.799 00 01 02 03
n e t r e v e n u e
( i n m i l l i o n s )
80.2 108.8 123.3 140.6 190.799 00 01 02 03
s t o c k h o l d e r s ’ e q u i t y
( i n m i l l i o n s )
61.7 63.4 76.9 109.4 115.399 00 01 02 03
c a s h a n d i n v e s t m e n t s
( i n m i l l i o n s )
220 237 264 269 28499 00 01 02 03
n u m b e r o f e m p l o y e e s
f i n a n c i a l h i g h l i g h t s

f i n a n c i a l i n f o r m a t i o n
p o w e r i n t e g r a t i o n s
`````
UNITED STATES SECURITIES AND EXCHANGE COMMISSION
Washington, DC 20549 FORM 10-K
(Mark One) Annual report pursuant to Section 13 or 15(d) of the Securities Exchange Act of 1934 for the fiscal year
ended December 31, 2003 or
Transition report pursuant to Section 13 or 15(d) of the Securities Exchange Act of 1934 for the transition period from to
Commission File Number 0-23441
POWER INTEGRATIONS, INC. (Exact name of registrant as specified in its charter)
DELAWARE 94-3065014 (State or other jurisdiction of (I.R.S. Employer
Incorporation or organization) Identification No.) 5245 Hellyer Avenue San Jose, California 95138-1002
(Address of principal executive offices) (Zip code) (408) 414-9200
(Registrant's telephone number, including area code) Securities registered pursuant to Section 12(b) of the Act:
Title of each class Name of Exchange on which registered
None None Securities registered pursuant to Section 12(g) of the Act:
Common Stock, $0.001 par value (Title of Class)
Indicate by check mark whether the registrant (1) has filed all reports required to be filed by Section 13 or 15(d) of the Securities Act of 1934 during the preceding 12 months (or for such shorter period that the registrant was required to file such reports), and (2) has been subject to such filing requirements for the past 90 days. YES NO Indicate by check mark if disclosure of delinquent filers pursuant to Item 405 of Regulation S-K is not contained herein, and will not be contained, to the best of registrant's knowledge, in definitive proxy or information statements incorporated by reference in Part III of this Form 10-K or any amendment to this Form 10-K. Indicate by check mark whether the registrant is an accelerated filer (as defined in Rule 12b-2 of the Act). YES NO The aggregate market value of registrant's voting and non-voting common equity held by nonaffiliates of registrant on June 30, 2003, the last business day of the registrant’s most recently completed second fiscal quarter, was approximately $592,295,550, based upon the closing sale price of the common stock as reported on the NASDAQ National Market. Shares of common stock held by each officer, director and holder of 5% or more of the outstanding common stock have been excluded in that such persons may be deemed to be affiliates. This determination of affiliate status is not necessarily a conclusive determination for other purposes. Outstanding shares of registrant's common stock, $0.001 par value, as of February 27, 2004: 30,707,469.
DOCUMENTS INCORPORATED BY REFERENCE Parts of the definitive Proxy Statement for registrant's 2003 Annual Meeting of Stockholders to be filed with the Commission pursuant to Regulation 14A not later than 120 days after the end of the fiscal year covered by this Form are incorporated by reference into Part III of this Form 10-K Report.

TABLE OF CONTENTS
PART I
Page
ITEM 1. BUSINESS..................................................................................................................................... 1 ITEM 2. PROPERTIES ................................................................................................................................ 14 ITEM 3. LEGAL PROCEEDINGS .............................................................................................................. 14 ITEM 4. SUBMISSION OF MATTERS TO A VOTE OF SECURITY HOLDERS................................... 14
PART II
ITEM 5. MARKET FOR POWER INTEGRATIONS COMMON EQUITY AND RELATED
STOCKHOLDER MATTERS .......................................................................................................
15 ITEM 6. SELECTED FINANCIAL DATA ................................................................................................. 16 ITEM 7. MANAGEMENT’S DISCUSSION AND ANALYSIS OF FINANCIAL CONDITION AND
OPERATING RESULTS ...............................................................................................................
17 ITEM 7a. QUANTITIVE AND QUALITATIVE DISCLOSURES ABOUT MARKET RISKS.................. 32 ITEM 8. CONSOLIDATED FINANCIAL STATEMENTS AND SUPPLEMENTARY DATA ............... 32 ITEM 9. CHANGES IN AND DISAGREEMENTS WITH ACCOUNTANTS ON ACCOUNTING
AND FINANCIAL DISCLOSURE ...............................................................................................
32 ITEM 9a. CONTROLS AND PROCEDURES .............................................................................................. 33
PART III
ITEM 10. DIRECTORS AND EXECUTIVE OFFICERS OF THE COMPANY.......................................... 34 ITEM 11. EXECUTIVE COMPENSATION ................................................................................................. 34 ITEM 12. SECURITY OWNERSHIP OF CERTAIN BENEFICIAL OWNERS AND MANAGEMENT... 34 ITEM 13. CERTAIN RELATIONSHIPS AND RELATED TRANSACTIONS ........................................... 34 ITEM 14. PRINCIPAL ACCOUNTANT FEES AND SERVICES ............................................................... 34
PART IV
ITEM 15. EXHIBITS, FINANCIAL STATEMENT SCHEDULES AND REPORTS ON FORM 8-K........ 35 SIGNATURES.......................................................................................................................................................... 58
1
PART I
TOPSwitch, TinySwitch, LinkSwitch, DPA-Switch, EcoSmart, and P I Expert are trademarks of Power Integrations, Inc.
Item 1. Business
Overview
We design, develop, manufacture and market proprietary, high-voltage, analog integrated circuits, commonly referred to as ICs, for use primarily in alternating current to direct current, or AC to DC, and direct current to direct current, or DC to DC, power supplies. We have targeted high-volume power supply markets including:
• the communications market;
• the consumer market;
• the computer market; and
• the industrial electronics markets.
Our focus is on those applications that are sensitive to size, portability, energy efficiency and time-to-market. We believe our patented TOPSwitch ICs, introduced in 1994, are the first highly integrated power conversion ICs to achieve widespread market acceptance. We introduced an enhanced family of ICs, TOPSwitch-II, in April 1997. In September 1998, we announced the TinySwitch family of integrated circuits for power supplies used in a broad range of electronic products. TinySwitch ICs, which are designed to reduce energy leakage by incorporating our new EcoSmart technology, enable a new class of light, compact, energy-efficient power supplies. In March 2000, we introduced the TOPSwitch-FX family of products, which also incorporates our EcoSmart technology to help engineers meet the growing need for environmentally friendly power solutions. In November 2000, we introduced the TOPSwitch-GX family of products. The GX family is capable of supplying output levels from 6 watts to 290 watts. We believe that the FX and GX families of ICs give power supply design engineers the ability to cost-effectively integrate additional functionality into the power supplies they design. In March 2001, we introduced the TinySwitch-II family of products with power levels ranging from 4 watts to 23 watts. In June 2002, we introduced DPA-Switch, which is a family of products that is the first highly integrated high-voltage DC-DC power conversion IC designed specifically for use in distributed power architectures (DPAs). In September 2002, we introduced LinkSwitch, which is an AC-DC power conversion IC specifically designed to replace linear transformers in the 0 to 3 watt range. All of our products introduced since 1998 incorporate our EcoSmart technology.
We were incorporated in California in 1988 and reincorporated in Delaware in 1997. We maintain a World Wide Website at www.powerint.com. Investors can obtain copies of our SEC filings from this site free of charge as well as from the SEC website at www.sec.gov.
Industry Background
Virtually every electronic device that plugs into a wall socket requires some type of power supply to convert high-voltage AC, provided by electric utilities, into low-voltage DC required by the devices. Additionally, rechargeable, portable products, such as cellular phones and laptop computers, also need an AC to DC power supply to recharge their batteries.
Before 1970, AC to DC power supplies used large, inefficient transformers, which operated at low frequencies to convert power from AC to DC. In the 1970s, the invention of high-voltage discrete semiconductors enabled the development of a new generation of AC to DC “switching” power supplies (switchers), which operate at much higher frequencies allowing the use of smaller, more efficient transformers to lower the voltage.

2
Although these discrete switchers offered advantages over older technologies, over the years they have not kept pace with the technological advances made in the electronic devices they power.
As the pressures from market forces have increased, the limitations of discrete switchers have become more pronounced. Discrete switchers require numerous components which limit the power supply designers’ ability to reduce the size, increase the functionality and improve the efficiency of switchers while at the same time meeting stringent market cost and energy efficiency requirements. In addition, discrete switchers involve a high level of design complexity, which limits the scalability of designs and increases time-to-market and development risks for new products.
Early attempts to replace discrete switchers with integrated switchers, using high-voltage analog ICs, did not achieve widespread acceptance in the marketplace because they were not cost-effective. We addressed this opportunity in 1994 by introducing our first cost effective IC, TOPSwitch. Our growth since that time validates our belief that a substantial market opportunity exists for high-voltage ICs that are cost effective and combine the benefits of integration that discrete switcher and earlier transformer technologies lack.
Our Highly Integrated Solution
We have developed several families of high-voltage power conversion ICs, which we believe are the first highly integrated power conversion ICs to achieve widespread market acceptance. Based on this and subsequent innovations, since introducing our TOPSwitch family of products in 1994, we have shipped into the market we pioneered approximately 1.1 billion ICs. These patented ICs achieve a high level of system integration by combining a number of electronic components into a single IC. Our TOPSwitch, TinySwitch, DPA-Switch and LinkSwitch products enable many power supplies to have a total cost equal to or lower than discrete switchers. Our products offer the following key benefits to power supplies:
• Fewer Components, Reduced Size and Enhanced Functionality
Our highly integrated ICs enable the design and production of cost-effective switchers that use up to 70% fewer components and have enhanced functionality compared to discrete-based solutions. For example, our ICs provide thermal and short circuit protection without increasing system cost, while discrete switchers must add additional components and cost to provide these functions.
• Improved Efficiency
Our integrated circuit also improves electrical efficiency, which reduces power consumption and excess heat generation. Our patented low-loss, high-voltage device, combined with its control circuitry, improves overall electrical efficiency during both full operation and stand-by mode.
• Reduced Time-to-Market
Our integrated circuits make power supply designs simpler and more suitable for high volume manufacturing. We also provide automated design tools and reference designs that reduce time-to-market and product development risk.
• Wide Power Range and Scalability
Products in our current IC families can address a power range of 0 to 290 watts. Within each family of products, the switcher designer can scale up or down in power to address a wide range of designs with minimal design effort.
Strategy
Our objective is to be the leading provider of high-voltage power conversion ICs. We intend to pursue the following strategies to accelerate adoption of our products:
3
• Target High-Volume Markets
Because of our products’ scalability and ability to address a wide power range, a small number of products address a wide variety of customer needs, allowing us to take advantage of economies of scale and making us more competitive.
• Focus on Markets that Can Derive Significant Benefits from Integration
We focus our efforts on those applications that are particularly sensitive to size, portability, energy efficiency and/or time to market issues such as cellular phones and cordless phones in the communications market, desktop PCs and LCD monitors in the computer market, and DVDs, home appliances and set-top boxes in the consumer market. As other significant market opportunities emerge for our products, we intend to focus our resources on the development and penetration of those markets.
• Deliver Systems Solutions and Provide Applications Expertise
To help potential customers decide to purchase our products, we offer comprehensive application design support. We provide extensive application notes, software design tools and reference design boards. We also provide application-engineering support out of our headquarters and through field application engineering labs located in U.S., China, England, Germany, India, Japan, Korea and Taiwan. We believe our power supply systems expertise and investment in field applications engineering provide us significant competitive advantages.
• Extend Technological Leadership in High-Voltage Analog ICs
Our proprietary device structures and fabrication processes as well as our circuit and system designs have resulted in 81 U.S. patents and 61 foreign patents as of December 31, 2003. These patents, in combination with our other intellectual property, form the basis of our product families. Our more recent enhanced product families provide improved power capability and system cost advantages while preserving the design simplicity of our original TOPSwitch products. We continue to improve our device structures, wafer fabrication processes and circuit and system designs and seek to obtain additional patents to protect our intellectual property.
• Leverage Patented Technology in Strategic Relationships
We have established relationships with Matsushita Electric Industrial Co, Ltd. (Matsushita) , and with OKI Electric Industry (OKI) in order to take advantage of these companies’ high volume manufacturing resources, and in the case of Matsushita, to also generate royalty revenues. Our wafer manufacturing relationships with Matsushita and OKI enable us to focus on fundamental high-voltage silicon technology, product design and marketing while minimizing fixed costs and capital expenditures. Matsushita also has licensed the right to manufacture our products for sale in certain geographic regions and for use in its own products. In May 2003, we signed a wafer supply agreement with a third foundry, ZMD Analog Mixed Signal Services GmbH & CoKG (ZMD). ZMD is located in Germany and is expected to be able to produce wafers for us by the end of 2004.
Products
Below is a brief description of our products:
• Our TOPSwitch, TinySwitch, LinkSwitch, and DPA-Switch high-voltage analog IC products are able to meet the power conversion needs of a wide range of applications within high volume markets. Sales of these products accounted for approximately 100%, 99% and 98% of our net revenues in 2003, 2002 and 2001, respectively.
4
∗ TOPSwitch
The TOPSwitch family was introduced in 1994 and consists of 13 products. The key benefits that the TOPSwitch family brings to power supplies, compared to discrete switchers, include fewer components, reduced size, enhanced functionality and lower cost in many applications. Our TOPSwitch products integrate a PWM controller, a high-voltage MOSFET and a number of other electronic components into a single 3 terminal IC.
∗ TOPSwitch- II
The TOPSwitch-II family was introduced in April 1997 and consists of 11 products. The TOPSwitch-II products further lower the switcher costs by improving the performance of TOPSwitch and addressing low power applications with lower cost packaging. The TOPSwitch-II family uses the same proprietary architecture as the original TOPSwitch family, enabling switcher designers experienced with TOPSwitch to take advantage of the TOPSwitch-II benefits without implementing a new architecture.
∗ TinySwitch
The TinySwitch family was introduced in September 1998 and consists of 5 products. The product line topology was specifically designed to address low power applications below 10 watts. The TinySwitch family of high voltage ICs was the first family of chips to incorporate EcoSmart technology to address the growing global demands to reduce energy waste in a wide range of electronic products. It dramatically reduces the energy consumed during standby and no-load, enabling our customers to meet governmental energy efficiency guidelines.
∗ TOPSwitch-FX
The TOPSwitch-FX family was introduced in March 2000 and consists of 6 products. This family offers engineers greater design flexibility to develop highly integrated power supplies. New features integrated into the TOPSwitch-FX parts continue to reduce the system cost of power supplies as well as improve their performance. In addition, this product line incorporates our energy saving EcoSmart technology to help meet the growing need for environmentally friendly power solutions. The family delivers up to 75 watts of power for use in markets such as cellular phone chargers, personal computers, set-top boxes and DVD players.
∗ TOPSwitch-GX
The TOPSwitch-GX family was introduced in November 2000 and consists of 22 products. It is capable of supplying output power levels up to 290 watts. TOPSwitch-GX is the first monolithic high voltage switching power IC capable of providing this level of power. Our patented, new high-voltage technology further improves silicon efficiency of this family of devices resulting in a significantly more cost-effective high voltage device than that of competing technologies. The new family incorporates the features offered in earlier TOPSwitch product families as well as new ones through additional user configurable pins. This allows a higher level of end user design flexibility, resulting in improved power supply design optimization and lower system cost. EcoSmart technology offers improved standby energy efficiency. Applications for TOPSwitch-GX devices include set-top boxes, DVD players, desktop computers, LCD monitors, internet appliances and printers.
5
∗ TinySwitch- II
The TinySwitch-II family was introduced in March 2001 and consists of 4 products. This product line maintains the simplicity of the previous TinySwitch line while providing additional features and lowering system cost. This family of products is also implemented with the patented new high-voltage silicon technology and addresses power levels up to 23 watts. TinySwitch-II devices enable manufacturers to easily and cost effectively meet energy guidelines for standby power as outlined in Europe’s EC Code of Conduct, President Bush’s one watt standby executive order and Energy Star’s guidelines in the U.S. Applications for these devices include low power adapters for portable equipment such as cell phones, PDAs, digital cameras, external computer peripherals, power tools, standby power supplies found in PCs and audio/video equipment and power supplies for home appliances.
∗ LinkSwitch
The LinkSwitch family was introduced in September 2002 and consists of 2 products. Deriving its name from the phrase “Linear Killer Switch”, it is the industry’s first highly integrated high-voltage power conversion IC designed specifically to displace low power (0 to 3 watts) linear transformers in adapters and battery chargers by delivering switcher benefits – smaller size, lighter weight, superior performance and energy efficiency – at comparable system cost. The LinkSwitch family incorporates EcoSmart technology to address the growing global demand to reduce energy waste in a wide range of electronic products. Applications for LinkSwitch devices include low power adapters and chargers for personal electronics such as cell phones, cordless phones, digital cameras, and MP3 players. LinkSwitch can also be used in consumer appliance applications.
∗ DPA-Switch
The DPA-Switch family was introduced in June 2002 and consists of 4 products. It is capable of supplying output power levels of up to 100 watts. DPA-Switch is the first monolithic high voltage switching power IC designed specifically for use in DC-DC converters and distributed power architectures. The DPA-Switch allows designers to eliminate up to 50 external components from the design of a typical discrete DC-DC converter, resulting in a shorter design cycle, smaller board size and higher reliability. Applications include network and telecommunication line cards, PC servers, power over ethernet (PoE) powered devices, VoIP phones, Digital PBX phones, DC-DC converter modules and industrial controls.
6
Markets and Customers
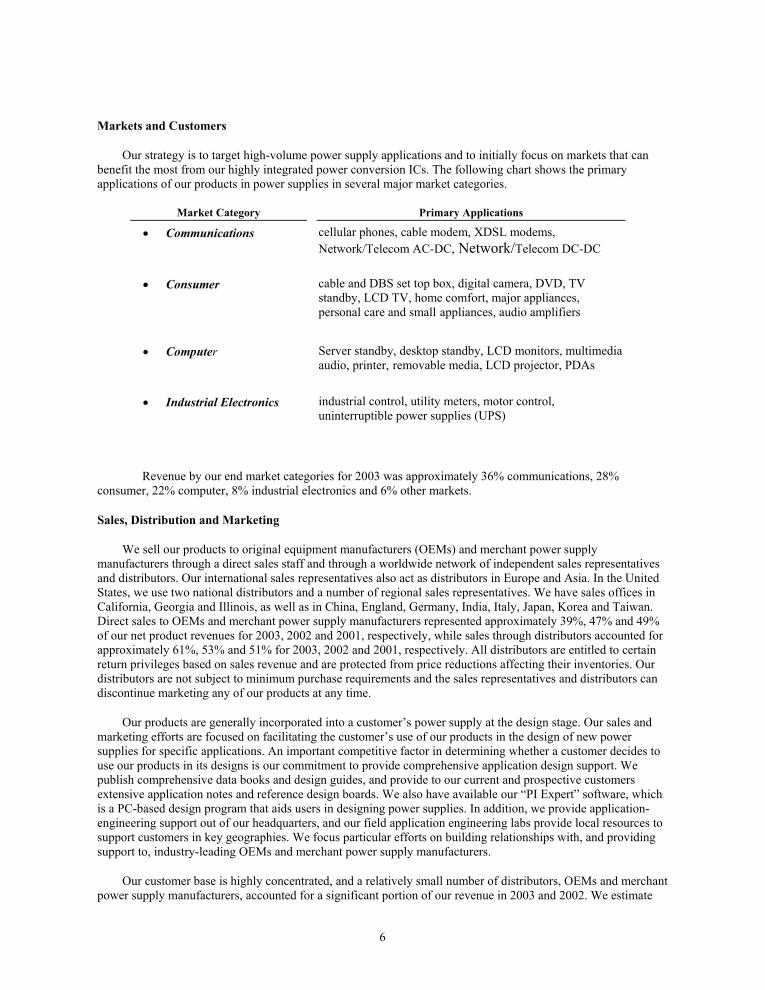
Our strategy is to target high-volume power supply applications and to initially focus on markets that can benefit the most from our highly integrated power conversion ICs. The following chart shows the primary applications of our products in power supplies in several major market categories.
Market Category Primary Applications
• Communications cellular phones, cable modem, XDSL modems, Network/Telecom AC-DC, Network/Telecom DC-DC
• Consumer cable and DBS set top box, digital camera, DVD, TV standby, LCD TV, home comfort, major appliances, personal care and small appliances, audio amplifiers
• Computer Server standby, desktop standby, LCD monitors, multimedia audio, printer, removable media, LCD projector, PDAs
• Industrial Electronics industrial control, utility meters, motor control, uninterruptible power supplies (UPS)
Revenue by our end market categories for 2003 was approximately 36% communications, 28% consumer, 22% computer, 8% industrial electronics and 6% other markets.
Sales, Distribution and Marketing
We sell our products to original equipment manufacturers (OEMs) and merchant power supply manufacturers through a direct sales staff and through a worldwide network of independent sales representatives and distributors. Our international sales representatives also act as distributors in Europe and Asia. In the United States, we use two national distributors and a number of regional sales representatives. We have sales offices in California, Georgia and Illinois, as well as in China, England, Germany, India, Italy, Japan, Korea and Taiwan. Direct sales to OEMs and merchant power supply manufacturers represented approximately 39%, 47% and 49% of our net product revenues for 2003, 2002 and 2001, respectively, while sales through distributors accounted for approximately 61%, 53% and 51% for 2003, 2002 and 2001, respectively. All distributors are entitled to certain return privileges based on sales revenue and are protected from price reductions affecting their inventories. Our distributors are not subject to minimum purchase requirements and the sales representatives and distributors can discontinue marketing any of our products at any time.
Our products are generally incorporated into a customer’s power supply at the design stage. Our sales and marketing efforts are focused on facilitating the customer’s use of our products in the design of new power supplies for specific applications. An important competitive factor in determining whether a customer decides to use our products in its designs is our commitment to provide comprehensive application design support. We publish comprehensive data books and design guides, and provide to our current and prospective customers extensive application notes and reference design boards. We also have available our “PI Expert” software, which is a PC-based design program that aids users in designing power supplies. In addition, we provide application-engineering support out of our headquarters, and our field application engineering labs provide local resources to support customers in key geographies. We focus particular efforts on building relationships with, and providing support to, industry-leading OEMs and merchant power supply manufacturers.
Our customer base is highly concentrated, and a relatively small number of distributors, OEMs and merchant power supply manufacturers, accounted for a significant portion of our revenue in 2003 and 2002. We estimate
7
that our top ten customers, including distributors which resell to large OEMs and merchant power supply manufacturers, accounted for 76%, 81% and 74% of our net revenues for 2003, 2002 and 2001, respectively. For 2003, Memec Electronic Components and Synnex Technologies, both distributors, accounted for 25% and 20% of our net revenues, respectively. For 2002, Memec and Synnex accounted for 22% and 15% of our net revenues, respectively. Also in 2002, Samsung Electronics, an OEM, accounted for 14% of our net revenues. For 2001, Memec and Synnex accounted for 22% and 13% of our net revenues, respectively. Also in 2001, Phihong Enterprise Co., a merchant power supply manufacturer, accounted for 11% of our net revenues. No other customers accounted for more than 10% of net revenues during 2003, 2002 and 2001. In 2003, 2002 and 2001, international sales comprised 93%, 96% and 93%, respectively, of our net revenues. See note 2 in our notes to consolidated financial statements regarding material sales in individual countries.
Sales of our products are generally made pursuant to standard purchase orders, which are frequently revised, prior to shipment, to reflect changes in the customer’s requirements. Product deliveries are scheduled upon our receipt of purchase orders. Generally, these orders allow customers to reschedule delivery dates and cancel purchase orders without significant penalties. For these reasons, we believe that purchase orders received, while useful for scheduling production, are not necessarily reliable indicators of future revenues.
Technology
• High-Voltage Transistor Structure and Process Technology
We have developed a patented high-voltage, power IC technology, which uses our proprietary high voltage MOS transistor structure and fabrication process. The technology enables us to integrate cost effectively on the same monolithic IC, high-voltage n-channel transistors with industry standard CMOS and bipolar components. The IC device structure and the wafer fabrication process both contribute to the cost effectiveness of our high-voltage technology. In 2003 we introduced an improved, high-voltage technology that further reduces silicon area of the devices by using dual-conduction layers. The device structure provides a transistor conduction capability that results in a significantly more cost-effective high voltage device than that of competing technologies. Our high voltage ICs have been implemented on low cost silicon wafers using standard 5V CMOS silicon processing techniques with a relatively large feature size of 3-microns combined with our proprietary implant process.
• IC Design and System Technology
Our proprietary IC designs combine complex control circuits and high-voltage transistors on the same monolithic IC. Our IC design technology takes advantage of our high-voltage process to minimize the die size of both the high-voltage device and control circuits and improve the performance of our ICs versus alternative integrated technologies. We also have developed system expertise in switching converters that have resulted in new innovative topologies that reduce system cost, increase system performance and greatly improve energy efficiency of power supplies compared to alternative approaches. Our innovations in IC circuit designs and system level architectures have enabled us to develop revolutionary products such as the highly integrated TOPSwitch, TOPSwitch-FX, TOPSwitch-GX, TinySwitch, LinkSwitch and DPA-Switch family of ICs.
Research and Development
Our research and development efforts are focused on improving our high-voltage device structures, wafer fabrication processes, analog circuit designs and system level architecture. By these efforts, we seek to introduce new products to expand our addressable markets, further reduce the costs of our products, and improve the cost effectiveness and enhance the functionality of our customers’ power supplies. We have assembled a multidisciplined team of highly skilled engineers to meet our research and development goals. These engineers bring expertise in high-voltage structure and process technology, analog design and power supply systems architecture.
8
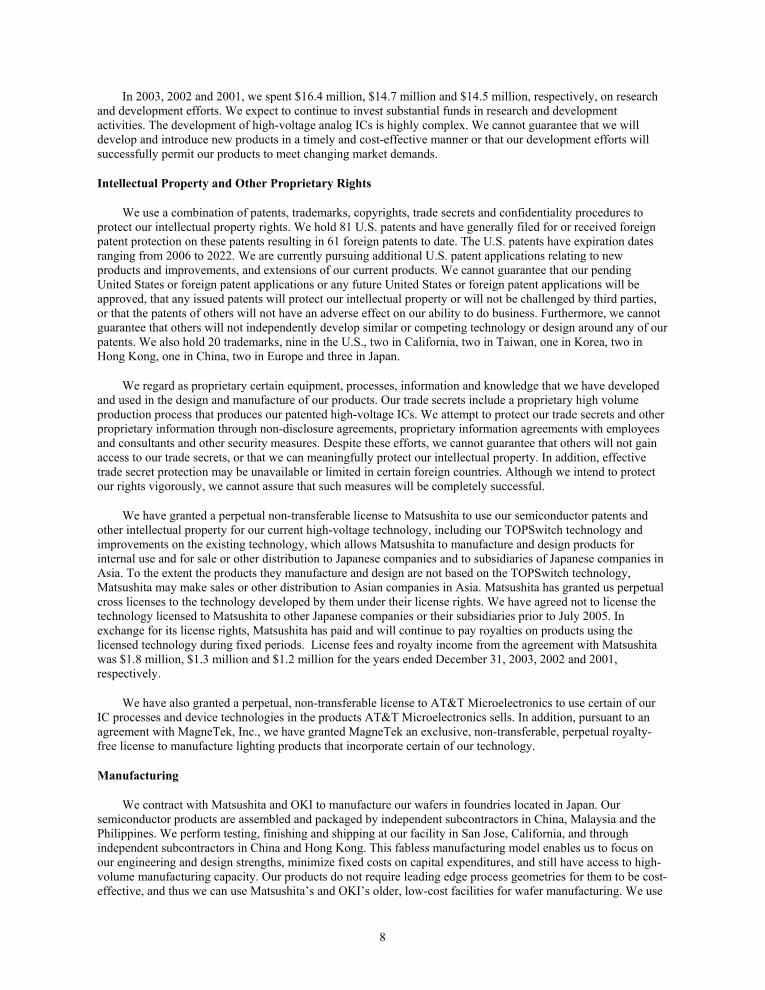
In 2003, 2002 and 2001, we spent $16.4 million, $14.7 million and $14.5 million, respectively, on research and development efforts. We expect to continue to invest substantial funds in research and development activities. The development of high-voltage analog ICs is highly complex. We cannot guarantee that we will develop and introduce new products in a timely and cost-effective manner or that our development efforts will successfully permit our products to meet changing market demands.
Intellectual Property and Other Proprietary Rights
We use a combination of patents, trademarks, copyrights, trade secrets and confidentiality procedures to protect our intellectual property rights. We hold 81 U.S. patents and have generally filed for or received foreign patent protection on these patents resulting in 61 foreign patents to date. The U.S. patents have expiration dates ranging from 2006 to 2022. We are currently pursuing additional U.S. patent applications relating to new products and improvements, and extensions of our current products. We cannot guarantee that our pending United States or foreign patent applications or any future United States or foreign patent applications will be approved, that any issued patents will protect our intellectual property or will not be challenged by third parties, or that the patents of others will not have an adverse effect on our ability to do business. Furthermore, we cannot guarantee that others will not independently develop similar or competing technology or design around any of our patents. We also hold 20 trademarks, nine in the U.S., two in California, two in Taiwan, one in Korea, two in Hong Kong, one in China, two in Europe and three in Japan.
We regard as proprietary certain equipment, processes, information and knowledge that we have developed and used in the design and manufacture of our products. Our trade secrets include a proprietary high volume production process that produces our patented high-voltage ICs. We attempt to protect our trade secrets and other proprietary information through non-disclosure agreements, proprietary information agreements with employees and consultants and other security measures. Despite these efforts, we cannot guarantee that others will not gain access to our trade secrets, or that we can meaningfully protect our intellectual property. In addition, effective trade secret protection may be unavailable or limited in certain foreign countries. Although we intend to protect our rights vigorously, we cannot assure that such measures will be completely successful.
We have granted a perpetual non-transferable license to Matsushita to use our semiconductor patents and other intellectual property for our current high-voltage technology, including our TOPSwitch technology and improvements on the existing technology, which allows Matsushita to manufacture and design products for internal use and for sale or other distribution to Japanese companies and to subsidiaries of Japanese companies in Asia. To the extent the products they manufacture and design are not based on the TOPSwitch technology, Matsushita may make sales or other distribution to Asian companies in Asia. Matsushita has granted us perpetual cross licenses to the technology developed by them under their license rights. We have agreed not to license the technology licensed to Matsushita to other Japanese companies or their subsidiaries prior to July 2005. In exchange for its license rights, Matsushita has paid and will continue to pay royalties on products using the licensed technology during fixed periods. License fees and royalty income from the agreement with Matsushita was $1.8 million, $1.3 million and $1.2 million for the years ended December 31, 2003, 2002 and 2001, respectively.
We have also granted a perpetual, non-transferable license to AT&T Microelectronics to use certain of our IC processes and device technologies in the products AT&T Microelectronics sells. In addition, pursuant to an agreement with MagneTek, Inc., we have granted MagneTek an exclusive, non-transferable, perpetual royalty-free license to manufacture lighting products that incorporate certain of our technology.
Manufacturing
We contract with Matsushita and OKI to manufacture our wafers in foundries located in Japan. Our semiconductor products are assembled and packaged by independent subcontractors in China, Malaysia and the Philippines. We perform testing, finishing and shipping at our facility in San Jose, California, and through independent subcontractors in China and Hong Kong. This fabless manufacturing model enables us to focus on our engineering and design strengths, minimize fixed costs on capital expenditures, and still have access to high-volume manufacturing capacity. Our products do not require leading edge process geometries for them to be cost-effective, and thus we can use Matsushita’s and OKI’s older, low-cost facilities for wafer manufacturing. We use
9
a proprietary and sensitive implant process and must interact closely with Matsushita and OKI to achieve satisfactory yields. Although we generally utilize standard IC packages for assembly, some materials and aspects of assembly are specific to our products. We require our manufacturers to use a high-voltage molding compound that is difficult to process and is available from only one supplier. This compound and its required processes, together with the other non-standard materials and processes needed to assemble our products, require a more exacting level of process control than normally required for standard packages. As a result we must be involved with our contractors on an active engineering basis to maintain and improve the process. We have developed process monitoring equipment to support this effort and must provide adequate engineering resources to provide similar support in the future.
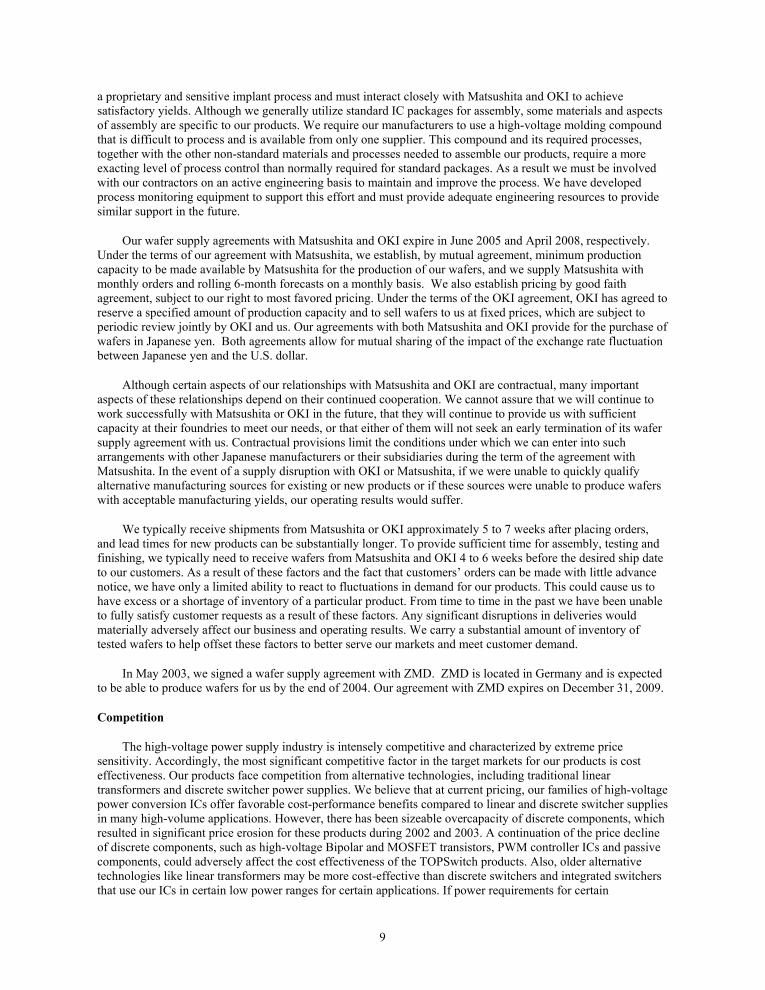
Our wafer supply agreements with Matsushita and OKI expire in June 2005 and April 2008, respectively. Under the terms of our agreement with Matsushita, we establish, by mutual agreement, minimum production capacity to be made available by Matsushita for the production of our wafers, and we supply Matsushita with monthly orders and rolling 6-month forecasts on a monthly basis. We also establish pricing by good faith agreement, subject to our right to most favored pricing. Under the terms of the OKI agreement, OKI has agreed to reserve a specified amount of production capacity and to sell wafers to us at fixed prices, which are subject to periodic review jointly by OKI and us. Our agreements with both Matsushita and OKI provide for the purchase of wafers in Japanese yen. Both agreements allow for mutual sharing of the impact of the exchange rate fluctuation between Japanese yen and the U.S. dollar.
Although certain aspects of our relationships with Matsushita and OKI are contractual, many important aspects of these relationships depend on their continued cooperation. We cannot assure that we will continue to work successfully with Matsushita or OKI in the future, that they will continue to provide us with sufficient capacity at their foundries to meet our needs, or that either of them will not seek an early termination of its wafer supply agreement with us. Contractual provisions limit the conditions under which we can enter into such arrangements with other Japanese manufacturers or their subsidiaries during the term of the agreement with Matsushita. In the event of a supply disruption with OKI or Matsushita, if we were unable to quickly qualify alternative manufacturing sources for existing or new products or if these sources were unable to produce wafers with acceptable manufacturing yields, our operating results would suffer.
We typically receive shipments from Matsushita or OKI approximately 5 to 7 weeks after placing orders, and lead times for new products can be substantially longer. To provide sufficient time for assembly, testing and finishing, we typically need to receive wafers from Matsushita and OKI 4 to 6 weeks before the desired ship date to our customers. As a result of these factors and the fact that customers’ orders can be made with little advance notice, we have only a limited ability to react to fluctuations in demand for our products. This could cause us to have excess or a shortage of inventory of a particular product. From time to time in the past we have been unable to fully satisfy customer requests as a result of these factors. Any significant disruptions in deliveries would materially adversely affect our business and operating results. We carry a substantial amount of inventory of tested wafers to help offset these factors to better serve our markets and meet customer demand.
In May 2003, we signed a wafer supply agreement with ZMD. ZMD is located in Germany and is expected to be able to produce wafers for us by the end of 2004. Our agreement with ZMD expires on December 31, 2009.
Competition
The high-voltage power supply industry is intensely competitive and characterized by extreme price sensitivity. Accordingly, the most significant competitive factor in the target markets for our products is cost effectiveness. Our products face competition from alternative technologies, including traditional linear transformers and discrete switcher power supplies. We believe that at current pricing, our families of high-voltage power conversion ICs offer favorable cost-performance benefits compared to linear and discrete switcher supplies in many high-volume applications. However, there has been sizeable overcapacity of discrete components, which resulted in significant price erosion for these products during 2002 and 2003. A continuation of the price decline of discrete components, such as high-voltage Bipolar and MOSFET transistors, PWM controller ICs and passive components, could adversely affect the cost effectiveness of the TOPSwitch products. Also, older alternative technologies like linear transformers may be more cost-effective than discrete switchers and integrated switchers that use our ICs in certain low power ranges for certain applications. If power requirements for certain
10
applications in which our products are currently utilized, such as battery chargers for cellular telephones, drop below certain power levels, these older alternative technologies can be used more cost effectively than switchers. Our TinySwitch IC family, introduced in September 1998 and LinkSwitch introduced in October 2002, were specifically designed to enhance the cost effectiveness of our integrated switcher solutions in the low power range. However, we cannot guarantee that our efforts in this area will continue to be successful.
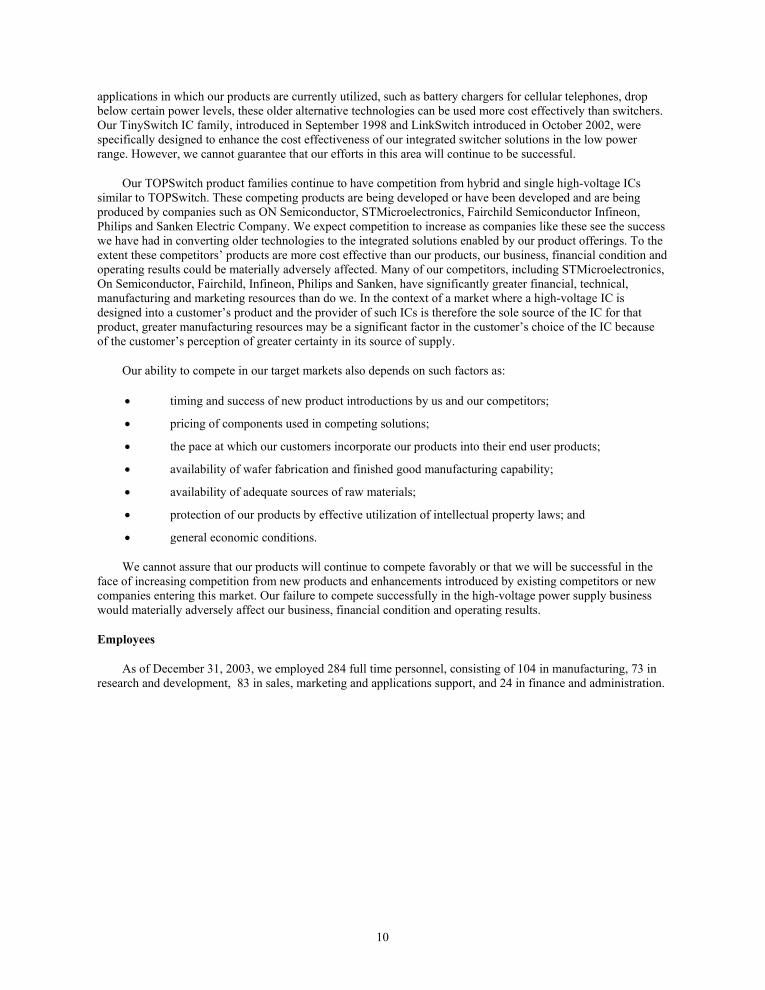
Our TOPSwitch product families continue to have competition from hybrid and single high-voltage ICs similar to TOPSwitch. These competing products are being developed or have been developed and are being produced by companies such as ON Semiconductor, STMicroelectronics, Fairchild Semiconductor Infineon, Philips and Sanken Electric Company. We expect competition to increase as companies like these see the success we have had in converting older technologies to the integrated solutions enabled by our product offerings. To the extent these competitors’ products are more cost effective than our products, our business, financial condition and operating results could be materially adversely affected. Many of our competitors, including STMicroelectronics, On Semiconductor, Fairchild, Infineon, Philips and Sanken, have significantly greater financial, technical, manufacturing and marketing resources than do we. In the context of a market where a high-voltage IC is designed into a customer’s product and the provider of such ICs is therefore the sole source of the IC for that product, greater manufacturing resources may be a significant factor in the customer’s choice of the IC because of the customer’s perception of greater certainty in its source of supply.
Our ability to compete in our target markets also depends on such factors as:
• timing and success of new product introductions by us and our competitors;
• pricing of components used in competing solutions;
• the pace at which our customers incorporate our products into their end user products;
• availability of wafer fabrication and finished good manufacturing capability;
• availability of adequate sources of raw materials;
• protection of our products by effective utilization of intellectual property laws; and
• general economic conditions.
We cannot assure that our products will continue to compete favorably or that we will be successful in the face of increasing competition from new products and enhancements introduced by existing competitors or new companies entering this market. Our failure to compete successfully in the high-voltage power supply business would materially adversely affect our business, financial condition and operating results.
Employees
As of December 31, 2003, we employed 284 full time personnel, consisting of 104 in manufacturing, 73 in research and development, 83 in sales, marketing and applications support, and 24 in finance and administration.
11
Executive Officers of Power Integrations
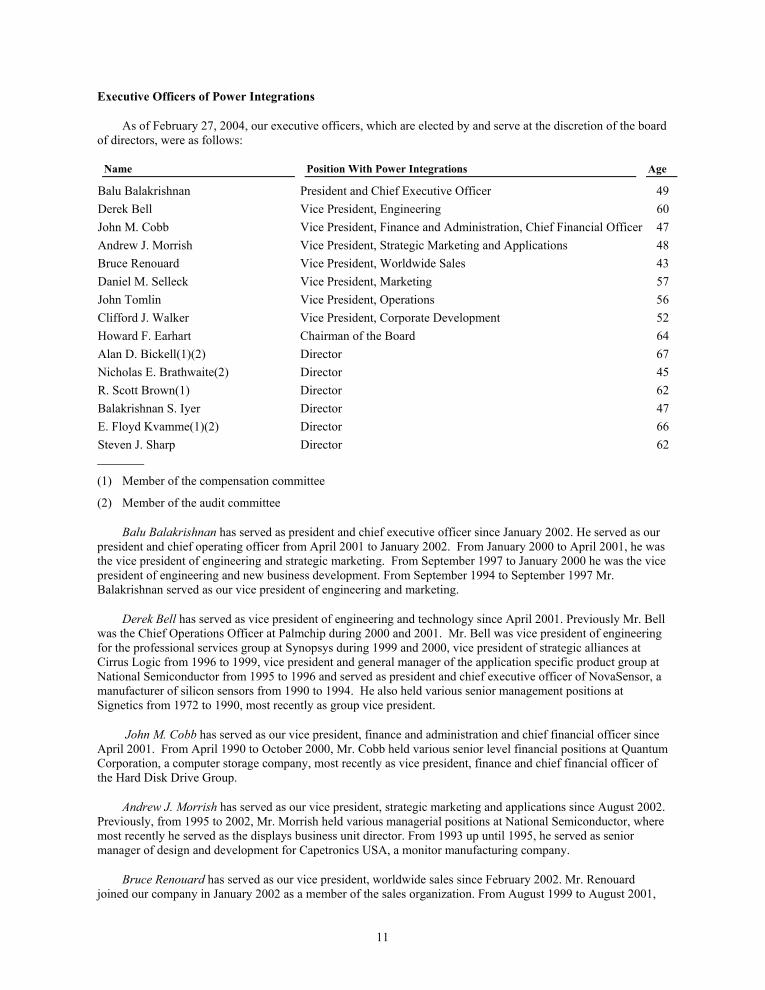
As of February 27, 2004, our executive officers, which are elected by and serve at the discretion of the board of directors, were as follows:
Name Position With Power Integrations Age
Balu Balakrishnan President and Chief Executive Officer 49 Derek Bell Vice President, Engineering 60 John M. Cobb Vice President, Finance and Administration, Chief Financial Officer 47 Andrew J. Morrish Vice President, Strategic Marketing and Applications 48 Bruce Renouard Vice President, Worldwide Sales 43 Daniel M. Selleck Vice President, Marketing 57 John Tomlin Vice President, Operations 56 Clifford J. Walker Vice President, Corporate Development 52 Howard F. Earhart Chairman of the Board 64 Alan D. Bickell(1)(2) Director 67 Nicholas E. Brathwaite(2) Director 45 R. Scott Brown(1) Director 62 Balakrishnan S. Iyer Director 47 E. Floyd Kvamme(1)(2) Director 66 Steven J. Sharp Director 62 (1) Member of the compensation committee
(2) Member of the audit committee
Balu Balakrishnan has served as president and chief executive officer since January 2002. He served as our president and chief operating officer from April 2001 to January 2002. From January 2000 to April 2001, he was the vice president of engineering and strategic marketing. From September 1997 to January 2000 he was the vice president of engineering and new business development. From September 1994 to September 1997 Mr. Balakrishnan served as our vice president of engineering and marketing.
Derek Bell has served as vice president of engineering and technology since April 2001. Previously Mr. Bell was the Chief Operations Officer at Palmchip during 2000 and 2001. Mr. Bell was vice president of engineering for the professional services group at Synopsys during 1999 and 2000, vice president of strategic alliances at Cirrus Logic from 1996 to 1999, vice president and general manager of the application specific product group at National Semiconductor from 1995 to 1996 and served as president and chief executive officer of NovaSensor, a manufacturer of silicon sensors from 1990 to 1994. He also held various senior management positions at Signetics from 1972 to 1990, most recently as group vice president.
John M. Cobb has served as our vice president, finance and administration and chief financial officer since April 2001. From April 1990 to October 2000, Mr. Cobb held various senior level financial positions at Quantum Corporation, a computer storage company, most recently as vice president, finance and chief financial officer of the Hard Disk Drive Group.
Andrew J. Morrish has served as our vice president, strategic marketing and applications since August 2002. Previously, from 1995 to 2002, Mr. Morrish held various managerial positions at National Semiconductor, where most recently he served as the displays business unit director. From 1993 up until 1995, he served as senior manager of design and development for Capetronics USA, a monitor manufacturing company.
Bruce Renouard has served as our vice president, worldwide sales since February 2002. Mr. Renouard joined our company in January 2002 as a member of the sales organization. From August 1999 to August 2001,

12
he served as vice president, worldwide sales of Zoran Corporation, a provider of digital solutions in the multimedia and consumer electronics markets. Mr. Renouard held the position of director, worldwide market development from June 1997 to August 1999 for IDT/Centaur, an X 86 processor. From January 1995 to June 1997, he served as national distribution sales manager for Cyrix Corp, a company specializing in Intel compatible processors.
Daniel M. Selleck has served as our vice president, marketing since February 2002. He was our vice president, worldwide sales from May 1993 to February 2002. From February 1984 to May 1993, Mr. Selleck held various sales management positions with Philips Semiconductor including European regional sales manager and western area sales manager in the United States.
John Tomlin has served as our vice president, operations since October 2001. From 1981 to 2001, Mr. Tomlin served in a variety of senior management positions in operations, service, logistics and marketing, most recently as vice president of worldwide operations at Quantum Corporation, a computer storage company.
Clifford J. Walker has served as our vice president, corporate development since June 1995. From September 1994 to June 1995, Mr. Walker served as vice president of Reach Software, a software company. From December 1993 to September 1994, Mr. Walker served as president of Morgan Walker, a consulting company.
Howard F. Earhart served as our president, chief executive officer and as a director from January 1995 until January 2002, and continues as chairman of the board of directors. Mr. Earhart brings more than 30 years of executive management experience to Power Integrations. His management experience includes photographic film products at Eastman Kodak and consumer products at Memorex Corporation where he was president of the consumer products group. Mr. Earhart also served as the chief executive officer of Lin Data Corporation and Information Magnetics Corporation; both companies manufacture semiconductor-based components for the disk drive industry. Mr. Earhart currently serves on the boards of two private companies.
Alan D. Bickell has served as a member of the board of directors since April 1999. Mr. Bickell retired in 1996 after more than 30 years with Hewlett Packard, serving as a corporate senior vice president and managing director of geographic operations since 1992. Mr. Bickell also serves on the boards of Asiainfo Holdings, Inc. and the Peking University Educational Foundation (USA).
Nicholas E. Brathwaite has served as a member of the board of directors since January 2000. Mr. Brathwaite currently serves as senior vice president and chief technology officer for Flextronics International, a provider of engineering, advanced electronics manufacturing and logistical services, and has held various engineering management positions with Flextronics since 1995. From 1989 to 1995, Mr. Brathwaite held various management positions at nChip, a multi-chip module company.
R. Scott Brown has served as a member of the board of directors since July 1999. Mr. Brown has been retired since May 1999. From 1985 to May 1999, Mr. Brown served as senior vice president of worldwide sales and support for Xilinx, Inc., a designer and developer of complete programmable logic solutions for use by electronic equipment manufacturers.
Balakrishnan S. Iyer became a member of the board of directors in February 2004. From October 1998 to June 2003, Mr. Iyer served as senior vice president and chief financial officer for Conexant Systems, Inc., a worldwide leader in semiconductor systems solutions for communications applications. From 1997 to 1998, Mr. Iyer served as senior vice president and chief financial officer for VLSI Technology, Inc. Mr. Iyer also serves on the boards of Conexant Systems Inc., Invitrogen Corporation, Qlogic Corporation and Skyworks Solutions, Inc.
E. Floyd Kvamme has served as a member of the board of directors since September 1989. Mr. Kvamme has been a general partner of Kleiner Perkins Caufield & Byers, a venture capital company, since 1984, and now is a partner emeritus. Mr. Kvamme also serves on the boards of Harmonic Inc., National Semiconductor, Photon Dynamics and two private companies.

13
Steven J. Sharp is one of our founders and has served as a member of the board of directors since our inception. Mr. Sharp is Chairman of the Board of Directors of TriQuint Semiconductor, a manufacturer of electronic components for the communications industry. He served as president, chief executive officer and chairman of the board of TriQuint Semiconductor, from 1991 until July of 2002. Mr. Sharp serves on the Boards of several private companies and charitable organizations.

14
Item 2. Properties.
In October 2003, we purchased our main executive, administrative, manufacturing and technical offices for approximately $30 million. These offices are located in San Jose, California in an 118,000 square foot facility.
Item 3. Legal Proceedings.
From time to time, we could become involved in litigation relating to claims arising out of the ordinary course of business. We are not presently involved in any legal proceedings.
Item 4. Submission of Matters to a Vote of Security Holders.
None.

15
PART II
Item 5. Market for Power Integrations Common Equity and Related Stockholder Matters.
Our common stock trades on the Nasdaq National Market under the symbol “POWI.” As of February 27, 2004, there were approximately 102 stockholders of record. Because brokers and other institutions on behalf of stockholders hold many of such shares, we are unable to estimate the total number of stockholders represented by these record holders. The following table sets forth, for the quarter indicated, the range of daily closing prices per share of our common stock as reported on the Nasdaq National Market:
Price Range
Year Ended December 31, 2003 High Low Fourth quarter $41.90 $31.41 Third quarter $37.30 $24.48 Second quarter $26.79 $19.60 First quarter $23.86 $17.75
Year Ended December 31, 2002 High Low Fourth quarter $ 21.28 $ 10.11 Third quarter $ 19.50 $ 10.98 Second quarter $ 25.29 $ 16.37 First quarter $ 24.95 $ 14.82
We have not paid any cash dividends on our capital stock. We currently intend to retain our earnings for use in the operation and expansion of our business and, therefore, do not anticipate paying any cash dividends in the foreseeable future.
16
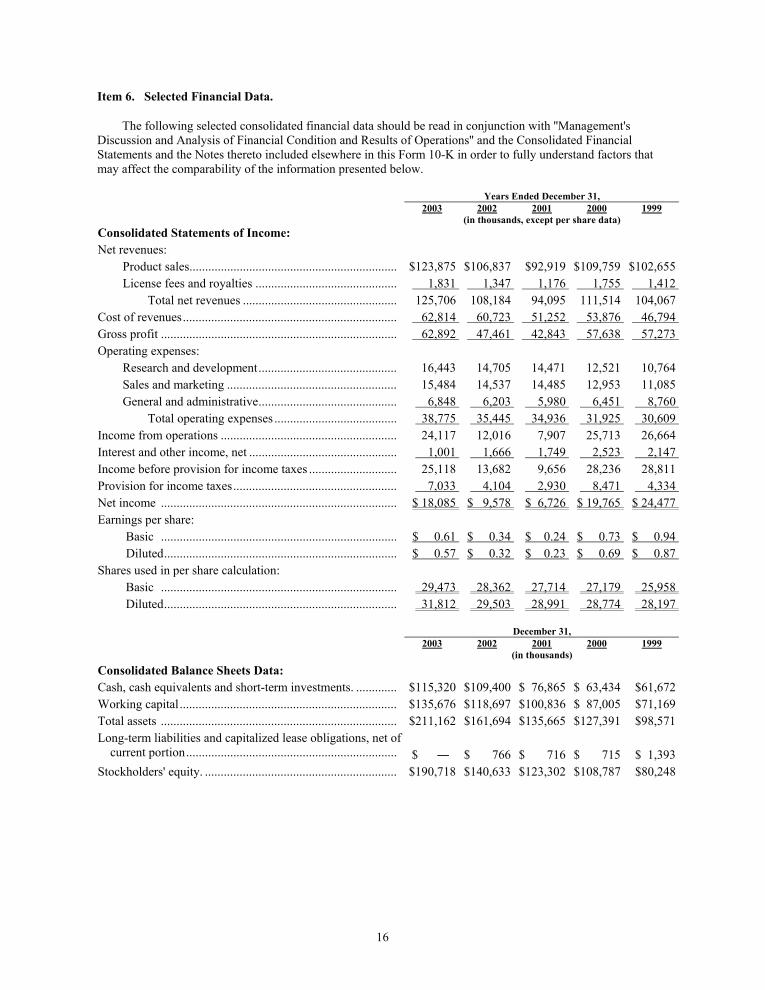
Item 6. Selected Financial Data.
The following selected consolidated financial data should be read in conjunction with ''Management's Discussion and Analysis of Financial Condition and Results of Operations'' and the Consolidated Financial Statements and the Notes thereto included elsewhere in this Form 10-K in order to fully understand factors that may affect the comparability of the information presented below.
Years Ended December 31, 2003 2002 2001 2000 1999 (in thousands, except per share data)
Consolidated Statements of Income: Net revenues: Product sales.................................................................. $123,875 $106,837 $92,919 $109,759 $102,655 License fees and royalties ............................................. 1,831 1,347 1,176 1,755 1,412 Total net revenues ................................................. 125,706 108,184 94,095 111,514 104,067 Cost of revenues.................................................................... 62,814 60,723 51,252 53,876 46,794 Gross profit ........................................................................... 62,892 47,461 42,843 57,638 57,273 Operating expenses: Research and development............................................ 16,443 14,705 14,471 12,521 10,764 Sales and marketing ...................................................... 15,484 14,537 14,485 12,953 11,085 General and administrative............................................ 6,848 6,203 5,980 6,451 8,760 Total operating expenses ....................................... 38,775 35,445 34,936 31,925 30,609 Income from operations ........................................................ 24,117 12,016 7,907 25,713 26,664 Interest and other income, net ............................................... 1,001 1,666 1,749 2,523 2,147 Income before provision for income taxes ............................ 25,118 13,682 9,656 28,236 28,811 Provision for income taxes.................................................... 7,033 4,104 2,930 8,471 4,334 Net income ........................................................................... $ 18,085 $ 9,578 $ 6,726 $ 19,765 $ 24,477 Earnings per share: Basic ........................................................................... $ 0.61 $ 0.34 $ 0.24 $ 0.73 $ 0.94 Diluted.......................................................................... $ 0.57 $ 0.32 $ 0.23 $ 0.69 $ 0.87 Shares used in per share calculation: Basic ........................................................................... 29,473 28,362 27,714 27,179 25,958 Diluted.......................................................................... 31,812 29,503 28,991 28,774 28,197
December 31, 2003 2002 2001 2000 1999 (in thousands)
Consolidated Balance Sheets Data: Cash, cash equivalents and short-term investments. ............. $115,320 $109,400 $ 76,865 $ 63,434 $61,672 Working capital..................................................................... $135,676 $118,697 $100,836 $ 87,005 $71,169 Total assets ........................................................................... $211,162 $161,694 $135,665 $127,391 $98,571 Long-term liabilities and capitalized lease obligations, net of current portion................................................................... $ ― $ 766
$ 716 $ 715 $ 1,393
Stockholders' equity. ............................................................. $190,718 $140,633 $123,302 $108,787 $80,248
17
Item 7. Management’s Discussion and Analysis of Financial Condition and Operating Results.
This report includes a number of forward-looking statements. The use of such words and phrases as “will”, “expect”, “believe”, “should”, “anticipate”, “outlook”, “if”, “future” and similar words and phrases identify forward looking statements. Such statements reflect our current views with respect to future events and our potential financial performance and are subject to risks and uncertainties that could cause our actual results and financial position to differ materially from what we say in this report. These factors include, but are not limited to, our ability to maintain and establish strategic relationships; the risks inherent in the development and delivery of complex technologies; our ability to attract, retain and motivate qualified personnel; the emergence of new markets for our products and services, and our ability to compete in those markets based on timeliness, cost and market demand; and our limited financial resources. We make these forward looking statements based upon information available on the date hereof, and we have no obligation (and expressly disclaim any such obligation) to update or alter any forward looking statements, whether as a result of new information or otherwise .We more fully discuss these and other risk factors in “Item 7—Management’s Discussion and Analysis of Financial Condition and Operating Results— Factors That May Affect Future Results of Operations” and elsewhere in this report. Overview
We design, develop, manufacture and market proprietary, high-voltage, analog ICs for use primarily in AC to DC and DC to DC power conversion. These ICs are used in a wide variety of electronics products primarily for the communications, consumer, computer and industrial electronics markets. The Company’s strategy is to continue to diversify into new markets and to expand its existing customer base. The Company believes it can achieve its goals by continuing to develop products, which are more energy efficient and have increased functionality, and by continuing to focus on cost reduction strategies to remain price competitive. We derive a substantial portion of our net revenues from product sales. Our net revenues from product sales were $123.9 million, $106.8 million and $92.9 million in 2003, 2002 and 2001, respectively. Our business is characterized by short-term orders and short customer lead times. Customers typically can cancel or reschedule orders without significant penalty. We plan our production and inventory levels based on internal forecasts of customer demand, which is highly unpredictable and can fluctuate substantially.
In response to increasing market acceptance of our products and increased revenue growth, we continue to accelerate our investment in research and development and sales and marketing, including technical customer support. Total operating expenses in 2003, 2002 and 2001 were $38.8 million, $35.4 million and $34.9 million, respectively. For 2004, we expect our operating expenses to increase in absolute dollars as we continue to add resources to research and development, sales and marketing and general and administrative activities.
Our quarterly and annual operating results are volatile and difficult to predict. Our net revenues and operating results have varied significantly in the past, are difficult to forecast and are subject to numerous factors both within and outside of our control. As a result, our quarterly and annual operating results may fluctuate significantly in the future. For a discussion of the factors that may affect our quarterly and annual operating results, please see “Factors that May Affect Future Results of Operations.”
We license certain technologies and grant limited product manufacturing and marketing rights to strategic parties in return for foundry relationships, license fees and product royalty arrangements. License fees and royalties consist primarily of royalties on products shipped by licensees incorporating licensed technology, and have accounted for a small percentage of our net revenues. We expect this trend to continue in 2004.
A portion of our cost of revenues consists of the cost of wafers. The contract prices to purchase wafers from Matsushita and OKI are denominated in Japanese yen. The agreements with both vendors allow for mutual sharing of the impact of the exchange rate fluctuation between Japanese yen and the U.S. dollar. Nevertheless, changes in the exchange rate between the U.S. dollar and the Japanese yen subject our gross profit and operating results to the potential for material fluctuations. Our agreement to purchase wafers from ZMD is denominated in U.S. dollars. We expect to begin purchasing wafers from ZMD by the end of 2004.
18
Critical Accounting Policies and Estimates
We believe our critical accounting policies are as follows:
• revenue recognition; • estimating sales returns and allowances; • estimating ship and debit reserve; • estimating allowance for doubtful accounts; • estimating reserve for excess and obsolete inventory, and • income taxes.
We believe that the above represents our critical accounting policies. That is, they are both important to the portrayal of our financial condition and results, and they require us to make judgments and estimates about matters that are inherently uncertain. A brief description of these critical accounting policies is set forth below. For more information regarding our accounting policies, see note 2 in the notes to the consolidated financial statements.
The preparation of financial statements and related disclosures in conformity with accounting principles generally accepted in the United States of America requires management to make estimates and assumptions that affect the reported amounts of assets and liabilities and disclosures of contingent assets and liabilities at the date of the financial statements and the reported amounts of revenues and expenses during the reporting period. On an on-going basis, we evaluate our estimates, including those related to revenue recognition, sales returns, allowance for ship and debit, bad debts and inventories. We base our estimates on historical facts and various other assumptions that we believe to be reasonable at the time the estimates are made. Actual results could differ from those estimates.
Revenue recognition
Product revenues consist of sales to OEMs, merchant power supply manufacturers and distributors. Revenues from product sales to OEMs and merchant power supply manufacturers are recognized upon shipment. At that time, we provide for estimated sales returns and other allowances related to those sales. Approximately 50% to 60% of our sales are made to distributors under terms allowing certain rights of return and price protection for our products held in the distributors’ inventories. Therefore, we defer recognition of revenue and the proportionate cost of revenues derived from sales to distributors until the distributors sell our products to their customers. We evaluate the amounts to defer based on the level of actual distributors’ inventory on hand as well as inventory that is in transit. The gross profit deferred as a result of this policy is reflected as “deferred income on sales to distributors” in the accompanying condensed consolidated balance sheets.
We have entered into a separate wafer supply and technology license agreement with an unaffiliated wafer foundry. The wafer supply agreement, which expires in June 2005, is renewable. In connection with the technology license agreement, we are entitled to receive a royalty on sales of products by the foundry, which incorporates our technology into its own products. This revenue is recognized upon receipt of payment from the foundry.
Estimating sales returns and allowances
Net revenue consists of product revenue reduced by estimated sales returns and allowances. To estimate sales returns and allowances, we analyze, both when we initially establish the reserve, and then each quarter when we review the adequacy of the reserve, the following factors: historical returns, current economic trends, levels of inventories of our products held by our customers, and changes in customer demand and acceptance of our products. This reserve is reflected as a reduction to accounts receivable in the accompanying consolidated balance sheets. Increases to the reserve are recorded as a reduction to net revenue. Because the reserve for sales returns and allowances is based on our judgments and estimates, particularly as to future customer demand and acceptance of our products, our reserves may not be adequate to cover actual sales returns and other allowances. If our reserves are not adequate, our future net revenues could be adversely affected.
19
Estimating ship and debit reserve
Approximately 50% to 60% of our sales are made to distributors. Some of those sales are subject to credits that distributors claim on certain transactions. We also give them protection against subsequent price declines on products they hold. The credits are referred to as “ship and debits.” The credits are available to the distributors after they have sold our products through to their end customer. We maintain a reserve for these credits that appears as a reduction to accounts receivable in our accompanying consolidated balance sheets. Any increase in the reserve results in a corresponding reduction in our net revenues. To establish the adequacy of the reserve, we analyze historical ship and debit payments and levels of inventory in the distributor channels. If our reserves are not adequate, our net revenues could be adversely affected.
Estimating allowance for doubtful accounts
We maintain an allowance for losses we may incur as a result of our customers’ inability to make required payments. Any increase in the allowance results in a corresponding increase in our general and administrative expenses. In establishing this allowance, and then evaluating the adequacy of the allowance for doubtful accounts each quarter, we analyze historical bad debts, customer concentrations, customer credit-worthiness, current economic trends and changes in our customer payment terms. If the financial condition of one or more of our customers deteriorates, resulting in their inability to make payments, or if we otherwise underestimate the losses we incur as a result of our customers’ inability to pay us, we could be required to increase our allowance for doubtful accounts which could adversely affect our operating results.
Estimating reserve for excess and obsolete inventory
We identify excess and obsolete products and analyze historical usage, forecasted production based on demand forecasts, current economic trends, and historical write-offs when evaluating the adequacy of the reserve for excess and obsolete inventory. This reserve is reflected as a reduction to inventory in the accompanying consolidated balance sheets, and an increase in cost of revenues. If actual market conditions are less favorable than our assumptions, we may be required to take additional reserves, which could adversely impact our cost of revenues and operating results.
Income taxes
We recognize Federal, state and foreign current tax liabilities or assets based on our estimate of taxes payable or refundable in the current fiscal year by tax authorities. We also recognize Federal, state and foreign deferred tax liabilities or assets for our estimate of future tax effects attributable to temporary differences and carry forwards and record a valuation allowance to reduce any deferred tax assets by the amount of any tax benefits that, based on available evidence and judgment, are not expected to be realized. As of December 31, 2003, no valuation allowance had been recorded to reduce our deferred tax assets. We believe it is more likely than not that forecasted income, including income that may be generated as a result of certain tax planning strategies, will be sufficient to fully recover our deferred tax assets. In the event that all or part of the net deferred tax assets are determined not to be realizable in the future, an adjustment to the valuation allowance would be charged to earnings in the period such determination is made. In addition, the calculation of tax liabilities involves significant judgment in estimating the impact of uncertainties in the application of complex tax laws. Resolution of these uncertainties in a manner inconsistent with our expectations could have a material impact on our result of operations and financial position.
20
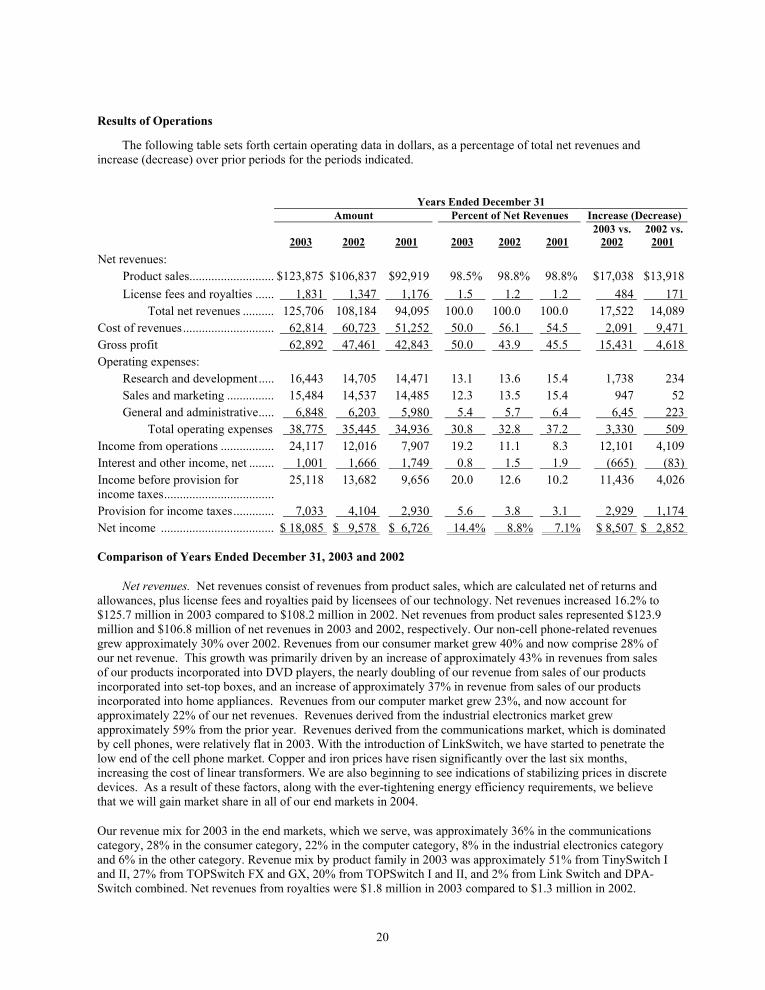
Results of Operations
The following table sets forth certain operating data in dollars, as a percentage of total net revenues and increase (decrease) over prior periods for the periods indicated.
Years Ended December 31 Amount Percent of Net Revenues Increase (Decrease)
2003
2002
2001
2003
2002
2001 2003 vs.
2002 2002 vs.
2001 Net revenues: Product sales........................... $123,875 $106,837 $92,919 98.5% 98.8% 98.8% $17,038 $13,918 License fees and royalties ...... 1,831 1,347 1,176 1.5 1.2 1.2 484 171 Total net revenues .......... 125,706 108,184 94,095 100.0 100.0 100.0 17,522 14,089 Cost of revenues............................. 62,814 60,723 51,252 50.0 56.1 54.5 2,091 9,471 Gross profit 62,892 47,461 42,843 50.0 43.9 45.5 15,431 4,618 Operating expenses: Research and development..... 16,443 14,705 14,471 13.1 13.6 15.4 1,738 234 Sales and marketing ............... 15,484 14,537 14,485 12.3 13.5 15.4 947 52 General and administrative..... 6,848 6,203 5,980 5.4 5.7 6.4 6,45 223 Total operating expenses 38,775 35,445 34,936 30.8 32.8 37.2 3,330 509 Income from operations ................. 24,117 12,016 7,907 19.2 11.1 8.3 12,101 4,109 Interest and other income, net ........ 1,001 1,666 1,749 0.8 1.5 1.9 (665) (83) Income before provision for income taxes...................................
25,118 13,682 9,656 20.0 12.6 10.2 11,436 4,026
Provision for income taxes............. 7,033 4,104 2,930 5.6 3.8 3.1 2,929 1,174 Net income .................................... $ 18,085 $ 9,578 $ 6,726 14.4% 8.8% 7.1% $ 8,507 $ 2,852 Comparison of Years Ended December 31, 2003 and 2002
Net revenues. Net revenues consist of revenues from product sales, which are calculated net of returns and allowances, plus license fees and royalties paid by licensees of our technology. Net revenues increased 16.2% to $125.7 million in 2003 compared to $108.2 million in 2002. Net revenues from product sales represented $123.9 million and $106.8 million of net revenues in 2003 and 2002, respectively. Our non-cell phone-related revenues grew approximately 30% over 2002. Revenues from our consumer market grew 40% and now comprise 28% of our net revenue. This growth was primarily driven by an increase of approximately 43% in revenues from sales of our products incorporated into DVD players, the nearly doubling of our revenue from sales of our products incorporated into set-top boxes, and an increase of approximately 37% in revenue from sales of our products incorporated into home appliances. Revenues from our computer market grew 23%, and now account for approximately 22% of our net revenues. Revenues derived from the industrial electronics market grew approximately 59% from the prior year. Revenues derived from the communications market, which is dominated by cell phones, were relatively flat in 2003. With the introduction of LinkSwitch, we have started to penetrate the low end of the cell phone market. Copper and iron prices have risen significantly over the last six months, increasing the cost of linear transformers. We are also beginning to see indications of stabilizing prices in discrete devices. As a result of these factors, along with the ever-tightening energy efficiency requirements, we believe that we will gain market share in all of our end markets in 2004.
Our revenue mix for 2003 in the end markets, which we serve, was approximately 36% in the communications category, 28% in the consumer category, 22% in the computer category, 8% in the industrial electronics category and 6% in the other category. Revenue mix by product family in 2003 was approximately 51% from TinySwitch I and II, 27% from TOPSwitch FX and GX, 20% from TOPSwitch I and II, and 2% from Link Switch and DPA-Switch combined. Net revenues from royalties were $1.8 million in 2003 compared to $1.3 million in 2002.
21
Customer demand for our products can change quickly and unexpectedly. Our customers perceive that our products are readily available and typically order only for their short-term needs. Our revenue levels are highly dependent on the amount of new orders that are received for which product can be delivered by us within the same period. Orders that are booked and shipped within the same period are called “turns business”. Because of the uncertainty of customer demand, and the short lead-time environment and high turns business, it is difficult to predict future levels of revenues and profitability.
International sales were $117.0 million in 2003 compared to $104.5 million in 2002, representing approximately 93% and 96% of net revenues in those respective periods. Although the power supplies using our products are designed and distributed worldwide, most of these power supplies are manufactured in Asia. As a result, sales to this region were 81.1% and 83.1% of our net revenues for 2003 and 2002, respectively. We expect international sales to continue to account for a large portion of our net revenues.
Direct sales for 2003 were divided 61% to distributors and 39% to OEMs, and merchant power supply manufacturers, compared to 53% to distributors and 47% to OEMs and merchant power supply manufacturers for 2002. In 2003, two separate customers, both of whom are distributors, accounted for approximately 25% and 20% of net revenues. In 2002, the same two customers accounted for approximately 22% and 15% of net revenues. Also in 2002, one other customer, an OEM accounted for approximately 14% of net revenues.
Cost of revenues; Gross profit. Gross profit is equal to net revenues less cost of revenues. Our cost of revenues consists primarily of costs associated with the purchase of wafers from Matsushita and OKI, the assembly and packaging of our products by sub-contractors, internal labor and overhead associated with the testing of both wafers and packaged components and testing of packaged components by sub-contractors. Gross profit was $62.9 million, or 50.0% of net revenues, in 2003, compared to $47.5 million, or 43.9% of net revenues, in 2002. The improved gross margin was a result of our continued focus on reducing manufacturing costs. Cost improvements were primarily the result of improved yields and lower test costs. We expect our gross profit to be in a range of 47% to 49% during 2004 but if pricing pressures from our customers increase during the year as a result of an economic slowdown or for other reasons, our gross profit could be lower.
Research and development expenses. Research and development expenses consist primarily of employee-related expenses, and expensed material and facility costs associated with the development of new processes and new products. We also expense prototype wafers and mask sets related to new products as research and development costs until new products are released to production. Research and development expenses were $16.4 million, or 13.1% of net revenues, in 2003, compared to $14.7 million, or 13.6% of net revenues, in 2002. The increase in absolute dollars for 2003 was due primarily to increased salaries and other costs related to the hiring of additional engineering personnel. We expect research and development expenses to continue to increase in absolute dollars but depending on our ability to sell our products in the current economic environment, such expenses may fluctuate as a percentage of our net revenues.
Sales and marketing expenses. Sales and marketing expenses consist primarily of employee-related expenses, commissions to sales representatives and facilities expenses, including expenses associated with our regional sales and support offices. Sales and marketing expenses, which includes applications engineering were $15.5 million, or 12.3% of net revenues, in 2003, compared to $14.5 million, or 13.5% of net revenues, in 2002. In absolute dollars, sales and marketing expenses for 2003 were slightly up from 2002, primarily as a result of expanding our world wide sales and applications engineering staffs. We expect sales and marketing expenses to increase in absolute dollars in 2004, but depending on the general economic environment and subsequent demand for our products, sales and marketing expenses may fluctuate as a percentage of our net revenues.
General and administrative expenses. General and administrative expenses consist primarily of employee-related expenses for administration, finance, human resources and general management, as well as consulting, professional services, legal and auditing expenses. General and administrative expenses were $6.8 million, or 5.4% of net revenues, in 2003, compared to $6.2 million, or 5.7% of net revenues, in 2002. The increase in absolute dollars in general and administration expenses for 2003 was attributable primarily to increases in professional and legal expenses. For 2004, we expect general and administrative expenses to increase in absolute dollars but depending on the sales levels we are able to achieve given current economic conditions, they may fluctuate as a percentage of our net revenues.

22
Interest and other income, net. Interest and other income, net, was $1.0 million in 2003 and $1.7 million in 2002. Due primarily to lower interest rates in 2003, our interest income decreased even though our cash equivalents and short-term investments increased in 2003.
Provision for income taxes. Provision for income taxes for 2003 and 2002 represents Federal, state and foreign taxes. The provision for income taxes was $7.0 million for 2003 compared to $4.1 million for 2002. Our estimated effective tax rate used for 2003 was 28% and for 2002 was 30%. The difference between the statutory rate of 35% and our effective tax rate is due primarily to the favorable effects of research and development tax credits, international sales not subject to Federal taxation under the current laws and regulations, and apportionment of state taxes, net of the federal benefit. We expect our effective tax rate to remain at 28% for 2004.
Comparison of Years Ended December 31, 2002 and 2001
Net revenues. Net revenues increased 15.0% to $108.2 million in 2002 compared to $94.1 million in 2001. Net revenues from product sales represented $106.8 million and $92.9 million of net revenues in 2002 and 2001, respectively. The increase in net revenues from product sales was driven primarily by increased sales of our products in the communications and computer end markets. While most of our end markets were weak throughout the year, we were able to gain market share and diversify our customer base, which enabled us to achieve revenue growth. The positive impact of our growth in volume was partially offset by the change in mix of products as customers transitioned to our newer generation products, some of which have lower average sales prices. Our revenue mix for 2002 in the end markets, which we serve was approximately 43% in the communications category, 23% in the consumer category, 21% in the computer category, 6% in the industrial electronics category and 7% in the other category. Sales of our TOPSwitch and TinySwitch products represented 99% and 98% of net revenues from product sales in 2002 and 2001, respectively. Net revenues from royalties were $1.3 million in 2002 compared to $1.2 million in 2001.
International sales were $104.5 million in 2002 compared to $87.9 million in 2001, representing approximately 96% and 93% of net revenues in those respective periods. Although the power supplies using our products are designed and distributed worldwide, most of these power supplies are manufactured in Asia. As a result, sales to this region were 82.8% and 76.6% of our product sales for 2002 and 2001, respectively.
Direct sales for 2002 were divided 53.0% to distributors and 47.0% to OEMs, and merchant power supply manufacturers, compared to 51.0% to distributors and 49.0% to OEMs and merchant power supply manufacturers for 2001. In 2002, two separate customers, both of whom are distributors, accounted for approximately 22% and 15% of net revenues. Also in 2002, one other customer, an OEM accounted for approximately 14% of net revenues. In 2001, the same two distributors as in 2002 accounted for approximately 22% and 13% of net revenues, respectively, and a third customer, a merchant power supply manufacturer, accounted for approximately 11% of net revenues.
Cost of revenues; Gross profit. Gross profit was $47.5 million, or 43.9% of net revenues, in 2002, compared to $42.8 million, or 45.5% of net revenues, in 2001. The decrease in gross profit percentage for 2002 was due primarily to lower manufacturing efficiencies due to new product introductions, and the adverse impact of increased pressure from customers for lower pricing.
Research and development expenses. Research and development expenses were $14.7 million, or 13.6% of net revenues, in 2002, compared to $14.5 million, or 15.4% of net revenues, in 2001. The moderate increase for 2002 was due primarily to increased salaries and other costs related to the hiring of additional engineering personnel.
Sales and marketing expenses. Sales and marketing expenses were $14.5 million, or 13.5% of net revenues, in 2002, compared to $14.5 million, or 15.4% of net revenues, in 2001. Sales and marketing expenses for 2002 remained unchanged from 2001 primarily as a result of our effort to control discretionary spending.
General and administrative expenses. General and administrative expenses were $6.2 million, or 5.7% of net revenues, in 2002, compared to $6.0 million, or 6.4% of net revenues, in 2001. The moderate increase in

23
spending for general and administration expenses for 2002 was attributable primarily to an increase in professional and legal expenses partially offset by other cost reductions.
Interest and other income, net. Interest and other income, net, was $1.7 million in both 2002 and 2001. Due primarily to lower interest rates in 2002, our interest income remained flat even though our cash equivalents and short-term investments increased in 2002.
Provision for income taxes. Provision for income taxes for 2002 and 2001 represents Federal, state and foreign taxes. The provision for income taxes was $4.1 million for 2002 compared to $2.9 million for 2001. The increase in “taxes payable and other accrued liabilities” on our balance was primarily due to the tax provision of $4.1 million for 2002. Our estimated effective tax rate used for both 2002 and 2001 was 30%. The difference between the statutory rate of 35% and our effective tax rate is due primarily to the favorable effects of research and development tax credits, international sales, and apportionment of state taxes, net of the federal benefit.
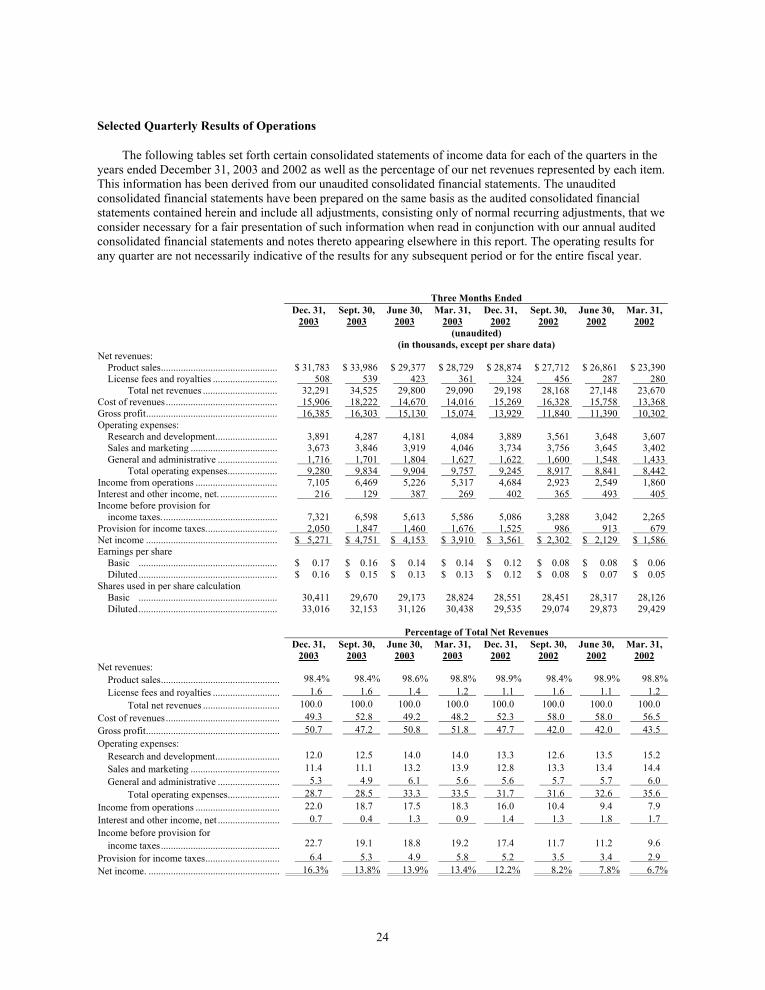
24
Selected Quarterly Results of Operations
The following tables set forth certain consolidated statements of income data for each of the quarters in the years ended December 31, 2003 and 2002 as well as the percentage of our net revenues represented by each item. This information has been derived from our unaudited consolidated financial statements. The unaudited consolidated financial statements have been prepared on the same basis as the audited consolidated financial statements contained herein and include all adjustments, consisting only of normal recurring adjustments, that we consider necessary for a fair presentation of such information when read in conjunction with our annual audited consolidated financial statements and notes thereto appearing elsewhere in this report. The operating results for any quarter are not necessarily indicative of the results for any subsequent period or for the entire fiscal year.
Three Months Ended Dec. 31,
2003 Sept. 30,
2003 June 30,
2003 Mar. 31,
2003 Dec. 31,
2002 Sept. 30,
2002 June 30,
2002 Mar. 31,
2002 (unaudited) (in thousands, except per share data)
Net revenues: Product sales............................................... $ 31,783 $ 33,986 $ 29,377 $ 28,729 $ 28,874 $ 27,712 $ 26,861 $ 23,390 License fees and royalties .......................... 508 539 423 361 324 456 287 280 Total net revenues .............................. 32,291 34,525 29,800 29,090 29,198 28,168 27,148 23,670 Cost of revenues............................................. 15,906 18,222 14,670 14,016 15,269 16,328 15,758 13,368 Gross profit..................................................... 16,385 16,303 15,130 15,074 13,929 11,840 11,390 10,302 Operating expenses: Research and development......................... 3,891 4,287 4,181 4,084 3,889 3,561 3,648 3,607 Sales and marketing ................................... 3,673 3,846 3,919 4,046 3,734 3,756 3,645 3,402 General and administrative ........................ 1,716 1,701 1,804 1,627 1,622 1,600 1,548 1,433 Total operating expenses.................... 9,280 9,834 9,904 9,757 9,245 8,917 8,841 8,442 Income from operations ................................. 7,105 6,469 5,226 5,317 4,684 2,923 2,549 1,860 Interest and other income, net. ....................... 216 129 387 269 402 365 493 405 Income before provision for income taxes............................................... 7,321 6,598 5,613 5,586 5,086 3,288 3,042 2,265 Provision for income taxes............................. 2,050 1,847 1,460 1,676 1,525 986 913 679 Net income ..................................................... $ 5,271 $ 4,751 $ 4,153 $ 3,910 $ 3,561 $ 2,302 $ 2,129 $ 1,586 Earnings per share Basic ........................................................ $ 0.17 $ 0.16 $ 0.14 $ 0.14 $ 0.12 $ 0.08 $ 0.08 $ 0.06 Diluted........................................................ $ 0.16 $ 0.15 $ 0.13 $ 0.13 $ 0.12 $ 0.08 $ 0.07 $ 0.05 Shares used in per share calculation Basic ........................................................ 30,411 29,670 29,173 28,824 28,551 28,451 28,317 28,126 Diluted........................................................ 33,016 32,153 31,126 30,438 29,535 29,074 29,873 29,429
Percentage of Total Net Revenues Dec. 31,
2003 Sept. 30,
2003 June 30,
2003 Mar. 31,
2003 Dec. 31,
2002 Sept. 30,
2002 June 30,
2002 Mar. 31,
2002 Net revenues: Product sales................................................ 98.4% 98.4% 98.6% 98.8% 98.9% 98.4% 98.9% 98.8% License fees and royalties ........................... 1.6 1.6 1.4 1.2 1.1 1.6 1.1 1.2 Total net revenues ............................... 100.0 100.0 100.0 100.0 100.0 100.0 100.0 100.0 Cost of revenues.............................................. 49.3 52.8 49.2 48.2 52.3 58.0 58.0 56.5 Gross profit...................................................... 50.7 47.2 50.8 51.8 47.7 42.0 42.0 43.5 Operating expenses: Research and development.......................... 12.0 12.5 14.0 14.0 13.3 12.6 13.5 15.2 Sales and marketing .................................... 11.4 11.1 13.2 13.9 12.8 13.3 13.4 14.4 General and administrative ......................... 5.3 4.9 6.1 5.6 5.6 5.7 5.7 6.0 Total operating expenses..................... 28.7 28.5 33.3 33.5 31.7 31.6 32.6 35.6 Income from operations .................................. 22.0 18.7 17.5 18.3 16.0 10.4 9.4 7.9 Interest and other income, net ......................... 0.7 0.4 1.3 0.9 1.4 1.3 1.8 1.7 Income before provision for income taxes................................................ 22.7 19.1 18.8 19.2 17.4 11.7 11.2 9.6 Provision for income taxes.............................. 6.4 5.3 4.9 5.8 5.2 3.5 3.4 2.9 Net income. ..................................................... 16.3% 13.8% 13.9% 13.4% 12.2% 8.2% 7.8% 6.7%
25
Net revenues generally increased sequentially over the seven quarters beginning in the first quarter of 2002 and then decreased in the quarter ended December 31, 2003, primarily due to decreases in demand for our products, primarily in the communications end market. The increases in net revenues during the prior seven quarters resulted primarily from our success in gaining market share and diversifying our customer base in end markets that have been relatively flat over the last two years.
Our gross profit, as a percentage of net revenues, was relatively flat in the first three quarters of 2002, improved in the fourth quarter of 2002 and the first quarter of 2003, and fluctuated during the last three quarters of 2003. These fluctuations were due primarily to the benefit from our continued focus on manufacturing costs reductions, but also adversely impacted from increased pressure from customers for lower pricing and proactive pricing adjustments that we made at key customers to increase sales. The fourth quarter of 2003 cost of revenues also received a one-time benefit in the amount of approximately $360,000 resulting from the reversal of deferred rent due to the purchase of our San Jose facilities.
Research and development expenses generally increased in absolute dollars during the eight quarters presented. The decrease in the fourth quarter of 2003 was primarily from a one-time benefit in the amount of approximately $235,000 from the reversal of deferred rent due to the purchase of our San Jose facilities.
Sales and marketing expenses remained essentially stable in absolute dollars during the eight quarters presented as we focused on controlling discretionary spending. Sales and marketing expenses also received a one-time benefit in the amount of approximately $146,000 in the fourth quarter of 2003 from the reversal of deferred rent due to the purchase of our San Jose facilities.
General and administrative expenses generally increased over the eight quarters due primarily to increased use of outside professional services.
Interest and other income, net, generally trended down over the eight quarters presented, primarily from declining interest rates over the periods.
Liquidity and Capital Resources
Since our initial public offering of common stock in December 1997, our principal source of funding has been cash from our operations with some funding from capital equipment lease lines.
As of December 31, 2003, we had approximately $115.3 million in cash, cash equivalents and short-term investments. In addition, under a revolving line of credit agreement with Union Bank of California, we can borrow up to $10.0 million. A portion of the credit line is used to cover advances for commercial letters of credit and standby letters of credit, which we provide to Matsushita and OKI prior to the shipment of wafers by those foundries to us. As of December 31, 2003, there were outstanding letters of credit totaling approximately $5.1 million. The balance of this credit line is unused and available. The line of credit agreement contains financial covenants with which we have remained in compliance, and requires that we maintain profitability on a quarterly basis and not pay or declare dividends without the bank’s prior consent. In previous years, we have financed a significant portion of our machinery and equipment through capital equipment leases. We did not obtain any additional financing through capital equipment leases in the years ended December 31, 2003 and 2002. However, we may obtain additional financing for equipment purchases in future quarters. As of December 31, 2003, we owed approximately $41,000 on our various capital equipment leases.
As of December 31, 2003, we had working capital, defined as current assets less current liabilities, of approximately $135.7 million, which was an increase of approximately $17.0 million over December 31, 2002. Our operating activities generated cash of $20.4 million and $31.5 million in the years ended December 31, 2003 and 2002, respectively. Cash generated in the year ended December 31, 2003 was principally the result of net income in the amount of $18.1 million, depreciation and amortization and tax benefits associated with employee stock option exercises, partially offset by an increase in inventories, accounts receivables and prepaid expenses. Cash generated in the year ended December 31, 2002 was principally the result of net income in the amount of $9.6 million, depreciation and amortization, a decrease in inventory, and increases in accounts payable and other accrued liabilities, partially offset by an increase in accounts receivable.
26
Our investing activities were a net transfer from cash and cash equivalents to short-term investments of $26.8 million for the year ended December 31, 2003, and a net transfer from short-term investments to cash and cash equivalents of $17.2 million for the year ended December 31, 2002. We also purchased capital assets in the amount of $37.8 million and $4.5 million for the years ended December 31, 2003 and 2002, respectively. Capital asset purchases in 2003 included the purchase of our San Jose headquarters facilities in the amount of approximately $30 million.
As of December 31, 2003, we have commitments through September 2008 for our operating and capital leases totaling approximately $756,000. See note 4 in the notes to consolidated financial statements.
During 2003, a significant portion of our cash flow was generated by our operations. If our operating results deteriorate in 2004, as a result of decrease in customer demand or severe pricing pressures from our customers or our competitors, our ability to generate positive cash flow from operations may be jeopardized. In that case, we may be forced to use our cash, cash equivalents and short-term investments to fund our operations. We believe that cash generated from operations, together with existing sources of liquidity, will satisfy our projected working capital and other cash requirements for at least the next 12 months.
Contractual Obligations
As of December 31, 2003, the Company had the following contractual obligations and commitments: (in thousands)
Payments due by period
Total Less than
1 Year 1-3
Years 3-5
Years Purchase obligations...................................................... $ 4,731 $ 4,731 $ — $ — Operating lease obligations ........................................... 714 320 362 32 Capital lease obligations................................................ 41 41 — — Total ..................................................................... $ 5,486 $ 5,092 $ 362 $ 32
Recently Issued Accounting Pronouncements
In January 2003, the FASB issued FASB Interpretation No. 46 (revised December 2003 by FIN 46R), Consolidation of Variable Interest Entities, which addresses how a business enterprise should evaluate whether it has a controlling financial interest in an entity through means other than voting rights and accordingly should consolidate the entity. FIN 46R replaces FASB Interpretation No. 46, Consolidation of Variable Interest Entities, which was issued in January 2003. We will be required to apply FIN 46R to variable interests in VIEs created after December 31, 2003. For variable interests in VIEs created before January 1, 2004, the Interpretation will be applied beginning on January 1, 2005. For any VIEs that must be consolidated under FIN 46R that were created before January 1, 2004, the assets, liabilities and noncontrolling interests of the VIE initially would be measured at their carrying amounts with any difference between the net amount added to the balance sheet and any previously recognized interest being recognized as the cumulative effect of an accounting change. If determining the carrying amounts is not practicable, fair value at the date FIN 46R first applies may be used to measure the assets, liabilities and noncontrolling interest of the VIE. We believe the adoption of FIN 46R will not have a material impact to our financial position, results of operations or cash flows as we do not have any VIEs.
FASB Statement No. 150, Accounting for Certain Financial Instruments with Characteristics of both Liabilities and Equity, was issued in May 2003. This statement establishes standards for the classification and measurement of certain financial instruments with characteristics of both liabilities and equity. The Statement also includes required disclosures for financial instruments within its scope. For the Company, the Statement was effective for instruments entered into or modified after May 31, 2003 and otherwise will be effective as of January 1, 2004, except for mandatorily redeemable financial instruments. For certain mandatorily redeemable financial instruments, the Statement will be effective for the Company on January 1, 2005. We currently do not have any financial instruments that are within the scope of this Statement.
27
Factors That May Affect Future Results of Operations
In addition to the other information in this Report, the following factors should be considered carefully in evaluating our business before purchasing shares of our stock.
Our quarterly and annual operating results are volatile and difficult to predict. If we fail to meet the expectations of public market analysts or investors, the market price of our common stock may decrease significantly. Our net revenues and operating results have varied significantly in the past, are difficult to forecast, are subject to numerous factors both within and outside of our control, and may fluctuate significantly in the future. As a result, our quarterly and annual operating results may fall below the expectations of public market analysts or investors. If that occurs, the price of our stock may decline.
Some of the factors that could affect our operating results include the following:
• the volume and timing of orders received from customers;
• the volume and timing of orders placed by us with our foundries;
• changes in product mix including the impact of new product introduction on existing products;
• our ability to develop and bring to market new products and technologies on a timely basis;
• the timing of investments in research and development and sales and marketing;
• cyclical semiconductor industry conditions;
• fluctuations in exchange rates, particularly the exchange rates between the U.S. dollar and the Japanese yen; and
• proposed changes to GAAP which may require recording compensation expense for employee stock options.
We do not have long-term contracts with any of our customers and if they fail to place, or if they cancel or reschedule orders for our products, our operating results and business may suffer. Our business is characterized by short-term customer orders and shipment schedules. Our customer base is highly concentrated, and a relatively small number of distributors, OEMs and merchant power supply manufacturers account for a significant portion of our revenues. The ordering patterns of some of our existing large customers have been unpredictable in the past and we expect that customer-ordering patterns will continue to be unpredictable in the future. Not only does the volume of units ordered by particular customers vary substantially from period to period, but also purchase orders received from particular customers often vary substantially from early oral estimates provided by those customers for planning purposes. In addition, customer orders can be canceled or rescheduled without significant penalty to the customer. In the past we have experienced customer cancellations of substantial orders for reasons beyond our control, and significant cancellations could occur again at any time.
Intense competition in the high-voltage power supply industry may lead to a decrease in the average selling price and reduced sales volume of our products, which may harm our business. The high-voltage power supply industry is intensely competitive and characterized by significant price erosion. Our products face competition from alternative technologies, including traditional linear transformers and discrete switcher power supplies. If the price of competing solutions decreases significantly, the cost effectiveness of our products will be adversely affected. If power requirements for applications in which our products are currently utilized go outside the cost effective range of our products, these older alternative technologies can be used more cost effectively. We cannot assure that our products will continue to compete favorably or that we will be successful in the face of increasing competition from new products and enhancements introduced by existing competitors or new companies entering
28
this market. We believe our failure to compete successfully in the high-voltage power supply business, including our ability to introduce new products with higher average selling prices, would materially harm our operating results.
If demand for our products declines in the major end markets that we serve, our net revenues will decrease. Applications of our products in the consumer, communications and computer end markets, such as cellular phone chargers, stand-by power supplies for PCs, power supplies for TV set top boxes and power supplies for home appliances have and will continue to account for a large percentage of our net revenues. We expect that a significant level of our net revenues and operating results will continue to be dependent upon these applications in the near term. The demand for these products has been highly cyclical and has been subject to significant economic downturns at various times. Announcements of economic slowdown by major companies in any of the end markets we serve, could indirectly through our customers, cause a slowdown in demand for some of our ICs. When our customers are not successful in maintaining high levels of demand for their products, their demand for our ICs decreases, which adversely affects our operating results. Any significant downturn in demand in these markets would cause our net revenues to decline and could cause the price of our stock to fall.
Because the sales cycle for our products can be lengthy, we may incur substantial expenses before we generate significant revenues, if any. Our products are generally incorporated into a customer’s products at the design stage. However, customer decisions to use our products, commonly referred to as design wins, which can often require us to expend significant research and development and sales and marketing resources without any assurance of success, often precede volume sales, if any, by a year or more. The value of any design win will largely depend upon the commercial success of the customer’s product. We cannot assure that we will continue to achieve design wins or that any design win will result in future revenues. If a customer decides at the design stage not to incorporate our products into its product, we may not have another opportunity for a design win with respect to that product for many months or years.
Our products must meet exacting specifications, and undetected defects and failures may occur which may cause customers to return or stop buying our products. Our customers generally establish demanding specifications for quality, performance and reliability that our products must meet. ICs as complex as those we sell often encounter development delays and may contain undetected defects or failures when first introduced or after commencement of commercial shipments. We have from time to time in the past experienced product quality, performance or reliability problems. If defects and failures occur in our products, we could experience lost revenue, increased costs, including warranty expense and costs associated with customer support, delays in or cancellations or rescheduling of orders or shipments and product returns or discounts, any of which would harm our operating results.
Our international sales activities account for a substantial portion of our net revenues and subject us to substantial risks. Sales to customers outside of the United States account for a large portion of our net revenues, including approximately 93% and 96% of our net revenues in 2003 and 2002, respectively. If our international sales declined and we were unable to increase domestic sales, our revenues would decline and our operating results would be harmed. International sales involve a number of risks to us, including:
• potential insolvency of international distributors and representatives;
• reduced protection for intellectual property rights in some countries;
• the impact of recessionary environments in economies outside the United States;
• tariffs and other trade barriers and restrictions;
• the burdens of complying with a variety of foreign and applicable U.S. federal and state laws; and
• foreign currency exchange risk.
Our failure to adequately address these risks could reduce our international sales, which would materially adversely affect our operating results. Furthermore, because substantially all of our foreign sales are denominated
29
in U.S. dollars, increases in the value of the dollar increase the price in local currencies of our products in foreign markets and make our products relatively more expensive and less price competitive than competitors’ products that are priced in local currencies.
We depend on third-party suppliers to provide us with wafers for our products and if they fail to provide us sufficient wafers, our business will suffer. We have supply arrangements for the production of wafers with Matsushita, which expires in June 2005, and with OKI, which expires in April 2008. Although certain aspects of our relationships with Matsushita and OKI are contractual, many important aspects of these relationships depend on their continued cooperation. We cannot assure that we will continue to work successfully with Matsushita or OKI in the future, that they will continue to provide us with sufficient capacity at their foundries to meet our needs, or that either of them will not seek an early termination of its wafer supply agreement with us. Any serious disruption in the supply of wafers from either OKI or Matsushita would harm our business. We estimate that it would take 9 to 18 months from the time we identified an alternate manufacturing source before that source could produce wafers with acceptable manufacturing yields in sufficient quantities to meet our needs. In May 2003, we signed a wafer supply agreement with a third foundry, ZMD Analog Mixed Signal Services GmbH & CoKG. ZMD is located in Germany and is expected to be able to produce wafers for us by the end of 2004. Our agreement with ZMD expires on December 31, 2009. Although we provide Matsushita and OKI with rolling forecasts of our production requirements, their ability to provide wafers to us is limited by the available capacity of the foundry in which they manufacture wafers for us. An increased need for capacity to meet internal demands or demands of other customers could cause Matsushita and OKI to reduce capacity available to us. Matsushita and OKI may also require us to pay amounts in excess of contracted or anticipated amounts for wafer deliveries or require us to make other concessions in order to acquire the wafer supply necessary to meet our customers’ requirements. Any of these concessions could harm our business.
If our third-party suppliers and independent subcontractors do not produce our wafers and assemble our finished products at acceptable yields, our net revenues may decline. We depend on Matsushita and OKI to produce wafers, and independent subcontractors to assemble and test finished products, at acceptable yields and to deliver them to us in a timely manner. The failure of Matsushita or OKI to supply us wafers at acceptable yields could prevent us from selling our products to our customers and would likely cause a decline in our net revenues. In addition, our IC assembly process requires our manufacturers to use a high-voltage molding compound available from only one vendor, which is difficult to process. This compound and its required processes, together with the other non-standard materials and processes needed to assemble our products, require a more exacting level of process control than normally required for standard packages. Unavailability of the sole source compound or problems with the assembly process can materially adversely affect yields and cost to manufacture. We cannot assure that acceptable yields will be maintainable in the future.
Matsushita has licenses to our technology, which it may use to our detriment. Our ability to take advantage of the potentially large Japanese market for our products is largely dependent on Matsushita and its ability to promote and deliver our products. Pursuant to our agreement with Matsushita, Matsushita has the right to manufacture and sell products using our technology to Japanese companies worldwide and to subsidiaries of Japanese companies located in Asia. Although we receive royalties on Matsushita’s sales, these royalties are substantially lower than the gross profit we receive on direct sales. We cannot assure that Matsushita will not use the technology rights we have granted it to develop or market competing products following any termination of its relationship with us or after termination of Matsushita’s royalty obligation to us.
If our efforts to enhance existing products and introduce new products are not successful, we may not be able to generate demand for our products. Our success depends in significant part upon our ability to develop new ICs for high-voltage power conversion for existing and new markets, to introduce these products in a timely manner and to have these products selected for design into products of leading manufacturers. New product introduction schedules are subject to the risks and uncertainties that typically accompany development and delivery of complex technologies to the market place, including product development delays and defects. If we fail to develop and sell new products in a timely manner, our net revenues could decline.
We cannot be sure that we will be able to adjust to changing market demands as quickly and cost-effectively as necessary to compete successfully. Furthermore, we cannot assure that we will be able to introduce new products in a timely and cost-effective manner or in sufficient quantities to meet customer demand or that these

30
products will achieve market acceptance. Our failure, or our customers’ failure to develop and introduce new products successfully and in a timely manner would harm our business and may cause the price of our common stock to fall. In addition, customers may defer or return orders for existing products in response to the introduction of new products. Although we maintain reserves for potential customer returns, we cannot assure that these reserves will be adequate.
If our products do not penetrate additional markets, our business will not grow as we expect. We believe that our future success depends in part upon our ability to penetrate additional markets for our products. We cannot assure that we will be able to overcome the marketing or technological challenges necessary to do so. To the extent that a competitor penetrates additional markets before we do, or takes market share from us in our existing markets, our net revenues and financial condition could be materially adversely affected.
In the event of an earthquake, terrorist act or other disaster, our operations may be interrupted and our business would be harmed. Our principal executive offices and operating facilities situated near San Francisco, California, and most of our major suppliers (foundries and assembly houses), are located in areas that have been subject to severe earthquakes. In the event of an earthquake, we and/or most of our major suppliers may be temporarily unable to continue operations and may suffer significant property damage. Any such interruption in our ability or that of our major suppliers to continue operations at our facilities could delay the development and shipment of our products.
Like other U.S. companies, our business and operating results are subject to uncertainties arising out of the recent terrorist attacks on the United States, including the potential worsening or extension of the current global economic slowdown, the economic consequences of current and potential military actions or additional terrorist activities and associated political instability, and the impact of heightened security concerns on domestic and international travel and commerce. Such uncertainties could also lead to delays or cancellations of customer orders, a general decrease in corporate spending or our inability to effectively market and sell our products. Any of these results could substantially harm our business and results of operations, causing a decrease in our revenues.
An outbreak of Severe Acute Respiratory Syndrome (SARS) may adversely impact the operations of our major suppliers and our global operations. If there is an outbreak of Severe Acute Respiratory Syndrome (SARS) that began in China, Hong Kong, Singapore and Vietnam recurs, it could have an adverse impact on our major customers and suppliers located in Asia, resulting in a serious disruption in the supply of wafers and subsequent harm to our business. We estimate that it would take 9 to 18 months from the time we identified an alternate manufacturing source before that source could produce wafers with acceptable manufacturing yields in sufficient quantities to meet our needs. SARs could also have an impact on the end market demand for consumer products that incorporate our chips. If the number of cases rises or spreads to other locations, our global sales and operations could be harmed.
If we are unable to adequately protect or enforce our intellectual property rights, we could lose market share, incur costly litigation expenses or lose valuable assets. Our success depends upon our ability to protect our intellectual property, including patents, trade secrets, and know-how, and to continue our technological innovation. We cannot assure that the steps we have taken to protect our intellectual property will be adequate to prevent misappropriation or that others will not develop competitive technologies or products. From time to time we have received, and we may receive in the future, communications alleging possible infringement of patents or other intellectual property rights of others. Litigation, which could result in substantial cost to us, may be necessary to enforce our patents or other intellectual property rights or to defend us against claimed infringement of the rights of others. The failure to obtain necessary licenses or other rights or litigation arising out of infringement claims could cause us to lose market share and harm our business.
Moreover, the laws of some foreign countries in which our technology is or may in the future be licensed may not protect our intellectual property rights to the same extent as the laws of the United States, thus increasing the possibility of infringement of our intellectual property.
We must attract and retain qualified personnel to be successful and competition for qualified personnel is intense in our market. Our success depends to a significant extent upon the continued service of our executive
31
officers and other key management and technical personnel, and on our ability to continue to attract, retain and motivate qualified personnel, such as experienced analog design engineers and systems applications engineers. The competition for these employees is intense, particularly in Silicon Valley. The loss of the services of one or more of our engineers, executive officers or other key personnel could harm our business. In addition, if one or more of these individuals leaves our employ, and we are unable to quickly and efficiently replace those individuals with qualified personnel who can smoothly transition into their new roles, our business may suffer. We do not have long-term employment contracts with, and we do not have in place key person life insurance policies on, any of our employees.
We have adopted anti-takeover measures, which may make it more difficult for a third party to acquire us. Our board of directors has the authority to issue up to 3,000,000 shares of preferred stock and to determine the price, rights, preferences and privileges of those shares without any further vote or action by the stockholders. The rights of the holders of common stock will be subject to, and may be adversely affected by, the rights of the holders of any preferred stock that may be issued in the future. The issuance of shares of preferred stock, while potentially providing flexibility in connection with possible acquisitions and for other corporate purposes, could have the effect of making it more difficult for a third party to acquire a majority of our outstanding voting stock. We have no present intention to issue shares of preferred stock.
In addition, our board of directors adopted a Preferred Stock Purchase Rights Plan intended to guard against hostile takeover tactics. The existence of this plan could have the effect of making it more difficult for a third party to acquire a majority of our outstanding voting stock.
The future trading price of our common stock could be subject to wide fluctuations in response to a variety of factors. The price of our common stock has been, and is likely to be, volatile. Factors including future announcements concerning us, our customers or our competitors, quarterly variations in operating results, announcements of technological innovations, the introduction of new products or changes in our product pricing policies or those of our competitors, proprietary rights or other litigation, changes in earnings estimates by analysts and other factors could cause the market price of our common stock to fluctuate substantially. In addition, stock prices for many technology companies fluctuate widely for reasons, which may be unrelated to operating results. These fluctuations, as well as general economic, market and political conditions may harm the market price of our common stock.
Recently enacted changes in securities laws and regulations are likely to increase our costs. The Sarbanes-Oxley Act of 2002 that became law in July 2002 requires changes in some of our corporate governance practices. The Act also requires the Securities and Exchange Commission to promulgate new rules on a variety of subjects. In addition to final rules made by the Securities and Exchange Commission, Nasdaq has revised its requirements for companies that are Nasdaq-listed. These new rules and regulations will increase our legal and financial compliance costs, and make some activities more difficult, time consuming and/or costly. These new rules and regulations also make it more expensive for us to obtain director and officer liability insurance, and we may be required to accept reduced coverage or incur substantially higher costs to obtain coverage. These new rules and regulations could also make it more difficult for us to attract and retain qualified members of our board of directors, particularly to serve on our audit committee, and qualified executive officers.
Proposed changes to GAAP that may require recording compensation expense for employee stock options. The FASB and various federal legislative proposals have proposed changes to GAAP that may require us to adopt a different method of determining the compensation expense for our employee stock options. We currently use the intrinsic value method to measure compensation expense for stock-based awards to our employees. Under this standard, we generally do not consider stock option grants issued under our employee stock option plans to be compensation when the exercise price of the stock option is equal to the fair market value on the date of grant. If any change to GAAP is adopted that requires us to adopt a different method of determining the compensation expense for our employee stock options, our reported results of operations may be adversely affected.
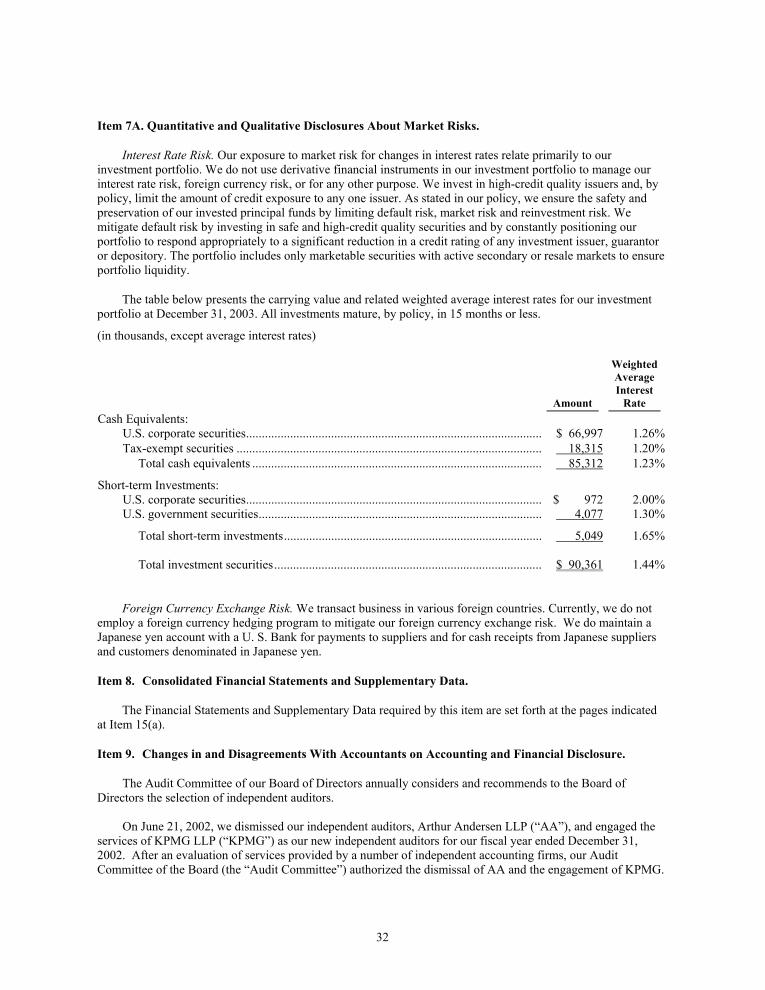
32
Item 7A. Quantitative and Qualitative Disclosures About Market Risks.
Interest Rate Risk. Our exposure to market risk for changes in interest rates relate primarily to our investment portfolio. We do not use derivative financial instruments in our investment portfolio to manage our interest rate risk, foreign currency risk, or for any other purpose. We invest in high-credit quality issuers and, by policy, limit the amount of credit exposure to any one issuer. As stated in our policy, we ensure the safety and preservation of our invested principal funds by limiting default risk, market risk and reinvestment risk. We mitigate default risk by investing in safe and high-credit quality securities and by constantly positioning our portfolio to respond appropriately to a significant reduction in a credit rating of any investment issuer, guarantor or depository. The portfolio includes only marketable securities with active secondary or resale markets to ensure portfolio liquidity.
The table below presents the carrying value and related weighted average interest rates for our investment portfolio at December 31, 2003. All investments mature, by policy, in 15 months or less.
(in thousands, except average interest rates)
Amount
Weighted Average Interest
Rate Cash Equivalents: U.S. corporate securities.............................................................................................. $ 66,997 1.26% Tax-exempt securities ................................................................................................. 18,315 1.20% Total cash equivalents ............................................................................................ 85,312 1.23%
Short-term Investments: U.S. corporate securities.............................................................................................. $ 972 2.00% U.S. government securities.......................................................................................... 4,077 1.30%
Total short-term investments.................................................................................. 5,049 1.65% Total investment securities..................................................................................... $ 90,361 1.44%
Foreign Currency Exchange Risk. We transact business in various foreign countries. Currently, we do not employ a foreign currency hedging program to mitigate our foreign currency exchange risk. We do maintain a Japanese yen account with a U. S. Bank for payments to suppliers and for cash receipts from Japanese suppliers and customers denominated in Japanese yen.
Item 8. Consolidated Financial Statements and Supplementary Data.
The Financial Statements and Supplementary Data required by this item are set forth at the pages indicated at Item 15(a).
Item 9. Changes in and Disagreements With Accountants on Accounting and Financial Disclosure.
The Audit Committee of our Board of Directors annually considers and recommends to the Board of Directors the selection of independent auditors. On June 21, 2002, we dismissed our independent auditors, Arthur Andersen LLP (“AA”), and engaged the services of KPMG LLP (“KPMG”) as our new independent auditors for our fiscal year ended December 31, 2002. After an evaluation of services provided by a number of independent accounting firms, our Audit Committee of the Board (the “Audit Committee”) authorized the dismissal of AA and the engagement of KPMG.

33
During the two most recent fiscal years prior to the dismissal of AA, and the subsequent interim period through June 21, 2002, we had no disagreements with AA on any matter of accounting principles or practices, financial statement disclosure, or auditing scope or procedure, which disagreements, if not resolved to AA’s satisfaction, would have caused AA to make reference to the subject matter of the disagreement in connection with its reports; and there were no reportable events described under Item 304(a)(1)(v) of Regulation S-K. The audit reports of AA on our consolidated financial statements as of and for the fiscal years ended December 31, 2000 and 2001 did not contain any adverse opinion or disclaimer of opinion, nor were they qualified or modified as to uncertainty, audit scope or accounting principles. We requested to receive a letter from AA indicating its concurrence with the disclosures in this and the preceding paragraph. We used reasonable efforts to obtain the required letter from AA but were unable to obtain such letter. During our fiscal years ended December 31, 2000 and 2001, and the subsequent interim period through June 21, 2002, we did not consult with KPMG regarding any of the matters or events set forth in Item 304(a)(2)(i) and (ii) of Regulation S-K.
Item 9a. Controls and Procedures.
(a) Under the supervision and with the participation of our management, including our chief executive officer and chief financial officer, we evaluated the effectiveness of the design and operation of our disclosure controls and procedures, as such term is defined under Rule 13a-14(c) promulgated under the Securities Exchange Act of 1934, as amended, as of the end of the period covered by this report. Based on this evaluation, our chief executive officer and chief financial officer concluded that our disclosure controls and procedures were effective as of that date.
(b) There have been no significant changes (including corrective actions with regard to significant deficiencies or material weaknesses) in our internal controls or in other factors that could significantly affect these controls subsequent to the date of the evaluation referenced in paragraph (a) above.

34
PART III The SEC allows us to include information required in this report by referring to other documents or reports we have already or will soon be filing. This is called “Incorporation by Reference.” We intend to file our definitive proxy statement pursuant to Regulation 14A not later than 120 days after the end of the fiscal year covered by this report, and certain information therein is incorporated in this report by reference.
Item 10. Directors and Executive Officers of the Registrant.
The information required by this Item is incorporated by reference to information set forth in our definitive proxy statement under the heading “Proposal No. 1—Election of Directors” and in Part I of this report under the heading “Executive Officers of the Registrant.”
The information required by this Item with respect to compliance with Section 16(a) of the Securities Exchange Act of 1934 is incorporated by reference to information set forth in the definitive Proxy Statement under the heading “Executive Compensation and Other Matters.”
The Company has adopted a Code of Business Conduct and Ethics, that applies to all of our directors and employees, including our principal executive officer, principal financial and accounting officer and controller. A copy of the Code of Business Conduct and Ethics is available on request. Requests should be directed in writing to Power Integrations, Inc., 5245 Hellyer Avenue, San Jose, California 95138-1002; Attention: Investor Relations.
Item 11. Executive Compensation.
The information required by this Item is incorporated by reference to information set forth in our definitive proxy statement under the heading “Executive Compensation and Other Matters.”
Item 12. Security Ownership of Certain Beneficial Owners and Management.
The information required by this Item is incorporated by reference to information set forth in our definitive proxy statement under the heading “Security Ownership of Certain Beneficial Owners and Management.”
The information required under this Item regarding securities authorized for issuance under equity compensation plans is incorporated by reference to information set forth in our definitive proxy statement under the heading “Equity Compensation Plan Information.”
Item 13. Certain Relationships and Related Transactions.
The information required by this Item is incorporated by reference to information set forth in our definitive proxy statement under the heading “Certain Relationships and Related Transactions.”
Item 14. Principal Accountant Fees and Services.
The information required by this Item is incorporated by reference to information set forth in our definitive proxy statement under the heading “Principal Accountant Firm Fees.”

35
PART IV Item 15. Exhibits, Financial Statement Schedules and Reports on Form 8-K. (a) The following documents are filed as part of this Form:
1. Financial Statements
Page Independent Auditor’s Report .................................................................................................... 36 Consolidated Balance Sheets...................................................................................................... 38 Consolidated Statements of Income .......................................................................................... 39 Consolidated Statements of Stockholders' Equity ...................................................................... 40 Consolidated Statements of Cash Flows..................................................................................... 41 Notes to Consolidated Financial Statements .............................................................................. 42
2. Financial Statement Schedules
All other schedules, except Schedule II, Valuation and Qualifying Accounts, are omitted because they are not applicable or the required information is shown in the Consolidated Financial Statements or Notes thereto.
3. Exhibits
See Index to Exhibits. The Exhibits listed in the accompanying Index to Exhibits are filed as part of this report.
(b) Reports on Form 8-K
The Company filed a report on Form 8-K with the Securities and Exchange Commission on October 27, 2003, pursuant to Item 12 (“Results of Operations and Financial Condition”). The Form 8-K included a press release announcing the Company’s financial results for the quarter ended September 30, 2003 and forward-looking statements relating to fiscal 2003.
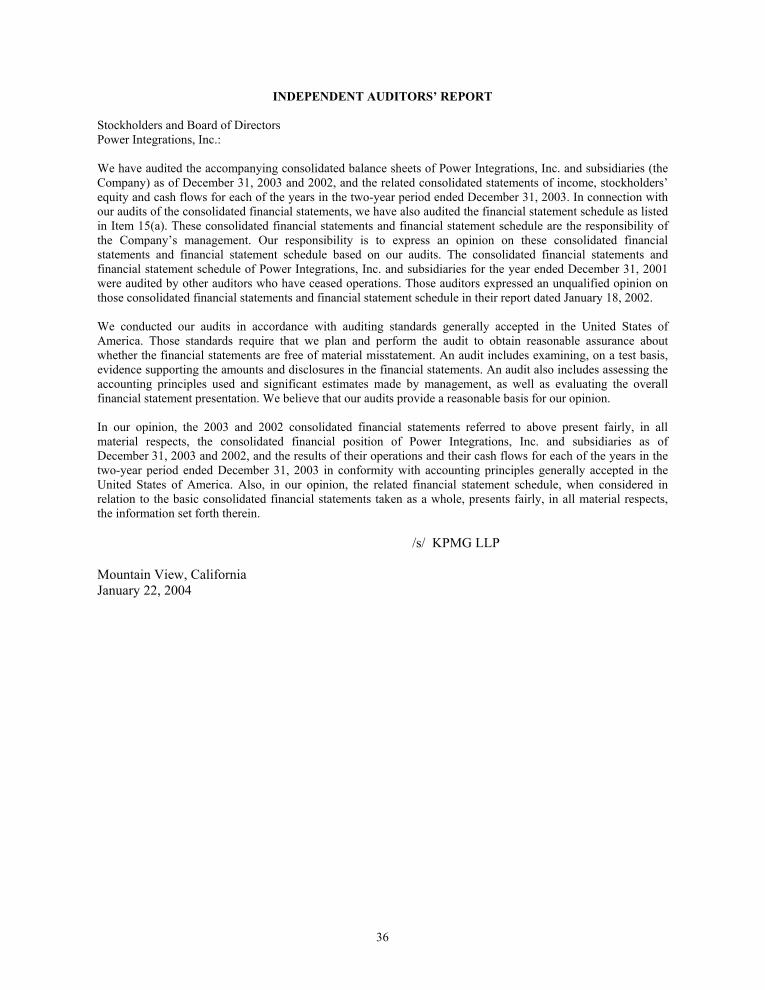
36
INDEPENDENT AUDITORS’ REPORT
Stockholders and Board of Directors Power Integrations, Inc.: We have audited the accompanying consolidated balance sheets of Power Integrations, Inc. and subsidiaries (the Company) as of December 31, 2003 and 2002, and the related consolidated statements of income, stockholders’ equity and cash flows for each of the years in the two-year period ended December 31, 2003. In connection with our audits of the consolidated financial statements, we have also audited the financial statement schedule as listed in Item 15(a). These consolidated financial statements and financial statement schedule are the responsibility of the Company’s management. Our responsibility is to express an opinion on these consolidated financial statements and financial statement schedule based on our audits. The consolidated financial statements and financial statement schedule of Power Integrations, Inc. and subsidiaries for the year ended December 31, 2001 were audited by other auditors who have ceased operations. Those auditors expressed an unqualified opinion on those consolidated financial statements and financial statement schedule in their report dated January 18, 2002. We conducted our audits in accordance with auditing standards generally accepted in the United States of America. Those standards require that we plan and perform the audit to obtain reasonable assurance about whether the financial statements are free of material misstatement. An audit includes examining, on a test basis, evidence supporting the amounts and disclosures in the financial statements. An audit also includes assessing the accounting principles used and significant estimates made by management, as well as evaluating the overall financial statement presentation. We believe that our audits provide a reasonable basis for our opinion. In our opinion, the 2003 and 2002 consolidated financial statements referred to above present fairly, in all material respects, the consolidated financial position of Power Integrations, Inc. and subsidiaries as of December 31, 2003 and 2002, and the results of their operations and their cash flows for each of the years in the two-year period ended December 31, 2003 in conformity with accounting principles generally accepted in the United States of America. Also, in our opinion, the related financial statement schedule, when considered in relation to the basic consolidated financial statements taken as a whole, presents fairly, in all material respects, the information set forth therein.
/s/ KPMG LLP Mountain View, California January 22, 2004

37
REPORT OF INDEPENDENT PUBLIC ACCOUNTANTS
To Power Integrations, Inc.: We have audited the accompanying consolidated balance sheets of Power Integrations, Inc. (a Delaware corporation) and subsidiaries as of December 31, 2001 and 2000, and the related consolidated statements of operations, stockholders' equity and cash flows for each of the three years in the period ended December 31, 2001. These financial statements and the schedule referred to below are the responsibility of the Company's management. Our responsibility is to express an opinion on these financial statements and schedule based on our audits. We conducted our audits in accordance with auditing standards generally accepted in the United States of America. Those standards require that we plan and perform the audit to obtain reasonable assurance about whether the financial statements are free of material misstatement. An audit includes examining, on a test basis, evidence supporting the amounts and disclosures in the financial statements. An audit also includes assessing the accounting principles used and significant estimates made by management, as well as evaluating the overall financial statement presentation. We believe that our audits provide a reasonable basis for our opinion. In our opinion, the financial statements referred to above present fairly, in all material respects, the financial position of Power Integrations, Inc. and subsidiaries as of December 31, 2001 and 2000, and the results of their operations and their cash flows for each of the three years in the period ended December 31, 2001, in conformity with accounting principles generally accepted in the United States of America. Our audits were made for the purpose of forming an opinion on the basic financial statements taken as a whole. The schedule listed under Item 14 (a) is presented for purposes of complying with the Securities and Exchange Commission’s rules and is not a part of the basic financial statements. This schedule has been subjected to the auditing procedures applied in our audits of the basic financial statements and, in our opinion, fairly states in all material respects the financial data required to be set forth therein in relation to the basic financial statements taken as a whole.
ARTHUR ANDERSEN LLP
San Jose, California January 18, 2002
The above report of Arthur Andersen LLP (“Andersen”) is a copy of the report previously issued by Andersen on January 18, 2002. The report of Andersen is included in this annual report on Form 10-K pursuant to rule 2-02(E) of Regulation S-X. After reasonable efforts the company has not been able to obtain a reissued report from Andersen. Andersen has not consented to the inclusion of its report in this annual report on Form 10-K. Because Andersen has not consented to the inclusion of its report in this annual report, it may be difficult to seek remedies against Andersen and the ability to seek relief against Andersen may be impaired.
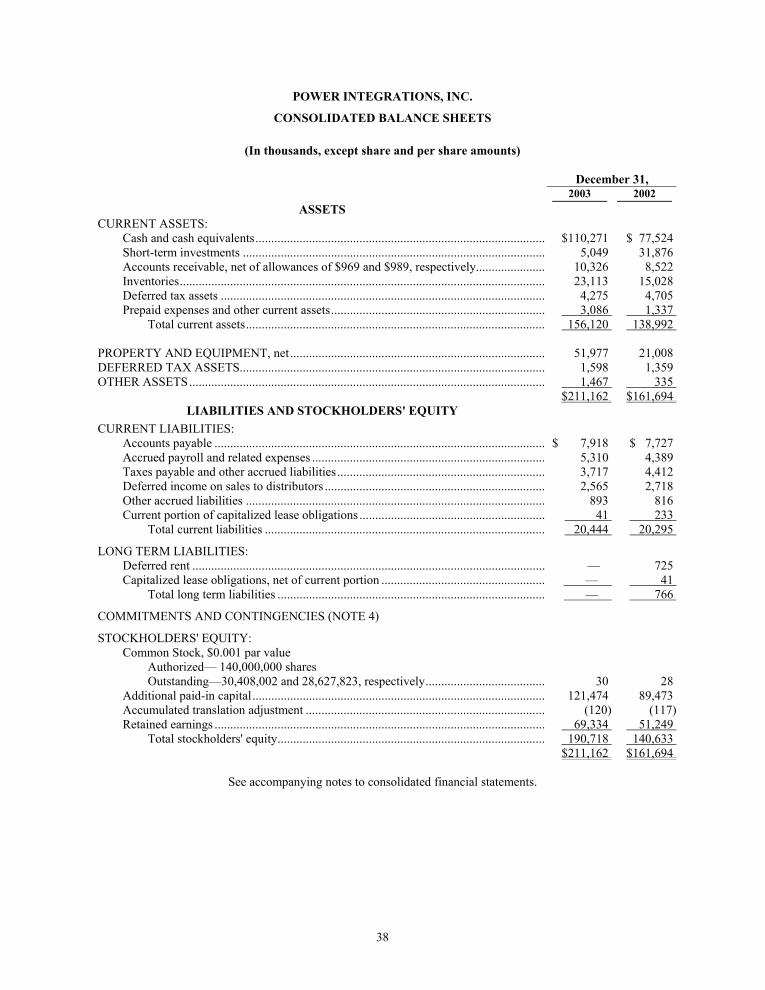
38
POWER INTEGRATIONS, INC.
CONSOLIDATED BALANCE SHEETS
(In thousands, except share and per share amounts)
December 31, 2003 2002
ASSETS CURRENT ASSETS: Cash and cash equivalents............................................................................................ $110,271 $ 77,524 Short-term investments ................................................................................................ 5,049 31,876 Accounts receivable, net of allowances of $969 and $989, respectively...................... 10,326 8,522 Inventories.................................................................................................................... 23,113 15,028 Deferred tax assets ....................................................................................................... 4,275 4,705 Prepaid expenses and other current assets.................................................................... 3,086 1,337 Total current assets............................................................................................... 156,120 138,992 PROPERTY AND EQUIPMENT, net................................................................................. 51,977 21,008 DEFERRED TAX ASSETS................................................................................................. 1,598 1,359 OTHER ASSETS................................................................................................................. 1,467 335 $211,162 $161,694
LIABILITIES AND STOCKHOLDERS' EQUITY CURRENT LIABILITIES: Accounts payable ......................................................................................................... $ 7,918 $ 7,727 Accrued payroll and related expenses .......................................................................... 5,310 4,389 Taxes payable and other accrued liabilities.................................................................. 3,717 4,412 Deferred income on sales to distributors ...................................................................... 2,565 2,718 Other accrued liabilities ............................................................................................... 893 816 Current portion of capitalized lease obligations ........................................................... 41 233 Total current liabilities ......................................................................................... 20,444 20,295
LONG TERM LIABILITIES: Deferred rent ................................................................................................................ — 725 Capitalized lease obligations, net of current portion .................................................... — 41 Total long term liabilities ..................................................................................... — 766
COMMITMENTS AND CONTINGENCIES (NOTE 4)
STOCKHOLDERS' EQUITY: Common Stock, $0.001 par value Authorized— 140,000,000 shares Outstanding—30,408,002 and 28,627,823, respectively...................................... 30 28 Additional paid-in capital............................................................................................. 121,474 89,473 Accumulated translation adjustment ............................................................................ (120) (117) Retained earnings ......................................................................................................... 69,334 51,249 Total stockholders' equity..................................................................................... 190,718 140,633 $211,162 $161,694
See accompanying notes to consolidated financial statements.

39
POWER INTEGRATIONS, INC.
CONSOLIDATED STATEMENTS OF INCOME (In thousands, except per share amounts)
Years Ended December 31, 2003 2002 2001
NET REVENUES: Product sales ............................................................................................
......................................................................................................................... $123,875 $106,837 $ 92,919
License fees and royalties ........................................................................ 1,831 1,347 1,176
Total net revenues ......................................................................................................................................................................................................
125,706 108,184 94,095
COST OF REVENUES................................................................................... 62,814 60,723 51,252
GROSS PROFIT ............................................................................................. 62,892 47,461 42,843
OPERATING EXPENSES: Research and development....................................................................... 16,443 14,705 14,471 Sales and marketing ................................................................................. 15,484 14,537 14,485 General and administrative....................................................................... 6,848 6,203 5,980
Total operating expenses................................................................... 38,775 35,445 34,936
INCOME FROM OPERATIONS ................................................................... 24,117 12,016 7,907
OTHER INCOME (EXPENSE): Interest income......................................................................................... 1,519 2,090 2,103 Interest expense........................................................................................ (7) (23) (104) Other, net.................................................................................................. (511) (401) (250)
Total other income ............................................................................ 1,001 1,666 1,749
INCOME BEFORE PROVISION FOR INCOME TAXES .......................................................................................
25,118
13,682
9,656
PROVISION FOR INCOME TAXES ............................................................ 7,033 4,104 2,930
NET INCOME ................................................................................................ $18,085 $ 9,578 $ 6,726
EARNINGS PER SHARE: Basic......................................................................................................... $ 0.61 $ 0.34 $ 0.24 Diluted...................................................................................................... $ 0.57 $ 0.32 $ 0.23
SHARES USED IN PER SHARE CALCULATION: Basic......................................................................................................... 29,473 28,362 27,714 Diluted...................................................................................................... 31,812 29,503 28,991
See accompanying notes to consolidated financial statements.
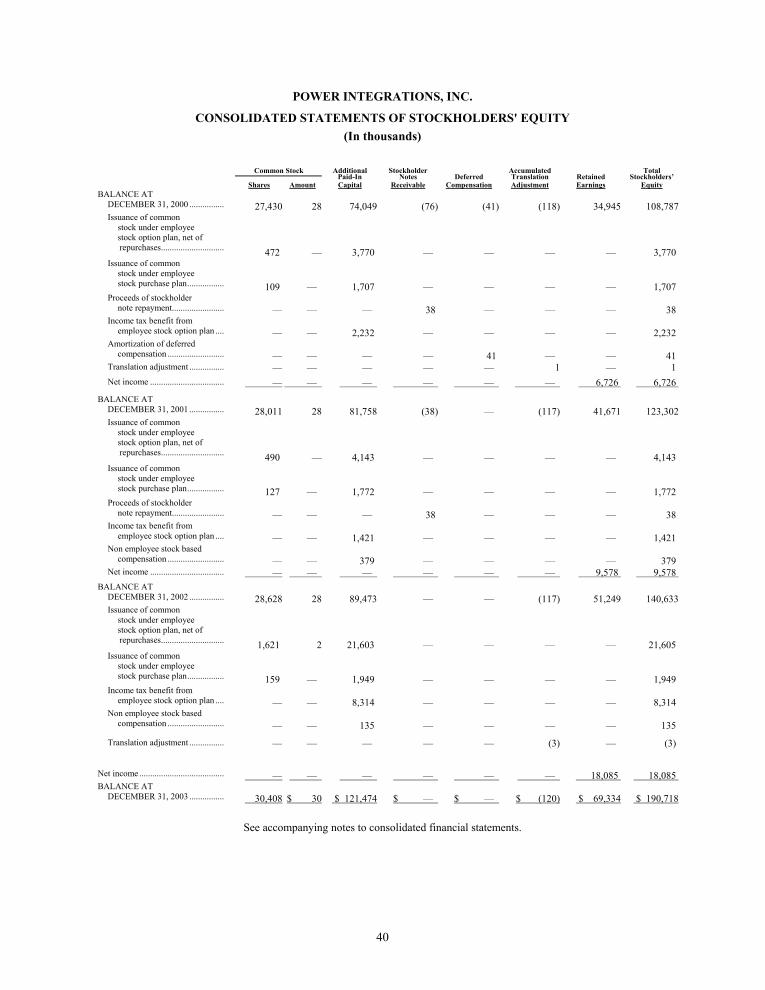
40
POWER INTEGRATIONS, INC.
CONSOLIDATED STATEMENTS OF STOCKHOLDERS' EQUITY (In thousands)
Common Stock
Additional Paid-In
Stockholder Notes
Deferred
Accumulated Translation
Retained
Total Stockholders’
Shares Amount Capital Receivable Compensation Adjustment Earnings Equity BALANCE AT DECEMBER 31, 2000 ................
27,430 28 74,049 (76) (41) (118) 34,945 108,787
Issuance of common stock under employee stock option plan, net of repurchases.............................
472 — 3,770 — — — — 3,770 Issuance of common stock under employee stock purchase plan.................
109 — 1,707 — — — — 1,707 Proceeds of stockholder note repayment........................
— — — 38 — — — 38
Income tax benefit from employee stock option plan ....
— — 2,232 — — — — 2,232
Amortization of deferred compensation ..........................
— — — — 41 — — 41
Translation adjustment ................ — — — — — 1 — 1 Net income .................................. — — — — — — 6,726 6,726 BALANCE AT DECEMBER 31, 2001 ................
28,011 28 81,758 (38) — (117) 41,671 123,302
Issuance of common stock under employee stock option plan, net of repurchases.............................
490 — 4,143 — — — — 4,143 Issuance of common stock under employee stock purchase plan.................
127 — 1,772 — — — — 1,772 Proceeds of stockholder note repayment........................
— — — 38 — — — 38
Income tax benefit from employee stock option plan ....
— — 1,421 — — — — 1,421
Non employee stock based compensation ..........................
— — 379 — — — — 379
Net income .................................. — — — — — — 9,578 9,578 BALANCE AT DECEMBER 31, 2002 ................
28,628 28 89,473 — — (117) 51,249 140,633
Issuance of common stock under employee stock option plan, net of repurchases.............................
1,621 2 21,603 — — — — 21,605 Issuance of common stock under employee stock purchase plan.................
159 — 1,949 — — — — 1,949 Income tax benefit from employee stock option plan ....
— — 8,314 — — — — 8,314
Non employee stock based compensation ..........................
— — 135 — — — — 135
Translation adjustment ................ — — — — — (3) — (3)
Net income .......................................
— — — — — — 18,085 18,085
BALANCE AT DECEMBER 31, 2003 ................
30,408 $ 30 $ 121,474 $ — $ — $ (120) $ 69,334 $ 190,718
See accompanying notes to consolidated financial statements.
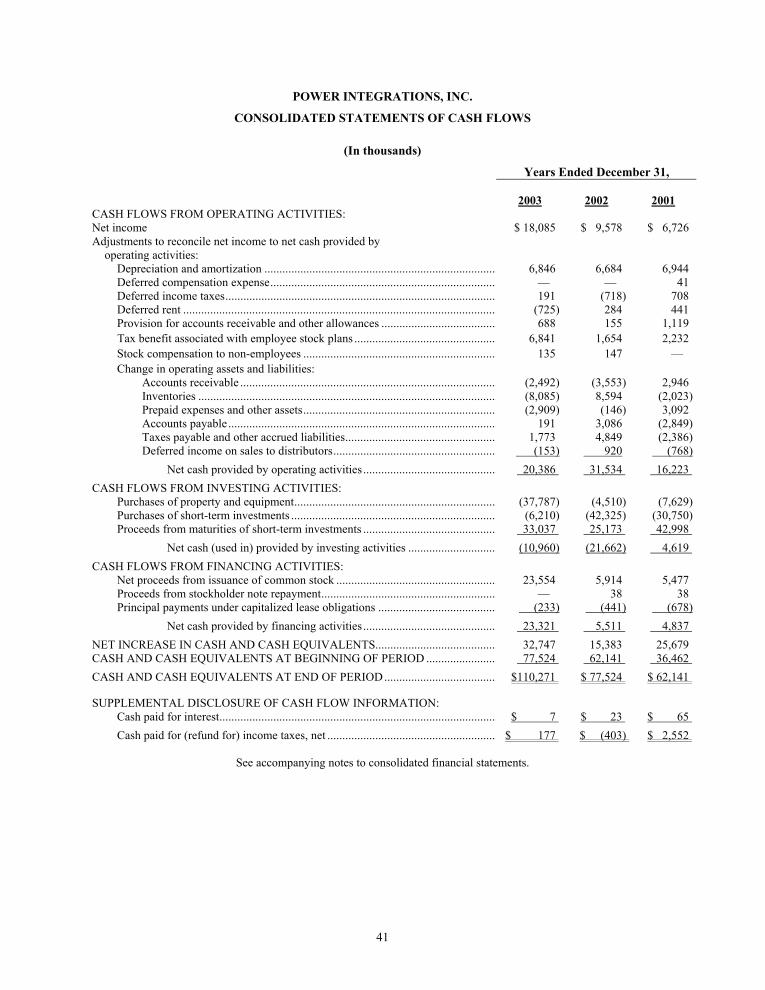
41
POWER INTEGRATIONS, INC.
CONSOLIDATED STATEMENTS OF CASH FLOWS
(In thousands)
Years Ended December 31, 2003 2002 2001
CASH FLOWS FROM OPERATING ACTIVITIES: Net income $ 18,085 $ 9,578 $ 6,726 Adjustments to reconcile net income to net cash provided by operating activities:
Depreciation and amortization .............................................................................. 6,846 6,684 6,944 Deferred compensation expense............................................................................ — — 41 Deferred income taxes........................................................................................... 191 (718) 708 Deferred rent ......................................................................................................... (725) 284 441 Provision for accounts receivable and other allowances ....................................... 688 155 1,119 Tax benefit associated with employee stock plans ................................................ 6,841 1,654 2,232 Stock compensation to non-employees ................................................................. 135 147 — Change in operating assets and liabilities: Accounts receivable ...................................................................................... (2,492) (3,553) 2,946 Inventories .................................................................................................... (8,085) 8,594 (2,023) Prepaid expenses and other assets................................................................. (2,909) (146) 3,092 Accounts payable .......................................................................................... 191 3,086 (2,849) Taxes payable and other accrued liabilities................................................... 1,773 4,849 (2,386) Deferred income on sales to distributors....................................................... (153) 920 (768) Net cash provided by operating activities ............................................. 20,386 31,534 16,223 CASH FLOWS FROM INVESTING ACTIVITIES: Purchases of property and equipment.................................................................... (37,787) (4,510) (7,629) Purchases of short-term investments ..................................................................... (6,210) (42,325) (30,750) Proceeds from maturities of short-term investments ............................................. 33,037 25,173 42,998 Net cash (used in) provided by investing activities .............................. (10,960) (21,662) 4,619 CASH FLOWS FROM FINANCING ACTIVITIES: Net proceeds from issuance of common stock ...................................................... 23,554 5,914 5,477 Proceeds from stockholder note repayment........................................................... — 38 38 Principal payments under capitalized lease obligations ........................................ (233) (441) (678) Net cash provided by financing activities ............................................. 23,321 5,511 4,837 NET INCREASE IN CASH AND CASH EQUIVALENTS......................................... 32,747 15,383 25,679 CASH AND CASH EQUIVALENTS AT BEGINNING OF PERIOD ........................ 77,524 62,141 36,462 CASH AND CASH EQUIVALENTS AT END OF PERIOD...................................... $110,271 $ 77,524 $ 62,141 SUPPLEMENTAL DISCLOSURE OF CASH FLOW INFORMATION: Cash paid for interest............................................................................................. $ 7 $ 23 $ 65 Cash paid for (refund for) income taxes, net ......................................................... $ 177 $ (403) $ 2,552
See accompanying notes to consolidated financial statements.
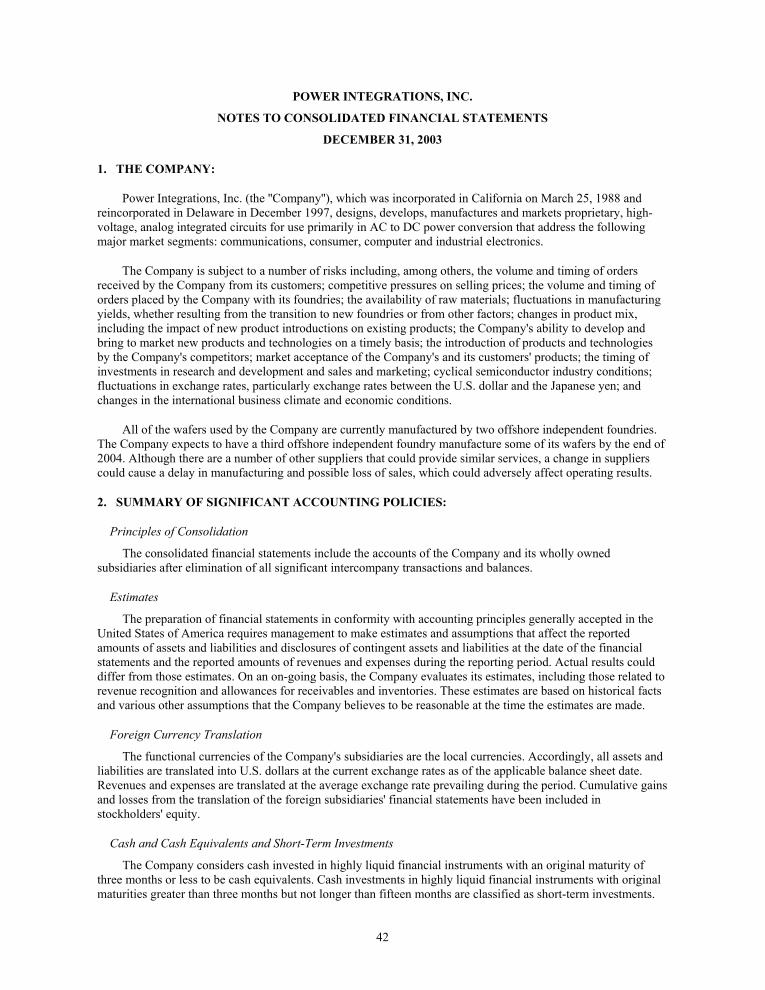
42
POWER INTEGRATIONS, INC.
NOTES TO CONSOLIDATED FINANCIAL STATEMENTS
DECEMBER 31, 2003
1. THE COMPANY:
Power Integrations, Inc. (the ''Company''), which was incorporated in California on March 25, 1988 and reincorporated in Delaware in December 1997, designs, develops, manufactures and markets proprietary, high-voltage, analog integrated circuits for use primarily in AC to DC power conversion that address the following major market segments: communications, consumer, computer and industrial electronics.
The Company is subject to a number of risks including, among others, the volume and timing of orders received by the Company from its customers; competitive pressures on selling prices; the volume and timing of orders placed by the Company with its foundries; the availability of raw materials; fluctuations in manufacturing yields, whether resulting from the transition to new foundries or from other factors; changes in product mix, including the impact of new product introductions on existing products; the Company's ability to develop and bring to market new products and technologies on a timely basis; the introduction of products and technologies by the Company's competitors; market acceptance of the Company's and its customers' products; the timing of investments in research and development and sales and marketing; cyclical semiconductor industry conditions; fluctuations in exchange rates, particularly exchange rates between the U.S. dollar and the Japanese yen; and changes in the international business climate and economic conditions.
All of the wafers used by the Company are currently manufactured by two offshore independent foundries. The Company expects to have a third offshore independent foundry manufacture some of its wafers by the end of 2004. Although there are a number of other suppliers that could provide similar services, a change in suppliers could cause a delay in manufacturing and possible loss of sales, which could adversely affect operating results.
2. SUMMARY OF SIGNIFICANT ACCOUNTING POLICIES:
Principles of Consolidation
The consolidated financial statements include the accounts of the Company and its wholly owned subsidiaries after elimination of all significant intercompany transactions and balances.
Estimates
The preparation of financial statements in conformity with accounting principles generally accepted in the United States of America requires management to make estimates and assumptions that affect the reported amounts of assets and liabilities and disclosures of contingent assets and liabilities at the date of the financial statements and the reported amounts of revenues and expenses during the reporting period. Actual results could differ from those estimates. On an on-going basis, the Company evaluates its estimates, including those related to revenue recognition and allowances for receivables and inventories. These estimates are based on historical facts and various other assumptions that the Company believes to be reasonable at the time the estimates are made.
Foreign Currency Translation
The functional currencies of the Company's subsidiaries are the local currencies. Accordingly, all assets and liabilities are translated into U.S. dollars at the current exchange rates as of the applicable balance sheet date. Revenues and expenses are translated at the average exchange rate prevailing during the period. Cumulative gains and losses from the translation of the foreign subsidiaries' financial statements have been included in stockholders' equity.
Cash and Cash Equivalents and Short-Term Investments
The Company considers cash invested in highly liquid financial instruments with an original maturity of three months or less to be cash equivalents. Cash investments in highly liquid financial instruments with original maturities greater than three months but not longer than fifteen months are classified as short-term investments.
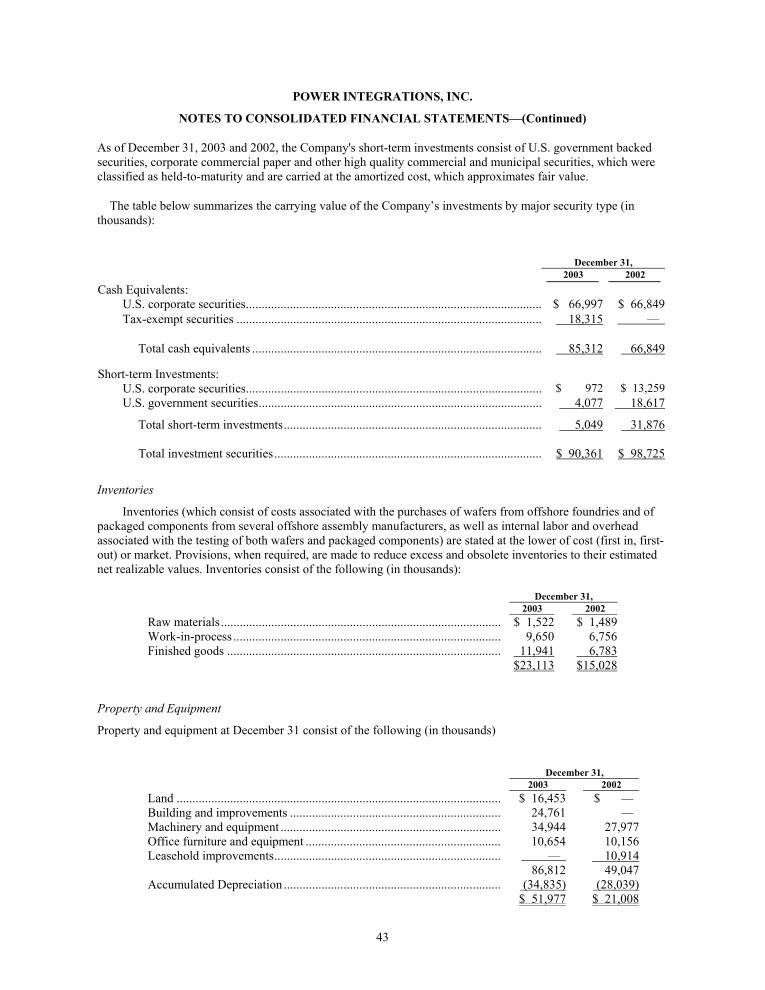
43
POWER INTEGRATIONS, INC.
NOTES TO CONSOLIDATED FINANCIAL STATEMENTS—(Continued)
As of December 31, 2003 and 2002, the Company's short-term investments consist of U.S. government backed securities, corporate commercial paper and other high quality commercial and municipal securities, which were classified as held-to-maturity and are carried at the amortized cost, which approximates fair value.
The table below summarizes the carrying value of the Company’s investments by major security type (in thousands):
December 31, 2003 2002
Cash Equivalents: U.S. corporate securities.............................................................................................. $ 66,997 $ 66,849 Tax-exempt securities ................................................................................................. 18,315 —
Total cash equivalents ............................................................................................ 85,312 66,849
Short-term Investments: U.S. corporate securities.............................................................................................. $ 972 $ 13,259 U.S. government securities.......................................................................................... 4,077 18,617
Total short-term investments.................................................................................. 5,049 31,876 Total investment securities..................................................................................... $ 90,361 $ 98,725
Inventories
Inventories (which consist of costs associated with the purchases of wafers from offshore foundries and of packaged components from several offshore assembly manufacturers, as well as internal labor and overhead associated with the testing of both wafers and packaged components) are stated at the lower of cost (first in, first-out) or market. Provisions, when required, are made to reduce excess and obsolete inventories to their estimated net realizable values. Inventories consist of the following (in thousands):
December 31, 2003 2002
Raw materials......................................................................................... $ 1,522 $ 1,489 Work-in-process ..................................................................................... 9,650 6,756 Finished goods ....................................................................................... 11,941 6,783 $23,113 $15,028 Property and Equipment
Property and equipment at December 31 consist of the following (in thousands)
December 31, 2003 2002
Land ....................................................................................................... $ 16,453 $ — Building and improvements ................................................................... 24,761 — Machinery and equipment ...................................................................... 34,944 27,977 Office furniture and equipment .............................................................. 10,654 10,156 Leasehold improvements........................................................................ — 10,914 86,812 49,047 Accumulated Depreciation ..................................................................... (34,835) (28,039) $ 51,977 $ 21,008
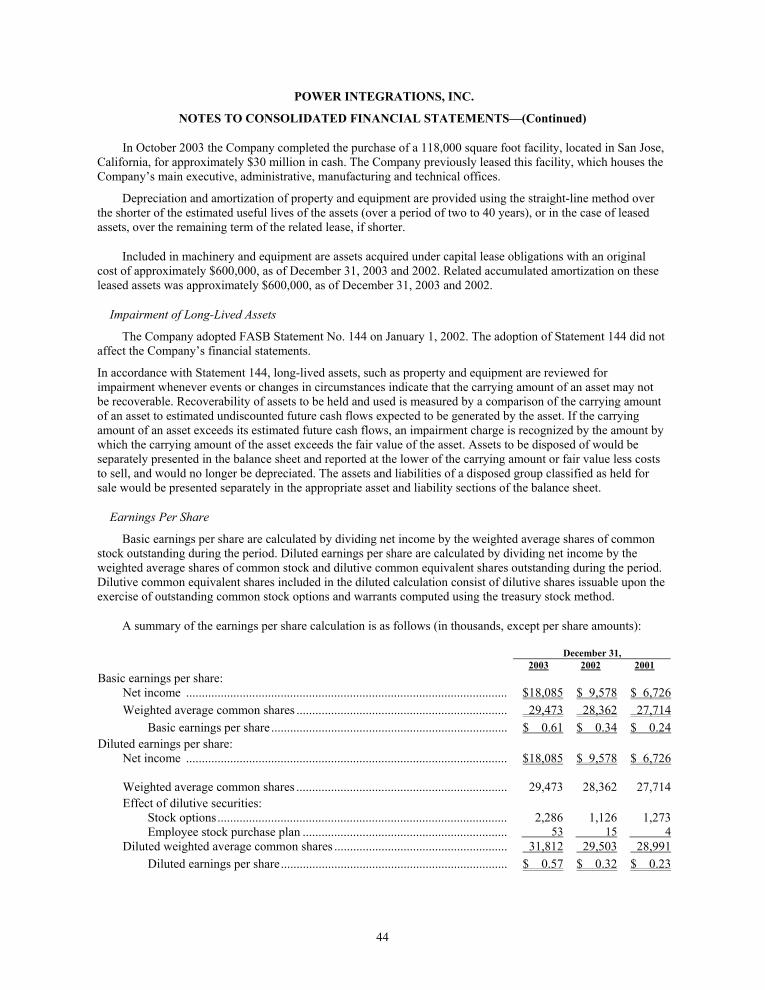
44
POWER INTEGRATIONS, INC.
NOTES TO CONSOLIDATED FINANCIAL STATEMENTS—(Continued)
In October 2003 the Company completed the purchase of a 118,000 square foot facility, located in San Jose, California, for approximately $30 million in cash. The Company previously leased this facility, which houses the Company’s main executive, administrative, manufacturing and technical offices.
Depreciation and amortization of property and equipment are provided using the straight-line method over the shorter of the estimated useful lives of the assets (over a period of two to 40 years), or in the case of leased assets, over the remaining term of the related lease, if shorter.
Included in machinery and equipment are assets acquired under capital lease obligations with an original cost of approximately $600,000, as of December 31, 2003 and 2002. Related accumulated amortization on these leased assets was approximately $600,000, as of December 31, 2003 and 2002.
Impairment of Long-Lived Assets
The Company adopted FASB Statement No. 144 on January 1, 2002. The adoption of Statement 144 did not affect the Company’s financial statements.
In accordance with Statement 144, long-lived assets, such as property and equipment are reviewed for impairment whenever events or changes in circumstances indicate that the carrying amount of an asset may not be recoverable. Recoverability of assets to be held and used is measured by a comparison of the carrying amount of an asset to estimated undiscounted future cash flows expected to be generated by the asset. If the carrying amount of an asset exceeds its estimated future cash flows, an impairment charge is recognized by the amount by which the carrying amount of the asset exceeds the fair value of the asset. Assets to be disposed of would be separately presented in the balance sheet and reported at the lower of the carrying amount or fair value less costs to sell, and would no longer be depreciated. The assets and liabilities of a disposed group classified as held for sale would be presented separately in the appropriate asset and liability sections of the balance sheet.
Earnings Per Share
Basic earnings per share are calculated by dividing net income by the weighted average shares of common stock outstanding during the period. Diluted earnings per share are calculated by dividing net income by the weighted average shares of common stock and dilutive common equivalent shares outstanding during the period. Dilutive common equivalent shares included in the diluted calculation consist of dilutive shares issuable upon the exercise of outstanding common stock options and warrants computed using the treasury stock method.
A summary of the earnings per share calculation is as follows (in thousands, except per share amounts):
December 31, 2003 2002 2001
Basic earnings per share: Net income ...................................................................................................... $18,085 $ 9,578 $ 6,726 Weighted average common shares ................................................................... 29,473 28,362 27,714 Basic earnings per share ........................................................................... $ 0.61 $ 0.34 $ 0.24Diluted earnings per share: Net income ......................................................................................................
$18,085 $ 9,578 $ 6,726
Weighted average common shares ................................................................... 29,473 28,362 27,714 Effect of dilutive securities: Stock options............................................................................................ 2,286 1,126 1,273 Employee stock purchase plan ................................................................. 53 15 4 Diluted weighted average common shares ....................................................... 31,812 29,503 28,991 Diluted earnings per share........................................................................ $ 0.57 $ 0.32 $ 0.23
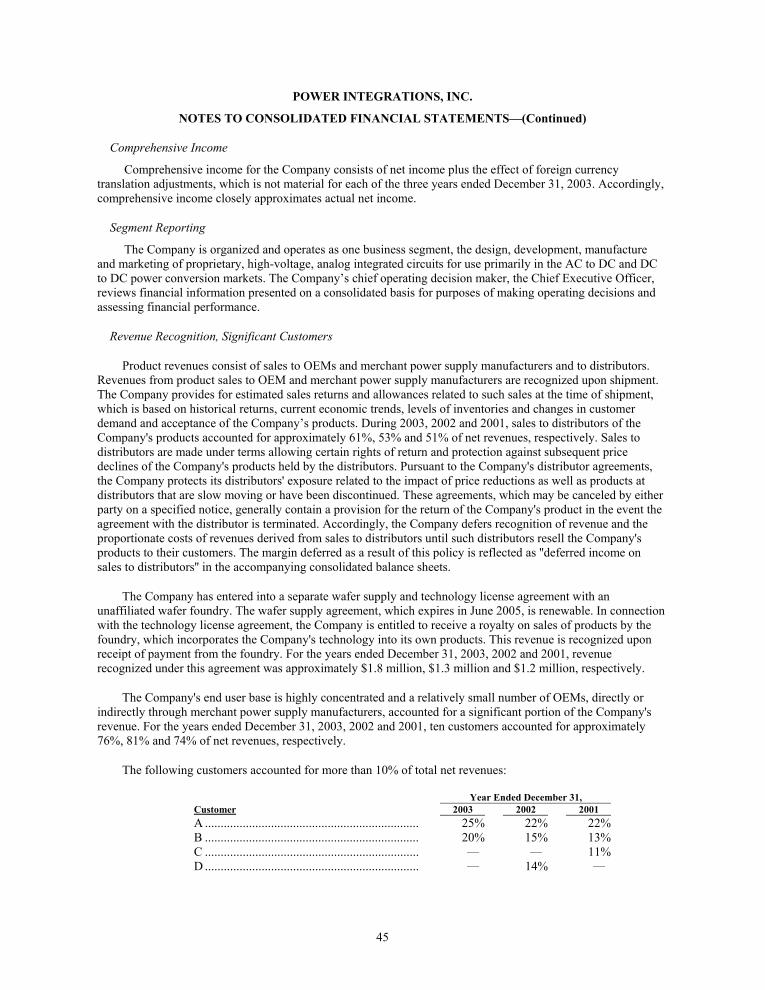
45
POWER INTEGRATIONS, INC.
NOTES TO CONSOLIDATED FINANCIAL STATEMENTS—(Continued)
Comprehensive Income
Comprehensive income for the Company consists of net income plus the effect of foreign currency translation adjustments, which is not material for each of the three years ended December 31, 2003. Accordingly, comprehensive income closely approximates actual net income.
Segment Reporting
The Company is organized and operates as one business segment, the design, development, manufacture and marketing of proprietary, high-voltage, analog integrated circuits for use primarily in the AC to DC and DC to DC power conversion markets. The Company’s chief operating decision maker, the Chief Executive Officer, reviews financial information presented on a consolidated basis for purposes of making operating decisions and assessing financial performance.
Revenue Recognition, Significant Customers
Product revenues consist of sales to OEMs and merchant power supply manufacturers and to distributors. Revenues from product sales to OEM and merchant power supply manufacturers are recognized upon shipment. The Company provides for estimated sales returns and allowances related to such sales at the time of shipment, which is based on historical returns, current economic trends, levels of inventories and changes in customer demand and acceptance of the Company’s products. During 2003, 2002 and 2001, sales to distributors of the Company's products accounted for approximately 61%, 53% and 51% of net revenues, respectively. Sales to distributors are made under terms allowing certain rights of return and protection against subsequent price declines of the Company's products held by the distributors. Pursuant to the Company's distributor agreements, the Company protects its distributors' exposure related to the impact of price reductions as well as products at distributors that are slow moving or have been discontinued. These agreements, which may be canceled by either party on a specified notice, generally contain a provision for the return of the Company's product in the event the agreement with the distributor is terminated. Accordingly, the Company defers recognition of revenue and the proportionate costs of revenues derived from sales to distributors until such distributors resell the Company's products to their customers. The margin deferred as a result of this policy is reflected as ''deferred income on sales to distributors'' in the accompanying consolidated balance sheets.
The Company has entered into a separate wafer supply and technology license agreement with an unaffiliated wafer foundry. The wafer supply agreement, which expires in June 2005, is renewable. In connection with the technology license agreement, the Company is entitled to receive a royalty on sales of products by the foundry, which incorporates the Company's technology into its own products. This revenue is recognized upon receipt of payment from the foundry. For the years ended December 31, 2003, 2002 and 2001, revenue recognized under this agreement was approximately $1.8 million, $1.3 million and $1.2 million, respectively.
The Company's end user base is highly concentrated and a relatively small number of OEMs, directly or indirectly through merchant power supply manufacturers, accounted for a significant portion of the Company's revenue. For the years ended December 31, 2003, 2002 and 2001, ten customers accounted for approximately 76%, 81% and 74% of net revenues, respectively.
The following customers accounted for more than 10% of total net revenues:
Year Ended December 31, Customer 2003 2002 2001 A .................................................................... 25% 22% 22% B .................................................................... 20% 15% 13% C .................................................................... — — 11% D .................................................................... — 14% —
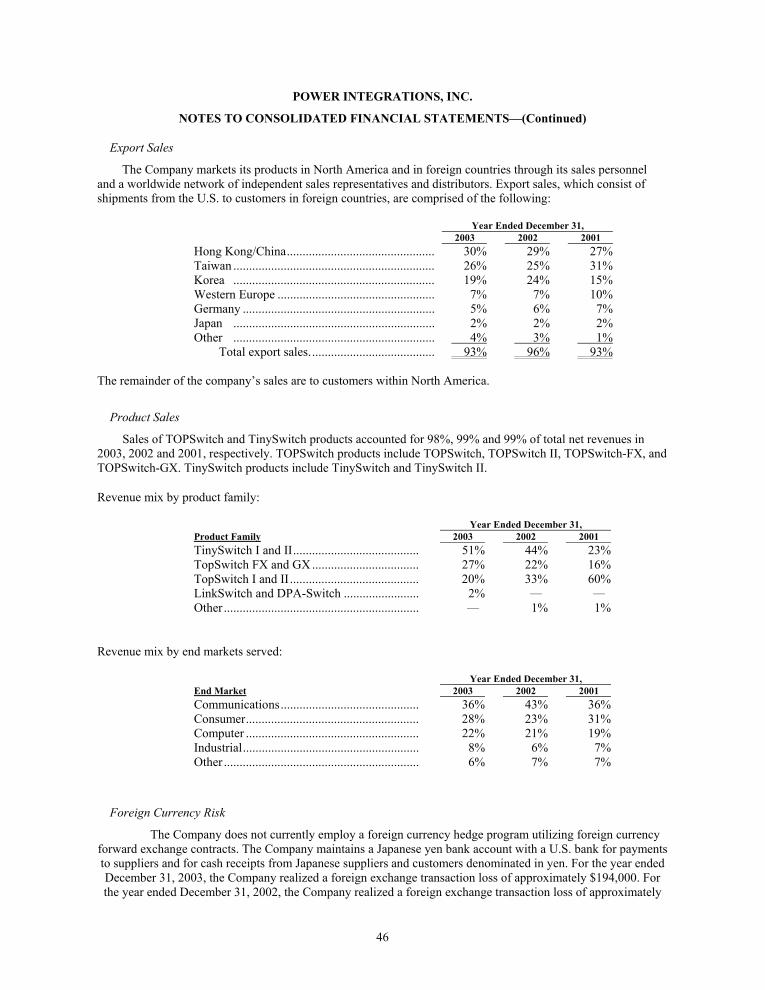
46
POWER INTEGRATIONS, INC.
NOTES TO CONSOLIDATED FINANCIAL STATEMENTS—(Continued)
Export Sales
The Company markets its products in North America and in foreign countries through its sales personnel and a worldwide network of independent sales representatives and distributors. Export sales, which consist of shipments from the U.S. to customers in foreign countries, are comprised of the following:
Year Ended December 31, 2003 2002 2001
Hong Kong/China............................................... 30% 29% 27% Taiwan ................................................................ 26% 25% 31% Korea ................................................................ 19% 24% 15% Western Europe .................................................. 7% 7% 10% Germany ............................................................. 5% 6% 7% Japan ................................................................ 2% 2% 2% Other ................................................................ 4% 3% 1% Total export sales........................................ 93% 96% 93% The remainder of the company’s sales are to customers within North America.
Product Sales
Sales of TOPSwitch and TinySwitch products accounted for 98%, 99% and 99% of total net revenues in 2003, 2002 and 2001, respectively. TOPSwitch products include TOPSwitch, TOPSwitch II, TOPSwitch-FX, and TOPSwitch-GX. TinySwitch products include TinySwitch and TinySwitch II.
Revenue mix by product family:
Year Ended December 31, Product Family 2003 2002 2001 TinySwitch I and II........................................ 51% 44% 23% TopSwitch FX and GX .................................. 27% 22% 16% TopSwitch I and II ......................................... 20% 33% 60% LinkSwitch and DPA-Switch ........................ 2% — — Other .............................................................. — 1% 1%
Revenue mix by end markets served:
Year Ended December 31, End Market 2003 2002 2001 Communications............................................ 36% 43% 36% Consumer....................................................... 28% 23% 31% Computer ....................................................... 22% 21% 19% Industrial........................................................ 8% 6% 7% Other .............................................................. 6% 7% 7%
Foreign Currency Risk
The Company does not currently employ a foreign currency hedge program utilizing foreign currency forward exchange contracts. The Company maintains a Japanese yen bank account with a U.S. bank for payments to suppliers and for cash receipts from Japanese suppliers and customers denominated in yen. For the year ended December 31, 2003, the Company realized a foreign exchange transaction loss of approximately $194,000. For the year ended December 31, 2002, the Company realized a foreign exchange transaction loss of approximately
47
POWER INTEGRATIONS, INC.
NOTES TO CONSOLIDATED FINANCIAL STATEMENTS—(Continued)
$171,000, and for the year ended December 31, 2001, the Company realized a foreign exchange transaction loss of approximately $112,000. These amounts are included in ''other income (expense),'' in the accompanying consolidated statements of operations.
Advertising
Advertising costs are expensed as incurred. Advertising costs amounted to $636,000, $736,000, and $620,000 in 2003, 2002 and 2001, respectively.
Research and Development
Research and development costs are expensed as incurred.
Income Taxes
Income taxes are accounted for under the asset and liability method. Deferred tax assets and liabilities are recognized for the future tax consequences attributable to differences between the financial statement carrying amounts of existing assets and liabilities and their respective tax bases and operating loss and tax credit carryforwards. Deferred tax assets and liabilities are measured using enacted tax rates expected to apply to taxable income in the years in which those temporary differences are expected to be recovered or settled. The effect on deferred tax assets and liabilities of a change in tax rates is recognized in income in the period that includes the enactment date.
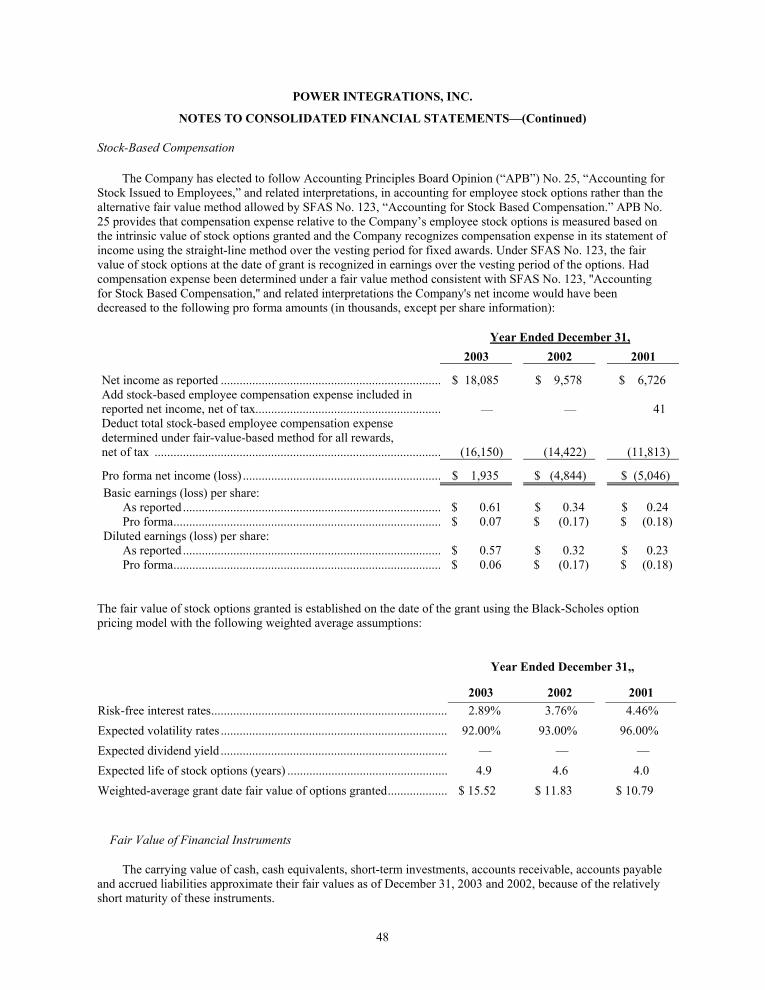
48
POWER INTEGRATIONS, INC.
NOTES TO CONSOLIDATED FINANCIAL STATEMENTS—(Continued)
Stock-Based Compensation The Company has elected to follow Accounting Principles Board Opinion (“APB”) No. 25, “Accounting for Stock Issued to Employees,” and related interpretations, in accounting for employee stock options rather than the alternative fair value method allowed by SFAS No. 123, “Accounting for Stock Based Compensation.” APB No. 25 provides that compensation expense relative to the Company’s employee stock options is measured based on the intrinsic value of stock options granted and the Company recognizes compensation expense in its statement of income using the straight-line method over the vesting period for fixed awards. Under SFAS No. 123, the fair value of stock options at the date of grant is recognized in earnings over the vesting period of the options. Had compensation expense been determined under a fair value method consistent with SFAS No. 123, ''Accounting for Stock Based Compensation,'' and related interpretations the Company's net income would have been decreased to the following pro forma amounts (in thousands, except per share information):
Year Ended December 31, 2003 2002 2001
Net income as reported ...................................................................... $ 18,085 $ 9,578 $ 6,726 Add stock-based employee compensation expense included in reported net income, net of tax........................................................... — — 41 Deduct total stock-based employee compensation expense determined under fair-value-based method for all rewards, net of tax ........................................................................................... (16,150) (14,422) (11,813)
Pro forma net income (loss) ............................................................... $ 1,935 $ (4,844) $ (5,046) Basic earnings (loss) per share:
As reported .................................................................................. $ 0.61 $ 0.34 $ 0.24 Pro forma..................................................................................... $ 0.07 $ (0.17) $ (0.18) Diluted earnings (loss) per share:
As reported .................................................................................. $ 0.57 $ 0.32 $ 0.23 Pro forma..................................................................................... $ 0.06 $ (0.17) $ (0.18)
The fair value of stock options granted is established on the date of the grant using the Black-Scholes option pricing model with the following weighted average assumptions:
Year Ended December 31,,
2003 2002 2001 Risk-free interest rates........................................................................... 2.89% 3.76% 4.46% Expected volatility rates ........................................................................ 92.00% 93.00% 96.00% Expected dividend yield ........................................................................ — — — Expected life of stock options (years) ................................................... 4.9 4.6 4.0 Weighted-average grant date fair value of options granted................... $ 15.52 $ 11.83 $ 10.79
Fair Value of Financial Instruments
The carrying value of cash, cash equivalents, short-term investments, accounts receivable, accounts payable and accrued liabilities approximate their fair values as of December 31, 2003 and 2002, because of the relatively short maturity of these instruments.
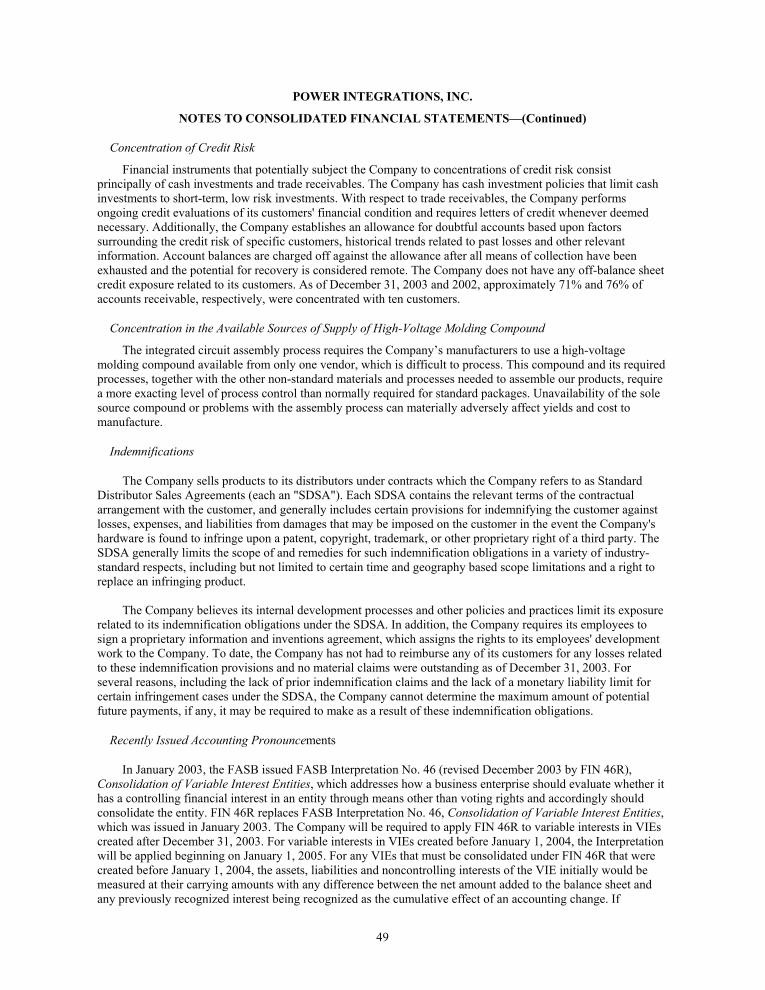
49
POWER INTEGRATIONS, INC.
NOTES TO CONSOLIDATED FINANCIAL STATEMENTS—(Continued)
Concentration of Credit Risk
Financial instruments that potentially subject the Company to concentrations of credit risk consist principally of cash investments and trade receivables. The Company has cash investment policies that limit cash investments to short-term, low risk investments. With respect to trade receivables, the Company performs ongoing credit evaluations of its customers' financial condition and requires letters of credit whenever deemed necessary. Additionally, the Company establishes an allowance for doubtful accounts based upon factors surrounding the credit risk of specific customers, historical trends related to past losses and other relevant information. Account balances are charged off against the allowance after all means of collection have been exhausted and the potential for recovery is considered remote. The Company does not have any off-balance sheet credit exposure related to its customers. As of December 31, 2003 and 2002, approximately 71% and 76% of accounts receivable, respectively, were concentrated with ten customers.
Concentration in the Available Sources of Supply of High-Voltage Molding Compound
The integrated circuit assembly process requires the Company’s manufacturers to use a high-voltage molding compound available from only one vendor, which is difficult to process. This compound and its required processes, together with the other non-standard materials and processes needed to assemble our products, require a more exacting level of process control than normally required for standard packages. Unavailability of the sole source compound or problems with the assembly process can materially adversely affect yields and cost to manufacture.
Indemnifications
The Company sells products to its distributors under contracts which the Company refers to as Standard Distributor Sales Agreements (each an "SDSA"). Each SDSA contains the relevant terms of the contractual arrangement with the customer, and generally includes certain provisions for indemnifying the customer against losses, expenses, and liabilities from damages that may be imposed on the customer in the event the Company's hardware is found to infringe upon a patent, copyright, trademark, or other proprietary right of a third party. The SDSA generally limits the scope of and remedies for such indemnification obligations in a variety of industry-standard respects, including but not limited to certain time and geography based scope limitations and a right to replace an infringing product. The Company believes its internal development processes and other policies and practices limit its exposure related to its indemnification obligations under the SDSA. In addition, the Company requires its employees to sign a proprietary information and inventions agreement, which assigns the rights to its employees' development work to the Company. To date, the Company has not had to reimburse any of its customers for any losses related to these indemnification provisions and no material claims were outstanding as of December 31, 2003. For several reasons, including the lack of prior indemnification claims and the lack of a monetary liability limit for certain infringement cases under the SDSA, the Company cannot determine the maximum amount of potential future payments, if any, it may be required to make as a result of these indemnification obligations.
Recently Issued Accounting Pronouncements
In January 2003, the FASB issued FASB Interpretation No. 46 (revised December 2003 by FIN 46R), Consolidation of Variable Interest Entities, which addresses how a business enterprise should evaluate whether it has a controlling financial interest in an entity through means other than voting rights and accordingly should consolidate the entity. FIN 46R replaces FASB Interpretation No. 46, Consolidation of Variable Interest Entities, which was issued in January 2003. The Company will be required to apply FIN 46R to variable interests in VIEs created after December 31, 2003. For variable interests in VIEs created before January 1, 2004, the Interpretation will be applied beginning on January 1, 2005. For any VIEs that must be consolidated under FIN 46R that were created before January 1, 2004, the assets, liabilities and noncontrolling interests of the VIE initially would be measured at their carrying amounts with any difference between the net amount added to the balance sheet and any previously recognized interest being recognized as the cumulative effect of an accounting change. If
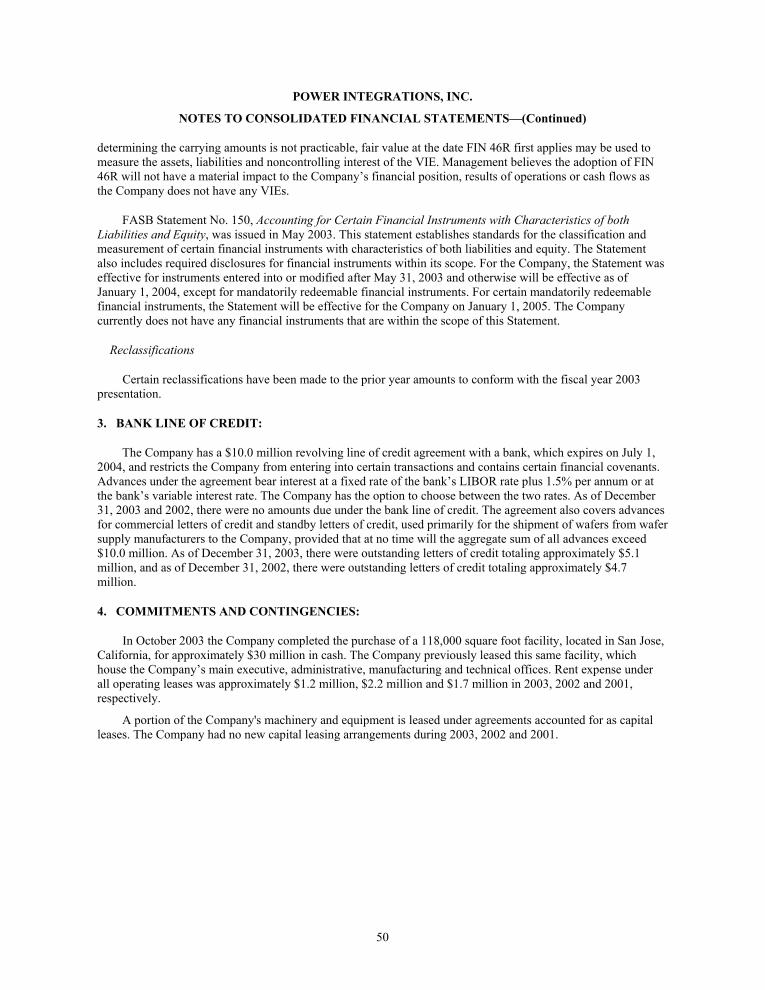
50
POWER INTEGRATIONS, INC.
NOTES TO CONSOLIDATED FINANCIAL STATEMENTS—(Continued)
determining the carrying amounts is not practicable, fair value at the date FIN 46R first applies may be used to measure the assets, liabilities and noncontrolling interest of the VIE. Management believes the adoption of FIN 46R will not have a material impact to the Company’s financial position, results of operations or cash flows as the Company does not have any VIEs.
FASB Statement No. 150, Accounting for Certain Financial Instruments with Characteristics of both Liabilities and Equity, was issued in May 2003. This statement establishes standards for the classification and measurement of certain financial instruments with characteristics of both liabilities and equity. The Statement also includes required disclosures for financial instruments within its scope. For the Company, the Statement was effective for instruments entered into or modified after May 31, 2003 and otherwise will be effective as of January 1, 2004, except for mandatorily redeemable financial instruments. For certain mandatorily redeemable financial instruments, the Statement will be effective for the Company on January 1, 2005. The Company currently does not have any financial instruments that are within the scope of this Statement.
Reclassifications
Certain reclassifications have been made to the prior year amounts to conform with the fiscal year 2003 presentation.
3. BANK LINE OF CREDIT:
The Company has a $10.0 million revolving line of credit agreement with a bank, which expires on July 1, 2004, and restricts the Company from entering into certain transactions and contains certain financial covenants. Advances under the agreement bear interest at a fixed rate of the bank’s LIBOR rate plus 1.5% per annum or at the bank’s variable interest rate. The Company has the option to choose between the two rates. As of December 31, 2003 and 2002, there were no amounts due under the bank line of credit. The agreement also covers advances for commercial letters of credit and standby letters of credit, used primarily for the shipment of wafers from wafer supply manufacturers to the Company, provided that at no time will the aggregate sum of all advances exceed $10.0 million. As of December 31, 2003, there were outstanding letters of credit totaling approximately $5.1 million, and as of December 31, 2002, there were outstanding letters of credit totaling approximately $4.7 million.
4. COMMITMENTS AND CONTINGENCIES:
In October 2003 the Company completed the purchase of a 118,000 square foot facility, located in San Jose, California, for approximately $30 million in cash. The Company previously leased this same facility, which house the Company’s main executive, administrative, manufacturing and technical offices. Rent expense under all operating leases was approximately $1.2 million, $2.2 million and $1.7 million in 2003, 2002 and 2001, respectively.
A portion of the Company's machinery and equipment is leased under agreements accounted for as capital leases. The Company had no new capital leasing arrangements during 2003, 2002 and 2001.
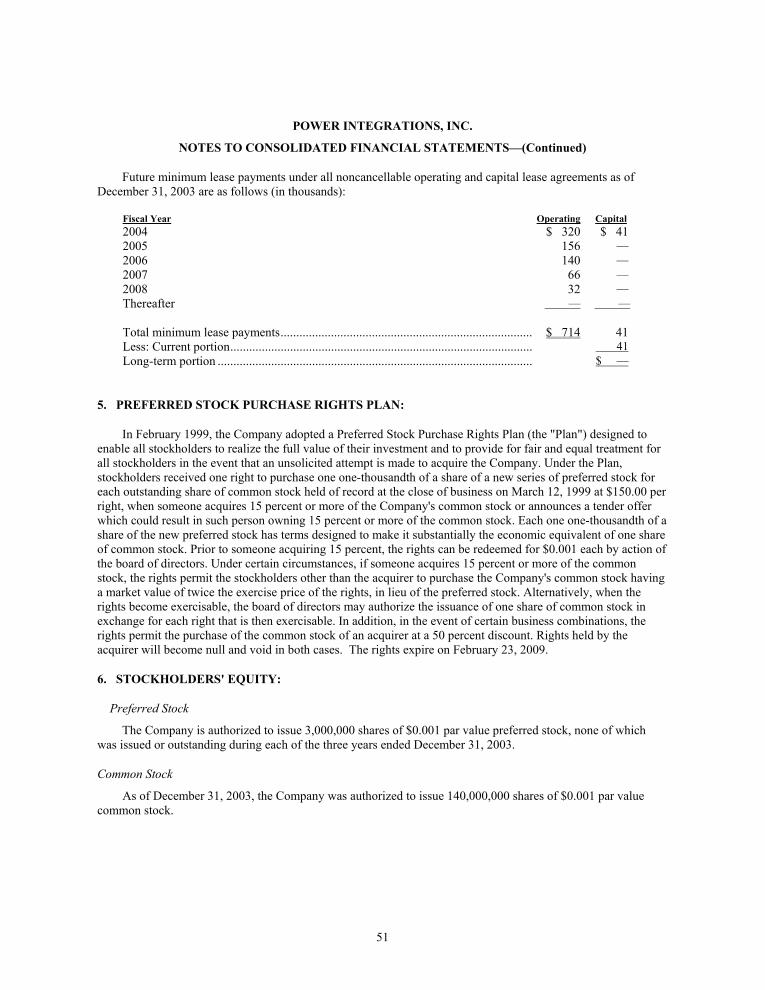
51
POWER INTEGRATIONS, INC.
NOTES TO CONSOLIDATED FINANCIAL STATEMENTS—(Continued)
Future minimum lease payments under all noncancellable operating and capital lease agreements as of December 31, 2003 are as follows (in thousands): Fiscal Year Operating Capital 2004 $ 320 $ 41 2005 156 — 2006 140 — 2007 66 — 2008 32 — Thereafter — — Total minimum lease payments................................................................................ $ 714 41 Less: Current portion................................................................................................ 41 Long-term portion .................................................................................................... $ —
5. PREFERRED STOCK PURCHASE RIGHTS PLAN:
In February 1999, the Company adopted a Preferred Stock Purchase Rights Plan (the "Plan") designed to enable all stockholders to realize the full value of their investment and to provide for fair and equal treatment for all stockholders in the event that an unsolicited attempt is made to acquire the Company. Under the Plan, stockholders received one right to purchase one one-thousandth of a share of a new series of preferred stock for each outstanding share of common stock held of record at the close of business on March 12, 1999 at $150.00 per right, when someone acquires 15 percent or more of the Company's common stock or announces a tender offer which could result in such person owning 15 percent or more of the common stock. Each one one-thousandth of a share of the new preferred stock has terms designed to make it substantially the economic equivalent of one share of common stock. Prior to someone acquiring 15 percent, the rights can be redeemed for $0.001 each by action of the board of directors. Under certain circumstances, if someone acquires 15 percent or more of the common stock, the rights permit the stockholders other than the acquirer to purchase the Company's common stock having a market value of twice the exercise price of the rights, in lieu of the preferred stock. Alternatively, when the rights become exercisable, the board of directors may authorize the issuance of one share of common stock in exchange for each right that is then exercisable. In addition, in the event of certain business combinations, the rights permit the purchase of the common stock of an acquirer at a 50 percent discount. Rights held by the acquirer will become null and void in both cases. The rights expire on February 23, 2009.
6. STOCKHOLDERS' EQUITY:
Preferred Stock
The Company is authorized to issue 3,000,000 shares of $0.001 par value preferred stock, none of which was issued or outstanding during each of the three years ended December 31, 2003.
Common Stock
As of December 31, 2003, the Company was authorized to issue 140,000,000 shares of $0.001 par value common stock.
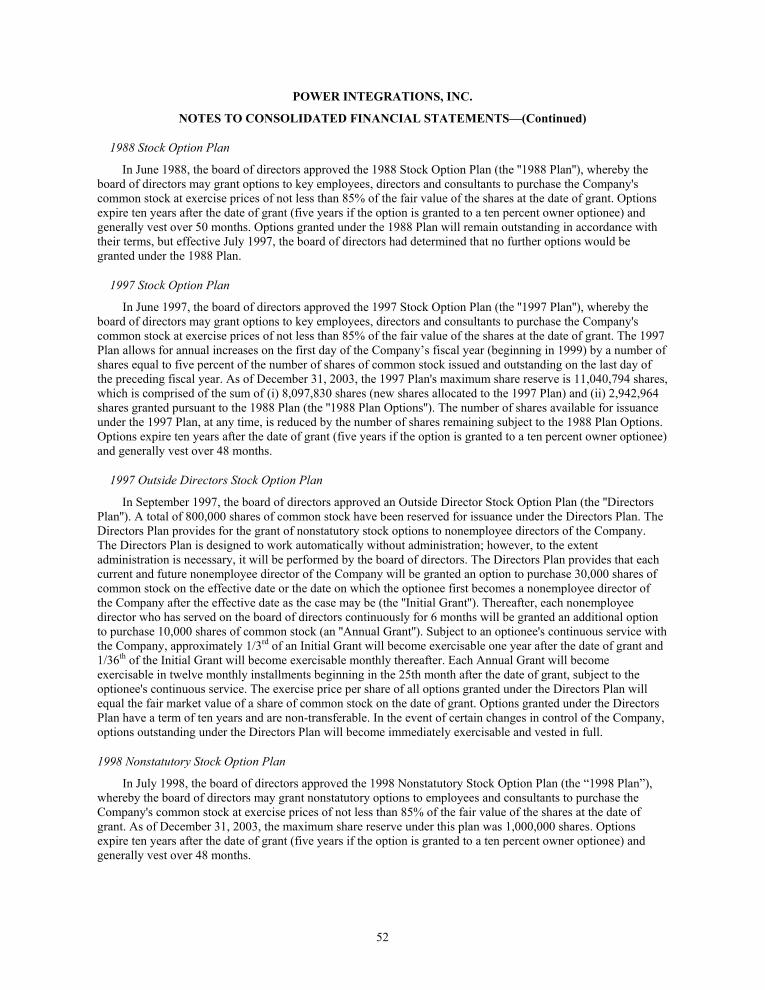
52
POWER INTEGRATIONS, INC.
NOTES TO CONSOLIDATED FINANCIAL STATEMENTS—(Continued)
1988 Stock Option Plan
In June 1988, the board of directors approved the 1988 Stock Option Plan (the ''1988 Plan''), whereby the board of directors may grant options to key employees, directors and consultants to purchase the Company's common stock at exercise prices of not less than 85% of the fair value of the shares at the date of grant. Options expire ten years after the date of grant (five years if the option is granted to a ten percent owner optionee) and generally vest over 50 months. Options granted under the 1988 Plan will remain outstanding in accordance with their terms, but effective July 1997, the board of directors had determined that no further options would be granted under the 1988 Plan.
1997 Stock Option Plan
In June 1997, the board of directors approved the 1997 Stock Option Plan (the ''1997 Plan''), whereby the board of directors may grant options to key employees, directors and consultants to purchase the Company's common stock at exercise prices of not less than 85% of the fair value of the shares at the date of grant. The 1997 Plan allows for annual increases on the first day of the Company’s fiscal year (beginning in 1999) by a number of shares equal to five percent of the number of shares of common stock issued and outstanding on the last day of the preceding fiscal year. As of December 31, 2003, the 1997 Plan's maximum share reserve is 11,040,794 shares, which is comprised of the sum of (i) 8,097,830 shares (new shares allocated to the 1997 Plan) and (ii) 2,942,964 shares granted pursuant to the 1988 Plan (the ''1988 Plan Options''). The number of shares available for issuance under the 1997 Plan, at any time, is reduced by the number of shares remaining subject to the 1988 Plan Options. Options expire ten years after the date of grant (five years if the option is granted to a ten percent owner optionee) and generally vest over 48 months.
1997 Outside Directors Stock Option Plan
In September 1997, the board of directors approved an Outside Director Stock Option Plan (the ''Directors Plan''). A total of 800,000 shares of common stock have been reserved for issuance under the Directors Plan. The Directors Plan provides for the grant of nonstatutory stock options to nonemployee directors of the Company. The Directors Plan is designed to work automatically without administration; however, to the extent administration is necessary, it will be performed by the board of directors. The Directors Plan provides that each current and future nonemployee director of the Company will be granted an option to purchase 30,000 shares of common stock on the effective date or the date on which the optionee first becomes a nonemployee director of the Company after the effective date as the case may be (the ''Initial Grant''). Thereafter, each nonemployee director who has served on the board of directors continuously for 6 months will be granted an additional option to purchase 10,000 shares of common stock (an ''Annual Grant''). Subject to an optionee's continuous service with the Company, approximately 1/3rd of an Initial Grant will become exercisable one year after the date of grant and 1/36th of the Initial Grant will become exercisable monthly thereafter. Each Annual Grant will become exercisable in twelve monthly installments beginning in the 25th month after the date of grant, subject to the optionee's continuous service. The exercise price per share of all options granted under the Directors Plan will equal the fair market value of a share of common stock on the date of grant. Options granted under the Directors Plan have a term of ten years and are non-transferable. In the event of certain changes in control of the Company, options outstanding under the Directors Plan will become immediately exercisable and vested in full.
1998 Nonstatutory Stock Option Plan
In July 1998, the board of directors approved the 1998 Nonstatutory Stock Option Plan (the “1998 Plan”), whereby the board of directors may grant nonstatutory options to employees and consultants to purchase the Company's common stock at exercise prices of not less than 85% of the fair value of the shares at the date of grant. As of December 31, 2003, the maximum share reserve under this plan was 1,000,000 shares. Options expire ten years after the date of grant (five years if the option is granted to a ten percent owner optionee) and generally vest over 48 months.
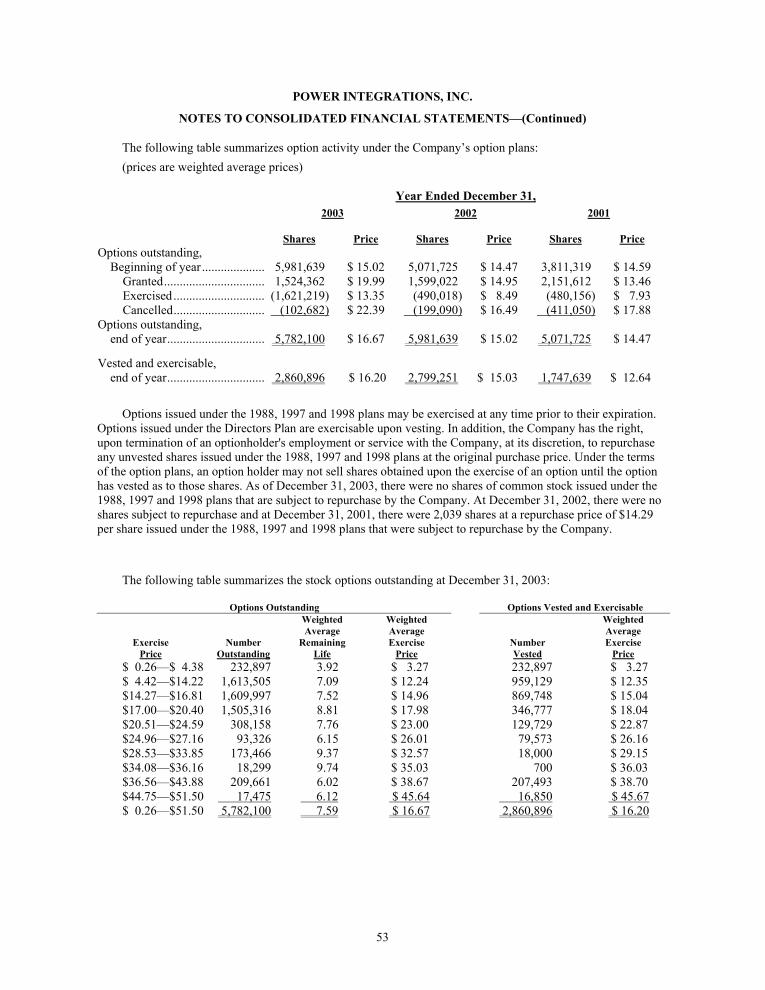
53
POWER INTEGRATIONS, INC.
NOTES TO CONSOLIDATED FINANCIAL STATEMENTS—(Continued)
The following table summarizes option activity under the Company’s option plans: (prices are weighted average prices)
Year Ended December 31, 2003 2002 2001
Shares
Price
Shares
Price
Shares
Price Options outstanding, Beginning of year.....................
5,981,639
$ 15.02
5,071,725
$ 14.47
3,811,319
$ 14.59
Granted................................. 1,524,362 $ 19.99 1,599,022 $ 14.95 2,151,612 $ 13.46 Exercised.............................. (1,621,219) $ 13.35 (490,018) $ 8.49 (480,156) $ 7.93 Cancelled.............................. (102,682) $ 22.39 (199,090) $ 16.49 (411,050) $ 17.88 Options outstanding, end of year................................
5,782,100
$ 16.67
5,981,639
$ 15.02
5,071,725
$ 14.47
Vested and exercisable, end of year................................
2,860,896
$ 16.20
2,799,251
$ 15.03
1,747,639
$ 12.64
Options issued under the 1988, 1997 and 1998 plans may be exercised at any time prior to their expiration. Options issued under the Directors Plan are exercisable upon vesting. In addition, the Company has the right, upon termination of an optionholder's employment or service with the Company, at its discretion, to repurchase any unvested shares issued under the 1988, 1997 and 1998 plans at the original purchase price. Under the terms of the option plans, an option holder may not sell shares obtained upon the exercise of an option until the option has vested as to those shares. As of December 31, 2003, there were no shares of common stock issued under the 1988, 1997 and 1998 plans that are subject to repurchase by the Company. At December 31, 2002, there were no shares subject to repurchase and at December 31, 2001, there were 2,039 shares at a repurchase price of $14.29 per share issued under the 1988, 1997 and 1998 plans that were subject to repurchase by the Company.
The following table summarizes the stock options outstanding at December 31, 2003:
Options Outstanding Options Vested and Exercisable
Exercise Price
Number Outstanding
Weighted Average
Remaining Life
Weighted Average Exercise
Price
Number Vested
Weighted Average Exercise
Price $ 0.26—$ 4.38 232,897 3.92 $ 3.27 232,897 $ 3.27 $ 4.42—$14.22 1,613,505 7.09 $ 12.24 959,129 $ 12.35 $14.27—$16.81 1,609,997 7.52 $ 14.96 869,748 $ 15.04 $17.00—$20.40 1,505,316 8.81 $ 17.98 346,777 $ 18.04 $20.51—$24.59 308,158 7.76 $ 23.00 129,729 $ 22.87 $24.96—$27.16 93,326 6.15 $ 26.01 79,573 $ 26.16 $28.53—$33.85 173,466 9.37 $ 32.57 18,000 $ 29.15 $34.08—$36.16 18,299 9.74 $ 35.03 700 $ 36.03 $36.56—$43.88 209,661 6.02 $ 38.67 207,493 $ 38.70 $44.75—$51.50 17,475 6.12 $ 45.64 16,850 $ 45.67 $ 0.26—$51.50 5,782,100 7.59 $ 16.67 2,860,896 $ 16.20
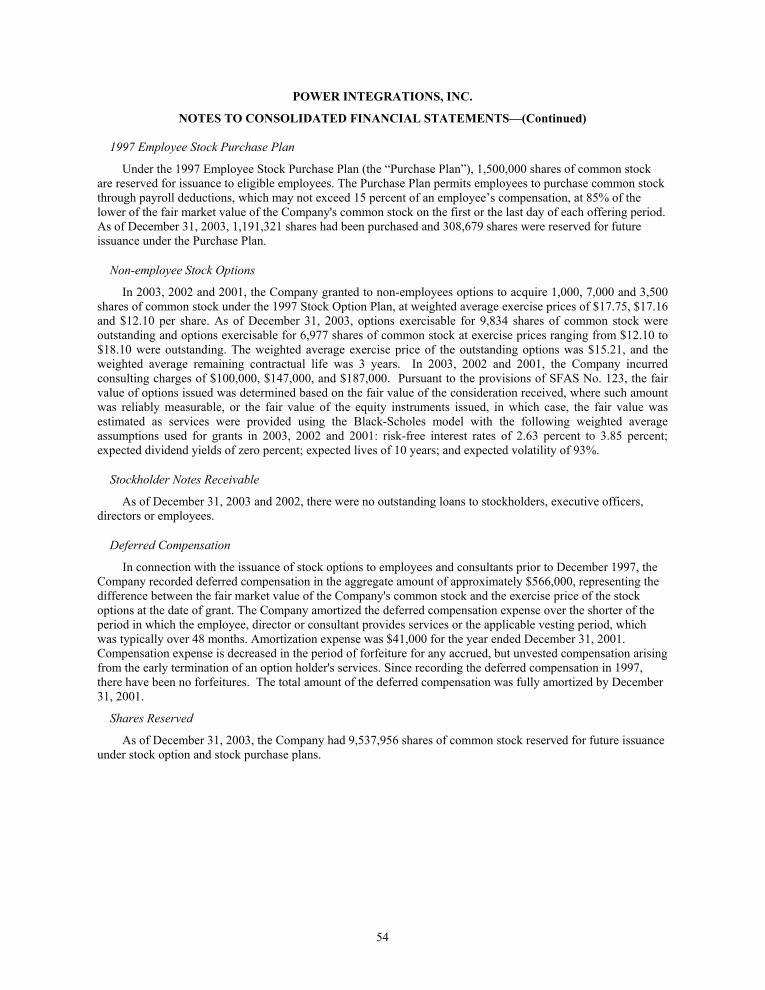
54
POWER INTEGRATIONS, INC.
NOTES TO CONSOLIDATED FINANCIAL STATEMENTS—(Continued)
1997 Employee Stock Purchase Plan
Under the 1997 Employee Stock Purchase Plan (the “Purchase Plan”), 1,500,000 shares of common stock are reserved for issuance to eligible employees. The Purchase Plan permits employees to purchase common stock through payroll deductions, which may not exceed 15 percent of an employee’s compensation, at 85% of the lower of the fair market value of the Company's common stock on the first or the last day of each offering period. As of December 31, 2003, 1,191,321 shares had been purchased and 308,679 shares were reserved for future issuance under the Purchase Plan.
Non-employee Stock Options
In 2003, 2002 and 2001, the Company granted to non-employees options to acquire 1,000, 7,000 and 3,500 shares of common stock under the 1997 Stock Option Plan, at weighted average exercise prices of $17.75, $17.16 and $12.10 per share. As of December 31, 2003, options exercisable for 9,834 shares of common stock were outstanding and options exercisable for 6,977 shares of common stock at exercise prices ranging from $12.10 to $18.10 were outstanding. The weighted average exercise price of the outstanding options was $15.21, and the weighted average remaining contractual life was 3 years. In 2003, 2002 and 2001, the Company incurred consulting charges of $100,000, $147,000, and $187,000. Pursuant to the provisions of SFAS No. 123, the fair value of options issued was determined based on the fair value of the consideration received, where such amount was reliably measurable, or the fair value of the equity instruments issued, in which case, the fair value was estimated as services were provided using the Black-Scholes model with the following weighted average assumptions used for grants in 2003, 2002 and 2001: risk-free interest rates of 2.63 percent to 3.85 percent; expected dividend yields of zero percent; expected lives of 10 years; and expected volatility of 93%.
Stockholder Notes Receivable
As of December 31, 2003 and 2002, there were no outstanding loans to stockholders, executive officers, directors or employees.
Deferred Compensation
In connection with the issuance of stock options to employees and consultants prior to December 1997, the Company recorded deferred compensation in the aggregate amount of approximately $566,000, representing the difference between the fair market value of the Company's common stock and the exercise price of the stock options at the date of grant. The Company amortized the deferred compensation expense over the shorter of the period in which the employee, director or consultant provides services or the applicable vesting period, which was typically over 48 months. Amortization expense was $41,000 for the year ended December 31, 2001. Compensation expense is decreased in the period of forfeiture for any accrued, but unvested compensation arising from the early termination of an option holder's services. Since recording the deferred compensation in 1997, there have been no forfeitures. The total amount of the deferred compensation was fully amortized by December 31, 2001.
Shares Reserved
As of December 31, 2003, the Company had 9,537,956 shares of common stock reserved for future issuance under stock option and stock purchase plans.
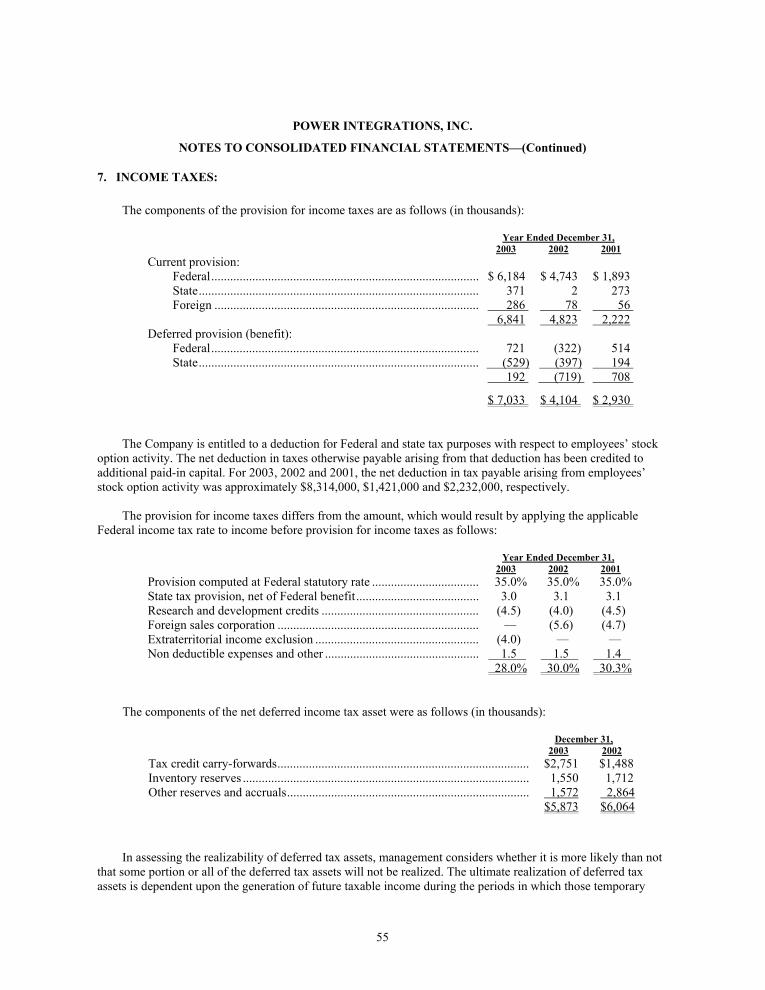
55
POWER INTEGRATIONS, INC.
NOTES TO CONSOLIDATED FINANCIAL STATEMENTS—(Continued)
7. INCOME TAXES:
The components of the provision for income taxes are as follows (in thousands):
Year Ended December 31, 2003 2002 2001
Current provision: Federal..................................................................................... $ 6,184 $ 4,743 $ 1,893 State......................................................................................... 371 2 273 Foreign .................................................................................... 286 78 56 6,841 4,823 2,222 Deferred provision (benefit): Federal..................................................................................... 721 (322) 514 State......................................................................................... (529) (397) 194 192 (719) 708
$ 7,033 $ 4,104 $ 2,930
The Company is entitled to a deduction for Federal and state tax purposes with respect to employees’ stock option activity. The net deduction in taxes otherwise payable arising from that deduction has been credited to additional paid-in capital. For 2003, 2002 and 2001, the net deduction in tax payable arising from employees’ stock option activity was approximately $8,314,000, $1,421,000 and $2,232,000, respectively. The provision for income taxes differs from the amount, which would result by applying the applicable Federal income tax rate to income before provision for income taxes as follows:
Year Ended December 31, 2003 2002 2001
Provision computed at Federal statutory rate .................................. 35.0% 35.0% 35.0% State tax provision, net of Federal benefit....................................... 3.0 3.1 3.1 Research and development credits .................................................. (4.5) (4.0) (4.5) Foreign sales corporation ................................................................ — (5.6) (4.7) Extraterritorial income exclusion .................................................... (4.0) — — Non deductible expenses and other ................................................. 1.5 1.5 1.4 28.0% 30.0% 30.3%
The components of the net deferred income tax asset were as follows (in thousands):
December 31, 2003 2002
Tax credit carry-forwards................................................................................ $2,751 $1,488 Inventory reserves ........................................................................................... 1,550 1,712 Other reserves and accruals............................................................................. 1,572 2,864 $5,873 $6,064
In assessing the realizability of deferred tax assets, management considers whether it is more likely than not that some portion or all of the deferred tax assets will not be realized. The ultimate realization of deferred tax assets is dependent upon the generation of future taxable income during the periods in which those temporary
56
POWER INTEGRATIONS, INC.
NOTES TO CONSOLIDATED FINANCIAL STATEMENTS—(Continued)
differences become deductible. Management considers the scheduled reversal of deferred tax liabilities, projected future taxable income, and tax planning strategies in making this assessment. Based upon the level of historical taxable income and projections for future taxable income over the periods in which the temporary differences are deductible, management believes it is more likely than not that the Company will realize the benefits of these deductible differences.
As of December 31, 2003, the Company had Federal and California research and development tax credit carryforwards of approximately $616,000 and $3.2 million, respectively. The Federal research and development tax credit carryforward expires in 2023. There is no expiration of research and development tax credit carryforwards for the State of California.
8. LEGAL PROCEEDINGS:
From time to time, the Company could become involved in litigation relating to claims arising out of the ordinary course of business. The Company is not presently involved in any legal proceedings.
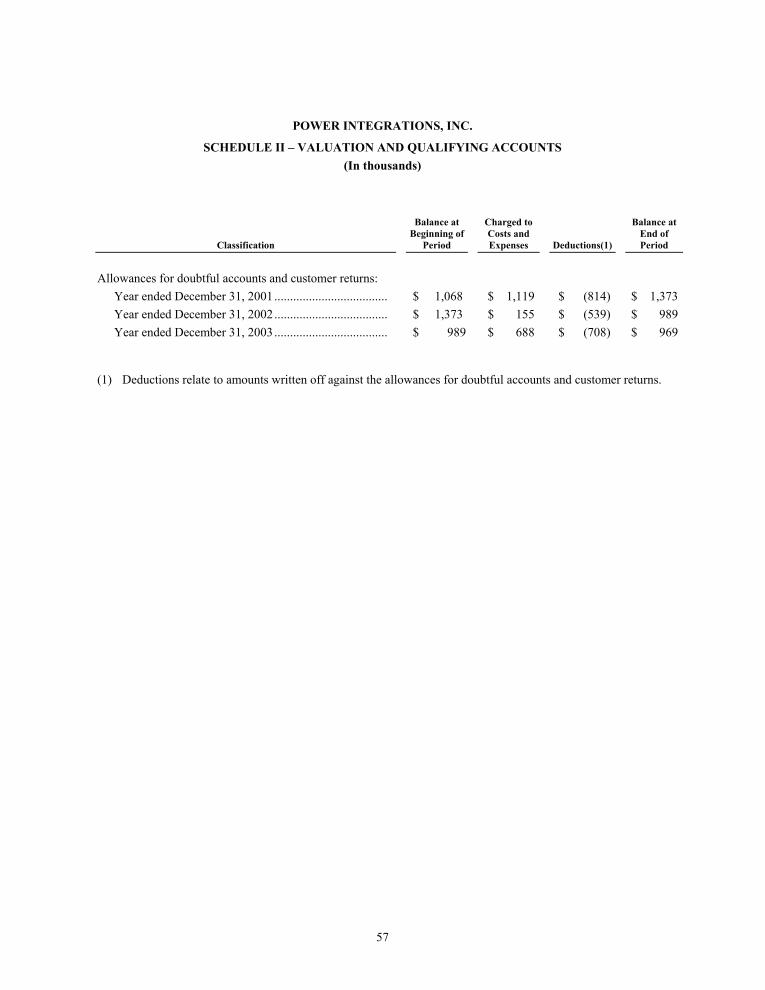
57
POWER INTEGRATIONS, INC.
SCHEDULE II – VALUATION AND QUALIFYING ACCOUNTS (In thousands)
Classification
Balance at Beginning of
Period
Charged to Costs and Expenses
Deductions(1)
Balance at End of Period
Allowances for doubtful accounts and customer returns:
Year ended December 31, 2001.................................... $ 1,068 $ 1,119 $ (814) $ 1,373 Year ended December 31, 2002.................................... $ 1,373 $ 155 $ (539) $ 989 Year ended December 31, 2003.................................... $ 989 $ 688 $ (708) $ 969
(1) Deductions relate to amounts written off against the allowances for doubtful accounts and customer returns.

58
SIGNATURES
Pursuant to the requirements of Section 13 or 15(d) of the Securities Exchange Act of 1934, the registrant has duly caused this Report to be signed on its behalf by the undersigned, thereunto duly authorized.
POWER INTEGRATIONS, INC.
/s/ JOHN M COBB Dated: March 10, 2004 By: ______________________________________
John M. Cobb Chief Financial Officer

59
POWER OF ATTORNEY
KNOW ALL PERSONS BY THESE PRESENTS, that each person whose signature appears below constitutes and appoints Balu Balakrishnan and John M. Cobb his true and lawful attorney-in-fact and agent, with full power of substitution and, for him and in his name, place and stead, in any and all capacities to sign any and all amendments to this Report on Form 10-K, and to file the same, with all exhibits thereto and other documents in connection therewith, with the Securities and Exchange Commission, granting unto said attorney-in-fact and agent full power and authority to do and perform each and every act and thing requisite and necessary to be done in connection therewith, as fully to all intents and purposes as he might or could do in person, hereby ratifying and confirming all that said attorney-in-fact and agent, or his substitute or substitutes, may lawfully do or cause to be done by virtue hereof. PURSUANT TO THE REQUIREMENTS OF THE SECURITIES EXCHANGE ACT OF 1934, THIS REPORT HAS BEEN SIGNED BY THE FOLLOWING PERSONS ON BEHALF OF THE REGISTRANT AND IN THE CAPACITIES AND ON THE DATES INDICATED. /s/ BALU BALAKRISHNAN Dated: March 10, 2004 By: Balu Balakrishnan President, Chief Executive Officer (Principal Executive Officer) /s/ JOHN M. COBB Dated: March 10, 2004 By: John M. Cobb Chief Financial Officer (Principal Financial and Principal Accounting Officer) /s/ HOWARD F. EARHART Dated: March 10, 2004 By: Howard F. Earhart Chairman of the Board /s/ ALAN D. BICKELL Dated: March 10, 2004 By: Alan D. Bickell Director
/s/ NICHOLAS E. BRATHWAITE Dated: March 10, 2004 By: Nicholas E. Brathwaite Director
/s/ R. SCOTT BROWN Dated: March 10, 20034 By: R. Scott Brown Director
/s/ E. FLOYD KVAMME Dated: March 10, 2004 By: E. Floyd Kvamme Director

60
/s/ STEVEN J. SHARP Dated: March 10, 2004 By: Steven J. Sharp Director /s/ BALAKRISHNAN S. IYER Dated: March 10, 2004 By: Balakrishnan S. Iyer Director
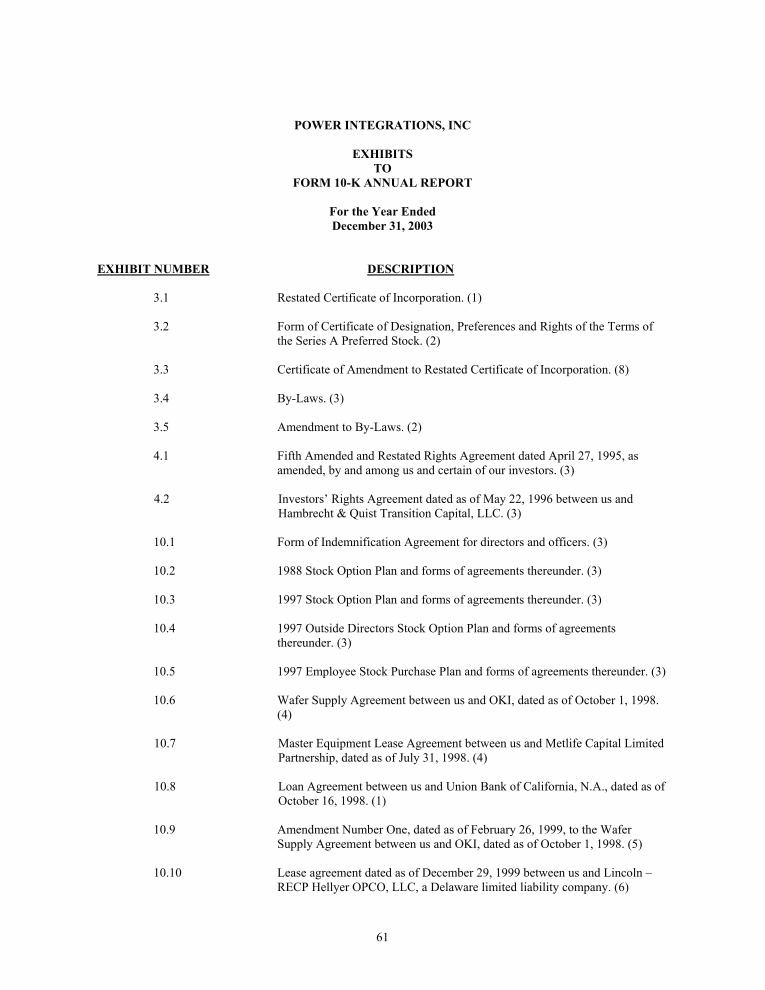
61
POWER INTEGRATIONS, INC
EXHIBITS TO
FORM 10-K ANNUAL REPORT
For the Year Ended December 31, 2003
EXHIBIT NUMBER DESCRIPTION
3.1 Restated Certificate of Incorporation. (1)
3.2 Form of Certificate of Designation, Preferences and Rights of the Terms of the Series A Preferred Stock. (2)
3.3 Certificate of Amendment to Restated Certificate of Incorporation. (8) 3.4 By-Laws. (3)
3.5 Amendment to By-Laws. (2) 4.1 Fifth Amended and Restated Rights Agreement dated April 27, 1995, as
amended, by and among us and certain of our investors. (3) 4.2 Investors’ Rights Agreement dated as of May 22, 1996 between us and
Hambrecht & Quist Transition Capital, LLC. (3) 10.1 Form of Indemnification Agreement for directors and officers. (3) 10.2 1988 Stock Option Plan and forms of agreements thereunder. (3) 10.3 1997 Stock Option Plan and forms of agreements thereunder. (3) 10.4 1997 Outside Directors Stock Option Plan and forms of agreements
thereunder. (3) 10.5 1997 Employee Stock Purchase Plan and forms of agreements thereunder. (3)
10.6 Wafer Supply Agreement between us and OKI, dated as of October 1, 1998.
(4) 10.7 Master Equipment Lease Agreement between us and Metlife Capital Limited
Partnership, dated as of July 31, 1998. (4) 10.8 Loan Agreement between us and Union Bank of California, N.A., dated as of
October 16, 1998. (1) 10.9 Amendment Number One, dated as of February 26, 1999, to the Wafer
Supply Agreement between us and OKI, dated as of October 1, 1998. (5) 10.10 Lease agreement dated as of December 29, 1999 between us and Lincoln –
RECP Hellyer OPCO, LLC, a Delaware limited liability company. (6)
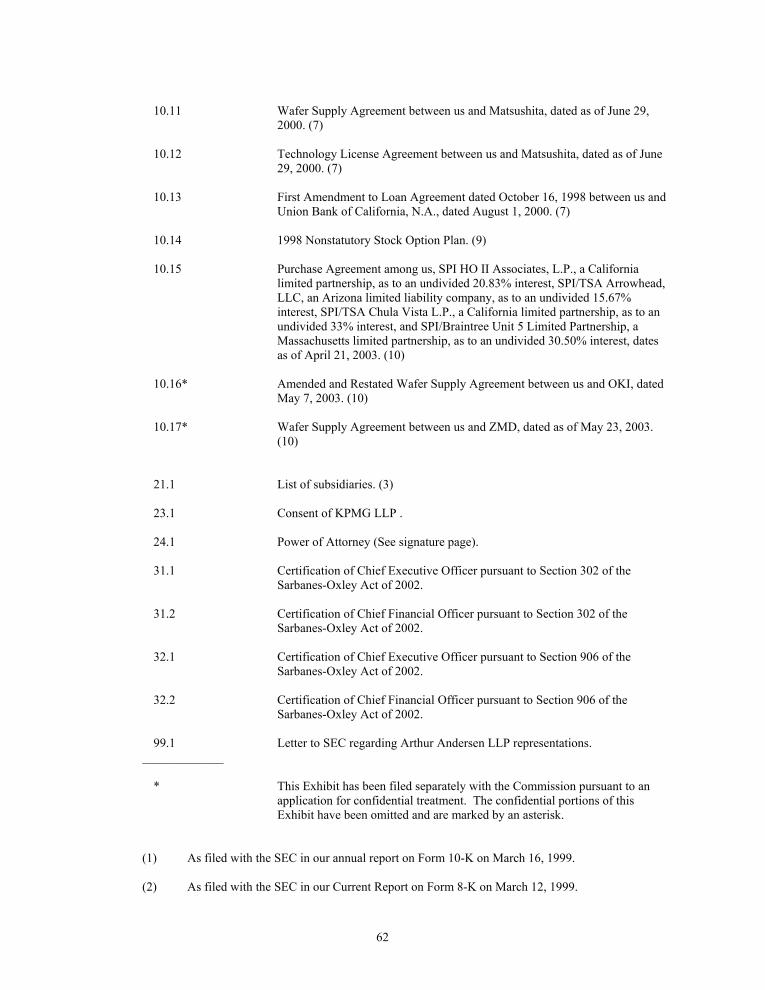
62
10.11 Wafer Supply Agreement between us and Matsushita, dated as of June 29,
2000. (7) 10.12 Technology License Agreement between us and Matsushita, dated as of June
29, 2000. (7) 10.13 First Amendment to Loan Agreement dated October 16, 1998 between us and
Union Bank of California, N.A., dated August 1, 2000. (7) 10.14 1998 Nonstatutory Stock Option Plan. (9) 10.15 Purchase Agreement among us, SPI HO II Associates, L.P., a California
limited partnership, as to an undivided 20.83% interest, SPI/TSA Arrowhead, LLC, an Arizona limited liability company, as to an undivided 15.67% interest, SPI/TSA Chula Vista L.P., a California limited partnership, as to an undivided 33% interest, and SPI/Braintree Unit 5 Limited Partnership, a Massachusetts limited partnership, as to an undivided 30.50% interest, dates as of April 21, 2003. (10)
10.16* Amended and Restated Wafer Supply Agreement between us and OKI, dated
May 7, 2003. (10) 10.17* Wafer Supply Agreement between us and ZMD, dated as of May 23, 2003.
(10)
21.1 List of subsidiaries. (3) 23.1 Consent of KPMG LLP . 24.1 Power of Attorney (See signature page). 31.1 Certification of Chief Executive Officer pursuant to Section 302 of the
Sarbanes-Oxley Act of 2002. 31.2 Certification of Chief Financial Officer pursuant to Section 302 of the
Sarbanes-Oxley Act of 2002. 32.1 Certification of Chief Executive Officer pursuant to Section 906 of the
Sarbanes-Oxley Act of 2002. 32.2 Certification of Chief Financial Officer pursuant to Section 906 of the
Sarbanes-Oxley Act of 2002.
99.1 Letter to SEC regarding Arthur Andersen LLP representations. _____________
* This Exhibit has been filed separately with the Commission pursuant to an application for confidential treatment. The confidential portions of this Exhibit have been omitted and are marked by an asterisk.
(1) As filed with the SEC in our annual report on Form 10-K on March 16, 1999.
(2) As filed with the SEC in our Current Report on Form 8-K on March 12, 1999.
63
(3) As filed with the SEC in our Registration Statement on Form S-1 on September 11, 1997. (4) As filed with the SEC in our quarterly report on Form 10-Q on November 10, 1998. (5) As filed with the SEC in our quarterly report on Form 10-Q on May 10, 1999. (6) As filed with the SEC in our annual report on Form 10-K on March 29, 2000. (7) As filed with the SEC in our quarterly report on Form 10-Q on November 10, 2000. (8) As filed with the SEC in our annual report on Form 10-K on March 22, 2002.
(9) As filed with the SEC in our quarterly report on Form 10-Q on May 12, 2003. (10) As filed with the SEC in our quarterly report on Form 10-Q on August 7, 2003.
64
EXHIBIT 23.1
CONSENT OF KPMG LLP
The Board of Directors Power Integrations, Inc.:
We consent to the incorporation by reference in the registration statements (Nos. 333-112135, 333-102676, 333-42194, 333-56381, 333-69871, 333-83083, 333-59564, and 333-86270) on Form S-8 of Power Integrations, Inc. of our report dated January 22, 2004, with respect to the consolidated balance sheets of Power Integrations, Inc. and subsidiaries as of December 31, 2003 and 2002, and the related consolidated statements of income, stockholders’ equity and cash flows for each of the years in the two-year period ended December 31, 2003, and the related financial statement schedule, which report appears in this December 31, 2003 annual report on Form 10-K of Power Integrations, Inc. /s/ KPMG LLP Mountain View, California March 9, 2004

65
EXHIBIT 31.1
CERTIFICATION OF CHIEF EXECUTIVE OFFICER I, Balu Balakrishnan, Chief Executive Officer of the registrant, certify that:
1. I have reviewed this annual report on Form 10-K of Power Integrations, Inc.; 2. Based on my knowledge, this report does not contain any untrue statement of a material fact or omit to state a material fact necessary to make the statements made, in light of the circumstances under which such statements were made, not misleading with respect to the period covered by this report; 3. Based on my knowledge, the financial statements, and other financial information included in this report, fairly present in all material respects the financial condition, results of operations and cash flows of the registrant as of, and for, the periods presented in this report; 4. The registrant’s other certifying officer and I are responsible for establishing and maintaining disclosure controls and procedures (as defined in Exchange Act Rules 13a-15(e) and 15d-15(e)) for the registrant and have:
(a) Designed such disclosure controls and procedures, or caused such disclosure controls and procedures to be designed under our supervision, to ensure that material information relating to the registrant, including its consolidated subsidiaries, is made known to us by others within those entities, particularly during the period in which this report is being prepared; (b) Evaluated the effectiveness of the registrant’s disclosure controls and procedures and presented in this report our conclusions about the effectiveness of the disclosure controls and procedures, as of the end of the period covered by this report based on such evaluation; and (c) Disclosed in this report any change in the registrant’s internal control over financial reporting that occurred during the registrant’s most recent fiscal quarter that has materially affected, or is reasonably likely to materially affect, the registrant’s internal control over financial reporting; and
5. The registrant’s other certifying officer and I have disclosed, based on our most recent evaluation of internal control over financial reporting, to the registrant’s auditors and the audit committee of the registrant’s board of directors (or persons performing the equivalent functions):
(a) All significant deficiencies and material weaknesses in the design or operation of internal control over financial reporting which are reasonably likely to adversely affect the registrant’s ability to record, process, summarize and report financial information; and (b) Any fraud, whether or not material, that involves management or other employees who have a significant role in the registrant’s internal control over financial reporting.
/s/ BALU BALAKRISHNAN Dated: March 10, 2004 By: ______________________________________
Balu Balakrishnan Chief Executive Officer

66
EXHIBIT 31.2
CERTIFICATION OF CHIEF FINANCIAL OFFICER
I, John M. Cobb, Chief Financial Officer of the registrant, certify that:
1. I have reviewed this annual report on Form 10-K of Power Integrations, Inc.; 2. Based on my knowledge, this report does not contain any untrue statement of a material fact or omit to state a material fact necessary to make the statements made, in light of the circumstances under which such statements were made, not misleading with respect to the period covered by this report; 3. Based on my knowledge, the financial statements, and other financial information included in this report, fairly present in all material respects the financial condition, results of operations and cash flows of the registrant as of, and for, the periods presented in this report; 4. The registrant’s other certifying officer and I are responsible for establishing and maintaining disclosure controls and procedures (as defined in Exchange Act Rules 13a-15(e) and 15d-15(e)) for the registrant and have:
(a) Designed such disclosure controls and procedures, or caused such disclosure controls and procedures to be designed under our supervision, to ensure that material information relating to the registrant, including its consolidated subsidiaries, is made known to us by others within those entities, particularly during the period in which this report is being prepared; (b) Evaluated the effectiveness of the registrant’s disclosure controls and procedures and presented in this report our conclusions about the effectiveness of the disclosure controls and procedures, as of the end of the period covered by this report based on such evaluation; and (c) Disclosed in this report any change in the registrant’s internal control over financial reporting that occurred during the registrant’s most recent fiscal quarter that has materially affected, or is reasonably likely to materially affect, the registrant’s internal control over financial reporting; and
5. The registrant’s other certifying officer and I have disclosed, based on our most recent evaluation of internal control over financial reporting, to the registrant’s auditors and the audit committee of the registrant’s board of directors (or persons performing the equivalent functions):
(a) All significant deficiencies and material weaknesses in the design or operation of internal control over financial reporting which are reasonably likely to adversely affect the registrant’s ability to record, process, summarize and report financial information; and (b) Any fraud, whether or not material, that involves management or other employees who have a significant role in the registrant’s internal control over financial reporting.
/s/ JOHN M. COBB Dated: March 10, 2004 By: ______________________________________
John M. Cobb Chief Financial Officer
67
EXHIBIT 32.1
CERTIFICATION OF CHIEF EXECUTIVE OFFICER
CERTIFICATION PURSUANT TO 18 U.S.C. SECTION 1350, AS ADOPTED PURSUANT TO SECTION 906 OF THE SARBANES-OXLEY ACT OF 2002
In connection with the Annual Report of Power Integrations, Inc. (the Company) on Form 10-K for the year ended December 31, 2003, as filed with the Securities and Exchange Commission on the date hereof (the “Report”), I, Balu Balakrishnan, Chief Executive Officer of the Company, certify, pursuant to 18 U.S.C. Section 1350, as adopted pursuant to Section 906 of the Sarbanes-Oxley Act of 2002 (“Section 906”), that:
(1) The Report fully complies with the requirements of section 13(a) of the Securities Exchange Act of 1934 (15 U.S.C. 78m); and
(2) The information contained in the Report fairly presents, in all material respects, the financial
condition and results of operations of the Company.
/s/ BALU BALAKRISHNAN
Dated: March 10, 2004 By: ______________________________________ Balu Balakrishnan
Chief Executive Officer
A signed original of this written statement required by Section 906, or other document authenticating, acknowledging, or otherwise adopting the signature that appears in typed form within the electronic version of this written statement required by Section 906, has been provided to the Registrant and will be retained by the Registrant and furnished to the Securities and Exchange Commission or its staff upon request.
68
EXHIBIT 32.2
CERTIFICATION OF CHIEF FINANCIAL OFFICER
CERTIFICATION PURSUANT TO 18 U.S.C. SECTION 1350, AS ADOPTED PURSUANT TO SECTION 906 OF THE SARBANES-OXLEY ACT OF 2002
In connection with the Annual Report of Power Integrations, Inc. (the Company) on Form 10-K for the year ended December 31, 2003, as filed with the Securities and Exchange Commission on the date hereof (the “Report”), I, John M. Cobb, Chief Financial Officer of the Company, certify, pursuant to 18 U.S.C. Section 1350, as adopted pursuant to Section 906 of the Sarbanes-Oxley Act of 2002 (“Section 906”), that:
(1) The Report fully complies with the requirements of section 13(a) of the Securities Exchange Act of 1934 (15 U.S.C. 78m); and
(2) The information contained in the Report fairly presents, in all material respects, the financial
condition and results of operations of the Company.
/s/ JOHN M. COBB
Dated: March 10, 2004 By: ______________________________________ John M. Cobb
Chief Financial Officer
A signed original of this written statement required by Section 906, or other document authenticating, acknowledging, or otherwise adopting the signature that appears in typed form within the electronic version of this written statement required by Section 906, has been provided to the Registrant and will be retained by the Registrant and furnished to the Securities and Exchange Commission or its staff upon request.
69
EXHIBIT 99.1
[POWER INTEGRATIONS, INC. LETTERHEAD]
March 21, 2002 United States Securities and Exchange Commission 450 Fifth Street, N.W. Washington, D.C. 20549 Ladies and Gentlemen: This letter is to inform you that Arthur Andersen LLP (“Andersen”) has represented to us that: The audit of the consolidated financial statements as of December 31, 2001 and for the year then ended was subject to Andersen’s quality control system for the U.S. accounting and auditing practice to provide reasonable assurance that the engagement was conducted in compliance with professional standards and that there was appropriate continuity of Andersen personnel working on the audit and availability of national office consultation. Availability of personnel at foreign affiliates of Andersen is not relevant to this audit. Sincerely, POWER INTEGRATIONS, INC. By: /s/ JOHN M. COBB John M. Cobb, Chief Financial Officer
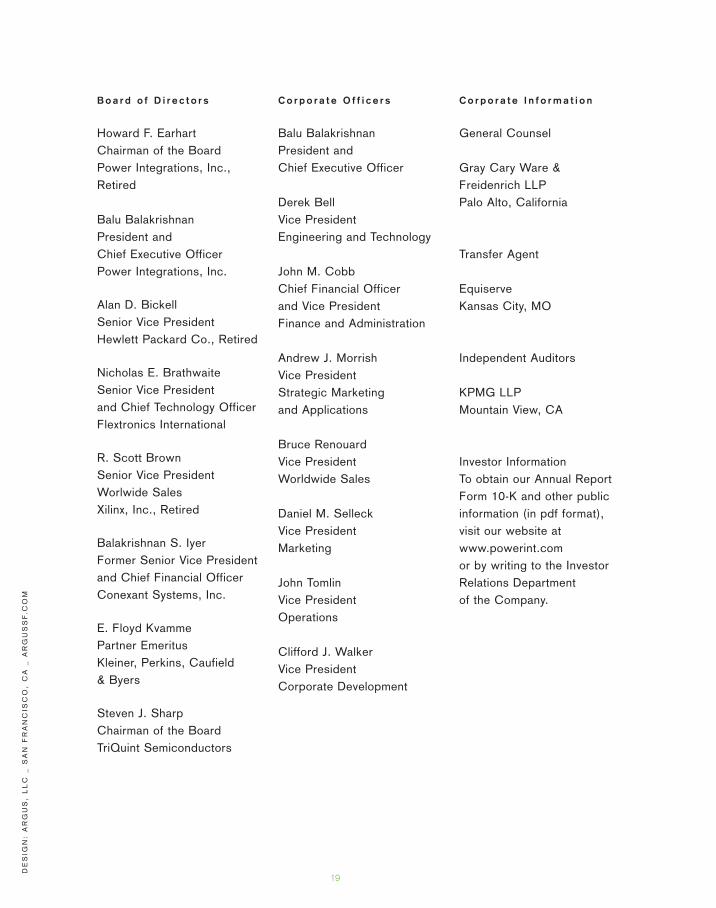
1919
B o a r d o f D i r e c t o r s
Howard F. EarhartChairman of the Board Power Integrations, Inc.,Retired
Balu Balakrishnan President and Chief Executive OfficerPower Integrations, Inc.
Alan D. BickellSenior Vice President Hewlett Packard Co., Retired
Nicholas E. BrathwaiteSenior Vice President and Chief Technology OfficerFlextronics International
R. Scott BrownSenior Vice PresidentWorlwide SalesXilinx, Inc., Retired
Balakrishnan S. IyerFormer Senior Vice Presidentand Chief Financial OfficerConexant Systems, Inc.
E. Floyd KvammePartner EmeritusKleiner, Perkins, Caufield & Byers
Steven J. SharpChairman of the BoardTriQuint Semiconductors
C o r p o r a t e O f f i c e r s
Balu Balakrishnan President and Chief Executive Officer
Derek BellVice PresidentEngineering and Technology
John M. Cobb Chief Financial Officer and Vice President Finance and Administration
Andrew J. MorrishVice PresidentStrategic Marketing and Applications
Bruce Renouard Vice PresidentWorldwide Sales
Daniel M. Selleck Vice PresidentMarketing
John Tomlin Vice PresidentOperations
Clifford J. Walker Vice PresidentCorporate Development
C o r p o r a t e I n f o r m a t i o n
General Counsel
Gray Cary Ware & Freidenrich LLPPalo Alto, California
Transfer Agent
Equiserve Kansas City, MO
Independent Auditors
KPMG LLPMountain View, CA
Investor InformationTo obtain our Annual ReportForm 10-K and other public information (in pdf format),visit our website at www.powerint.com or by writing to the InvestorRelations Department of the Company.
DE
SIG
N:
AR
GU
S,
LL
C _
SA
N F
RA
NC
ISC
O,
CA
_ A
RG
US
SF
.CO
M

2020
C o r p o r a t e H e a d q u a r t e r s
Power Interations, Inc.5245 Hellyer Ave.San Jose, CA 951381-408-414-9200
U n i t e d K i n g d o m
Power Integrations Europe Ltd1st Floor, St. Jame’s HouseEast Street, FarnhamSurrey, GU9 7TJUnited Kingdom44-1252-730-140
I t a l y
Power Integrations Italy S.r.lVia Vittorio Veneto 1220091 Bresso MIItaly39-028-928-6000
G e r m a n y
Power Integrations GmbHRueckerstrasse 3D-80336 MuenchenGermany49-895-527-3910
K o r e a
Power Integrations Netherlands B.V., Korea Branch8th Floor, DongSung Bldg17-8, Yoido-dong, Youngdeungpo-guSeoul, 150-874, Korea82-2-782-2840
Ta i w a n
Power Integrations Netherlands B.V., Taiwan Branch5F-1,No.316, Nei Hu Rd., Sec.1Nei Hu Dist.Taipei, Taiwan 114886-2-2659-0949
C h i n a / H o n g K o n g
Power Integrations Netherlands B.V. - ShenzhenRepresentative OfficeRm 1705, BlackA, Bao Hua Bldg.,1016 Hua Qiang Bei Lu,Shenzhen, Guangdong, P.R.C. 51803186-755-8367-5143
Power Integrations Netherlands B.V. - ShanghaiRepresentative OfficeRm807-808A, Pacheer CommercialCentre, 555 Nanjing West Rd.Shanghai, P.R.C. 20004186-755-8367-5143
S i n g a p o r e
Power Integrations, Singapore Pte. Ltd51 Newton Road,#15-08/10 Goldhill PlazaSingapore, 30890065-6358-2160
I n d i a
Innovatech261/A, Ground Floor7th Main, 17th CrossSadashivanagaBangalore, India 56008091-80-5113-8020
J a p a n
Power Integrations, K.K.Keihin-Tatemono 1st Bldg Shin-Yokohama2-12-20 Kohoku-ku,Yokohama-shi Kanagawa,Japan 222-0033
P o w e r I n t e g r a t i o n s , I n c . is the leading supplier of high-voltage analog integrated circuits (ICs) used in powerconversion. The company’s suite of energy-friendly ICs enables electronics, appliance and power supply manufacturersto cost effectively produce a new class of smaller, lighter, cheaper and simpler power supplies.
Power supplies also benefit from the company’s patented EcoSmart® technology, which dramatically improves theirenergy efficiency and allows manufacturers to meet all current and proposed worldwide energy standards.