2005 southland transport study
TRANSCRIPT

December 2005
Southland IntegratedTransport Study
Final Report
51/22078//Southland TransportStudy V24
Southland Integrated Transport Study
Contents
Executive Summary 1
1. Introduction 7
1.1 Study Objectives 7
1.2 Scope of the Study 7
1.3 Data Collection and Stakeholder Consultation 8
1.4 Report Structure 9
2. Setting the Scene 10
2.1 Southland 10
2.2 Population and demographics 11
2.3 Existing economic environment 13
2.4 Tourism 15
2.5 Requirements for an efficient transport system 16
2.6 Key Transport Issues 17
3. Roading 19
3.1 Background 19
3.2 Roading Hierarchy 20
3.3 Economic Importance of the Road Network 20
3.4 Southland District Council 21
3.5 Gore District Council 21
3.6 Invercargill City Council 22
3.7 Transit New Zealand 22
3.8 Transport Safety 24
3.9 State Highway 6 25
3.10 State Highway 94 – Milford Road 25
3.11 Traffic Volumes 25
3.12 Heavy Vehicles 25
3.13 Ageing Roading Network 26
3.14 Tourism Traffic 27
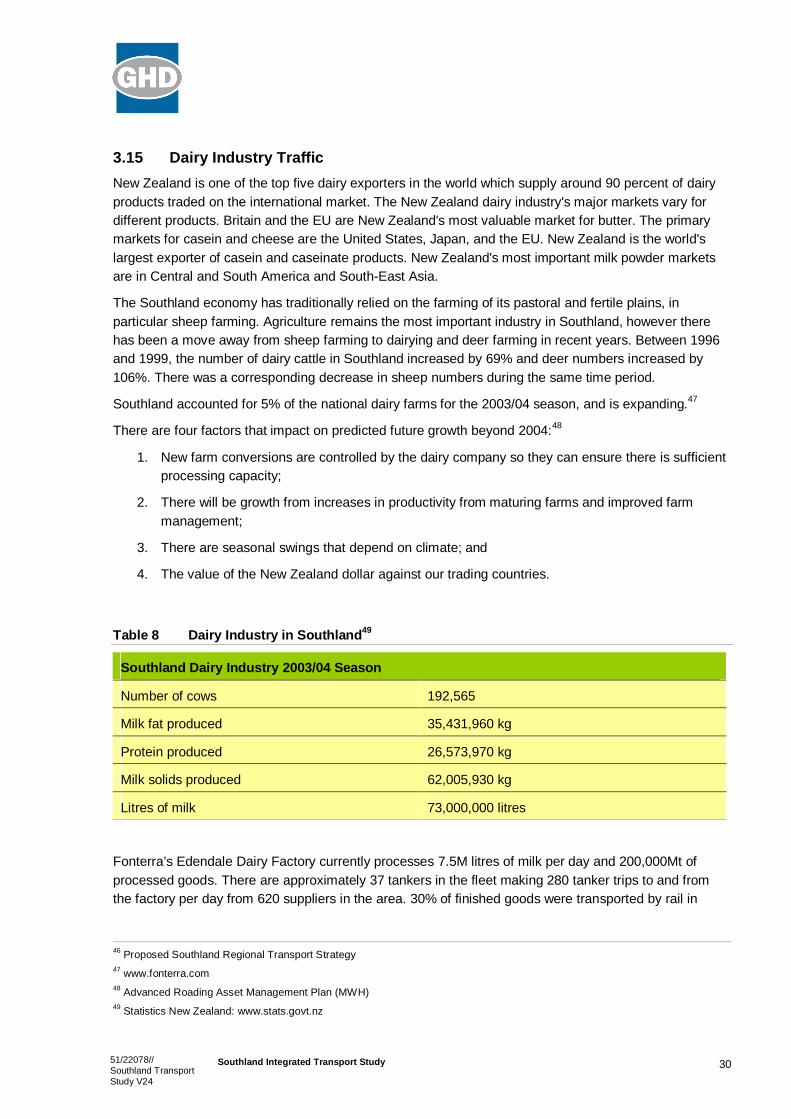
3.15 Dairy Industry Traffic 30
3.16 Forestry Industry Traffic 32
3.17 Livestock Traffic 37
3.18 Mining Traffic 39

51/22078//Southland TransportStudy V24
Southland Integrated Transport Study
3.19 Bridges 42
3.20 Milford Road (State Highway 94) 43
3.21 Stewart Island 44
4. Passenger Transport 47
4.1 Invercargill City Passenger Transport 49
5. Cyclists and Pedestrians 50
5.1 Walking 50
5.2 Cycling 51
6. Rail 53
6.1 The Ohai Line 55
6.2 The Main South Line 56
6.3 New Developments 56
6.4 Bluff Line 57
7. Shipping 58
7.1 Shipping in the Southland Region 61
7.2 South Port (Bluff) 62
8. Airports 67
8.1 Background 67
8.2 Current Situation 68
9. Industry Commodity Flows 70
9.1 Introduction 70
9.2 Methodology 70
9.3 Summary of Analysis 77
10. Roading Hierarchy 79
10.1 Current situation 79
10.2 Road Classification Definition 79
10.3 Discussion 80
10.4 Recommendations 81
11. Transport Business Case 82
11.1 Overview 82
11.2 Funding Options 83
11.3 Business Case 85
51/22078//Southland TransportStudy V24
Southland Integrated Transport Study
11.4 Business Case Summary 96
12. Land Transport Management Act 2003 Requirements 99
13. Recommendations 101
13.1 Funding 103
13.2 Integrated Transport Options 103
13.3 Recommended Future Work 103
Table IndexTable 1 Estimated Costs of Projects 4Table 2 Affordability 5Table 3 Funding of projects 6Table 4 Urban and Rural Population Distribution for
Southland 12Table 5 Car ownership in Southland by Household –
Census 2001 13Table 6 Local Roads – Physical Statistics as at 30 June
2004 20Table 7 Southland’s Tourism Figures (2003) 27Table 8 Dairy Industry in Southland 30Table 9 Area age/Class Distribution as at 1 April 2003 33Table 10 Species of Planted Production Forest in Southland,
1 April 2001 33Table 11 New Zealand’s Recoverable Coal Reserves 39Table 12 New Zealand Ports 58Table 13 Council Subsidy Benchmark 92Table 14 Estimated Costs of Projects 96Table 15 Current Management Strategies 97Table 16 Affordability 97Table 17 Priority Action Plan 101
Figure IndexFigure 1 Urban / Rural Profile Categories for Southland 11Figure 2 Regional Economic Activity – Year on year growth 14Figure 3 Key Issues in the Southland Region 17Figure 5 Southland Indicative Traffic Volumes 26Figure 6 Southern Scenic Route 29
51/22078//Southland TransportStudy V24
Southland Integrated Transport Study
Figure 7 Timber Production In New Zealand (Plantation andindigenous) 32
Figure 8 Wood Milling and Processing Plants 35Figure 9 Forest Plantings in Southland 36Figure 10 New Zealand Farm Land by Farm Type 38Figure 12 Southland Mining Developments 41Figure 13 Southland Rail Network 55Figure 14 Major New Zealand Ports 60Figure 18 Southland District Ward Network 71Figure 19 Forestry Industry Land Use 71Figure 20 Dairy Industry Land Use 72Figure 21 Livestock Industry Land Use 72Figure 22 Wool Industry Land Use 72Figure 23 Fertiliser Use 73Figure 24 Southland Roading Network 73Figure 25 Southland Roading Network 74Figure 26 Forestry Industry Commodity Flows 74Figure 27 Dairy Industry Commodity Flows 75Figure 28 Fertiliser Industry Commodity Flows 75Figure 29 Wool Industry Commodity Flows 76Figure 30 Livestock Industry Commodity Flows 76Figure 31 Total Heavy Traffic Movements 77Figure 32 Commodity flow effects on networks 77Figure 33 Southland Roading Hierarchy 80Figure 34 Shares of nominal national GDP (yaxis) and
regional GDP (xaxis), averaged across Marchyears 20002004 85
Figure 35 Rank ordering of Territorial Local Authorities (TLAs)by different descriptors 90
Figure 36: SDC Roading Expenditure and Income 93Figure 37: Road Network Expenditure: High Risk Scenario 94Figure 38 Forecasts of Expenditure on Maintenance and
Improvements – Southland Region 126
AppendicesA AbbreviationsB ReferencesC Consultation Process
51/22078//Southland TransportStudy V24
Southland Integrated Transport Study
D Roading HierarchyE Milford ReportF Heavy VehiclesG Southland District Council Asset Management Plan Graph 2004H Southland District Council Projected Pavement Strengthening
HistogramsI Tiwai Bridge ReportJ Southland District Council Commodity Flow Analysis Schematic
DiagramK Commodity Flow DiagramsL Regional Funding 20042014M National Stakeholder Strategies and PlansN Annual Plans, District Plans, Long Term Council Community PlansO National Land Transport Programme 2005/06 Factsheet
151/22078//Southland TransportStudy V24
Southland Integrated Transport Study
Executive Summary
Venture Southland, on behalf of Environment Southland, Invercargill City Council, Southland DistrictCouncil, Gore District Council, Transit New Zealand, South Port and OnTrack commissioned GHD Ltd toassess the current situation of Southland’s transport network and provide an integrated transport studyfor the region. Recent studies1 confirm and indications show that transport infrastructure problems thatare currently evident are now being accentuated by growth in key industry sectors. Investigations predictthat the Tiwai Bridge and Southland road network will be facing acute transport investment demands inthe immediate future. Additionally, tourism growth is placing significant pressure on the Milford Road(State Highway 94).
The study comprised three principal stages. Stage one involved the review of information andconfirmation of the issues (Southland Integrated Transport Scoping Study) and consultation with keystakeholders. Stage two involved further consultation, investigation of specific projects, the developmentof options to address the issues, the development of a priority action plan and the compilation of a draftreport. Stage three involved consultation on the draft report with the client group, the development offunding business cases and the submission of this final report.
Southland Transportation Network: Background
The Southland region has one main port, South Port New Zealand Ltd, located at Bluff. It also has anumber of smaller ports, primarily used for tourism and fishing, these are located at Milford Sound,Waikawa, Riverton and Oban (Stewart Island).
South Port is approximately 27 km south from Invercargill. The port is reliant on good rail and roadtransport links for receipt and delivery of freight.
Road travel is the most significant mode of transport with Southland being more reliant on road freighttransport than New Zealand as a whole.2
There are 7,186 km of road in the Southland Region, 1076 bridges, 486 of which are single lane and 42of which have posted weight restrictions3. The Region’s roads are owned and maintained by SouthlandDistrict Council (SDC), Gore District Council (GDC), and Invercargill City Council (ICC), with the StateHighways being maintained by Transit New Zealand. The SDC’s roading network is the most extensiveof all districts within New Zealand with several state highways linking areas of strategic importance.
There are three rail lines in Southland, the main trunk line which runs north from Invercargill to Dunedin,the Ohai Line which services the coal mine at Ohai and the freezing works at Makarewa, and the Bluffline which predominately services South Port. The Ohai and Bluff lines intersect with the main trunk lineat Invercargill. With the exception of the tourist line in northern Southland at Kingston to Fairlight, all railtraffic in Southland is concerned with the carriage of goods and cargo rather than passenger services.
Southland has one main airport, Invercargill Airport, which is presently used primarily for passengertransport to and from Christchurch as well as small amounts of airfreight. It also offers an alternativeshould weather close Queenstown airport. Air New Zealand operates regular scheduled services.Stewart Island Flights offers regular scheduled services to Stewart Island. Manapouri and Milford Sound
1 Southland Integrated Transport Scoping Study, 20042 Road Freight – Its Significance for Regional Economics, April 20033 Southland Integrated Transport Scoping Study, 2004
251/22078//Southland TransportStudy V24
Southland Integrated Transport Study
airports also operate regular services, mainly for tourismbased travel, with Manapouri offering directcharters from Christchurch to the Fiordland region.
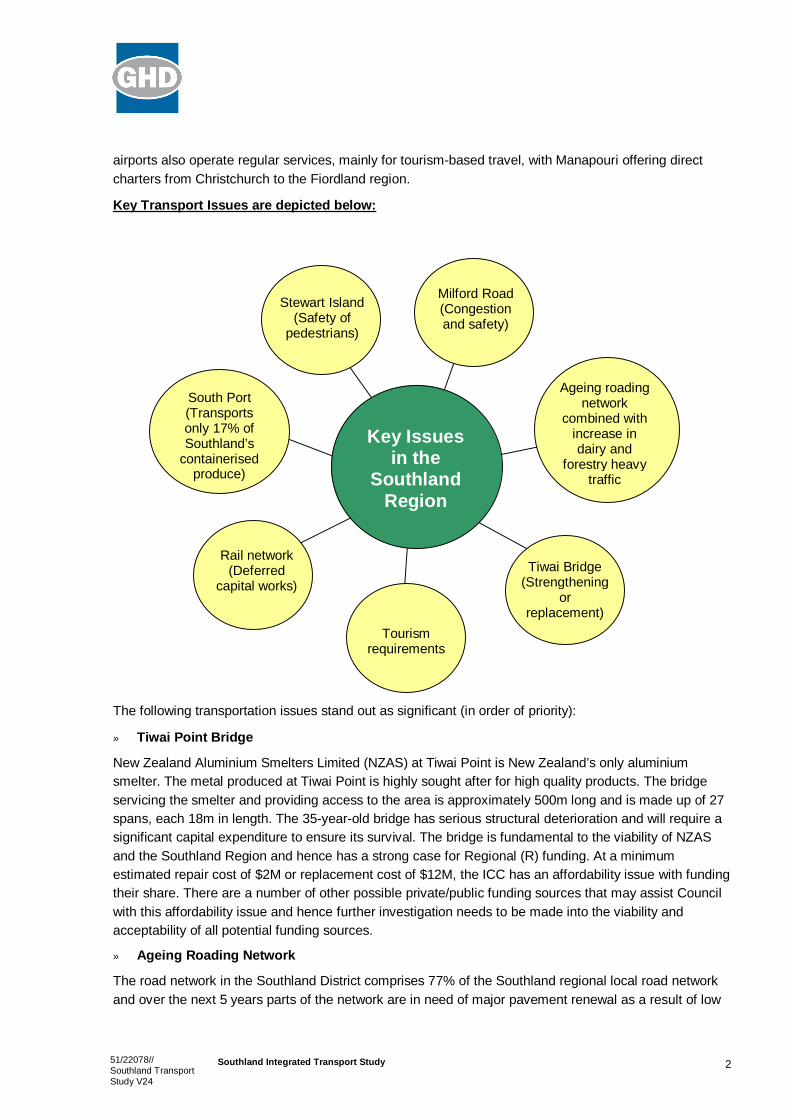
Key Transport Issues are depicted below:
The following transportation issues stand out as significant (in order of priority):
» Tiwai Point Bridge
New Zealand Aluminium Smelters Limited (NZAS) at Tiwai Point is New Zealand’s only aluminiumsmelter. The metal produced at Tiwai Point is highly sought after for high quality products. The bridgeservicing the smelter and providing access to the area is approximately 500m long and is made up of 27spans, each 18m in length. The 35yearold bridge has serious structural deterioration and will require asignificant capital expenditure to ensure its survival. The bridge is fundamental to the viability of NZASand the Southland Region and hence has a strong case for Regional (R) funding. At a minimumestimated repair cost of $2M or replacement cost of $12M, the ICC has an affordability issue with fundingtheir share. There are a number of other possible private/public funding sources that may assist Councilwith this affordability issue and hence further investigation needs to be made into the viability andacceptability of all potential funding sources.
» Ageing Roading Network
The road network in the Southland District comprises 77% of the Southland regional local road networkand over the next 5 years parts of the network are in need of major pavement renewal as a result of low
Key Issuesin the
SouthlandRegion
South Port(Transportsonly 17% ofSouthland’s
containerisedproduce)
Tourismrequirements
Tiwai Bridge(Strengthening
orreplacement)
Stewart Island(Safety of
pedestrians)
Rail network(Deferred
capital works)
Milford Road(Congestionand safety)
Ageing roadingnetwork
combined withincrease indairy and
forestry heavytraffic
351/22078//Southland TransportStudy V24
Southland Integrated Transport Study
strength sealed roads nearing the end of their lifecycle while being subjected to increasing numbers ofheavy vehicle traffic. Over 60% of the local roads remain unsealed, creating problems for safety andtransport efficiency. In addition there are 37 wooden bridges with weight restrictions4. The extent andbroad distribution of farming activities generates high percentages of heavy vehicle traffic on sealed nonarterial routes, places additional pressures on unsealed roads, with increased pavement deterioration onall roads. Over the next few years, it is predicted that a significant amount of funds will need to be spentto retain the current road level of service.5
There is an issue surrounding not only the age of the network but also the forecast volumes of traffic onthe roads as there is significant potential for stepped traffic growth around industries based on coal,lignite and gas. The lignite resources of the Southland Coal region make up 71% of New Zealand’srecoverable coal resources. In addition, growth in the tourism, dairy, pastoral farming and forestrysectors has, and will continue to, increase traffic volume on the roading network.
Southland District has low council revenue, but high road spending. The district also has a low populationrelative to its land area and low population growth. As a Local Authority Funding Issues Report6 found,districts with issues such as these are more likely to have affordability funding issues. In addition to this,other areas such as the Far North District and Taranaki received substantial additional funds from theMED; hence the district has a strong business case for regional funding of its pavementstrengtheningprogramme.
» Milford Road
State Highway 94, the Milford Road, is the only land transport access corridor to Milford Sound in theFiordland National Park. As an iconic tourist destination, Milford Sound attracts high numbers of tourismtraffic, comprised of tour buses, campervans and private vehicles. The beauty of the Milford Roadcorridor itself is considered a major part of the Milford Sound experience, and needs to be maintained toa high standard of safety. Currently, on average, 800 vehicles travel along this route per day, 25% ofwhich are buses. At peak times during the day, the high quantity and combination of vehicles generatescongestion at viewing areas and certain sections along the Milford Road. It appears that a progressivemove to control traffic flows needs to occur over time. These options will still require the proposedhighway upgrades to provide a reduced traffic safety risk.
» Passenger Transport, Walking and Cycling
Passenger transport consists of long distance bus services, bus services within Invercargill and ferryservices between Bluff and Stewart Island. Ferry commuters (local residents) between South Port andStewart Island believe this service should be subsidised. There is a general lack of cycling networks inthe region. Road user and cyclist/pedestrian conflicts following the creation of the Rakiura National Parkare an issue particularly on Stewart Island, where conflicts continue to grow in parallel with tourismgrowth. Stewart Island requires funding to mitigate issues surrounding pedestrian and vehicle conflicts onthe roads.
» Rail
Coal is a significant product transported by rail. The Ohai line has a weight restriction of 16t and speedrestrictions with the line travelling over three substandard bridges, while parts of the line are prone to
4 Southland Integrated Transport Scoping Study, 20045 Southland Integrated Transport Scoping Study, 20046 Local Authority Funding Issues – Report of the Joint Central Government/Local Authority Funding Project Team, 2005

451/22078//Southland TransportStudy V24
Southland Integrated Transport Study
damage from flooding. As a result of these restrictions the rail network in Southland runs at belowcapacity creating transport inefficiencies. There is the potential for line upgrades and to transport otherbulk products, as an alternative to road freight.
» Ports
South Port is of regional significance to Southland and is one of 15 international oceangoing ports inNew Zealand. Good road and rail access to the port is essential. The South Port harbour entrance isrestricted to a maximum draft of 10 metres, thereby restricting larger ships from entering. There issignificant “leakage” of containers from the region with South Port capturing only 17% of the potentialtotal. With the current facilities provided at South Port there is capacity to handle larger volumes of cargo.
» Tourism
Tourist numbers are forecast to grow rapidly. In many parts of NZ, tourist traffic coexists with heavyfreight road traffic, for example around the Rotorua area. However Southland offers a ‘remote wilderness’experience to visitors and so for Southland, tourist road traffic is less compatible with heavy freight roadtraffic. While the volume of heavy vehicles on the road is not significant and it is well within the capacityof the road network, tourists find it uncomfortable (as do the locals) and it lessens the “SouthlandExperience” to share road space with heavy traffic. For foreign tourists the roads appear to be narrowand windy and not compatible with heavy traffic. Also, the option of extending the Milford Airport runwayshould be investigated, which would allow for larger and fewer planes to service Milford.
» Economic Development
When the ability to transport is not available, development is restricted. Financing a major projectrequires a high degree of certainty in major risk areas and freight transport is usually the second largestcost an industry faces. Uncertainty about capital costs, plans and designs, consents, and communityacceptability have the effect of undermining a venture at the financing stage. The maintenance of anefficient transport infrastructure is important, as without it this high performing region will experiencesignificant barriers to economic growth.
Recommendations:
1. Proceed with the following priority projects:
Table 1 Estimated Costs of Projects7
Issue Total $ required including grants
Tiwai Bridge
Replacement or
Strengthening
Minimum $12,000,000
Minimum $2,000,000
Milford Road – Relieve congestion Depends on selected option
Milford Road – Homer Tunnel Portal $18,000,000
7 See section 11.4.1 for more information on project costs

551/22078//Southland TransportStudy V24
Southland Integrated Transport Study
Issue Total $ required including grants
Southland DC AWT Programme $11,000,000
Stewart Island footpaths and walking tracksupgrades
$2,000,000
New or improved cycling and walkinginfrastructure
$50,000
Table 2 Affordability
Issue Key Drivers Impacts on Council/TransitNZ
Tiwai Bridge Replacement Assisting economicdevelopment
Affordability Issue with ICCunable to fund a project of thismagnitude.
Tiwai Bridge Strengthening Assisting economicdevelopment
Affordability Issue with ICCunable to fund a project of thismagnitude.
Milford Road – Relievecongestion
Increasing tourist numberslessening the visitor’sexperience (improving accessand mobility)
Pressure to improve safety andprovide improved infrastructure;funding priority and affordabilityissues.
Milford Road – Homer TunnelPortal
Safety concerns and high riskconsequences to touristindustry (assisting safety andpersonal security)
Threat to New Zealandreputation as a touristdestination; affordability impacton Transit, heightened risk ifdelayed.
Southland DC AWT Programme Early intervention will result in acost benefit to council and roadusers with improved transportefficiency (assisting economicdevelopment)
Affordability with significantimpact on ratepayers and roadusers if deferred.
Stewart Island footpaths andwalking tracks upgrades
Safety and improvedinfrastructure for tourists(assisting safety and personalsecurity)
Large impact on small ratepayer base for funding ofinfrastructure that servicesnational scenic attractions.
New or improved cycling andwalking infrastructure
Improving access and mobility Minor impact provided fundingprogrammed to match demandover several years.

651/22078//Southland TransportStudy V24
Southland Integrated Transport Study
Table 3 Funding of projects
Issue Suggested source of fundingbest fitting resolving thisissue
Reason for funding source
Tiwai Bridge Replacement R funding with privatecontribution to council share
Key component of roadingnetwork and of regionaleconomic importance
Tiwai Bridge Strengthening R funding with privatecontribution to council share
Key component of roadingnetwork and of regionaleconomic importance
Milford Road – Relievecongestion
N funding from LTNZ National importance of road tothe tourism industry and thenational economy
Milford Road – Homer TunnelPortal
N funding from LTNZ National importance of road tothe tourism industry and thenational economy
Southland DC AWT Programme MED funding or R funding fromLTNZ (Construction subsidyrate = 82.5%)
Regional economicimportance; remove barrier toeconomic growth
Stewart Island footpaths andwalking tracks upgrades
R funding from LTNZ Regional significance andsafety improvement
New or improved cycling andwalking infrastructure
N funding from LTNZ Part of normal programmedworks
2. Roading Hierarchy:
A regionwide hierarchy needs to be agreed with universal levels of service provided. Traffic should bediscouraged from using parts of the hierarchy that do not match the stated function. Planning controls onlanduse/access need to reinforce and maintain the road hierarchy.

751/22078//Southland TransportStudy V24
Southland Integrated Transport Study
1. Introduction
1.1 Study ObjectivesThe ability to sustain and expand existing industry and attract new industry to the region is heavilydependant on a reliable and effective transportation network. Recent studies8 have confirmed that in thefuture, if maintenance issues are deferred on the transportation network in the Southland region then thetransportation network in the Southland region will be a major barrier to regional and national economicgrowth.
Venture Southland, on behalf of Environment Southland, Invercargill City Council, Southland DistrictCouncil, Gore District Council, Transit New Zealand, South Port and OnTrack have contracted GHD toinvestigate and prepare the Southland Integrated Transport Study, the overall purpose of this study beingto identify an appropriate Regional Integrated Transportation Network.
The study examines the major transportation issues identified by stakeholders, the extent of challengesfacing owners of the transportation infrastructure, and provides recommendations with regard tonecessary mitigating actions. Additionally, the project aimed to identify issues associated with theexisting transportation network (road, rail, shipping, airports and cyclists/pedestrians), investigate optionsto address these issues, update industry consultation and investigate funding requirements for thetransport options. This project is part of a coordinated effort to provide background information for abusiness case, to Land Transport New Zealand (LTNZ) and the Ministry for Economic Development, thatresponds to current and future transport demands in the Southland region.
1.2 Scope of the StudyThe Integrated Transport Study will:
» Identify the networks and transport facilities required (airport, port, freight transfer areas etc) tomeet forecast demand;
» Set out the most efficient manner of ensuring transport investment meets the objectives of the NewZealand Transport Strategy;
» Address how capital works should be funded and, where affordability is an issue, how funding theshortfall should be addressed;
» Give consideration to LTNZ regional funding (R funding) and determine how regional prioritiesmight be established for maintenance and capital works;
» Review Southland’s transport infrastructure including air, land and sea;
» Identify the constraints or barriers (if any) for regional economic development caused by ageing orinefficient transport networks or by other factors;
» Investigate Southland’s regional advantage/disadvantages in regard to its transport system andability to meet project future demand;
» Investigate safety issues which may arise for all transport users;
8 Southland Integrated Transport Scoping Study

851/22078//Southland TransportStudy V24
Southland Integrated Transport Study
» Identify the range of options for more effectively integrating Southland’s transport networks andmodes to meet industry and sector demand; and
» Assess current and future demand of transport modes.
The study also identifies the potential environmental, social, cultural, community and economicdevelopment impacts and opportunities associated with:
» Increased road usage;
» Projected growth in tourism, forestry and dairy sectors;
» Increased demand for international air services;
» Local rail networks and terminus facilities; and
» Coastal and international sea freight services.
1.3 Data Collection and Stakeholder ConsultationIn order to prepare this report, information was gathered in two ways. Existing information and reportswere sourced from Councils and other agencies and reviewed for relevant information, and consultationwas undertaken with identified stakeholders. Information from both these sources was used in thedevelopment of this report.
1.3.1 Existing Information
Information was sourced from a number of agencies and a full list of references is included withinAppendix B of this report. Given the length of the study period it is possible new information has becomeavailable or existing information has been updated. Where possible and time permitting the latest andmost accurate information is included in this report.
1.3.2 Stages to the Study
The study comprised three principal stages. Stage one involved the review of information andconfirmation of the issues (Southland Integrated Transport Scoping Study) and consultation with keystakeholders. Stage two involved further consultation, investigation of specific projects, the developmentof options to address the issues, the development of a priority action plan and the compilation of a draftreport. Stage three involved consultation on the draft report with the client group, the development offunding business cases and the submission of the final report.
Stakeholder changes to the regional integrated transportation network have the potential to create anumber of traffic and environmental effects within the region, both actual and perceived.
For this reason alone it was considered essential to engage key stakeholders effectively in theconsultation process from the outset and to channel their current base information, constraints, ideas,suggestions and other inputs into the study process and the strategy outcome.
A consultation strategy was developed for the project. Organisations that were consulted as part of thisproject fit within the following categories:
» Transport Agency;
» Transport Provider;
» Transport Interest Group;

951/22078//Southland TransportStudy V24
Southland Integrated Transport Study
» Key Transport Users; and
» Other Key Stakeholders.
The objective of consultation as part of stage one of the study was to identify existing and futuredemands and stakeholder issues. In order to do this, the following was undertaken:
1 Letter of Introduction and request for updated information sent to stakeholders;
2 Meetings with District Councils, Transit New Zealand and other key stakeholders;
3 Gathering of information and review;
4 Analysis of inputs; and
5 Submission of an Issues Report to Venture Southland.
Although no formal consultation was expected to occur during stage two, it eventuated that a number ofdiscussions occurred with a number of organisations with an interest in the study. This consultationoccurred mainly at a oneonone meeting opportunity, as well as an opportunity for all stakeholders toview the various draft reports and make comments. The consultation process is outlined further inAppendix C.
1.4 Report StructureThis report is presented in 13 sections as follows
1. Introduction
2. Setting the Scene
3. Roading
4. Passenger Transport
5. Cyclists and Pedestrians
6. Rail
7. Shipping
8. Airports
9. Industry Commodity Flows
10. Roading Hierarchy
11. Transport Business Case
12. Land Transport Management Act 2003 Requirements
13. Priority Action Plan and Recommendations
Sections one and two set the scene for the study and provide background information about the reportand the Southland region. Sections three through eight provide more detail on each of the transportsectors. Each section begins by providing a summary of the section with key points summarised at theend of each section. Sections nine and ten look at the key components of industry commodity flows andthe roading hierarchy. The final sections of the report, sections eleven through thirteen outline a priorityaction plan for the Southland region in relation to the transport network as well as providing a businesscase, Land Transport Management Act 2003 requirements as well as recommendations for a wayforward.
1051/22078//Southland TransportStudy V24
Southland Integrated Transport Study
2. Setting the Scene
Summary
» Southland covers 34,000 km², or 12.5% of New Zealand’s land area;
» Southland’s urban population is centred in Invercargill. The Invercargill city area has apopulation of 51,800;
» The largest National Park in New Zealand, Fiordland National Park, as well as most recentaddition to New Zealand’s National Parks, Stewart Island’s Rakiura National Park, arelocated in Southland; and
» Southland’s economy is primarily based on commodity production from the agriculturalsector, traditionally sheep and beef and more recently dairying.
2.1 SouthlandSouthland is the southernmost region in New Zealand with a current population of 93,800.9 It has a landarea of 34,000 square kilometres, is the secondlargest region and accounts for 12.5 percent of NewZealand’s land area. Coastal waters flank Southland to the east, south and west. Coastal Southlandextends for 3100 km from Awarua Point, where it meets the West Coast Region, down the South Island’smost western coast (bounded by the Tasman Sea), and across the South Island’s most southern coast(bounded by Foveaux Strait) to Waiparau Head. The region is bounded to the north by various mountainranges, which generally separate the region from the remainder of the South Island. Southland’sboundary with Otago extends southeast from Milford Sound, along the southern edge of Lake Wakatipu,and follows a southerly course just south of Balclutha. The region comprises Invercargill City, GoreDistrict and Southland District (including Stewart Island).
Southland is a vast area of land, high in contrasts and has a natural and unspoilt landscape. Itssouthwest coast is a rugged remote region with fiords and forested wilderness. This area, known asFiordland, covers 1.3M hectares and is the largest national park in New Zealand and one of the largest inthe world. Waitutu Forest Park, around 46,000 hectares, was added to the park in 1998, and includesNew Zealand’s largest remaining lowland virgin forest which had been under constant threat fromlogging. In contrast, most of the remainder of Southland is pastoral land of fertile alluvial plains(Southland and Waimea), laced with rivers and small towns.10
To Maori, Southland is known as “Murihiku” which means the end of the tail, referring to the region’slocation at the southern end of the South Island of New Zealand. The Southland region is administeredby Environment Southland, three territorial authorities: the Southland District Council (SDC), Gore DistrictCouncil (GDC) and the Invercargill City Council (ICC) with the State Highways administered by TransitNew Zealand. Adjoining the region are the territorial authorities of Queenstown Lakes, Central Otago andClutha District Councils, whose regional authority is the Otago Regional Council, and Westland DistrictCouncil, whose regional authority is the West Coast Regional Council.
9 Information on Southland February 200410 Statistics New Zealand: www.stats.govt.nz

1151/22078//Southland TransportStudy V24
Southland Integrated Transport Study
The main urban settlements of the region are Invercargill, Gore, Mataura, Winton, Te Anau, Tuatapere,Otautau, Riverton, Lumsden, Bluff and Oban.11
2.2 Population and demographics
2.2.1 Urban / Rural Distribution
Figure 1 Urban / Rural Profile Categories for Southland
11 Proposed Southland Regional Transport Strategy

1251/22078//Southland TransportStudy V24
Southland Integrated Transport Study
Territorial Authorities Population figures as at 30 June 2003 areestimated as follows12:
2002 2003
Invercargill City Council 51,400 51,800
Southland District Council 29,300 29,400
Gore District Council 12,650 12,600
Total for Southland Region 93,350 93,800
The median income of people in the Southland Region is$17,800, compared with $18,500 for all of New Zealand. 93.4% ofpeople in Southland Region said they belong to the Europeanethnic group, compared with 80.1% for all of New Zealand.13
Invercargill is Southland’s only major urban area and Gore is theonly other significant urban area. The majority of areas within Southland are losing population, apart fromminor urban areas such as Te Anau.
Table 4 Urban and Rural Population Distribution for Southland
Area 1991(number)
1996(number)
2001(number)
% change19911996
% change19962001
Invercargill 51540 49404 46305 4.1 6.3
Gore 10,956 10,620 9927 3.1 6.6
Minor UrbanAreas
7,878 7,887 * 0.1 *
Rural Centres 5,892 5,730 * 2.8 *
Other RuralAreas
23,682 23,382 * 1.3 *
Oceanic/Inlet 3 78 *
TotalSouthland
99,951 97,101 91081 2.9 6.2
Source: Statistics New Zealand, Census of Population and Dwellings, 1991, 1996, 2001
* Information unavailable
2.2.2 Age Distribution
An important indicator of future land transport needs is the age distribution of the population. Southlandhas a slightly higher percentage of elderly people (13.1%) than New Zealand as a whole (12%) andcorresponding lower percentages of children and adults (22.6% and 64.3% respectively, compared to23% and 65% for the country as a whole). The proportion of the population that is 65 years and over isincreasing nationally. In 1951 this age group comprised 9% of the population, while in 2001 it made up
12 Information on Southland Feb 200413 www.stats.govt.nz

1351/22078//Southland TransportStudy V24
Southland Integrated Transport Study
12% of the population. By the year 2051, it is projected that 26% of the population will be aged 65 yearsor older.14 Therefore the provision of access and mobility through a reliable public transport service foruse by both the elderly and the young will become important. These trends also identify a need toprovide a road network that caters for the growing number of elderly drivers.
2.2.3 Vehicle Ownership
Consistent with New Zealand as a whole, the level of car ownership is increasing throughout Southland.Table 5 indicates that 88% of households in Southland have access to at least one car, while almost 9%have no car.15
Table 5 Car ownership in Southland by Household – Census 2001
No MotorVehicle
One MotorVehicle
Two MotorVehicles
Three orMore MotorVehicles
Not Specified
SouthlandDistrict
510 3,372 4,290 2,034 264
Gore District 417 1,887 1,647 753 90
InvercargillCity
2,370 8,382 6,168 2,028 525
SouthlandRegion
3,297 13,641 12,102 4,818 876
Source: Statistics New Zealand
The 2001 census data on the main means of travel to work shows that the use of motor vehiclescontinues to be the predominant mode of land transport in Southland. Public transport remains a verylowuse option in Southland at less than 1%. Bicycle use is just over 2% while over 6% of Southland’spopulation walk or jog to work. The high percentage of people with no motor vehicle again reinforces theincreased need for public transport services in the future. There is potential to reduce the number ofmotor vehicles on Southland’s roads by providing improved facilities for cyclists and pedestrians.
2.3 Existing economic environmentSouthland’s economy is primarily based on commodity production from the agricultural sector,traditionally sheep and beef and more recently dairying and deer.16
The Southland economy has traditionally relied on the farming of its pastoral and fertile plains, inparticular sheep farming. When refrigeration became available in the early 1880’s, the frozen meatindustry transformed the region. Sheep were bred as much for meat as for wool. Agriculture remains themost important industry in Southland and has since diversified, as has industry in general. Importantmanufacturing industries include the aluminium smelter at Tiwai Point. Forestry, fishing and tourism arealso significant industries. Of the estimated 5,311 businesses operating within the region, 10.2% were inthe agriculture, forestry and fishing industries (compared with 4.4% nationally). There were also a
14 Southland Regional Transport Strategy15 Southland Regional Transport Strategy16 A Strategy for Development: Venture Southland

1451/22078//Southland TransportStudy V24
Southland Integrated Transport Study
significantly larger proportion of business in the mining, retail trade and education industries and a muchsmaller proportion of business in the property and business services industry.17 The Manapourihydroelectric power station in Southland is the largest hydroelectric power station in terms of bothcapacity and energy generation. In the year ended 30 June 1996, it had a capacity of 600 megawatts.This will be increased to a peak output of 850 megawatts following the completion of the fiveyearManapouri halflife refurbishment programme, which is currently half way to completion. The total cost ofthe programme, which is due to be completed by late 2007, is $90M.18
Southland is the thirdlargest coalproducing region in New Zealand after Waikato and the West Coast.The region’s main coal deposits are in the west and east of the region. In 1994, Southland produced150,058t of subbituminous coal and 51,402t of lignite, accounting for 6.6% of total New Zealand coalproduction.
Mineral deposits are widespread throughout the region, but although there are substantial quantities,they are difficult to mine. Gold has also been found over much of Southland. Alluvial gold mining hasoccurred in the region Nokomai (now closed and rehabilitated) was the fourthlargest field in NewZealand (producing around 0.75t of gold annually). Tin deposits can be found in New Zealand on theWest Coast and on Stewart Island; about 1t of alluvial tin concentrate was mined there in the latenineteenth century. Southland also has large reserves of limestone.
Southland’s fertile land provides prosperous conditions for farming. Historically, settlers from Otago andgold miners after the gold rush moved to Southland to farm the land. Communities were built to servicefarms and were dependent on agriculture for their livelihood. Today, agriculture continues to be theregion’s dominant industry. At the time of the 2001 Census, 19% of Southland’s employed populationwere engaged in the agriculture industry (including services to agriculture). This proportion decreasedfrom 20.4% in 1996.19
The following is an excerpt from the National Bank’s Regional Trends Report, May 2005:
“Business and consumer confidence in Southland were bothmarkedly below the national average. The number of dwellingapprovals in the region fell 17% in March. New registrations fortractors, cars and commercial vehicles declined. Partially offsettingthis weakness was a large rise in commercial construction consentsissued in the region in March, with the number of permits rising 36 %.Accommodation guest nights were the second fastest growingacross the country. In aggregate Southland registered its first declinein economic activity since June 2003, easing 0.3% in the first threemonths of the year.”
Figure 2 Regional Economic Activity – Year on yeargrowth
17 Statistics New Zealand: www.stats.govt.nz18 www.meridianenergy.co.nz19 Statistics New Zealand: www.stats.govt.nz
Source: www.nationalbank.co.nz
1551/22078//Southland TransportStudy V24
Southland Integrated Transport Study
2.4 Tourism
2.4.1 Draft Southland Tourism Strategy 2005 – 2015
The Draft Southland Tourism Strategy was prepared to identify opportunities and guide tourismdevelopment in Southland over the next 10 years. It identifies tourism as one of the top sectors inSouthland’s economy and highlights the fact that it is a diverse industry that provides jobs for between 10and 15% of the current labour force.20
The vision:
“Southland is New Zealand’s premier destination for nature, wilderness and pioneering heritageexperiences – the visitor experience is at an unhurried pace, the hospitality is genuine, service isexceptional and Southland’s communities benefit.”
The goals:
» Enhance the range of tourism products on offer in order to expand existing businesses, attract newinvestment and spread community benefits;
» Develop a regional marketing approach that will strengthen Southland’s image, positioning andperformance in its key visitor markets; and
» Provide sustainable management of Southland’s tourism destinations through strong stakeholderrelationships.
2.4.2 Southland Regional Tourism Forecasts – Tourism Research Council
The following is an excerpt from the Tourism Research Council of New Zealand’s Southland RegionalTourism Forecasts21:
» International visitors made a total of 478,000 day and overnight visits to the Southland Region in2003, staying a total of 1.1M visitor nights and spending a total of $153M. Domestic visitors made atotal of 1.4M day and overnight visits to the region, staying 1.5M visitor nights and spending a totalof $216M;
» In total, Southland attracted 726,000 overnight visitors in 2003, 1.2M day visitors, 2.6M visitor nightsand $369M in tourism expenditure for the region. By 2010, total overnight visits to the SouthlandRegion are expected to increase by 26.0% to 914,000 and total day visits are expected to increaseby 13.0% to 1.3M. Total nights are expected to similarly increase to 3.2M (23.6%), and visitorexpenditure to $572M by 2010 (55.3%);
» Southland visitor nights are dominated by holiday travellers. Holiday travellers make up 56% of theregion’s nights and are projected to grow by 26.4% to 2010. By 2010, holiday nights will reach 1.9M,providing 3.2% of the total New Zealand holiday nights;
» According to the Commercial Accommodation Monitor (CAM), most of Southland’s commercialvisitor nights are spent in motel accommodation (40%), followed by hotels (28%). Backpacker andhosted accommodation and caravan parks/camping grounds handle the remaining 32%. SouthlandRegion establishments accounted for 3.2% of New Zealand’s total motel guest nights, and 2.2% ofhotel guest nights in 2003;
20 Draft Southland Tourism Strategy21 Tourism Research Council New Zealand, Tourism Forecasts – Southland Region 20042010

1651/22078//Southland TransportStudy V24
Southland Integrated Transport Study
» Southland’s share of total New Zealand visitor nights and expenditure are expected to remain steadyto 2010. By 2010, international visitors will account for 50% of total nights in the region (currently43%) and 47% of total expenditure (currently 41%);
» The region’s outlook is for reasonably steady growth throughout the forecast period, withinternational tourist nights growing much faster than domestic nights. However, there is only limitedchange anticipated by 2010 in average length of stay and the mix of day and overnight visitors;
» Domestic visitors spend on average a longer time in Southland (3.9 nights) than do internationalvisitors (3.3 nights), and this pattern is expected to persist to 2010. The difference is in part due tothe differences in visitor mix, with longer stay holiday travel by the domestic visitors;
» Southland attracts over 1.0M domestic day visits, many by residents travelling within the region.International day visits are fewer, though are by definition incidental to the overnight travel ofinternational visitors;
» Overall, average expenditure per visitor is expected to increase steadily, from $393 in 2003 to $499by 2010 for overnight visitors. Average spend by day visitors is also expected to grow, to $89 perday by 2010, from the current $72; and
» While domestic spending rates are projected to grow faster than international, Southland’s overseasvisitors still spend considerably more ($319 per visitor, 2003) than domestic ($154 per visitor, 2003).
Key Points:
» Without making proper allowance for the projected increase in tourism numbers using theroading network, especially in the form of campervans, cyclists, buses and other touristtraffic, the Southland tourism industry could suffer; and
» The potential conflict between heavy transport and tourist traffic is an issue.
2.5 Requirements for an efficient transport systemAn effective freight system able to meet future needs depends on several factors22:
1. Availability of fixed infrastructure to meet marginal demand;
2. Ability to invest in new infrastructure without long leadtime hurdles such as RMAconsents or land acquisition;
3. Access to conveyances in a reasonable timeframe eg locomotives, coastal ships etc; and
4. Competing operators OR competing modes.
South Port is a key strategic asset for the whole country, being one of 15 ports within New Zealand withinternational oceangoing capacity. As fuel costs increase, carbon charges take effect and demandvolumes increase, there is likely to be a further move towards coastal shipping. This trend is alreadyevident in New Zealand and other countries.
22 West Coast Integrated Regional Transport Infrastructure Plan, GHD Ltd 2005.

1751/22078//Southland TransportStudy V24
Southland Integrated Transport Study
The requirement for competing modes or operators requires collaboration. It is tempting for a consultantto analyse the costs of possible transport options and conclude that one option – based on its underlyingeconomics – is the lowest cost and should be implemented.
However New Zealand is a market economy where prices are set by negotiation between users andsuppliers. There is no price regulation or mechanism for price setting. Competition between operators(eg for road transport) or between modes (eg rail vs. road) is necessary for fair price setting. The abilityto move bulk cargo by all transport modes is essential.
This study therefore examines all transport modes with a focus on key issues as summarised below infigure 3.
2.6 Key Transport Issues
Figure 3 Key Issues in the Southland Region
Many industries identified in regional development strategies, such as forestry, tourism, and dairying,place significant demands on transport networks. Many regional development opportunities are likely todepend to some extent on the further development of transport services, facilities, and infrastructure,23
particularly with regards to the key issues above.
23 Ministry of Transport Statement of Intent
Key Issuesin the
SouthlandRegion
South Port(Transportsonly 17% ofSouthland’s
containerisedproduce)
Tourismrequirements
Tiwai Bridge(Strengthening
orreplacement)
Stewart Island(Safety of
pedestrians)
Rail network(Deferred
capital works)
Milford Road(Congestionand safety)
Ageing roadingnetwork
combined withincrease indairy and
forestry heavytraffic

1851/22078//Southland TransportStudy V24
Southland Integrated Transport Study
A recent scoping study undertaken by GHD Ltd found the following24:
The Southland region is serviced by a widespread roading network, and complemented by aregional port, air and rail services.
The network, in particular roading, is under increasing pressure from the following:
– Changes in vehicle type, especially from increases in heavy vehicles from dairy and forestrygrowth;
– Increases in tourism and tourist usage of rental cars, campervans and buses;
– Conflict between increasing heavy vehicle traffic, tourist traffic, and other road user groups;and
– Continued demand from traditional users for improvements in level of service.
Overall, current traffic growth is only moderate, but forecasted growth of heavy vehicles andtourism is significant.25 Heavy vehicles generate the bulk of the pressure on network maintenanceand their numbers are increasing at a higher rate than other vehicle types.
24 Southland Integrated Transport Scoping Study25 Statistics New Zealand: www.stats.govt.nz

1951/22078//Southland TransportStudy V24
Southland Integrated Transport Study
3. Roading
Summary
» SDC requires significant funding to renew an ageing network that is being subjected toincreasing HCVs;
» The Tiwai Bridge requires significant funding to either strengthen the existing bridge ortotally replace it;
» The Milford Road is likely to be impacted by several commercial proposals. It appears thatpeak time congestion at viewing locations is lessening the visitor experience and sometraffic controls will shortly be necessary; and
» Stewart Island requires funding to mitigate issues surrounding pedestrian and vehicleconflicts on the roads.
3.1 BackgroundRoad is by far the most significant transport mode in Southland. This is not only because road is now themain form of transport for the movement of goods, but also because, where other forms of transport areused, they generally rely on road for part of the journey. It is anticipated that road will continue to be thepredominant mode of transport in Southland in years to come.
As of June 2004, there were 7,186 km of road in Southland comprising State Highways, local roads andSpecial Purpose Roads. Over 50% of these roads are unsealed. Southland’s roading network formsnearly 8% of the national total.
Southland has 777.5 km of State Highways (as of June 2004). State Highway 1 provides access toDunedin and Coastal Otago while State Highway 6 provides access to Queenstown, Central Otago andthe West Coast. The rest of Southland’s nine State Highways form strategic links throughout the region.
The State Highway network carries much of the long distance traffic in the region. There are 288 bridgeson the State Highway network with a total length of 4,738 metres.26 Of these bridges, four are single lanebridges. Southland’s State Highway network is completely sealed and there are no bridges with speed orweight restrictions. State Highway 1 carries the most traffic, with approximately 10,000 vehiclemovements per day in Invercargill and 5,000 vehicle movements per day heading north.27 State Highway6 also carries significant volumes of traffic between Winton and Invercargill. State Highways 90 (McNabto Raes Junction), 93 (Mataura to Clinton), 94 (Te Anau to Milford), 95 (Te Anau to Manapouri), 96(Mataura to Ohai) and 99 (Riverton to Clifden) generally have less than 1,000 vehicle movements perday with the exception of urban areas. State Highways 94 (Gore to Te Anau), 98 (Dacre to Lorneville)and 99 (Lorneville to Riverton) range between 1,000 and 4,000 vehicle movements per day.
As can be seen from the table below, Southland has 598.8 km of urban (U) roads, 5,832.7 km of rural (R)roads and 27.6 km of Special Purpose Roads (SPR) on the local road network. The region has 1090
26 Transfund New Zealand Roading Statistics 2003/200427 Transit New Zealand Traffic Volumes 20002004 inclusive (revised May 2005)

2051/22078//Southland TransportStudy V24
Southland Integrated Transport Study
bridges, 473 of which are single lane and 44 of which have posted weight restrictions. (Note: The tabledoes not include the State Highway statistics above).
Table 6 Local Roads – Physical Statistics as at 30 June 200428
Total bridges Single lanebridges
Restricted bridges Timberbridges
Speed only Weight
Totallengthkm
LengthSealedkm
% Sealed
No. Lengthmetres
No. Lengthmetres
No Lengthmetres
No Lengthmetres
No. Lengthmetres
U 83.6 75.7 90.6Gore DC
R 809.7 266.8 33
104 1171 47 771 5 88 4 52 22 277
U 290 287.2 99.InvercargillCC
R 300 173.7 57.9
51 1436 12 291 1 6 124
U 225.2 180.1 80.0
R 4,723.0 1,753.9 37.1
935 12064 414 6573 37 718 149 1352SouthlandDC
SPR 27.6 11.7 42.4 17 175 14 160
U 598.8 543 90.7
R 5832.7 2,194.4 37.6
1090 14,671 473 7635 5 88 42 770 177 1753SouthlandRegionTotal
SPR 27.6 11.7 42.4 17 175 14 160
The Southland Region’s roads are owned and maintained by SDC, GDC, and ICC, with the StateHighways being maintained by Transit New Zealand.
Road travel is the most significant mode of transport in the Southland region and Southland is morereliant on road freight transport than New Zealand as a whole.29 According to the 2001 Census, 3,294households in Southland own no motor vehicle, 13,641 own one motor vehicle, 12,102 own two motorvehicles and 4,815 own three or more motor vehicles. 30
3.2 Roading HierarchySection 10 of this report describes an alternative roading hierarchy based upon an integrated hierarchydefinition.
3.3 Economic Importance of the Road NetworkThe following is an excerpt from Road Freight – Its significance for Regional Economics (Infometrics,2003).
Road freight companies account for 61% of all land and sea transport revenue in the Southland region.For New Zealand as a whole, the comparitable figure is 55%. A high proportion of Southland’s road
28 Transfund New Zealand Roading Statistics 2003/200429 Road Freight – Its significance for regional economics, April 200330 Statistics New Zealand: www.stats.govt.nz

2151/22078//Southland TransportStudy V24
Southland Integrated Transport Study
freight business is exported from the region (i.e. services are provided to businesses based in other partsof the country).
This is an economy that relies heavily on road freight transport to get its products to market, rather thanto bring products in for domestic utilization.
For most industries, the purchase of road transport services is a small part of total costs, however 13.8%of goods and services costs in the forestry industry in Southland are road freight transport costs.
The economic contribution of road freight transport in Southland for the year ended March 2001 (% of allindustry total) is as follows:31
» Gross output 2.5%
» Value added 2.6% (at factor prices)
» Employment (FTE’s) 2.4%
3.4 Southland District CouncilThe SDC is responsible for the administration and maintenance of the District’s entireroading and bridging network.
The SDC is responsible for a roading and bridging network that has 4,922 km of roads(1,946.5 km sealed and 2975.5 km unsealed, 225 km urban and 4669.2 km rural). 27.5 km of the roadsare designated ‘special purpose’. There are also 865 bridges and 99 stock underpasses. The network ismaintained to a standard that provides safe and comfortable road transport, within the limit of availablefunds.
The Council has prepared an Advanced Roading Asset Management Plan, which sets out the basis andstandard to which roads will be managed and maintained while under Council’s control.
The Southland Roading Network has been subjected to significant growth in dairying. This activity has asignificant impact on the roading network for two main reasons:
1. Frequent heavy axle loads on low strength roading pavements; and
2. Unpredictable traffic trips both during the farm development and with servicing by dairytankers, which travel the shortest and most convenient route.
Due to the natural landscape the roading network is porous in travel opportunity aspects. Hence, traffic isable to avoid the State Highway network. The result is HCVs utilising local roads, which were designed toa lower standard (the old class 2 prior to 1990) than the higher standard State Highways.
3.5 Gore District CouncilThe GDC has 893.9 km of roads, 341.3 km sealed, 552.6 unsealed, 83.6 km urbanand 809.7 km rural. The road network is generally in reasonable condition, withongoing maintenance required to upgrade wooden bridges and undertake seal
widening. A program of bridge upgrades has recently been completed, with four bridges remaining withweight restrictions and five with speed restrictions. Pressure on district roads is generated by heavytraffic associated with dairy and forestry industries (particularly with metal supply associated with new
31 Butcher and Partners in Road Freight – Its significance for regional economics, April 2003

2251/22078//Southland TransportStudy V24
Southland Integrated Transport Study
activity for off road infrastructure development) and further strengthening of particular routes is requiredto increase and upgrade their carrying capacity.
There is an ongoing need for seal extensions within the district, and the Council has applied for RFunding to assist with progressing this work. The major roading issue is narrow seals. Council isdeveloping a program of works to progressively widen seal to meet the required level of service.
The district’s industries, including tourist attractions, are generally adjacent to State Highways and hencehave only a minor impact on the local network.
Council is currently developing a roading activity (asset) management plan, which is due for publicationlate in 2005.
3.6 Invercargill City CouncilAs at 30 June 2004 ICC has 590 km of roads, 460.9 km sealed, 290 kmurban and 300 rural.32 The Invercargill road network is concentrated in theurban areas of Invercargill City and Bluff.
The key focus for the ICC is the maintenance of existing roads to ensure they meet required safetystandards. Many freight and depot centres servicing the Southland region are located in Invercargill,particularly to the west between Clyde and Bond Streets adjacent to the railway. This results in heavyvehicle traffic passing through the city centre. This places pressure on the local road network andproduces conflict with other road user groups. A heavy vehicle bypass is planned to redirect heavyvehicles along Bond Street (South) connecting to the Bluff Highway at Grace Street. Land has beenpurchased with design and construction programmed in future years.
3.7 Transit New ZealandThere are approximately 771 km of State Highways in the Southland region,which are owned and maintained by Transit New Zealand.
Transit New Zealand’s focus is on sustainability and integration. This isparticularly evident adjacent to growth areas such as Te Anau.
As land use intensifies, road use by heavy vehicles will increase, especially as there are limitations withinSouthland to alternative forms of transport such as rail and coastal shipping.
Most state highways in Southland carry relatively low traffic volumes and no major improvements arerequired apart from minor safety improvements, and improvements to the Homer Tunnel on SH94.Hence, the region’s State Highway network has no major barriers hindering economic growth.Nevertheless, Southland’s economic growth, potential industrial developments, and conversion ofpasture farming activity to dairying, needs to be constantly monitored to ensure that the current highlevels of service on Southland Highways are maintained. There is continuing need for activemanagement of SH94 to Milford Sound to provide an appropriate level of avalanche protection and trafficmanagement.
The key regional transport issues in Southland include:
» Road safety;
32 Invercargill City Council

2351/22078//Southland TransportStudy V24
Southland Integrated Transport Study
» Forestry traffic;
» Tourist traffic, particularly on the Southern Scenic Route to Fiordland National Park and MilfordSound; and
» The increase in the number of dairy farms is increasing truck movements, particularly around theprocessing plant at Edendale.
With regard to road safety, Transit plans to remove the ‘out of context’ sections of state highway androadside hazards, and provide a network of stock truck effluent disposal facilities including one nearMataura and is carrying out further investigations on the need for one at Lumsden on SH6.
Safety improvements that are progressing include the Lorneville Roundabout and River RoadRealignment.
The following activity is scheduled to be undertaken over the next three years:33
» SH93: River Road Realignment
A number of additional projects are proposed but are dependent on progress with other projects and theavailability of regional distribution funding. These include:
» SH98: Mill Road Intersection Improvements, east of Lorneville;
» SH1: Edendale Realignment;
» SH6: Gap Road Intersection Improvements, near Winton;
» SH1: Boundary Creek Bridge Widening, north of Mataura; and
» SH1: East Road Curve Realignment, north of Invercargill.
Regarding secure routes (SH94 to Milford Sound), Transit is continuing to investigate replacing theeastern portal of the Homer Tunnel, which was damaged some years ago and is likely to need to bereplaced and extended. This tunnel provides the only road access to the key tourist destination of MilfordSound.
The alignment of the State Highways in Southland is generally good but increasing passing opportunitieswill assist, particularly close to Invercargill. Two sets of passing lanes are proposed but are subject to theavailability of regional distribution funding. They are: Dowling Road / Mona Bush Road on SH1 andWilson’s Crossing on SH 6.
Since the Land Transport Management Act (LTMA) was passed at the end of 2003, there has been verysignificant change at Transit – to their strategy, structure and processes. The LTMA embedded principlesof the New Zealand Transport Strategy into Transit’s statutory objective, which is “to operate the StateHighway system in a way that contributes to an integrated, safe, responsive and sustainable landtransport system”. In doing that, Transit must exhibit a sense of social and environmental responsibility.The LTMA also:
» Required that the objectives of the New Zealand Transport Strategy be taken into account when landtransport programmes are prepared – of which Transit’s State Highway Programme is the largest;and
» Enabled road tolling schemes and concession agreements.34
33 Extracts from Transit New Zealand’s 10year SH Forecast 2005/06 – 2014/1534 Excerpt from a Transit New Zealand brochure, Times Have Changed at Transit, 2005

2451/22078//Southland TransportStudy V24
Southland Integrated Transport Study
3.8 Transport SafetyMaritime New Zealand, the Civil Aviation Authority and LTNZ all have in place regulations that applies tothe use and operation of ships, aircraft and vehicles. The movement of aircraft is closely monitored, toensure necessary safety standards during flights and landings are observed. The movement of ships intoand out of ports is controlled by port authorities, and cruise ships operate under an accord withEnvironment Southland. These processes result in all practicable means being adopted to ensure highlevels of safety are achieved, both for the movement of aircraft and ships, but also for the people beingconveyed on them.
While regulations apply to the use and operation of vehicles on land, significant safety concerns arise asa result of the number of crashes that occur involving vehicles (singularly, with other road users or withtrains) and trains (either by themselves or with road users).
By world standards, Southland and the rest of New Zealand has an unacceptable level of road traumadespite the considerable improvements made in safety over recent years. Out of the 28 countries on theOECD’s road and traffic database, New Zealand ranks 20th equal in terms of deaths per 100,000 people,falling well behind countries like Sweden, Australia and Italy.
Crashes and other accidents on roads is the largest cause of accidental death in New Zealand.Inattention, alcohol, speed, failure to give way or stop, and crossing the centre line are the maincontributing factors. It is not possible to totally avoid crashes, but it is both practical and feasible toachieve an improvement on the existing situation. An improvement can be achieved with an integratedapproach that focuses on:
» Driver skills and behaviour, includingattitudes to speed, drink driving, overtakingand wearing restraints;
» The driving environment, for example thestandard of roads; and
» The vehicles that use the road, includingtheir roadworthiness.
Between 1998 and 2004 there were 152 fatalaccidents involving railways in New Zealand,55 of which occurred at level crossings – anaverage of 20 per year.35
The Southland region has an extensive roadnetwork with several State Highways runningthrough it. A general trend exists for the
majority of injury crashes in Southland to occur on rural roads, with 85% of all crashes in the SouthlandDistrict and 60% in the Gore District occurring on rural roads in 2004. Figure 4 below shows a breakdownof where the rural injury crashes took place in 2004 in the Southland District.36 Although the majority ofcrashes in Southland 2004 took place on rural roads, the severity of the urban crashes increaseddramatically. In 2003, 20 percent of urban crashes in the Southland District resulted in serious injuries; in
35 National Rail Strategy to 201536 Southland District Road Safety Issues – Land Transport Safety Authority (2004)
Figure 4 Rural crash locations in SouthlandDistrict (2004)
2551/22078//Southland TransportStudy V24
Southland Integrated Transport Study
2004 that figure was closer to 60 percent. In the ICC region the portion of urban crashes was 90%, dueto the fact that the region has more urban than rural roads.
Key Points:
» Majority of injury crashes occur on rural roads as opposed to urban roads; and
» Southland is experiencing a significant increase in the number of crashes.
3.9 State Highway 6This route is of growing importance to the tourism sector. It runs the length of the South Island fromBlenheim down the West Coast, through Wanaka and Queenstown and on to Invercargill and passesthrough some of the country’s most visited tourist destinations. Conflicts between freight and touristtraffic on State Highway 6 need to be addressed.
3.10 State Highway 94 – Milford RoadThe Milford Road poses particular operational issues to Transit due to its iconic passage throughFiordland National Park and ever increasing tourist pressures. This is covered in more detail in section3.21 below and in the full Milford Report which can be found in Appendix E.
3.11 Traffic VolumesThe significant changing demands Southland region needs to consider are:37
1. The change in the vehicle types travelling on the region’s roads, especially the increases in theheavy vehicle group. Both the dairying and forestry industries are growing and both have a highdependence on heavy commercial vehicles. Cars have very little impact on the performance of aroad pavement whereas trucks, because of their comparative weight, have a disproportionateimpact compared to their numbers;
2. Tourism within Southland is increasing, with travel by rental cars and camper vans beingpopular. Their use on a number of District roads is increasing, particularly the Southern ScenicRoute (SSR) and adjacent roads leading to SSR attractions; and
3. A change in vehicle use habits. While the population is currently decreasing people are tendingto use their cars more. This is likely to only result in a minor increase in total traffic over districtroads.
3.12 Heavy VehiclesThe numbers of heavy vehicles are increasing on Southland’s roads. As outlined below, both the dairyand forestry industries are growing rapidly. These industries have a high dependence on heavycommercial vehicles. In addition, the economic upturn in all farming sectors has lead to increased limeand fertiliser application by heavy vehicles. The number of agricultural contracting vehicles (tractors,
37 Advanced Roading Asset Management Plan (MWH)

2651/22078//Southland TransportStudy V24
Southland Integrated Transport Study
harvesters and ancillary vehicles) utilising the transport network is also increasing as landowners areincreasing their use of contract services rather than purchasing their own equipment.
With the increases in primary production, both in timber and milk, catchup farm maintenance andreliance upon contractors, an annual increase in heavy vehicle usage above the national average isanticipated. SDC estimates that this increase will be 11% per annum for the next two years and 9% perannum for the following 8 years resulting in an overall increase over the next ten years of 2.5 times theexisting levels (SDC Advanced Roading Asset Management Plan).
Many of Southland’s sealed roads were originally constructed with only thin pavements. It was neverenvisaged that these thin pavements would be required to carry the heavy vehicles they do today or thatwhich is projected in future. Cars have very little impact on the performance of a road pavement whereastrucks, because of their comparative weight, have a disproportionate impact compared to their numbers.The increasing numbers of heavy vehicles on Southland’s roads will lead to an increased rate ofdeterioration of road pavements.
The impacts of heavy vehicles on the roading network and its users have been more closely examined inthe various industry sections below.38 Information relating to road user charges (RUC) for heavy vehiclesin Southland can be found in Appendix F.
Figure 5 Southland Indicative Traffic Volumes
3.13 Ageing Roading NetworkThe road network in the Southland District comprises 77% of the Southland regional local road networkand is currently in need of major rehabilitation. Over 60% of the local roads remain unsealed, creating
38 See sections 3.14 Tourism, 3.15 Dairy Industry, 3.16 Forestry Industry, 3.17 Livestock, and 3.18 Mining.
Invercargill
Winton
1072Road ToSouth Port
4263
12649
SH6
Ohai
Te Anau
Riverton
Road ToMilford
993
2121
2078
1749
787
468
Lumsden
5818
3683
810
1591
2004 Traffic Volumes(AADT)
Gore
SH11118
1236
1179
7607
1641

2751/22078//Southland TransportStudy V24
Southland Integrated Transport Study
problems for safety and restricting load carrying capacity. In addition there are 37 wooden bridges withweight restrictions.
The extent and broad distribution of farming activities generates heavy vehicle traffic on nonarterialroutes and places additional pressures on unsealed roads, and increases deterioration on local roads.
The graph in Appendix G is from the SDC’s Asset Management Plan (2004). It shows the date of themost recent work on their road network by number of kilometres concerned. The graph demonstratesthat a large length of the SDC road network is overdue for remedial work. A lot of paved roaddevelopment undertaken in the 1960’s and early 1970’s has been maintained but is now due for renewal.Generally, after around 25 years of use a road will need remedial work. In 1979 the average age of thenetwork was 14 years. In 1999, the average age of the network was 28 years. The timeframe forremedial work depends upon the volume and type of traffic, the ground conditions and the topography.Much of the road network has not been renewed for 30 to 40 years. Over the next few years, it ispredicted that a significant amount of funds will need to be spent to retain the current road conditions39.The above data has been updated during 2005 and the histograms in Appendix H depict the currentsituation.
There is an issue surrounding not only the age of the network but also the forecast volumes of traffic onthe roads as there is significant potential for traffic growth around industries based on coal, lignite andgas. The lignite resources of the Southland Coal region make up 71% of New Zealand’s recoverable coalresources. Growth in the tourism, dairy, and forestry sectors has and will continue to increase trafficvolume on the roading network.
Key Points:
» Significant sections of the Southland District’s roading network, particularly those subjected toincreased HCV traffic, will require renewals.
3.14 Tourism Traffic
Table 7 Southland’s Tourism Figures (2003)40
Southland Overnight Visits (000’s) Day Visits (000s) Total Spend ($NZ M)
International 339 140 153
Domestic 387 1018 215
TOTAL 726 1157 368
NZ Market Shares (%) 2.9 3.0 2.55
Southland’s main tourist attractions are its natural features, including Fiordland National Park (whichincorporates attractions such as the Milford Track, Milford and Doubtful Sound) and the Catlins, withInvercargill acting as a link for Stewart Island and Rakiura National Park and a southern entrance to theQueenstown area. There is limited tourism infrastructure in Southland, with only a small share of thenational accommodation sector. However, significant transport activity supports visits to Milford and
39 Southland Integrated Transport Scoping Study40 Tourism Research Council New Zealand, Tourism Forecasts – Southland Region 20042010.

2851/22078//Southland TransportStudy V24
Southland Integrated Transport Study
Doubtful Sound. Visitor use of the Milford Road is increasing at a rate of about 7% annually, meaning adoubling of numbers over the next ten years. Currently around 800 vehicles travel the Milford Road eachday. This figure rises to 1200 vehicles per day during the peak summer season. Buses compriseapproximately 25% of the traffic on the road. Traffic volumes and visitor numbers peak at specific timesof the day. The timing of these peaks relates to the travel time from Queenstown to Milford Sound on aday return trip. The large numbers of tourist operators arriving in Milford around lunchtime, with touriststaking a boat trip before commencing their return journey, gives rise to congestion, safety and parkingissues. The Homer Tunnel also gives rise to issues of concern, given its length (1200 metres) and that itis narrow, unlit and unventilated.
While buses are extensively used on the Milford Road, in other areas, motor vehicles, either cars orcampervans, are the mode of choice of most tourists that visit Southland. Between 75% 85% of alltraffic generated by holidaymakers and people visiting friends and relatives enters Southland via road.41
Tourist numbers in the Catlins have grown over the past few years and it is estimated 100,000 visit theregion each year. The figures are predicted to continue rising and it is possible that the area may see upto 300,000 visitors per year over the next 10 years.42 The sealing of the Southern Scenic Route isexpected to significantly contribute to this increase in the number of visitors to the Catlins region.43
Southland tourism growth has surpassed all other regions in New Zealand. Most of the tourist attractionswithin the region are only accessible by road and the majority of visitors use private vehicles andcampervans for transportation to these areas. Tourism traffic on the roads is expected to grow by 290%over 20 years based on a continued growth of 8% p.a. New tourism attractions are being built orconsidered throughout the region and traffic growth could grow at a rate much greater than the predicted8% p.a.
There is thus a change in expectation of the standard of the roads. Visitors to New Zealand expect totravel on sealed roads with better information signage than is currently provided. This is particularly thecase on the fringes of the network at such locations as Waikawa. In these locations, the scenicattractions are accessed by unsealed, narrow and often winding roads that have current low levels ofservice.44 Issues associated with tourists who are used to driving on roads of better condition and on theother side of the road can pose a safety risk.
3.14.1 The Southern Scenic Route
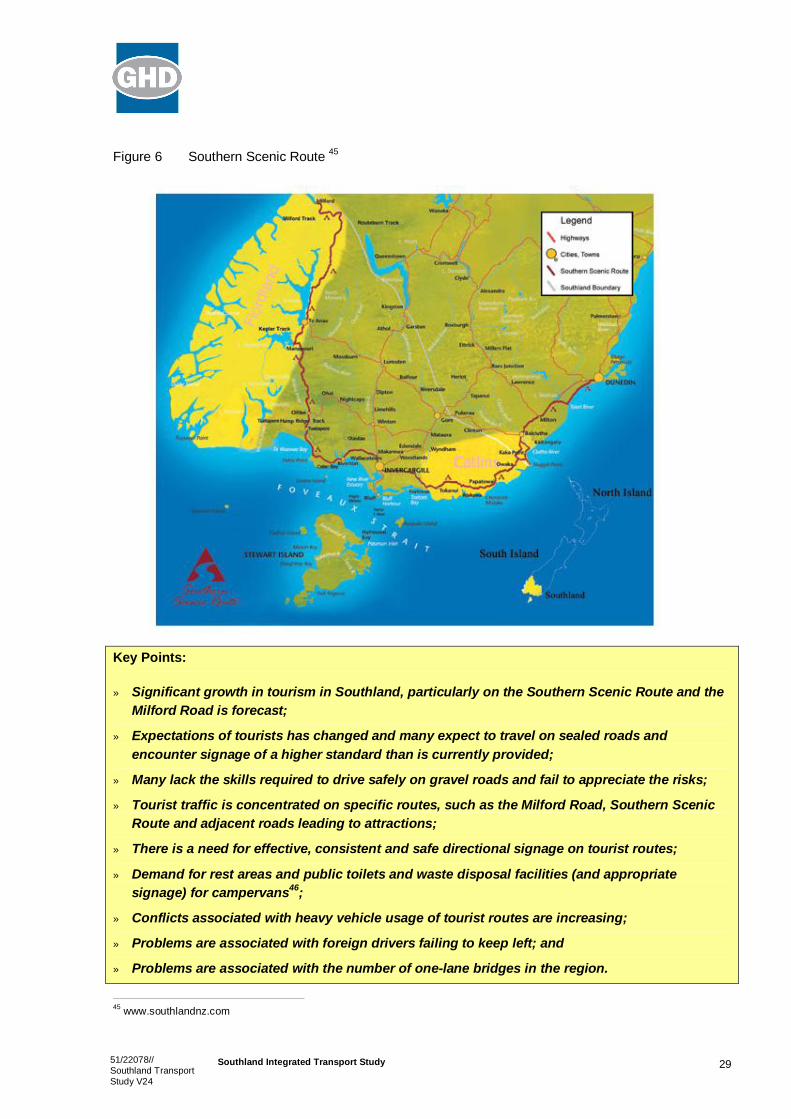
The Southern Scenic Route (see figure 6 below) is the first touring route of its kind in New Zealand. Itcovers 440 km from Milford Sound down to Tuatapere, along the coast, through the Catlins and up toDunedin.
41 Southland Tourism Strategy 2005201542 Catlins Tourism Strategy43 Venture Southland Activities Report October – November 200444 Proposed Southland Regional Transport Strategy
2951/22078//Southland TransportStudy V24
Southland Integrated Transport Study
Figure 6 Southern Scenic Route 45
Key Points:
» Significant growth in tourism in Southland, particularly on the Southern Scenic Route and theMilford Road is forecast;
» Expectations of tourists has changed and many expect to travel on sealed roads andencounter signage of a higher standard than is currently provided;
» Many lack the skills required to drive safely on gravel roads and fail to appreciate the risks;
» Tourist traffic is concentrated on specific routes, such as the Milford Road, Southern ScenicRoute and adjacent roads leading to attractions;
» There is a need for effective, consistent and safe directional signage on tourist routes;
» Demand for rest areas and public toilets and waste disposal facilities (and appropriatesignage) for campervans46;
» Conflicts associated with heavy vehicle usage of tourist routes are increasing;
» Problems are associated with foreign drivers failing to keep left; and
» Problems are associated with the number of onelane bridges in the region.
45 www.southlandnz.com
3051/22078//Southland TransportStudy V24
Southland Integrated Transport Study
3.15 Dairy Industry TrafficNew Zealand is one of the top five dairy exporters in the world which supply around 90 percent of dairyproducts traded on the international market. The New Zealand dairy industry's major markets vary fordifferent products. Britain and the EU are New Zealand's most valuable market for butter. The primarymarkets for casein and cheese are the United States, Japan, and the EU. New Zealand is the world'slargest exporter of casein and caseinate products. New Zealand's most important milk powder marketsare in Central and South America and SouthEast Asia.
The Southland economy has traditionally relied on the farming of its pastoral and fertile plains, inparticular sheep farming. Agriculture remains the most important industry in Southland, however therehas been a move away from sheep farming to dairying and deer farming in recent years. Between 1996and 1999, the number of dairy cattle in Southland increased by 69% and deer numbers increased by106%. There was a corresponding decrease in sheep numbers during the same time period.
Southland accounted for 5% of the national dairy farms for the 2003/04 season, and is expanding.47
There are four factors that impact on predicted future growth beyond 2004:48
1. New farm conversions are controlled by the dairy company so they can ensure there is sufficientprocessing capacity;
2. There will be growth from increases in productivity from maturing farms and improved farmmanagement;
3. There are seasonal swings that depend on climate; and
4. The value of the New Zealand dollar against our trading countries.
Table 8 Dairy Industry in Southland49
Southland Dairy Industry 2003/04 Season
Number of cows 192,565
Milk fat produced 35,431,960 kg
Protein produced 26,573,970 kg
Milk solids produced 62,005,930 kg
Litres of milk 73,000,000 litres
Fonterra’s Edendale Dairy Factory currently processes 7.5M litres of milk per day and 200,000Mt ofprocessed goods. There are approximately 37 tankers in the fleet making 280 tanker trips to and fromthe factory per day from 620 suppliers in the area. 30% of finished goods were transported by rail in
46 Proposed Southland Regional Transport Strategy47 www.fonterra.com48 Advanced Roading Asset Management Plan (MWH)49 Statistics New Zealand: www.stats.govt.nz

3151/22078//Southland TransportStudy V24
Southland Integrated Transport Study
2005. This is forecast to increase to 50% in February 2006. The majority of product (>80%) fromEdendale is shipped from Port Otago in Dunedin.50
Both Port Otago and South Port have constructed additional storage facilities in recent years to cater forthe growing export trade in dairy products. Approximately 25% of the total tonnage of processed goodswas transported by rail. Road transport is via the State Highway network, with State Highway 93 beingused to transport goods between Mataura and Clinton as opposed to State Highway 1.
It is difficult to predict future growth in the dairy industry, as the dairy company controls the number ofnew farm conversions to ensure sufficient processing capacity. At a minimum, there will be growth fromincreases in productivity from maturing farms and from improved farm management.51
Roads likely to be affected by dairy development have been identified. There is concern over intersectiondesign between primary and secondary roads, which does not facilitate ease of access for milk tankersonto main highways e.g. intersection at Lorneville. In addition, these laden vehicles turning on and off thestrategic roading network combined with the slow acceleration, produces conflict with other vehiclestravelling at open road speeds. Heavy vehicles are also required by law to travel at a slower speed thanother traffic. As a result milk tankers tend to prefer to stay on secondary roads, causing wear and tear onroads that have not been designed for the current volume of heavy traffic. These secondary roads areoften narrower than the main highways and have little or no road shoulder. These geometric constraintscombined with dust generation from vehicles on unsealed minor roads pose safety issues for heavytraffic and other road users. Milk tankers using these roads must travel slower than they would onprimary sealed routes resulting in a lack of efficiency in the movement of milk products. In terms ofconflict with other road users, increasing numbers of milk tankers could lead to convoys of thesevehicles, which leads to frustration for other road users who are unable to safely overtake them.
Fonterra is trying to mitigate issues of milk tankers using secondary roads by using vehicles that aremore stable, and therefore better able to handle the narrow, unsealed roads. Understandably, Fonterrawould like to see all roads used by its milk tankers sealed.
The road design around the Edendale factory itself is not conducive to maintaining good safetystandards. The main road, near the entrance to the factory, has a right angle bend in it and also has arail siding to the factory through the centre of it. This is a safety issue for all vehicles, and also withpossible additional use of rail on and off site in the future. Plans are underway to move traffic away fromthe factory by redirecting the road and altering the rail alignment as a consequence.
Key Points:
» The Edendale Dairy Factory: the viability of rail to reduce the number of truck movementsaround the dairy processing plant at Edendale is being programmed. Transit is alsoinvestigating the possibility of a road bypassing Edendale township and the dairy processingplant;
» Conflicts between milk tankers and other road users: speed conflicts and lack of safepassing opportunities;
» Deterioration of road surfaces, from the weight and intensity of use by heavy vehicles;
50 Source: Consultation with Edendale Site Manager51 Southland Regional Transport Strategy

3251/22078//Southland TransportStudy V24
Southland Integrated Transport Study
» Increased use of nonarterial roads by heavy traffic;
» Increased use of unsealed roads by heavy traffic resulting in increased dust generation;
» Noise/vibration issues associated with the transport of heavy freight; and
» “Hubbing” of milk for transportation to the dairy factory. This could involve onloading torail.52
3.16 Forestry Industry TrafficForests cover about 30 percent or 8.1M hectares of New Zealand's land area. Of this, about 6.4Mhectares are in natural forest and 1.7M hectares in planted production forests. Of the total plantedproduction forest estate, 91 percent is radiata pine (Pinus radiata), and 5 percent is Douglas fir(Pseudotsuga menziesii). Hardwoods comprise about 3 percent of New Zealand's planted productionforests. The most important hardwood plantation species are eucalypts originating from Australia.
New forest establishment has increased markedly during the 1990s. During 1998, 52,000 hectares ofnew forest planting occurred. Almost all areas of forest harvested are replanted.
The volume of wood available for export is expected to increase dramatically, with about a 74 percentincrease between 1996 and 2010. This projected increase assumes 60,000 hectares of new plantingsare undertaken each year.53
Figure 7 Timber Production In New Zealand (Plantation and indigenous)54
There are a number of areas in which there are potential problems and issues with regards the roadingnetwork and the forestry industry. Like the dairy industry above, the forestry industry relies on heavyvehicles to transport product from plantations to mills and experiences many of the same issues withregards road wear and tear and conflict with other users.
As with dairy traffic there is concern surrounding heavy vehicles at intersections between primary andsecondary roads, their slower speed and safety on narrow and often dusty secondary roads.
52 Southland Regional Transport Strategy53 Statistics New Zealand: www.stats.govt.nz54 www.stats.govt.nz

3351/22078//Southland TransportStudy V24
Southland Integrated Transport Study
Many drivers, particularly elderly drivers, are weary of passing logging trucks, and feel intimidated bythem, as there is a perception of them being dangerous vehicles. There is the potential in the future forlogging trucks with increased dimensions. Trials have been undertaken where logging trucks carry longerand lower loads. This has been shown to substantially reduce the number of rollover type crashes.
3.16.1 Southland Forestry
Approximately 2.5% of the Southland region (86,166 hectares) is dedicated to planted forest consistingmostly of Radiata pine and Douglas fir. Most of Southland’s planted forest is Radiata pine, recently moreDouglas fir has been planted than Radiata pine. As at April 2003, 26.6% of Southland’s forestry estate isin Douglas fir with another 15.5% in hardwoods55 (principally Eucalyptus nitens). Radiata pine isgenerally harvested between 25 and 30 years of age and Douglas fir between 45 and 50 years of age.Eucalyptus plantings are on a short rotation, designed for the production of wood chips. The followingtable shows that over 65% of the planted forest in Southland is under 10 years of age.
Table 9 Area age/Class Distribution as at 1 April 2003
Age Class (years)/Area (ha)
15 610 1115 1620 2125 2630 3135 3640 4150 5160 61+ Total
Southland DC 22,109 31,213 6,669 4,157 708 190 141 50 75 81,970
InvercargillCity
86 130 178 84 109 65 25 141 7 0 0 825
Gore DC 2,360 93 251 95 61 0 0 0 0 3,371
SouthlandRegion
2,455 31,436 9,587 7,844 7,029 4,137 794 331 148 50 75 86,166
Source: Otago Southland Forest Industries Profile June 2004
This means that the impacts of forestry on the region’s transport network will increase over time. Aroundonethird of the national wood harvest is exported as logs; one third is supplied to sawmills and plywoodmills, with the remaining third supplying the pulp, paper and reconstituted panel.
Table 10 Species of Planted Production Forest in Southland, 1 April 2001
Species Southland (ha) New Zealand (ha) Southland % of NZ
Radiata pine 47,924 1,607,726 2.9 %
Douglas fir 19,061 102,573 18.5 %
Other Softwoods 1,478 34,604 4.3 %
Hardwoods 12,834 53,854 23.8 %
Source: Ministry of Agriculture and Forestry – A National Exotic Forest Description as at 1 April 2001
Since 1990, considerable planting of Eucalyptus has been undertaken in Southland for woodchip for themarkets of Japan and Korea. Harvesting of these plantings was predicted to commence from 2001. Initial
55 Otago Southland Forest Industries Profile June 2004

3451/22078//Southland TransportStudy V24
Southland Integrated Transport Study
harvesting trials were carried out and harvesting began in 2004, with major volumes of timber beingcarried on District Council roads.56
Most of the region’s planted forest can be found on inland hill country. A medium density fibreboard planthas been constructed south of Mataura. Timber is processed at sawmills in western and easternSouthland.57
3.16.2 Timber Processing
In Southland, investment in local wood processing has increased significantly in recent years, withparticular emphasis on sawmill expansion. Large sawmills in the region include Craigpine TimberCompany at Winton, Brightwood NZ Ltd at Otautau and Niagara Sawmilling Co Ltd at Kennington. Allthree of these sawmills have undergone significant upgrades in recent years. Rayonier New Zealand Ltdcommissioned its first New Zealand timber processing operation, a Medium Density Fibreboard (MDF)plant near Mataura, in 1997. Rayonier’s New Zealand MDF business has been sold to an overseascompany, Dongwha Hong Kong International Ltd, subject to approval by the New Zealand OverseasInvestment Commission.58 The Mataura plant was designed to process 140,000 cubic metres of productannually, however current production now exceeds 165,000 cubic metres annually. The plant has thenecessary resource consents and infrastructure to build a second line that would double its output.
In Southland, the forestry industry uses transport routes from logging and planting areas to the followinglocations of major wood milling and processing plants:
» Winton;
» Otautau;
» Kennington;
» Awarua (wood chipping); and
» Mataura (MDF Plant).
A number of these plants also receive logs from the Otago region via road. Forestry produce is alsoexported from the region via road freight and sea freight facilities at Bluff.
Analysis of current wood flows in the region show that there is more processing capacity in Southlandthan wood resource available. The opposite is true in Otago and South Canterbury where there is asurplus of logs over current processing capacity. Currently, there is considerable movement of logs fromOtago to Southland to meet this imbalance. In the next five years, it is likely that this trend will continue.
The extent of the impact on the road network, of increasing forestry development in Southland, isinfluenced by the specific locations of the forests and the locations of the processing facilities.59
56 Advanced Roading Asset Management Plan (MWH)57 Statistics New Zealand: www.stats.govt.nz58 www.nzforestry.co.nz59 Advanced Roading Asset Management Plan (MWH)

3551/22078//Southland TransportStudy V24
Southland Integrated Transport Study
Figure 8 Wood Milling and Processing Plants
Most of the larger sawmilling operations in Southland run chippers supplying chip for export or toDongwha Hong Kong International Ltd’s MDF operation. However, there is one standalone chippingplant operating in the region. South Wood Export Ltd’s plant at Awarua 10 km south of Invercargill hasbeen processing logs into wood chips for export through Bluff for around 25 years. Since 1990considerable planting of Eucalyptus has been undertaken for wood chip for the markets of Japan andKorea. Harvesting of these plantings is expected to take place from 2002 onwards.
A profile of the Otago and Southland Forest Industries produced by Otago Southland Forest ProductsGroup Incorporated in January 2002 estimates that Southland log input to processing and log export willincrease by 33% from 790,000 cubic metres in 2000 to 1,047,000 cubic metres in 2005. From the figuresabove, it can be seen that the forestry industry is likely to have a significant impact on the transportnetwork in future years. This impact will increase as the forests in the region mature.60
Southland has a maturing supply of lightcoloured pine, totalling about 1M cubic metres per annum withprocessing infrastructure in saw milling, veneer and MDF. There are also significant plantings of shortrotation eucalypts for fibre.61
60 Southland Regional Transport Strategy61 A Strategy for Development: Venture Southland
Winton
MatauraOtautau
Awarua
Kennington
Wood Milling andProcessing Plants in
Southland
Tuatapere
Lumsden
Findlaters Pankhursts
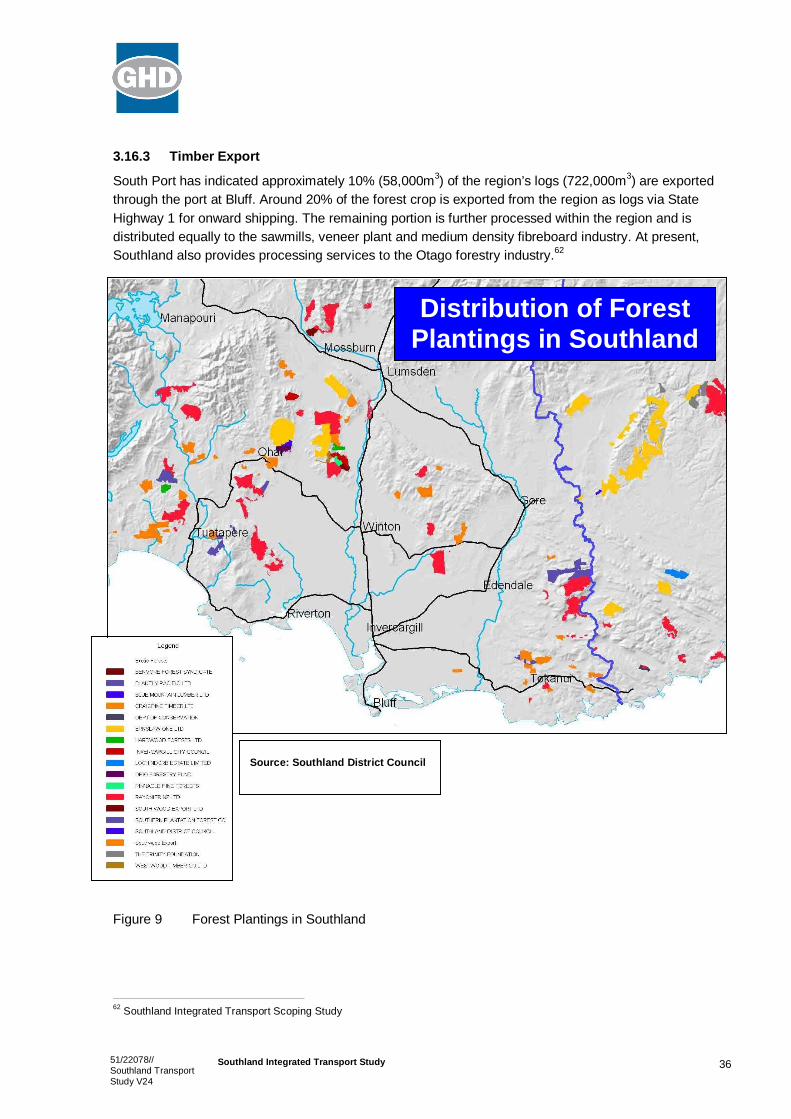
3651/22078//Southland TransportStudy V24
Southland Integrated Transport Study
3.16.3 Timber Export
South Port has indicated approximately 10% (58,000m3) of the region’s logs (722,000m3) are exportedthrough the port at Bluff. Around 20% of the forest crop is exported from the region as logs via StateHighway 1 for onward shipping. The remaining portion is further processed within the region and isdistributed equally to the sawmills, veneer plant and medium density fibreboard industry. At present,Southland also provides processing services to the Otago forestry industry.62
Figure 9 Forest Plantings in Southland
62 Southland Integrated Transport Scoping Study
Distribution of ForestPlantings in Southland
Source: Southland District Council

3751/22078//Southland TransportStudy V24
Southland Integrated Transport Study
Key Points:
» Impact of forestry traffic on local roads that have under strength pavements will increase;
» Forestry traffic is expected to grow by 34% over 20 years63;
» Conflicts between logging trucks and other road users;
» Deterioration of road surfaces, from the weight and intensity of use by heavy vehicles;
» Potential use of rail access. The Ohai branch line runs from Invercargill to Ohai or Wairio andcould potentially be used to transport logs to processing plants and ports;
» Strong transport flows to processing plants and ports;
» Increased use of nonarterial roads by heavy traffic;
» Increased use of unsealed roads by heavy traffic resulting in increased dust generation;
» Noise/vibration issues associated with the transport of heavy freight; and
» “Hubbing” of logs for transportation to processing plants and ports. This could involve onloading to rail.
3.17 Livestock TrafficThe droving of stock along public roads can be hazardous to other road users. However, with adequatewarning signage and careful management there will be instances when droving is appropriate, and, withregard to traffic volumes, a time of day when traffic movement is sporadic or ongoing. It is appropriate forsuch activity to be managed by territorial authorities, and SDC, GDC and ICC all have Stock DrovingBylaws in place. These bylaws, in conjunction with appropriate education, are considered the bestmeans of minimising traffic safety effects and damage to roads resulting from stock droving.
Wandering stock can also give rise to danger to road users. The Impounding Act 1955 allows animalcontrol officers to impound stock straying or wandering on roads. In addition, the Transit New ZealandAct 1989 and Local Government Act 1974 allow road controlling authorities to require landowners toadequately fence land adjacent to roads where public safety or convenience renders it expedient. Insome regions of New Zealand, territorial authorities also have in place bylaws to penalise owners whoallow substandard fencing to give stock access to public roads. Over the past ten years there has beena considerable increase in farmers seeking to move stock across roads. This is particularly evident in thedairying sector. As such stock movement can occur daily and over a period of several hours, it is highlydesirable for road underpasses to be used. Road controlling authorities provide a subsidy for theprovision of stock underpasses on existing roads. This is up to 25% of the total construction costs.
The riding of horses along public roads is increasing in popularity, but is still minor. Territorial authoritiesneed to consider whether any control of this activity is required.
63 Based on MAF Harvest Predictions

3851/22078//Southland TransportStudy V24
Southland Integrated Transport Study
Beef Farming7%
Mixed Livestock3%
Dairy Farming12%
Forestry14%
Deer Farming2%
Other Farmingand Idle Land
4%
Sheep Farming43%
Sheep/Beef/Cattle Farming
15%
Figure 10 New Zealand Farm Land by Farm Type
Probably New Zealand's bestknown statistic is that it has more than 20 times as many sheep as people(actually now close to 13 times as many). Grasslands have been developed to the extent that the bestsheep farms can carry up to 25 sheep per hectare throughout the year. The best dairy farms carry 3.5cows per hectare throughout the year. Trends in livestock numbers are largely determined by worldmarket prices for farm products, including meat, wool, dairy products and, more recently, venison, andgoat fibre.
Over the last 14 years the Ministry of Agriculture and Forestry (MAF) records that the sheep populationhas declined from 70.3M at June 1982 to stand at around 46.2M at June 1999. The beef cattlepopulation was around 4.4M at June 1999 and the total number of dairy cattle at June 1999 is estimatedto have also risen to being around 4.4M. There are currently around 1.2M deer in New Zealand.64
Although there is a move away from pastoral (sheep and beef) farming towards dairy in the Southlandregion, there is still significant demand placed on the road network to service the delivery of livestock tothe meat processing plants (road) and the onward movement of meat for export (rail). In fact the majoruser of road freight services in Southland is the meat processing industry. According to Butcher Partner’sestimate, nearly a quarter of all demand for road freight services comes from the meat processingindustry.65
Key Points:
» Livestock continues to generate significant HCVs that have an impact on the local roadnetwork and road users.
64 Statistics New Zealand: www.stats.govt.nz65 Butcher and Partners estimate in Road Freight – Its significance for regional economics, April 2003

3951/22078//Southland TransportStudy V24
Southland Integrated Transport Study
3.18 Mining TrafficFigure 11 shows the location of New Zealand’s coalresources.
(Note: production numbers are from 2002.)
» All North Island coal is subbituminous in rank;
» West Coast coal is bituminous;
» Virtually all of the Southland/Otago coal is lignite; and
» The Canterbury deposits are not significant.
Mining costs for lignite are usually lower than those forbituminous and sub bituminous coals as lignite coals areusually nearer the surface. Transport costs do not varywith coal type; they are similar on a per tonne/km basis.However, lignite has the highest water content, typically45%. Southland Coal Region has New Zealand's largestcoal resource, mostly in the extensive lignite deposits ofEastern Southland. The region has an inground resourceof 9,392 Mt, representing 60% of New Zealand's totalresource; the recoverable resource of 6,256 Mt is 71% ofthe New Zealand recoverable total.66
Table 11 below shows New Zealand’s recoverable coal reserves, and illustrates Southland’s significantcoal reserves. They are split by coal type.
Table 11 New Zealand’s Recoverable Coal Reserves67
Area TotalRecoverable
Lignite (Mt) Sub Bituminous(Mt)
Bituminous (Mt)
Northland 0 0 0 0
Waikato 714 0 714 0
Taranaki 173 0 173 0
Nelson 0 0 0 0
West Coast 343 0 20 323
Canterbury 2 0 2 0
Otago 1154 1154 0 0
Southland 6256 6206 50 0
Totals 8642 7360 959 323
66 Source: Solid Energy67 Source: Crown Minerals Website
Figure 11 New Zealand’s coal resources
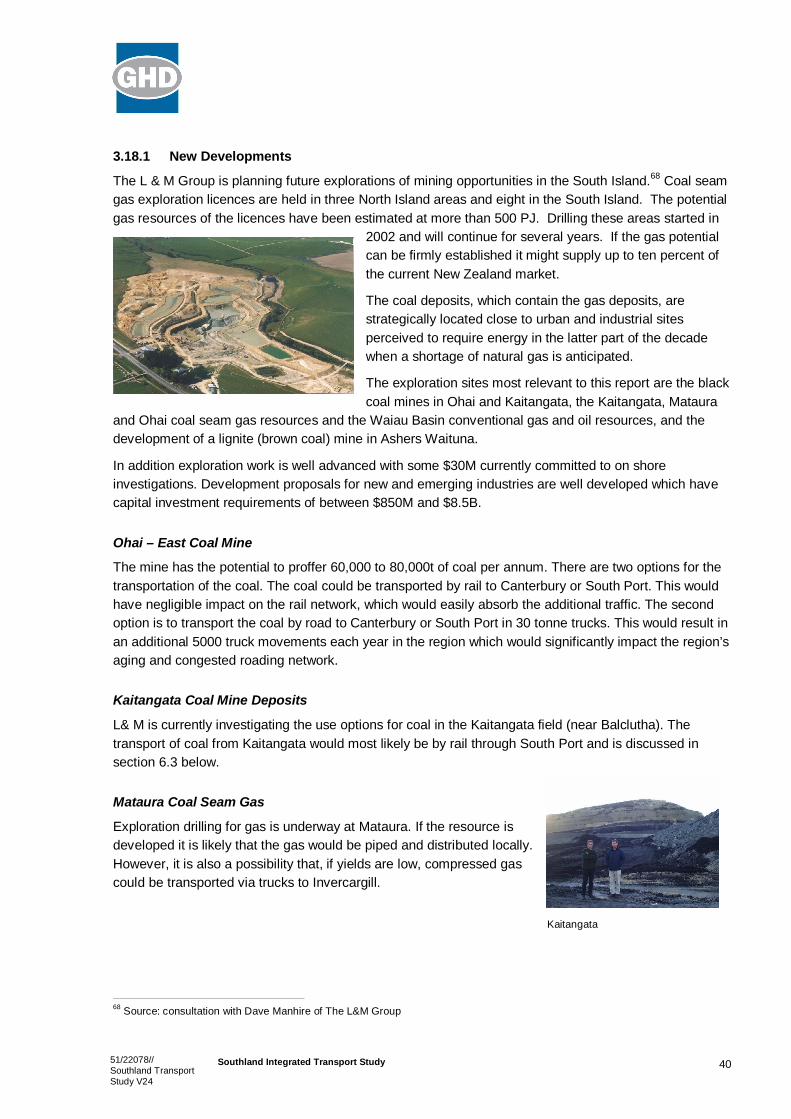
4051/22078//Southland TransportStudy V24
Southland Integrated Transport Study
3.18.1 New Developments
The L & M Group is planning future explorations of mining opportunities in the South Island.68 Coal seamgas exploration licences are held in three North Island areas and eight in the South Island. The potentialgas resources of the licences have been estimated at more than 500 PJ. Drilling these areas started in
2002 and will continue for several years. If the gas potentialcan be firmly established it might supply up to ten percent ofthe current New Zealand market.
The coal deposits, which contain the gas deposits, arestrategically located close to urban and industrial sitesperceived to require energy in the latter part of the decadewhen a shortage of natural gas is anticipated.
The exploration sites most relevant to this report are the blackcoal mines in Ohai and Kaitangata, the Kaitangata, Mataura
and Ohai coal seam gas resources and the Waiau Basin conventional gas and oil resources, and thedevelopment of a lignite (brown coal) mine in Ashers Waituna.
In addition exploration work is well advanced with some $30M currently committed to on shoreinvestigations. Development proposals for new and emerging industries are well developed which havecapital investment requirements of between $850M and $8.5B.
Ohai – East Coal Mine
The mine has the potential to proffer 60,000 to 80,000t of coal per annum. There are two options for thetransportation of the coal. The coal could be transported by rail to Canterbury or South Port. This wouldhave negligible impact on the rail network, which would easily absorb the additional traffic. The secondoption is to transport the coal by road to Canterbury or South Port in 30 tonne trucks. This would result inan additional 5000 truck movements each year in the region which would significantly impact the region’saging and congested roading network.
Kaitangata Coal Mine Deposits
L& M is currently investigating the use options for coal in the Kaitangata field (near Balclutha). Thetransport of coal from Kaitangata would most likely be by rail through South Port and is discussed insection 6.3 below.
Mataura Coal Seam Gas
Exploration drilling for gas is underway at Mataura. If the resource isdeveloped it is likely that the gas would be piped and distributed locally.However, it is also a possibility that, if yields are low, compressed gascould be transported via trucks to Invercargill.
68 Source: consultation with Dave Manhire of The L&M Group
Kaitangata

4151/22078//Southland TransportStudy V24
Southland Integrated Transport Study
Ohai Coal Seam Gas
Exploration drilling and preliminary modelling has been completed for the Ohai coal seam gas resourceand pilot development planning is currently underway. Distribution of the processed gas could be bytruck (perhaps as far as Wanaka and Queenstown), by pipeline or to a local power plant.
Waiau Basin Petroleum Resources
The Waiau Basin is located West of Invercargill. Exploration drilling is scheduled for early 2006. Thebasin has good indication that hydrocarbons are present but few wells have been drilled to date. In afrontier basin the chance of success in early weeks is 1520%.
Ashers Waituna Lignite Mine
Exploration in the 1980’s has established the presence of a substantial resource of lignite at AshersWaituna. The total inground resource is in the order of 1000Mt and the recoverable resource is inexcess of 500Mt. L&M has carried out further appraisal of the resource including further drilling andmodelling. The company is engaged in prefeasibility studies to determine the viability of a largescalecoal to gas to liquid project.
This project could produce up to 50,000 barrels per day of diesel or equivalent liquid from a mineproducing up to 20Mt per year. The method of transporting the fuel oil from the mine site to South Porthas yet to be identified. However, if the roading network is utilised, the requirement would be equivalentto approximately 300 to 400 truck movements one way per day. The demands resulting from the AsherWaituna lignite mine would have significant impacts, and place further stress, on the ageing roadingnetwork from east of Invercargill to South Port.
Figure 12 Southland Mining Developments
Invercargill
Winton
Mataura
Ohai
Waiau Basin
Kaitangata
Key
Black Coal Mine
Gas Mine
Lignite Deposits
AshersWaituna
Morton Mains
Waimatua

4251/22078//Southland TransportStudy V24
Southland Integrated Transport Study
3.19 BridgesWithin the Southland District, the Council owns and maintains a rangeof structures spanning waterways and railways and acting as stockcrossings.69 There are 42 posted bridges out of 935 total (excludingstock underpasses). A sixyear review currently underway may resultin more additional postings. The bridge network is in generally goodcondition due to a regular inspection and maintenance programmethat has identified faults, and repairs have been made before theythreaten the capacity of the structure.70 The ICC maintains 51 bridgeswith a total length of 1436 metres. The bridges vary in size from small single spans to large multi spanconcrete bridges. The bridges form a vital link in the roading network and any damage or problems withthem can cause disruption to many sectors of the community. All ICC bridges are inspected regularly forany damage or change such as the condition of the road surface, missing or damaged sign markers,safety of railings and guardrails.71
There are 104 bridges in the Gore District, 3 of which are not on maintained public roads. Approximately22 are constructed of timber, 3 of which have steel beam components.
3.19.1 Tiwai Bridge
New Zealand Aluminium Smelters Ltd (NZAS) is New Zealand’s only aluminium smelter, producing350,000t of aluminium each year, including the highest purity aluminium in the world. The metal is highlysought after for high quality products including 40% of the capacitors for cell phones worldwide and thewings of the Airbus A380. As well as being a significant contributor to the national economy, thecontribution of NZAS to the Southland regional economy is clearly significant and a large number ofpeople owe their employment either directly or indirectly to the presence of NZAS.
Access for employees and maintenance services to the NZAS is via the Tiwai Bridge, which runs offTiwai Road, over Awarua Bay. The bridge is approximately 500m long and is made up of 27 spansapproximately 18m long each. The 35yearold structure is subject to serious structural deterioration andwill require a significant capital expenditure to ensure its survival.
In a report conducted by MWH72, initial testing and inspection of the bridge showed that there issignificant deterioration of the bridge in a number of areas including the pile caps, deck beams, deck side
69 Advanced Asset Management Plan (MWH)70 Advanced Asset Management Plan (MWH)71 www.icc.govt.nz72 MWH Tiwai Bridge Evaluation and Repair Design November 2004
Key Points:
» Future mining prospects have the potential to significantly increase the volume of heavyvehicles using the roading network; and
» At this time the effect on the transport network is uncertain.

4351/22078//Southland TransportStudy V24
Southland Integrated Transport Study
protection and protective abutment sea wall and sheet pile walls. MWH recommended the 80% Class Irestriction should be placed on the bridge to ensure the safety of the users of the bridge and thisrestriction, with a 30 km/hr limit, is currently in place on the bridge.
These posting limits have a severe impact on NZAS’s operations and require a change in operatingprocedures until strengthening or replacement can be carried out. As a direct consequence of the bridgerestrictions NZAS is incurring approximately $30,000 a month in additional outgoing freight charges andNZAS have made it quite clear that the present deteriorated state of the bridge requires urgent attention.
It appears likely from subsequent MWH reports that the bridge is in need of full replacement, at a cost inexcess of $10M. Current estimates put this figure at $12M.73 If this is the case, the issue is obtainingfunding for such a replacement. A coarse benefit cost analysis indicates that a total bridge replacementbased on a capital cost of $10M is greater than 1.0. The bridge is fundamental to the viability of NZASand the Southland region and hence has a strong case for R funding. There are a number of otherpossible private/public funding sources and further investigation needs to be made into the viability andacceptability of all potential funding sources.
For further information, please see the Tiwai Bridge Report in Appendix I.
Key Points:
» The Tiwai bridge either requires substantial strengthening works or replacement; and
» Obtaining the necessary funding for the Tiwai Bridge replacement or strengthening isparamount.
3.20 Milford Road (State Highway 94)State Highway 94 is the only road access corridor to Milford Sound in the Fiordland National Park andbegins in the gateway community of Te Anau. As an undoubted iconic tourist destination, Milford Soundattracts high numbers of tourism traffic, comprised of tour buses, campervans and private vehicles. Thebeauty of the Milford Road itself is considered a major part of the Milford Sound experience, and needsto be maintained to a high standard of safety. Currently, on average 800 vehicles travel along this routeper day, 25% of which are buses. At peak times during the day, the high quantity and combination ofvehicles generates congestion at parking areas and certain sections along the Milford Road.
The majority of tourists travelling by bus usually come by day from Queenstown, leaving early morningand returning in the evening, an 11hour trip. Because of the distance most buses and vehicles end uptravelling along the Milford Road at the same time, between 10am and 4pm, causing major congestionissues. It must be highlighted that the congestion issue is only relevant for a small number of summermonths in the year. However, it is apparent that visitor numbers and traffic volumes on the Milford Roadwill continue to increase resulting in a diminishing visitor experience, and increased congestion andsafety risk.
Other issues associated with the Milford Road corridor include safety, especially during the wintermonths and at the Homer Tunnel, concerns about the lack of driver awareness of difficult roadconditions, and conflicts between vehicles, particularly buses and light traffic.
73 Figures are taken from the Southland Regional Land Transport Committee letter to LTNZ regarding regional recommendationsfor the allocation of R funding.

4451/22078//Southland TransportStudy V24
Southland Integrated Transport Study
There are currently a number of alternative options being considered that attempt to enhance the MilfordSound transport experience. These options have been evaluated against certain criteria to determinetheir feasibility, suitability and acceptability. The Department of Conservation Draft Fiordland NationalPark Management Plan also outlines a series of criteria, working closely with Transit NZ, to whichvarious proposals regarding access to the Fiordland National Park would be evaluated. There are also anumber of possible funding options surrounding these proposals.
Various proposals such as the commercial developments of a Gondola and/or Monorail will eitherproceed or not depending on normal commercial and consenting approval processes. It is the view of themajority of those consulted that the proposed link roads are unlikely to proceed due to a failure to gainfunding and consenting approvals. The upgrade of the highway and airport will proceed as demand andfunding allows. The Park and Ride and Booking System are considered viable options.
For further information, please see the Milford Report in Appendix E.
It appears from stakeholder consultation that a progressive move to control of traffic flows will occur overtime. These options would still require the proposed highway upgrades to provide a reduced traffic safetyrisk.
Key Points:
» Congestion at viewing points is lessening the visitor experience;
» A progressive move to control traffic flows is desirable;
» There are currently a number of alternative options being considered to enhance theMilford Sound transport experience. The proposed link roads are unlikely to proceed. Thecommercial operations are not true transport alternatives but rather different touristexperiences; and
» There are safety concerns associated with the Homer Tunnel.
3.21 Stewart IslandMWH has produced a detailed Stewart Island RoadingStrategy.74
The roading network on the island links a series of smallbays. The access to the Island is by boat or plane andthe network links the sea and airports with the township,scattered housing and access to various tourist interestpoints and track entries. The township of Oban is the hubof this network and it is the location of the Island’scommunity services, commercial and industrial areas.The roading network is built on weak soils and eitherhugs the coastal strip (that is prone to damage during
74 MWH Southland District Council Stewart Island Roading Strategy, June 2003
Source: www.backpacknewzealand.com
4551/22078//Southland TransportStudy V24
Southland Integrated Transport Study
storms) or sidles along ridges and up steep faces. For these reasons the network is very prone to coastalerosion or slips. With higher than the national average rainfall (1500mm per year) good drainage isessential.
The island was historically used as a fishing base but has developed into a key tourist destination andnumbers on the island will continue to grow as increased numbers of people migrate to the island toservice the rapidly expanding tourism industry. The island has had a base of tourism that consisted ofmainly New Zealanders coming to the island for fishing, hunting, tramping or relaxing. The objectives ofthe roading strategy are to:
» Describe the network function, together with the physical, economic and social environmentsurrounding it;
» Identify current and future needs of the network, including land use changes and traffic patternchanges as a result of the Rakiura National Park development;
» Identify lengths of roadway that are affected by or susceptible to erosion or slumping from geological,stormwater or coastal influence;
» Identify and assess efficiency and safety deficiencies, both for current and future road users andprioritise improvements to address these deficiencies;
» Identify and assess road user services, community services and environmental issues associatedwith the network; and
» Develop strategies to manage land use and environmental issues associated with the network.
There are a number of potential issues surrounding the Stewart Island transport network. There areincreasing numbers of tourists arriving on the island following the creation of the Rakiura National Park.Visitor nights on the island are expected to grow from 38,000 to 77,500 by 2015.75 An improvedpassenger ferry service is placing pressure on the roading and pedestrian infrastructure on StewartIsland. There is a lack of pavements for walking and as a result many tourists walk on the road creatingsafety and vehicle/pedestrian conflict issues.
The number and location of Boat Ramps should be investigated to see if the problems of overcrowdingand parking that are evident at Thule ramp (at the end of Rankin Street) can be overcome. Increasedparking area at the Thule ramp should be constructed. An alternative option to improve this situationwould be to encourage the use of another site.
There is a need for long term parking of vehicles, boats and trailers. There is one project that provides forlong term paid parking opposite the Community Centre on Ayr Street. As future demand increases forshortterm car parking, the area opposite the Community Centre should be used for this parking.Preferably longterm parking should be provided for in an industrial area.
There is a major problem with congestion at the wharf especially with parked vehicles. There have beenseveral options proposed. The parking solution proposal in the “Guidelines for Development” will gosome way towards solving the parking issue but time limits should be set on parking at this location.
There is a conflict on Stewart Island between maintaining character and integrity, and providing safety.
75 Stewart Island Tourism Trends – Venture Southland Report

4651/22078//Southland TransportStudy V24
Southland Integrated Transport Study
Key Points:
» There are increasing numbers of tourists arriving on the island;
» Vehicle/pedestrian conflict issues;
» The number and location of Boat Ramps requires rationalisation;
» There is a need for long term parking of vehicles, boats and trailers; and
» There is a major problem with congestion at the wharf especially with parked vehicles.

4751/22078//Southland TransportStudy V24
Southland Integrated Transport Study
4. Passenger Transport
Summary
» Passenger transports consist of long distance bus services, bus services withinInvercargill and ferry services between South Port and Stewart Island; and
» Ferry commuters between Bluff and Stewart Island believe this service should besubsidised.
The Southland passenger transport system consists of anumber of long distance bus services that operate withinthe region as well as public transport services that operatewithin Invercargill. Public transport services are difficult tosustain within the region as only Invercargill has the sizeand density to enable timetabled bus services to attractsufficient patrons. Environment Southland transferred itspassenger transport function to ICC in April 2001 because itwas unwilling to continue to rate all the region’s ratepayersto administer a predominantly Invercargill based service.The transfer included the responsibility to prepare a
Regional Passenger Transport Plan and to manage the total mobility schemes within the region.
A ferry service operates between Stewart Island and Bluff, connecting the island with the mainland. Thisferry, the ‘Stewart Island Experience’, operates daily scheduled ferry services between Bluff and StewartIsland. Currently there is an issue with locals commuting to Stewart Island by way of the ferry as theybelieve that the ferry trip should be subsidised, in a manner similar to other subsidised transport. Thecurrent cost of a trip on the ferry for adults is $45, and for children, $22.50. Subsidising the ferry trip hasbeen ruled out by LTNZ.
Public sector involvement is desirable in subsidising services for the transport disadvantaged, both inurban areas (with ICC currently managing total mobility schemes with both Invercargill and Gore) and inrural areas. Provided that funding is made available, retention and possibly expansion of total mobilityservices can be anticipated in the future. Tourism related passenger transport is also anticipated to growin importance.76
Public or passenger transport vehicles include the timetabled bus service, school buses, regulatedtransport services between towns and regions (including buses and shuttles), and passenger rail, boatand air services. It is an important mode of transport for the region. It reduces air emissions and providesresidents who cannot drive or are without cars with access to the region’s facilities and other centres.
Passenger transport assists in reducing the number of people walking, cycling or travelling along roads,either as individuals or small groups. As a consequence, passenger transport assists in improving roadsafety and reducing energy consumption. These benefits are perceived as greatest in urban areas,although only within Invercargill are timetabled bus services provided. This is a contracted service, and
76 Southland Regional Transport Strategy

4851/22078//Southland TransportStudy V24
Southland Integrated Transport Study
subject to the Regional Passenger Transport Plan prepared by the ICC. To be successful, contractedservices need to:
» Travel routes, and at times, that suit potential passengers;
» Provide vehicles that are convenient to use and safe; and
» Generate revenue at a level that justifies the continuation of the service.
The Regional Passenger Transport Plan also deals with the implementation of ‘Total Mobility’ servicesfor those people with disabilities in Invercargill and Gore. The Plan does not however consider the waysto assist people with disabilities in the rural areas of Southland.
A report into accessible public land transport77 has found that barriers in one form or another unfairlyprevent many disabled people from using public land transport to go to work, to go to school, to enjoycommunity activities and fully participate in society. At the same time, the report highlighted that there isgrowing public acceptance that improving the accessibility of public land transport will benefit bothdisabled people and all New Zealanders. The report recommends changes to legislation, regulations,policies, procedures for funding arrangements and improvements that can be achieved in the short termwith minimal expenditure. These recommendations are aimed at complementing and giving practicaleffect to the New Zealand Disability Strategy and the New Zealand Transport Strategy.
Where passengers wait to use public transport, associated facilities are required, in the form of vehiclestopping areas, passenger shelters and other associated facilities.78
Encouraging passenger transport and developing passenger transport networks of high standard areintegral to achieving Governments five objectives for transport detailed in the New Zealand TransportStrategy (2002), these being:
» Assisting economic development;
» Assisting safety and personal security;
» Improving access and mobility;
» Protecting and promoting public health; and
» Ensuring environmental sustainability.
The National Land Transport Programme 2005/06, has allocated passenger transport funds as follows:79
Environment Southland $200
Invercargill City $751,400
Key Points:
» Locals desire that the Stewart Island Ferry be subsidised in a manner similar to othersubsidised transport.
77 The Accessible Journey – Report of the Inquiry into Accessible Public Land Transport, Human Rights Commission, September2005
78 Southland Regional Transport Strategy, June 200379 National Land Transport Programme 2005/06
4951/22078//Southland TransportStudy V24
Southland Integrated Transport Study
4.1 Invercargill City Passenger TransportThe ICC Roading Facilities and Services department is responsible for the provision of public transportas a discretionary activity80. The Council contracts out the bus service and Passenger Transport Ltdcurrently holds this contract. Owing to high public demand and a growth in people using public transport,the Council has introduced a number of new services. These include additional bus routes, a free daytime bus service, and buses with low floors which allow people to enter at footpath level, making enteringand leaving the bus easier for people with disabilities, young children, prams and walking frames and theelderly81.
Passenger transport figures in Invercargill City have shown a steady increase over the last three years:82
2002/03 488,750
2003/04 491,750
2004/05 525,218
The ICC’s objective, as stated in the 2003/04 Annual Plan, is to ensure that an appropriate level of publictransport is available to assist everyone to fully partake in the community’s activities. The strategy forachieving this objective is to continue to investigate improvements to the current bus routes and services.
80 Invercargill City Council LTCCP 2004/05 – 2013/1481 Invercargill City Council website: www.icc.govt.nz82 Personal communication: Tom Greenwood, Invercargill City Council
5051/22078//Southland TransportStudy V24
Southland Integrated Transport Study
5. Cyclists and Pedestrians
Summary
» There is a general lack of cycling networks in the region; and
» Road user and cyclist/pedestrian conflicts are an issue particularly on Stewart Island.
A concerted and collective action is required to ensure that walking and cycling can flourish as modes oftransport and that our transport systems support and encourage their use. The policy framework forGetting there – on foot, by cycle is provided by the New Zealand Transport Strategy (2002).
Walking is the most common active leisure activity among New Zealand adults, while onroad cyclingfeatures in the active leisure of one in five young people. Because the road environment is a commonsetting for leisureoriented walking and cycling, improving the onroad environment for pedestrians andcyclists is expected to benefit those who walk and cycle for leisure.83
In the ICC region the number of pedestrian casualties fell to 22 in 2004. At eight percent of all casualtiesthis is the same as the national rate. However, as with other user groups, the 15 to 19 year age range isoverrepresented in Invercargill. More than twice as many pedestrians of this age have been injured overthe last five years than any other age group. For the third consecutive year the number of cyclists injuredfell and, at 13, is now below the national average for the first time in 10 years. The 10 to 14 year agegroup has made up nearly one third of cyclists injured since 2000, a figure slightly higher than for the restof the New Zealand.84
For the same year (2004) in the Gore District three cyclists and one pedestrian were injured,representing a downward trend. In the Southland District three cyclists and seven pedestrians wereinjured, the highest number in 20 years.85
Increasing numbers of tourists, following the creation of the Rakiura National Park and improvedpassenger ferry services, is placing pressure on the roading and pedestrian infrastructure on StewartIsland.
5.1 WalkingThe 1997/98 New Zealand Household Travel Survey estimated that in Southland only one in eight tripsare made on foot, compared to Wellington and Taranaki where one quarter of trips are made on foot.This is primarily due to Southland’s significant rural population.
Within the urban areas of Southland, the majority of short distance trips are undertaken by walking. Evenwhere other modes of transport are used, the journey frequently begins and ends with walking. Over 6%of Southland’s population walk or jog to and from work and considerably more children walk to and fromschool. Many people also walk for pleasure, and to improve their fitness (either on footpaths, beaches orwalking tracks). The greatest issues for walkers are:
83 Getting there – on foot, by cycle 200584 Land Transport New Zealand Safety Issues Reports 2005 Invercargill85 Land Transport New Zealand Safety Issues Reports 2005 Southland, Gore and Invercargill

5151/22078//Southland TransportStudy V24
Southland Integrated Transport Study
» Protection from weather, particularly in shopping areas, where verandas are able to be provided;
» Avoiding conflict with other road users, with footpaths being required; and
» Safety outside daylight hours, particularly in winter months with lighting being required on frequentlyused routes.
By addressing these issues, encouragement would be given to greater numbers of people to adoptwalking as a mode of transport in the future.
5.1.1 Tramping
Some parts of Southland are not served by road, and tramping provides the one means of access.Tramping is environmentally friendly and has minimal impact. In areas where wilderness, isolation andnatural values are to be protected then tramping may be the only form of access that is appropriate.Certainly, Southland contains some of the premiere tramping tracks in the world, including the Milford,Routeburn, Kepler and Hollyford tracks. The Department of Conservation maintains 199 walking trackswithin Southland totalling 1,166 km. This network includes: 114 huts, and 3,650 structures (such asbridges and sections of boardwalk). Over time increasing use of these tracks and tramping activity cangenerally be expected. That will bring with it issues that the Department of Conservation will need toconsider.86
5.1.2 Footpaths
The footpath area is defined as being the area between the property boundary and the kerb and channel.The purpose of footpaths is to provide a safe and efficient network of access ways catering for themovement of pedestrians. The need to provide footpaths is based on a combination of the traffic volume,road width and pedestrian demand. They also fulfil a social function providing areas with a sense ofcommunity.87
The age profile for footpaths within the Southland District is based on the construction dates, whichrange between the 1950’s and 2003, with the bulk of the asset being dated between the 1980’s and themid 1990’s.88
Footpaths in the Gore District have a greater age range with some very old coal tar asphalt footpaths stillin service. Gore District has a continuing programme of replacement of faulty footpaths. A limited amountof new footpaths are also constructed each year.
There are 494 km of footpaths within Invercargill City with a replacement cost of $28.9M.
5.2 CyclingThe beneficial effects of cycling are widely recognised:
» It is environmentally friendly and sustainable;
» It is a viable alternative to motor vehicles, particularly on short trips where terrain is flat;
» It offers health benefits by providing physical activity; and
86 Proposed Southland Regional Transport Strategy87 Advanced Asset Management Plan (MWH)88 Advanced Asset Management Plan (MWH)
5251/22078//Southland TransportStudy V24
Southland Integrated Transport Study
» It is cost effective.
As a mode of transport, however, cycling is not presently extensively used in Southland. The results ofthe 2001 Census indicate that only 2% of people use a bicycle to travel to work in Southland. In 1996,this figure was 3%. However, significantly greater numbers of school children cycle to and from schoolsthroughout the region. Small numbers of tourists travel by cycle.
Given the relatively flat terrain of much of Southland, cycling offers a viable mode of transport. Increaseduse of cycles would be achieved by the provision of dedicated cycle lanes and consideration of theneeds of cyclists on strategic roads (State Highways). Wider carriageways and smoother shoulders onmain roads and tourist routes would alleviate perceived and actual safety concerns.89
There are plans in place to extend the recently completed $170,000 Otepuni cycle way, which runs alongthe Otepuni Stream from Rockdale Road to Elles Road, right into Forth Street in Invercargill city. In theSouthland District the route between Mt Nicholas and the Mavora Lakes is becoming a popular mountainbike attraction. The Southern Scenic Route is being promoted as a route not only for vehicles but alsocyclists.
LTNZ are funding cycle ways and cycle lanes within Invercargill, having spent $120,000 paintingmarkings on the roads in 2004.90 Transit has widened several narrow bridges and other bridge wideningwork is proposed. The main driver for these works is safety, with increased bridge width also improvingcyclist safety. The widening of key sections of Southland’s State Highways would increase safety forcyclists.
Key Points:
» Projected increases in heavy vehicle movements would heighten safety concerns for otherusers, including cyclists and pedestrians;
» Widening of key sections of State Highways necessary;
» Lack of cycling networks and infrastructure to meet sports, leisure and tourist demand;and
» Road user and pedestrian conflicts on Stewart Island.
89 Proposed Southland Regional Transport Strategy90 Invercargill City Council News 27/04/2004

5351/22078//Southland TransportStudy V24
Southland Integrated Transport Study
6. Rail
Summary
» Coal is a significant product transported by rail;
» The Ohai line has a weight restriction of 16t with the line travelling over three substandardbridges while parts of the line are prone to damage from flooding; and
» There is the potential for upgrade and an increase to transport other bulk products.
The existing rail freight service in Southland is limitedto the South Island Main Trunk Line and the OhaiBranch Line. Notwithstanding the limited area served,rail is a significant carrier of freight into and out of theregion. Short haul services are also available,particularly to and from the Port of Bluff. A number ofSouthland’s large industries have sidings providingdirect access to their site.
The South Island Main Trunk Line is the main railroute in Southland. It runs from the Port of Bluff for110 km to the regional boundary at Arthurton,generally following the same alignment as State
Highway 1. The Ohai Branch Line runs for 79 km from Invercargill to Ohai. The line is a significant freightroute, with principal freight including refrigerated meat products for export from the Makarewa andLorneville freezing works, and coal from Ohai to supply markets in Otago and Canterbury. The line isgenerally in a poor state of repair and is operated on a maintenance only basis partly because of thedecrease in rail freight due to the increased trucking of freight by road. However, there is considerablescope for future traffic growth on this line mainly from development of further longterm coal reserves atOhai. The recent discovery that the Maui gas reserves are lower than originally estimated may wellimpact on coal production levels at Ohai and thus increase volumes on the rail line.
A small tourist line operates between Fairlight and Kingston, where the steam train the Kingston Flyeroperates. With the exception of this passenger service, all train traffic in Southland relates to the carriageof goods and cargo. However, the presence of rail lines enables the reintroduction of passenger servicesat any time in the future. Venture Southland holds the view that with a sound marketing strategy apassenger rail service, predominantly for tourists, could operate successfully between Invercargill andother main centres of the South Island.
Rail provides an alternate and sometimes more economic means of moving freight and it can also assistin reducing the number of heavy vehicles carrying freight on roads. Therefore future traffic growth mayoccur on both the Main Trunk Line and the Ohai Branch Line as a result of increased public demand forimproved road safety and environmental concerns. In November 2002, the Transfund Board approved$10,000 for the evaluation of options for the existing rail access to the Edendale Dairy Factory, with theother half of the evaluation being jointly funded by Environment Southland, SDC, New Zealand MilkProducts and Toll. The project has the potential to reduce the amount of bulk milk currently being
Rail facility at Southport. (Image courtesy of South Port)
5451/22078//Southland TransportStudy V24
Southland Integrated Transport Study
transported by road to and from the factory.91 If this project is to proceed it will need to be funded byOnTrack as LTNZ is no longer funding the alternatives to road (ATR) scheme. The project will tie intoTransit New Zealand’s Edendale realignment project.
Increasing the amount of freight and number of commuters using rail, is the focus of The National RailStrategy to 2015, which was launched recently. The aim of the strategy is to move people out of cars forurban journeys, and freight off roads, wherever possible. The development of rail can help deliver gainsin terms of economic growth, reduced congestion, safety, personal security and health. The Strategyprovides a framework to develop rail in order to realise these potential benefits.92.
The Strategy’s priorities include:
» Improving safety;
» Upgrading the network;
» Improving rail’s contribution to regional economic development;
» Optimising the use of rail within the wider transport network; and
» Improving access to rail users.
With the exception of the tourist line at Kingston, all rail traffic in Southland is concerned with the carriageof goods and cargo rather than passenger services. There is potential to develop the lignite resources ofthe Southland coal region, which makes up 71% of New Zealand’s recoverable coal resources. Thiswould have secondary effects on the transport network in terms of transportation of coal.
As land use intensifies road use by heavy vehicles will increase, especially as there are limitations toalternative forms of transport such as rail and coastal shipping.
There are three rail lines in Southland, the main trunk line which runs north from Invercargill to Dunedin,the Ohai Line which services the coal mine at Ohai and the freezing works at Makarewa, and the Bluffline which predominately services South Port. The Ohai and Bluff lines intersect with the main trunk linein Invercargill. Figure 13 over shows the Southland rail network.
91 Proposed Southland Regional Transport Strategy92 MOT Report July 2005

5551/22078//Southland TransportStudy V24
Southland Integrated Transport Study
Figure 13 Southland Rail Network
6.1 The Ohai Line
Current Situation
The Ohai line runs for 79 km from Invercargill inland to Ohai. This line is currently fit for use but does notmeet main line standards and includes weightrestricted bridges (Bridge 9 Branxholme; Bridge 22Aparima). The line is primarily used to transport coal from the Ohai Coal Mine and refrigerated meatproducts from the meat processing works located near Makarewa (west of Invercargill). Currently onecoal train per day (to Ohai return) and two shunt services to the freezing works use the line.
Axle loads on the line are restricted to 16t axles due to the lightweight 70pound rail. The line fromInvercargill to Wairio (66 km) is subject to 40 km/h speed restrictions due to the condition of the track.The line from Wairio to Ohai (13 km) is subject to 25 km/h speed restriction due to the condition of thetrack.
Approximately 90% of production from the Ohai mine is supplied to Fonterra at Clandeboye (SouthCanterbury). Coal trains are loaded at Ohai and run to Temuka where the demountable containers aretransferred to truck and transported to Clandeboye (Fonterra factory). This is a oneway trip of 530 km.The main line to which the Ohai line joins, has an axle load of 18t so wagons are not fully loaded due tothe 16t restriction on the Ohai line, creating an inefficient operation.
There are several bridges on the line. Bridge 9 at Branxholme is wooden and is closed when floodwatersreach a specified risk level. Bridge 5 is a road underpass that has been hit several times by over heightvehicles passing underneath. Bridge 22 is similar in size to bridge 9 and crosses the Aparima River. In1984 the Aparima River flooded and washed away significant sections of the track. The risk of furtherflooding and damage to the line is an ongoing risk for the line.

5651/22078//Southland TransportStudy V24
Southland Integrated Transport Study
Despite rail running inefficiently due to axle restrictions, speed restrictions, high costs of bridgemaintenance and the risk of flooding on the Ohai line, rail is still a cheaper mode of transport whencompared to roading 90% of the Ohai mine product 530 km to Clandeboye.
If this line were repaired and transfer facilities in place then more goods could be carried by rail. There ispotential for logs to be transported and for use as a heritage tourism product.
Ohai Mine
Ohai Opencast Mine, at Ohai in Southland, is the replacement for the Wairaki No. 6 Underground Mine,which closed in August 2003. In February 2003 W Stevenson & Sons Ltd (Ohai Mining) won the contractto prove the longterm commercial viability of an opencast mine at Ohai, carrying out overburdenstripping and the initial coal winning in a pilot area. The Ohai mine produces approximately 140,000 tpa(tonnes per annum) of black coal and an extensive drilling programme completed in early 2003confirmed resources of 2 Mt, enough to supply existing Ohai coal customers for 15 years. Sales figuresare forecast to remain close to 140,000 tpa over the next few years.
New Developments
Ohai – East Coal Mine
L & M Mining is planning future explorations of mining opportunities in the South Island; most relevant tothis report is the possible development of a coal mine in Ohai. L&M is currently exploring on the site andadvise that the mine has the potential to produce 60,000t to 80,000t of black coal per annum.
There are two options for the transportation of the coal from Ohai. Firstly, the coal could be transportedby road to Canterbury or South Port. The second option is to transport the coal by rail to Canterbury orSouthport. Subject to the availability of suitable rolling stock, this additional volume would have negligibleimpact on the rail network, which would absorb the additional rail traffic.
6.2 The Main South LineThis is the main rail route in Southland and runs between Invercargill and Dunedin generally following theroute of State Highway 1 and then northwards to Christchurch and Wellington. The line provides afreight transport service.
The line has an 18 tonne axle capacity. The only significant line restriction is on the height of containersat one tunnel just north of Dunedin at Purakanui, through which 9’ 6’’ containers (on standard containerwagons) cannot pass.
6.3 New Developments
Kaitangata Coal Mine
L & M Mining has completed a preliminary appraisal of a coal mine at Kaitangata and has scheduledexploratory drilling at the site. It is estimated that the site will produce 100,000t to 150,000t of black coalif mining of the site proceeds. Transportation options for the coal have been briefly investigated. Thebarging of the coal across the Clutha River mouth at Balclutha is not a viable option and has beendismissed. Instead, it is likely that the coal will be transported by rail to South Port. It is anticipated thatthe existing line would easily absorb the additional rail traffic.

5751/22078//Southland TransportStudy V24
Southland Integrated Transport Study
6.4 Bluff LineThis line is 26.5 km long and runs between Invercargill and Bluff to service South Port, also providing afreight transport service. The line services light traffic and is maintained at branch line standards.
The line has an 18t axle capacity and can carry 9’ 6’’ containers. The line is subject to 40 km/hr speedrestrictions due to track condition.
Key Points:
» The main line to which the Ohai line joins, has an axle load of 18t so wagons are not fullyloaded due to the 16t restriction on the Ohai line, creating an inefficient operation;
» There are several bridges on the line that pose risks due to flooding and other damage;
» Despite rail running inefficiently due to axle restrictions, speed restrictions, high costs ofbridge maintenance and the risk of flooding on the Ohai line, rail is still a cheaper mode oftransport when compared to roading product to Clandeboye;
» If this line were repaired and transfer facilities in place then more goods could be carriedby rail. There is potential for some logs and milk to be transported and for use as aheritage tourism product; and
» Addressing the issues associated with this line would take traffic off roads, especiallylogging and dairying traffic. The potential for a hub at Otautau would alleviate some of thispressure. These options are currently being considered by Stakeholders along with otheralternatives to service the Edendale Dairy Factory.

5851/22078//Southland TransportStudy V24
Southland Integrated Transport Study
7. Shipping
Summary
» South Port is of regional significance to Southland and is one of 14 international oceangoing ports in New Zealand;
» Good transport links to the port are essential;
» The South Port harbour entrance is restricted to a maximum draft of 10m; and
» There is significant “leakage” of containers from the region with South Port capturing only17% of the potential total. A coastal feeder system would help South Port compete forcontainerised shipping.
New Zealand has a relatively large number of ports, with 14 ofthem referred to as ‘main ports’.93 Table 12 below shows how theycan be categorised as either major commercial ports able tohandle large ocean going ships (handysize or larger), smallcommercial ports handling coastal and TransTasman trades, orsmaller ports servicing fishing, small coastal or recreational/touristneeds.
The large ports have generally been that way since Europeansfirst settled in New Zealand.
Many of the third category were formerly in the middle (Coastal/Trans Tasman) group but have declinedin significance since then, often in the 1960’s and 1970’s as coastal shipping was overtaken byderegulated road transport and rail. In some areas such as Wanganui, local groups are trying toresurrect their ports.
Table 12 New Zealand Ports
Port International OceanGoing
Large coastal/
Trans Tasman
Fishing/SmallCoastal/Tourist/
Recreational
Tarakohe X
Port Motueka X
Nelson X
Port Marlborough X
Port Underwood X
Kaikoura X
Lyttelton X
93 Transporting New Zealand
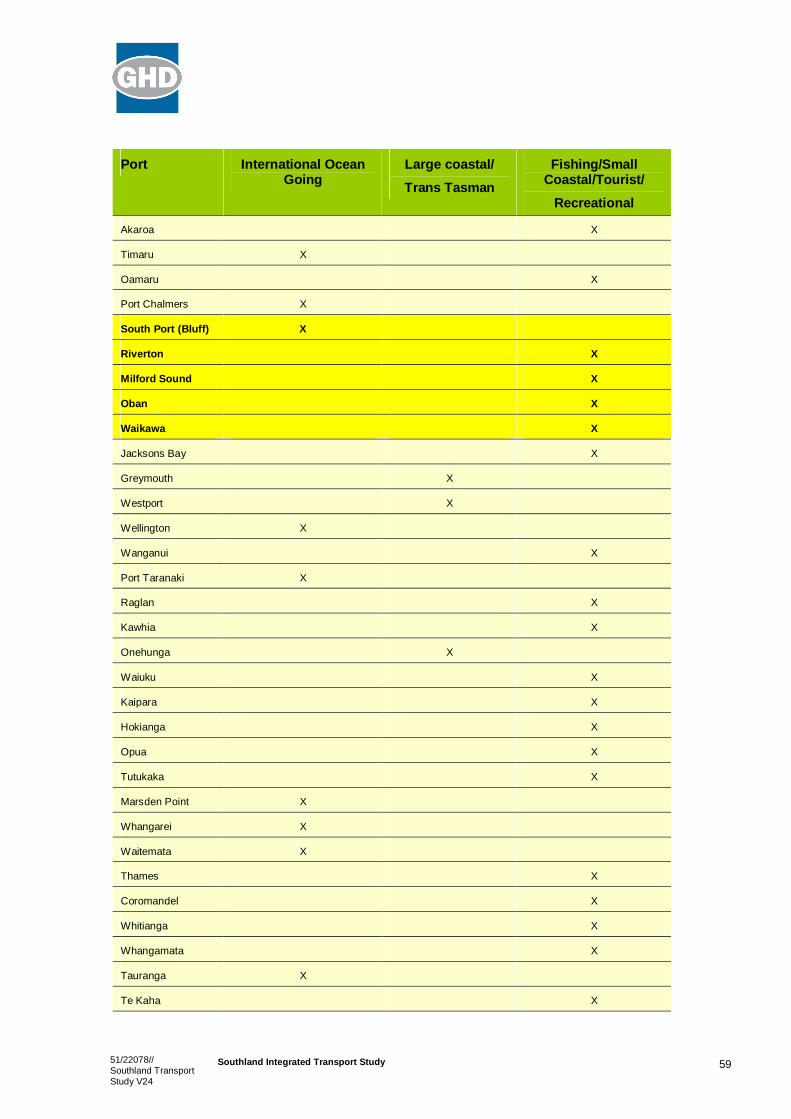
5951/22078//Southland TransportStudy V24
Southland Integrated Transport Study
Port International OceanGoing
Large coastal/
Trans Tasman
Fishing/SmallCoastal/Tourist/
Recreational
Akaroa X
Timaru X
Oamaru X
Port Chalmers X
South Port (Bluff) X
Riverton X
Milford Sound X
Oban X
Waikawa X
Jacksons Bay X
Greymouth X
Westport X
Wellington X
Wanganui X
Port Taranaki X
Raglan X
Kawhia X
Onehunga X
Waiuku X
Kaipara X
Hokianga X
Opua X
Tutukaka X
Marsden Point X
Whangarei X
Waitemata X
Thames X
Coromandel X
Whitianga X
Whangamata X
Tauranga X
Te Kaha X
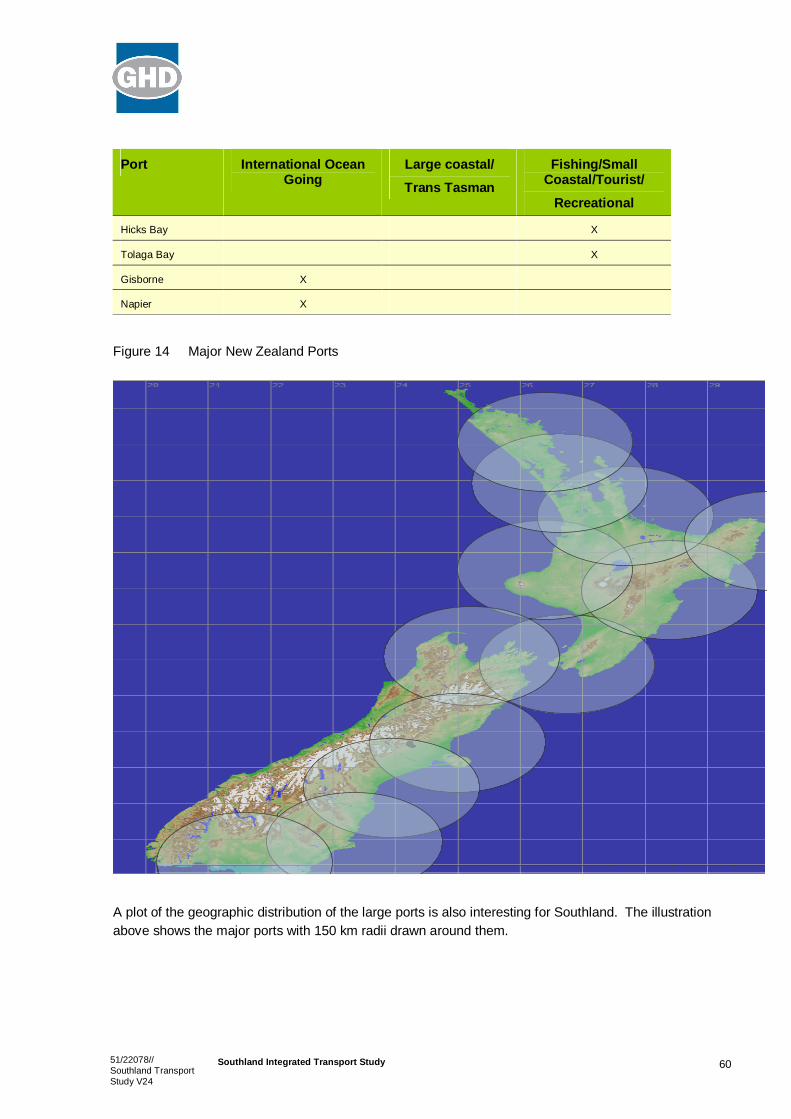
6051/22078//Southland TransportStudy V24
Southland Integrated Transport Study
Port International OceanGoing
Large coastal/
Trans Tasman
Fishing/SmallCoastal/Tourist/
Recreational
Hicks Bay X
Tolaga Bay X
Gisborne X
Napier X
Figure 14 Major New Zealand Ports
A plot of the geographic distribution of the large ports is also interesting for Southland. The illustrationabove shows the major ports with 150 km radii drawn around them.

6151/22078//Southland TransportStudy V24
Southland Integrated Transport Study
The following points should also be kept in mind:
» Ports are facilities with lifetimes measured in hundreds of years and contain classes of assets withlifetimes of scores of years. Shorterterm fluctuations in perceived demand for their services shouldnot allow their longterm futures to be compromised;
» New industries can emerge to replace traditional cargos at a port e.g. logs replacing meat, dairyproducts replacing wool;
» All industries based on minerals tend to have transport as a critical cost element. This is true forcement manufacture (product to market), gold mining (ore for processing) and coal (product forprocessing and to market); and
» Improvements in ship design and port management can drastically alter shipping economics.
The economic wellbeing of a region is a national issue and these assets should not be allowed to declineor disappear.
7.1 Shipping in the Southland RegionThe major port within the region is South Port (Bluff), which in 2004 catered for 2.15 Mt of cargo.Approximately 50% of this figure was New Zealand Aluminium Smelters cargo (alumina and aluminiumproduct). Other commodities include forest products (365,000t), petroleum imports (225,000t) andfertiliser imports (265,000t). Smaller ports, primarily used for tourism and fishing are located at:
» Milford Sound;
» Waikawa;
» Riverton; and
» Oban (Stewart Island).
Bluff is the main fishing port in Southland, being the base for 92 registered vessels in 2002. There arealso fishing ports established at Milford Sound, Waikawa, Riverton and Oban at Stewart Island. The portof Milford was the base for 9 registered fishing vessels in 2002, while the ports of Riverton and Obanwere the bases for 33 and 24 registered vessels respectively.
Much of the water transport in the region is associated with tourism with:
» Overseas cruise ships visiting New Zealand waters, principally Fiordland and to a lesser extentStewart Island and Bluff. Environment Southland’s code of conduct for cruise ships applies to theiractivities in Fiordland;
» Regular passenger services between Bluff and Oban; and
» Scenic and other tourist operations at Oban, Milford, Doubtful Sound, Manapouri and Te Anau.
These activities are all important for the economy of Southland. They can be expected to increase in thefuture, probably in proportion to increases in the number of international tourists coming to NewZealand.94
94 Proposed Southland Regional Transport Strategy

6251/22078//Southland TransportStudy V24
Southland Integrated Transport Study
7.2 South Port (Bluff)South Port New Zealand Ltd operates the major seaport servicing the Southland region at Bluff,approximately 27 km south of Invercargill. The port uses rail and road transport links with Invercargill forthe receipt and delivery of freight. The port has three cold stores, which have a storage capacity of10,000t. One of these stores is used exclusively by NZMP Edendale for storage of cheese destined forthe Japanese market. South Port owns 56 hectares of land with 15 hectares of this land available forfuture industry growth.
The port facilities are situated less than 2 km inside the entrance to Bluff Harbour, providing safeberthage in all weathers for a number of large vessels, fishing vessels and oyster trawlers. The depth ofwater in the port limits the size and range of vessels that can enter the harbour.
7.2.1 Access to South Port
From South Port’s perspective the quality of the associated infrastructure, the roads and rail, are criticalto the ongoing growth of the port at Bluff and the overall economy. Given the limitations of rail andcoastal shipping, it is inevitable that more intensive use of the land will increase the use of the road bytrucks. Customers need to be able to access the port without undue delay or cost therefore the quality ofthe roads and rail is critical to the ongoing growth of the port. Should the road and rail struggle to meetwith demand, this could have a negative impact on South Port operations.
Road transport is the major logistical partner for the port. South Port is also very supportive of rail andthe services provided by rail to South Port are a key part of the region’s infrastructure.
The Tiwai Bridge is also an issue for South Port in that the restrictions placed on the bridge result in theinability to transport full truck loads of export product to port facilities, which is increasing freight andtransport costs and reducing competitiveness.95
Road traffic accesses the port from the east via State Highway 1 and then uses the Kennington / BluffHighway, enabling heavy traffic to bypass the city. From the north, heavy traffic must currently use theState Highway 6 / Victor Avenue / Bond Street route which passes through the city. Land has beendesignated for the extension of Bond Street to divert heavy traffic away from the city centre. Constructionof the extension is programmed for late 2005.
In the reverse direction, phosphate is brought through Bluff to the fertiliser works, with further distributionthen occurring throughout the rural community.96
7.2.2 South Port Characteristics
The physical characteristics of the port play a large role in operational considerations. The maximumdraught of ships is 9.7m at ordinary high water and up to 10m at high water spring tides. The maximumvessel length is 200m with a beam of 34m. Vessels up to 225m and 34m will be restricted by wind/tideconditions. Ships can be loaded with up to 35,000t of cargo at South Port. The South Port harbourentrance is restricted in terms of a maximum draft of approximately 10m. The harbour bed compriseshard bedrock and an extensive drill and blast programme would be required to improve the draft. It wouldbe cost prohibitive to carry out such a project as the costs are estimated in excess of $100M. There areberths available for up to 10 large overseas vessels and ships are serviced by 2 tugs, with bollard pull of
95 See Appendix I Tiwai Bridge report.96 Invercargill Traffic Study: Roading Network Options and Implications
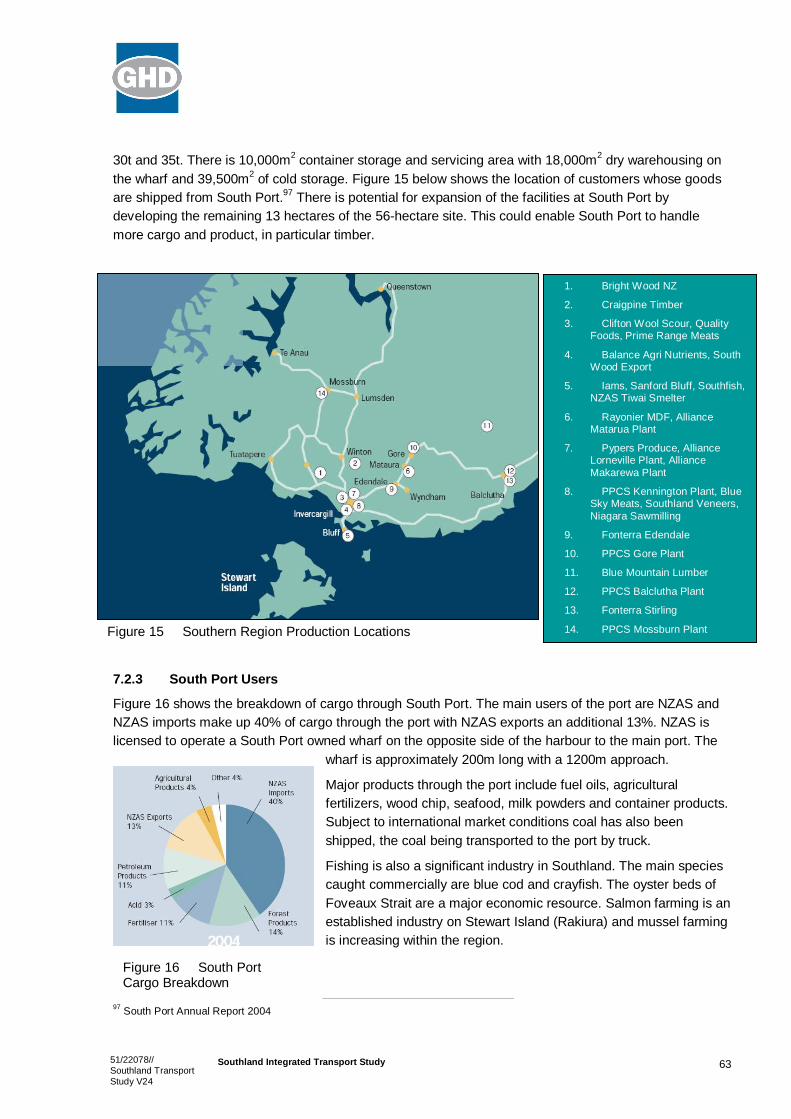
6351/22078//Southland TransportStudy V24
Southland Integrated Transport Study
1. Bright Wood NZ
2. Craigpine Timber
3. Clifton Wool Scour, QualityFoods, Prime Range Meats
4. Balance Agri Nutrients, SouthWood Export
5. Iams, Sanford Bluff, Southfish,NZAS Tiwai Smelter
6. Rayonier MDF, AllianceMatarua Plant
7. Pypers Produce, AllianceLorneville Plant, AllianceMakarewa Plant
8. PPCS Kennington Plant, BlueSky Meats, Southland Veneers,Niagara Sawmilling
9. Fonterra Edendale
10. PPCS Gore Plant
11. Blue Mountain Lumber
12. PPCS Balclutha Plant
13. Fonterra Stirling
14. PPCS Mossburn Plant
30t and 35t. There is 10,000m2 container storage and servicing area with 18,000m2 dry warehousing onthe wharf and 39,500m2 of cold storage. Figure 15 below shows the location of customers whose goodsare shipped from South Port.97 There is potential for expansion of the facilities at South Port bydeveloping the remaining 13 hectares of the 56hectare site. This could enable South Port to handlemore cargo and product, in particular timber.
7.2.3 South Port Users
Figure 16 shows the breakdown of cargo through South Port. The main users of the port are NZAS andNZAS imports make up 40% of cargo through the port with NZAS exports an additional 13%. NZAS islicensed to operate a South Port owned wharf on the opposite side of the harbour to the main port. The
wharf is approximately 200m long with a 1200m approach.
Major products through the port include fuel oils, agriculturalfertilizers, wood chip, seafood, milk powders and container products.Subject to international market conditions coal has also beenshipped, the coal being transported to the port by truck.
Fishing is also a significant industry in Southland. The main speciescaught commercially are blue cod and crayfish. The oyster beds ofFoveaux Strait are a major economic resource. Salmon farming is anestablished industry on Stewart Island (Rakiura) and mussel farmingis increasing within the region.
97 South Port Annual Report 2004
Figure 16 South PortCargo Breakdown
Figure 15 Southern Region Production Locations

6451/22078//Southland TransportStudy V24
Southland Integrated Transport Study
South Port is also the calling point for some passenger cruise ships as well as a ferry service to StewartIsland (see section 4 above).
7.2.4 Current Situation and Industry Trends
Cargo volumes in the 12 months to 30 June 2004 registered at a record level of 2.15 Mt. This was thethird successive year where more than 2 Mt of cargo was handled through the port. According to SouthPort, it will only be a matter of time before a more extensive coastal shipping network develops in the NZshipping environment. South Port has been evaluating a coastal container feeder model involving keycontainer ports. A coastal feeder service would be reactive in that it would rely on others for trade.International shipping trends support the increased use of transshipment; i.e. smaller vessels feeding tolarger port hubs with cargo being transferred to other vessels several times before reaching its finaldestination. It is South Port’s view that the coastal feeder mode of transport is a viable option forinternational carriers of containerised cargo. This option would work in tandem with the inland transfer ofcontainers by rail and road, providing prudent international shipping lines with a viable service.
Figure 17 shows a graph of the Baltic Dry Index, which is anindicator of international ship and cargo movement demand. Itshows that currently there is very high demand for ships worldwide;reducing the number that are available for service and increasingvessel charter rates. It was largely the economic and industrialactivity in China that drove vessel charter rates to these recordlevels. As a consequence, shipping companies were forced to lookat ways of reducing the number of ships they had operating on thewater. One method of achieving this was to cut back on the numberof port calls serviced in a particular shipping rotation. South Porthas been disadvantaged by this form of rationalization, in particularthe loss of the TransTasman Butterfly Service Link in January2004.98
As a result of the loss of the TransTasman container service, thevolume of containers handled at South Port has dropped. Producers have sourced containerisedshipping from other ports resulting in a “leakage” of containers out of the region, with approximately 83%of all container traffic heading out of Southland, north to Port Otago, PrimePort Timaru or Lyttelton Port.It is estimated that the Southland market produces 35,000 TEU99 per annum. However, currently only5,0006,000 TEU p.a. are shipped via South Port. A minimum of 18,000 TEU would have been achievedduring 2004, however the loss of the container service at the time saw container shipments drop. SouthPort would like to see more of this container cargo passing through South Port, and they believe theyhave the appropriate infrastructure to handle and service such larger volumes of containerised cargo.The development of a more extensive coastal feeder shipping network would enable South Port to bettercompete for container cargo volume with northern ports, at the same time creating more transportoptions for Southland producers. Because of Bluff's physical environment and the trend towards furtherport consolidation, it is more logical for South Port to accommodate a coastal feed of containers asopposed to servicing direct international ship calls.
98 South Port Annual Report 2004.99 TEU = 20 foot equivalent unit is the international standard measure of containers.
Figure 17 Baltic Dry Index

6551/22078//Southland TransportStudy V24
Southland Integrated Transport Study
The current international trend reflects shipping companies remaining committed to a “bigger ships,fewer ports” strategy, which will drive further cargo consolidation. Ship operators and owners areordering new ships in record numbers and in ever increasing size. The flowon from this will see shipscurrently considered midsized (3,000 – 5,000 TEU) on key eastwest routes (Europe, Asia, NorthAmerica) redeployed to run northsouth routes (Australasia, Latin America and interregional). A directconsequence of larger ships servicing New Zealand waters is that they will schedule fewer calls andfocus on the overall transportation cost which will balance the higher domestic costs required toaggregate export cargos into key international ports. The shipping lines will increasingly concentrate onthree or four key New Zealand ports, being Ports of Auckland, Port of Tauranga, Lyttelton Port ofChristchurch and possibly Port Otago.
Regional ports such as South Port will face either losing services or providing feeder services to theinternational ports. This will facilitate the “bigger ships, fewer ports” trend referred to above, while thedomestic feeder services are expected to reinvigorate the coastal shipping industry.
7.2.5 South Port’s transport dilemma:
» The timing of when the coastal feeder model will take hold in New Zealand is unclear althoughchanges over a 5year horizon are not considered to be unrealistic;
» South Port currently has containerhandling infrastructure which is under utilised (shore basedcranes, large heavylift forklifts etc) and these assets cannot be retained over the medium to longterm at the current usage levels;
» Whilst South Port has been actively promoting itself as a coastal feeder option, to date it has beenunable to attract this type of service for the region; and
» Some of the larger impediments of establishing such a service are:
– The cost of relocating a suitable container feeder vessel into the New Zealand market (ex Asiaor Europe estimated cost $1M); and
– Absorbing the likely shortterm commercial reaction from the existing rail operator.
The recent demise of ATR funding presents a barrier to the shipping industry in terms of fundingavailable for projects such as the coastal feeder service. Currently funding from the Ministry forEconomic Development (MED) is provided via LTNZ but on the advice from the MED. This money islocked up for Tairawhiti and Northland until 2006/7.

6651/22078//Southland TransportStudy V24
Southland Integrated Transport Study
Key Points:
» Access to the port by road and rail is crucial to the port’s operation;
» The South Port harbour entrance is restricted in terms of a maximum draft ofapproximately 10m. The harbour bed comprises hard bedrock and an extensive drill andblast programme would be required to improve the draft. It would be cost prohibitive tocarry out such a project as the costs are estimated in excess of $100M;
» The development of a more extensive coastal feeder shipping network would enable SouthPort to better compete for container cargo volume with northern ports, at the same timecreating more transport options for Southland producers; and
» The Tiwai Bridge is also an issue for South Port due to weight restrictions placed on thebridge.100
100 See section 3.20 on Tiwai Bridge issues.

6751/22078//Southland TransportStudy V24
Southland Integrated Transport Study
8. Airports
Summary
» Invercargill Airport has recently gained international status and is recognised as providingsignificant benefit to the region’s economy in terms of both business and increasingtourism growth.
8.1 BackgroundInvercargill airport is the principal airport in Southland, although a number of tourists visiting the regionutilise the airport at Queenstown. Air New Zealand operates regular scheduled services from Invercargillto Christchurch and beyond. Regular scheduled services to Stewart Island are operated by StewartIsland Flights. Freight carried by aircraft in Southland is generally not significant because of the changeby the airlines in 1995 from jet aircraft to smaller turbo prop aircraft. This change significantly reduced theavailable capacity for airfreight and led to a considerable reduction in the amount of freight carried by thesmaller aircraft out of Invercargill airport. However there is ongoing demand for increased airfreightcapacity out of Invercargill from exporters especially from the fish and flower exporters. The major role ofInvercargill airport is as a service centre to other national destinations (via Christchurch), and a feeder tointernational flights from Auckland and Christchurch. Growth in passenger numbers is encouraging asinbound and outbound passengers totalled 201,402 in the year to June 2003, up 8.7% on 2002.101
The airport has one sealed runway and three grass runways. The sealed runway has a new length of2210m, with the extension project recently completed, and the runway strength has been assessed ascapable of accepting up to Boeing 767 type aircraft. The airport has international arrival and departurefacilities and occasionally receives charter flights from Australia. It is also used by Qantas for divertedflights between Australia and Queenstown if Queenstown airport is inoperable due to adverse weatherconditions.
The region’s other significant airfields are located at Ryans Creek (Stewart Island), Milford and Gore.Milford, and to a lesser extent Ryans Creek, are primarily utilised for the movement of tourists. Milfordairport has approximately 16,000 aircraft movements per year.102 Most of these landings are associatedwith scenic flights from Queenstown. Air services in the Te Anau basin will progressively becomecentralised on the Manapouri airfield, which is now owned by SDC.
Further information about Milford Sound Airport, including more on the recent Draft Fiordland NationalPark Management Plan with regards aircraft movements in the area can be found in the separate MilfordReport in Appendix E.
There are also approximately 150 200 landing strips within the region, most of which are used for aerialtopdressing purposes. Southland's airfields are also utilised on occasion by the Royal New Zealand AirForce (RNZAF) for exercises involving air transport.
101 Southland Tourism Strategy 20052015102 Source: Airways Corporation of New Zealand, 2004

6851/22078//Southland TransportStudy V24
Southland Integrated Transport Study
Invercargill airport presently is used primarily for passenger transport to and from Christchurch. Thereare small amounts of airfreight. Air New Zealand operates regular scheduled services and Origin Pacificoperates charter services to Christchurch and beyond. Regular scheduled services to Stewart Island areoperated by Stewart Island Flights.
The airport has a modern terminal building and internationalarrival and departure facilities are also available. Not onlydoes the airport currently receive occasional charter flightsfrom Australia, it is also used by Qantas for diverted flightsbetween Australia and Queenstown if Queenstown airport isinoperable due to adverse weather conditions.
Air transport is essential to the tourist industry in Southlandalso in terms of scenic flights:
» Queenstown to Milford Sound;
» Queenstown to Manapouri Airport (Te Anau); and
» Invercargill to Stewart Island.
8.2 Current SituationVenture Southland’s Strategy for Development outlines thefact that the development of package tours for specialinterest groups can be affected by current limitations imposedby the availability of air transport.103 Investigations are beingmade into attracting more tourists through improved air services to the region, especially direct servicesfrom the east coast of Australia. Invercargill airport has been mandated by the Southland region as thenumber one priority for regional development. Its location on the southern coast of the South Island andits close proximity to the Australian eastern seaboard cities of Hobart, Melbourne and Sydney make it apotential entry/exit point for tourists from Australia visiting the tourist attractions of Stewart Island,Fiordland (Milford Sound) and Queenstown.
Distances from Invercargill are as follows:
» Hobart 913 nautical miles
» Sydney 1,082 nautical miles
» Melbourne 1,147 nautical miles
» Brisbane 1,350 nautical miles
The Invercargill airport runway extension project is underway and is 80% complete with full completionplanned for December 2005.104 This will increase the capacity of the airport to handle Airbus and B737300 aircraft to land, enabling direct flights from Australia. Two flights per week from Sydney and Brisbaneare planned for the first 12 years.105 Recent business case studies indicated that investment inextending the Invercargill airport would add significant benefit to the Southland economy as well asremove a barrier to tourism growth and provide a route to market for perishable freight. The creation of
103 Venture Southland “A strategy for development” 20022005104 Invercargill Airport Ltd105 Southland Tourism Strategy 200515

6951/22078//Southland TransportStudy V24
Southland Integrated Transport Study
an international airport in Invercargill will stimulate investment of new accommodation, activities,attractions and travel itineraries, rental cars and vans and other visitor services. In time it has thepotential to strengthen and diversify the flow of visitor traffic in and around the region. This will send avery positive message to the Southland tourism industry and potential investors.
From consultation with stakeholders there has been a suggestion that with three other internationalairports in the South Island (Dunedin, Queenstown and Christchurch) it is doubtful as to whether a fourthin Invercargill is necessary, considering the proximity of Dunedin and Queenstown. Freedom Airoperates direct B737 flights from Dunedin year round to destinations such as Sydney, Melbourne,Brisbane and the Gold Coast. Direct flights from Queenstown to Australia operate during the ski seasonfrom July through September. Both Qantas and Air New Zealand operate B737800 aircraft direct toSydney and Brisbane during these months.
The success of Invercargill International Airport will be dependant on the success of Southland’s tourismoperators and promoters to get visitors to fly directly into Invercargill as opposed to Dunedin,Queenstown or even Christchurch.
It is also questionable as to whether an international airport in Invercargill would be used more byoverseas tourists arriving into New Zealand or by Southlanders travelling directly to Australia.
Key Points:
» The success of Invercargill International Airport will be dependant on the success ofSouthland’s tourism operators and promoters to encourage visitors to fly directly intoInvercargill as opposed to Dunedin, Queenstown or even Christchurch.

7051/22078//Southland TransportStudy V24
Southland Integrated Transport Study
9. Industry Commodity Flows
Summary
» The largest commodity generating areas are Invercargill and Tuatapere, followed by theToetoes ward;
» The largest commodity attracting areas are Gore, Invercargill and the Wallace ward;
» Forestry has the largest effect on the transport network in the Southland Region followedby fertiliser due to its ubiquitous distribution across the district; and
» Dairy has a comparatively reduced affect on the transport network, in comparison to itsproduction tonnage.
9.1 IntroductionThere is anecdotal evidence that the Southland region’s local road network is suffering from increasedheavy commercial vehicles. The State Highway network has been built to higher standards than localroads and hence consultation revealed that the State Highway was providing a good level of service interms of capacity and pavement strength.
To assist with understanding heavy traffic flow effects on the local roading network, a commodity flowinvestigation was undertaken, with focus on the Southland District only. This investigation focused on thecurrent situation, and was based on data available in the public domain. The points outside theboundaries of the Southland District are simply external nodes, for example the Gore District, ICC andthe Queenstown Lakes District. Transport of commodities to these external points do not reflect actualroad locations as the model only shows a basic heavy vehicle traffic flow from point to point.
9.2 MethodologyTo simplify the model the Southland District ward system was used as a basis for the analysis. Thecentroid of each ward was linked to its neighbours. The actual transport route taken by the commodity isnaturally the shortest main roading link between the locations. Below is a series of diagrams showing theresults of the analysis. A larger copy of each diagram is available in Appendix K.
9.2.1 Network description
The SDC was broken down into eleven discreet wards. In addition, Invercargill, Gore and Queenstownwere incorporated as ‘external’ wards in order to determine the impact of traffic to SDC wards. Figure 18below shows the SDC ward network.
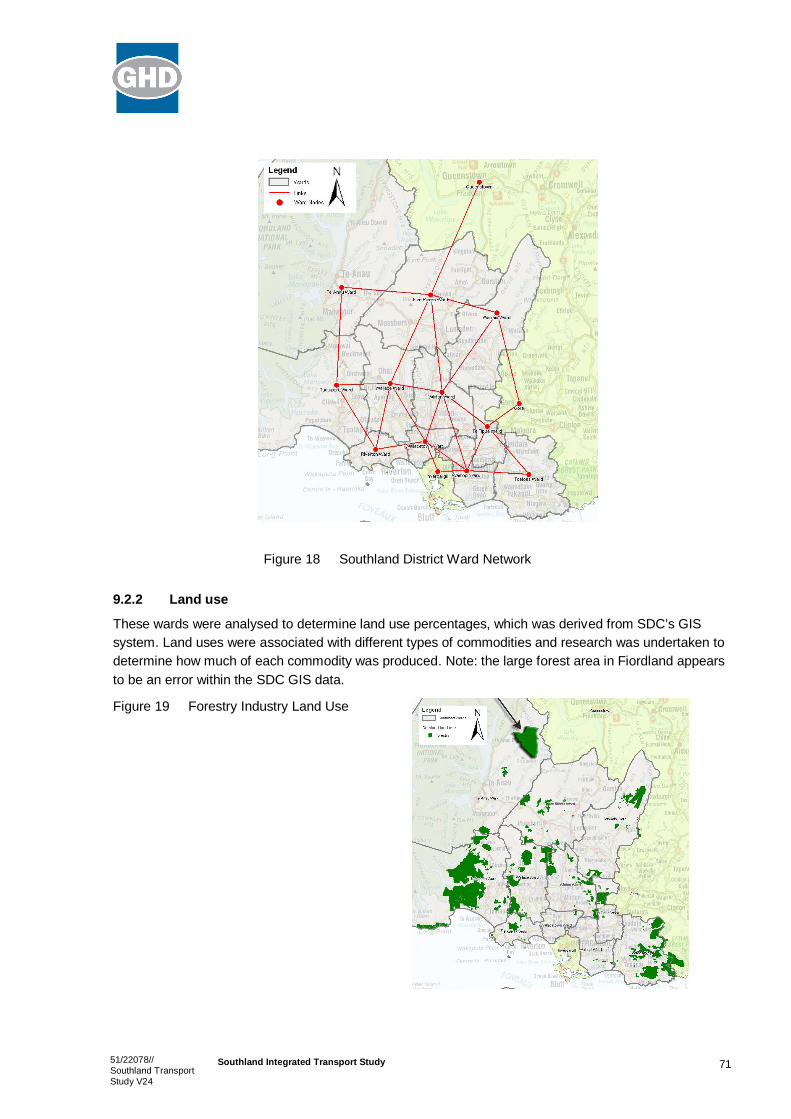
7151/22078//Southland TransportStudy V24
Southland Integrated Transport Study
Figure 18 Southland District Ward Network
9.2.2 Land use
These wards were analysed to determine land use percentages, which was derived from SDC’s GISsystem. Land uses were associated with different types of commodities and research was undertaken todetermine how much of each commodity was produced. Note: the large forest area in Fiordland appearsto be an error within the SDC GIS data.
Figure 19 Forestry Industry Land Use
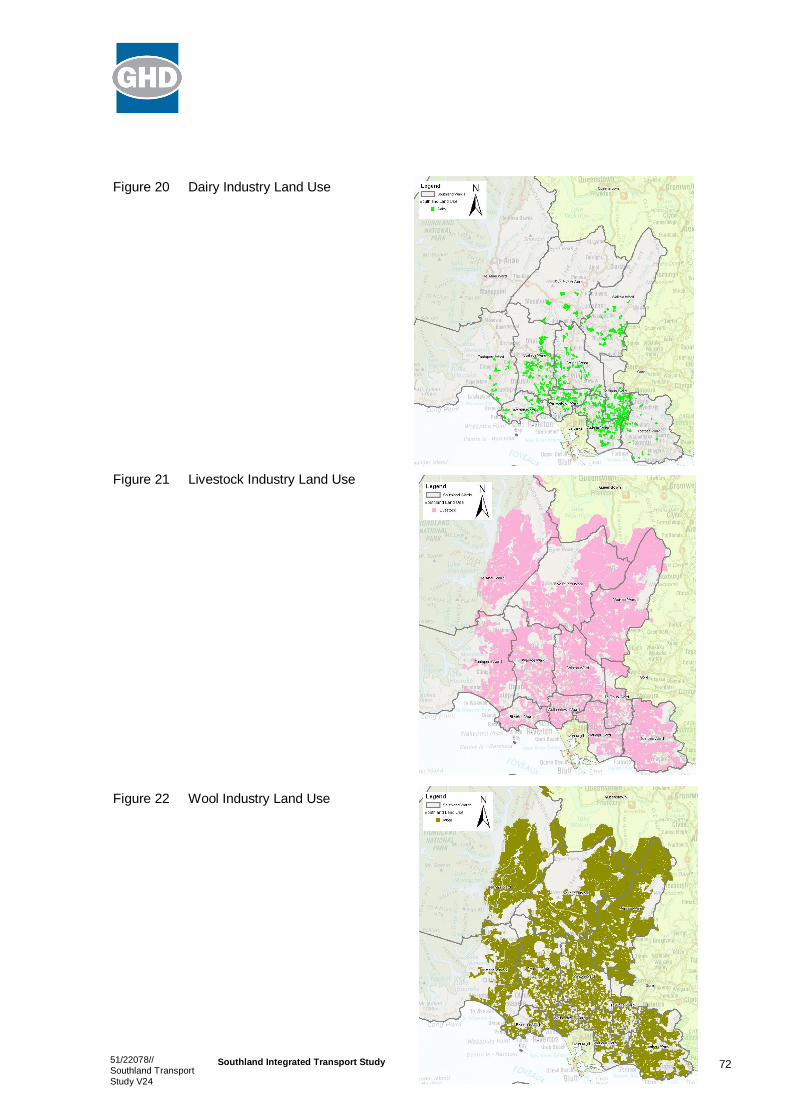
7251/22078//Southland TransportStudy V24
Southland Integrated Transport Study
Figure 20 Dairy Industry Land Use
Figure 21 Livestock Industry Land Use
Figure 22 Wool Industry Land Use

7351/22078//Southland TransportStudy V24
Southland Integrated Transport Study
Figure 23 Fertiliser Use
9.2.3 Traffic Flows
Figure 24 visually illustrates the comparative demands on individual roads and State Highways withinSouthland, based on Annual Average Daily Traffic (AADT) counts. State Highway 1 has the highestAADT count, acting as the main transportation route for industry traffic and light vehicles between theSouthland region and northeast to Dunedin. State Highway 6 functions as the main arterial routeconnecting Queenstown and Invercargill. Tourist traffic accounts for the comparatively heavy traffic flowson State Highway 94, with significant flows between Manapouri and Te Anau. State Highway 99 betweenRiverton and Invercargill also experiences above average traffic flows. This route acts as a conduit toservice areas west of Invercargill.
Figure 24 Southland Roading Network
– Total AADTs

7451/22078//Southland TransportStudy V24
Southland Integrated Transport Study
Figure 25 visually illustrates the comparative demands on individual roads and state highways withinSouthland, based on Heavy Vehicle Annual Average Daily Traffic (AADT) counts. State Highway 94leading into Te Anau from the east currently transports between 1400 and 1600 heavy vehicles per day.Other significant transportation routes for heavy traffic include State Highways 1, 6 and 98. High trafficvolumes are apparent adjacent to major townships.
Figure 25 Southland Roading Network
– Heavy Vehicle AADTs
9.2.4 Commodity Flows
The following diagrams show the commodity flow data for the SDC. These diagrams show the flow ofgoods around the SDC, broken down into the key transport industries: forestry, dairy, livestock (includingmeat and wool), and fertilizer (excluding limestone).
The commodity volume originating from each ward was known either from the total production orattraction of the commodity to the location. The volume transported was calculated on the basis of landuse distribution in each ward. For example with fertilizer, the total factory production was known anddistribution volume to each ward (attraction) was calculated on the basis of land use. The oppositemethod was used for forestry where the volume of product processed at the mills was known (attraction)and hence volume transported from each ward was calculated by land use (production).
Figure 26 Forestry Industry Commodity Flows

7551/22078//Southland TransportStudy V24
Southland Integrated Transport Study
Figure 27 Dairy Industry Commodity Flows
Figure 28 Fertiliser Industry Commodity Flows

7651/22078//Southland TransportStudy V24
Southland Integrated Transport Study
Figure 29 Wool Industry Commodity Flows
Figure 30 Livestock Industry Commodity Flows
9.2.5 Total Traffic Movements
The above data was put into the model based on a commodity/origin/destination tonnage matrix. Astylised network was developed between each ward and commodities were assigned to routes betweenwards. The commodity tonnage was converted to an equivalent ‘trucks per day’ figure. These truckswere then assigned to the network via known routes between each ward.
Figure 31 below depicts the total heavy traffic movements throughout the District.

7751/22078//Southland TransportStudy V24
Southland Integrated Transport Study
Figure 31 Total Heavy Traffic Movements
Figure 32 below shows the production by commodity and the actual network affects that the commodityproduces. Mining has not been modelled as the existing commodity is currently hauled by rail.
100,000200,000300,000400,000
500,000600,000700,000800,000900,000
Dai
ryP
rodu
ctio
n
Dai
ryP
rodu
cts
Ferti
liser
Min
ing
Live
stoc
k
Mea
t
Fore
stry
Tim
ber
Milli
ng
Woo
l
Oth
er
Commodity
Prod
uctio
n pe
r yea
r (to
nnes
)
20406080100120140160180
Commodity Production per year (tonnes)Commodity Netw ork Affects (relative to others)
Figure 32 Commodity flow effects on networks
9.3 Summary of AnalysisThe commodity analysis was undertaken only on selected commodities with known production volumestransported on the SDC roading network. To fully understand such a complex regional roading network asignificant transportation model and data collection exercise would need to be undertaken. However the

7851/22078//Southland TransportStudy V24
Southland Integrated Transport Study
commodities selected are the more significant for the region and indicate important regional transportroutes.
One commodity not modelled is tourism. However, tourism appears to have a very minor effect on thetransport network apart from the road from Te Anau to Milford/Manapouri and in and around Te Anauvillage. Also it is assumed that no modelled commodities go to or from Queenstown.
The analysis revealed the following with regards the key transport industries:
» The highest commoditygenerating ward is Invercargill; the next highest is Tuatapere and third isToetoes;
» The highest commodityattracting ward is Gore; the next highest is Invercargill and third is Wallace;
» Forestry has the largest effect on the transport network, generating approximately 25% more trafficeffects than the next highest which is fertiliser. Forestry is also likely to have the greatest effects onthe District roads as the routes from forestry to milling are typically via local roads and collectorsrather than state highways;
» Confirmation of anecdotal evidence that forestry has a significant impact on local and collectorroads in SDC particularly in the Wallace and Toetoes wards;
» Fertiliser has large transport effects because the commodity enters at South Port and is distributedto every ward. Dispersion of the commodity is significant as the wards requiring the largestvolumes are farther from the source. In comparison to Livestock (red lines only), the total generatedcommodity flow pattern is similar;
» Dairy, whilst having the third largest production in Southland, has a comparatively reduced effect onthe transport network;
» Traffic volumes are greatest north of Invercargill and on the State Highways;
» The farming industry is the dominant user of the SDC roading network with farming commoditiestransported over the whole network (excluding the National Park);
» The mining industry has only a minor impact on the roading network; and
» Rail is a significant transporter of processed commodities such as meat and diary products.
Note: This analysis was used to assist with developing the roading hierarchy.

7951/22078//Southland TransportStudy V24
Southland Integrated Transport Study
10. Roading Hierarchy
10.1 Current situationSouthland councils regularly review the classification of their roading hierarchy and make submissions asappropriate. The following sets out this procedure:
Transit New Zealand is the Crown Entity that can classify a road as a State Highway or a SpecialPurpose Road. All other roads are local roads controlled by territorial authorities.
Transit assesses proposals for state highways and special purpose roads against specific criteria. Onlythe Transit New Zealand Authority can declare or revoke the status of a road as a state highway orspecial purpose road. The following criteria must be met:
State Highways:
A state highway should form part of an integrated national network of roads that:
Are strategic interdistrict routes connecting locations of national economic significance such as:
– Significant centres of population;
– Major ports and airports;
– Major industrial, forestry and agricultural areas;
– Major tourist areas; and
– With a minimum number of parallel or alternative routes.
AND provide:
– The most convenient, efficient and safe route for through traffic; and
– A minimum restraint on traffic capacity and legal weight and dimensional constraints for heavycommercial vehicles.
OR in major urban areas, are arterials that:
– Carry traffic traversing a significant distance through the urban area;
– Connect with the existing state highway network; and
– When integrated with the existing state highway network would significantly improve theoverall performance and management of the state highway network.
10.2 Road Classification DefinitionMany different classification systems have been developed and used for various purposes. This studyhas adopted the functional classification as outlined below. A road network is provided for the effectivemovement of road users whilst minimising any adverse effects created by this movement on an areawide basis.
The functional hierarchy of roads stems from the need to reconcile the functions of providing for theefficient movement of vehicles with those of other transport and nontransport uses. It is stronglyinfluenced by the idea that any vehicle travelling between a particular origin and destination should

8051/22078//Southland TransportStudy V24
Southland Integrated Transport Study
intrude as little as possible into the neighbourhoods and living areas that it has to pass through on itsjourney.106
10.3 DiscussionIn determining the hierarchy in the first instance we have used a “reactive” approach as the currentlanduse has resulted in traffic following certain routes. The commodity flow analysis demonstrates theconcentration of heavy commercial vehicles on the State Highways and between areas of production,industry and internal servicing or export from the region (generally via South Port or State Highway 1).This is also the basis of the hierarchy in the current asset management plans. The above commodityanalysis generally confirms this hierarchy. In terms of proactive planning there are certain routes thatshould be discouraged. Individual councils need to recognise this issue and consult with industry and thecommunity on the proposed hierarchy.
However, if the above definition is used then the levels within the asset management plans are overstated. This proposed highway consists of the State Highway network with arterials connecting largertownships to the State Highway. All other roads are deemed collectors. Details are provided in largerscale map form and tables in Appendix D.
The higherlevel road hierarchy is depicted below:
Figure 33 Southland Roading Hierarchy
» Regional Arterials – State Highways and parts of the Southern Scenic Route
» Arterials – roads connecting Wyndham, Waikawa, Otautau, Mossburn and Invercargill.
106 Highway Capacity Manual (Institute of Highway and Transport – USA); Transport for Urban Environment (Department ofTransport and Institute of Highways Engineers – UK); Transit New Zealand SH Geometric Design Manual.
8151/22078//Southland TransportStudy V24
Southland Integrated Transport Study
10.4 Recommendations» The above hierarchy be adopted with agreed levels of service provided by councils;
» No significant changes in the current hierarchy are proposed;
» Completion of Bond Street heavy vehicle bypass with Invercargill priority;
» The need for an eastern Invercargill bypass should be investigated;
» Tourists be encouraged to use the Southern Scenic Route and State Highways 6 and 94; and
» Heavy commercial vehicles are encouraged to use State Highways, arterials and collector roads.

8251/22078//Southland TransportStudy V24
Southland Integrated Transport Study
11. Transport Business Case
Summary
» Available funding options include National (N), Regional (R), Crown (C) and RegionalDevelopment funding. N and R are viable alternatives that need to be pursued. C andregional development funding should be pursued but will require strong local support tobe successful;
» The Tiwai bridge replacement or strengthening should be funded from R funding with partof the local share assisted by stakeholders;
» The SDC pavement renewal programme has a strong case to be funded from R funding. Cfunding for this category would set a national precedent and as such has a lower chanceof success;
» The Homer Tunnel East Portal Avalanche Protection project should be N funded due to itsnational importance; and
» The region should obtain funding from LTNZ for its cycling and walking projects.
11.1 Overview
11.1.1 Future Strategy
According to LTNZ, transport will become more energy efficient and environmentally sustainable.Negative local and global environmental effects of transport will be reduced through education,regulation, technology and investment.
Enhanced mobility for people, goods and services within New Zealand and between New Zealand andoverseas will be achieved through creative responses that meet people’s needs with minimal adverseeffects on the environment. Improving the efficiency of existing road and rail networks, promotingalternatives to roads, and reducing traffic growth will be key elements in minimising the adverse effects ofland transport.
Southland is one of the few regions within NZ that has “true” broadband capabilities. This technology isexpected to substantially contribute to commercial growth in the region.
Transport policy will reflect New Zealand’s commitment to energy efficiency, and to the Kyoto Protocoland the Framework Convention on Climate Change, and will recognise the role transport plays inmeeting this commitment.107
For the Southland region the movement of bulk goods is predominately by road. Hence efficiency of theexisting road network is a key element of the strategy, particularly considering the significantdevelopment proposals that are planned to be operating by 2010/2012 (investments between $850M and$8.5B).
107 New Zealand Transport Strategy

8351/22078//Southland TransportStudy V24
Southland Integrated Transport Study
11.1.2 Sustainable Management of Transport Networks
The region is committed to the sustainable management of its transportation network. There are anumber of specific examples that illustrate this commitment. One such example is the SDC’s differentialroading rating approach, through which the Council has taken a lead nationally in this method ofsustainable funding that targets the specific users that generate specific demands on the network. Themodel analyses the impacts on the roads of various sectors and targets those sectors to pay their fairshare of the costs in maintaining the network based on their impacts. In addition, the uniform annualcharge (UAC) allows “fixed costs” and nontraffic impacts to be charged across all users.
The consultative approach taken by Council in establishing a working party of representatives from thevarious sectors working together and providing information about their specific sectors – present needs,trends, future demands enhances the sustainability of maintaining the network by being able to plan,provide and fund for the future. The model will also enable SDC to predict impacts on the networkthrough identifying the localities of the specific sectors and their routes and use of the network throughthe landuse categories. This system can also be kept “live” by monitoring landuse changes through therating system.
These are good examples of an innovative approach to sustainability, in addition to having a good typicalengineering approach to robust asset management.
The sustainable management of transportation networks also involves the protection of the strategicfunctions of these networks, through the promotion of appropriate land use development that sustainsthe network capacity and develops appropriate State Highway and local roads hierarchy.
11.2 Funding Options
11.2.1 National Land Transport Programme (NLTP)108
This year’s NLTP outlines the funding for New Zealand’s land transport system for 2005/6. This nationalallocation includes Crown (C) and Regionally (R) distributed funds. The 2005/6 NLTP sets out aprogramme of land transport activities that aims to integrate different modes of transport to optimise NewZealand’s land transport system.
a) National Land Transport Fund (N funding)
National land Transport Programme (N) funding is available for roads, cycle projects, walkways and railpassenger transport. N funding is nationally prioritised through the National Land Transport Accountexcluding the 5 cents per litre increase in petrol tax and equivalent in road user charges (RUC) forvehicles up to 5t from 1 April 2005.
b) Regional Funding (R funding)
R funding comes from the five cents per litre increase in petrol tax and RUC for vehicles up to 5t from 1April 2005, resulting in approximately $207M per annum over ten years and distributed based onpopulation by region. See Appendix L for information on Southland’s share of LTNZ’s R funding until2014. A total of $41.5M has been programmed over 10 years from 20042014.
The Government has made it clear to LTNZ that funding for freight on the rail network and shipping is thesole prerogative of the Government and is not a LTNZ responsibility.
108 National Land Transport Programme Document, 2005/06
8451/22078//Southland TransportStudy V24
Southland Integrated Transport Study
The following is an excerpt from the National Land Transport Programme 2005/06:
Issues with provisional R allocations:
The proposed funding allocations are based on the information provided. They were made on theunderstanding that there is considerable uncertainty about which of the projects submitted to LTNZ aspart of a Land Transport Programme will actually proceed in the near future. There were also few 10 yearworks programmes or R funding recommendations available. The proposals are not completely balancedover the 10year period in all regions. We expect that as the proposed programmes are reviewed andproject details refined more certainty will be possible. R funds have been provisionally overallocated toprojects in the Auckland, Waikato, Bay of Plenty, Wellington and Canterbury regions. This is becausethere is more forecast expenditure within the 10year period on nominated projects, than there is fundsavailable, and the duration of some projects extends beyond the 10year period for which R funds areexpected to be available.
For full details on the above see the National Land Transport Programme 2005/06.
The financial assistance rate will depend on the road type on which the fundable benefits accrue. Theproportion of costs equating to the fundable benefits that accrue:
» On State Highways, will be funded at 100%; and
» On local roads, will be funded at the applicable FAR for the territorial authority.
c) Crown Funding (C Funding)
Crown funding is allocated from the Crown fund. Crown funding has been set aside for Auckland ($49M)for bus and rail infrastructure projects including western line track duplication and rolling stockimprovements. The Wellington region will receive Crown funding for the refurbishment of its trolley busnetwork and other projects that are yet to be committed ($10M). The allocation of R and C funds toprojects is indicative. Final decisions will only be made when funding is approved for a project. Crownfunding has currently been allocated for strategic projects in Auckland ($900M) and Wellington ($225M).
d) Regional Development Funding
Funding from the MED is provided via LTNZ but on the advice from the MED. This activity class isfocussed on regions with acute transport needs. The two regions eligible for regional developmentfunding in 2005/06 are Northland and Tairawhiti. In these regions projects were identified in agreedregional transport plans notified to LTNZ in October 2002 by the Minister of Transport. Projectprioritisation and programming is guided by the priorities outlined in each regional transport plan and bythe relevant regional industry prioritisation group. To be approved for funding, a project must:
» Provide or improve access in such a way that it will encourage direct additional investment in theregion
» Significantly reduce travel costs for industry
» Mitigate adverse effects on safety, environment and amenity including conflicts with tourist traffic;and/or reduce travel costs.
Funding will be provided for regional development projects in other regions not covered above inexceptional circumstances only. LTNZ has set aside an allocation of $15M in the 2005/06 programme forfunding approved projects. This is based on the $20M funding level signalled by the government less theextra $5M that was allocated in 2004/5. The allocation includes $1.66M for continuing work.

8551/22078//Southland TransportStudy V24
Southland Integrated Transport Study
Key Point:
» The region should focus its efforts on securing funding from National, Regional, RegionalDevelopment and Crown allocations.
11.3 Business Case
11.3.1 Key Drivers
The key drivers for an improved transport infrastructure network are the following industries:
» Dairy Industry;
» Forestry Industry;
» Tourism; and
» Future energy based projects.
Figure 34 below demonstrates that the agriculture and tourism industries carry much of Southland’s GDPshare. Agriculture is growing nationally, particularly in Southland with primary processing sectors alsoshowing growth. The nature of agriculture is such that small growth in the industry translates to a largeincrease in transport of goods over the network, which is matched by the large growth in the processingsector.
Figure 34 Shares of nominal national GDP (yaxis) and regional GDP (xaxis), averaged across Marchyears 20002004109
Note:
» The square scatter plots are industries that are fastgrowing at a national level. The red diamondscatter plots are industries that are slowgrowing at a national level. Fastgrowing regions tend tohave a high proportion of their regional economies focused on fastgrowing sectors.
109 http://www.med.govt.nz/irdev/reg_dev/repreport/final/final07.html#P840_126582

8651/22078//Southland TransportStudy V24
Southland Integrated Transport Study
» Southland's economy is highly reliant on agriculture and its associated primary processing sectors(labelled FBT manufacturing) both in an absolute sense and relative to the New Zealand economy.The region is underrepresented in the various services sectors.
» The above graph treats NZAS as a separate identity. Infometric’s January 2005 Assessment of theEconomic and Social Impacts of Tiwai Point Aluminium Smelter on the Southland Economyestimated that NZAS actually contributed 18% of GDP to the Southland region.
11.3.2 Projected economic contribution of an improved Southland Roading Network110
In most developed nations there has historically been a strong relationship between economic growthand transport activity. The provision of physical infrastructure is generally recognised as being of vitalimportance to economic development. Despite recent increases in New Zealand’s road funding levels,New Zealand’s level of annual spending on road infrastructure is still below the OECD average of 1.3%of gross domestic product (GDP). The Allen Consulting Group undertook a study investigating thepotential net benefits that may accrue to New Zealand by undertaking further investment in roadtransport infrastructure. In the study the direct and indirect impacts of four proposed land transportinfrastructure packages111 were quantified using both standard cost benefit analysis and computablegeneral equilibrium (CGE) modelling techniques. It was established that further investment in NewZealand’s land transport infrastructure would involve four broad direct impacts:
» Accident cost savings
» Travel time savings
» Project capital costs and financing impacts
» Vehicle operating cost impacts
An Australian study using a general equilibrium analysis identified the main measurable benefits fromnew road construction, or the improvement of existing road facilities, as including: vehicle operating costbenefits, travel time benefits, accident benefits, environmental benefits and other productivity and indirectbenefits. Accounting for the flowon of these direct benefits throughout the economy reveals thatinvestment in improved road infrastructure has two broad effects. The consequent productivityimprovements in freight and passenger transport increase income and lower costs to using industries.They thus expand national economic output, with the size of the gain depending on the initial productivityimprovement and the market characteristics faced by the industries which benefit from the productivityimprovements.
One of the infrastructure packages in the study looked at the possible construction of a Taurangastrategic roading network. The results of the study showed that the construction and use of such astrategic roading network is expected to result in substantial economy wide benefits in the year 2012 $439M annually. Applying an 8% discount rate to expected benefits and costs of the project reveals thatthe strategic roading network package has a benefit cost ratio of 6.5.
110 Information sourced from “Benefits of Investing in New Zealand’s Road Infrastructure” – The Allen Consulting Group, 2004111 The four packages were: the passing lanes package, the Auckland western ring route package, the Tauranga strategic roading
network package and the Wellington regional land transport package.

8751/22078//Southland TransportStudy V24
Southland Integrated Transport Study
Comparisons between the Tauranga roading network and a similar roading network project in Southlandcould be made, resulting in similar economic benefits. Southland’s total nominal GDP is $3,453,000; thatequates to 9.6% of the South Island nominal GDP and 2.5% of New Zealand nominal GDP.112
The bulk of roading improvement projects would facilitate more efficient transportation particularly asroad transport is a key factor for industries in Southland. Such industries include dairy farming, forestryand mining. Investment confidence in the development of new facilities, i.e. a new Ashers Waituna lignitemine, would be greatly increased should there be a high level of roading infrastructure to adequatelysupport such an investment. The same could be said for the dairy industry in terms of dairy farms anddairy processing facilities as well as in tourism with accommodation and service providers. The flow oneffects from such industry investments to the Southland community would be substantial; for example thecreation of new jobs in the region and providing opportunity for encouraging people to live in Southland.
Such studies indicate that if action is not taken to improve the transport infrastructure then the region willsuffer a decline in the GDP figures. In particular the growth in dairy commodities and forestry will not beable to sustain potential economic growth with possible flow on effects in terms of roading level of serviceto other industries.
11.3.3 Milford Road – Homer Tunnel Avalanche Portal Upgrade – funding issues
Transit New Zealand has identified in its 10yearplan that $18M is to be spent upgrading the avalancheportal at the Homer Tunnel on the Milford Road. The $18M is planned from R funding. Consultation withkey stakeholders revealed that many were of the view that this funding should come from N funding asthe road is of national significance and much of the economic benefit of the road is of national value.
The effect of channelling a large portion of Southland’s R funding to the Homer Tunnel is significant as itcomprises a large portion of the region’s roading budget in one project from which the Southland regionwould not receive a proportionate return on its ‘investment’. It can be argued that this is a special case, inthat the Milford Road is purely a tourist route, of undoubted national significance (see separate MilfordReport in Appendix E) and should therefore be eligible for N funding.
Tourism New Zealand, the Department of Conservation and the SDC all agree that the Milford Road is ofnational significance. In a recent media release, the SDC stated that maintenance and upgrades of theroad should therefore be derived from national funds.
To determine the priority and ranking of projects a comparison should be made on the effect of spending$18M into other areas in the region such as Southland’s roading network. Should these funds be spent inthis manner then it would be possible for a number of the weight restricted bridges to be upgraded orreplaced, and the existing LOS of main freight routes maintained, thereby improving the efficiency andsafety of the network. The general equilibrium analysis outlined above suggests that the benefits to theSouthland region would be more significant for the region than expenditure on the Homer Tunnel project.
11.3.4 Tiwai Bridge
The Tiwai Bridge was built to service NZAS. NZAS provides 900 onsite jobs, and in the wider Southlandregion this amount extends to 2600 full time jobs and an estimated net economic contribution of inexcess of $100M per annum to the New Zealand economy. The smelter contributes $499M to regionalGDP, about 18% of total Southland GDP. The economic significance of the bridge and the impacts on
112 The Press, 13 July 2005
8851/22078//Southland TransportStudy V24
Southland Integrated Transport Study
the Southland region should the bridge continue to operate below par are detailed in the Tiwai Bridgereport found in Appendix I.
11.3.5 SDC’s AWT programme
The SDC has identified the need for major rehabilitation including resealing, pavement treatment, sealwidening and bridge renewal (SDC Annual Plan 2003/4). There is also a planned response to thedemands from transport growth particularly tourism and heavy commercial vehicles. The comparativelylow population density and broad spread of local road network in the Southland District limits populationbased rate funding mechanisms to cover the cost of road maintenance and renewal.
The following is an excerpt from the SDC roading issues paper113:
Southland District is significantly affected by development through economic growth. Over recent yearsland use changes bought about by farming conversions from sheep farming to dairying have hadsignificant impacts on road deterioration. The healthy economic climate that has enabled or driven thesechanges has been good for the District and New Zealand as a whole. But that economic growth hascome at a cost to the infrastructure.
R funding has been granted to Northland because it meets the criteria of needing roading infrastructureto assist economic growth. Southland District case is different to Northland. In Northland the lack ofroads prevents development. In Southland it is the renewal of roads as the result of development that isthe major hurdle.
How then does Council meet its obligations to manage the assets properly if the funding requirements topower that asset management are unpalatable to the ratepayers? Central Government must accept thatthe impact on GDP from the economic growth in Southland has been very valuable. Recognising thisbenefit to the nation/Central Government through the Regional Development Fund can supportSouthland by granting payment to cater for the increased renewals necessary.
11.3.5.1 Economic ContributionIn order for the Southland region to continue its economic contribution to the nation, the current roadinglevel of service must be maintained. Hence, the need to fund a bow wave of pavement renewals iscompelling. This issue is not new and has been openly discussed within council and with LTNZ. AlthoughSouthland District is not alone with this issue, it is of significantly greater importance than some otherregions due to:
1. The age profile and dTIMs114 analysis provides clear evidence of the substantial size of renewalswhich is beyond the limit that Council can afford to fund;
2. Much of the affected network was not built to the strengths necessary to cater for imposed andpredicted loadings (class 2 type roads were an acceptable fit for purpose philosophy prior to1990);
3. Portions of the Southland network are built on soft, swampy terrain with poor drainagecharacteristics. These sub grade conditions, in combination with annual heavy rain weatherconditions, heavy loads and sections of pavements past their design lives, indicate that funds forstrengthening become critical;
113 Roading Issues Paper, Prepared for Hon Paul Swain’s Southland Visit, 2004.114 DTIMs = deightons Total Infrastructure Management. This is modelling system that uses algorithms to predict pavement
behaviour and wear patterns to determine appropriate responses.

8951/22078//Southland TransportStudy V24
Southland Integrated Transport Study
4. Defect indicators such as rutting are increasingly reflecting that current intervention levels areinsufficient; and
5. Case projects, such as Grove Bush Road and Black Mount / Redcliffe Road, where Council hasspent in excess of $1M to upgrade and strengthen short lengths of the network are indicatorsthat council does not have the funds to rectify all under strength pavements.
6. Stepped traffic growth from new industries and/or the dynamic nature or the forestry industry hasand in the future is likely to have an immediate impact on the roading network. Hence previoustraffic growth figures are likely to understate traffic growth.
7. The high volumes and long trip average trip length (25 km) of forestry HCVs as evident from thecommodity analysis (refer to section 9) have a significant impact on the whole roading network.
The SDC has recognised this funding issue for several years. One initiative has been to implement adifferential rating system, which targets the users more directly than a land rating system. While the meritof such a system continues to be modified and debated, the Council is clearly attempting to provideequity to ratepayers, users and funding providers.
Economic Impacts of AWT programme
The economic value of the AWT programme is not in question. The ability to fund is the issue. As shownby the Allen Report the wider economic benefits to the nation’s GDP highlight the importance of nationalfunds for this project.
11.3.5.2 Local Authority Funding Issues
Of all the districts analysed, Southland and Gore districts rank low in terms of percentage of sealedroads, with 39% sealed for the Southland District and 38% sealed for the Gore District. The SouthlandDistrict has a greater number of kilometres of unsealed roads than any other councils’ total roadingnetwork.
Grants are given to local authorities from the land transport fund, which collects revenue from road usersthrough road user charges, vehicle registration fees, and a portion of petrol tax. On average these grantsprovide 50% of the funding of approved maintenance programmes on local authority roads, but thefinancial assistance rate (FAR) for individual authorities varies from a minimum of 43% for localauthorities assessed as most able to fund for themselves, to 68% for local authorities least able to fundfor themselves. A principal determinant of a local authority’s ability to afford its transport networkprogrammes is the nature of transport network expenditures, which reflect the extent of the locallymanaged network relative to the area of the territory as well as the growth in demands and the extent ofany backlog. The Southland region has high network expenditure, coupled with growth in transportdemand from major industry sectors combined with a significant amount of cyclic pavement renewals inthe Southland District. The local government sector has stated that the cost of new or replacementinfrastructure driven by cost escalation and higher environmental and health standards is a driver ofincreasing demands placed on local authorities.

9051/22078//Southland TransportStudy V24
Southland Integrated Transport Study
Figure 35 Rank ordering of Territorial Local Authorities (TLAs) by different descriptors
Figure 35 above shows how a selection of local authorities would be ranked, from lowest to highest, onthe basis of 8 different descriptive characteristics that could be considered indicators of ability to pay forlocal transport network expenditures. The SDC is one of the 8 local authorities selected in this example.
Southland District has low TLA revenue, but high road spending (for the years 2001/02). The district alsohas a low population and population growth. As a Local Authority Funding Issues Report115 found, a localauthority that has affordability issues is more likely to:
» Have lower population densities than higher (which makes the cost of infrastructure and serviceshigher per person).
» Have significantly higher than average rates of population growth or by contrast population decline(which reduces the rating base available to fund investment).
» Have lower holdings of revenueproducing assets such as port and airport company shares;
» Have more substantial amounts of land that is exempt from rates;
» Face substantial needs for new or replacement capital works on the existing stock of infrastructure;
The Southland region as a whole fits many of the above criteria suggesting that the region will suffer fromaffordability issues with funding local roading projects.
11.3.5.3 Subsidy Comparison with Other District Councils
GHD also conducted a subsidy comparison of Southland with other district councils. This investigationfocussed upon the rate contribution to roading maintenance, new work, and the LTNZ subsidy.
These regions were selected due to their similarity with Southland with regard to rural roading networkand common industry dominance.
Table 13 below summarises the results and illustrates that, although Southland District ratepayerscontribute nearly $15M towards roading maintenance and capital expenditure and with a total road lengthof 4948 km, only some $2,000 dollars are spent per kilometre of district road.
Southland District’s roading network is the most extensive of all districts within New Zealand. The FarNorth district has the third largest roading network and with ratepayers contributing almost $9M towards
115 Local Authority Funding Issues – Report of the Joint Central Government / Local Authority Funding Project Team, 2005.
Total RoadSpending2001/02
Aggregate LandValue
AggregateCapital Value
Median income /head
Total TLARevenue
Total TLARevenue / head
Population PopulationGrowth 1991
2001
Lowest Lowest Lowest Lowest Lowest Lowest Lowest LowestBuller Buller Buller Buller Buller Papakura Buller BullerPapakura Papakura Papakura Far North Papakura Christchurch Queenstown SouthlandPalmerston Nth Gisborne Gisborne Gisborne Southland Palmerston Nth Southland GisborneQueenstown Palmerston Nth Palmerston Nth Tauranga Queenstown Tauranga Papakura Palmerston NthTauranga Queenstown Queenstown Palmerston Nth Gisborne Buller Gisborne ChristchurchFar North Far North Southland Christchurch Far North Far North Far North PapakuraGisborne Southland Far North Southland Palmerston Nth Southland Palmerston Nth WellingtonSouthland Tauranga Tauranga Papakura Tauranga North Shore Tauranga Far NorthWellington Wellington Wellington Auckland North Shore Gisborne Wellington AucklandNorth Shore North Shore North Shore Queenstown Wellington Wellington North Shore North ShoreChristchurch Christchurch Christchurch North Shore Christchurch Auckland Christchurch TaurangaAuckland Auckland Auckland Wellington Auckland Queenstown Auckland Queenstown
Highest Highest Highest Highest Highest Highest Highest Highest

9151/22078//Southland TransportStudy V24
Southland Integrated Transport Study
roading maintenance and capital expenditure. Although this is a smaller contribution than SouthlandDistrict ratepayers, approximately $3,500 of ratepayers money is spent per kilometre of road.
Despite this inequity, LTNZ contributes about the same percentage of funding to both the Southland(55% of total roading spend, $9.8M) and Far North District (56% of total roading spend, $8.9M) Councils.In addition to this other areas such as the Far North District and Taranaki received substantial additionalfunds from the MED.
Of additional interest is the fact that the SDC dedicates approximately 54% of its annual budget towardroading maintenance and capital expenditure. This is the highest percentage of all councils surveyed andhighlights the requirement the extensive roading network has on Council’s resources, i.e. the SDC isspending more than any other council. The required high roading funding level has an impact oncouncil’s ability to fund local social projects
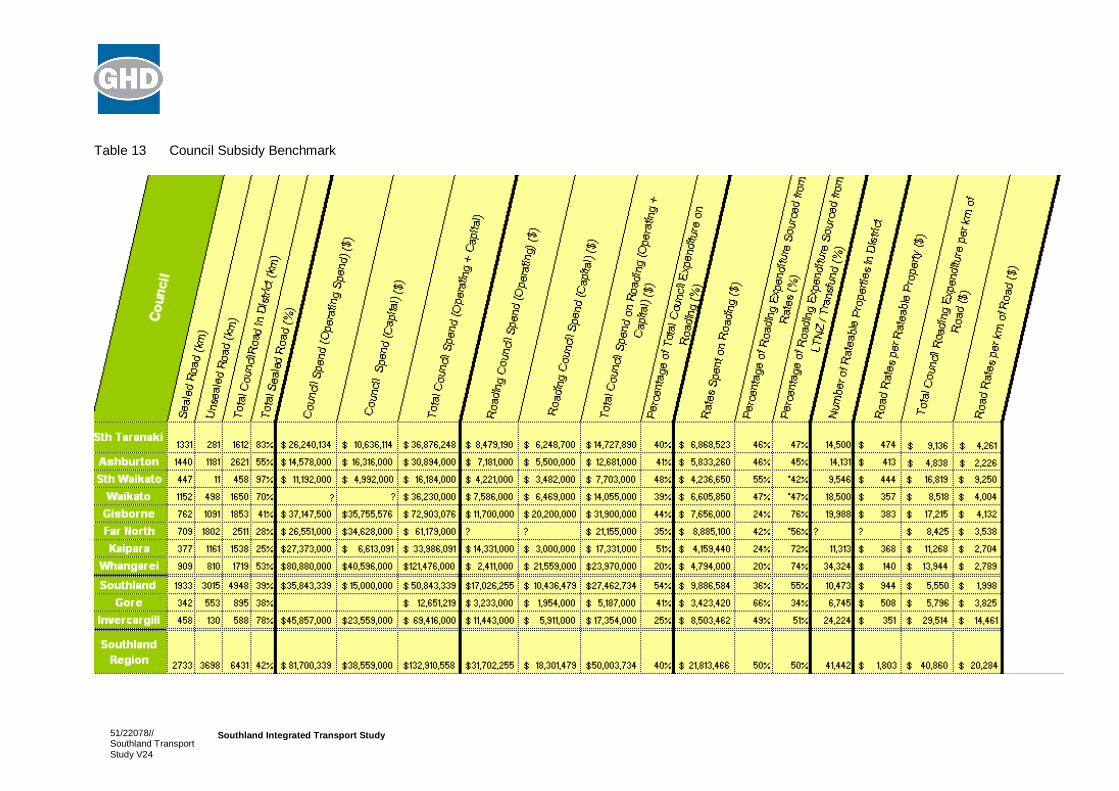
9251/22078//Southland TransportStudy V24
Southland Integrated Transport Study
Table 13 Council Subsidy Benchmark
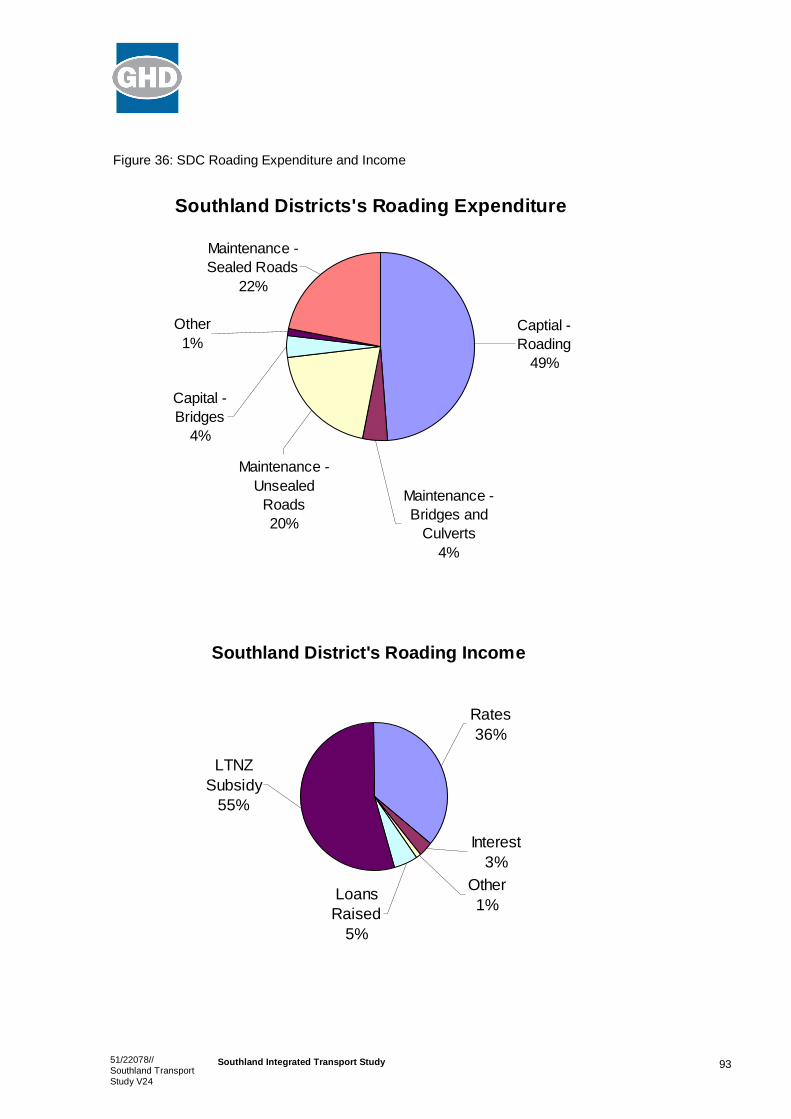
9351/22078//Southland TransportStudy V24
Southland Integrated Transport Study
Figure 36: SDC Roading Expenditure and Income
Southland Districts's Roading Expenditure
Other1%
Maintenance Unsealed
Roads20%
Capital Bridges
4%
Maintenance Bridges and
Culverts4%
Maintenance Sealed Roads
22%
Captial Roading
49%
Southland District's Roading Income
Rates36%
LTNZSubsidy
55%
Interest3%
LoansRaised
5%
Other1%

9451/22078//Southland TransportStudy V24
Southland Integrated Transport Study
We conclude that unless the Council maintains its expenditure at an appropriate level the road networkwill deteriorate. Research116 has shown that Southland faces far higher transport costs than most otherregions in the country. Moreover, the region is highly dependant on the road network to transportproduce to the factories from where it can be exported.
11.3.5.4 SDC’s Management StrategiesUser Pays Rating System
To assist the Council fund the expenditure from ratepayers in the fairest manner, the Council hasintroduced an innovative rating system, which is outlined in 11.1.2 above.
Performance Based Delivery
In addition, the Council has moved to performancebased contracts for the management of its roadnetwork, these have generally resulted in a 10% to 20% reduction in costs while giving a higher qualityresult. Unfortunately, these savings are not enough to provide affordability.
Pavement Renewal Strategy
The Council has considered four pavement renewal strategies. Due to affordability issues council hasembarked on a highrisk pavement renewal strategy, approved in the LTCCP. This strategy sees basicexpenditure on Capital and Operations with a high risk of necessary expenditure exceeding fundsallocated. This highrisk strategy has no contingency for stepped traffic growth (from new industries) norfor current forecast traffic growth.
The funding problem facing Southland is demonstrated by figure 37 below. A loan will be required until2012 to fund this level of expenditure.
Figure 37: Road Network Expenditure: High Risk Scenario117
Road network Expenditure: Adopted High Risk Scenario
$17,500,000
$18,000,000
$18,500,000$19,000,000
$19,500,000
$20,000,000
$20,500,000$21,000,000
$21,500,000
$22,000,000
2004
2006
2008
2010
2012
2014
2016
2018
2020
2022
2024
Year
Tota
l
$
$100,000
$200,000$300,000
$400,000
$500,000
$600,000$700,000
$800,000
$900,000
Loan Total
Loan
116 Transport Costs, By Infometrics for the Road Transport Forum117 Source: SDC’s LTCCP and Advanced Roading Asset Management Plan

9551/22078//Southland TransportStudy V24
Southland Integrated Transport Study
The graph shows that in the highrisk expenditure profile the SDC has cut back expenditure from whatwould be prudent (the normal risk scenario) to achieve affordability for ratepayers. Loan funding is usedto smooth out the initial peak in local contribution in the highrisk scenario (until 2013).
The funding risk to the council of adopting this scenario is explained within the Advanced Road AssetManagement Plan and include:
a) Area Wide Pavement Treatment (AWPT) – Sealed
The risk relates to the potential that the budget projections from the scenario under considerationwould be exceeded.
On balancing up these risks with affordability issues Council has chosen to a hold increasing thequantum of AWPT for 2004/2005 above the current 30 km per year level with an increase to 40 kmper year and progressing from this to 45 km per year over five years. This level of AWPT per yearhelps balance Councils overall budget, especially given the high quantum of reseals required overthe next three years.
Should the highrisk scenario lead to budget problems, options include lowering the levels ofservice on various parts of the network.
b) Changes in Land Use/Production Output (no allowance)
Land use or production changes can result in increases or reductions in heavy traffic. As heavytraffic is the primary cause of structural deterioration of the network this can have a significanteffect as evidenced by the dairy expansion in Southland over the last 10 years. The proposedhighrisk scenario does not make an allowance for any further increase in heavy traffic.
c) Environmental Issues
Environmental issues such as weather, have direct effects on the roads (in terms of durability andmaintenance requirements) and land production (quantities produced and transported). Periods ofsustained dry weather are good for sealed roads (which are the most expensive to maintain) andcan reduce primary production and therefore heavy traffic volumes on the roading network.Conversely very wet conditions, while not good for roads can also reduce production and the loadson the roads. Extended periods of frost, snow and ice as well as flooding can lead to significantadditional funding being required.
The highrisk scenario assumes good weather conditions prevail which will in turn result in costsavings over the current situation.
d) Cost of Delaying Critical Works
Higher maintenance requirements are necessary if critical major treatments are not carried out atthe ideal time. Such delays in pavement renewals flow on to inefficiencies to transport operatorswith consequential impacts on the local economy. Hence such delays place economic barriers onthe local economy and threaten the viability of new economic initiatives such as those discussed insection 3.18 (Mining).

9651/22078//Southland TransportStudy V24
Southland Integrated Transport Study
11.4 Business Case Summary
11.4.1 Key Issues
The key issues investigated were:
» Tiwai Bridge – replacement or strengthening;
» Milford Road – assessment of transport options and Homer Tunnel;
» SDC’s backlog of Area Wide Treatment;
» Stewart Island – footpaths and walking tracks to service growing tourist numbers; and
» Need for new or improved cycling and walking infrastructure.
The above issues pertain to roads and the road corridor. These roading related issues have beeninvestigated below. Other transport infrastructure such as rail and ports are not directly owned andmanaged by councils or Transit and hence have not been investigated further then as outlined insections 6 and 7 respectively.
Table 14 Estimated Costs of Projects
Issue FundingShortfall in2006/07
Future FundingShortfall in2007/08
Balance neededin subsequentyears
Total $ requiredincluding grants
Tiwai Bridge
Replacement
Strengthening
$5,100,000† $5,100,000† $12,000,000†
Min. $2,000,000°
Milford Road –Relievecongestion
Depends onchosen option
Milford Road –Homer TunnelPortal
$18,000,000 $18,000,000 $18,000,000†
Southland DCAWT Programme
$1,250,000 $1,300,000 $1,500,000 $2,000,000
$11,000,000
Stewart Islandfootpaths andwalking tracksupgrades
$870,000* Nil Nil $2,000,000*
New or improvedcycling andwalkinginfrastructure
To be determined $50,000
° Figures taken from MWH Tiwai Bridge Evaluation and Repair Design November 2004.
† Figures taken from the Southland Regional Land Transport Committee letter to LTNZ regarding regional recommendations for the
allocation of R funding.

9751/22078//Southland TransportStudy V24
Southland Integrated Transport Study
* Figures taken from the Southland Regional Land Transport Committee letter to LTNZ regarding regional recommendations for the
allocation of R funding. Includes roads on Stewart Island, not just pedestrian and cycling infrastructure. The total improvement
project list from the Stewart Island Roading Strategy 2003 is $1,737,230, including roading and pedestrian infrastructure
improvements. From this report $187,380 is small improvement projects to protect assets or pedestrians.
Table 15 Current Management Strategies
Issue Burden of Funding isCurrently With
Suggested Source ofFunding to Best Fitthe Issue
Reason forsuggested funding
Tiwai BridgeReplacement
Regional (R) orNational (N) fundingfrom LTNZ
R funding with privatecontribution to councilshare
Key component ofroading network and ofregional economicimportance
Tiwai BridgeStrengthening
R or N funding fromLTNZ
R funding with privatecontribution to councilshare
Key component ofroading network and ofregional economicimportance
Milford Road – Relievecongestion
N funding from LTNZ N funding from LTNZ National importance ofroad to the tourismindustry and thenational economy
Milford Road – HomerTunnel Portal
R funding from LTNZ N funding from LTNZ National importance ofroad to the tourismindustry and thenational economy
Southland DC AWTProgramme
N funding from LTNZ MED funding or Rfunding from LTNZ
Regional economicimportance; removebarrier to economicgrowth
Stewart Islandfootpaths and walkingtracks upgrades
N funding from LTNZ R funding from LTNZ Regional significanceand safetyimprovement
New or improvedcycling and walkinginfrastructure
N funding from LTNZ N funding from LTNZ Part of normalprogrammed works
Table 16 Affordability
Issue Key Drivers Impacts on Council and/orTransit NZ
Tiwai Bridge Replacement Assisting economicdevelopment and removal ofbarriers to export product.
Affordability Issue with ICCunable to fund a project of thismagnitude.
Tiwai Bridge Strengthening Assisting economic Affordability Issue with ICCunable to fund a project of this

9851/22078//Southland TransportStudy V24
Southland Integrated Transport Study
Issue Key Drivers Impacts on Council and/orTransit NZ
development magnitude.
Milford Road – Relievecongestion
Increasing tourist numberslessening the visitor’sexperience (improving accessand mobility) and adverseenvironmental effects.
Pressure to improve safety andprovide improved infrastructure;funding priority and affordabilityissues.
Milford Road – Homer TunnelPortal
Safety concerns and high riskconsequences to touristindustry (assisting safety andpersonal security)
Threat to New Zealandreputation as a touristdestination; affordability impacton Transit, heightened risk ifdelayed.
Southland DC AWT Programme Early intervention will result in acost benefit to council and roadusers with improved transportefficiency (assisting economicdevelopment) and reducingbarriers to economic growth.
Affordability with significantimpact on ratepayers and roadusers if deferred.
Stewart Island footpaths andwalking tracks upgrades
Safety and improvedinfrastructure for tourists(assisting safety and personalsecurity)
Large impact on small ratepayer base for funding ofinfrastructure that servicesnational scenic attractions.
New or improved cycling andwalking infrastructure
Improving access and mobilityand reducing transport energyuse and encouraging healthlifestyle and tourism potential.
Minor impact provided fundingprogrammed to match demandover several years.

9951/22078//Southland TransportStudy V24
Southland Integrated Transport Study
12. Land Transport Management Act 2003Requirements
The Land Transport Management Act 2003 (LTMA) requires that in preparing a land transportprogramme an approved organisation must take into account how each activity or activity class meetsthe following objectives of the New Zealand Transport Strategy:
» Assists economic development;
» Assists safety and personal security;
» Improves access and mobility;
» Protects and promotes public health; and
» Ensures environmental sustainability.
The following A3 table outlines how the twelve key issues named in the priority action plan (section 13)meet the above objectives as well as looking at affordability, alternative options considered and therelevant sections of the Southland Regional Transport Strategy.

10051/22078//Southland TransportStudy V24
Southland Integrated Transport Study

10151/22078//Southland TransportStudy V24
Southland Integrated Transport Study
13. Recommendations
Table 17 Priority Action Plan
Key Issue TransportationNetworkInvolved
EstimatedCost
Options to Meet demand
AluminiumSmelteraccess
Road – TiwaiBridge
$212M Strengthen or replace Tiwai Bridge to allowefficient transportation of goods to andfrom Tiwai Aluminium Smelter; pursue Rfunding and part private funding for ICCshare.
Backlog ofpavementrenewals inSDC
Roads $11M Pursue all available funding optionsincluding MED and/or R funding. Presentbusiness case to LTNZ.
Lowering ofvisitorexperience –perceivedcongestion
Road – StateHighway 94
N/A Consider a planned approach to controllingcongestion on the Milford Road by theintroduction of a booking system followedby a Park & Ride system or alternativemoves to control traffic flows.
PedestrianAccess
Footpaths andwalking tracks onStewart Island
$2M Provide business case to LTNZ to sourceR or MED funds for upgrades.
Cycling andwalkingtransportutilisation
Road $50,000 Develop a regional cycling strategy andindividual council plans; these should befocussed on current tourist routes.
RailInfrastructure
Rail N/A Provide support to OnTrack to strengthenrail infrastructure and to provide alternativetransport freight options to the region.
South Portutilisation
Shipping SouthPort
N/A Provide support to South Port to increasethe throughput of container transport andemerging industries transport needs byproviding appropriate road and railinfrastructure to the port. InvestigateCentral Government policy on support forcoastal feeder systems.
Homer TunnelEast PortalAvalanche
Road – StateHighway 94
$18M Provide business case to Transit and LTNZof the national importance of this project.Secure high priority National Land
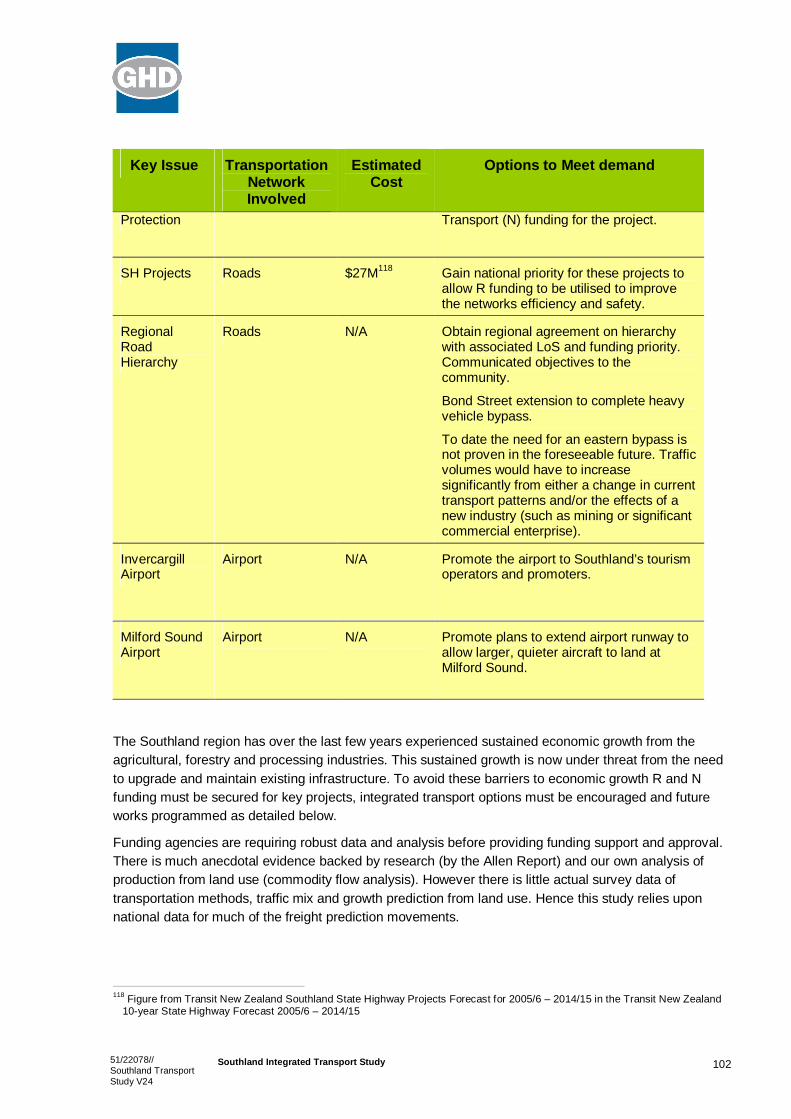
10251/22078//Southland TransportStudy V24
Southland Integrated Transport Study
Key Issue TransportationNetworkInvolved
EstimatedCost
Options to Meet demand
Protection Transport (N) funding for the project.
SH Projects Roads $27M118 Gain national priority for these projects toallow R funding to be utilised to improvethe networks efficiency and safety.
RegionalRoadHierarchy
Roads N/A Obtain regional agreement on hierarchywith associated LoS and funding priority.Communicated objectives to thecommunity.
Bond Street extension to complete heavyvehicle bypass.
To date the need for an eastern bypass isnot proven in the foreseeable future. Trafficvolumes would have to increasesignificantly from either a change in currenttransport patterns and/or the effects of anew industry (such as mining or significantcommercial enterprise).
InvercargillAirport
Airport N/A Promote the airport to Southland’s tourismoperators and promoters.
Milford SoundAirport
Airport N/A Promote plans to extend airport runway toallow larger, quieter aircraft to land atMilford Sound.
The Southland region has over the last few years experienced sustained economic growth from theagricultural, forestry and processing industries. This sustained growth is now under threat from the needto upgrade and maintain existing infrastructure. To avoid these barriers to economic growth R and Nfunding must be secured for key projects, integrated transport options must be encouraged and futureworks programmed as detailed below.
Funding agencies are requiring robust data and analysis before providing funding support and approval.There is much anecdotal evidence backed by research (by the Allen Report) and our own analysis ofproduction from land use (commodity flow analysis). However there is little actual survey data oftransportation methods, traffic mix and growth prediction from land use. Hence this study relies uponnational data for much of the freight prediction movements.
118 Figure from Transit New Zealand Southland State Highway Projects Forecast for 2005/6 – 2014/15 in the Transit New Zealand10year State Highway Forecast 2005/6 – 2014/15

10351/22078//Southland TransportStudy V24
Southland Integrated Transport Study
A regionwide transportation model would provide improved knowledge of the current freight and vehiclemovements while providing robust future traffic predictions based on factual data and agreedassumptions.
13.1 FundingThe region has several large projects that are of national significance in terms of tourist interest,economic benefit or safety. The funding of these projects is an affordability issue for individual councils.The funding gap necessary for the following projects to proceed in a timely manner will require nationalassistance in the form of financial grants:
» Tiwai bridge strengthening or replacement;
– The project should be funded from a combination of R funding and local share (ICC) and/orloan (with stakeholder funding of part of the local share);
» SDC’s pavement renewal programme;
– The project should be funded from R funding or alternatively MED funding. A specific businesscase would be required to obtain MED funding; and
» Pedestrian works on Stewart Island.
– Funds from R funding or from the National Walking and Cycling Programme.
13.2 Integrated Transport Options» Plan towards a joint management structure of the Milford Road and a controlled traffic regime in
terms of the preferred options (that generally excludes private vehicles perhaps at certain times ofthe year);
» Maintain secure, high standard road and rail links to South Port to improve regional and interregionalefficiencies;
» Output is facilitative rather than determinative i.e. making acceptable, economic, timely solutionspossible rather than dictating how and where transport activities will take place. It is possible toanalytically determine “best solution” BUT not to implement these solutions as they are commerciallydriven. Councils can impose planning or other constraints but they cannot require prices and servicelevels of the industry or transport operators;
» Provide a high level of roadside infrastructure to cater for expected growth in tourism (view points,rest areas, sign postings, cycling infrastructure); and
» Adopt a region wide roading hierarchy.
13.3 Recommended Future Work» Undertake a region wide transportation model in conjunction with user consultation and surveys.
» Complete a detailed plan of cycling and walking infrastructure for the region.
» Provide detailed business cases to LTNZ for regional and MED funding of the above projects.


51/22078//Southland TransportStudy V24
Southland Integrated Transport Study
Appendix A
Abbreviations
Abbreviation Definition
AADT Annual average daily traffic
ATR Alternative to Road
AWT Area Wide Treatment
AWPT Area Wide Pavement Treatment
CGE Computable General Equilibrium
C funding Crown funding
CAM Commercial Accommodation Monitor
dTIMs deightons Total Infrastructure Management
GIS Geographical Information System
GDC Gore District Council
GDP Gross Domestic Product
FAR Financial Assistance Rate
FBT Primary Processing Sectors
ICC Invercargill City Council
LTMA Land Transport Management Act 2003
LTNZ Land Transport New Zealand
M Million
MDF Medium Density Fibreboard
MED Ministry for Economic Development

51/22078//Southland TransportStudy V24
Southland Integrated Transport Study
Abbreviation Definition
N funding National funding
NLTP National Land Transport Programme
NZAS New Zealand Aluminium Smelters Ltd
NZEIR New Zealand Institute of Economic Research
R funding Regional funding
RMA Resource Management Act 1991
RUC Road User Charges
SDC Southland District Council
SH State Highway
SSR Southern Scenic Route
t Tonne
TA Territorial Authority
TEU 20 foot equivalent unit is the international standardmeasure of containers
TLA Territorial Local Authority
tpa Tonnes per annum
UAC Uniform annual charge

51/22078//Southland TransportStudy V24
Southland Integrated Transport Study
Appendix B
References
References
Report Name Authors Date
Invercargill Traffic Study: Roading Network Options andImplications
Transportation andTraffic Systems Ltd:Gabites PorterConsultants
October 1997
Road Freight – Its significance for regional economics Infometrics April 2003
New Zealand Regional Tourism Forecasts SouthlandRegion
Tourism ResearchCouncil, New Zealand
September 2003
Southland Regional Transport Strategy Southland RegionalLand TransportCommittee
June 2003
Southland Integrated Transport Scoping Study GHD Ltd August 2004
Information on Southland Unknown, provided byVenture Southland
February 2004
Transit New Zealand 10year State Highway Plan 2004/52013/14
Transit New Zealand 2004
Transit New Zealand 10year State Highway Forecast2005/62014/15
Transit New Zealand 2005
Land Transport Management Act 2003 New ZealandGovernment
2003
Times Have Changed at Transit Brochure Transit New Zealand 2005
Management of the Environmental Effects Associated withthe Tourism Sector
Office of theParliamentaryCommissioner for theEnvironment
1997
Milford Sound Concept Plan – A vision for the futuredevelopment and management of Milford Sound
Milford Sound PlanningGroup
1999
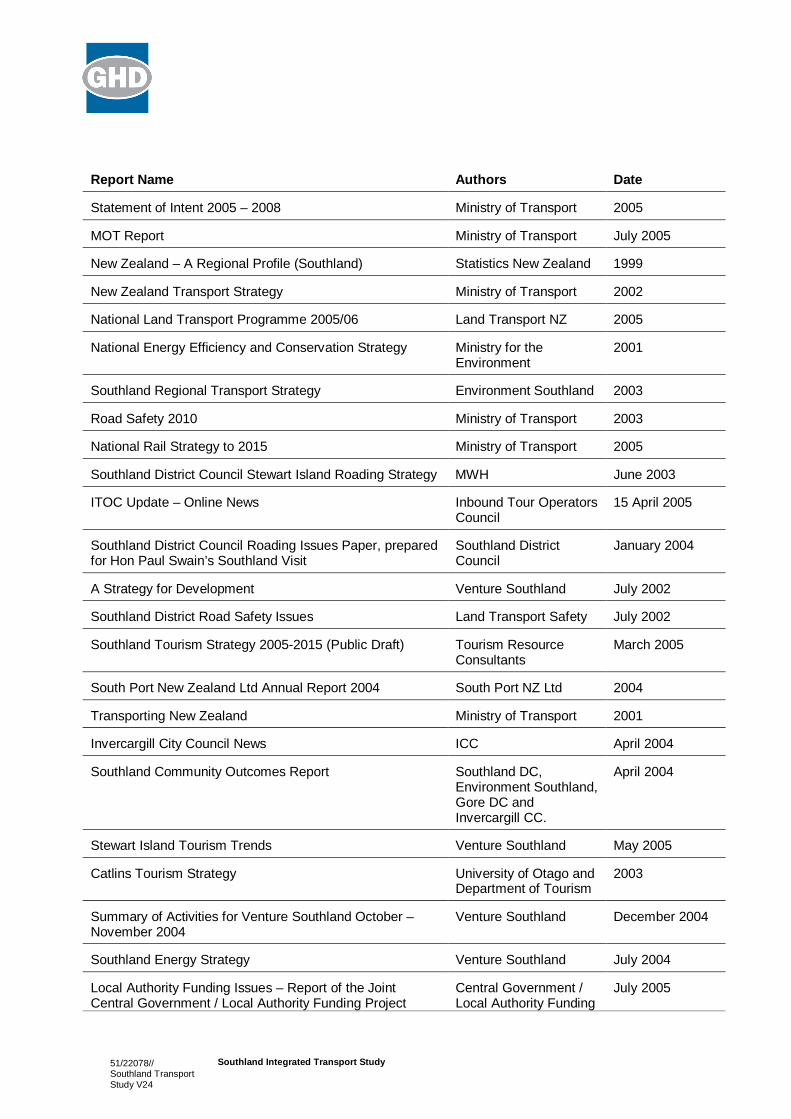
51/22078//Southland TransportStudy V24
Southland Integrated Transport Study
Report Name Authors Date
Statement of Intent 2005 – 2008 Ministry of Transport 2005
MOT Report Ministry of Transport July 2005
New Zealand – A Regional Profile (Southland) Statistics New Zealand 1999
New Zealand Transport Strategy Ministry of Transport 2002
National Land Transport Programme 2005/06 Land Transport NZ 2005
National Energy Efficiency and Conservation Strategy Ministry for theEnvironment
2001
Southland Regional Transport Strategy Environment Southland 2003
Road Safety 2010 Ministry of Transport 2003
National Rail Strategy to 2015 Ministry of Transport 2005
Southland District Council Stewart Island Roading Strategy MWH June 2003
ITOC Update – Online News Inbound Tour OperatorsCouncil
15 April 2005
Southland District Council Roading Issues Paper, preparedfor Hon Paul Swain’s Southland Visit
Southland DistrictCouncil
January 2004
A Strategy for Development Venture Southland July 2002
Southland District Road Safety Issues Land Transport Safety July 2002
Southland Tourism Strategy 20052015 (Public Draft) Tourism ResourceConsultants
March 2005
South Port New Zealand Ltd Annual Report 2004 South Port NZ Ltd 2004
Transporting New Zealand Ministry of Transport 2001
Invercargill City Council News ICC April 2004
Southland Community Outcomes Report Southland DC,Environment Southland,Gore DC andInvercargill CC.
April 2004
Stewart Island Tourism Trends Venture Southland May 2005
Catlins Tourism Strategy University of Otago andDepartment of Tourism
2003
Summary of Activities for Venture Southland October –November 2004
Venture Southland December 2004
Southland Energy Strategy Venture Southland July 2004
Local Authority Funding Issues – Report of the JointCentral Government / Local Authority Funding Project
Central Government /Local Authority Funding
July 2005
51/22078//Southland TransportStudy V24
Southland Integrated Transport Study
Report Name Authors DateTeam Project Team
The benefits of investing in New Zealand’s roadinfrastructure. A report for the New Zealand AutomobileAssociation
The Allen ConsultingGroup / Infometrics
August 2004
A National Exotic Forest Description (as at 1 April 2001) Ministry of Agricultureand Forestry
February 2002
Otago and Southland Forest Industries Profile Southern Wood CouncilIncorporated
June 2004
West Coast Integrated Regional Transport InfrastructurePlan
GHD Ltd and OptionOne
June 2005
In addition to the reports above, information from the following websites has been used in this report:
www.invercargillairport.co.nz www.stats.govt.nz
www.icc.govt.nz www.nationalbank.co.nz
www.venturesouthland.co.nz www.es.govt.nz
www.goredc.govt.nz www.fonterra.com
www.ltsa.govt.nz www.coalnz.com
51/22078//Southland TransportStudy V24
Southland Integrated Transport Study
Appendix C
Consultation Process
51/22078//Southland TransportStudy V24
Southland Integrated Transport Study
Appendix D
Roading Hierarchy
51/22078//Southland TransportStudy V24
Southland Integrated Transport Study
Appendix E
Milford Report

51/22078//Southland TransportStudy V24
Southland Integrated Transport Study
Appendix F
Heavy Vehicles
NUMBER OF TRUCKS WHICH PURCHASED RUC LICENCES IN THE PERIOD 1 JULY 2004 TO 30JUNE 2005
(LIGHT = Up to 3,500kg in gross vehicle mass, HEAVY = Over 3,500kg)
REGION TERRITORIAL LOCAL AUTHORITY TLA CODE LIGHT HEAVY TOTAL
Southland GORE DISTRICT 71 1222 560 1782
Southland INVERCARGILL CITY 72 2915 1583 4498
Southland SOUTHLAND DISTRICT 73 2542 1052 3594
TOTAL 6679 3195 9874
RUC KILOMETRES PURCHASED BY TRUCKS IN THE PERIOD 1 JULY 2004 TO 30 JUNE 2005
(LIGHT = Up to 3,500kg in gross vehicle mass, HEAVY = Over 3,500kg)
REGION TERRITORIAL LOCAL AUTHORITY TLA CODE LIGHT HEAVY TOTAL
Southland GORE DISTRICT 71 24370076 16601300 40971376
Southland INVERCARGILL CITY 72 60228852 39956500 100185352
Southland SOUTHLAND DISTRICT 73 50491423 30079900 80571323
TOTAL 135090351 86637700 221728051

51/22078//Southland TransportStudy V24
Southland Integrated Transport Study
Appendix G
Southland District Council Asset ManagementPlan Graph 2004

51/22078//Southland TransportStudy V24
Southland Integrated Transport Study
Appendix H
Southland District Council ProjectedPavement Strengthening Histograms
(Derived from 2005 dTIMS analysis)

51/22078//Southland TransportStudy V24
Southland Integrated Transport Study
Appendix I
Tiwai Bridge Report

51/22078//Southland TransportStudy V24
Southland Integrated Transport Study
Appendix J
Southland District Council Commodity FlowAnalysis Schematic Diagram

51/22078//Southland TransportStudy V24
Southland Integrated Transport Study
Divide commodities into
major industry
classifications.
Gen
erat
ion
Research industry groups for
expected production in each
model year.
Consider industry locations
against Southland District
Council wards.
Consider industry production
movements to secondary
production sites, destination
wards or external locations.
Assemble commodities by
industry and distribution
matricis based on industry
production units e.g. m3
tonnes etc.
Dis
tribu
tion
Convert commodities to
transport units e.g. m3 to
truck and trailers.
Ass
ignm
ent Assign vehicles to probable
transportation networks.
Calculate change in traffic
flow in model years.
Anal
ysis
Consider effects of traffic in
each model year. ? ?
Check that measuredAADT is similar tocommodity flow
assigned traffic flows

51/22078//Southland TransportStudy V24
Southland Integrated Transport Study
Appendix K
Commodity Flow Diagrams
51/22078//Southland TransportStudy V24
Southland Integrated Transport Study
Appendix L
Regional Funding 20042014
51/22078//Southland TransportStudy V24
Southland Integrated Transport Study
Appendix M
National Stakeholder Strategies and Plans
Summary
» This Appendix outlines some of the key stakeholders’ strategies and plans that must betaken into account in the planning and implementation of transport infrastructure upgradeoptions. The relevant sections of the District Plans, Annual Plans and Long Term CouncilCommunity Plans for the various District and Regional Councils are found in Appendix N.
Land Transport Management Act 2003The Land Transport Management Act 2003 (LTMA) aims to provide an integrated approach to land transportfunding and improve the planning, management and investment of land transport in New Zealand. LTNZ is thegovernmentfunding agency that allocates funding to land transport programmes. Section 20 of the LTMArequires LTNZ to make an assessment of a particular proposal before granting funding and each proposalmust therefore demonstrate how it achieves the following outcomes:
» Assists economic development;
» Assists safety and personal security;
» Improves access and mobility;
» Protects and promote public health; and
» Ensures environmental sustainability.
LTNZ must also consider whether a land transport programme is consistent with current national landtransport strategies, relevant regional transport strategies and National Energy and Conservation Strategies.In order for road controlling authorities to receive funding, they must satisfy LTNZ on the above requirements.
New Zealand Transport StrategyThe New Zealand Transport Strategy 2002 (NZTS) sets out the government's vision for transport and must beused to guide future policy decisions about transport. It describes how the transport system in New Zealandcan respond to the social, economic, and environmental needs of the country. It takes a holistic view of thetransport system, recognising all modes and users of transport. In particular, it recognises that, while roadsare likely to remain the main focus of government land transport expenditure, there is a need for a more

51/22078//Southland TransportStudy V24
Southland Integrated Transport Study
balanced consideration of other transport modes. The NZTS guides decisionmaking on transport by centralgovernment agencies and provides a reference for local government, business, and communities.
The NZTS is based on four key principles that include:
» Sustainability
Principles of sustainability, integration and transport policy must enhance economic, social andenvironmental well being, and promote resilience and flexibility. Consideration of the needs of futuregenerations and medium and longterm costs and benefits is also important.
» Integration
Transport policy will help create an efficient and integrated mix of transport modes by achieving cooperation and collaboration between stakeholders and efficient use of existing and new public investment.
» Safety
Achieve safety, health and personal security for all transport users and providers.
» Responsiveness
The diverse needs of urban and rural communities need to be recognised. All government agencies mustbe responsive to different transport needs.
The main objectives of the NZTS are to:
» Assist economic development;
» Assist safety and personal security;
» Improve access and mobility;
» Protect and promote public health; and
» Ensure environmental sustainability.
The vision of the NZTS is that New Zealand will have an affordable, integrated, safe, responsive, andsustainable transport system by 2010.
National Land Transport Programme
The National Land Transport Programme (NLTP) is the mechanism through which LTNZ allocates fundsacross the following activity classes:
» maintenance of the local roading network
» maintenance of the state highway network
» local road construction
» state highway construction
» passenger transport
» rail and sea freight
» LTNZ’s operating expenditure
LTNZ provides financial assistance to the following approved organisations:
» Territorial authorities (comprising city and district councils) to jointly fund maintenance and construction oflocal roads, passenger transport infrastructure and promotion of walking and cycling. LTNZ provides a
» transport demand management
» travel behaviour change
» regional development
» walking and cycling
» research, education and training
» administration and project control

51/22078//Southland TransportStudy V24
Southland Integrated Transport Study
national average of 50 percent financial assistance for maintenance programmes and an additional 10percent for construction projects, with local rates and other local authority revenue providing the balance.
» Territorial authorities in the Northland and Tairawhiti areas for regional development roading. LTNZ fullyfunds this activity.
» Regional councils for the provision of passenger transport services, and transport demand management,rail and sea freight. The level of financial assistance from LTNZ varies.
» Transit New Zealand (Transit) for New Zealand’s state highway system, including maintenance andconstruction of state highways, promotion of walking and cycling, and passenger transportrelated statehighway projects. LTNZ fully funds work on the state highway system.
The allocations to activity classes are announced annually prior to the financial year beginning 1 July. Someactivities are approved for funding at this time; others are approved during the year. Also, not all plannedactivities proceed according to the expected timeframe or cash flow requirement. Consequently, the NLTP isan ongoing programme through which activities are approved for funding throughout the year and allocationsto activity classes are adjusted.
To have activities approved for funding during the year, approved organisations must include them in theirland transport programme or longterm council community plan. Generally these activities must also beaccepted by LTNZ and included in its NLTP, though LTNZ may add activities to the NLTP during the year.
National Energy Efficiency and Conservation StrategyNew Zealand’s National Energy Efficiency and Conservation Strategy (2001) promotes energy efficiency,energy conservation and renewable energy within the context of achieving a sustainable energy future. Thisstrategy is closely linked with New Zealand’s climate change response and the NZTS and the NZ SustainableDevelopment Strategy.
The National Energy and Conservation Strategy aims to achieve the following goals:
» Reduce carbon dioxide emissions;
» Improve economic productivity;
» Improve economic resilience;
» Reduce local environmental impacts;
» Promote industry development; and
» Improve health and welfare.
Within each goal there are a number of projected outcomes proposed for 2012 that aim to improve urban airquality, increase the economic development of sustainable industries, increase the reliance on renewableenergy and improve the health of citizens.
Road Safety 2010The Road Safety 2010 Strategy was released in 2003 and provides a direction for road safety in New Zealandthat is focussed on engineering, education and enforcement. The road safety strategy is important inachieving the New Zealand Transport Strategy goal of an affordable, integrated, safe, responsive andsustainable transport system.
The government’s transport vision is that ‘by 2010, New Zealand will have an affordable, integrated, safe,responsive and sustainable transport system’. A main theme of the Road Safety 2010 strategy is:

51/22078//Southland TransportStudy V24
Southland Integrated Transport Study
“A more systemic approach to transport management should build safety in, not add safety on. Safetyshould be considered in all transport decisions and designed into our infrastructure. “
The Strategy aims to provide a road network and land use planning environment that reduces road deathsand injury and accommodates the safety needs of all users — pedestrians, cyclists, public transport users andmotorists.
National Rail Strategy to 2015The National Rail Strategy to 2015 was released in May 2005. It aims to realise the full potential of rail as aproperly integrated part of the nation's transport infrastructure. The strategy outlines national rail objectivesfor each of the 5 key National Transport Strategy objectives as follows:
» Assisting economic development
To enhance rail’s contribution to sustainable economic development
» Assisting safety and personal security
To improve rail safety and personal security
» Improving access and mobility
To maintain and develop access to rail passenger services
» Protecting and promoting public health
To promote rail’s contribution to positive health outcomes
» Ensuring environmental sustainability
To achieve a sustainable transport system that uses land, energy and other resources effectively.
As far as assisting economic development is concerned, the National Rail Strategy outlines several prioritiesto achieve its objective of enhancing rail’s contribution to sustainable economic development:
» Upgrade the national rail network;
» Improve the contribution of rail to regional development – transport is a critical factor affecting regionalgrowth and development. Growth opportunities have been identified in the coal and dairy sector and incontainer traffic;
» Encourage more freight to be carried by rail; and
» Optimise the use of the rail network as part of the wider transport network; increased integration oftransport modes includes development of innovative and flexible approaches, for example ‘inland ports’ ortransport hubs.
Key initiatives of the government include:
» Government investment of $200M to restore and upgrade network;
» Investigations into development of the network; and
» Promote integration between rail and other networks.
As far as improving access and mobility is concerned the objective of the government is to maintain anddevelop access to rail passenger services including long distance passenger rail.
In terms of ensuring environmental sustainability the negative environmental impacts associated with railtransport are small when compared to road. Rail freight uses 4% of freight transport energy. Road freight
51/22078//Southland TransportStudy V24
Southland Integrated Transport Study
accounts for 91% and coastal shipping 5%. A key initiative is to encourage a sustainable modal shift from roadto rail where appropriate.
Transit New Zealand 10year State Highway Plan 2004/5 – 2013/14
The following information is taken from the Transit New Zealand 10year State Highway Plan 2004/5 –2013/14. Transit anticipates it will have further expenditure from regional distribution funding, but this is yet tobe determined. These forecasts of expenditure are based on a 10year plan of maintenance andimprovements, including commitments. The timeframe for the development and construction of theimprovements proposed in the 10year plan is indicative only, and is likely to change depending on the use ofregional distribution funding to advance projects.
The Southland State Highway 10year plan seeks to protect and preserve the existing asset, improve thesecurity and efficiency of transport corridors into and out of Southland, and improve road safety.
Major features of the plan are:
» Three safety improvements, for construction in the next three years, comprising:
– SH1: East Road Curve Realignment, north of Invercargill
– SH98: Mill Road Intersection Improvements, east of Lorneville
– SH94: Hamilton Creek Bridge Widening
» Two more stock effluent disposal facilities west of Gore on SH1 and Lumsden on SH6.
Transit is continuing to investigate improvements to the eastern portal of the Homer Tunnel for avalancheprotection.
One large improvement project (with construction costs more than $3M) is included in the 10year plan, andsmall and mediumsized projects (with construction costs of less than $3M) have been planned for threeyears.
Key regional issues identified in the Plan for Southland are:
» Forestry traffic;
» Dairying traffic – increase in the number of dairy farms is increasing heavy vehicle movements particularlyaround the processing plant at Edendale;
» Tourist traffic, particularly on the Southern Scenic Route and to the Fiordland National Park and MilfordSound; and
» Road safety.
Transit New Zealand’s 10year State Highway Forecast 2005/6 – 2014/15Transit’s forecasts of expenditure in Southland for the next 10 years are set out in figure 38 below. Forforecast purposes only, Transit has made an assessment of regional distribution funding that will be availablefor State Highways. These will be determined annually. These forecasts of expenditure are based on a 10year plan of maintenance and improvements, including projects for which funding is already committed. Thetimeframe for the development and construction of the improvements proposed in the 10year forecast isindicative only, and is likely to change depending on the project’s importance within the context of the regionalland transport strategy, its national priority, the resolution of any local concerns and property issues.
The Southland 10year State Highway forecast seeks to protect and preserve the existing asset, improve theefficiency and safety of transport corridors into and out of Southland, and improve road safety generally.

51/22078//Southland TransportStudy V24
Southland Integrated Transport Study
Major features of the forecast are:
» Eight safety improvements, for construction in the next three years;
» Two passing lanes; and
» Stock effluent disposal facilities.
Transit is continuing to investigate improvements to the eastern portal of the Homer Tunnel for avalancheprotection.
Figure 38 Forecasts of Expenditure on Maintenance and Improvements – Southland Region
Southland Regional Transport StrategyOver the next 10 years Southland’s transport network will come under pressure from a number of directions.The dairy, forestry and tourism industries are expected to grow. At the same time, Statistics New Zealandpredicts that Southland’s population will decline. This Strategy identifies and prioritises means of respondingto Southland’s future transport needs. While the Strategy is based around a 10 year planning framework, itsstrategic focus looks beyond to a 20year planning horizon. The Strategy will be renewed at least once everythree years.
Southland Energy StrategyVenture Southland has identified that: “There is a lack of available energy for current and projected demandand this is a major barrier to regional and national economic growth. The ability to sustain and expand existingindustry and attract new industry is dependent on a reliable and affordable energy supply. In Southlandnational power grid transmission constraints also limit the ability to deliver robust, high capacity, power supplyto developing existing industry and new industry. Current issues relating to diminishing gas reserves and lowlake storage exacerbate these problems. Venture Southland established a working group, which hasassessed current and projected demands and proactively investigate opportunities to overcome the abovelimitations. This project is consistent with the Venture Southland Strategic Plan and is a major regional focusfor 2004 and 2005. Low energy costs have in the past been one of New Zealand’s major economicadvantages, however, in the past there has been inefficient use of these energy sources, largely because of

51/22078//Southland TransportStudy V24
Southland Integrated Transport Study
our lifestyle and historic factors surrounding the very low cost of energy. This situation is changing andSouthland as a region has the opportunity to address the impending energy shortages and the vagaries ofclimatic change, spot market pricing and increasing energy use. Southland has the potential to proactivelymanage its local energy needs and apply surplus energy towards facilitating the development of existing andnew industry as well as potentially contributing to the national grid requirements.” At it’s meeting on 20November 2003 the Venture Southland Regional Energy Project Group approved the Southland RegionalEnergy Assessment Report. The group also recommended the establishment of a Regional Energy Strategybased on the above document. The Southland Energy Assessment has since been published and hasattracted significant interest from the energy sector. Venture Southland is currently working with groupsinterested in gas exploration, fossil fuel generation, wind generation and alternative energy technologydevelopment. Venture Southland is also working with Energy Efficiency and Conservation Authority to exploreopportunities for conservation initiatives.
The Southland Regional Energy Strategy is based on the following principles:
» Southland has diverse energy resources that can be utilised to improve community and economic growthin the Region.
» A secure and cost effective energy supply is achievable by implementing an integrated regional energystrategy.
» Future demand can be met by:
– Promoting energy efficiency.
– Encouraging the effective use of energy resources.
– Investment in local exploration and generation opportunities.
– Construction of new generation plant to meet growth.
» Energy conservation practices and alternative energy technologies offer significant opportunity for users.
» The Region should utilise fossil fuel energy for local benefit and to secure local industry and develop newindustry opportunities.
» A variety of energy resources should be developed.
» That there is a need for strong advocacy and proactive planning practices to facilitate improvements totransmission and electricity generation opportunities.
Key AgenciesThe following are the key agencies that have responsibilities and roles in relation to Southland’s transportnetwork:
Southland Transport Network Key Agencies119
Agency Key Responsibilities
Ministry of Transport » Provides transport policy advice to the Minister of Transport;
» Prepares National Land Transport Strategy; and
» Contracts and monitors a number of transport agencies including mostof the following agencies.
119 Proposed Southland Regional Transport Strategy

51/22078//Southland TransportStudy V24
Southland Integrated Transport Study
Land Transport NewZealand
LTNZ allocates funding for:
» Construction, maintenance and improvement of state highways andlocal roads;
» Passenger transport services and projects;
» “Alternative to road” projects (Rail and sea freight)
» Regional development (funded by MED, allocated by LTNZ);
» Promotion of cycling and walking; and
» Administration and Project Control
LTNZ also:
» Develops and monitors land transport safety standards
» Prepares and manages New Zealand Road Safety ProgrammeManages vehicle, driver and operator licensing and registration
» Collects road user charges
» Manages driver licensing and road user education
Environment Southland » Establishes Regional Land Transport Committee;
» Prepares Regional Land Transport Strategy;
» Prepares Regional Programme; and
» Prepares and administers Regional Policy Statement and RegionalPlans under RMA.
Territorial Authorities(Southland District Council,
Invercargill City Council and Gore
District Council)
» Prepare District Roading Programmes and Asset Management Plans;
» Constructs and maintains roads which are not part of the state highwaynetwork;
» ICC administers the subsidised funding of public passenger transport inSouthland under a transfer agreement from Environment Southland;
» Prepares and administers District Plans under RMA; and
» Considers resource consents for land use activities under the RMA.
Transit NZ » Operates a safe and efficient state highway system
» Prepares State Highway Programme
New Zealand Police » Enforces and educates on road safety laws
» Carries out road crash and incident investigations
» Provides search and rescue services
Civil Aviation Authority » Establishes civil aviation safety and security standards, and monitorsadherence to those standards
» Carries out accident and incident investigations
» Provides search and rescue services

51/22078//Southland TransportStudy V24
Southland Integrated Transport Study
Maritime New Zealand » Provides search and rescue services
» Develops maritime safety rules and marine protection rules
» Investigates maritime accidents and conducts safety inspections ofships
» Licenses seafarers and registers ships
» Provides navigation aids, a coastal maritime safety and distress radioservice and participates in maritime searches and rescues
» Maintains the New Zealand marine oil spill response strategy andnational contingency plan and administers the New Zealand OilPollution Fund
Invercargill Airport Ltd » Manages the operation of Invercargill airport
South Port Ltd » Operates port activities at Bluff
On Track » Maintains and operates Southland’s rail network
Toll » The rail network operator

51/22078//Southland TransportStudy V24
Southland Integrated Transport Study
Appendix N
Annual Plans, District Plans, Long TermCouncil Community Plans

51/22078//Southland TransportStudy V24
Southland Integrated Transport Study
Appendix O
National Land Transport Programme 2005/06Factsheet

51/22078//Southland TransportStudy V24
Southland Integrated Transport Study
GHD Limited
Level 4148 Victoria StreetChristchurchT: 64 3 377 8076 F: 64 3 377 8575 E: [email protected]
© GHD Limited 2005
This document is and shall remain the property of GHD Limited. The document may only be used for thepurposes for which it was commissioned and in accordance with the Terms of Engagement for thecommission. Unauthorised use of this document in any form whatsoever is prohibited.
Document Status
Reviewer Approved for IssueRevNo. Authors
Name Signature Name Signature Date
Jim McNeill Les Dowdle Bob Penter
Bob Penter Rebecca Wardell