2006 q1 presentation arh+hank final
TRANSCRIPT

TGS-NOPEC Geophysical Company
TGSPresentation of the 1st Quarter 2006 ResultsMay 3rd 2006
Arne HellandChief Financial Officer
Hank HamiltonChief Executive Officer
A webcast of this presentation is available at www.tgsnopec.no

2
Forward-Looking Statements
All statements is this presentation other than statements of historical fact, are forward-looking statements, which are
subject to a number of risks, uncertainties, and assumptions that are difficult to predict and are based upon assumptions
as to future events that may not prove accurate. These factors include TGS’ reliance on a cyclical industry and principle customers, TGS’ ability to continue to expand
markets for licensing of data, and TGS’ ability to acquire and process data products at costs commensurate with
profitability. Actual results may differ materially from those expected or projected in the forward-looking statements.
TGS undertakes no responsibility or obligation to update or alter forward-looking statements for any reason.

3
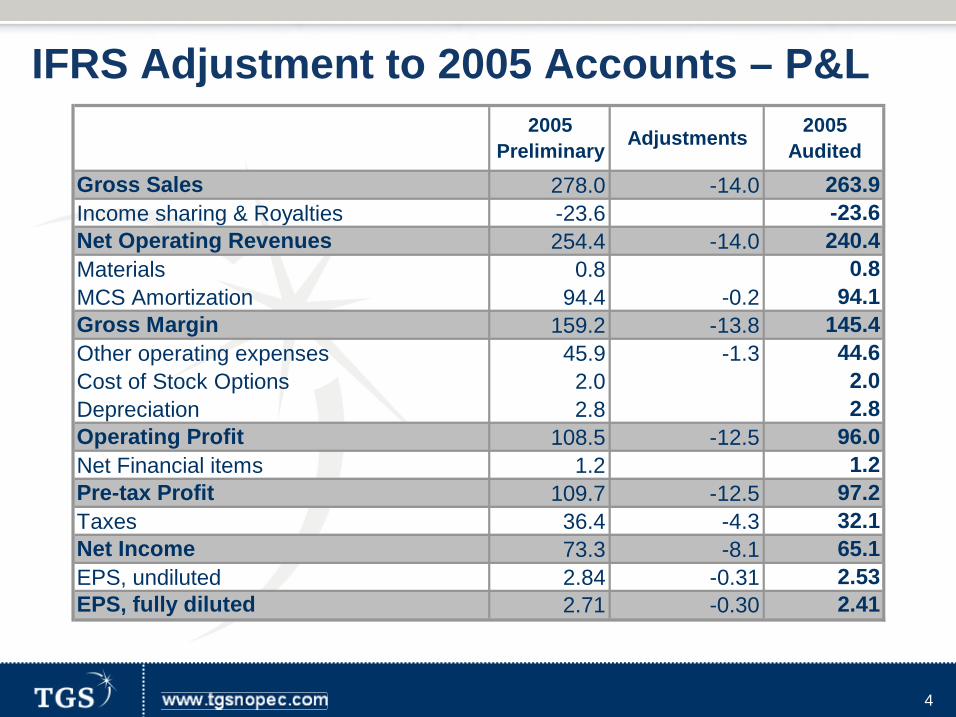
Recap: IFRS Adjustment to 2005 Accounts
Our auditor’s IFRS experts introduced a new interpretation of revenue recognition under IFRS in March 2006
Delayed recognition of 14.0 MUSD of net revenues and USD 0.2 MUSD of associated amortization from Q4 2005 to Q1 2006. See notice to OSE on March 24, 2006.
4
IFRS Adjustment to 2005 Accounts – P&L2005
Preliminary Adjustments 2005 Audited
Gross Sales 278.0 -14.0 263.9Income sharing & Royalties -23.6 -23.6Net Operating Revenues 254.4 -14.0 240.4Materials 0.8 0.8MCS Amortization 94.4 -0.2 94.1Gross Margin 159.2 -13.8 145.4Other operating expenses 45.9 -1.3 44.6Cost of Stock Options 2.0 2.0Depreciation 2.8 2.8Operating Profit 108.5 -12.5 96.0Net Financial items 1.2 1.2Pre-tax Profit 109.7 -12.5 97.2Taxes 36.4 -4.3 32.1Net Income 73.3 -8.1 65.1EPS, undiluted 2.84 -0.31 2.53EPS, fully diluted 2.71 -0.30 2.41

5
Source: SME Direkt
Q1 Actuals vs. Analysts Expectations
Actual ActualActual Average vs vs
(MUSD) Q1 2006 Analysts Consensus Consensus High Low Median
Net Revenue 89.7 80.2 9.5 12% 101.0 69.5 77.5EBITDA 73.8 65.6 8.2 12% 86.4 57.9 62.6EBIT 49.1 39.4 9.7 25% 52.0 30.0 38.0Net Income 32.6 26.2 6.4 25% 31.1 20.0 26.0Earnings per Share * 1.25 1.00 0.25 25% 1.19 0.76 0.99
*Avg. number of shares (undiluted) 26168
6
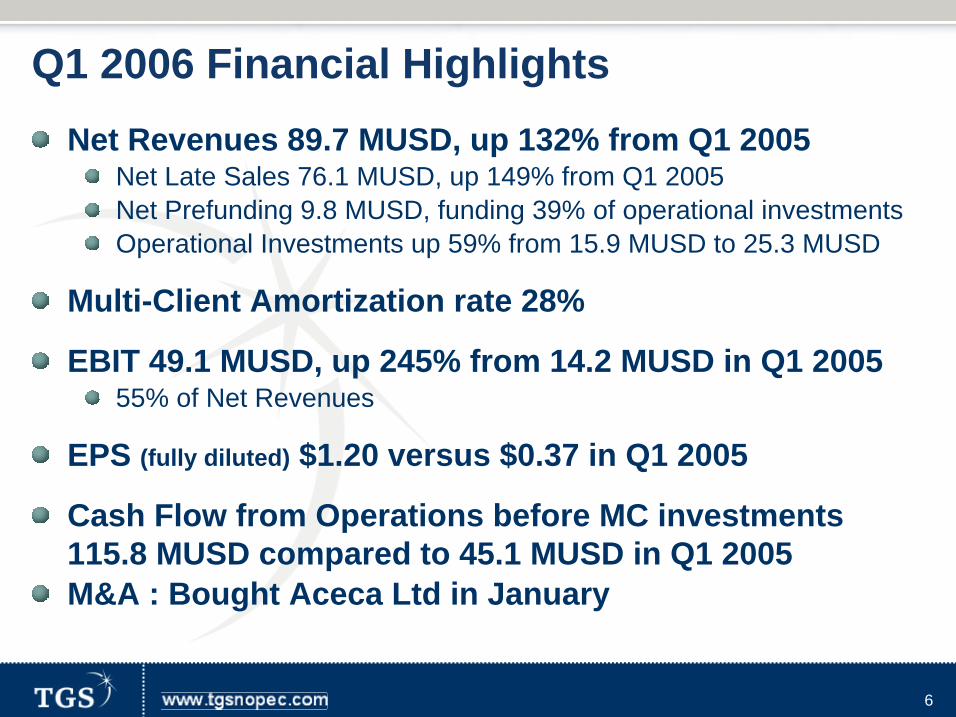
Q1 2006 Financial HighlightsNet Revenues 89.7 MUSD, up 132% from Q1 2005
Net Late Sales 76.1 MUSD, up 149% from Q1 2005Net Prefunding 9.8 MUSD, funding 39% of operational investments Operational Investments up 59% from 15.9 MUSD to 25.3 MUSD
Multi-Client Amortization rate 28%
EBIT 49.1 MUSD, up 245% from 14.2 MUSD in Q1 200555% of Net Revenues
EPS (fully diluted) $1.20 versus $0.37 in Q1 2005
Cash Flow from Operations before MC investments 115.8 MUSD compared to 45.1 MUSD in Q1 2005M&A : Bought Aceca Ltd in January

7
Q1 2006 PROFIT & LOSS (MUSD)Q1 2006 Q1 2005 Change %
Gross Sales 93.0 41.5 51.4 124%Income sharing & Royalties -3.3 -2.8 -0.5 16%Net Operating Revenues 89.7 38.7 51.0 132%Materials 1.6 0.1 1.6 1822%MCS Amortization 28% 23.8 13.9 9.9 71%Gross Margin 64.3 24.8 39.5 159%Other operating expenses 13.6 9.3 4.3 46%Cost of Stock Options 0.7 0.8 -0.1 -12%Depreciation 0.9 0.5 0.4 95%Operating Profit 55% 49.1 14.2 34.9 245%Net Financial items -0.1 0.0 -0.1 -201%Pre-tax Profit 55% 49.0 14.3 34.8 243%Taxes 16.4 5.0 11.4 230%Net Income 36% 32.6 9.3 23.3 250%EPS, undiluted 1.25 0.37 0.9 241%EPS, fully diluted 1.20 0.34 0.9 248%

8
Q1 2006 CASH FLOWQ1 2006 Q1 2005
Payments From Sales Received 144.2 67.8Operational Cost Paid -14.0 -10.1Taxes Paid -14.5 -12.6Operational Cash Flow 115.8 45.1
Investments Fixed Assets -0.4 -1.1Payments for acquired seismic and well logs -29.0 -18.8Investments through Mergers and Acquisitions -7.2 0.0Net Change in Long-term Receivables -3.6 0.2
Net Change in Loans 3.7 -0.3Purchase of own Shares 0.0 0.0Paid in Equity 3.2 9.2
Change in Cash Balance 82.4 34.2

9
Mar-06 % Dec-05 %Assets Cash 216.5 43% 134.1 29%Other Current Assets 77.3 15% 129.9 28%Total Current Assets 293.8 58% 264.0 57%Goodwill & Long Receiv. 29.4 6% 21.1 5%MC Library 165.8 33% 160.8 35%Fixed Assets 19.9 4% 18.7 4%Total Assets 509.0 100% 464.5 100%
Liabilities Short-term debt 0.0 0.0 0%Current Liabilities 73.6 14% 73.6 16%Long-term Loans 47.3 9% 45.1 10%Deferred Tax 27.5 5% 25.1 5%Equity 360.6 71% 320.8 69%
Cash in excess of interest bearing debt 169.2 MUSD
Balance Sheet – Key Figures

TGS-NOPEC Geophysical Company
Multi-Client Library

11
MCS Accounting – Matching PrincipleAccounting Standards recommend to match Revenues and Costs in time
TGS capitalizes the direct costs of surveys as investments in the Balance Sheet and amortizes them over 5 years (including the first year – WIP) as a function of expected ratio Sales/Investment
Maximum NBV one year after completion is 60%, then 40%, then 20%, then zeroAt the end of the fourth year after survey completion, each survey is fully amortized
If sales are lower than expectations, a minimum amortization kicks in:

12
7% vs. 0% 30% vs. 40%
53% vs. 60%
25% vs. 40%
57% vs. 100%
2004 2006/WIP Total2002 2003
Total Project Investments Net Book Value Allowed NBV at year end
Net Book Values below the max. NBVcriterias for year end 2006
Multi-Client Library NBV in % of InvestmentSeismic Segment as of March 31st 2006
2005
11% vs. 20%
0
50
100
150
200
250
300
350
400
450
MUSD

13
Q1 2006 Multi-Client Net Revenues & Ending NBV- Seismic Segment
36%
0% 1% 2% 2%5% 11% 13%
1% 6%
51%
74%
0%
10%
20%
30%
40%
50%
60%
70%
80%
Pre-2002 2002 2003 2004 2005 2006/WIP
Q1 Net Revenue Net Book Value

TGS-NOPEC Geophysical Company
Operations & Outlook
Hank HamiltonChief Executive Officer

15
Net Revenue Breakdown
Q1 2006
Prefunding11%
Late Sales85%
Contract4%
Q1 2005
Prefunding18%
Late Sales79%
Contract3%
Quarterly Record of $76.1 MUp 149% !

16
Net Revenues by Product Type
Q1 2006
2D22%
3D71%
Well Logs and
Integrated Products
7%
Q1 2005
2D54%
3D33%
Well Logs and Integrated Products
13%

17
Q1 Geographical Net Revenue Breakdown
13%
34%
87%
66%
0%
20%
40%
60%
80%
100%
Eastern Hemisphere Western Hemisphere
Q1 2006
Q1 2005
Gulf of Mexico 3D dominates Q1 Sales!

18
Operational Highlights
Continued acquisition of Sophie’s Link 3D in GoM
Started Eastern Delta 3D in GoM (OBC)
Delivered final Deep Resolve 3D PSTM and Mississippi Canyon 3D PSDM
Expanded 2D project offshore Madagascar by 70%
A2D secured pre-funding for conversion of GoM wells to WSR format & concluded agreements to source log data from Russia, Nigeria, NW Europe, & Madagascar
Aceca secured solid pre-funding for ‘06 annual product updates and several significant consulting contracts

19
Backlog
15.3
9.8
13.5
9.420.8
8.6
17.3
10.3
19.7
11.4
27.4
11.2
22.8
13.5
37.9
15.4
37.3
18.9
0.0
10.0
20.0
30.0
40.0
50.0
60.0
MUSD
Q1-04
Q2-04
Q3-04
Q4-04
Q1-05
Q2-05
Q3-05
Q4-05
Q1-06
Seismic Well Logs & Integrated Products
Note: Q4-05 Backlog figure adjusted to include $14 M in sales originally recognized in Q4
20
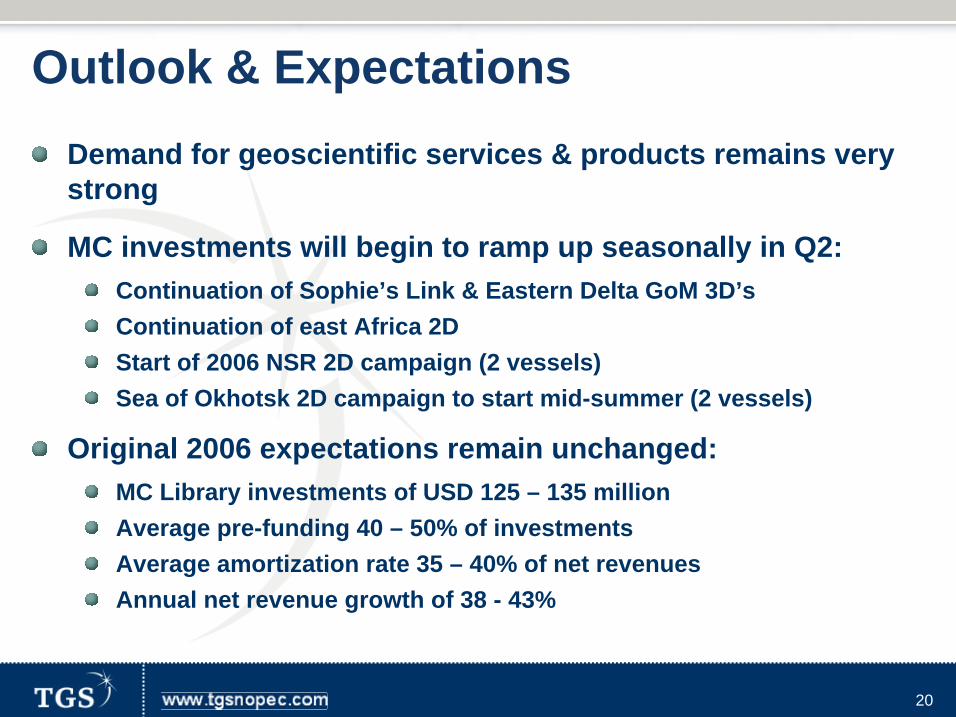
Outlook & ExpectationsDemand for geoscientific services & products remains very strong
MC investments will begin to ramp up seasonally in Q2:Continuation of Sophie’s Link & Eastern Delta GoM 3D’sContinuation of east Africa 2DStart of 2006 NSR 2D campaign (2 vessels)Sea of Okhotsk 2D campaign to start mid-summer (2 vessels)
Original 2006 expectations remain unchanged:MC Library investments of USD 125 – 135 millionAverage pre-funding 40 – 50% of investmentsAverage amortization rate 35 – 40% of net revenuesAnnual net revenue growth of 38 - 43%