2007 california department of transportation
TRANSCRIPT
2007
CALIFORNIA DEPARTMENT OF TRANSPORTATION
RAMP METERING ANNUAL REPORT
District 07
Los Angeles and Ventura Counties
Ramp Metering Connector Metering
STATE OF CALIFORNIA
Governor Arnold Schwarzenegger
BUSINESS, TRANSPORTATION AND HOUSING AGENCY Secretary Dale E. Bonner
DEPARTMENT OF TRANSPORTATION
Director Will Kempton
DIVISION OF OPERATIONS
OFFICE OF FREEWAY OPERATIONS Ramp Metering Branch
December 2008
2007
RAMP METERING ANNUAL REPORT
DEPARTMENT OF TRANSPORTATION DISTRICT 07
Los Angeles and Ventura Counties
DOUG FAILING
DISTRICT 07 DIRECTOR
FRANK QUON, DEPUTY DIRECTOR DIVISION OF OPERATIONS
MARCO RUANO, CHIEF OFFICE OF FREEWAY OPERATIONS
AFSANEH RAZAVI, CHIEF RAMP METERING BRANCH
ACKNOWLEDGEMENTS
The RAMP METERING ANNUAL REPORT is prepared by the Office of Freeway Operations, Ramp Metering Branch in District 07. This report encompasses all of the work performed by the Ramp Metering Branch during the calendar year 2007. In addition, it highlights in detail the most important accomplishments attained by the Ramp Metering Branch in Los Angeles and Ventura Counties.
Team Leader
Nabil Eskander Transportation Engineer, P.E.
Ramp Metering Branch
Special thanks and recognition to the Ramp Metering Branch staff for their help in the compilation of this report:
Fady Al-Awar
Wahib G. Jreij
Rafael Benitez-Lopez
Hanh Pham
Hamid Kalkatechi
Jack Kao
Mohamed Iqbal Toorawa
Allan Dumaplin
Rody Torchin
Reza Akramian
Kazem Atefyekta
Bob Masatsugu
TABLE OF CONTENTS
Subject Page #
EXECUTIVE SUMMARY ....................................................................................................... 1
INTRODUCTION........................................................................................................................ 1
DISTRICT 07 RAMP METERING HISTORY ................................................................... 2
RAMP METERING BASICS ................................................................................................... 4
• RAMP METERING BENEFITS .................................................................................... 5
• TYPES OF RAMP METERING..................................................................................... 5 1. FIXED TIME / TIME OF DAY METERING .................................................... 6 2. LOCAL MAINLINE TRAFFIC RESPONSIVE METERING .......................... 6 3. SYSTEM WIDE ADAPTIVE RAMP METERING (SWARM)........................ 6
RAMP METERING TECHNOLOGY ................................................................................... 7
• ADVANCED TRANSPORTATION MANAGEMENT SYSTEM (ATMS) ................ 7
• SYSTEM WIDE ADAPTIVE RAMP METERING (SWARM).................................... 7 o TYPES OF SWARM .......................................................................................... 8
� SWARM 1............................................................................................... 8 � SWARM 2A............................................................................................ 8 � SWARM 2B ............................................................................................ 8 � SWARM COMBINATIONS .................................................................. 8
o ADVANTAGES OF SWARM ........................................................................... 9 o DISADVANTAGES OF SWARM..................................................................... 9 o SWARM TESTING ............................................................................................ 9
• SATMS 3.0...................................................................................................................... 9
• UNIVERSAL RAMP METERING SYSTEM (URMS) ................................................ 11
ROLES AND ESPONSIBILITES TRANSPORTATION SYSTEM (ITS) BRANCH.............................................................. 11
• RAMP METERING BRANCH ...................................................................................... 11
• ELECTRICAL MAINTENANCE BRANCH ................................................................ 12
• ITS BRANCH ................................................................................................................. 13
TABLE OF CONTENTS (CONT’D)
RAMP METERING BRANCH PRODUCTION .................................................................13 1. SURVEILLANCE AND MONITORING OF RAMP OPERATION.............................14
FIGURES DESCRIBING RAMP METERING PRODUCTION: A. OPERATION & INSPECTION OF RAMP METERING CABINETS (Figure 1)...15 B. ISSUES REPORTED TO ITS OR ELECTRICAL MAINTENANCE (Figure 2)....16 C. MANUAL DATA COLLECTION 2007 (Figure 3)..................................................17 D. MODIFY RAM PAGES (Figure 4)...........................................................................18 E. PROJECTS REVIEWED (Figure 5) .........................................................................19 F. COMPLAINTS & INQUIRIES 2007 (Figure 6).......................................................20
2. ROUTE 210 STRATEGIC GROWTH PLAN – CONGESTION RELIEF PROJECT ..21 3. RAMP METER TRAFFIC DATA COLLECTION……................................................23
A. VARIOUS ROUTES .................................................................................................23 B. ROUTE 210, CONGESTION RELIEF PROJECT ..................................................23
4. CAPITAL PROJECT REVIEW ......................................................................................24 5. PERMIT PROJECT REVIEW ........................................................................................24 6. METERED RAMP DATA SUMMARY.........................................................................24 7. RAMP METER DEVELOPMENT PLAN (RMDP).......................................................25 8. RAMP METERING PROCEDURE MANUAL ADDENDUM.....................................25 9. TESTING OF NEW VEHICLE DETECTION TECHNOLOGIES……………………25 10. CONVERT EXISTING RAMP HOV BYPASS LANE TO A METERED HOV OR
MIX FLOW LANE..........................................................................................................26 11. MAJOR RAMP METERING OPERATIONAL STUDY...............................................26 12. NEW RAMP METERS ...................................................................................................26 13. TRAFFIC OPERATIONS MANAGEMENT INFORMATION SYSTEM (TOMIS) ...27
REFERENCES ..............................................................................................................................27
ATTACHMENTS.........................................................................................................................28
1. Route Responsibilities
2. Ramp Meter Area Map
3. Deputy Directive 35 – Ramp Metering
4. Ramp Metering Policy Procedures
5. Contents of Exceptions to Ramp Metering Policy Fact Sheet
6. Ramp Metering Policy on High Occupancy Vehicle (HOV)
7. Traffic Operations Management Information System (TOMIS)
Page 1
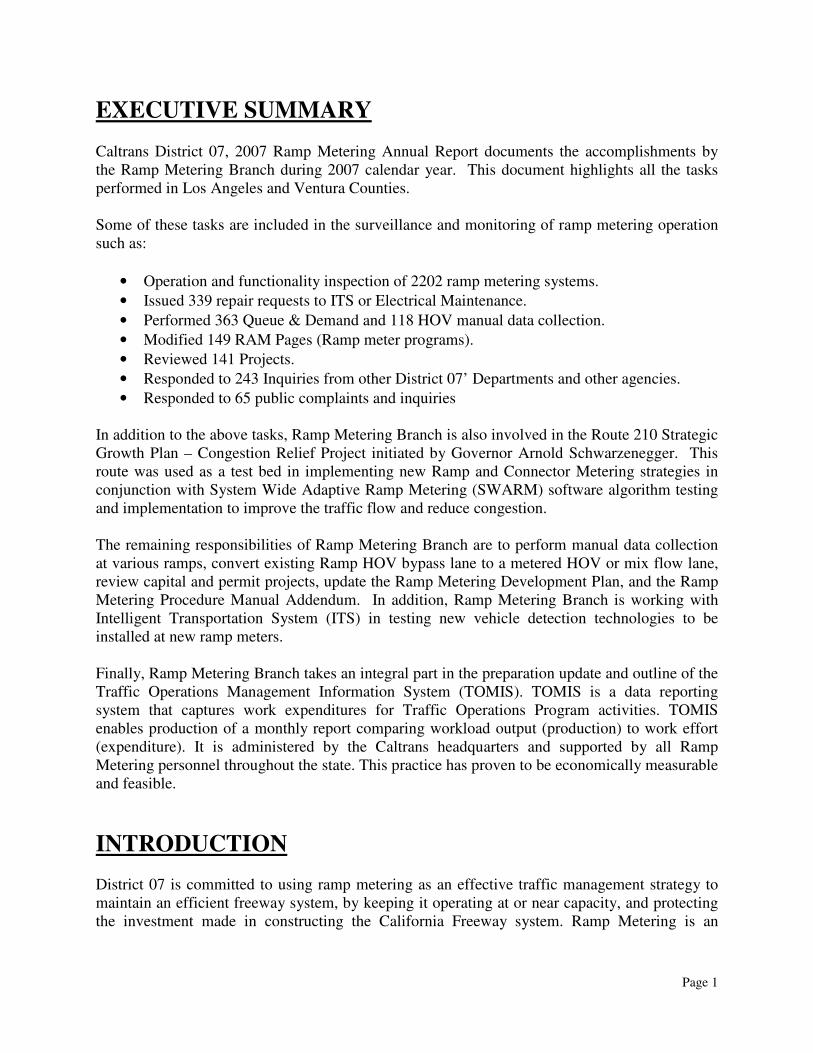
EXECUTIVE SUMMARY Caltrans District 07, 2007 Ramp Metering Annual Report documents the accomplishments by the Ramp Metering Branch during 2007 calendar year. This document highlights all the tasks performed in Los Angeles and Ventura Counties. Some of these tasks are included in the surveillance and monitoring of ramp metering operation such as:
• Operation and functionality inspection of 2202 ramp metering systems.
• Issued 339 repair requests to ITS or Electrical Maintenance.
• Performed 363 Queue & Demand and 118 HOV manual data collection.
• Modified 149 RAM Pages (Ramp meter programs).
• Reviewed 141 Projects.
• Responded to 243 Inquiries from other District 07’ Departments and other agencies.
• Responded to 65 public complaints and inquiries In addition to the above tasks, Ramp Metering Branch is also involved in the Route 210 Strategic Growth Plan – Congestion Relief Project initiated by Governor Arnold Schwarzenegger. This route was used as a test bed in implementing new Ramp and Connector Metering strategies in conjunction with System Wide Adaptive Ramp Metering (SWARM) software algorithm testing and implementation to improve the traffic flow and reduce congestion. The remaining responsibilities of Ramp Metering Branch are to perform manual data collection at various ramps, convert existing Ramp HOV bypass lane to a metered HOV or mix flow lane, review capital and permit projects, update the Ramp Metering Development Plan, and the Ramp Metering Procedure Manual Addendum. In addition, Ramp Metering Branch is working with Intelligent Transportation System (ITS) in testing new vehicle detection technologies to be installed at new ramp meters. Finally, Ramp Metering Branch takes an integral part in the preparation update and outline of the Traffic Operations Management Information System (TOMIS). TOMIS is a data reporting system that captures work expenditures for Traffic Operations Program activities. TOMIS enables production of a monthly report comparing workload output (production) to work effort (expenditure). It is administered by the Caltrans headquarters and supported by all Ramp Metering personnel throughout the state. This practice has proven to be economically measurable and feasible.
INTRODUCTION District 07 is committed to using ramp metering as an effective traffic management strategy to maintain an efficient freeway system, by keeping it operating at or near capacity, and protecting the investment made in constructing the California Freeway system. Ramp Metering is an
Page 2
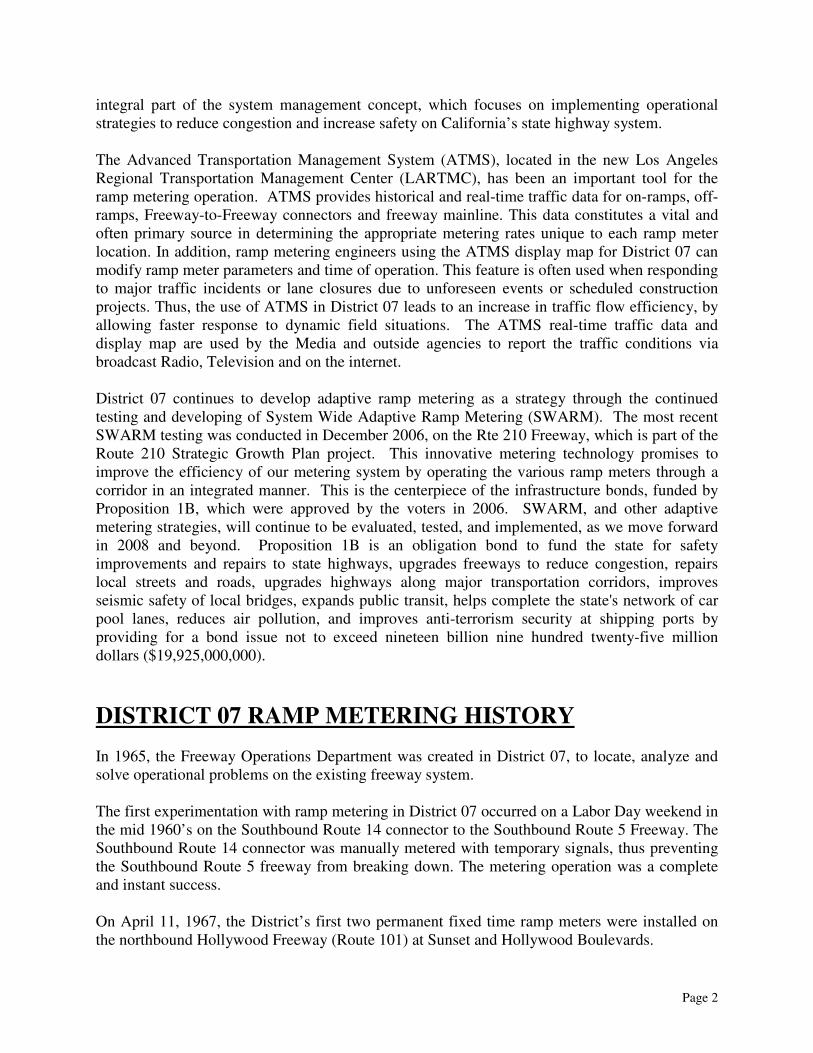
integral part of the system management concept, which focuses on implementing operational strategies to reduce congestion and increase safety on California’s state highway system. The Advanced Transportation Management System (ATMS), located in the new Los Angeles Regional Transportation Management Center (LARTMC), has been an important tool for the ramp metering operation. ATMS provides historical and real-time traffic data for on-ramps, off-ramps, Freeway-to-Freeway connectors and freeway mainline. This data constitutes a vital and often primary source in determining the appropriate metering rates unique to each ramp meter location. In addition, ramp metering engineers using the ATMS display map for District 07 can modify ramp meter parameters and time of operation. This feature is often used when responding to major traffic incidents or lane closures due to unforeseen events or scheduled construction projects. Thus, the use of ATMS in District 07 leads to an increase in traffic flow efficiency, by allowing faster response to dynamic field situations. The ATMS real-time traffic data and display map are used by the Media and outside agencies to report the traffic conditions via broadcast Radio, Television and on the internet. District 07 continues to develop adaptive ramp metering as a strategy through the continued testing and developing of System Wide Adaptive Ramp Metering (SWARM). The most recent SWARM testing was conducted in December 2006, on the Rte 210 Freeway, which is part of the Route 210 Strategic Growth Plan project. This innovative metering technology promises to improve the efficiency of our metering system by operating the various ramp meters through a corridor in an integrated manner. This is the centerpiece of the infrastructure bonds, funded by Proposition 1B, which were approved by the voters in 2006. SWARM, and other adaptive metering strategies, will continue to be evaluated, tested, and implemented, as we move forward in 2008 and beyond. Proposition 1B is an obligation bond to fund the state for safety improvements and repairs to state highways, upgrades freeways to reduce congestion, repairs local streets and roads, upgrades highways along major transportation corridors, improves seismic safety of local bridges, expands public transit, helps complete the state's network of car pool lanes, reduces air pollution, and improves anti-terrorism security at shipping ports by providing for a bond issue not to exceed nineteen billion nine hundred twenty-five million dollars ($19,925,000,000).
DISTRICT 07 RAMP METERING HISTORY In 1965, the Freeway Operations Department was created in District 07, to locate, analyze and solve operational problems on the existing freeway system. The first experimentation with ramp metering in District 07 occurred on a Labor Day weekend in the mid 1960’s on the Southbound Route 14 connector to the Southbound Route 5 Freeway. The Southbound Route 14 connector was manually metered with temporary signals, thus preventing the Southbound Route 5 freeway from breaking down. The metering operation was a complete and instant success. On April 11, 1967, the District’s first two permanent fixed time ramp meters were installed on the northbound Hollywood Freeway (Route 101) at Sunset and Hollywood Boulevards.
Page 3
The project was successful in relieving congestion on the freeway without seriously affecting surface street operations. Freeway delay was reduced by 75%. In the early 1970’s, District 07 created the Los Angeles Area Freeway Surveillance and Control Project (LAAFSCP). This experimental project, known as the 42-mile loop, was located on the Harbor Freeway (Route 110), Santa Monica Freeway (Route 10) and the San Diego Freeway (Route 405). The two primary objectives of the system were: first, to test and evaluate various techniques for improving movement of people and goods on the freeway by reducing traffic delay, accidents and motorists’ frustration and second, to integrate those techniques showing a great promise into an effective traffic management system. The LAAFSCP project consisted of a vast network of traffic sensors, telemetry equipment, in addition to a computer system for traffic data processing. The system provided real-time traffic data, a map display and an operator’s console. This was the beginning of the current LARTMC. The LAAFSCP project provided traffic engineers with data on a 24-hour basis, including freeway mainline volumes, speeds, occupancies and ramp volumes. Additional information provided by the system included travel time and traffic delay. Traffic responsive ramp metering was tested in the LAAFSCP project. The traffic responsive logic showed a great improvement over the existing fixed-time traffic controllers. Also in the early 1970’s, District 07 developed “A Program to Upgrade and Control the Los Angeles Freeway Network”. This program looked at sections of freeways that needed to be widened due to very heavy traffic demand. It was noted that as projects were completed, freeway congestion disappeared. However, as time went on, congestion returned since many motorists that were formerly taking city streets discovered the faster moving freeways. Ramp meters were then installed to control the input into the freeway system and to discourage local short trips. In 1992, the first connector meter in District 07 was installed on the Southbound Route 5 connector to the Southbound Route 110 Freeway. In 1994, Route 105 (Glenn Anderson Freeway) was opened to traffic. Design and construction of the Route 105 included freeway to freeway connector meters. Implementation of connector metering was possible on Route 105, due to long and wide connectors providing adequate storage and sufficient sight distance for fast approaching vehicles, especially on heavy volume connectors. Route 105 has a total of 19 connector meters in District 07, 17 are currently in operation, and the other 2 were turned off due to a lack of heavy traffic demand on these two connectors and a consistent free flow conditions on the receiving freeway (downstream from these connector meters). Today, ramp metering represents an important element of the Traffic Management System (TMS). The focal point of TMS is maximizing traffic flow on the freeway system by reducing congestion. Other elements of TMS include:
• Freeway Surveillance Equipment – provides essential traffic data to the LARTMC for early detection of incidents and locates areas of traffic congestion. Freeway surveillance equipment
Page 4
is part of the ramp meter detection system and is installed and maintained by the Ramp Metering Branch, ITS (Intelligent Transportation Systems) Branch and Electrical Maintenance Branch.
• Closed Circuit Television (CCTV) – Cameras with pan, tilt and zoom capabilities are used to confirm the exact location, nature and severity of freeway incidents.
• Changeable Message Signs (CMS) – The LARTMC manages 113 signs in District 07, located at key points on the freeway system. The LARTMC updates the display of CMS messages to provide major incident information, affecting traffic conditions and severe weather advisories. Estimated travel times are now displayed on selected CMS signs district wide. In the event of child abduction, CMSs are used by law enforcement to display Amber Alert messages.
• Highway Advisory Radio (HAR) – A short-range broadcast radio with transmitters located within the freeway right-of-way to provide motorists with updated informational messages such as directional advisories, traffic control restrictions as well as general information. HAR messages are remotely activated from the LARTMC.
• Freeway Service Patrol (FSP) – A team of 152 tow trucks patrolling 474 miles of Los Angeles County freeways to provide help to stranded motorists and quickly repair or remove disabled vehicles to relieve freeway congestion. Typical hours of operation are Monday through Friday between 6:00 AM and 7:00 PM, Saturday and Sunday from 10:00 AM until 6:30 PM.
RAMP METERING BASICS Ramp meters are traffic signals placed on freeway entrance ramps or freeway connectors to control the flow of vehicles entering the freeway or moving from one freeway to another. They are designed to decrease congestion and improve the average speed of vehicles traveling on the freeway, by controlling vehicular flow at most inputs onto the mainline. By installing a traffic signal at the on-ramp, Caltrans can control the rate at which vehicles enter the freeway. Vehicles entering at short intervals are less likely to slow down flowing traffic and can merge onto the freeway without causing the traditional bottlenecks, associated with heavy on-ramp traffic volumes. In addition, metering has been proven to reduce rear end and sideswipe traffic collisions, especially during congestion periods. The capacity of a freeway, in free-flow conditions, can easily reach 2000 vehicles per hour per lane (v/h/l). However, during congestion periods, this number often drops below 1500 v/h/l. Thus, a free-flowing traffic lane can carry 33% more cars than a congested lane. It is in the public interest to keep the freeways moving at free flow conditions. Therefore, by breaking up vehicular platoons entering the mainline, ramp metering helps to increase the total number of vehicles accommodated by the freeway.
Page 5
At some locations, where metered on-ramps include a High Occupancy Vehicle (HOV) by-pass lane, vehicles with two or more occupants, using these lanes, get priority access to the mainline freeway. This promotes carpooling which reduces the overall number of vehicles on the freeway. Additionally, ramp meters are used to discourage short distance travelers from using the freeway especially during the congestion periods where many arterial streets paralleling the freeways can be utilized. During congestion periods, many city streets paralleling the freeways are underutilized. Thus, motorists using local arteries, to avoid the wait at the ramp meter, will realize that it might be faster to use city streets, especially for short distance trips, than opting for the freeway. As a result, mainline traffic congestion will improve, due to less vehicles entering or travelling on the freeway. The following documents were prepared by Caltrans to guide in implementing ramp metering policy throughout the State: Caltrans’ policy on Ramp Metering is defined in Deputy Directive DD-35. See Attachment 3. RAMP METERING POLICY PROCEDURES, dated August 1997, provides guidelines for implementing the Department’s Ramp Metering Policy (DD-35). See Attachment 4. Design of Ramp Metering Facilities is governed by “Ramp Meter Design Guidelines”. Refer to REFERENCES, Item No. 1.
RAMP METERING BENEFITS The effectiveness of ramp meter systems has always been called into question. It is difficult to quantify ramp metering benefits, without conducting a detailed study to compare with and without effects of ramp metering implementation. In 2000, Minnesota Legislature passed a bill that required The Minnesota Department of Transportation (MnDOT) to study ramp metering effects in their State. Thus, MnDOT, responsible for managing freeway access in the Twin Cities (Minneapolis and St. Paul) metropolitan area, conducted a four month study aimed towards capturing these benefits. Data was collected during two different time periods; ramp meters were turned on in the first period then turned off in the second. After analyzing the data from both periods, it was concluded that ramp metering is a cost-effective investment. The study revealed the following ramp metering benefits: 21% reduction in accidents 8% increase in speed 22% reduction in travel time 16.3% increase in throughput capacity For detailed information, please refer to REFERENCES, Item No. 11.
TYPES OF RAMP METERING

Page 6
There are three types of ramp meter operations in District 07:
1. Fixed Time/Time of Day (TOD) 2. Local Mainline Responsive (LMR) 3. System Wide Adaptive Ramp Metering (SWARM)
It should be noted that all three types of metering operation could be implemented according to the following two modes:
• One Car per Cycle Metering - One vehicle per cycle per lane is permitted to enter the freeway. Assuming that green time is typically 2 seconds, the remaining cycle is red time, varying from 2 to 18 seconds. In District 07, the typical minimum metering cycle (Red + Green) time does not exceed 12 seconds or 300 vehicles per hour per lane (v/h/l), in order to minimize meter violations and minimize vehicle back-up onto local city streets.
• Platoon Metering - Two to three vehicles per cycle per lane are permitted. Typically, platoon metering is used at freeway connectors or heavy ramps, where traffic volumes exceed 900 v/h/l.
Type 1 - Fixed Time/Time of Day Fixed time ramp metering is the simplest form of ramp metering which breaks up platoons of vehicles entering the freeway. The ramp meter is programmed to operate based on a single or multiple fixed metering rates, for a pre-set metering period, based on historically averaged traffic conditions. Thus, the cycle length is “set” and does not change or respond to freeway mainline conditions. This is the primary drawback of this metering system. In addition, if the on-ramp gets congested, vehicle backup (Queue) reaches near city street, the Queue loop, usually located at the entrance of the ramp, will be triggered and the meter rate will increase to maximum rate (15 vehicles/minute/lane) until traffic back-up at the ramp is relieved. Metering rates can vary from 180 to 900 v/h/l and 600 to 1320 v/h/l for platoon metering. This type of ramp metering is used on a limited basis in District 07 when mainline loops are malfunctioning or during construction.
Type 2 - Local Mainline Responsive Metering
In addition to all the features of fixed time metering, local mainline traffic-responsive metering is directly influenced by the traffic conditions at the on-ramp and on the freeway mainline adjacent to the on-ramp. If the traffic volume and occupancy on the mainline freeway drops below a set critical volume and critical occupancy, the controller can override the set metered rates and allow more vehicles on the freeway up to the point of turning the meters to a constant green light. The primary criticism of local mainline responsive operation is that it reacts only to traffic conditions adjacent to the ramp and does not consider what is happening throughout the rest of the freeway corridor. Traffic responsive metering is widely used in District 07.
Type 3 - System Wide Adaptive Ramp Metering (SWARM)
Page 7
As the name indicates, it adapts the local traffic responsive concept to a whole freeway corridor. For additional information, please refer to “SYSTEM WIDE ADAPTIVE RAMP METERING” section of this report.
RAMP METERING TECHNOLOGY
ADVANCED TRANSPORTATION MANAGEMENT SYSTEM (ATMS)
The Advanced Transportation Management System (ATMS) is a computer system that was designed to assist in collection and dissemination of traffic information, in order to effectively manage the existing District 07 Transportation System. Refer to REFERENCES, Items No. 6, 7, and 14. The activities in the LARTMC are intended to reduce congestion and increase safety through the rapid detection of, response to, and removal of incidents on the freeway. Ramp Metering engineers using ATMS workstations, located in the LARTMC, can manage recurring congestion by remotely controlling ramp meter operation and analyzing freeway system efficiency, through historical report data. Additional ATMS enhanced features include incident detection which is integrated with the closed circuit television (CCTV) cameras to view traffic conditions and the use of changeable message signs (CMS) and highway advisory radio (HAR) to inform the motorists of existing freeway conditions and travel times. Ramp metering field hardware is the key element in providing data to the ATMS. The loop detector system on the freeway mainline, on-ramps, off-ramps, connectors, etc., is all tied to traffic controllers that send data to the ATMS. Ramp Metering, Intelligent Transportation Systems (ITS) and Electrical Maintenance personnel are responsible for new installations, operating, upgrading or modifying existing installations as well as maintaining all existing field elements. CALTRANS District 07, Ramp Metering and ITS Branch entered into a contract, in October 2006, with Delcan Technologies to modify the existing ATMS software. The goal is to make the ATMS more user friendly and be able to easily deploy the SWARM algorithm.
SYSTEM WIDE ADAPTIVE RAMP METERING (SWARM) System Wide Adaptive Ramp Metering (SWARM) is a ramp meter operating system developed by National Engineering Technology (NET) Corporation (Currently known as DELCAN TECHNOLOGIES), based on the recommendations and input of District 07’s Ramp Metering Branch. SWARM seeks to optimize traffic flow on the mainline by being responsive to actual and future forecasted conditions, throughout the system and to recurrent and non-recurrent congestion.

Page 8
Types of SWARM There are three basic types of SWARM: SWARM 1 operates system wide to predict congestion, SWARM 2a and SWARM 2b operate locally and are based on headway and storage capacity respectively.
SWARM 1
SWARM 1 is system wide adaptive and based on a freeway network divided into SWARM sections. Each section begins and ends at a mainline vehicle detection station (VDS) identified as a bottleneck. SWARM 1 algorithm operates at designated bottleneck locations and controls vehicle flow of all upstream on-ramp locations linked to that bottleneck. Since density is directly related to congestion, it is monitored at each bottleneck location. The algorithm requires a nominal saturation density threshold for each mainline VDS in the network. The algorithm attempts to estimate the density n minutes (user settable) in the future based on real time traffic data. When estimated density, at the bottleneck, exceeds saturation density, ramp meter rates will be computed in an attempt to proactively react to the predicted onset of congestion. Starting at the bottleneck and working upstream, the computer calculates new metering rates based on the required volume reductions. Actual metering rates vary between maximum and minimum rate. Since rate adjustments may be positive or negative, excess or reduction values are propagated upstream (User settable).
SWARM 2a SWARM 2a is local responsive based on headway (time between consecutive vehicles). It uses the density function to compute local metering rates and attempts to maintain headway such that maximum flow can be obtained.
SWARM 2b
SWARM 2b is local responsive based on storage. It computes the number of vehicles stored between two VDS stations and compares it to a maximum storage value. Metering rates are computed to maintain level of service (LOS) D as long as possible.
SWARM Combinations
SWARM can be used in combinations, i.e., SWARM 1 and 2b can be combined. The controller uses the more restrictive rates of those recommended. Within a bottleneck segment, some controllers can be placed on local Time of Day mode, while others are placed in one of the SWARM modes. The use of the local Time of Day mode is
Page 9
especially useful at on-ramps that experience heavy back up and can not be further restricted.
Advantages of SWARM It maximizes traffic flow on the mainline.
• It is responsive to actual traffic conditions throughout the freeway corridor.
• It is responsive to recurring and non-recurring congestion.
Disadvantages of SWARM
• Ramp control and traffic surveillance devices must be connected to a computerized communications center.
• Communication lines have to be maintained at all times in order for SWARM to operate properly.
• SWARM requires accurate data from mainline and on and off-ramp detectors in order to work effectively.
• It is more complicated than local traffic responsive metering.
SWARM Testing SWARM was tested in 2001 and 2002, on Routes 210 and 405. Results of the Route 210 study were published in the “PRELIMINARY SWARM STUDY REPORT” dated November 2001 and the “SWARM STUDY FINAL REPORT” dated October 2002. A brief summary was prepared following the Route 405 study in 2002. Please refer to REFERENCES, Item Nos. 4, 5 and 16. Last SWARM testing took place on Route 210. SWARM was tested on Eastbound and Westbound Route 210, from Baseline Rd. at Los Angeles / San Bernandino County line (PM 52.00) to Marengo, in the City of Pasadena just east of the Route 134 Interchange (PM 26.00). The testing took place between November 7, 2006 and December 14, 2006. This testing was the first for SWARM since the Route 405 study in January of 2002. Along with SWARM testing, travel time runs on Route 66, paralleling the Route 210 Freeway, were performed between October 24th, and December 14th, 2006. All study data for SWARM and travel time runs were submitted to the consultant, Cambridge Systematic. This data will be compiled and analyzed as part of the Route 210 Growth Plan – Congestion Relief Project. SWARM testing did not take place during the year 2007 pending the completion of the connector metering installation at various connectors in the Eastern Segment of the project.
SATMS 3.0
SATMS is an acronym for Semi-Automatic Traffic Management System. SATMS 3.0 is a new computer processor chip developed recently by Caltrans ITS to upgrade the existing ramp metering software. The previous versions were SATMS 1, used only at on-ramps and SATMS C for both connector and on-ramp locations.

Page 10
The primary goal for the SATMS 3.0 upgrade is to make it compatible with the new ramp metering algorithm, known as SWARM. However other features were also added in order to enhance the overall ramp meter operation. In 2002, SATMS 3.0 chip was tested at several locations district wide. Once the testing phase was completed, the updated chip was installed at all on-ramp controller cabinets (except at Route 105 connectors). By the end of 2003, ramp meter operation was universal district wide as SATMS 3.0 chip replaced all previously existing ones. The new features in the SATMS 3.0 chip are:
• Speed up the controller 170 initiation reset time following a power failure, which reduces the watchdog black out problem. Therefore, variation or brief interruption in power voltage level will have less effect on the operation of the ramp meter.
• The loss of communication Cycle Time is increased from one cycle (approximately 30 seconds) to ten cycles or around five minutes, in order to minimize frequent changes between SWARM and local Time of Day modes. Thus, communication losses lasting no more than ten cycles would not affect the implementation of SWARM in the field; the controller would meter for up to five minutes, according to the last SWARM rate before communication failure occurred.
• Queue override maximum rate can be set by the Engineer to be lower than 15 vehicles per lane per minute. In addition the new chip provides the ability of linking the activation of the Queue override mode to mainline traffic condition by setting a threshold speed level (normally set at 35 mph) to control Queue activation.
• Queue Override mode created to speed up the metering rate when vehicular back up reaches the entrance of the on-ramp can be used with SWARM mode. If activated, the Queue override mode, in case of a ramp back up, will gradually increase the metering rate dictated by SWARM up to a maximum rate of 15 vehicles per minute per lane; Therefore, reducing the overflow of vehicles onto city streets.
• Whenever metering is initiated or terminated by SWARM or loss of communication cycle time exceeds ten cycles, the controller will apply one minute Green light at the beginning and end of each metering phase.
• Set improved default values for the SATMS 3.0 chip over the previous ones.
• Improve the program’s traffic responsive feature.
• For Connectors only: Q2 loop operation is enhanced as follow: 1. Q2 can be programmed to operate independently of Q1 to trigger green light, when
backup occurs.
Page 11
2. Similarly to on-ramps Queue 1 Override maximum rate can be set at lower than 15 vehicles per lane per minute. In addition, Queue 1 and 2 activation modes can be controlled by mainline threshold speed level set by the engineer.
During 2007, Ramp Metering Branch partnered with ITS support to develop an improved SATMS 3.0 microchip. These improvements are as follows:
• Normalize the real-time occupancy reading, by averaging the last two occupancy readings.
• Smoothing off the gradual increase in the Traffic Responsive Rate, according to a settable integral. This feature will delay the rest in green mode and greatly reduce any unnecessary occurrences.
• Link the watchdog safety switch to address “0F4”, so it can be detected by the ATMS. Testing of the new SATMS microchip started in spring 2007.
UNIVERSAL RAMP METERING SYSTEM (URMS) At Caltrans, several ramp metering software packages are being used. These include the San Diego, Ramp Metering System (SDRMS) deployed in D3, D6, D8, D10, and D11; Semi-Automatic Traffic Management System (SATMS) deployed in D7: and Traffic Operations System (TOS) deployed in D4. District 8 has just deployed Revision 8 of the SDRMS. D11 is in the process of testing a dynamic ramp metering system. A variation of SATMS named Orange County Ramp Metering System (OCRMS) allows staggered ramp metering, and was deployed in D12. Caltrans strives to unify ramp metering operating software systems to minimize the operations and maintenance costs. A software package, called Universal Ramp Metering System (URMS) was therefore developed and is currently being evaluated statewide. URMS is deemed the future of ramp metering operations software. The ramp metering algorithms implemented in these software packages react to rather than prevent bottlenecks. SWARM algorithms involve integrating traffic predictive capabilities into the metering logic. It may have the capability of preventing bottleneck activation, instead of just reacting to it.
ROLES AND ESPONSIBILITIES Electrical Maintenance and ITS Branch work as a team with the Ramp Metering Branch. Thus, ramp metering engineers are responsible for the operation of ramp meters district-wide, report all trouble issues to both Electrical Maintenance and ITS Branch, for prompt repairs. In addition, as a way to exchange ideas and resolve any outstanding issues related to the repair and improvement of the ramp metering system, these groups meet on a quarterly basis.
RAMP METERING BRANCH The ramp metering system in the District is inspected and regularly observed through routine field surveillance and frequent ATMS observation. Ramp Metering Engineers are responsible for the ramp meter programmed software as well as the proper operation of ramp meters district- wide. Ramp Metering operation software consists of a “Ram Map” package which includes a

Page 12
program sheet, Time of Day (TOD) table and a detailed loop detector (sensor) diagram layout, in addition to an electrical as-built plan showing all of the hardware. Ramp Meter hardware includes signals, controllers, loop detectors, signing, striping and advance warning devices. Area Engineers (lead workers) are assigned ramp meters by routes or segments of routes. Other engineers within the Ramp Metering Branch assist the Area Engineers. For more details, please refer to ATTACHMENT 3 and Ramp Metering Branch Production Section on page 12.
ELECTRICAL MAINTENANCE BRANCH
Electrical Maintenance responds to ramp meter malfunctions reported by CHP, Ramp Metering Branch, ITS Branch and the general public, if related to hardware and electrical problems. As a routine procedure, Electrical Maintenance performs a 120-day check of all ramp metering equipment. The following main actions are performed by the Electrical Maintenance technician during this check:
� Maintenance of Freeway Meter Signals Meter signals should be checked for damage, proper operation, and timing every 120 days. This check should include the following items as a minimum: (A) Field Inspection
(1) Visual check of indications.
(2) Signal indication alignment.
(3) Hardware (hand-hole covers, signs, poles, backplates, etc.). (4) Pullbox covers (broken, missing, and clear of dirt or debris).
(5) Visual check of service cabinet and equipment locks.
(6) Visual check of loops in roadway (if possible).
(B) Cabinet Interior (1) Controller unit indicator lights and display.
(2) Function and timing.
(3) Detector indicator lights and operation.
(4) Check output devices, including interconnect systems.
(5) Thermostat and ventilation system including filter.
Page 13
(6) Clean cabinet and interior components.
(7) Check documentation (timing sheets, schematics, wiring plans, etc, and inspection noted on cabinet login card).
(C) Cabinet Exterior
(1) Condition of surface (paint, damage, graffiti).
(2) Condition of locks and handles.
(3) Operation of Police panel switches.
� Meter Timing and Operation Initial timing of ramp meter signals and any subsequent changes in timing are the sole responsibility of the Ramp Metering Branch. Maintaining the timing is the responsibility of the Division of Maintenance or the district Electrical Maintenance Branch.
INTELLIGENT TRANSPORATION SYSTEMS (ITS) BRANCH ITS Branch provides technical support for the LARTMC. This includes ramp metering and ATMS. ITS main duties are: 1. Test and develop new software related to metering operation. 2. Set up the configuration of ATMS. 3. Review electrical design plans for new projects. 4. Monitor and correct any discrepancies found on the ATMS data reports such as icons, loop
configuration, etc. 5. Check system electrical operation and final compliance in accordance to the contract
documents or as-builts on all new and replacement equipment. 6. Test and maintain communication lines between field equipment and TMC.
RAMP METERING BRANCH PRODUCTION
Ramp Metering Branch production was divided into work categories as follows:
1. Surveillance and Monitoring of Ramp Operation.
• Charts describing Ramp Metering production: A. Operation and Inspection of Ramp Metering Cabinets (Figure 1) B. Issues Reported to ITS or Electrical Maintenance (Figure 2) C. Manual Data Collection 2007 (Figure 3)
Page 14
D. Modify Ram Pages (Figure 4) E. Projects Reviewed (Figure 5) F. Complaints & Inquiries 2007 (Figure 6)
2. Route 210 Strategic Growth Plan – Congestion Relief Project 3. Ramp Meter Data Collection
A. Various Routes B. Route 210, Congestion Relief Project
4. Capital Project Review 5. Permit Project Review 6. Metered Ramp Data Summary 7. Ramp Meter Development Plan (RMDP) 8. Ramp Metering Procedure Manual Addendum 9. Testing of new Vehicle Detection Technologies 10. Convert existing ramp HOV bypass lane to a metered HOV or mix flow lane. 11. Major Ramp Metering Operational study 12. New Ramp Meters 13. Traffic Operations Management Information System (TOMIS)
The following sections summarize in depth the amount of work performed for each of these categories. All data included in the sections below was obtained from Weekly Ramp Meter Reports filed by all Ramp Metering Engineers.
1. Surveillance and Monitoring of Ramp Operation
Currently, District 07 has 870 metered on-ramps and 19 freeway to freeway connectors, making it the largest ramp metering district. The Ramp Metering Branch periodically performs field surveillance and corrects minor software and hardware problems associated with the metering operation. Staff observed traffic backups on the ramp, verify appropriate metering rates and check for any malfunctions with signal lights or advanced warning signs. If the meter is off during metering hours, the controller software program and cabinet hardware will be checked in order to diagnose the problem; minor issues will be corrected, while major problems are reported to Electrical Maintenance or ITS Branch for repairs.
Page 15
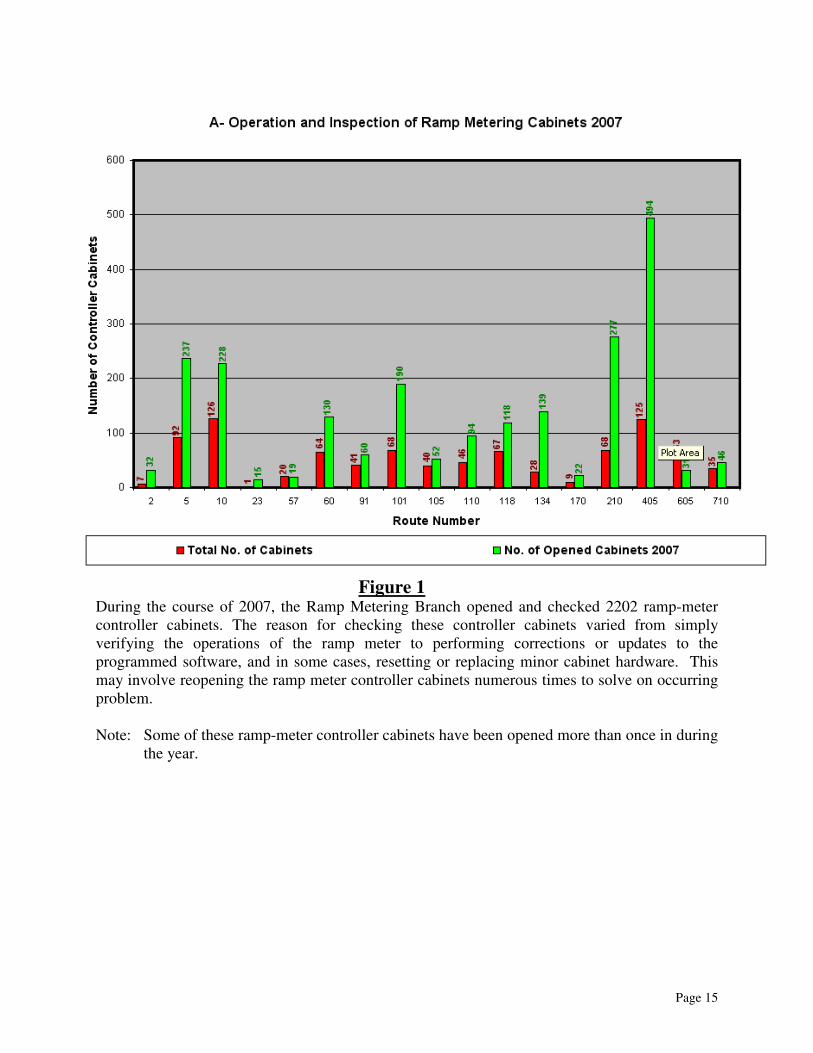
Figure 1 During the course of 2007, the Ramp Metering Branch opened and checked 2202 ramp-meter controller cabinets. The reason for checking these controller cabinets varied from simply verifying the operations of the ramp meter to performing corrections or updates to the programmed software, and in some cases, resetting or replacing minor cabinet hardware. This may involve reopening the ramp meter controller cabinets numerous times to solve on occurring problem. Note: Some of these ramp-meter controller cabinets have been opened more than once in during
the year.
Page 16
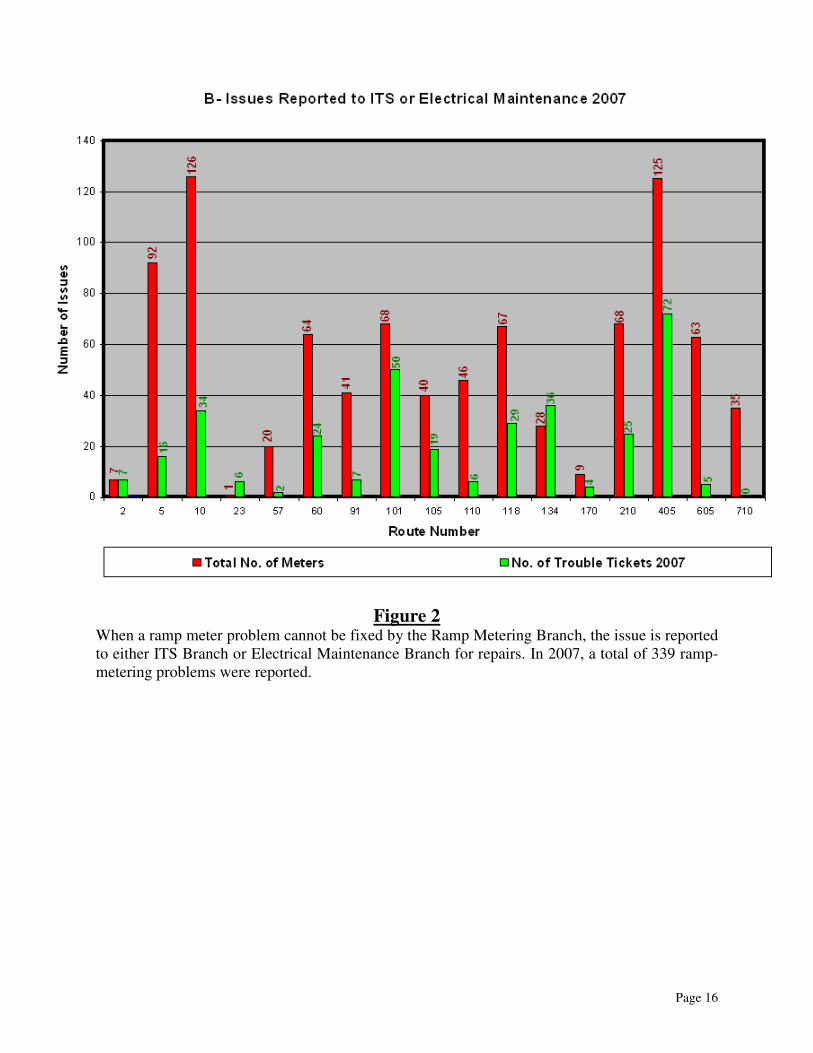
Figure 2 When a ramp meter problem cannot be fixed by the Ramp Metering Branch, the issue is reported to either ITS Branch or Electrical Maintenance Branch for repairs. In 2007, a total of 339 ramp-metering problems were reported.
Page 17
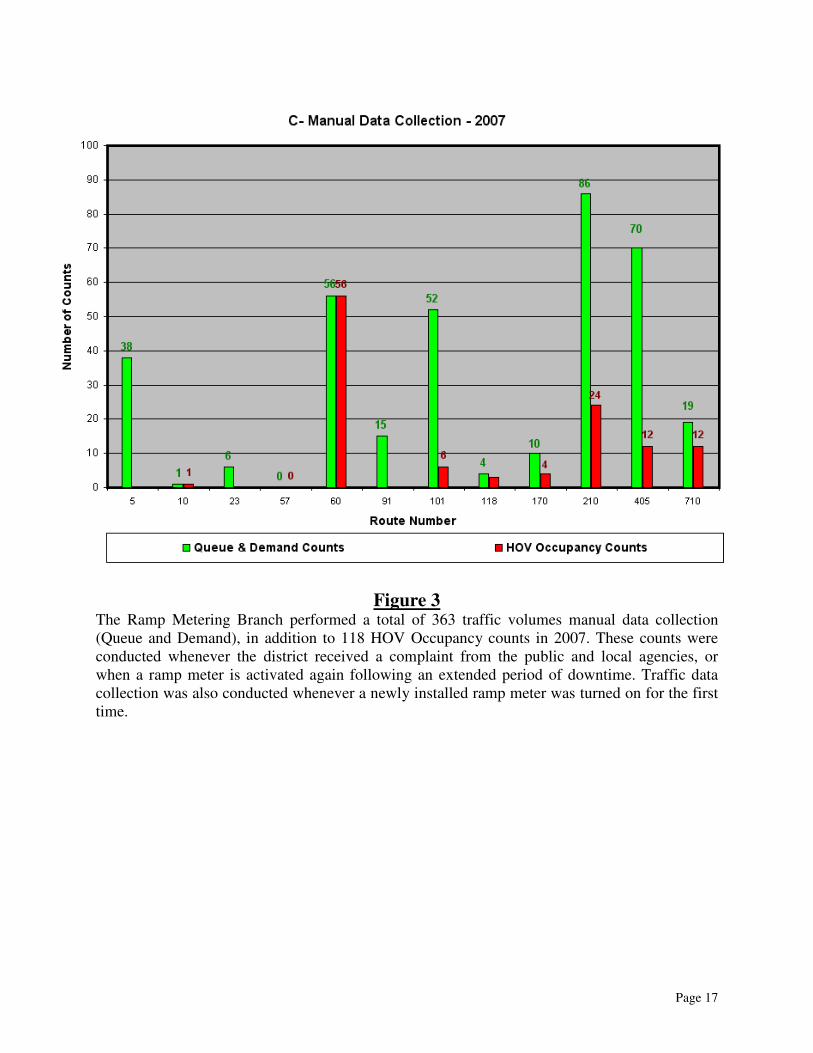
Figure 3 The Ramp Metering Branch performed a total of 363 traffic volumes manual data collection (Queue and Demand), in addition to 118 HOV Occupancy counts in 2007. These counts were conducted whenever the district received a complaint from the public and local agencies, or when a ramp meter is activated again following an extended period of downtime. Traffic data collection was also conducted whenever a newly installed ramp meter was turned on for the first time.
Page 18
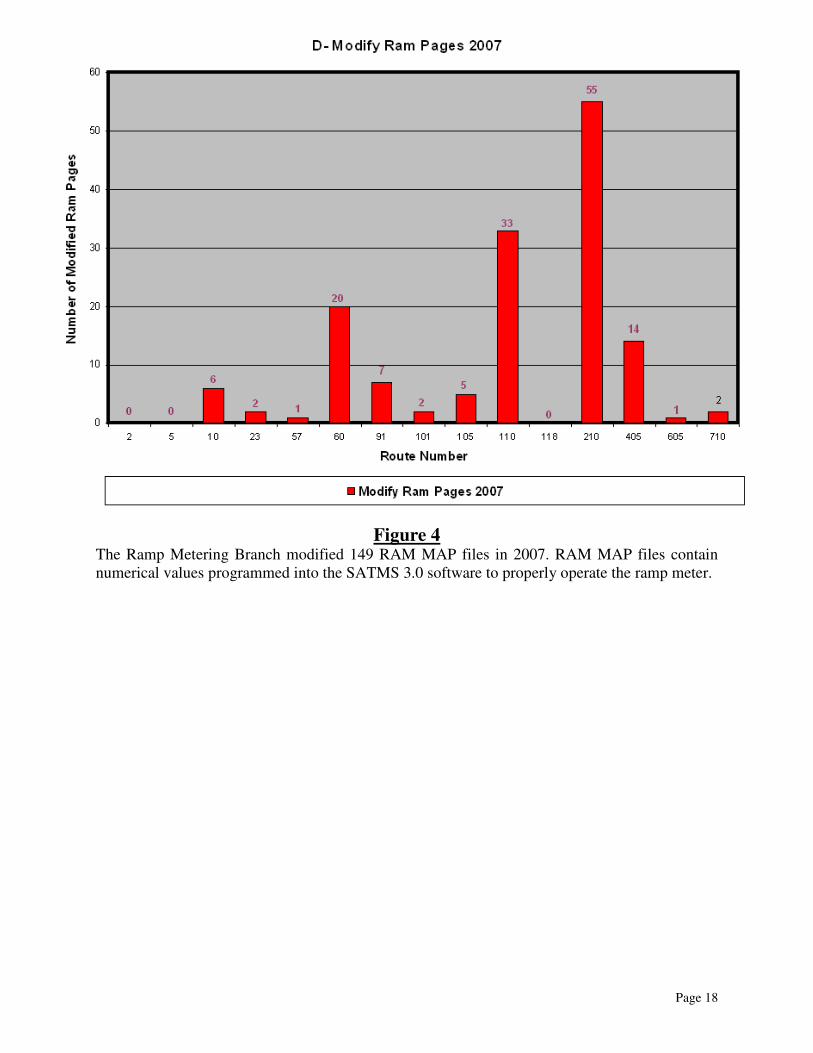
Figure 4 The Ramp Metering Branch modified 149 RAM MAP files in 2007. RAM MAP files contain numerical values programmed into the SATMS 3.0 software to properly operate the ramp meter.
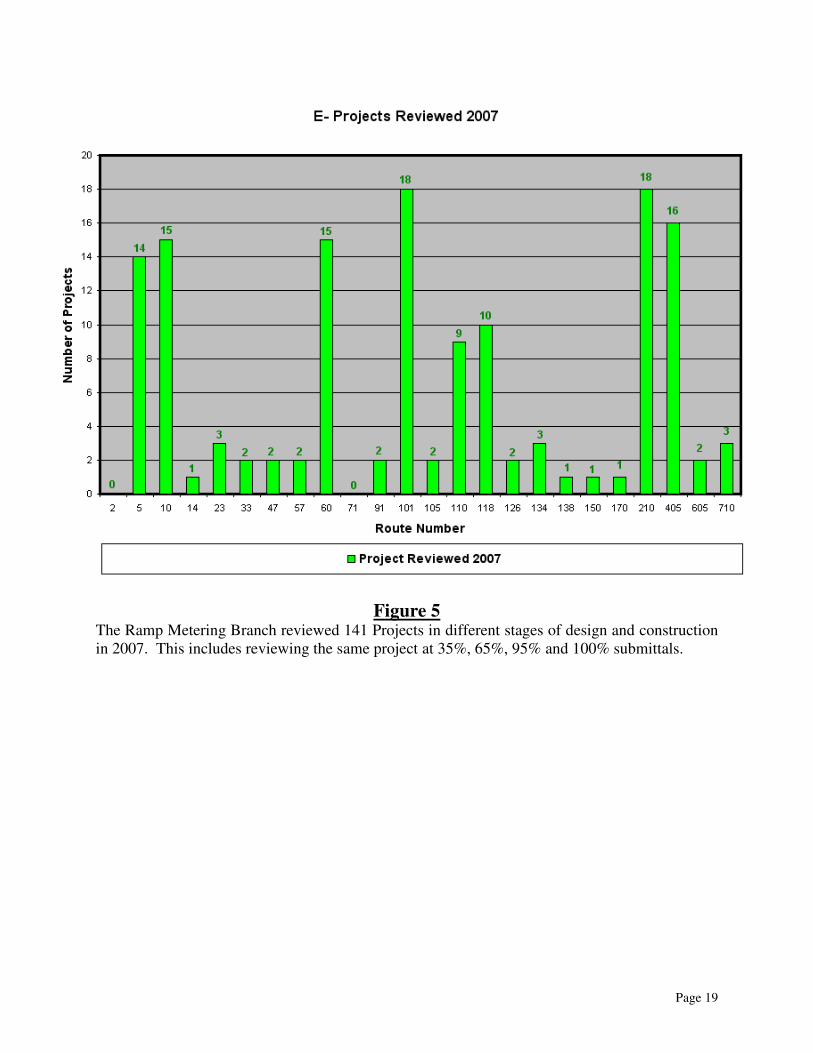
Page 19
Figure 5 The Ramp Metering Branch reviewed 141 Projects in different stages of design and construction in 2007. This includes reviewing the same project at 35%, 65%, 95% and 100% submittals.
Page 20
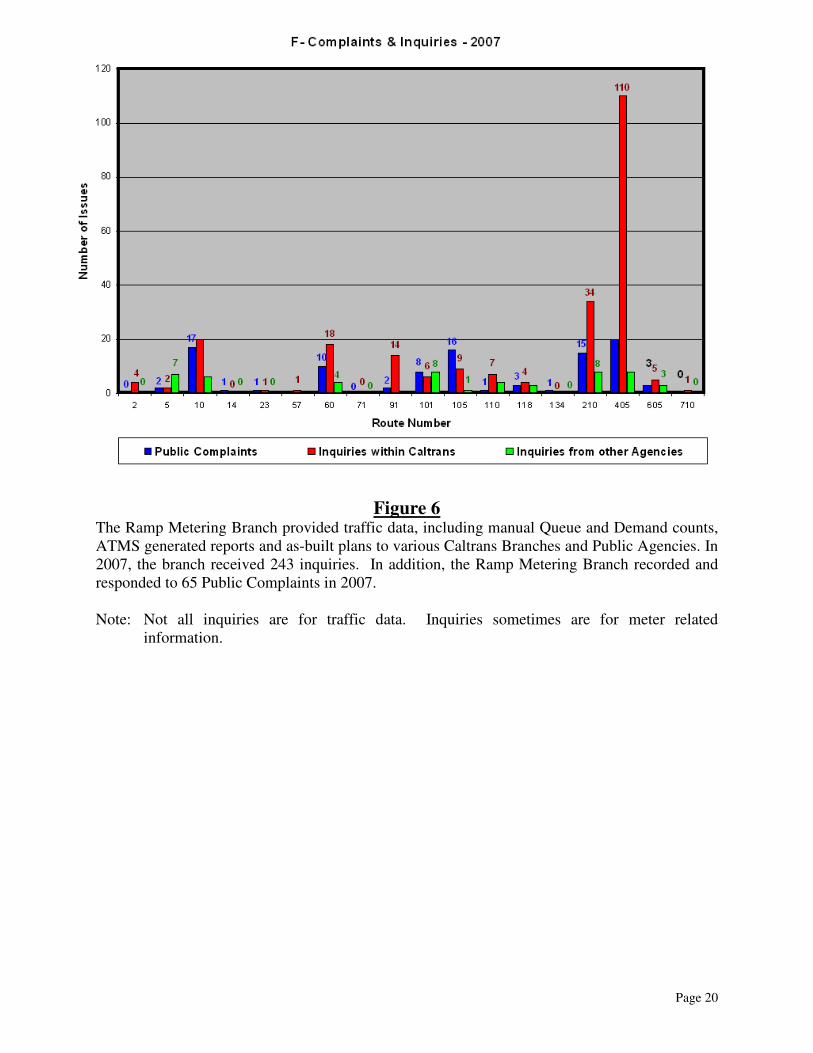
Figure 6 The Ramp Metering Branch provided traffic data, including manual Queue and Demand counts, ATMS generated reports and as-built plans to various Caltrans Branches and Public Agencies. In 2007, the branch received 243 inquiries. In addition, the Ramp Metering Branch recorded and responded to 65 Public Complaints in 2007. Note: Not all inquiries are for traffic data. Inquiries sometimes are for meter related
information.

Page 21
2. Route 210 Strategic Growth Plan – Congestion Relief Project
Introduction
Route 210 Strategic Growth Plan consists of 2 congestion relief projects. The first project, EA 257404, extends over the eastern segment of Route 210 corridor from post mile 26.00 (City of Pasadena) to post mile 52.00 (San Bernardino County Line), while the second, EA 258004, covers the western segment from post mile 0.31 (Route 5) to post mile 24.92 (Route 134).
Needs and Challenges
Continued population growth and economic development in the 210 Corridor communities has resulted in increasing travel demand on the freeway. In addition, extension of the freeway in recent years to connect with Routes 15 and 215 to the east has also created additional demand for travel on the freeway. Meanwhile, the built out urban environment surrounding the freeway, combined with difficult geography and other environmental, political and funding constraints, have often made it impractical to add physical capacity to the roadway within the corridor at a pace equal to the increasing demand. The result of this imbalance between available capacity and demand has been increased congestion resulting in slower travel speeds, extended delay and increased exposure to accident risk, in addition to declining environmental quality. As an illustration of this increasing congestion, performance metrics suggested that average peak period travel speeds have decreased by an estimated 30 percent between the years 2000 and 2006 for some sample sections of the corridor.
Project Description
The two Congestion Relief Projects primarily focused on the development and implementation of enhanced on-ramp and freeway-to-freeway connector metering strategies designed to improve the ability for effective traffic management along Route 210 corridor. The deployment and testing of these strategies should provide the opportunity to evaluate the potential impacts of different aspects of the improvements. These main aspects are highlighted below:
1. The installation of 41 new traffic responsive ramp meters at existing non-metered
on-ramp locations, bringing the total to 107 ramp metering stations throughout the corridor.
2. Addition of 24 microwave vehicle detection stations, along brief remote sections in the western end of Route 210 corridor: This new technology was installed within a rural section along the western segment of the corridor.
3. Installation of 9 Freeway-to-freeway connector meters along five major interchanges (Routes 2, 57, 118, 134 and 605 with Route 210 corridor): The purpose of this strategy is to regulate the flow of vehicles, from connecting freeways, onto Route 210.
Page 22
4. Introducing High Occupancy Vehicle (HOV) bypass lane metering at 9 existing and 20 new ramp metering locations. This strategy is intended to better manage the uncontrolled flow of HOV vehicles onto the Freeway mainline.
5. Conversion of 23 existing non-metered HOV by-pass lane to metered on-ramp mix flow lanes: This conversion was required in order to provide additional vehicular storage capacity needed to effectively implement ramp metering operation.
6. System Wide Adaptive Ramp Metering (SWARM): This advanced metering strategy works by evaluating real-time traffic situations at selected and dynamic bottlenecks throughout the corridor, in order to predict future congestion and properly set upstream ramp metering rates helping to reduce congestion. This methodology improves the ability to maximize and maintain efficiency of traffic flow throughout the corridor. It represents an innovation over current metering capabilities, by implementing ramp metering on a system wide basis, thus, responding to both recurring and non-recurring traffic congestion.
The addition of these strategies also required many supporting implementations including the addition of signage (both extinguishable and static), re-striping, the addition or repositioning of traffic detectors, and ramp reconfiguration.
Analysis of Existing Condition in 2006, prior to the improvements:
Analysis of existing condition was conducted in 2006, prior to the start of construction which took place throughout the course of 2007, and it consisted of:
1. March 2006 to June 2006: Manual field counts at all 107 on-ramp locations, located
within the two project limits. In addition, ATMS mainline data for volume, occupancy and speed was collected on the same days that the manual field counts were conducted.
2. October 2006 to December 2006: Travel time runs in both directions of Route 66, paralleling the eastern segment of Route 210.
3. November 2006 to December 2006: Swarm implementation on both directions of the eastern segment of Route 210. In addition, travel time runs were conducted at all four connectors leading to Route 210 from Routes 57 and 605.
Project Activities in 2007:
Construction of the two Congestion relief projects along Route 210 corridor was undergoing throughout the course of 2007. Ramp Metering unit involvement for most of the year consisted of providing technical support and field review of critical construction activities including the preparation of various Contract Change Orders (CCO) needed to modify some elements in the original project design plans. However, five ramp meter locations along the eastern segment and three along the western segment were activated in June of 2007. In addition construction of ramp meters in the western direction of the eastern segment of the corridor was completed at the end of 2007. This was followed by a thorough field check at all modified or newly constructed
Page 23
ramp meter locations. This final check was essential in order to address any issues or problems caused by fast track construction. Once all issues were resolved, a field study was conducted in order to activate the ramp meters in this section of the corridor. The study involved queue and demand counts, where traffic data similar to the before study was collected. Based on this data, appropriate metering rates were implemented at each ramp meter location. This study covered 12 ramp meter locations, in addition to the 8 activated in June of 2007, located along the western direction between San Bernardino County Line and Route 134 in the City of Pasadena.
3. RAMP METER TRAFFIC DATA COLLECTION There are three types of traffic data collection conducted by the Ramp Metering Branch:
1. Queue and Demand (Q & D) count 2. High Occupancy Vehicle (HOV) count 3. Violation Rates count
"Queue and Demand" counts are performed to study the operation of metered ramps, which include time and extent of traffic backup (Queue) due to ramp metering. In addition to measuring the peak vehicular demand at the ramp, the types of vehicles using the ramp are also recorded. Queue and Demand information helps to implement an effective ramp metering strategy. Metering rates are implemented according to type and volume of traffic demand at the on-ramp in relation to mainline traffic conditions. "HOV" counts are conducted at metered on-ramps with an HOV lane. The purpose of these counts is to determine time intervals, types of vehicles (truck, buses, and motorcycles), vehicle occupancy (2, 3 …persons per vehicle). The percentage of usage of the HOV lane, in relation to the metered mix-flow lane, is calculated with this information. In addition, the number of HOV lane violations is recorded. If the violation rate is determined to be high, this information is forwarded to the California Highway Patrol for enforcement. These three types of data collection should be conducted, on a yearly basis at all active ramp meter locations. However, due to time constraints and limited resource allocations, these counts are currently performed as a result of public complaints, upcoming projects and developments impacting the operation of the ramp meter. Thus, if a public complaint related to excessive back-up on the ramp is received, a field review and a “Queue and Demand” count might be conducted to properly investigate the problem and adjust the metering rate if needed. In addition, if a project to construct a new ramp or modify an existing one is being proposed, then a traffic count will be conducted, in order to assist in the new design. On-ramp Counts might also be conducted during major studies (SWARM testing), or large scale projects, such as the Route 5 Widening and HOV project.

Page 24
A. Various Routes. During the 2007 calendar year, the Ramp Metering Branch conducted 363 “Queue and Demand” and 118 “HOV” counts.
B. Route 210 Congestion Relief Project.
Manual Queue and Demand, and HOV Counts were performed on the entire stretch of Route 210 between 4/25/2006 and 06/06/2006. These counts were conducted at all 107 on-ramp locations, located within the two project limits.
4. Capital Project Review The Ramp Metering Branch reviews numerous projects and gets involved in ramp meter related issues, during the following stages of a project:
1. PID (Project Initiation Document) 2. PSR (Project Study Report) 3. PR (Project Report) 4. All stages of PS&E (Plans Specifications and Estimate)
In addition, the Ramp Metering engineers also keep track of the project’s progress throughout the construction stage.
5. Permit Project Review
The Ramp Metering engineers review and comment on ramp meter related issues involved in permit projects, and oversight projects, which are usually prepared by consultants on behalf of local cities, counties or other agencies.
6. Metered Ramp Data Summary
The Ramp Metering personnel collect information for the METERED RAMP DATA SUMMARY. Information gathered includes but is not limited to the following items:
• Ramp type and configuration
• Number of lanes
• Ramp storage length
• “Meter On” signs
• HOV and pullout locations
• Metering hours
• Metering rates
• Inventory of loops & loop detectors
• Signing
Page 25
• Striping The above information is useful for the following purposes:
• To provide a database for the “RAMP METER DEVELOPMENT PLAN” report.
• To generate a master list detailing all deficiencies and to forward it to the ITS group for repairs.
• To replace on-ramp detector loops, detector cards and to reconfigure detector loop connections (DLC), when needed, at numerous traffic controller cabinets.
7. Ramp Meter Development Plan (RMDP)
The first 10-year RMDP report was completed in 1997 and was due to be updated by 2007. However, an updated RMDP report was initiated in 2004 and published in July of 2005. This 10-year report contained an inventory of all on-ramps (metered and non-metered), metered connectors, in addition to a listing of on-ramps proposed or funded to be metered, within the next 10 years. For detailed information, please refer to REFERENCES, Item No. 2.
8. Ramp Metering Procedure Manual and Addendum
The Ramp Metering Procedure Manual and Addendum has been on the Caltrans website since 2006. Refer to the District 07 website, under Freeway Operations Publications.
9. Testing of New Vehicle Detection Technologies
During 2007, District 07’s Ramp Metering Branch tested new Microwave Radar Detection Technology at various locations on Route 5, Route 10 and Route 210 to detect vehicles on the freeway system. This radar system is easy to install and is compatible with the URMS software package that is being introduced at this time. Unlike the loop system and instead of closing freeway lanes, the radar system can be mounted on an existing power pole or an overhead sign pole with a minimal lane closure in place. The radar system detects traffic in the same manner as the loop detection does. The only difference is that the radar system detects traffic from overhead while the loop system is embedded in the roadway. The only draw back for this system is maintaining and positioning the radar to detect traffic properly while resisting the wind load without shifting or sliding from its position. Severe weather conditions or simply a traffic collision on the freeway can disrupt the functionality of this system. District 07 ITS Branch also experimented with wireless detection system. The wireless system works as the loop detection system as well. It is also embedded in the pavement – one device per lane. Unlike the loop system, the wireless detection system does not require wire to be run across the freeway lanes. Instead, each wireless system is embedded in a predrilled hole in each lane of the freeway. The only drawback is the battery life for each wireless detector can only last for maximum of 10 years. In addition, these wireless devices require individual programming to
Page 26
a separate control card located in the ramp metering cabinet. Maintaining such units can prove to be costly and time consuming.
10. Convert Existing Ramp HOV Bypass Lane to a Metered HOV OR Mix Flow
Lane
In 2007, the Ramp Metering Branch conducted traffic study at LA – 405 Southbound @ Manchester Avenue On-Ramp. As a result of this study, it was decided to convert the existing ramp HOV bypass lane into a metered lane. This mitigation improved the traffic congestion at the interchange and added more storage capacity at the On-Ramp.
11. Major Ramp Metering Operational Studies Widening and adding HOV construction projects on Route 405 from Route 105 to Route 90 and from Wilshire Blvd to RTE 101 were recently completed. Four ramp meters were modified and affected by the construction. Traffic Operational study was conducted in order to activate, evaluate and determine the appropriate metering rate. Queue and Demand (Q & D) and Occupancy traffic counts were performed on weekdays and weekends at the following locations: 1. LA-405-SB @ WB Wilshire Blvd, PM 31.66; This on-ramp was off for approximately 12 years, ramp geometric improvements were implemented. 2. LA-405-SB @ EB Wilshire Blvd, PM 31.39; This on-ramp was off for approximately 2 years, ramp geometric improvements and meter location were implemented. 3. LA-405-SB @ La Cienega Blvd, PM 23.61; This on-ramp has been off for approximately 15 years., 4. LA-405-SB @ Manchester / Olive Blvd, PM 22.34; This on-ramp was off for approximately 5 years Sepulveda Pass Project @ LA-405-NB The is the widening for HOV Lane Northbound design-build project on Route 405 from Route 10 until Route 101. Ramp Metering Branch has contributed an intensive assistance in the Project Risk Management and Technical Provisions.
12. New Ramp Meters
On October 12, 2007 a fiery crash accident occurred in the tunnel just north of Route 14 in the southbound Route 5 involved several trucks and took 3 lives. As a result of this tragic accident a committee was assigned to investigate the cause of this accident and come up with the recommendation in order to improve safety. One of the measures on the final recommendation was to meter all the on-ramps from Route 126 to Route 5 in the southbound direction of Route 5(Golden State Freeway). The proposed metering was in the following Southbound on-ramps:
Page 27
1- Rye Canyon Road. 2- Magic Mountain Parkway 3- WB Valencia Boulevard 4- EB Valencia Boulevard 5- WB Mc Bean Parkway 6- EB Mc Bean Parkway 7- WB Lyons Avenue 8- EB Lyons Avenue / Pico Canyon 9- Calgrove Blvd
Five out of eight remaining on-ramps had controllers and basic hardware; they only needed meter head and minor hardware. There were no ramp metering components at WB Mc Bean and EB Mc Bean on-ramps and also at the EB Lyons / Pico on-ramp; three out of five mainline loops were functional. Due to urgency of the project it was decided that instead of cutting the new loops in the mainline Freeway, use Micro Wave Detector system in lieu of the loops at these locations. By December 2007 all the above meters were activated.
13. Traffic Operations Management Information System (TOMIS)
Ramp Metering Branches throughout Caltrans in all 12 districts have adapted the Traffic Operations Management Information System (TOMIS). In Traffic Operations Management Information System (TOMIS), there are six subjobs that are related to ramp metering activities. These are EA 936501, subjob 3RACT, 3RSUR, 3RPNT, and 3RTRV; and EA 936602, subjob 3RFAS and 3TRVL. The detailed descriptions of these subjobs are tabulated in the following Table 3. On a monthly basis, production units for each subjob are reported to Headquarters. These production units are also defined in Table 3. Currently, the workload standard (See Attachment 7) for 3RSUR, 3RPNT is 49 and 15 hours per widget, respectively. The workload standards for other subjobs are under development.
Page 28
REFERENCES
1. “Ramp Meter Design Guidelines”, Caltrans, January 2000. 2. “Ramp Meter Development Plan”, Wahib Jreij & Mohamed Iqbal Toorawa, April
2004. 3. Amended “Ramp Metering Procedure Manual”, Rafael Benitez-Lopez, November
2005. 4. “Preliminary SWARM Study Report”, Hanh Pham, Caltrans District 07, November 2001. 5. “SWARM Study Final Report”, Hanh Pham, Caltrans District 07, October 2002. 6. “ATMS User’s Manual”, National Engineering Technology Corporation, June 2000. 7. “ATMS Traffic Engineer’s Manual”, National Engineering Technology Corporation, June
2000. 8. “Highway Capacity Manual”, Transportation Research Board, 2000. 9. “Traffic Manual”, Caltrans 10. “Highway Design Manual”, Caltrans 11. “Twin Cities Ramp Meter Evaluation”, Cambridge Systematics Inc., November 27 2001. 12. “Traffic Bulletin No. 4 - Notes on Freeway Capacity”, Karl Moskowitz and Leonard
Newman, July 1962. 13. “Traffic Bulletin No. 16 – Introduction to Capacity”, Leonard Newman, April 1969. 14. “Ramp Meter Operation Plan”, National Engineering Technology Corporation, December
2001. 15. “Basic Ramp Control”, M.K. Kim, Caltrans 16. Route 405 SWARM Study Summary, Wahib Jreij & Fady Al-Awar, Caltrans District 07,
January 2003.

Page 29
ATTACHMENTS
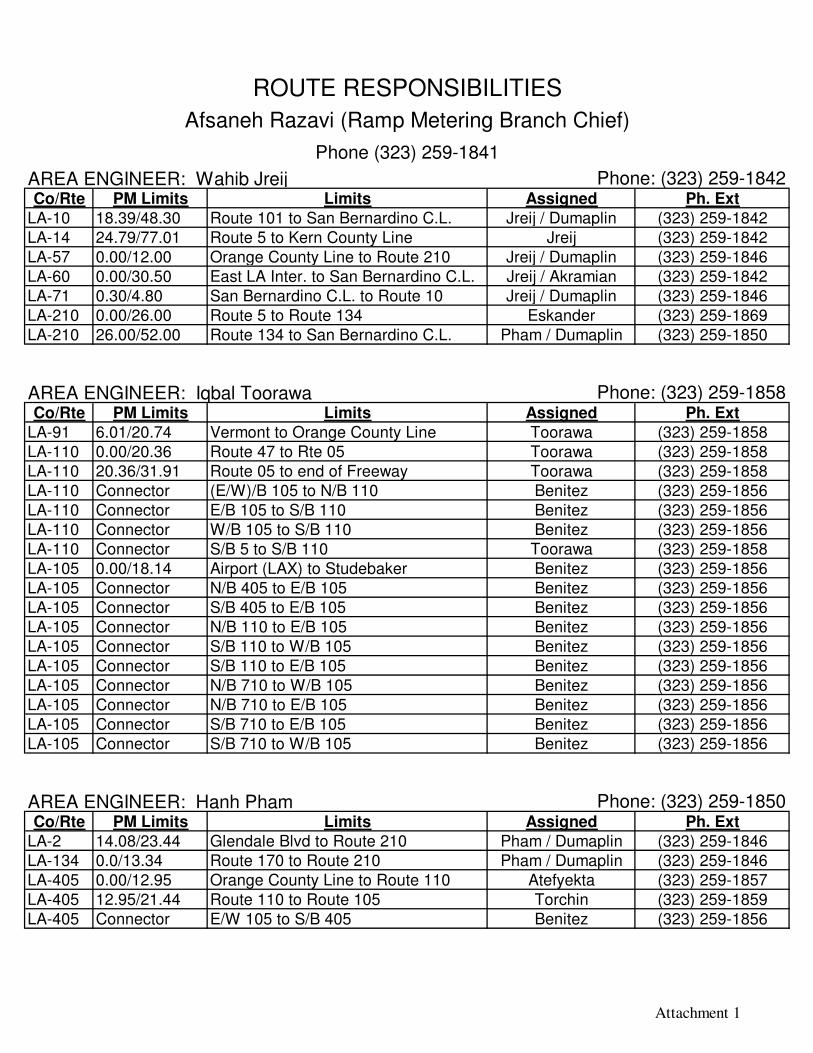
AREA ENGINEER: Wahib JreijCo/Rte PM Limits Limits Assigned Ph. Ext
LA-10 18.39/48.30 Route 101 to San Bernardino C.L. Jreij / Dumaplin (323) 259-1842LA-14 24.79/77.01 Route 5 to Kern County Line Jreij (323) 259-1842LA-57 0.00/12.00 Orange County Line to Route 210 Jreij / Dumaplin (323) 259-1846LA-60 0.00/30.50 East LA Inter. to San Bernardino C.L. Jreij / Akramian (323) 259-1842LA-71 0.30/4.80 San Bernardino C.L. to Route 10 Jreij / Dumaplin (323) 259-1846LA-210 0.00/26.00 Route 5 to Route 134 Eskander (323) 259-1869LA-210 26.00/52.00 Route 134 to San Bernardino C.L. Pham / Dumaplin (323) 259-1850
AREA ENGINEER: Iqbal ToorawaCo/Rte PM Limits Limits Assigned Ph. Ext
LA-91 6.01/20.74 Vermont to Orange County Line Toorawa (323) 259-1858LA-110 0.00/20.36 Route 47 to Rte 05 Toorawa (323) 259-1858LA-110 20.36/31.91 Route 05 to end of Freeway Toorawa (323) 259-1858LA-110 Connector (E/W)/B 105 to N/B 110 Benitez (323) 259-1856LA-110 Connector E/B 105 to S/B 110 Benitez (323) 259-1856LA-110 Connector W/B 105 to S/B 110 Benitez (323) 259-1856LA-110 Connector S/B 5 to S/B 110 Toorawa (323) 259-1858LA-105 0.00/18.14 Airport (LAX) to Studebaker Benitez (323) 259-1856LA-105 Connector N/B 405 to E/B 105 Benitez (323) 259-1856LA-105 Connector S/B 405 to E/B 105 Benitez (323) 259-1856LA-105 Connector N/B 110 to E/B 105 Benitez (323) 259-1856LA-105 Connector S/B 110 to W/B 105 Benitez (323) 259-1856LA-105 Connector S/B 110 to E/B 105 Benitez (323) 259-1856LA-105 Connector N/B 710 to W/B 105 Benitez (323) 259-1856LA-105 Connector N/B 710 to E/B 105 Benitez (323) 259-1856LA-105 Connector S/B 710 to E/B 105 Benitez (323) 259-1856LA-105 Connector S/B 710 to W/B 105 Benitez (323) 259-1856
AREA ENGINEER: Hanh PhamCo/Rte PM Limits Limits Assigned Ph. Ext
LA-2 14.08/23.44 Glendale Blvd to Route 210 Pham / Dumaplin (323) 259-1846LA-134 0.0/13.34 Route 170 to Route 210 Pham / Dumaplin (323) 259-1846LA-405 0.00/12.95 Orange County Line to Route 110 Atefyekta (323) 259-1857LA-405 12.95/21.44 Route 110 to Route 105 Torchin (323) 259-1859LA-405 Connector E/W 105 to S/B 405 Benitez (323) 259-1856
Phone: (323) 259-1858
Phone: (323) 259-1850
Phone (323) 259-1841
ROUTE RESPONSIBILITIES
Afsaneh Razavi (Ramp Metering Branch Chief)
Phone: (323) 259-1842
Attachment 1
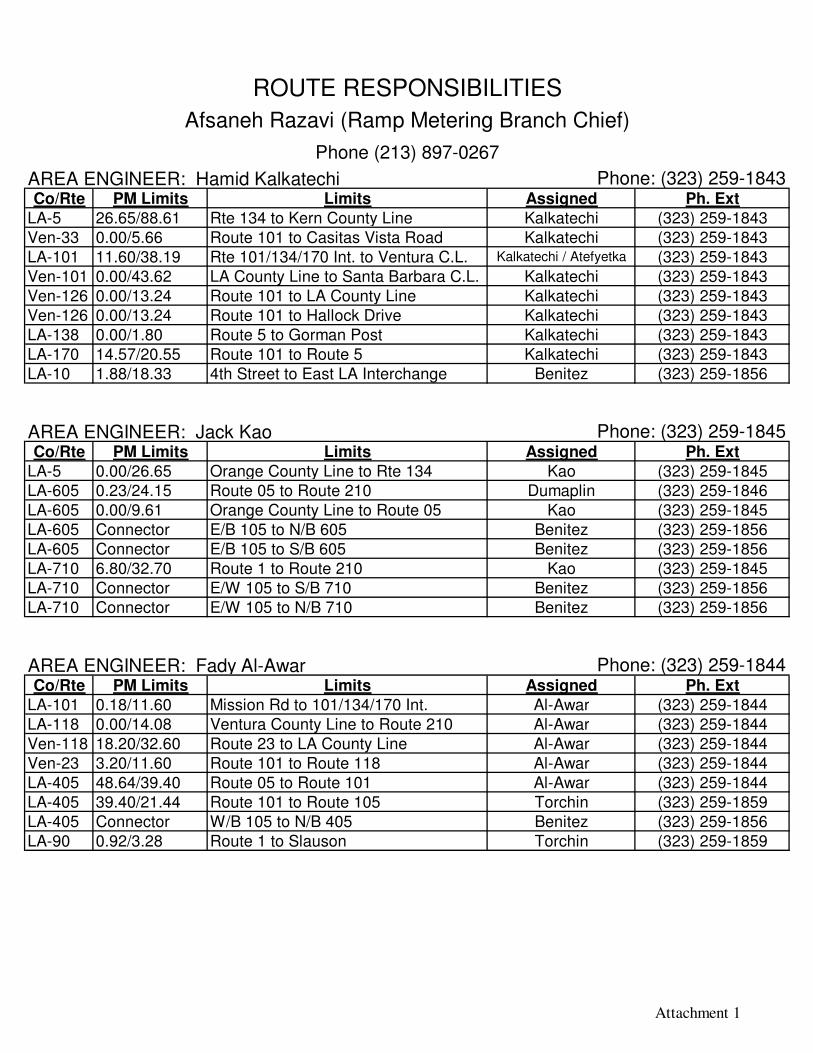
AREA ENGINEER: Hamid KalkatechiCo/Rte PM Limits Limits Assigned Ph. Ext
LA-5 26.65/88.61 Rte 134 to Kern County Line Kalkatechi (323) 259-1843Ven-33 0.00/5.66 Route 101 to Casitas Vista Road Kalkatechi (323) 259-1843LA-101 11.60/38.19 Rte 101/134/170 Int. to Ventura C.L. Kalkatechi / Atefyetka (323) 259-1843Ven-101 0.00/43.62 LA County Line to Santa Barbara C.L. Kalkatechi (323) 259-1843Ven-126 0.00/13.24 Route 101 to LA County Line Kalkatechi (323) 259-1843Ven-126 0.00/13.24 Route 101 to Hallock Drive Kalkatechi (323) 259-1843LA-138 0.00/1.80 Route 5 to Gorman Post Kalkatechi (323) 259-1843LA-170 14.57/20.55 Route 101 to Route 5 Kalkatechi (323) 259-1843LA-10 1.88/18.33 4th Street to East LA Interchange Benitez (323) 259-1856
AREA ENGINEER: Jack KaoCo/Rte PM Limits Limits Assigned Ph. Ext
LA-5 0.00/26.65 Orange County Line to Rte 134 Kao (323) 259-1845LA-605 0.23/24.15 Route 05 to Route 210 Dumaplin (323) 259-1846LA-605 0.00/9.61 Orange County Line to Route 05 Kao (323) 259-1845LA-605 Connector E/B 105 to N/B 605 Benitez (323) 259-1856LA-605 Connector E/B 105 to S/B 605 Benitez (323) 259-1856LA-710 6.80/32.70 Route 1 to Route 210 Kao (323) 259-1845LA-710 Connector E/W 105 to S/B 710 Benitez (323) 259-1856LA-710 Connector E/W 105 to N/B 710 Benitez (323) 259-1856
AREA ENGINEER: Fady Al-AwarCo/Rte PM Limits Limits Assigned Ph. Ext
LA-101 0.18/11.60 Mission Rd to 101/134/170 Int. Al-Awar (323) 259-1844LA-118 0.00/14.08 Ventura County Line to Route 210 Al-Awar (323) 259-1844Ven-118 18.20/32.60 Route 23 to LA County Line Al-Awar (323) 259-1844Ven-23 3.20/11.60 Route 101 to Route 118 Al-Awar (323) 259-1844LA-405 48.64/39.40 Route 05 to Route 101 Al-Awar (323) 259-1844LA-405 39.40/21.44 Route 101 to Route 105 Torchin (323) 259-1859LA-405 Connector W/B 105 to N/B 405 Benitez (323) 259-1856LA-90 0.92/3.28 Route 1 to Slauson Torchin (323) 259-1859
Phone: (323) 259-1845
Phone: (323) 259-1844
Phone: (323) 259-1843
Afsaneh Razavi (Ramp Metering Branch Chief)
Phone (213) 897-0267
ROUTE RESPONSIBILITIES
Attachment 1
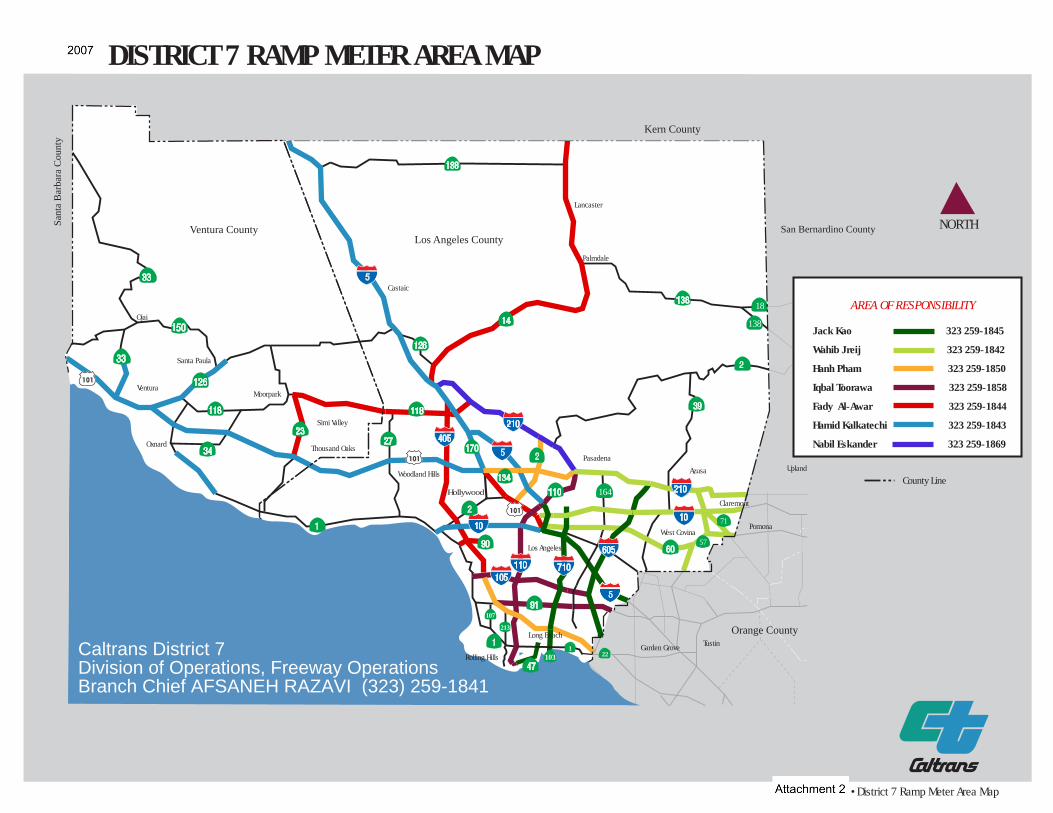
107
213
57
71
164
18
138
22
Ventura
Santa Paula
Simi Valley
Ojai
Oxnard
Woodland Hills
Thousand Oaks
Moorpark
Pasadena
Castaic
Palmdale
Lancaster
Los Angeles
Azusa
Claremont
West CovinaPomona
Upland
DISTRICT 7 RAMP METER AREA MAP
Ventura CountyLos Angeles County
Kern County
Hollywood
Rolling Hills
Long Beach
Garden Grove Tustin
NORTH
Kern County
Orange County
103
County Line
01/29/08 •District 7 Ramp Meter Area Map
Caltrans District 7Division of Operations, Freeway OperationsBranch Chief AFSANEH RAZAVI (323) 259-1841
1
San Bernardino County
Sant
a B
arba
ra C
ount
y
AREA OF RESPONSIBILITY
Jack Kao 323 259-1845
Wahib Jreij 323 259-1842
Hanh Pham 323 259-1850
Iqbal Toorawa 323 259-1858
Fady Al-Awar 323 259-1844
Hamid Kalkatechi 323 259-1843
Nabil Eskander 323 259-1869
Attachment 3
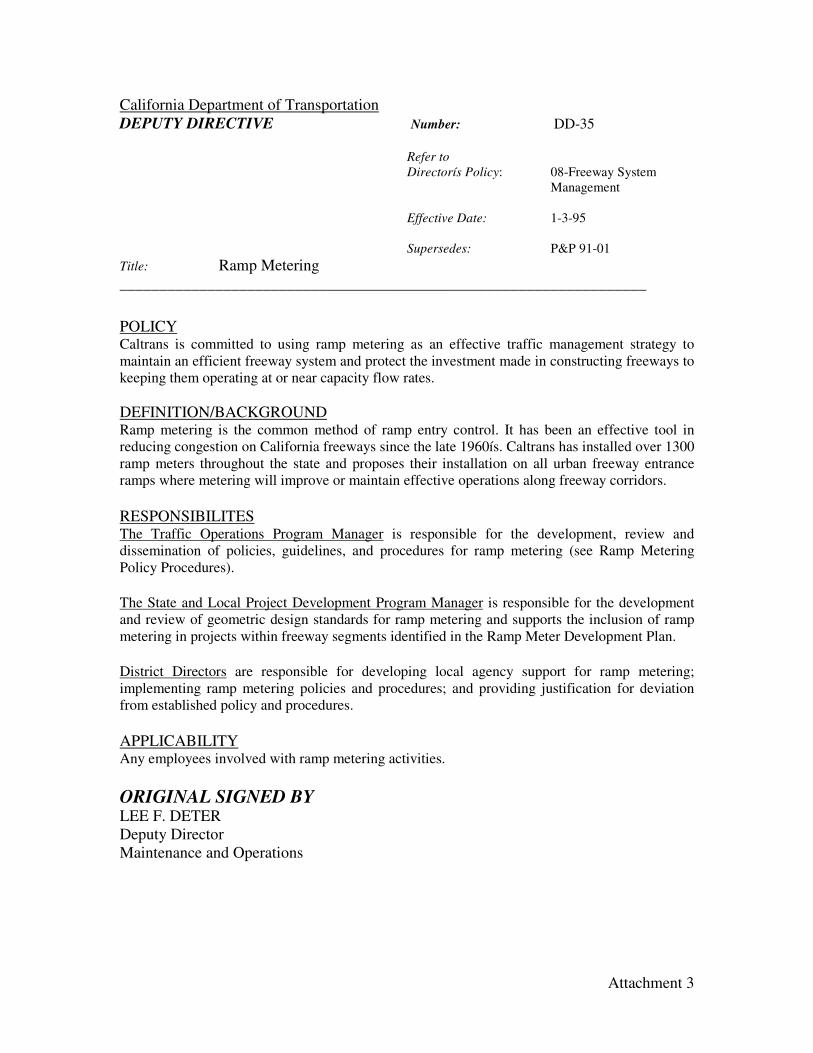
California Department of Transportation DEPUTY DIRECTIVE Number: DD-35
Refer to
Directorís Policy: 08-Freeway System Management
Effective Date: 1-3-95 Supersedes: P&P 91-01
Title: Ramp Metering __________________________________________________________________
POLICY Caltrans is committed to using ramp metering as an effective traffic management strategy to maintain an efficient freeway system and protect the investment made in constructing freeways to keeping them operating at or near capacity flow rates.
DEFINITION/BACKGROUND Ramp metering is the common method of ramp entry control. It has been an effective tool in reducing congestion on California freeways since the late 1960ís. Caltrans has installed over 1300 ramp meters throughout the state and proposes their installation on all urban freeway entrance ramps where metering will improve or maintain effective operations along freeway corridors.
RESPONSIBILITES The Traffic Operations Program Manager is responsible for the development, review and dissemination of policies, guidelines, and procedures for ramp metering (see Ramp Metering Policy Procedures).
The State and Local Project Development Program Manager is responsible for the development and review of geometric design standards for ramp metering and supports the inclusion of ramp metering in projects within freeway segments identified in the Ramp Meter Development Plan.
District Directors are responsible for developing local agency support for ramp metering; implementing ramp metering policies and procedures; and providing justification for deviation from established policy and procedures.
APPLICABILITY Any employees involved with ramp metering activities.
ORIGINAL SIGNED BY
LEE F. DETER Deputy Director Maintenance and Operations
Attachment 4
RAMP
METERING
POLICY
PROCEDURES State of California Business, Housing and Transportation Agency Department of Transportation Traffic Operations August 1997
Attachment 4
RAMP METERING POLICY PROCEDURES
I. PURPOSE The purpose of these procedures is to provide guidelines for implementing the Department’s ramp metering policy (DD-35). II. BACKGROUND Metering has proven to be an effective traffic operations tool to maximize the efficiency of a corridor. The primary objective of metering is to reduce congestion and the overall travel time of the total traffic stream - on both freeway and surface streets. Ramp metering reduces congestion by:
• Maintaining more consistent freeway throughput.
• Utilizing the capacity of the freeway corridor more efficiently.
• Providing incentives for increased use of carpools, vanpools, and public transit by including preferential lanes, which offer timesavings to High Occupancy Vehicles (HOV) at ramp meters.
Secondary benefits include the reduction of congestion-related accidents and air pollution. Ramp meters operate most effectively when upstream mainline traffic is controlled. This control can be accomplished by installing additional ramp meters, metering freeway to freeway connectors or mainline control. These procedures focus on the implementation of ramp metering systems through a coordinated effort involving Caltrans planners, designers, operations personnel, local agency staff, the California Highway Patrol (CHP), and the public. III. PROCEDURES A. It is the District’s responsibility to maintain an acceptable level of service on the
freeway system, to make the most effective use of each transportation corridor, and to protect the public’s investment in the system.
Each District that currently operates, or expects to operate, ramp meters within the next ten years shall prepare a Ramp Meter Development Plan (RMDP) identifying the freeway segments, including freeway to freeway connectors, that are expected to be metered within this period. The RMDP should also identify freeway segments where upstream mainline control is necessary to maintain effective overall freeway operations. The RMDP shall be updated biennially and be included in local Congestion Management Plans.
Attachment 4
B. Projects, which propose the modification of an existing interchange or the construction of a new interchange within the freeway segments identified in the RMDP, regardless of funding source, should include provisions for ramp meters. This applies to all projects that have an approved Project Study Report dated July 1991 or later (the date of the original Policy and Procedure). These provisions, as defined in the Ramp Meter Design Guidelines, should include right of way, geometric to accommodate vehicle storage and HOV bypass lanes, ramp meter equipment, and CHP enforcement areas. Projects which propose additional capacity within freeway segments identified in the RMDP shall include provisions for ramp meters and shall implement the ramp meters at all entrance ramps within the project limits. In freeway segments identified in the RMDP where mainline control is necessary to maintain effective overall freeway operation, additional freeway capacity should not be constructed without an analysis of the operational impacts to downstream segments. Districts are responsible for performing appropriate environmental studies for ramp metering projects.
C. The District will work in partnership with metropolitan planning organizations;
regional transportation planning agencies, and congestion management agencies to program ramp metering projects and develop implementation plans. Coordination and consultation should be documented and concurrence may be obtained in any form the District considers appropriate.
D. The Ramp Meter Design Guidelines prepared by the Division of Traffic Operations,
in cooperation with the Division of State and Local Project Development, and the CHP shall be used when designing ramp metering facilities. This document is a compilation of design information and operational practices used statewide.
E. HOV preferential lanes shall be considered wherever ramp meters are installed. The
need for HOV bypass lanes should be included in the Project Study Report, Project Information Report, Project Report, and Environmental Document. If an HOV preferential lane is not included in a proposal to ramp meter, the reasons should be addressed in the appropriate document.
The District is responsible for consulting with the CHP on project features, which affect enforcement activities such as HOV lane violations, enforcement pads, etc. Coordination and consultation should be documented.
F. When selecting the appropriate metering method for the HOV preferential lane, the
following criteria should be used:
Control: An analysis of HOV traffic volumes shall be made to determine the impact on mainline traffic flows. Where adverse impacts exist, consideration should include metering the HOV preferential lane and/or more restrictive metering of the SOV lane(s). Consideration should be given to metering the HOV preferential lane if platoons from local signalized intersections adversely affect

Attachment 4
the operation of the freeway. Storage capacity and effects to local arterials should also be addressed.
Merge Conditions: Prior to entering the freeway, all vehicles on the on-ramp should be provided with adequate space to safely merge with each other. The safest merge condition is when the speeds of the merging vehicles are identical. When the speed differentials between HOVs and SOVs are excessive, consideration should be given to metering the HOV lane. All ramps should be designed in accordance with the Ramp Meter Design Guidelines, which detail adequate merging distances.
Enforcement: The ability to safely enforce occupancy violations of HOV lanes is essential. The CHP should be consulted for their recommendation of enforcement operations at each HOV preferential lane location.
Corridor Operations: In corridors where ramp meters are already operational, the existing metering method may be used as criteria for additional installations in the same corridor. Should alternate metering methods be proposed along a corridor, local agencies should be consulted.
The criteria listed above can be applied to new and existing ramp meter installations. If it is being applied to an existing ramp meter, the following criteria should also be used:
Accident History: The accident history of the ramp needs to be investigated. If either the ramp or any portion of the freeway within 500 feet of the ramp gore has been flagged as a high accident concentration location (Table C), each accident report should be reviewed in detail to determine whether or not the HOV operation during the metered period was a contributing factor. If evidence suggests that it could have been a contributing factor to the accident, consideration should be given to metering the HOV preferential lane.
G. Districts shall provide justification for deviation from the policy and these procedures and concurrence shall be obtained from the Headquarters Traffic Operations District Liaison. Deviations from design standards require the approval of the Project Development Coordinator in the Office of Project Planning and Design.
H. The Division of Traffic Operations provides District personnel with technical
assistance and support on the design and operation of ramp meter systems and assists in the preparation of the District’s RMDP.

Attachment 5
CONTENTS OF EXCEPTION TO RAMP METERING POLICY FACT SHEET PROJECT DESCRIPTION Briefly describe the project. Note the type of project and/or major elements of work to be done.
RAMP METERING POLICY NON-COMPLIANCE FEATURES Describe the proposed or existing ramp metering policy non-compliance feature(s). (Note: Deviations from advisory or mandatory design standards shall be addressed as required by the Project Development Procedures Manual, the Highway Design Manual and applicable District Directives.) Design exceptions to standards to be attached to Ramp Meter Policy Fact Sheet.
REASON FOR THE EXCEPTION Be thorough but brief. Supportive factors may include right-of-way or space constraints, environmental concerns, inordinate costs, etc. Show an estimate of the added cost above the proposed project cost that would be required to conform to the ramp metering policy for which exception is being documented. The estimate does not have to be highly developed but must be realistic.
FUTURE CONSTRUCTION Describe any planned future projects in the immediate vicinity of the requested ramp meter exception, but do not make any commitments (e.g., ramp metering as part of future projects) unless there is a certainty that they can be followed through.
PROPOSED EXCEPTION REVIEWS AND CONCURRENCE Note reviews by HQ Traffic Operations, the District Liaison and District Office of Traffic Systems. Give dates of reviews and discuss any comments that were made and their disposition.
REMARKS Note clarifying remarks. Discuss impacts on project delivery schedule and project costs, if any. Discuss impacts of ramp metering policy non-compliance features.
ATTACHMENTS Provide a locations map and/or vicinity map for the project, indicating the location of the requested exception(s) to the ramp metering policy. Also provide cross-sections and/or special details as necessary to illustrate the policy non-compliance condition. Letters, resolutions, traffic studies, etc., which help to clarify the reasons for the exception request, may be attached.
SIGNATURE SHEET The Fact Sheet signature page shall conform to the attached.

Attachment 5
Dist-Co-Rte-KP Source Unit – EA Project Cost FACT SHEET
EXCEPTION TO
RAMP METERING POLICY (Insert Registered C.E. Seal) Prepared by: _______________________ ____________ ___________________ (Name), Registered C.E. Date Telephone Approval recommended by: _______________________ ____________ __________________ (Name), Project Manager Date Telephone Concurrence by: _______________________ ____________ __________________ (Name), District Liaison Date Telephone HQ Traffic Operations Approved by: _______________________ ____________ (Name), District Division Chief, Date Operations
Attachment 6
State of California Business, Housing and Transportation Agency
M e m o r a n d u m
To: DISTRICT DIVISION CHIEFS – Operations Date: July 31, 2000 DISTRICT DIVISION CHIEFS – Design DISTRICT DIVISION CHIEFS – Planning File:
From: DEPARTMENT OF TRANSPORTATION
Traffic Operations
Mail Station 36
Subject: Ramp Metering Policy on High Occupancy Vehicle (HOV) Preferential Lanes The purpose of this memorandum is to clarify and re-affirm the California Department of Transportation (Caltrans) policy on HOV preferential lanes at ramp meter locations. Caltrans is committed to its current policy: An HOV preferential lane shall be provided at all ramp
meter locations.
The January 2000 edition of the Ramp Meter Design Manual now addresses the circumstances under which exceptions to this policy may be warranted. See ‘Modifications to Existing HOV Preferential Lanes’ located in Section ‘I’ of Chapter One:
• Underutilization of an existing lane plus the need for additional right-of-way for storage
• The availability of an alternate HOV entrance ramp within 2 Km
• The availability of a direct HOV access (drop) ramp
Exceptions shall be handled on a location-by-location basis. Conversions may require Federal Highway Administration actions or concurrence. The District Division Chief for Operations, in consultation with the Headquarters Traffic Operations Liaison, is responsible for approving and documenting decisions to remove HOV preferential lanes. These policies and exceptions also apply to new and reconstruction projects. Districts should refer to the “Exception to Ramp Metering Policy” located in the Appendix of the Ramp Meter Design Manual or contact your Headquarters Traffic Operations Liaison for assistance. Original Signed By KIM NYSTROM Program Manager Traffic Operations cc: Mr. Robert Buckley Program Manager Design and Local Programs Ms. Joan Sollenberger Program Manager Transportation Planning
Page 1 Attachment 7
Division of Traffic Operations
Office of System Management Operations
EA 936501
Sub Job: 3RACT
ACTIVATION OF NEW, INACTIVE OR REPLACED RAMP METERS
DESCRIPTION: This work segment captures production and timesheet charges for activating new ramp metering field elements when a capital outlay support EA is NOT available.
TYPICAL TASKS (District):
• Public awareness
• Notification of the California Highway Patrol (CHP) and request support, if necessary
• Notification of the affected local agencies and request support, if necessary
• Notification of the Caltrans Headquarters Division of Traffic Operations and Division of Maintenance
• Field walk-through before turn-on
• Activation of ramp meters
• Fine tuning of field elements and metering rates, if necessary
• Conduct before and after studies
• Ramp metering operations support during construction
• Coordinate with TMC support, electrical maintenance, and construction prior to activation
• Negotiate inter-agency protocols and agreements
• Respond to inquiries (internal and external)
• Participate in specification development and procurement process TYPICAL TASKS (Headquarters):
• None.
TASKS NOT INCLUDED:
• Activation of new, inactive or replaced ramp meters for Encroachment Permit, Capital Outlay Project, or Maintenance (use EA XXXXXX – XXXXXX and Sub Job XXXXX or WBS XXXXX or Family Code respectively)
• Surveillance and adjustment of existing ramp meters (use EA 936501, Sub Job 3RSUR)
• Data collection and analysis related to Operational Investigations (use EA XXXXXX, Sub Job 3OPIN)
• Project development activities, including construction of new signals (use COS Project EA with appropriate WBS activity code)
• Travel time to complete activation (use Travel EA 936603 and Sub Job 3RACT)
• Surveillance and adjustment of traffic signals other than ramp meters (use EA XXXXX, Sub Job XXXXX – XXXXX)
PRODUCTION STANDARDS:
Production Unit:
• Number of ramp meters activated Workload Standard:
• 40 hours per activation Performance Measure:
• TBD
PREVIOUS EA: 936501 Ramp Metering, Sub Job 3RAMP
NOTES: None.
DATE MODIFIED: 1-31-2008
Page 2 Attachment 7
Division of Traffic Operations
Office of System Management Operations
EA 936501
Sub Job: 3RSUR
SURVEILLANCE AND ADJUSTMENT OF EXISTING RAMP METERS DESCRIPTION: This work segment captures production and time sheet charges for the surveillance and adjustment of existing ramp metering office and field elements.
TYPICAL TASKS (District):
• CONDUCT FIELD/OFFICE ELEMENT SURVEILLANCE o Monitor ramp meter functionality in the field o Monitor ramp meter functionality through a central system in the office o Review and adjust corridor ramp metering hours (am, pm, or all day for both weekdays and
weekends). o Inspect firmware (SATMS/SDRMS/TOS) and hardware in the field. o Report hardware or communication problems to appropriate functional units such as TMC
support, electrical maintenance and TMS support. o Investigate and respond to inquiries/complaints o Respond to inquiries (internal and external) o Respond to legal claims inquiries
• COLLECT TRAFFIC DATA o Occupancy counts o Queue and demand o ramp geometry o ramp volumes o Mainline volumes o Turning movements at the ramp termini o meter violation rates o HOV (Bypass) counts o HOV (Bypass) Violation rates o Maintain and update log of surveillance results
• ANALYZE TRAFFIC DATA o Analyze traffic data o HOV (Bypass) analysis o Corridor analysis o Analyze violation rates o Develop recommendations and implementation plans o Conduct before and after studies
• ADJUST FIELD ELEMENTS o Adjust ramp meter equipment such as detector settings. o Adjust metering parameters (rate, traffic responsive thresholds, holiday timing plans,etc.) o Maintain log of ramp metering changes (including meter timing) o Efforts and coordination with maint. and other internal/external offices To restore the knock-
downs
• SUPPORT OPERATIONAL IMPROVEMENT o Obtain data from ATMS, RMIS or other sources o Develop ramp meter operational study for each freeway o Develop plans for operational improvement o Generate the improvement report o Implement and evaluate the improvement
• CONDUCT YEARLY INVENTORY o Conduct inventory of each RMS and VDS/TMS o Report findings to TMC support and/or electrical maintenance, Headquarters
Page 3 Attachment 7
TYPICAL TASKS (Headquarters):
• None.
TASKS NOT INCLUDED:
• Activation of new, inactive or replaced ramp meters (use EA 936501, Sub Job 3RACT)
• Data collection and analysis related to Operational Investigations (use EA XXXXXX, Sub Job 3OPIN)
• Project development activities, including developing metering plans for new metered systems (use COS Project EA with appropriate WBS activity code)
• Travel time to conduct the surveillance and adjustment (use travel EA 936603 Sub Job 3RSUR)
• Surveillance or adjustment of signals other than ramp meters (use EA XXXXX, Sub Job XXXXX – XXXXX)
PRODUCTION STANDARDS:
Production Unit:
• Number of production units adjusting/reviewing ramp meters Workload Standard:
• 49 hours per production unit Performance Measure:
• TBD
PREVIOUS EA: 936501 Ramp Metering, Sub Job 3RAMP
NOTES: None.
DATE MODIFIED: 1-31-2008
Page 4 Attachment 7
Division of Traffic Operations
Office of System Management Operations
EA 936501
Sub Job: 3RPNT
SYSTEM PLANNING AND IMPLEMENTATION OF NEW
TECHNOLOGIES
DESCRIPTION: This work segment captures production and timesheet charges for support of corridor- or system-level ramp metering system planning and new technology implementation support effort, such as simulation and algorithm and field element testing.
TYPICAL TASKS (District):
• Corridor- or system-level intelligent ramp metering strategy studies
• Street traffic signal and ramp metering operation coordination studies
• Testing of new ramp metering algorithms and new field elements
• Provide support for District System Management Plan (DSMP) o Provide congestion/Delay data o Provide field element inventory data o Coordination with planning/local agencies/externals o Develop system-wide strategies in coordination with Planning (and other Caltrans Districts/Divisions)
• Consultant service oversight
• Update Ramp Metering Development Plan
• Ramp meter annual report
• Prepare and monitor budget, resource allocations and expenditures
• Develop and monitor workload standards, performance indicators, and outcomes
• Develop and or participate in training
• Participate in statewide meetings
• Other studies TYPICAL TASKS (Headquarters):
• Coordinate statewide activities
• Review workload data
• Report statewide activities
TASKS NOT INCLUDED:
• Activation of new, inactive or replaced ramp meters, supported by either COS EA or EA 936501 3RACT
• Surveillance and adjustment of ramp meters (use EA 936501, Sub Job 3RSUR)
• The Congestion Monitoring Component of the DSMP (use EA XXXXXX, Sub Job XXXXX)
• Data collection and analysis related to Operational Investigations (use EA XXXXXX, Sub Job XXXXX)
• Project development activities, including construction of new ramp meters (use COS Project EA with appropriate WBS activity code)
• Travel time to complete planning and implementation of new technologies (use Travel EA 936603 and Sub Job 3RPNT)
• Surveillance or adjustment of signals (use EA XXXXX, Sub Job XXXXX)
PRODUCTION STANDARDS: Production Unit:
• Number of production units implementing new technologies Workload Standard:
Page 5 Attachment 7
• 15 hours per production unit Performance Measure:
• TBD
PREVIOUS EA: 936501 Ramp Metering, Sub Job 3RAMP
NOTES: None.
DATE MODIFIED: 1-31-2008
Page 6 Attachment 7
Division of Traffic Operations
Office of ITS
EA 936602
Sub Job: 3RFAS
RAMP METER FIRMWARE AND CENTRAL APPLICATION
SUPPORT
DESCRIPTION: This work segment captures production and time sheet charges for the ramp metering firmware and application support effort, such as the ramp metering firmware and central system control, monitoring, testing, calibrating, maintaining and upgrading.
TYPICAL TASKS:
Central Application Support • Diagnose, troubleshoot, configure, optimize and maintain system.
• Provide System and Database Administration.
• Develop and maintain system documentation for future expansion, system integration and support.
• Specify, procure and coordinate equipment upgrades.
• Contract Management for hardware and software support.
• Data validation, archiving, performance testing and report generation.
• Develop and support Configuration Management plan.
• Develop operational instructions and provide training for TMC operators and support staff.
• Sustaining Engineering.
• Support MPOs, HQ and other districts.
• Develop and document system design.
• Prepare and update Policies and Guidelines
• Maintain a Statewide Inventory.
• Regional and National ITS Architecture support.
• Standardize and Develop system specifications.
• Participate in statewide system planning activities and develop/maintain a district plan.
• Coordinate with HQ-IT and other Caltrans' Divisions
Firmware Support • Maintain and support process control firmware applications
• Add new features and updates.
• Test and troubleshoot new features.
• Coordinate statewide testing and implementation.
• Develop and provide training workshops and classes.
• Investigate new technologies and coordinate technology upgrades.
• Coordinate with other districts/HQ traffic operations
TASKS NOT INCLUDED:
• All activities captured by EA 936501 subjob 3RACT, 3RSUR, and 3RPNT
• Travel time to conduct firmware and central application support (use travel EA 936603 subjob 3RFAS)
• All activities captured by any EA other than ramp metering support
PRODUCTION STANDARDS:
Output: Production Unit:
• Ramp metering firmware and central system support.
Page 7 Attachment 7
Workload Standard:
• 2 PY a year Performance Measure:
• TBD
PREVIOUS EA: 936501 Ramp Metering, Sub Job 3RAMP
NOTES: None.
DATE MODIFIED: 1-31-2008

Page 8 Attachment 7
Division of Traffic Operations
Office of System Management Operations
EA 936603
Sub Job: 3RAMP
TRAVEL FOR RAMP METERING ACTIVITIES
DESCRIPTION: This work segment captures time sheet charges for travel to and from the field related to ramp metering activities such as ramp meter activation, surveillance and new technology implementation. Any travel time that is longer than 15 minutes should be captured. Travel time hopping between work activities shall be captured as work time instead of travel time, unless it is longer than 15 minutes.
TYPICAL TASKS:
• Travel from origin (District Office) to the closest field site and back
TASKS NOT INCLUDED:
• Time to conduct ramp metering activities which should be charged to EA 936501 other than the traveling.
PRODUCTION STANDARDS: Production Unit:
• Travel required to and from field site to perform ramp metering activities. Workload Standard:
• Total annual travel hours Performance Measure:
• TBD
PREVIOUS EA: 936501 Ramp Metering, Sub Job 3RAMP
NOTES: None.
DATE MODIFIED: 1-31-2008

Page 9 Attachment 7
Division of Traffic Operations
Office of System Management Operations
EA 936603
SUBJOB: 3TMSU
TRAVEL
DESCRIPTION: This work segment captures time sheet charges for travel to and from the field related to ramp meter firmware and central application support.
TYPICAL TASKS:
• Travel from origin (District Office) to the closest field site and back
TASKS NOT INCLUDED:
• Time to conduct ramp metering activities which should be charged to EA 936501 other than the traveling.
PRODUCTION STANDARDS: Production Unit:
• Travel required to and from field site to perform ramp metering activities. Workload Standard:
• Total annual travel hours Performance Measure:
• TBD
PREVIOUS EA: 936501 Ramp Metering, Sub Job 3RAMP
NOTES: None.
DATE MODIFIED: 1-31-2008

Page 10 Attachment 7
EA 936501
RAMP METERING
Sub Job: 3RAMP (revised 3/4/2003)
DESCRIPTION:
This work segment captures production and time sheet charges for the ramp-metering program.
TYPICAL TASKS:
� Activating New Ramp Meter which includes: Public Awareness Negotiation with locals and/or Law enforcement agencies Corridor data collection, monitoring, evaluation, adjustment and documentation
� Monitoring, evaluating, adjusting and documenting operation of existing ramp metering systems and operating systems.
� Operational Improvement � Conduct Yearly inventory � Developing and maintaining Ramp Meter Development Plan. � Diagnosing and troubleshooting /reporting electrical problems related to ramp metering systems � Participate in Development of District System Management Plan:
Coordination with external agencies Develop system-wide strategies in coordination with planning and other Caltrans Districts/Divisions Data Collection and Analysis
� Data collection, analysis, and negotiation with local agencies related to corridor ramp metering plans � Respond to inquiries from elected officials, external/internal agencies and the public
TASKS NOT INCLUDED:
� Project development activities, including developing metering plans for new meter systems, preparation of PSRs, PSSRs, PRs, and PS&E for specific projects (use COS Project EA, with appropriate WBS activity code).
� Construction of ramp meters (use COS Project EA, with appropriate WBS activity code). � Maintenance of ramp meters (Maintenance).
WORKLOAD STANDARDS:
Production Units = Number of ramp meter locations inspected. Workload Standard = 50 hours per ramp meter/ramp meter location reviewed and /or adjusted. Performance Indicator = Travel time, Travel time reliability, number of incidents
Sub job Descriptions:
� 3RAMP - All above mentioned and otherwise routine Ramp Metering activities including all training, travel and administrative activities directly related to Ramp Metering.
PREVIOUS EXPENDITURE AUTHORIZATIONS:
936203 Work Segment OP11 Ramp Metering
NOTES: (1) Software/Hardware development charges for this activity should include Special Designation “6SOFTWARE”.