2007 - peelmining.com.au · the intercept of 75m at 1.02 g/t gold, 0.87% copper, 0.09% molybdenum,...
TRANSCRIPT

2007
www.peelex.com.au
peel exploration limited ABN 42 119 343 734
telephone (08) 9382 3955 level 1, 79 hay street, subiaco, western australia 6008 Annual Report 2009
PEEL ANNUAL09 COVER.indd 1 21/10/09 11:44:43 AM
Corporate Directory
Peel exPloration limited AnnuAl RepoRt 2009
DirectorsSimon Hadfield – Chairman
Robert Tyson – Managing Director
Craig McGown – Non-Executive Director
Company SecretaryDavid Hocking
Registered and Principal OfficeLevel 1, 79 Hay St, Subiaco, WA 6008
Telephone: +61 8 9382 3955
Facsimile: +61 8 9388 1025
Solicitors to the CompanySteinepreis Paganin
Lawyers and Consultants
Level 4, Next Building
16 Milligan St, Perth, WA 6000
Share RegistryComputershare investor Services
Level 2, 45 St Georges Tce, Perth, WA 6000
Telephone: +61 8 9323 2000
Facsimile: +61 8 9323 2033
AuditorsBdo Kendalls audit & assurance (Wa) Pty ltd
128 Hay St, Subiaco, WA 6008
Home ExchangeASX Code: PEX
ABN42 119 343 734
Websitewww.peelex.com.au
PEEL ANNUAL09 COVER.indd 2 21/10/09 11:44:43 AM

1Peel exPloration limited AnnuAl RepoRt 2009
ContentsSECTION 1 Chairman’s Report 3
SECTION 2 Review of Operations 4
SECTION 3 Schedule of Tenements 12
SECTION 4 Directors’ Report 13
SECTION 5 Income Statement 21
SECTION 6 Balance Sheet 22
SECTION 7 Statement of Changes in Equity 23
SECTION 8 Statement of Cash Flows 24
SECTION 9 Notes to the Accounts 25
SECTION 10 Directors’ Declaration 41
SECTION 11 Auditor’s Independence Declaration 42
SECTION 12 Independent Auditor’s Report 43
SECTION 13 Corporate Governance Statement 45
SECTION 14 Shareholder Information 48
Cover photo – attunga tungsten deposit
PEEL ANNUAL09.indd 1 21/10/09 11:40:44 AM
2 Peel exPloration limited AnnuAl RepoRt 20092 Peel exPloration limited AnnuAl RepoRt 2008
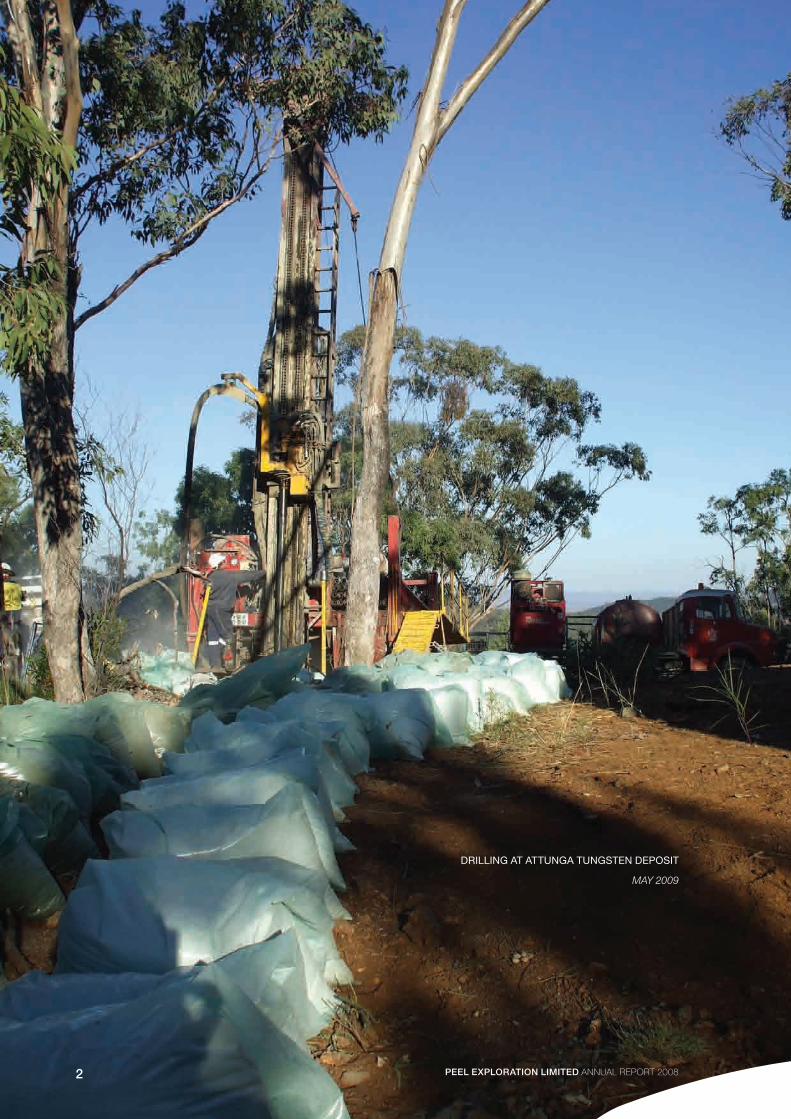
drilling at attunga tungsten deposit
May 2009
PEEL ANNUAL09.indd 2 21/10/09 11:40:51 AM

Chairman’s Report
SeCtion 1
3Peel exPloration limited AnnuAl RepoRt 2008
Dear Fellow Shareholders,
The global financial crisis over the past year has created an extremely challenging environment for investors and
the resources sector in general. Peel Exploration Limited is fortunate in having a strong core project at our Attunga
Tungsten Deposit, in northern New South Wales.
During the year ended of 30 June 2009 your Company has made excellent progress advancing the Attunga
Tungsten Deposit, identifying a potentially relatively simple process route for the recovery of scheelite concentrate
from ore. Late in the financial year, additional high-grade tungsten intercepts were returned from drilling offering
further encouragement regarding the exploration potential at Attunga.
Your Company was also buoyed by the significant discovery of copper-gold mineralisation at the nearby Attunga
Copper Mine. The intercept of 75m at 1.02 g/t gold, 0.87% copper, 0.09% molybdenum, 0.06% bismuth and 22 g/t
silver from 136m is extremely encouraging for the longer term prospectivity at Attunga.
Elsewhere, Peel has remained vigilant to exploration opportunities and most recently has conditionally agreed
to acquire the historic May Day gold-base metal deposit near Cobar. May Day has significant gold-base metal
mineralisation immediately below a shallow, historic open pit. Peel believes that May Day offers a potentially rapid
path to production and cash flow, benefiting from its situation on a granted mining lease located in one of Australia’s
major mining districts.
Whilst it is too early to say that the world is entering a phase of recovery and growth, it is clear that companies with
strong projects in advanced stages of exploration will be in the best position to benefit from improving economic
circumstances. Peel is positioning itself in anticipation of better times.
I would like to thank my fellow directors Rob Tyson and Craig McGown and Company Secretary David Hocking for
their contribution over the past 12 months. I would also like to thank Michael Oates and Steve Leggett who have
helped to manage our exploration programmes.
Finally I would like to thank our shareholders for their continued support.
Yours sincerely
Simon Hadfield
CHAIRMAN
30th September 2009
PEEL ANNUAL09.indd 3 21/10/09 11:40:56 AM

4 Peel exPloration limited AnnuAl RepoRt 2009
Review of operations
Background
Peel Exploration Limited is focused on precious, base and specialty metals exploration predominantly in the New
England region of New South Wales, Australia. Since listing in May 2007, Peel has identified and acquired several
valuable mineral projects in New South Wales, close to excellent infrastructure.
At September 2009, Peel Exploration held five separate mineral projects covering approximately 470 km2 of granted
exploration licences, all located in New South Wales, Australia. The most advanced of these projects and the focus
of the Company is the Attunga Project, located approximately 20 kms north of Tamworth.
• EL6883 & EL6884 – Attunga contains numerous historic gold, tungsten, molybdenum and copper mines/
workings/prospects. Peelex has recently outlined a high-grade tungsten-molybdenum resource at the Attunga
Tungsten Deposit (1.29 Mt at 0.61% WO3 and 0.05% Mo), and also identified extensive gold mineralisation at the
Kensington gold-tungsten prospect.
• EL6613 – Dungowan contains numerous historic copper mines/workings. High-grade copper mineralisation
has been reported from Fishers copper mine, with 2,643t of ore produced at an average grade of 13.4% copper
while at nearby Trough Gully copper mine, the lode finished in massive sulphide mineralisation.
• EL6722 – Armidale contains several historic silver mines along with numerous gold, antimony, tungsten and
molybdenum workings.
• EL7272 – Mt Tennyson East contains the historic Kirk and Wades (Mt Tennyson East) molybdenum-tungsten
prospect. Initial literature searches indicate that tungsten-molybdenum mineralisation at Mt Tennyson East
possibly represents an extension to the current Mt Tennyson molybdenum resource.
• EL7356 – Yerranderie contains the historic Yerranderie silver field area. Literature searches indicate that
substantial amounts of silver-lead-gold mineralisation remain present in surface waste and tailings dumps at
Yerranderie. Peel plans to investigate the potential to retreat and remediate the Yerranderie environs.
SeCtion 2
PEEL ANNUAL09.indd 4 21/10/09 11:40:56 AM

5Peel exPloration limited AnnuAl RepoRt 2009
Review of operationsSeCtion 2
peel exploration projeCt loCations
Details on Assets
EL6883 and EL6884 – the Attunga project – are located about 20 km north of Tamworth (pop ~42,000), or about
330 km north of Sydney, New South Wales. The licences cover a combined area of about 250 km2 and were
granted in September 2007.
Within the Attunga project, there are three specific areas of interest: the Attunga Tungsten Deposit area; the Attunga
Copper Mine prospect and the Kensington gold-tungsten prospect. The Attunga Project area is considered
prospective for tungsten-molybdenum skarn-type mineralisation, base/precious metal skarn-type mineralisation,
and gold (+/-tungsten) intrusive-related gold system type mineralisation.
Attunga Tungsten Deposit (aka Attunga Scheelite Deposit, Attunga Prospect 1)
In 1968, the Attunga Mining Corporation Pty Ltd (subsequently taken over by Endurance Mining Corporation)
discovered the Attunga Tungsten Deposit. Geopeko Ltd subsequently entered into an option agreement and
undertook an intensive, but confined diamond drilling program. In total 25 diamond drillholes for 4,236m to a
maximum depth of about 290m were drilled, establishing a small high-grade tungsten resource. Subsequent
explorers considered that a larger resource of lower grade material was present. Minimal further exploration was
completed at the Attunga Tungsten Deposit in the ensuing years.
The Attunga Tungsten Deposit can be classified as a skarn deposit formed by the intrusion of the Inlet Monzonite
into sedimentary rocks of the Middle Devonian Tamworth Group. Tungsten and molybdenum mineralisation occur
as fine disseminations and veinlets of scheelite, powellite and molybdenite; primarily within skarn, monzonite and a
fine-grained contact rock that Geopeko termed “scheelite rock”. Minor mineralisation also occurs in hornfels,
calc-silicate hornfels and marble.
PEEL ANNUAL09.indd 5 21/10/09 11:40:58 AM

6 Peel exPloration limited AnnuAl RepoRt 2009
Review of operationsSeCtion 2
In September 2007, Peel commissioned Geos Mining Mineral Consultants to complete an independent JORC-
compliant resource estimation on the Attunga Tungsten Deposit based on available data. Importantly, all historic
drilling relevant to the deposit was still available, with drillcore from 1968-69 held in storage at the New South
Wales Department of Primary Industries (NSW DPI) Londonderry drillcore library, and cuttings from 2006 RC
drillhole ATRC-04 stored on site at the Attunga Tungsten Deposit. Historic exploration reports relevant to the
Attunga Tungsten Deposit were recovered from the NSW DPI’s interactive database for exploration and geoscience
information (DIGS).
In October 2007, during Peel’s programme of relogging and assaying/reassaying historic drillcore, previously
unrecognised high-grade tungsten-molybdenum mineralisation was identified with an interval of 2.44m at 4.3%
WO3 and 0.23% Mo from 89.97m downhole returned from historic drillhole AP1-23. Further previously unrecognised
high-grade tungsten-molybdenum mineralisation was identified in early 2008 when RC drillhole ATRC-04 (drilled
in mid-2006) was re-sampled and assayed utilising XRF methodology. An intersection of 12m at 0.65% WO3 and
0.07% Mo from 84m downhole was returned.
In April 2008, Peel announced completion of an independent JORC-compliant resource estimation for the Attunga Tungsten
Deposit by Geos Mining. A high-grade tungsten-molybdenum inferred resource was defined with results including 1.29
Mt at 0.61% WO3 and 0.05% Mo for 9,400t contained WO3 equivalent using a 0.2% WO3 equivalent cutoff.
In July 2008, Peel completed two RC drillholes (ATP1-D & ATP1-G) as partial fulfillment of an extensional and infill drilling
programme designed by Geos Mining. Peel’s primary aim was to gain sufficient material to commence early warning
metallurgical testwork and drillhole ATP1-D was designed by Geos Mining for this purpose.
In August 2008, Peel announced high-grade assay results from drillhole ATP1-D with an intersection of 42m at
2.09% WO3 and 0.17% Mo from 21m downhole including a very high grade interval of 2m at 24.21% WO3 and
1.71% Mo from 22m downhole. Drillhole ATP1-G returned an intersection of 10m at 0.27% WO3 and 0.04% Mo
from 39m downhole. Also in August 2008, Peel engaged NAGROM, metallurgical consultants, to complete Phase 1
metallurgical testwork.
During the March quarter 2009, Phase 1 metallurgical testwork results were finalised with high grade WO3
concentrate products derived along with a potential process flowsheet. The key outcomes from the work done are:
• ScheelitegrainsizeatAttungaispredominantlygreaterthan0.1mm(100micron).
• Grindsizefractionof+75to-125micronyielded80%recoveryofWO3to16%oforiginalcircuitmassvia
conventional gravity (spirals) primary concentration.
• Magneticpropertiesofganguematerial(garnet)offersadditionalsimpleprimaryconcentrationroute.Thegrind
size fraction +75 to -125 micron gravity (spirals) concentrates were successfully upgraded via magnetic rollers to
a 47% WO3 grade concentrate with 79% overall recovery of WO3.
• Flotationtestworkontailsandfines(-75micron),andcleanerwork/oredressingofspiralconcentrate/magnetic
separation products yielded positive upgrade and recovery of WO3 content.
PEEL ANNUAL09.indd 6 21/10/09 11:40:58 AM

7Peel exPloration limited AnnuAl RepoRt 2009
• Molybdenumispredominantlyheldchemicallyinscheelite,aspowellitesolidsolution.Cursoryleachworkoffine
ground concentrate product has shown potential for the separation of WO3 and molybdenum.
Metalurgical testwork completed to date was derived from RC drill cuttings which are not considered optimum for
metallurgical work. Notwithstanding this fact, Peel is very encouraged by the results of Phase 1 testwork.
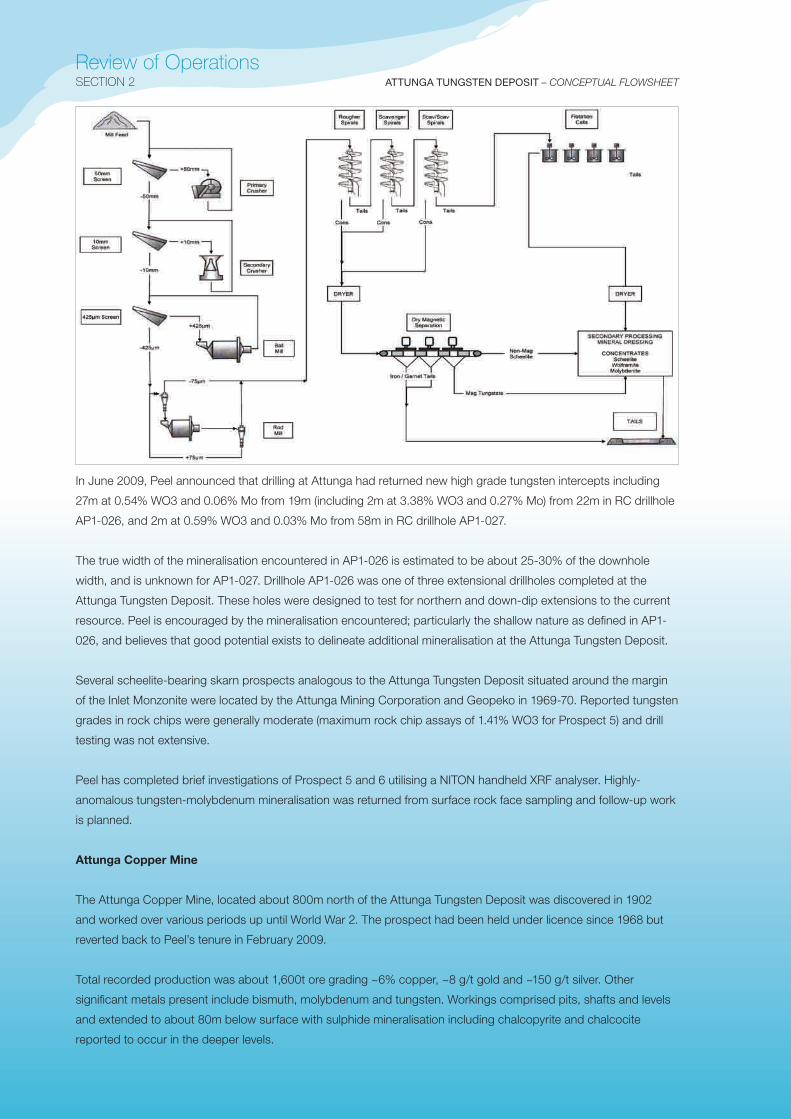
The potential process flow sheet identified would involve staged crushing and grinding, conventional gravity
concentration (spirals), drying of gravity concentrates, removal of magnetic gangue material via magnetic circuit, and
flotation of fine (-75 micron) spiral tails. Secondary processing/mineral dressing would involve further flotation work.
Review of operationsSeCtion 2
attunga projeCt – regional geology
PEEL ANNUAL09.indd 7 21/10/09 11:41:01 AM
8 Peel exPloration limited AnnuAl RepoRt 2009
Review of operationsSeCtion 2
In June 2009, Peel announced that drilling at Attunga had returned new high grade tungsten intercepts including
27m at 0.54% WO3 and 0.06% Mo from 19m (including 2m at 3.38% WO3 and 0.27% Mo) from 22m in RC drillhole
AP1-026, and 2m at 0.59% WO3 and 0.03% Mo from 58m in RC drillhole AP1-027.
The true width of the mineralisation encountered in AP1-026 is estimated to be about 25-30% of the downhole
width, and is unknown for AP1-027. Drillhole AP1-026 was one of three extensional drillholes completed at the
Attunga Tungsten Deposit. These holes were designed to test for northern and down-dip extensions to the current
resource. Peel is encouraged by the mineralisation encountered; particularly the shallow nature as defined in AP1-
026, and believes that good potential exists to delineate additional mineralisation at the Attunga Tungsten Deposit.
Several scheelite-bearing skarn prospects analogous to the Attunga Tungsten Deposit situated around the margin
of the Inlet Monzonite were located by the Attunga Mining Corporation and Geopeko in 1969-70. Reported tungsten
grades in rock chips were generally moderate (maximum rock chip assays of 1.41% WO3 for Prospect 5) and drill
testing was not extensive.
Peel has completed brief investigations of Prospect 5 and 6 utilising a NITON handheld XRF analyser. Highly-
anomalous tungsten-molybdenum mineralisation was returned from surface rock face sampling and follow-up work
is planned.
Attunga Copper Mine
The Attunga Copper Mine, located about 800m north of the Attunga Tungsten Deposit was discovered in 1902
and worked over various periods up until World War 2. The prospect had been held under licence since 1968 but
reverted back to Peel’s tenure in February 2009.
Total recorded production was about 1,600t ore grading ~6% copper, ~8 g/t gold and ~150 g/t silver. Other
significant metals present include bismuth, molybdenum and tungsten. Workings comprised pits, shafts and levels
and extended to about 80m below surface with sulphide mineralisation including chalcopyrite and chalcocite
reported to occur in the deeper levels.
attunga tungsten deposit – ConCeptual Flowsheet
PEEL ANNUAL09.indd 8 21/10/09 11:41:18 AM

9Peel exPloration limited AnnuAl RepoRt 2009
Review of operationsSeCtion 2
Mineralisation at the Attunga Copper Mine occurs in a garnet skarn similar to that at the Attunga Tungsten Deposit
indicating that the deposits are genetically-related. Modern exploration had been very limited, however an IP survey
completed in the mid-1980s defined multiple anomalies with only very shallow airtrac drilling (deepest hole = 14m)
ever completed.
In April 2009, Peel completed a transient electromagnetics (TEM) survey with results suggesting that the
presence of a moderate, shallow conductor, centred approximately 200m north of the historic Attunga Copper
Mine workings.
In May 2009, Peel announced the discovery of strong polymetallic (copper-gold dominant) mineralisation
at the Attunga Copper Mine. Drillhole ACM-004 returned 75m at 1.02 g/t gold, 0.87% copper,
0.09% molybdenum, 0.06% bismuth, and 22 g/t silver from 136m including 27m at 1.60 g/t gold, 1.66% copper,
0.18% molybdenum, 0.1% bismuth, and 39 g/t silver from 136m. Drillhole ACM-4 is one of six drillholes
that Peel has just completed to test the Attunga Copper Mine area. ACM-4 was designed to test an historic IP
anomaly located to the south of the historic workings and intersected mineralisation is interpreted to be
sub-vertical in geometry. The true width of the above intervals is construed to be approximately 25% of
the downhole intercepts.
Results for other drillholes in the Attunga Copper Mine area yielded significant mineralisation in several drillholes
with several drillholes experiencing difficult drilling conditions in alteration clays and not reaching target depths.
The discovery at the Attunga Copper Mine supports Peel’s belief that the Attunga skarn deposits are part of a larger
metalliferous system, possibly including a porphyry/mineralised granite source.
spiral metallurgiCal testwork
PEEL ANNUAL09.indd 9 21/10/09 11:41:20 AM

10 Peel exPloration limited AnnuAl RepoRt 2009
Kensington gold prospect
The Kensington gold prospect, located about 5 km north of the Attunga Tungsten Deposit, comprises a series of
historic gold workings (pre-WW1) across 800m strike with mineralisation outcropping, and covered by a 1,500m
long, +100 ppb gold geochemical anomaly, open in several directions. Peel believes that Kensington represents an
intrusive-related gold system.
Drilling in 1971 intersected extensive tungsten mineralisation, however the drill samples were not tested for gold.
In 1983, a large low grade tungsten resource was estimated by a previous explorer. In 1987 diamond drilling by
Challenger Mining intersected extensive low-grade gold mineralisation, however this work was not tested for
tungsten. Drillholes Ken-7 – 68m (13m at 1.07 g/t gold from 0m) and Ken-6 – 150.9m (108m at 0.74 g/t gold from
8m) returned the most significant gold mineralisation although all holes were mineralised to some degree.
Gold mineralisation at Kensington is hosted in a complexly faulted/sheared suite of dioritic and andesitic breccias,
andesitic volcanic greywacke (also described as lithic arenites) andesitic tuff, carbonaceous shale, metasediments
and lamprophyre.
In March 2008, Peel reported that resampling and assaying of historic drillcore from Kensington had validated
historic data and confirmed the presence of significant gold mineralisation. Resample assay results for drillhole Ken-
6 yielded an intercept of 109m at 0.69 g/t gold from 8m. Resample assay results also confirmed low-grade tungsten
mineralisation to be present in the area.
In July 2008, Peel completed an RC drilling programme comprising 10 holes for 1,229m with an aim of following up
the most important historic drill results and also to test along strike from previous drilling.
In September 2008, Peel announced that RC drilling completed at Kensington had encountered widespread gold
mineralisation. Highly anomalous to low-grade gold mineralisation was intersected in all drillholes.
In May 2009, Peel completed one RC drillhole at the Kensington gold prospect. The drillhole was designed to test
a shallow, chargeable anomaly defined from a recent IP survey. Ken-10 intercepted wide zones of low grade gold
mineralisation within a package of sediments that included carbonaceous shale.
Peel believes that Kensington holds good potential to host a significant gold system with mineralisation
remaining open.
EL6613 – Dungowan
EL6613 – the Dungowan project – covers an area of about 125 km2,, was granted in August 2006, and is located
about 15 km east of Tamworth, or about 300 km north of Sydney, New South Wales. There are two specific
project areas of interest within the Dungowan Project; numerous historic copper mines/workings in the vicinity of
Dungowan as well as a number of historic gold workings in the vicinity of Limbri.
The licence area is considered prospective for polymetallic VHMS mineralisation, syngenetic (volcanic-related),
exhalative gold mineralisation, and epigenetic structurally-controlled gold mineralisation related to regional
deformation, metamorphism and granite-intrusive phases.
Review of operationsSeCtion 2
PEEL ANNUAL09.indd 10 21/10/09 11:41:20 AM
11Peel exPloration limited AnnuAl RepoRt 2009
Review of operationsSeCtion 2
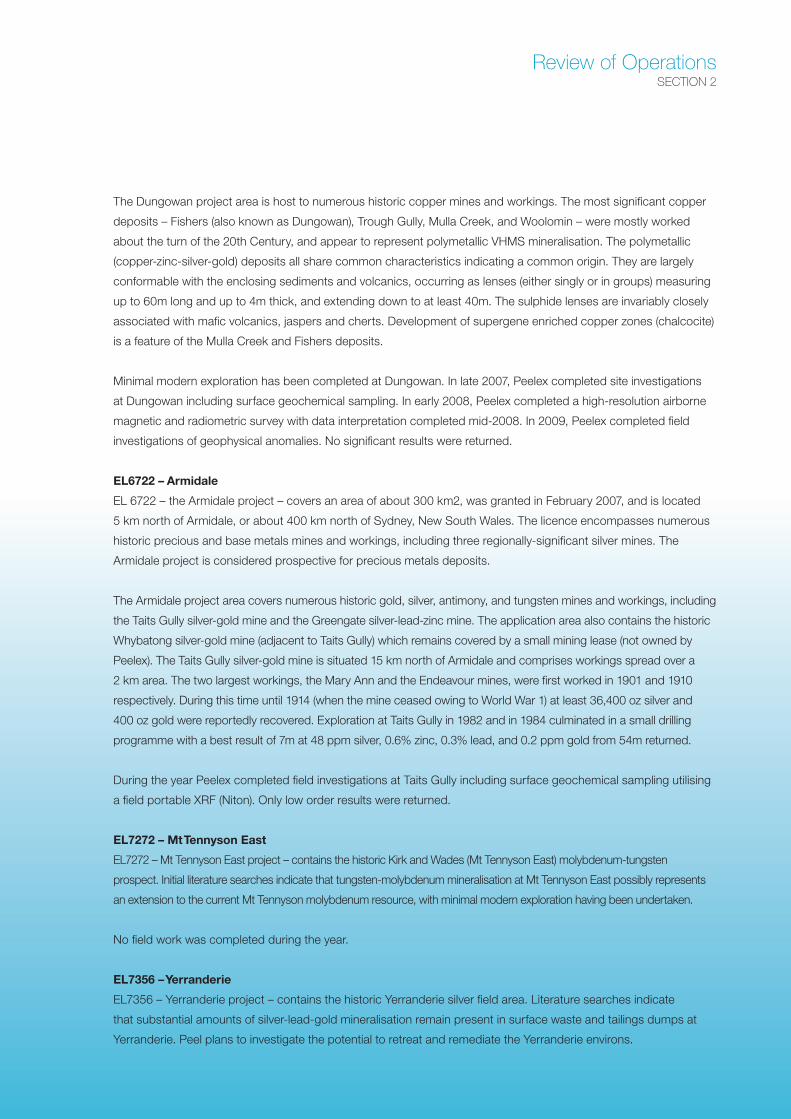
The Dungowan project area is host to numerous historic copper mines and workings. The most significant copper
deposits – Fishers (also known as Dungowan), Trough Gully, Mulla Creek, and Woolomin – were mostly worked
about the turn of the 20th Century, and appear to represent polymetallic VHMS mineralisation. The polymetallic
(copper-zinc-silver-gold) deposits all share common characteristics indicating a common origin. They are largely
conformable with the enclosing sediments and volcanics, occurring as lenses (either singly or in groups) measuring
up to 60m long and up to 4m thick, and extending down to at least 40m. The sulphide lenses are invariably closely
associated with mafic volcanics, jaspers and cherts. Development of supergene enriched copper zones (chalcocite)
is a feature of the Mulla Creek and Fishers deposits.
Minimal modern exploration has been completed at Dungowan. In late 2007, Peelex completed site investigations
at Dungowan including surface geochemical sampling. In early 2008, Peelex completed a high-resolution airborne
magnetic and radiometric survey with data interpretation completed mid-2008. In 2009, Peelex completed field
investigations of geophysical anomalies. No significant results were returned.
EL6722 – Armidale
EL 6722 – the Armidale project – covers an area of about 300 km2, was granted in February 2007, and is located
5 km north of Armidale, or about 400 km north of Sydney, New South Wales. The licence encompasses numerous
historic precious and base metals mines and workings, including three regionally-significant silver mines. The
Armidale project is considered prospective for precious metals deposits.
The Armidale project area covers numerous historic gold, silver, antimony, and tungsten mines and workings, including
the Taits Gully silver-gold mine and the Greengate silver-lead-zinc mine. The application area also contains the historic
Whybatong silver-gold mine (adjacent to Taits Gully) which remains covered by a small mining lease (not owned by
Peelex). The Taits Gully silver-gold mine is situated 15 km north of Armidale and comprises workings spread over a
2 km area. The two largest workings, the Mary Ann and the Endeavour mines, were first worked in 1901 and 1910
respectively. During this time until 1914 (when the mine ceased owing to World War 1) at least 36,400 oz silver and
400 oz gold were reportedly recovered. Exploration at Taits Gully in 1982 and in 1984 culminated in a small drilling
programme with a best result of 7m at 48 ppm silver, 0.6% zinc, 0.3% lead, and 0.2 ppm gold from 54m returned.
During the year Peelex completed field investigations at Taits Gully including surface geochemical sampling utilising
a field portable XRF (Niton). Only low order results were returned.
EL7272 – Mt Tennyson East
EL7272 – Mt Tennyson East project – contains the historic Kirk and Wades (Mt Tennyson East) molybdenum-tungsten
prospect. Initial literature searches indicate that tungsten-molybdenum mineralisation at Mt Tennyson East possibly represents
an extension to the current Mt Tennyson molybdenum resource, with minimal modern exploration having been undertaken.
No field work was completed during the year.
EL7356 – Yerranderie
EL7356 – Yerranderie project – contains the historic Yerranderie silver field area. Literature searches indicate
that substantial amounts of silver-lead-gold mineralisation remain present in surface waste and tailings dumps at
Yerranderie. Peel plans to investigate the potential to retreat and remediate the Yerranderie environs.
PEEL ANNUAL09.indd 11 21/10/09 11:41:20 AM

12 Peel exPloration limited AnnuAl RepoRt 2009
SeCtion 3
Rob Tyson
Managing Director
Schedule of Tenements
pRoject numbeR HoldeR owneRsHip expiRy
dungowan el6613 peel exploration ltd 100% 21 August 2010
Armidale el6722 peel exploration ltd 100% 25 February 2009
Attunga el6883 peel exploration ltd 100% 21 september 2009
Attunga el6884 peel exploration ltd 100% 21 september 2009
mt tennyson east elA3594 peel exploration ltd 100% 20 january 2011
yerranderie el7356 peel exploration ltd 100% 24 june 2011
Schedule of tenements
the information in this report that relates to exploration results is based on information compiled by Mr robert tyson, who is a Member of the australasian institute of Mining and Metallurgy. Mr tyson has sufficient experience which is relevant to the styles of mineralisation and types of deposits under consideration and to the activity which he is undertaking to qualify as a Competent person as defined in the 2004 edition of the ‘australasian Code for reporting of exploration results, Mineral resources and ore reserves.’ Mr tyson consents to the inclusion in this report of the matters based on the information in the form and context in which it appears.
PEEL ANNUAL09.indd 12 21/10/09 11:41:20 AM

13Peel exPloration limited AnnuAl RepoRt 2009
Your directors present their report on the consolidated entity (referred to hereafter as “the Group”) comprising Peel
Exploration Limited and its 100% owned subsidiary Peel Energy Limited for the financial year ended 30 June 2009.
Directors
The following persons were directors of Peel Exploration Limited during the financial year and up to the date of this
report.
S Hadfield
R Tyson
C McGown
Directors’ Interests in Shares and Options
Directors’ interests in shares and options as at 30 June 2009 are set out in the table below.
Activities
The continuing principal activity of the Group is the exploration for economic deposits of minerals. For the period of
this report, the emphasis has been on base and precious metals.
Results
The loss of the Group for the financial year after providing for income tax amounted to $1,334,675 (2008: $757,648).
Dividends
No dividends were paid or proposed during the year.
Review of Operations
A review of the operations of the Group during the financial year and the results of those operations are contained in
pages 2 to 11 in this report.
Corporate Structure
The Group comprises Peel Exploration Limited, a limited Company incorporated and domiciled in Australia and its
100% owned subsidiary Peel Energy Limited also incorporated and domiciled in Australia. Peel Energy Limited was
incorporated on 14 January 2009.
Directors Report
diRectoR sHARes diRectly And indiRectly Held options
s Hadfield 2,100,000 4,722,873
R tyson 2,598,750 5,122,874
c mcGown - 1,000,000
SeCtion 4
PEEL ANNUAL09.indd 13 21/10/09 11:41:20 AM

14 Peel exPloration limited AnnuAl RepoRt 2009
Directors ReportSeCtion 4
Significant Changes
During the financial year Peel Exploration Limited increased contributed equity by $135,000 through the issue
of 900,000 ordinary shares at $0.15 each. The cash received from the increase in contributed equity was used
principally to continue the company’s exploration program at its Attunga project.
The Directors are not aware of any other significant changes in the state of affairs of the Group occurring during the
financial year, other than disclosed in this report.
Matters Subsequent to the End of the Financial Period
(a) Non-renounceable entitlement issue
A prospectus for a pro-rata non-renounceable entitlement issue of one new share for every three shares held by
shareholders at an issue price of 10 cents to raise approximately $1,030,892 was despatched by the Company
to shareholders on 7 September 2009. The closing date of the offer is 25 September 2009. At that date the
Company had received acceptances for 3,293,400 shares raising $329,340.
(b) Acquisition of new mining lease
The company has announced the details of a conditional agreement to acquire a 100% interest in the May Day gold
and base metal deposit from Imperial Corporation Ltd. The agreement is conditional on completion of due diligence
investigations and the renewal of Mining Lease 1361. Consideration for the acquisition is 2,750,000 fully paid
ordinary shares in Peel Exploration Limited.
Other than these matters, there were at the date of this report no other matters or circumstances which have arisen
since 30 June 2009 that have significantly affected or may significantly affect:
i) the operations of the Group;
ii) the results of those operations; or
iii) the state of affairs of the Group.
Likely Developments and Expected Results
As the Group’s areas of interest are at an early stage, it is not possible to postulate the likely developments and any
expected results.
Information on directors
Simon Hadfield – Non-Executive Chairman
Mr Hadfield has more than 30 years company management experience and has held directorships in publicly-listed
industrial and resource companies. Mr Hadfield is Managing Director of Resource Information Unit Pty Ltd.
Robert Maclaine Tyson – Executive Director
Mr Tyson is a geologist with more than 15 years resources industry experience, having worked in exploration and
mining-related roles for companies including Cyprus Exploration Pty Ltd, Queensland Metals Corporation NL,
Murchison Zinc Pty Ltd, Normandy Mining Ltd and Equigold NL. Mr Tyson has more than five years of senior
management experience.
PEEL ANNUAL09.indd 14 21/10/09 11:41:20 AM
15Peel exPloration limited AnnuAl RepoRt 2009
Craig McGown – Non-Executive Director
Mr McGown is an Investment Banker with over 35 years experience consulting to companies in Australia and
internationally, particularly in the natural resource sector. He holds a Bachelor of Commerce degree, is a Fellow
of the Institute of Chartered Accountants and an Affiliate of the Securities Institute of Australia. Mr McGown is the
former Chairman of DJ Carmichael Pty Limited. He is currently a director of the corporate advisory business New
Holland Capital Pty Limited and a Non-Executive Director of Bass Metals Ltd and Non-Executive Chairman of
Pioneer Nickel Limited and Entek Energy Limited.
Company secretary
The company secretary is Mr D Hocking who was appointed to the position of company secretary in March 2007.
Mr Hocking is a qualified Chartered Accountant from the United Kingdom. He has more than 20 years commercial
experience in Australia producing management and financial reports for medium sized businesses in a range of
industries including publishing, franchising, rural merchandising, financial services and the offshore oil industry. Mr
Hocking also brings previous experience as a Company Secretary in a public company.
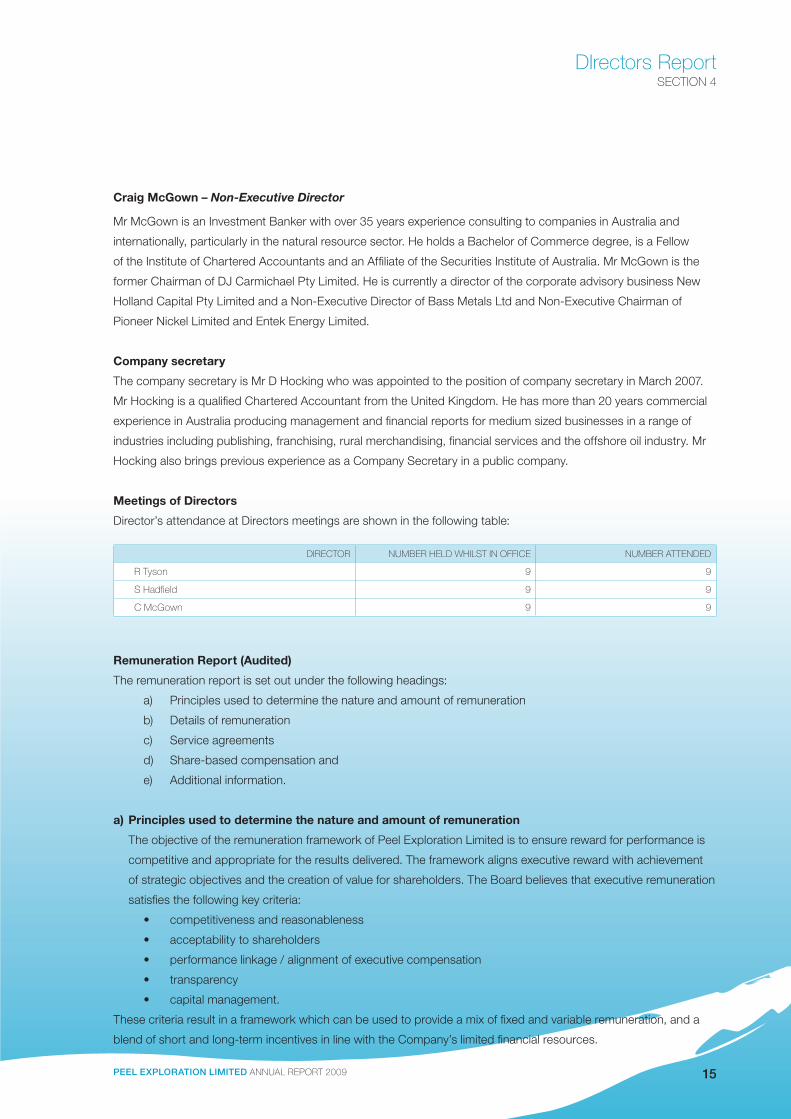
Meetings of Directors
Director’s attendance at Directors meetings are shown in the following table:
Remuneration Report (Audited)
The remuneration report is set out under the following headings:
a) Principles used to determine the nature and amount of remuneration
b) Details of remuneration
c) Service agreements
d) Share-based compensation and
e) Additional information.
a) Principles used to determine the nature and amount of remuneration
The objective of the remuneration framework of Peel Exploration Limited is to ensure reward for performance is
competitive and appropriate for the results delivered. The framework aligns executive reward with achievement
of strategic objectives and the creation of value for shareholders. The Board believes that executive remuneration
satisfies the following key criteria:
• competitivenessandreasonableness
• acceptabilitytoshareholders
• performancelinkage/alignmentofexecutivecompensation
• transparency
• capitalmanagement.
These criteria result in a framework which can be used to provide a mix of fixed and variable remuneration, and a
blend of short and long-term incentives in line with the Company’s limited financial resources.
Directors ReportSeCtion 4
diRectoR numbeR Held wHilst in oFFice numbeR Attended
R tyson 9 9
s Hadfield 9 9
c mcGown 9 9
PEEL ANNUAL09.indd 15 21/10/09 11:41:20 AM

16 Peel exPloration limited AnnuAl RepoRt 2009
Directors ReportSeCtion 4
Board and Senior Management
Fees and payments to the non-executive Directors and senior executives reflect the demands which are made
on, and the responsibilities of, the Directors and the senior management. Such fees and payments are reviewed
annually by the Board.
Company policy in relation to issuing options and remunerating executives is that directors are entitled to
remuneration out of the funds of the Company but the remuneration of the non-executive Directors may not exceed
in any year the amount fixed by the Company in general meeting for that purpose. The aggregate remuneration of
the non-executive directors has been fixed at a maximum of $200,000 per annum to be apportioned among the
non-executive Directors in such a manner as they determine (refer below). Directors are also entitled to be paid
reasonable travel, accommodation and other expenses incurred in consequence of their attendance at Board
meetings and otherwise in the execution of their duties as Directors.
Remuneration is not linked to past group performance but rather towards generating future shareholder wealth
through share price performance. Peel Exploration Limited listed on 11 May 2007 at 20c per share and the share
price at 30 June 2009 was 16c (2008: 19c). The shares recorded high and low points of 26c and 15c during the
year, and are trading at 9c on 19th September 2009. The company has recorded a loss each financial year to date
as it carries out exploration activities on its tenements. No dividends have been paid.
b) Details of remuneration
Details of the nature and amount of each element of the remuneration of each of the Directors of Peel Exploration
Ltd and those senior executives of the Company who received the highest emoluments during the year ended 30
June 2009 are set out in the following table.
Table 1: Director and senior executive remuneration
sHoRt-teRm employment beneFits post employment
lonG-teRm beneFits
sHARe bAsed
pAyment
2009 cAsH sAlARy
And Fees $
bonuses, otHeR
beneFits $
consultinG Fees $
supeR-AnnuAtion $
lonG-seRvice leAve $
options $
totAl $ % peRFoR-mAnce
RelAted
Directors
Rm tyson 91,925 - - 8,273 - - 100,198 0%
s Hadfield 50,000 - - 4,500 - - 54,500 0%
c mcGown 50,000 - - 4,500 - 52,290 106,790 0%
Other executives
d Hocking 62,400 - - 5,616 - - 68,016 0%
Total 254,325 - - 22,889 - 52,290 329,504
PEEL ANNUAL09.indd 16 21/10/09 11:41:21 AM
17Peel exPloration limited AnnuAl RepoRt 2009
c) Service agreements
Remuneration and other terms of employment for the Directors and executives are not formalised in Service/
Appointment agreements. Major provisions of employment are set out below:
R Tyson
There is no written contract for Mr Tyson, who received payments and benefits totalling $100,198 (2008:$62,356) in
his role as executive director of the Company.
S Hadfield
There is no written contract for Mr Hadfield, who received payments and benefits totalling $54,500 (2008:$39,955)
in his role as a director of the Company.
C McGown
There is no written contract for Mr McGown, who received payments and benefits totalling $106,790 (2008:$16,753)
in his role as a director of the Company.
d) Share-based compensation
Directors
During the year options over one million shares in Peel Exploration Limited were granted to a director; Mr Craig
McGown. The options vested immediately and were granted for nil consideration pursuant to approval by
shareholders at the last Annual General meeting. The options are exercisable at 30cents at any time up to 30 April
2011. The assessed fair value of $52,290 is included in the remuneration tables above. Fair values at grant date
have been determined using Black-Scholes option pricing model that takes into account the exercise price, the
term of the option, the impact of dilution, the share price at grant date and expected price volatility of the underlying
share, the expected dividend yield and the risk-free interest rate for the term of the option.
Employees
Options over shares in Peel Exploration Limited may be granted under the Peel Exploration Limited Employee
Option Plan which was created in June 2008 and approved by shareholders at annual general meeting. The
Employee Option Plan is designed to provide long-term incentives for employees to deliver long-term shareholder
Directors ReportSeCtion 4
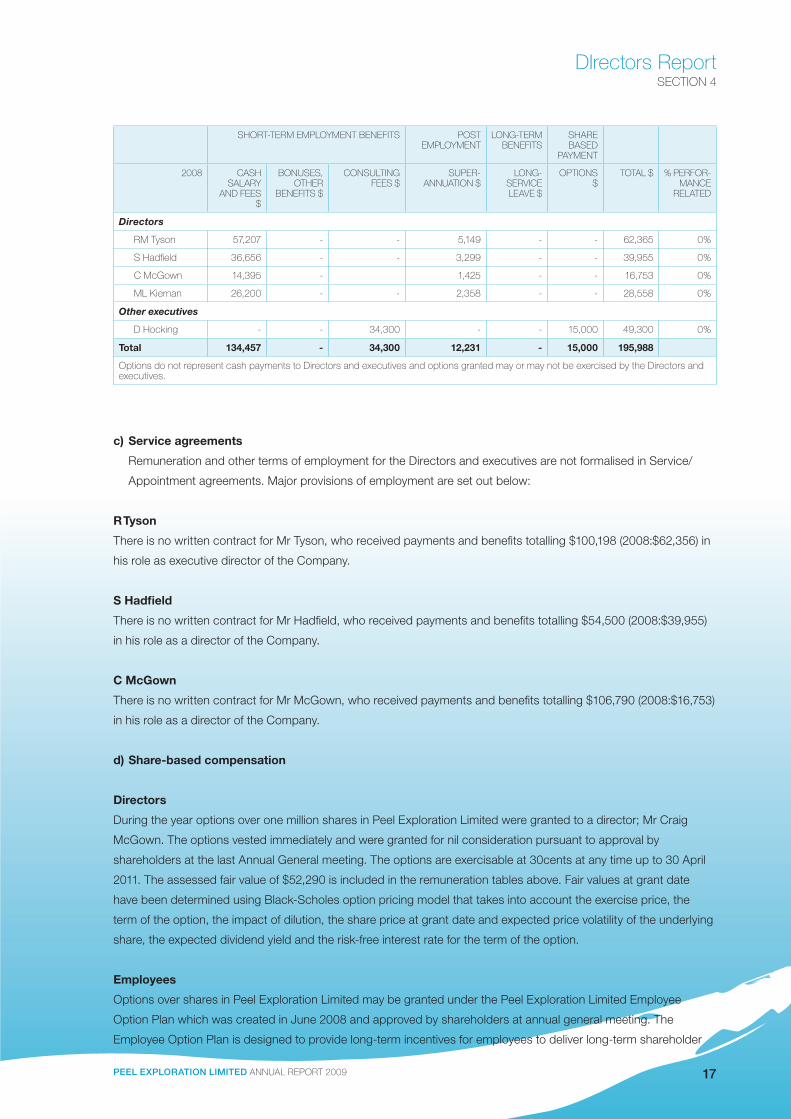
sHoRt-teRm employment beneFits post employment
lonG-teRm beneFits
sHARe bAsed
pAyment
2008 cAsH sAlARy
And Fees $
bonuses, otHeR
beneFits $
consultinG Fees $
supeR-AnnuAtion $
lonG-seRvice leAve $
options $
totAl $ % peRFoR-mAnce
RelAted
Directors
Rm tyson 57,207 - - 5,149 - - 62,365 0%
s Hadfield 36,656 - - 3,299 - - 39,955 0%
c mcGown 14,395 - 1,425 - - 16,753 0%
ml Kiernan 26,200 - - 2,358 - - 28,558 0%
Other executives
d Hocking - - 34,300 - - 15,000 49,300 0%
Total 134,457 - 34,300 12,231 - 15,000 195,988
options do not represent cash payments to directors and executives and options granted may or may not be exercised by the directors and executives.
PEEL ANNUAL09.indd 17 21/10/09 11:41:21 AM

18 Peel exPloration limited AnnuAl RepoRt 2009
Directors ReportSeCtion 4
returns. Under the plan, participants are granted options 50% of which vest immediately and the remainder vest
after twelve months provided the employees are still employed by the Company at the end of the vesting period.
Participation in the plan is at the Board’s discretion and no individual has a contractual right to participate in the plan
or to receive any guaranteed benefits.
Once vested the options are exercisable at $0.25 up to and including 30 November 2010. Options granted under
the plan carry no dividend or voting rights.
Details of options over ordinary shares in the company provided as remuneration to each director and key
management personnel of Peel Exploration Limited are set out below. When exercisable, each option is convertible
into one ordinary share of Peel Exploration Limited. Further information on the options is set out in note 13 to the
financial statements.
The assessed fair value at grant date of options granted to the individuals is allocated equally over the period from
grant date to vesting date and the amount is included in the remuneration tables above. Fair values at grant date
have been determined using Black-Scholes option pricing model that takes into account the exercise price, the
term of the option, the impact of dilution, the share price at grant date and expected price volatility of the underlying
share, the expected dividend yield and the risk-free interest rate for the term of the option.
The terms and conditions of each grant of options affecting remuneration in the previous, this or future reporting
period is as follows:
No options were exercised by directors of Peel Exploration Limited or other key management personnel during the year.
GRAnt dAte dAte vested & exeRcisAble
expiRy dAte exeRcise pRice vAlue peR option At GRAnt dAte
23 june 2008 23 june 2008 (50%)23 june 2009 (50%)
30 november 2010 25 cents 7 cents
5 december 2008 5 december 2008 30 April 2011 30 cents 5 cents
Table 2: Options granted as part of remuneration
nAme numbeR oF options GRAnted duRinG yeAR
numbeR oF options vested duRinG yeAR
2009 2008 2009 2008
Directors
c mcGown 1,000,000 - 1,000,000 -
Other key management personnel
d Hocking - 200,000 100,000 100,000
PEEL ANNUAL09.indd 18 21/10/09 11:41:21 AM

19Peel exPloration limited AnnuAl RepoRt 2009
e) Additional Information
Details of remuneration: cash bonuses, options
No cash bonuses have been paid by the Company. For each grant of options included in the table 2 above, the
percentage of grant that vested in the financial year, and the percentage that was forfeited, is set out below:
end of audited remuneration report
Share-based compensation: optionsFurther details relating to options issued as compensation in the current year are set out below:
nAme A RemuneRAtion consistinG oF options B vAlue At GRAnt dAte
c mcGown 49.0% 52,290
no options were exercised by directors of peel exploration ltd or other key management personnel in the year. A = the percentage of the value of remuneration consisting of options, based on the value of options expensed during the current year.B = the value at grant date calculated in accordance with AAsb 2 share-based payment of options granted during the year as part of remuneration.
Shares issued on the exercise of options
no ordinary shares of the company were issued during the year on the exercise of options.the following ordinary shares of the company were issued during the previous year ended 30 june 2008 on the exercise of options.
exeRcise dAte issue pRice oF sHARes numbeR oF sHARes issued
24 october 2007 20 cents 26,750
Total 26,750
Directors ReportSeCtion 4
nAme options
yeAR GRAnted vested%
FoRFeited%
FinAnciAl yeARs in wHicH
options mAy vest
minimum totAl vAlue oF GRAnt
yet to vest$
mAximum totAl vAlue oF GRAnt
yet to vest$
Rm tyson 2007 100% - - nil -
s Hadfield 2007 100% - - nil -
d Hocking 2008 50% - 30/06/09 nil -
c mcGown 2009 100% - 30/06/09 nil -
Shares under option
unissued ordinary shares of the company under option at the date of this report are as follows:
dAte options GRAnted expiRy dAte issue pRice oF sHARes numbeR undeR option
8 mar 2007 (shareholders) 30 nov 2010 20 cents 7,500,000
8 mar 2007 (directors) 30 nov 2010 30 cents 7,500,000
11 sept 2007 (shareholders) 30 nov 2010 20 cents 14,973,250
23 jun 2008 (employees) 30 nov 2010 25 cents 600,000
5 dec 2009 (directors) 30 Apr 2011 30 cents 1,000,000
Total 31,573,250
no option holder has any right under the options to participate in any other share issue of the company.
PEEL ANNUAL09.indd 19 21/10/09 11:41:21 AM

20 Peel exPloration limited AnnuAl RepoRt 2009
Indemnification and Insurance of Directors and Officers
During the financial year the Company paid a premium to insure the directors and officers of the Group.
Proceedings on behalf of the Company
No person has applied for leave of Court to bring proceedings on behalf of the Group or intervene in any
proceedings to which the Group is a party for the purpose of taking responsibility on behalf of the Group for all or
any part of those proceedings.
The Group was not a party to any such proceedings during the year.
Environmental Performance
Peel Exploration Limited holds exploration licences issued by the NSW Department of Primary Industry which
specifies guidelines for environmental impacts in relation to exploration activities. The licence conditions provide
for the full rehabilitation of the areas of exploration in accordance with the Department’s guidelines and standards.
There have been no significant known breaches of the licence conditions.
The Directors have considered compliance with the National Greenhouse and Energy Reporting Act 2007 which
requires entities to report annual greenhouse gas emissions and energy use. For the first measurement period 1
July 2008 to 30 June 2009 the directors have assessed that there are no current reporting requirements, but may
be required to do so in the future.
Auditor’s Independence Declaration
A copy of the auditor’s independence declaration as required under section 307C of the Corporations Act 2001 is
included at the end of this financial report.
Auditor
BDO Kendalls Audit & Assurance (WA) Pty Ltd continues in office under section 327 of the Corporations Act 2001.
Non-Audit Services
The company may decide to employ the auditor on assignments additional to their statutory audit duties where
the auditor’s expertise and experience with the company are important. Please refer to Note 14 in the Financial
Report for details of non-audit services provided.
This report is made in accordance with a resolution of the Board of Directors:
Simon Hadfield
Chairman of Directors
Perth, Western Australia
Dated on this the 30th day of September 2009.
Directors ReportSeCtion 4
PEEL ANNUAL09.indd 20 21/10/09 11:41:21 AM

21Peel exPloration limited AnnuAl RepoRt 2009
income Statement
SeCtion 5
For The Year Ended 30 June 2009
consolidAted pARent entity
note 2009 $ 2008 $ 2009 $ 2008 $
Revenue 3 98,750 - 98,750 164,472
depreciation expenses 8 (28,859) - (28,859) (5,260)
directors fees (109,000) - (109,000) (84,333)
saleries and employee benefits (344,713) - (344,713) (167,858)
share-based remuneration to employees 23 (52,290) - (52,290) (45,000)
exploration expenditure written-off (640,717) - (640,717) (383, 802)
Administration expenses (257,846) - (257,126) (233,867)
loss before income tax (1,334,675) - (1,333,955) (755,648)
income tax expense 4 - - - -
Loss for the year attributable to the ordinary equity holders of the company 1,334,675) - (1,333,955) (755,648)
basic and diluted loss per share (cents per share) 23 (0.04) -
The above income statement should be read in conjunction with the accompanying notes.
PEEL ANNUAL09.indd 21 21/10/09 11:41:21 AM

22 Peel exPloration limited AnnuAl RepoRt 2009
SeCtion 6
Balance SheetAs At 30 June 2009
consolidAted pARent entity
note 2009 $ 2008 $ 2009 $ 2008 $
Current assets
cash and cash equivalents 5 901,020 - 901,020 2,030,930
trade and other receivables 6 31,233 - 31,233 22,850
Total Current Assets 932,253 - 932,253 2,053,780
non-Current assets
security deposits 7 80,000 - 80,000 60,000
plant and equipment 8 55,896 - 55,896 84,754
exploration licences 10 - - 5,000 -
total non-Current assets 135,896 - 140,896 144,754
total assets 1,068,149 - 1,073,149 2,200,162
Current liabilities
trade and other payables 11 103,917 - 108,197 88,545
total Current liabilities 103,917 - 108,197 88,545
total liabilities 103,917 - 108,197 88,545
net assets / (liabilities) 964,232 - 964,952 2,111,617
equity
contributed equity 12 2,901,921 - 2,901,921 2,766,921
Accumulated losses (2,507,211)) - (2,506,491) (1,172,536)
option reserve 13 569,522 - 569,522 517,232
total equity 964,232 - 964,952 2,111,617
The above balance sheet should be read in conjunction with the accompanying notes.
PEEL ANNUAL09.indd 22 21/10/09 11:41:21 AM

23Peel exPloration limited AnnuAl RepoRt 2009
SeCtion 7
Statement of Changes in equity For The Year Ended 30 June 2008
CONSOLIDATED ContRiButeD equity $
ACCumulAteD loSSeS $ ReSeRveS $ totAl equity $
Balance at 1 July 2007 2,799,062 (414,888) 322,500 2,706,674
loss for year - (757,648) - (757,648)
Total income and expense recognised for the year 2,799,062 (1,172,536) 322,500 1,949,026
Transactions with equity holders in their capacity as equity holders:
issue of share capital 5,350 - - 5,350
share issue options - - 150,000 150,000
exercise of options 268 - (268) -
share issue expenses (37,759) - - (37,759)
share-based payments - - 45,000 45,000
Balance at 30 June 2008 2,766,921 (1,172,536) 517,232 2,111,617
loss for year - (1,334,675) - (1,334,675)
Total income and expense recognised for the year 2,766,921 (2,507,211) 517,232 766,942
Transactions with equity holders in their capacity as equity holders:
issue of share capital 135,000 - - 135,000
share-based payments - - 52,290 52,290
Balance at 30 June 2009 2,901,921 (2,507,211) 569,522 964,232
Parent entity ContRiButeD equity $
ACCumulAteD loSSeS $ ReSeRveS $ totAl equity $
Balance at 1 July 2007 2,799,062 (414,888) 322,500 2,706,674
loss for year - (757,648) - (757,648)
Total income and expense recognised for the year 2,799,062 (1,172,536) 322,500 1,949,026
Transactions with equity holders in their capacity as equity holders:
issue of share capital 5,350 - - 5,350
share issue options - - 150,000 150,000
exercise of options 268 - (268) -
share issue expenses (37,759) - - (37,759)
share-based payments - - 45,000 45,000
Balance at 30 June 2008 2,766,921 (1,172,536) 517,232 2,111,617
loss for year - (1,333,955) - (1,333,955)
Total income and expense recognised for the year 2,766,921 (2,506,491) 517,232 777,662
Transactions with equity holders in their capacity as equity holders:
issue of share capital 135,000 - - 135,000
share-based payments - - 52,290 52,290
Balance at 30 June 2009 2,901,921 (2,506,491) 569,522 964,952
The above Statements of Changes in Equity should be read in conjunction with the accompanying notes.
PEEL ANNUAL09.indd 23 21/10/09 11:41:22 AM

24 Peel exPloration limited AnnuAl RepoRt 2009
SeCtion 8
Statement of Cash FlowsFor The Year Ended 30 June 2008
consolidAted pARent entity
note 2009 $ 2008 $ 2009 $ 2008 $
Cash flows from operating activities
payments to suppliers and employees (1,343,660) - (1,342,940) (799,715)
interest received 98,750 - 98,750 164,472
net cash outflow from operating activities 20 (1,244,910) - (1,244,190) (635,243)
Cash flows from investing activities
payment of security deposits (20,000) - (20,000) (20,000)
payments for purchase of plant and equipment - - - (88,338)
net cash outflow from investing activities (20,000) - (20,000) (108,338)
Cash flows from financing activities
proceeds from issues of shares 135,000 - 135,000 155,350
transaction costs of issue of shares - - - (37,759)
purchase of investment in subsidiary company - - (5,000) -
loan from related company - - 4,280 -
net cash inflow from financing activities 135,000 - 134,280 117,591
net decrease in cash and cash equivalents (1,129,910) - (1,129,910) (625,990)
cash and cash equivalents at the beginning of the financial year 2,030,930 - 2,030,930 2,656,920
Cash and cash equivalents at the end of the financial year 901,020 - 901,020 2,030,930
The above Cash Flow Statement should be read in conjunction with the accompanying notes.
PEEL ANNUAL09.indd 24 21/10/09 11:41:22 AM

25Peel exPloration limited AnnuAl RepoRt 2009
notes to the Accounts1. Statement of Significant Accounting Policies
The principal accounting policies adopted in the preparation of the financial report are set out below. These policies
have been consistently applied to all the years presented, unless otherwise stated. The financial report includes the
financial statements for Peel Exploration Limited as an individual entity and the consolidated entity comprising Peel
Exploration Limited and its subsidiary, Peel Energy Limited.
a) Basis of preparation
This general purpose financial report has been prepared in accordance with Australian Accounting Standards, other
authoritative pronouncements of the Australian Accounting Standards Board, Australian Accounting Interpretations
and the Corporations Act 2001.
Compliance with iFrs
Australian Accounting Standards include Australian equivalents to International Financial Reporting Standards
(AIFRS). Compliance with AIFRS ensures that the financial statements and notes of Peel Exploration Limited comply
with International Financial Reporting Standards (IFRS).
historical cost convention
These financial statements have been prepared under the historical cost convention.
b) Principles of consolidation
The consolidated financial statements are those of the consolidated entity, comprising Peel Exploration
Limited (the parent entity) and Peel Energy Limited (the controlled entity) which Peel Exploration Limited
controlled during the year and at balance date (“the Group”). A controlled entity is any entity that Peel
Exploration Limited has the power to control the financial and operation policies so as to obtain benefits from
its activities.
Information from the financial statements of the subsidiary is included from the date the parent company
obtains control until such time as control ceases. Where there is a loss of control of a subsidiary, the consolidated
financial statements include the results for the part of the reporting period during which the parent company has
control.
Subsidiary acquisitions are accounted for using the purchase method of accounting.
The financial statements of subsidiaries are prepared for the same reporting period as the parent entity, using
consistent accounting policies.
All intercompany balances and transactions, including unrealised profits arising from intra-group transactions, have
been eliminated in full. Unrealised losses are eliminated except where costs cannot be recovered.
The investment in the subsidiary is carried at cost in the parent entity.
SeCtion 9
PEEL ANNUAL09.indd 25 21/10/09 11:41:22 AM

26 Peel exPloration limited AnnuAl RepoRt 2009
notes to the AccountsSeCtion 9
c) Revenue recognition
Revenue is recognised to the extent that it is probable that the economic benefit will flow to the group and the
revenue can be reliably measured. The following specific recognition criteria must also be met before revenue is
recognised.
interest income
Revenue is recognised as the interest accrues using the effective interest rate method.
d) Income tax
The income tax expense or revenue for the period is the tax payable on the current period’s taxable income based
on the national income tax rate for each jurisdiction adjusted by changes in deferred tax assets and liabilities
attributable to temporary differences and to unused tax losses.
Deferred income tax is provided on all temporary differences at the balance sheet date between the tax bases of
assets and liabilities and their carrying amounts for financial reporting purposes.
Deferred income tax assets are recognised for all deductible temporary differences, carry forward of unused tax assets
and unused tax losses, to the extent that it is probable that taxable profit will be available against which the deductible
temporary differences, and the carry-forward of unused tax assets and unused tax losses can be utilised. A deferred
income tax asset is not recognised where the deferred income tax asset relating to the deductible temporary difference
arises from the initial recognition of an asset or liability in a transaction that is not a business combination and, at the
time of the transaction, affects neither the accounting profit nor taxable profit or loss or when the deductible temporary
difference is associated with investments in subsidiaries, associates or interests in joint ventures, in which case a deferred
tax asset is only recognised to the extent that it is probable that the temporary difference will reverse in the foreseeable
future and taxable profit will be available against which the temporary difference can be utilised.
The carrying amount of deferred income tax assets is reviewed at each balance date and reduced to the extent it is
no longer probable that sufficient taxable profit will be available to allow all or part of the deferred income tax to be
utilised. Deferred income tax assets and liabilities are measured at the tax rates that are expected to apply to the
year when the asset is realised or the liability is settled, based on tax rates (and tax laws) that have been enacted at
the balance date. Income taxes relating to items recognised directly in equity are recognised in equity and not in the
income statement.
e) Impairment of assets
At each reporting date, the group assesses whether there is any indication that an asset may be impaired. Where
an indicator of impairment exists, the company makes a formal estimate of recoverable amount. Where the carrying
amount of an asset exceeds its recoverable amount the asset is considered impaired and is written down to its
recoverable amount.
Recoverable amount is the greater of fair value less costs to sell and value in use. It is determined for an individual
asset, unless the asset’s value in use cannot be estimated to be close to its fair value less costs to sell and it does
not generate cash inflows that are largely independent of those from other assets or groups of assets, in which
PEEL ANNUAL09.indd 26 21/10/09 11:41:22 AM
27Peel exPloration limited AnnuAl RepoRt 2009
notes to the AccountsSeCtion 9
case, the recoverable amount is determined for the cash-generating unit to which the asset belongs. The estimated
future cash flows are discounted to their present value using a pre tax discount rate reflecting current market
assessments of the time value of money and the risks specific to the asset.
No impairment losses (2008: $11,425) have been recognised for the year ending 30 June 2009.
f) Cash and cash equivalents
For cash flow statement preparation purposes, cash and cash equivalents includes cash on hand and deposits
held at call with financial institutions. Bank overdrafts are shown within borrowings in the current liabilities of the
balance sheet.
g) Trade and other receivables
Trade receivables, which generally have 30 to 90 day terms, are recognised initially at fair and subsequently at
amortised cost less an allowance for any uncollectible amounts. An allowance for doubtful debts is made when
there is objective evidence that the group will not be able to collect the debts. The allowance for bad debts is
recognised in a separate account. Bad debts are written off when identified.
h) Other financial assets – security deposits
Security deposits are non-derivative financial assets with fixed or determinable payments that are not quoted in an
active market.
i) Fair value estimation
The fair value of financial assets and financial liabilities must be estimated for recognition and measurement or for
disclosure purposes.
The carrying value less impairment provision of trade receivables and payables are assumed to approximate their
fair values due to their short-term nature. The fair value of financial liabilities for disclosure purposes is estimated
by discounting the future contractual cash flows at the current market interest rate that is available to the Group for
similar financial instruments.
j) Plant and equipment
All assets acquired, including plant and equipment are initially recorded at their cost of acquisition, being the fair
value of the consideration provided plus incidental costs directly attributable to the acquisition. Plant and equipment
is included at cost less provision for depreciation and any impairment in value and depreciated on a straight-line
basis commencing from the time the asset is held ready for use.
An item of plant and equipment is derecognised upon disposal or when no future economic benefits are expected
from its use or disposal. Any gain or loss arising on de-recognition of the asset (calculated as the difference
between net disposal proceeds and the carrying amount of the asset) is included in profit or loss in the year the
asset is derecognised.
k) Exploration and evaluation expenditure
Exploration licences are expensed through the profit and loss.
PEEL ANNUAL09.indd 27 21/10/09 11:41:22 AM

28 Peel exPloration limited AnnuAl RepoRt 2009
notes to the AccountsSeCtion 9
Exploration and evaluation expenditure is written off in the year it is incurred. Accordingly, exploration expenditure
of $640,717 (2008: $383,802) has been written off during the year. The decision to write off exploration expenditure
as incurred does not indicate any change in the board’s view of the intrinsic value of the mining leases held by the
company. Rather, the decision was taken, as it is the most prudent treatment available under current accounting
standards for such expenditure.
l) Trade and other payables
These amounts represent liabilities for goods and services provided to the Group prior to the end of the financial
year which are unpaid. The amounts are unsecured and are usually paid within 30 days of recognition. They are
recognised initially at fair value and subsequently at amortised cost.
m) Borrowings
Borrowings are initially recognised at fair value, net of transaction costs incurred. Borrowings are subsequently
measured at amortised cost. Any difference between the proceeds (net of transaction costs) and the redemption
amount is recognised in the income statement over the period if the borrowings using the effective interest method.
Borrowings are removed from the balance sheet when the obligation specified in the contract is discharged,
cancelled, or expired. The difference between the carrying amount of a financial liability that has been extinguished
or transferred to another party and the consideration paid, including any non-cash assets transferred or liabilities
assumed, is recognised in other income or other expenses.
Borrowings are classified as current liabilities unless the Company has an unconditional right to defer settlement of
the liability for at least 12 months after the balance sheet date.
n) Contributed equity
Ordinary shares are classified as equity.
Incremental costs directly attributable to the issue of new shares or options are shown in equity as a deduction,
net of tax, from the proceeds. Incremental costs directly attributable to the issue of new shares or options for the
acquisition of a business are not included in the cost of the acquisition as part of the purchase consideration.
If the entity acquires its own equity instruments, e.g. as the result of a share buy-back, those instruments are
deducted from equity and the associated shares are cancelled. No gain or loss is recognised in the profit or loss
and the consideration paid including any directly attributable incremental costs (net of income taxes) is recognised
directly in equity.
o) Earnings per share
Basic earnings per share is calculated by dividing the profit attributable to equity holders of the Company, excluding
any costs of servicing equity other than ordinary shares, by the weighted average number of ordinary shares
outstanding during the financial year, adjusted for bonus elements in ordinary shares issued during the year.
Diluted earnings per share adjusts the figures used in the determination of basic earnings per share to take into
account the after income tax effect of interest and other financing costs associated with dilutive potential ordinary
PEEL ANNUAL09.indd 28 21/10/09 11:41:22 AM

29Peel exPloration limited AnnuAl RepoRt 2009
notes to the AccountsSeCtion 9
shares and the weighted average number of shares assumed to have been issued for no consideration in relation to
dilutive potential ordinary shares.
p) Goods and services tax
Revenues, expenses and assets are recognised net of goods and services tax (GST), except where the amount of
GST incurred is not recoverable from the taxation authority. In these circumstances the GST is recognised as part
of the cost of acquisition of the asset or as part of the expense item.
Receivables and payables are stated with the amount of GST included. The net amount of GST recoverable is
included as a current asset in the balance sheet.
Cash flows are included in the statement of cash flows on a gross basis. The GST components of cash flows arising
from investing and financing activities which are recoverable from the taxation authority are classified as operating
cash flows.
q) New accounting standards and interpretations
Australian Accounting Standards include AIFRSs. Compliance with AIFRSs ensures that the financial statements of
Peel Exploration Limited comply with International Financial Reporting Standards (IFRSs).
Certain new accounting standards and interpretations have been published that are not mandatory for 30 June
2009 reporting periods. The Group’s assessment of the impact of these new standards and interpretations is set
out below.
(i) AASB 8 Operating Segments and AASB 2007-3 Amendments to Australian Accounting Standards arising from
AASB 8.
Effective for annual reporting period commencing on or after 1 January 2009. AASB 8 will result in a significant
change in the approach to segment reporting, as it requires adoption of a ‘management approach’ to reporting
on financial performance. The information being reported will be based on what the key decision makers use
internally for evaluating segment performance and deciding how to allocate resources to operating segments.
The Group will adopt AASB 8 from 1 July 2009. Application of AASB 8, at this stage, may expand on amounts
disclosed in the financial statements.
(ii) Revised AASB 123 Borrowing Costs and AASB 2007-6 Amendments to Australian Accounting Standards arising
from AASB 123
The revised AASB 123 is applicable to annual reporting periods commencing on or after 1 January 2009. It has
removed the option to expense all borrowing costs and – when adopted – will require the capitalisation of all
borrowing costs directly attributable to the acquisition, construction or production of a qualifying asset. There will
be no impact on the financial statements of the Group as it has no borrowings currently.
(iii) Revised AASB 101 Presentation of Financial Statements and AASB 2007-8 Amendments to Australian
Accounting Standards arising from AASB 101
PEEL ANNUAL09.indd 29 21/10/09 11:41:23 AM

30 Peel exPloration limited AnnuAl RepoRt 2009
notes to the AccountsSeCtion 9
A revised AASB 101 was issued in September 2007 and is applicable for annual reporting periods beginning
on or after 1 January 2009. It requires the presentation of a statement of comprehensive income and makes
changes to the statement of changes in equity, but will not affect any of the amounts recognised in the financial
statements. If an entity has made a prior period adjustment or has reclassified items in the financial statements,
it will need to disclose a third balance sheet (statement of financial position), this one being as at the beginning of
the financial period. The Group intends to apply the revised standard from 1 July 2009.
(iv) AASB 2008-5 Amendments arising from Annual Improvements Project (revised July 2007)
The revised version of this standard provides for a range of presentation, recognition, measurement, terminology
and editorial changes to a wide range of accounting standards. The revised standard is applicable for annual
reporting periods commencing on or after 1 January 2009, and the Group will adopt the revised standard from
that date.
Application should not affect any of the amounts recognised in the financial report, but may require additional
levels of disclosures. The Group will adopt the new standard, together with its consequential changes, for the
financial report dated 30 June 2010.
(v) AASB 127 Consolidated and Separate Financial Statements (reissued March 2008)
The revised standard clarifies that changes in ownership interest which result in control being retained are
accounted for within equity as transactions with owners. The revised standard is applicable for annual reporting
periods commencing on or after 1 July 2009, and the Group will adopt the revised standard from that date.
Application should not affect any of the amounts recognised in the financial report, but may require additional
levels of disclosures. The Group will adopt the new standard, together with its consequential changes, for the
financial report dated 30 June 2010.
(vi) AASB 3 Business Combinations (reissued March 2008)
The revised standard introduces more detailed guidance on accounting for aspects including step acquisitions,
adjustments to contingent consideration, and share-based payments as part of purchase consideration. Also, all
acquisition costs will have to be expensed instead of being recognised as part of goodwill. The revised standard
is applicable for annual reporting periods commencing on or after 1 July 2009, and the Group will adopt the
revised standard from that date.
Application should not affect any of the amounts recognised in the financial report, but may require additional
levels of disclosures. The Group will adopt the new standard, together with its consequential changes, for the
financial report dated 30 June 2010.
No initial application of any other issued and effective Australian Accounting Standard has had any significant effect
on the current period or any prior period. Furthermore, no other new Australian Accounting Standard, which has
been issued but is not yet effective, is expected to have any significant effect on a future reporting period.
PEEL ANNUAL09.indd 30 21/10/09 11:41:23 AM
31Peel exPloration limited AnnuAl RepoRt 2009
2. Financial Risk Management
Overview
The Company and Group have exposure to the following risks from their use of financial instruments:
• Creditrisk(oncashandcashequivalents,andreceivables)
• Liquidityrisk
• Marketrisk(cashflowinterestriskoncashandcashequivalents)
Credit risk
Credit risk is the risk of financial loss to the Group if a customer or counterparty to a financial instrument fails to
meet its contractual obligations, and arises principally from the Group’s receivables from customers and cash and
cash equivalents. The Group manages its credit risk on financial instruments, including cash, by only dealing with
banks licensed to operate in Australia with credit ratings of at least ‘A’ rated.
Trade and other receivables
The Group operates in the mining exploration sector and does not have trade receivables. It is not exposed to credit
risk in relation to trade receivables.
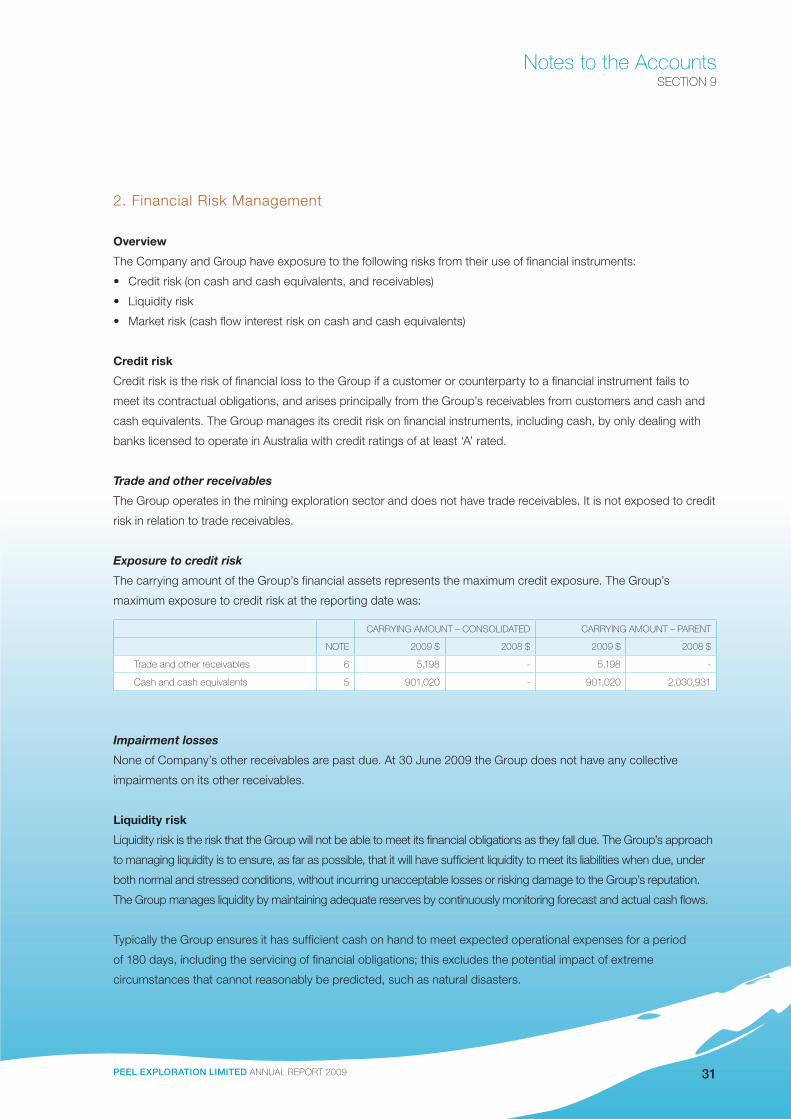
Exposure to credit risk
The carrying amount of the Group’s financial assets represents the maximum credit exposure. The Group’s
maximum exposure to credit risk at the reporting date was:
Impairment losses
None of Company’s other receivables are past due. At 30 June 2009 the Group does not have any collective
impairments on its other receivables.
Liquidity risk
Liquidity risk is the risk that the Group will not be able to meet its financial obligations as they fall due. The Group’s approach
to managing liquidity is to ensure, as far as possible, that it will have sufficient liquidity to meet its liabilities when due, under
both normal and stressed conditions, without incurring unacceptable losses or risking damage to the Group’s reputation.
The Group manages liquidity by maintaining adequate reserves by continuously monitoring forecast and actual cash flows.
Typically the Group ensures it has sufficient cash on hand to meet expected operational expenses for a period
of 180 days, including the servicing of financial obligations; this excludes the potential impact of extreme
circumstances that cannot reasonably be predicted, such as natural disasters.
notes to the AccountsSeCtion 9
cARRyinG Amount – consolidAted cARRyinG Amount – pARent
note 2009 $ 2008 $ 2009 $ 2008 $
trade and other receivables 6 5,198 - 5,198 -
cash and cash equivalents 5 901,020 - 901,020 2,030,931
PEEL ANNUAL09.indd 31 21/10/09 11:41:23 AM

32 Peel exPloration limited AnnuAl RepoRt 2009
notes to the AccountsSeCtion 9
Market risk
Market risk is the risk that changes in market prices, such as interest rates and equity prices will affect the Group’s
income or the value of its holdings of financial instruments. The objective of managing market risk is to manage and
control market risk exposures to within acceptable limits, while optimising returns.
Interest rate risk
Interest rate risk is the risk that the Group’s financial position will be adversely affected by movements in interest
rates that will increase the costs of floating rate debt or opportunity losses that may arise on fixed rate borrowings
in a falling interest rate environment. The Group does not have any borrowings and is, therefore, not exposed to
interest rate risk in this area. Interest rate risk on cash and short term deposits is not considered to be a material
risk due to the short term nature of these financial instruments.
Profile
At the reporting date the interest rate profile of the Group and the Company’s interest-bearing financial instruments was:
Cash flow sensitivity analysis for variable rate instruments
Group
At 30 June 2009 if interest rates had changed +/- 100 basis points from year end rates with all other variables held
constant, equity and post tax profit would have been $8,548 higher/lower (2008: nil).
Parent company
At 30 June 2009 if interest rates had changed +/- 100 basis points from year end rates with all other variables held
constant, equity and post tax profit would have been $8,548 higher/lower (2008: $19,779).
consolidAted pARent compAny
cARRyinG Amount $
contRActuAl cAsH Flows $
6mtHs oR less $
cARRyinG Amount $
contRActuAl cAsH Flows $
6mtHs oR less $
30 June 2009
trade and other payables 103,917 103,917 103,917 108,197 108,197 108,197
30 June 2008
trade and other payables - - - 88,545 - 88,545
Variable rate instruments
consolidAted compAny
cARRyinG 2009 $ Amount 2008 $ cARRyinG 2009 $ Amount 2008 $
short term cash deposits 854,774 - 854,774 1,977,932
PEEL ANNUAL09.indd 32 21/10/09 11:41:23 AM

33Peel exPloration limited AnnuAl RepoRt 2009
Fair values
The carrying values of all financial assets and financial liabilities, as disclosed in the balance sheets, approximate
their fair values.
The Company has tax losses arising in Australia of $1,283,278 (2008: $898,562 restated) that are available
indefinitely for offset against future profits of the Company. No deferred tax asset has been recognised in respect of
these losses at this point in time as the Company is still engaged in exploration activities. In 2008 the Company also
had an unrecognised deferred tax asset in respect of equity raising costs of $28,289 (2008: $11,328).
notes to the AccountsSeCtion 9
4. Income tax consolidAted pARent entity
2009 $ 2008 $ 2009 $ 2008 $
income tax expense
current tax - - - -
deferred tax - - - -
numerical reconciliation of income tax expense to prima facie tax payable:
Accounting loss before income tax (1,334,675) - (1,333,955) (757,648)
At the statutory income tax rate of 30% (2008: 30%) (400,403) - (400,187) (227,294)
expenditure not allowed for income tax purposes:
non-deductible expenses 15,687 - 15,687 13,500
tax loss not brought to account 384,716 - 384,500 213,794
income tax benefit reported in the income statement - - - -
5. Cash and cash equivalents consolidAted pARent entity
2009 $ 2008 $ 2009 $ 2008 $
cash at bank and in hand 46,246 - 46,246 52,998
term deposit with a financial institution 854,774 - 854,774 1,977,932
901,020 - 901,020 2,030,930
6. Trade and other receivables consolidAted pARent entity
2009 $ 2008 $ 2009 $ 2008 $
Gst recoverable from taxation authority 26,035 - 26,035 24,477
interest accrued on term deposits 5,198 - 5,198 -
31,233 - 31,233 24,477
7. Receivables (non-current) consolidAted pARent entity
2009 $ 2008 $ 2009 $ 2008 $
security deposits on mining tenements 80,000 - 80,000 60,000
80,000 - 80,000 60,000
no fair value estimation has been made for these deposits as they are dependent on the periods for which the related mining tenements will be held, which is not determinable at this point in time.
3. Revenue consolidAted pARent entity
2009 $ 2008 $ 2009 $ 2008 $
interest received 98,750 - 98,750 164,472
Expenditure
superannuation 19,442 - 19,442 6,558
operating lease payments 36,000 - 36,000 24,097
PEEL ANNUAL09.indd 33 21/10/09 11:41:23 AM
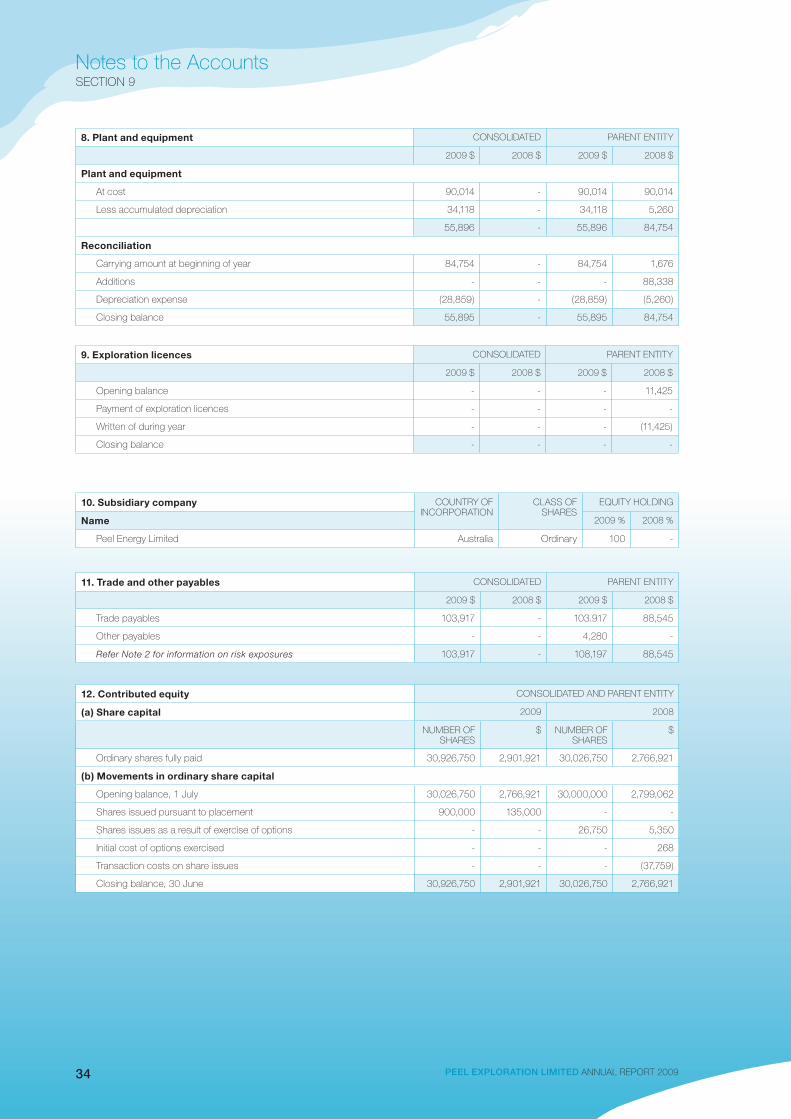
34 Peel exPloration limited AnnuAl RepoRt 2009
notes to the AccountsSeCtion 9
8. Plant and equipment consolidAted pARent entity
2009 $ 2008 $ 2009 $ 2008 $
Plant and equipment
At cost 90,014 - 90,014 90,014
less accumulated depreciation 34,118 - 34,118 5,260
55,896 - 55,896 84,754
Reconciliation
carrying amount at beginning of year 84,754 - 84,754 1,676
Additions - - - 88,338
depreciation expense (28,859) - (28,859) (5,260)
closing balance 55,895 - 55,895 84,754
9. Exploration licences consolidAted pARent entity
2009 $ 2008 $ 2009 $ 2008 $
opening balance - - - 11,425
payment of exploration licences - - - -
written of during year - - - (11,425)
closing balance - - - -
11. Trade and other payables consolidAted pARent entity
2009 $ 2008 $ 2009 $ 2008 $
trade payables 103,917 - 103.917 88,545
other payables - - 4,280 -
refer note 2 for information on risk exposures 103,917 - 108,197 88,545
12. Contributed equity consolidAted And pARent entity
(a) Share capital 2009 2008
numbeR oF sHARes
$ numbeR oF sHARes
$
ordinary shares fully paid 30,926,750 2,901,921 30,026,750 2,766,921
(b) Movements in ordinary share capital
opening balance, 1 july 30,026,750 2,766,921 30,000,000 2,799,062
shares issued pursuant to placement 900,000 135,000 - -
shares issues as a result of exercise of options - - 26,750 5,350
initial cost of options exercised - - - 268
transaction costs on share issues - - - (37,759)
closing balance, 30 june 30,926,750 2,901,921 30,026,750 2,766,921
10. Subsidiary company countRy oF incoRpoRAtion
clAss oF sHARes
equity HoldinG
Name 2009 % 2008 %
peel energy limited Australia ordinary 100 -
PEEL ANNUAL09.indd 34 21/10/09 11:41:23 AM

35Peel exPloration limited AnnuAl RepoRt 2009
notes to the AccountsSeCtion 9
13. Reserves consolidAted pARent entity
2009 $ 2008 $ 2009 $ 2008 $
(i) Accumulated losses
opening balance 1 july (1,172,536) - (1,172,536) (414,888)
loss for the year (1,334,675) - (1,333,955) (757,648)
closing balance, 30 june (2,507,211) - (2,506,491) (1,172,536)
(ii) Share-based payments reserve
opening balance, 1 july 517,232 - 517,232 322,500
option expenses (director options) 52,290 - 52,290 -
option expenses (payment on shareholder options) - - - 149,732
option expenses (employee options) - - - 45,000
closing balance, 30 june 569,522 - 569,522 517,232
Nature and purpose of reservethe share-based payment reserve represents the fair value of equity benefits provided to directors and employees as part of their remuneration for services provided to the company paid for by the issue of equity.
Share options and reserve movements consolidAted pARent entity
2009 $ 2008 $ 2009 $ 2008 $
opening balance, 1 July 30,573,250 517,232 15,000,000 322,500
issued to director 1,000,000 52,290 - -
issued to shareholders - - 15,000,000 150,000
issued to employees - - 600,000 45,000
options exercised during year - - (26,750) (268)
closing balance, 30 june 31,573,250 569,522 30,573,250 517,232
- exercisable at 20 cents each on or before 30 november 2010 22,473,250 - 22,473,250
- exercisable at 30 cents each on or before 30 november 2010 7,500,000 - 7,500,000
- exercisable at 25 cents each on or before 30 november 2010 600,000 - 600,000
- exercisable at 30 cents each on or before 30 April 2011 1,000,000 - -
31,573,250 - 31,573,250
(c) ordinary shares
ordinary shares entitle the holder to participate in dividends and the proceeds on winding up of the company in proportion to the number of and amounts paid on the shares held.on a show of hands every holder of ordinary shares present at a meeting in person or by proxy, is entitled to one vote, and upon a poll each share is entitled to one vote.
(d) options
information relating to options issued during the year is set out in note 13.
(e) capital risk management
in employing its capital (or equity as it is referred to on the balance sheet) the company seeks to ensure that it will be able to continue as a going concern and in time provide value to shareholders by way of increased market capitalisation or dividends. in the current stage of its development, the company has invested its available capital in acquiring and exploring mining tenements. As is appropriate at this stage, the company is funded entirely by equity.As it moves forward to develop its tenements towards a production stage, the company will adjust its capital structure to support its operational and strategic objectives, by raising additional capital or taking on debt, as is seen to be appropriate from time to time given the overriding objective of creating shareholder value. in this regard, the board will consider each step forward in the development of the company on its merits and in the context of the then capital markets, in deciding how to structure capital raisings.
PEEL ANNUAL09.indd 35 21/10/09 11:41:24 AM

36 Peel exPloration limited AnnuAl RepoRt 2009
notes to the AccountsSeCtion 9
14. Remuneration consolidAted pARent entity
2009 $ 2008 $ 2009 $ 2008 $
Amounts paid or due and payable to the auditors bdo Kendalls for:
Auditing or reviewing the financial report 39,859 - 39,859 15,736
other services – consulting - - - 10,463
39,859 - 39,859 26,199
15. Contingenciesthe consolidated entity had no contingent assets or liabilities for the years ended 30 june 2009 and 2008.
16. Expenditure commitments
under the terms of mineral tenement licences held by the company, minimum annual expenditure obligations are required to be expended during the forthcoming financial year in order for the tenements to maintain a status of good standing. this expenditure may be subject to variation from time to time in accordance with department of industry and Resources regulations.expenditure commitments contracted for at the reporting date but not recognised as liabilities are as follows:
consolidAted pARent entity
2009 $ 2008 $ 2009 $ 2008 $
within one year 303,000 - 303,000 154,640
later than one year but not later than five years 305,000 - 305,000 361,740
later than five years - - - -
608,000 - 608,000 516,380
17. Segment Informationthe consolidated entity operates predominantly in one business and geographical segment, being mineral exploration in Australia, and all of the assets of the consolidated entity are deployed for these purposes.
18. Related partiesTransactions with related parties
during the year there were no transactions with related parties other than the transactions shown in note 22.
Model inputs for employee options granted during the year ended 30 June 2008 included:
underlying security spot price $0.160
exercise price $0.30
dividend rate nil
standard deviation of returns (annualised) 75%
Risk free rate 6.97%
valuation date 20 october 2008
expiration date 30 April 2011
expiration period (years) 2.53
black scholes valuation ($ per security) 0.05
binomial valuation ($ per security) 0.05
the expected life of the options is based on historical data and is not necessarily indicative of exercise patterns that may occur. the expected volatility reflects the assumption that the historical volatility is indicative of future trends, which may also nor necessarily be the actual outcome. no other features of options granted were incorporated into the measurement of fair value.
PEEL ANNUAL09.indd 36 21/10/09 11:41:24 AM

37Peel exPloration limited AnnuAl RepoRt 2009
notes to the AccountsSeCtion 9
19. Events occurring after the Balance Sheet dateNon-renounceable entitlement issue
A prospectus for a pro-rata non-renounceable entitlement issue of one new share for every three shares held by shareholders at an issue price of 10 cents to raise approximately $1,030,892 was despatched by the company to shareholders on 7 september 2009. the closing date of the offer is 25 september 2009. At that date the company had received acceptances for 3,293,400 shares raising $329,340.
Acquisition of new mining lease the company has announced the details of a conditional agreement to acquire a 100% interest in the may day gold and base metal deposit from imperial corporation ltd. the agreement is conditional on completion of due diligence investigations and the renewal of mining lease 1361. consideration for the acquisition is 2,750,000 fully paid ordinary shares in peel exploration limited.other than as disclosed above there has not arisen in the interval between the end of financial year and the date of this report any other item, transaction or event of a material or unusual nature, which is likely in the opinion of the directors, to affect substantially the operation of the consolidated entity, the result of those operations and the state of affairs of the consolidated entity in the financial year subsequent to 30 june 2009.
20. Reconciliation of the cash flows from operating activities to loss after income tax
consolidAted pARent entity
2009 $ 2008 $ 2009 $ 2008 $
net cash outflow from operating activities (1,244,910) - (1,244,910) (635,2443)
share-based payments (52,290) - (52,290) (45,000)
depreciation (28,858) - (28,858) (5,260)
exploration licence fees written off - - - (11,425)
changes in operating assets and liabilities
increase in receivables 6,755 - 6,755 1,628
decrease/(increase) in payables (15,372) - (15,372) (62,348)
loss after income tax (1,334,675) - (1,333,955) (757,648)
21. Earning per share consolidAted
Basic earnings per share 2009 $ 2008 $
loss for the year attributable to the ordinary equity holders of the company (0.04) (0.02)
Reconciliation of loss used in calculation of earnings per share 2009 $ 2008 $
loss used in calculating basic loss per share (1,334,675 (757,648)
Weighted average number of shares used as the denominator consolidAted
numbeR oF sHARes
2009
numbeR oF sHARes
2008
weighted average number of shares used in calculating basic earnings per share 30,926,750 30,018,322
Effect of dilutive securitiesoptions on issue at balance date could potentially dilute earnings per share in the future. the effect in the current year is to reduce the loss per share hence they are considered anti-dilutive. Accordingly diluted loss per share has not been disclosed.
22. Key Management Personnel Disclosures consolidAted pARent entity
2009 $ 2008 $ 2009 $ 2008 $
(a) Compensation of key management personnel
short-term employee benefits 254,325 168,757 254,325 168,757
post-employment benefits 22,889 12,231 22,889 12,231
long-term benefits - - - -
share-based payments 52,290 15,000 52,290 15,000
329,504 195,988 329,504 195,988
(b) Shares issued on exercise of compensation options
there were no shares issued on exercise of compensation options during the year.
PEEL ANNUAL09.indd 37 21/10/09 11:41:24 AM

38 Peel exPloration limited AnnuAl RepoRt 2009
notes to the AccountsSeCtion 9
(c) Option holdings of key management personnel
30 june 2009
bAlAnce At tHe stARt oF
tHe yeAR
GRAnted As compensAtion
GRAnted As sHAReHoldeRs exeRcised
bAlAnce At end oF tHe
yeAR
vested And exeRcisAble unvested
Directors
R m tyson 5,122,874 - - - 5,122,874 5,122,874 -
s Hadfield 4,722,873 - - - 4,722,873 4,722,873 -
c mcGown - 1,000,000 - - 1,000,000 1,000,000
Executives
d Hocking 200,000 - - - 200,000 200,000 -
all vested options are exercisable at the end of the year.
(d) Share holdings of key management personnel as at 30 June 2009Shares in Peel Exploration Limited (number)
30 june 2009
bAlAnce At 1 july 2008
Received duRinGtHe yeAR on tHe
exeRcise oF options
otHeR cHAnGesduRinG tHe yeAR
bAlAnce At30 june 2009
Directors
R m tyson 2,598,750 - 46,000 2,644,750
s Hadfield 2,100,000 - - 2,100,000
Executives
d Hocking - - - -
of the balance at 30 June 2009, the amounts held nominally in respect of each director are: r tyson 2,100,000 and s hadfield 1,100,000.
(e) Share holdings of key management personnel as at 30 June 2008Shares in Peel Exploration Limited (number)
30 june 2008
bAlAnce At 1 july 2007
Received duRinGtHe yeAR on tHe
exeRcise oF options
otHeR cHAnGesduRinG tHe yeAR
bAlAnce At30 june 2008
Directors
R m tyson 2,500,000 - 98,750 2,598,750
m l Kiernan 3,000,000 - - 3,000,000
s Hadfield 2,100,000 - - 2,100,000
Executives
d Hocking - - - -
30 june 2008
bAlAnce At tHe stARt oF
tHe yeAR
GRAnted As compensAtion
GRAnted As sHAReHoldeRs exeRcised
bAlAnce At end oF tHe
yeAR
vested And exeRcisAble unvested
Directors
R m tyson 3,750,000 - 1,372,874 - 5,122,874 5,122,874 -
m l Kiernan 4,000,000 - 1,622,874 - 5,622,874 5,622,874 -
s Hadfield 3,550,000 - 1,172,873 - 4,722,873 4,722,873 -
Executives
d Hocking - 200,000 - - 200,000 100,000 100,000
all vested options are exercisable at the end of the year.
PEEL ANNUAL09.indd 38 21/10/09 11:41:24 AM
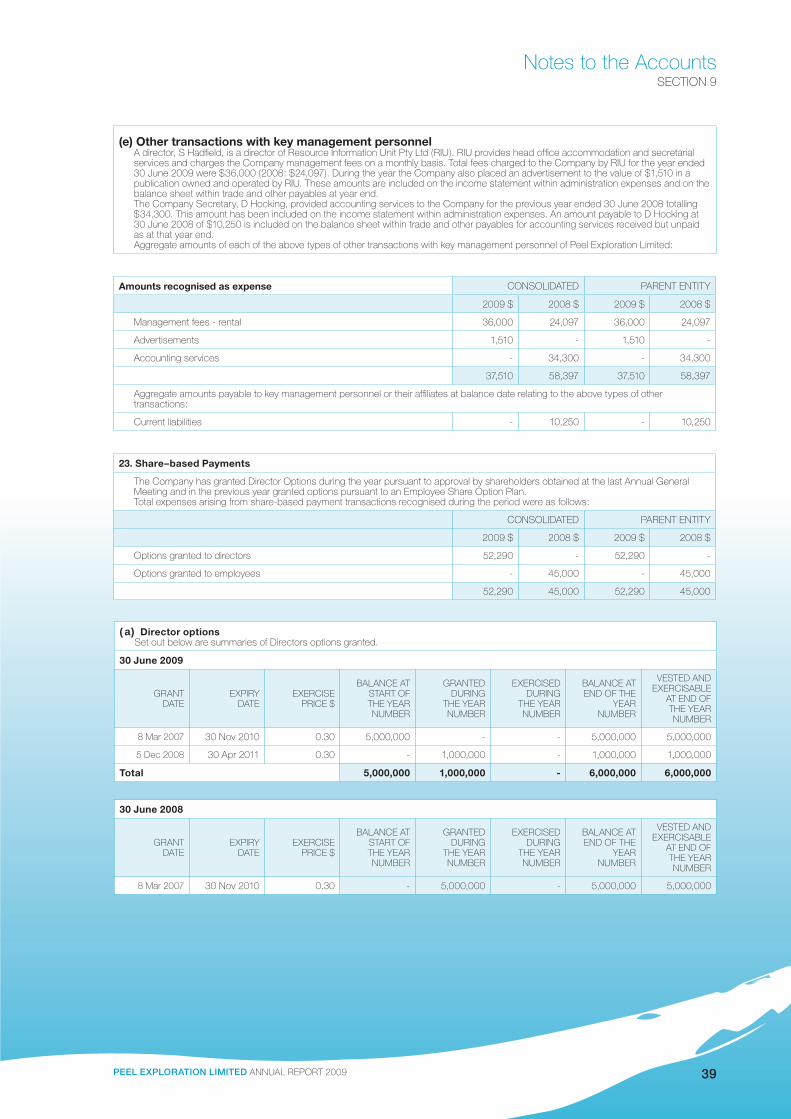
39Peel exPloration limited AnnuAl RepoRt 2009
(e) Other transactions with key management personnelA director, s Hadfield, is a director of Resource information unit pty ltd (Riu). Riu provides head office accommodation and secretarial services and charges the company management fees on a monthly basis. total fees charged to the company by Riu for the year ended 30 june 2009 were $36,000 (2008: $24,097). during the year the company also placed an advertisement to the value of $1,510 in a publication owned and operated by Riu. these amounts are included on the income statement within administration expenses and on the balance sheet within trade and other payables at year end.the company secretary, d Hocking, provided accounting services to the company for the previous year ended 30 june 2008 totalling $34,300. this amount has been included on the income statement within administration expenses. An amount payable to d Hocking at 30 june 2008 of $10,250 is included on the balance sheet within trade and other payables for accounting services received but unpaid as at that year end.Aggregate amounts of each of the above types of other transactions with key management personnel of peel exploration limited:
Amounts recognised as expense consolidAted pARent entity
2009 $ 2008 $ 2009 $ 2008 $
management fees - rental 36,000 24,097 36,000 24,097
Advertisements 1,510 - 1,510 -
Accounting services - 34,300 - 34,300
37,510 58,397 37,510 58,397
Aggregate amounts payable to key management personnel or their affiliates at balance date relating to the above types of other transactions:
current liabilities - 10,250 - 10,250
23. Share–based Payments
the company has granted director options during the year pursuant to approval by shareholders obtained at the last Annual General meeting and in the previous year granted options pursuant to an employee share option plan.total expenses arising from share-based payment transactions recognised during the period were as follows:
consolidAted pARent entity
2009 $ 2008 $ 2009 $ 2008 $
options granted to directors 52,290 - 52,290 -
options granted to employees - 45,000 - 45,000
52,290 45,000 52,290 45,000
(a) Director optionsset out below are summaries of directors options granted.
30 June 2009
GRAnt dAte
expiRy dAte
exeRcise pRice $
bAlAnce At stARt oF tHe yeARnumbeR
GRAnted duRinG
tHe yeARnumbeR
exeRcised duRinG
tHe yeARnumbeR
bAlAnce At end oF tHe
yeARnumbeR
vested And exeRcisAble
At end oF tHe yeARnumbeR
8 mar 2007 30 nov 2010 0.30 5,000,000 - - 5,000,000 5,000,000
5 dec 2008 30 Apr 2011 0.30 - 1,000,000 - 1,000,000 1,000,000
Total 5,000,000 1,000,000 - 6,000,000 6,000,000
30 June 2008
GRAnt dAte
expiRy dAte
exeRcise pRice $
bAlAnce At stARt oF tHe yeARnumbeR
GRAnted duRinG
tHe yeARnumbeR
exeRcised duRinG
tHe yeARnumbeR
bAlAnce At end oF tHe
yeARnumbeR
vested And exeRcisAble
At end oF tHe yeARnumbeR
8 mar 2007 30 nov 2010 0.30 - 5,000,000 - 5,000,000 5,000,000
notes to the AccountsSeCtion 9
PEEL ANNUAL09.indd 39 21/10/09 11:41:25 AM

40 Peel exPloration limited AnnuAl RepoRt 2009
notes to the AccountsSeCtion 9
(b) Employee option planoptions over shares in peel exploration limited may be granted under the peel exploration limited employee option plan which was created in june 2008 and approved by shareholders at annual general meeting. the employee option plan is designed to provide long-term incentives for employees to deliver long-term shareholder returns. under the plan, participants are granted options 50% of which vest immediately and the remainder vest after twelve months provided the employees are still employed by the company at the end of the vesting period. participation in the plan is at the board’s discretion and no individual has a contractual right to participate in the plan or to receive any guaranteed benefits. options granted under the plan carry no dividend or voting rights.when exercisable, each option is convertible into one ordinary share at an exercise price of 25 cents.set out below are summaries of options granted under the plan.
30 June 2009
GRAnt dAte
expiRy dAte
exeRcise pRice $
bAlAnce At stARt oF tHe yeARnumbeR
GRAnted duRinG
tHe yeARnumbeR
exeRcised duRinG
tHe yeARnumbeR
bAlAnce At end oF tHe
yeARnumbeR
vested And exeRcisAble
At end oF tHe yeARnumbeR
23 jun 2008 30 nov 2010 0.25 600,000 - - 600,000 600,000
30 June 2008
GRAnt dAte
expiRy dAte
exeRcise pRice $
bAlAnce At stARt oF tHe yeARnumbeR
GRAnted duRinG
tHe yeARnumbeR
exeRcised duRinG
tHe yeARnumbeR
bAlAnce At end oF tHe
yeARnumbeR
vested And exeRcisAble
At end oF tHe yeARnumbeR
23 jun 2008 30 nov 2010 0.25 - 600,000 - 600,000 600,000
Fair value of director options grantedoptions are granted for no consideration. the fair value of options granted during the year was $0.0523 (2008: $0.075). the value was calculated using the black-scholes binominal option valuation method applying the following inputs:
underlying security spot price $0.160
exercise price $0.30
dividend rate nil
standard deviation of returns (annualised) 75%
Risk free rate 6.97%
valuation date 20 october 2008
expiration date 30 April 2011
expiration period (years) 2.53
black scholes valuation ($ per security) 0.0523
binomial valuation ($ per security) 0.0523
Fair value of director options grantedoptions are granted for no consideration. the fair value of options granted during the year was $0.0523 (2008: $0.075). the value was calculated using the black-scholes binominal option valuation method applying the following inputs:
underlying security spot price $0.185
exercise price $0.25
dividend rate nil
standard deviation of returns (annualised) 75%
Risk free rate 6.97%
valuation date 23 june 2008
expiration date 30 november 2010
expiration period (years) 2.438
black scholes valuation ($ per security) 0.0750
binomial valuation ($ per security) 0.0750
PEEL ANNUAL09.indd 40 21/10/09 11:41:25 AM

41Peel exPloration limited AnnuAl RepoRt 2009
SeCtion 10
Directors’ Declaration
The Board of Directors of Peel Exploration Limited declares that:
(a) the financial statements, comprising the income statement, balance sheet, cash flow statement, statement of
changes in equity, accompanying notes are in accordance with the Corporations Act 2001 and:
(i) comply with Accounting Standards and the Corporations Regulations 2001; and
(ii) give a true and fair view of the financial position as at 30 June 2009 and performance for the financial year
ended on that date of the company and the consolidated entity.
(b) In the directors’ opinion, there are reasonable grounds to believe that the Company will be able to pay its debts
as and when they become due and payable;
(c) the remuneration disclosures set out in pages 13 to 20 of the directors’ report (as part of the audited
Remuneration Report), for the year ended 30 June 2009, comply with section 300A of the Corporations Act
2001; and
(d) the Board Of Directors have been given the declaration by the chief executive officer and chief financial officer
required by Section 295A of the Corporations Act 2001
This declaration is made in accordance with a resolution of the Board of Directors and is signed for and on behalf of
the directors by:
S. Hadfield
Chairman of Directors
Perth
30 September 2009
PEEL ANNUAL09.indd 41 21/10/09 11:41:25 AM

42 Peel exPloration limited AnnuAl RepoRt 2009
Auditor’s independence Declaration
SeCtion 11
PEEL ANNUAL09.indd 42 21/10/09 11:41:29 AM

43Peel exPloration limited AnnuAl RepoRt 2009
independent Auditor’s Report
SeCtion 12
PEEL ANNUAL09.indd 43 21/10/09 11:41:34 AM

44 Peel exPloration limited AnnuAl RepoRt 2009
independent Auditor’s ReportSeCtion 12
PEEL ANNUAL09.indd 44 21/10/09 11:41:38 AM

45Peel exPloration limited AnnuAl RepoRt 2009
Corporate Governance StatementA description of the Company’s main corporate governance practices is set out below. These practices, unless
otherwise stated, were adopted on 20th March 2007. Copies of relevant corporate governance policies are available
in the corporate governance section of the Company’s web-site at www.peel.com.au.
Board of Directors
The Board is responsible for guiding and monitoring the Company on behalf of shareholders by whom they are
elected and to whom they are accountable. The Board’s primary responsibility is to oversee the Company’s
business activities and management for the benefit of shareholders. Day to day management of the Company’s
affairs and the implementation of corporate strategies and policy initiatives are formally delegated by the Board to
the Managing Director and senior executives, as set out in the Company’s Board charter.
Board composition
The Board charter states that:
• theBoardistocompriseanappropriatemixofbothexecutiveandnon-executivedirectors.
• therolesofChairmanandManagingDirectorwillnotbecombined.
• theChairmaniselectedbythefullBoardandisrequiredtomeetregularlywiththeManagingDirector.
Board members should possess complementary business disciplines and experience aligned with the Company’s
objectives, with a number of directors being independent and where appropriate, major shareholders being
represented on the Board. Consequently, at various times there may not be a majority of directors classified as
being independent, according to ASX guidelines. However, where any director has a material personal interest in a
matter, the director will not be permitted to be present during discussions or to vote on the matter.
Directors’ independence
The experience, qualifications and term of office of directors are set out in the Directors’ Report. The Board
comprises three directors one of whom is considered independent under the principles set out below. Having
regard to the share ownership structure of the Company, it is considered appropriate by the Board that a major
shareholder may be represented on the Board and if nominated, hold the position of Chairman. Such appointment
would not be deemed to be independent under ASX guidelines. The Chairman is expected to bring independent
thought and judgement to his role in all circumstances. Where matters arise in which there is a perceived conflict of
interest, the Chairman must declare his interest and abstain from any consideration or voting on the relevant matter.
Mr Craig McGown who is a non-executive director and does not hold shares in the Company is an independent
director under the ASX recommended principles in relation to the assessment of the independence of directors.
Directors have the right, in connection with their duties and responsibilities, to seek independent professional advice
at the Company’s expense, subject to the prior written approval of the Chairman, which shall not be unreasonably
withheld.
SeCtion 13
PEEL ANNUAL09.indd 45 21/10/09 11:41:38 AM

46 Peel exPloration limited AnnuAl RepoRt 2009
Corporate Governance StatementSeCtion 13
Performance assessment
The Board has adopted a formal process for an annual self assessment of its collective performance and the
performance of individual directors. The Board is required to meet annually with the purpose of reviewing the role
of the Board, assessing its performance over the previous 12 months and examining ways in which the Board can
better perform its duties. A formal assessment was undertaken during the year, using a self-assessment checklist
as the basis for evaluation of performance against the requirements of the Board charter.
Corporate reporting
The Managing Director and Chief Financial Officer provide a certification to the Board on the integrity of the
Company’s external financial reports. The Board does not specifically require an additional certification that the
financial statements are founded on a sound system of risk management and that compliance and control systems
are operating efficiently and effectively. The Board considers that risk management and internal compliance and
control systems are sufficiently robust for the Board to place reliance on the integrity of the financial statements
without the need for an additional certification by management.
The company has established policies for the oversight and management of material business risk.
Board Committees
Whist at all times the Board retains full responsibility for guiding and monitoring the Company, in discharging
its stewardship makes use of committees. To this end the Board has established or may establish the following
committees:
• Auditcommittee;
• Nominationcommittee;and
• Remunerationcommittee.
At present the board has deemed the Company’s current size does not sufficiently warrant the establishment of the
above-mentioned committees; however the Board will continually re-evaluate this position as necessary. If or when
these committees are established, each will have its own written charter. Matters determined by the committees
will be submitted to the full Board as recommendations for Board consideration. If or when an audit committee is
established, the committee will oversee accounting and reporting practices and will also be responsible for:
• Co-ordinationandappraisalofthequalityoftheauditsconductedbytheCompany’sexternalauditors;
• Determinationoftheindependenceandeffectivenessoftheexternalauditors;
• Assessmentofwhethernon-auditserviceshavethepotentialtoimpairtheindependenceoftheexternalauditor;
• ReviewingtheadequacyofthereportingandaccountingcontrolsoftheCompany.
If or when a remuneration committee is established, the remuneration committee will review all remuneration
policies and practices for the Company, including overall strategies in relation to executive remuneration policies
and compensation arrangements for the Managing Director and Non-Executive Directors, as well as all equity
based remuneration policies.
PEEL ANNUAL09.indd 46 21/10/09 11:41:38 AM

47Peel exPloration limited AnnuAl RepoRt 2009
Details of the Company’s current remuneration policies are set out in the Remuneration Report section of the
Directors’ Report. The remuneration policy states that executive directors may participate in share option schemes
with the prior approval of shareholders. Executives may also participate in employee share option schemes, with
any option issues generally being made in accordance with thresholds set in plans approved by shareholders. The
Board however, considers it appropriate to retain the flexibility to issue options to executives outside of approved
employee option plans in appropriate circumstances.
The responsibility for the selection of potential directors and to review membership lies with the full Board of the
Company and consequently no separate nomination committee has been established. In circumstances where
the size of the Board is expanded as a result of the growth or complexity of the Company, the establishment of a
separate nomination committee will be reconsidered.
External Auditors
The performance of the external auditor is reviewed annually. BDO Kendalls were appointed as the external auditors
in 2006. It is both the Company’s and BDO Kendall’s policy to rotate audit engagement partners at least every five
years and the review partner every five years.
The external auditors provide an annual declaration of their independence to the Board. The external auditor is
requested to attend annual general meetings and be available to answer shareholder questions about the conduct
of the audit and the preparation and content of the audit report.
Code of Conduct
A formal code of conduct for the Company applies to all directors and employees. The code aims to encourage
the appropriate standards of conduct and behaviour of the directors, officers, employees and contractors of
the Company. All personnel are expected to act with integrity and objectivity, striving at all times to enhance the
reputation and performance of the Company.
Trading in the Company’s securities by directors and senior executives is not permitted in the two months
immediately preceding the release of the Company’s annual and half-year financial results. Any transactions to be
undertaken must be notified to the Chairman or Managing Director in advance.
Continuous Disclosure and Shareholder Communications
The Company has a formal written policy for the continuous disclosure of any price sensitive information
concerning the Company. The Board has also adopted a formal written policy covering arrangements to promote
communications with shareholders and to encourage effective participation at general meetings.
The Managing Director and Company Secretary have been nominated as the Company’s primary disclosure
officers. All information released to the ASX is posted on the Company’s web-site immediately after it is disclosed to
the ASX. When analysts are briefed on aspects on the Company’s operations, the material used in the presentation
is released to the ASX and posted on the Company’s web-site. All shareholders receive a copy of the Company’s
annual report. In addition, the Company makes all market announcements, media briefings, details of shareholders
meetings, press releases and financial reports available on the Company’s web-site.
Corporate Governance StatementSeCtion 13
PEEL ANNUAL09.indd 47 21/10/09 11:41:38 AM

48 Peel exPloration limited AnnuAl RepoRt 2009
SeCtion 14
Shareholder informationInformation relating to shareholders at 22 September 2009
Distribution of Shareholders
RAnGe no. oF HoldeRs no. oRd sHARes %
1 - 1,000 - - -
1,001 - 5,000 27 88,583 0.29
5,001 - 10,000 91 872,993 2.82
10,001 - 100,000 291 9,221,299 29.82
100,001 - 9,999,999 29 20,743,875 67.07
total 438 30,027,000 100.00
Twenty Largest Shareholders
HoldeR no. oRd sHARes %
1 stiRlinG tunGsten pty ltd 3,900,000 12.61
2 lAuRence jAmes KieRnAn 3,000,000 9.70
3 RobeRt mAclAine tyson 2,100,000 6.79
4 lisA dupeRouzel 1,600,000 5.17
5 lindA sAlA tennA 1,487,000 4.81
6 sAlAmAR pty ltd 1,100,000 3.56
7 simon HAdField 1,000,000 3.23
8 Anz nominees limited 626,010 2.02
9 blue cRystAl pty ltd 610,000 1.97
10 KAtAnA Asset mAnAGement ltd 500,000 1.62
11 Ron & liz nominees pty ltd (RonAld jAmes supeR Fund A/c) 450,000 1.46
12 Kb33 cApitAl pty ltd 425,000 1.37
13 joRdAn And Flynn tyson 400,000 1.29
14 Rodney m jones + cARol R jones (HopeRidGe enteRpRises pty ltd supeR A/c) 325,000 1.05
15 HopeRidGe enteRpRises pty ltd (jones FAmily A/c) 300,000 0.97
16 scott pAul jones + Rodney mAlcolm jones + cARol Robin jones (scopA FAmily A/c) 300,000 0.97
17 wondeR HoldinGs pty ltd 290,000 0.94
18 stepHen j lAmbeRt + RutH l lAmbeRt + simon l lAmbeRt (lAmbeRt RetiRement A/c) 275,000 0.89
19 pAul HoddeR + jAmes RAmsAy + dAniel FosteR (deltA blue investments A/c) 250,000 0.81
20 mAj pty ltd (wAllAce supeR Fund A/c) 250,000 0.81
19,188,910 62.05
PEEL ANNUAL09.indd 48 21/10/09 11:41:38 AM

49Peel exPloration limited AnnuAl RepoRt 2009
Shareholder informationSeCtion 14
Distribution of Optionholders
RAnGe no. oF HoldeRs options %
1 - 1,000 4 2,750 0.01
1,001 - 5,000 68 312,135 1.39
5,001 - 10,000 129 1,069,571 4.76
10,001 - 100,000 108 3,552,294 15.81
100,001 - 9,999,999 23 17,536,500 78.03
total 332 22,473,250 100.00
Twenty Largest Optionholders
HoldeR options %
1 cRAwley investments pty ltd 3,122,874 13.90
2 lAuRence jAmes KieRnAn 3,122,874 13.90
3 RobeRt mAclAine tyson 2,222,874 9.89
4 lisA dupeRouzel 1,550,000 6.90
5 lindA sAlA tennA 1,537,500 6.84
6 sAlAmAR pty ltd 1,222,873 5.44
7 simon HAdField 1,000,000 4.45
8 joRdAn + Flynn tyson 400,000 1.78
9 Kb33 cApitAl pty ltd (cHARity A/c) 362,500 1.61
10 HopeRidGe enteRpRises pty ltd (jones FAmily A/c) 350,000 1.56
11 KAtAnA Asset mAnAGement ltd 350,000 1.56
12 blue cRystAl pty ltd 325,000 1.45
13 Anz nominees limited 302,505 1.35
14 pAul HoddeR + jAmes RAmsAy + dAniel FosteR (deltA blue investments A/c) 300,000 1.33
15 Ron & liz nominees pty ltd (RonAld jAmes supeR Fund A/c) 225,000 1.00
16 dR RosemARy elizAbetH Anne GReen 177,500 0.79
17 scott p jones + Rodney m jones + cARol R jones (scopA FAmily A/c) 150,000 0.67
18 wondeR HoldinGs pty ltd 145,000 0.65
19 GRAtitude HoldinGs pty ltd (swARts investment A/c) 135,000 0.60
20 mAj pty ltd (wAllAce supeR Fund A/c) 125,000 0.56
17,126,500 76.21
Substantial Shareholders
HoldeR no. oRd sHARes %
1 stiRlinG tunGsten pty ltd 3,900,000 12.6
2 mR lAuRence jAmes KieRnAn 3,000,000 9.7
3 mR RobeRt mAclAine tyson 2,598,750 8.4
4 mR simon HAdField 2,100,000 7.0
5 ms lisA dupeRouzel 1,600,000 5.2
6 mRs lindA sAlA tennA 1,487,900 4.8
At the prevailing market price of $0.14 per share there were seventeen shareholders with less than a marketable parcel of $500 at 22 september 2009.
PEEL ANNUAL09.indd 49 21/10/09 11:41:39 AM

50 Peel exPloration limited AnnuAl RepoRt 2009
At the prevailing price of $0.02 per Option there were two hundred and seventy two Option holders with less than a
marketable parcel of $500 at 22 September 2009.
At 23 September 2009 there were 438 holders of ordinary shares in the Company.
At the date of this report there were no shares or options restricted by the ASX.
Voting Rights
The voting rights attaching to the ordinary shares, set out in Clause 12.11 of the Company’s Constitution are:
“Subject to any rights or restrictions for the time being attached to any class or classes of Shares, at meetings of
Shareholders or classes of Shareholders:
(a) each Shareholder entitled to vote may vote in person or by proxy, attorney or Representative;
(b) on a show of hands, every person present who is a Shareholder or a proxy, attorney or Representative od a
Shareholder has one vote; and
(c) on a poll, every person present who is a Shareholder or a proxy, attorney or Representative of a Shareholder
shall, in respect of each fully paid Share held by him, or in respect of which he is appointed a proxy, attorney
or Representative, have one vote for the Share, but in respect of partly paid Shares, shall have such number of
votes being equivalent to the proportion which the amount paid (not credited) is of the total amounts paid and
payable in respect of those Shares (excluding amounts credited)”
Statement under ASX Listing Rule 4.10.19
From the date of admission of the Company’s shares on ASX (17 May 2007) to the date of this Annual Report, the
Company has used the cash and assets in a form readily convertible to cash that it had at the time of admission in a
way consistent with its business objectives. Expenditures have been in line with Prospectus estimates.
Shareholder informationSeCtion 14
PEEL ANNUAL09.indd 50 21/10/09 11:41:39 AM

Peel exPloration limited AnnuAl RepoRt 2009
PEEL ANNUAL09 COVER.indd 53 21/10/09 11:44:43 AM

www.peelex.com.au
peel exploration limited ABN 42 119 343 734
telephone (08) 9382 3955 level 1, 79 hay street, subiaco, western australia 6008
PEEL ANNUAL09 COVER.indd 54 21/10/09 11:44:33 AM