2008 2q earnings releaselgepr.lge.com/upload/press/2008/2q08 earnings eng fin… · ·...
TRANSCRIPT

0July 21st 2008
2008 2Q Earnings Release

1
All information regarding management performance and financial results of LG Electronics (the “Company”) during the 2nd
quarter of 2008 as contained herein has been prepared on a parent and consolidated basis in accordance with Korean Generally Accepted Accounting Principles (Korean GAAP).
In addition, the information contained herein has been prepared in advance, prior to being audited by outside auditors, solely for the convenience of investors of the Company, and is subject to change in the process of final auditing by outside auditors.
The information contained herein includes forward-looking statements in respect to future plans, prospects, and performances of the Company as well as the Company’s projected sales plan for the 3rd quarter of 2008 and the rest of the year. These forward-looking statements also refer to the Company’s performance on both parent and consolidated base, as indicated.
The aforementioned forward-looking statements are influenced by changes in the management environment and relative events, and by their nature, these statements refer to uncertain circumstances. Consequently, due to these uncertainties, the Company’s actual future results may differ materially from those expressed or implied by such statements.
Please note that as the forward-looking statements contained herein are based on the current market situation and the Company’s management direction, they are subject to change according to the changes in future market environment and business strategy.
The information contained herein should not be utilized for any legal purposes in regards to investors’ investment results. The Company hereby expressly disclaims any and all liability for any loss or damage resulting from the investors’ reliance on the information contained herein.

2
Table of Contents
Ⅰ. 2008 2Q Results (Consolidated)
Ⅱ. Performance and Outlook by Sector
Ⅲ. 2008 2Q Results (Parent)
Ⅳ. 3Q Business Direction and Prospects
3
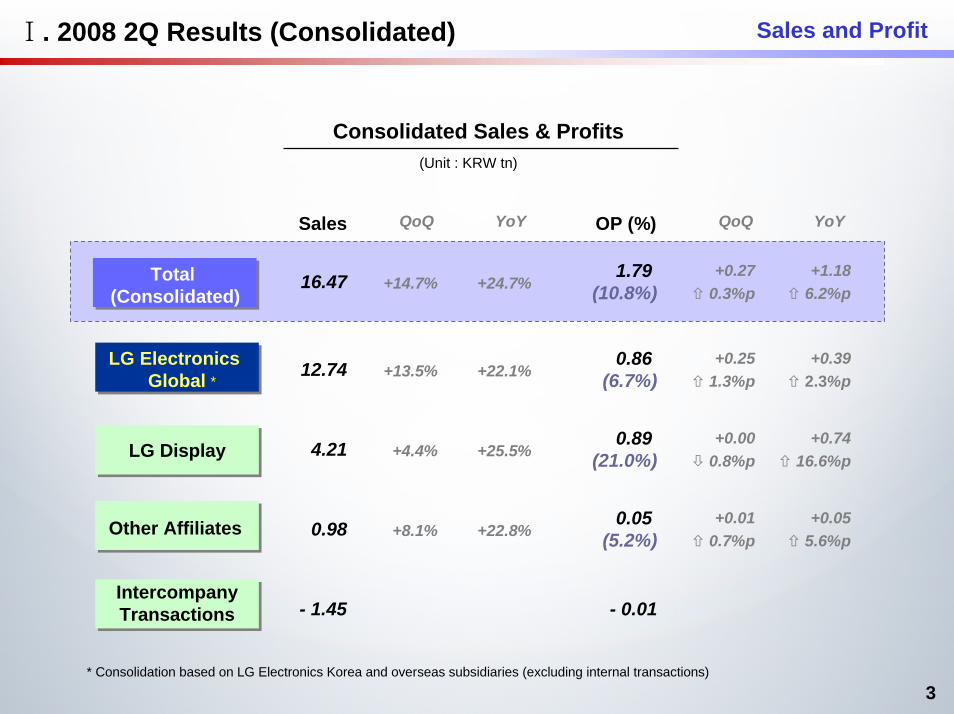
Ⅰ. 2008 2Q Results (Consolidated) Sales and Profit
Consolidated Sales & Profits(Unit : KRW tn)
QoQ YoYQoQ YoYSales OP (%)
16.47 +14.7% +24.7%1.79
(10.8%)+0.27
0.3%p+1.18
6.2%p
0.86 (6.7%)
+0.251.3%p
+0.392.3%p*
Total (Consolidated)
LG ElectronicsGlobal 12.74 +13.5% +22.1%
0.89 (21.0%)
+0.000.8%p
+0.7416.6%p4.21 +4.4% +25.5%LG Display
0.05 (5.2%)
+0.010.7%p
+0.055.6%p0.98Other Affiliates +8.1% +22.8%
IntercompanyTransactions - 1.45 - 0.01
* Consolidation based on LG Electronics Korea and overseas subsidiaries (excluding internal transactions)

4
Ⅰ. 2008 2Q Results (Consolidated) Sales & Profit by Division
Sales & Profit* (Unit : KRW bn)
1Q’08
3,047 144
(4.7%)
3,637 1
(0.0%)
1,31017
(1.3%)
3,327 454
(13.7%)
3,195 444
(13.9%)
2Q’08
3,781 272
(7.2%)
3,742 38
(1.0%)
1,220 13
(1.0%)
3,849 537
(13.9%)
3,754 540
(14.4%)
2Q’07
3,604 292
(8.1%)
2,727-138
(-5.1%)
1,246 -4
(-0.3%)
2,865 325
(11.3%)
2,709 313
(11.6%)
+24.1%
QoQ YoY
DigitalAppliance
DigitalDisplay
DigitalMedia
MobileCommunications
Handset
+2.9%
-6.9%
+15.7%
+17.5%
+4.9%
+37.2%
-2.1%
+34.3%
+38.6%
SalesOp. Profit
(%)Sales
Op. Profit(%)
SalesOp. Profit
(%)
SalesOp. Profit
(%)Sales
Op. Profit(%)
* Consolidation based on LG Electronics Korea and overseas subsidiaries (excluding internal transactions)** Divisional sales includes internal transactions between divisions

5
Digital ApplianceDigital ApplianceⅡ. Performance and Outlook by Sector
2Q’07
3.60
8.1%
2.79
5.4%
3Q’07
2.47
4Q’07
4.3%
3.05
1Q’08
4.7%
3.78
7.2%
2Q’08
2008 2Q Performance
3Q Outlook
Sales growth of 5% YoY to 3.8 trillion KRW
Solid operating profit margin of 7% reached despite challenging business environment (increased raw material prices, economic slowdown, etc.)
Korea : Sales growth expected from high season of A/C, kimchi ref. and washing machines
Overseas : Focus on sales expansion - new models and premium products
LGE : Stronger marketing for high season, focus on sales expansion of premium products
Market : Concerns of U.S. and Europe market slowdownbut continuous growth expected from A/C sales in Korea and premium products in the emerging markets
2Q’07 2Q’08
1)
21%
6%
27%
17%
29%
18%
5%
31%
18%
28%
3.85 3.80
Sales growth from Middle East, Asia, CIS markets
Impact from U.S. subprime effect, Europe’s cool summer and slow sales of air conditioners in Korea
Global* Performance(KRW tn)
Regional Sales Breakdown(USD bn)
Op. Margin (%)
1) Includes MEA 2) Includes CIS
Sales
Korea
Others
Asia
Europe
N. America
2)
* Pertains solely LG Electronics and its overseas subsidiaries (excluding internal transactions)

6
Digital Display
2.73
2Q’07
-5.1%
3.17
-0.9%
3Q’07
3.97
-0.3%
4Q’07
3.64
0.0%
1Q’08
3.74
1.0%
2Q’08
FPTV Shipment by Region(Unit: K)
Market : Market demand growth to be slow due to global economic slowdown, but FPTV demand growth in emerging markets and entrance of high season to lead to continuous growth QoQ
LGE : - Focus on sales expansion of premium products such asLCD TV “Scarlet” and PDP TV “Renaissance”
- Continuous efforts on SCM and cost innovation activitieslinked to panel supply situation
Following profitability turnaround in 1Q, continuous improvementresulted in positive profitability in 2Q
Display Set: 39% growth YoY- LCD TV 86%, PDP TV 31%, Monitors 19% (YoY)
PDP module sales increased 22% YoY
Sales increased 2.9% QoQ to 3.7 trillion KRW from strong FPTV sales
2008 2Q Performance
Ⅱ. Performance and Outlook by Sector
Sales
Global* Performance(KRW tn)
Op. Margin (%)
2Q’07 2Q’08* Includes MEA ** Includes CIS
KoreaOthers
Asia *
Europe **N. America
3Q Outlook
2Q’07 2Q’08
1,730
2,958
148149
332
712
389
223274
574
1,108
778
71%↑
51%84%
73%
56%
100%
* Pertains solely LG Electronics and its overseas subsidiaries (excluding internal transactions)

7
Digital MediaⅡ. Performance and Outlook by Sector
1.25
2Q’07
-0.3%
1.34
3Q’07
2.2%
4Q’07
1.43
1.9%
1Q’08
1.31
1.3% 1.0%
2Q’08
1.22PC : FX rates led to lower profitability in domestic PCs
DS : Maintained ODD Global Top #1 as notebook DVD-RW sales ↑
Car : Sales growth of built-in products led to turnaround in profitability
Media : Sales of main & strategic products increased, stable profitabilityDomination of U.S. D2A Set top box demand
Sales decreased slightly due to low seasonality
Improved profitability from better business portfolio and CI¹
2008 2Q Performance
Sales
Global* Performance(KRW tn)
Op. Margin (%)
Market : Global economy to slow down from higher material costs and cutback in consumer spending
LGE : Sustain profitability by risk management - High season product management, better procurement
2Q’07 2Q’08
21%
11%13%
17%
18%
23%
9%15%
13%
20%
1.25 1.22
11% 9%8%7%3%2%
Car : Sustain profitability from GM new platform launch and AVN sales
DS : Stronger line up & better profitability from BD Slim product launch
Media : Managing massive shipments to emerging markets & special procurements, launching BD players in developed markets
3Q Outlook
Europe
Middle East
CS America
North America
China
CIS
Asia
Regional Sales Breakdown(KRW tn)
Korea
* Pertains solely LG Electronics and its overseas subsidiaries (excluding internal transactions) 1- Cost innovation

8
Mobile CommunicationsⅡ. Performance and Outlook by Sector
Better profitability from sales growth of premium models and improvements in operational efficiency
Premium models in line with strategic plan
Emerging market shipment growth emanated from India and CS America
WCDMA shipment increased 18% QoQ
Historical high - Sales and shipment of 27.7 million (1H - 52M)
- Good performances of Secret, Viewty, Venus and other premium models
2008 2Q Performance
2.86
2Q’07
11.3%
2.64
3Q’07
8.4%
3.05
4Q’07
8.7%
3.33
1Q’08
13.7%
3.85
13.9%
2Q’08
Global* Performance(KRW tn)
Sales
Op. Margin (%)
Market : Due to global economic slowdown, emerging market demand growth to slowdown, competition to intensify leading to possible ASP declineLGE : Stronger marketing, responding proactively to the market
expanding sales and sustaining double digit profitability
Allocation of marketing resources (centered on premium models)Responding to the market situation with appropriate ASP
1Q’08 2Q’08
34%
11%
21%
26%
7%24.4
34%
11%
21%
27%
7%27.7
Focus on resource allocation efficiency management, stronger SCM
3Q Outlook Shipment by Region(unit:mn)
MEA/CIS
North America
Europe
CSAmerica
Korea
* Pertains solely LG Electronics and its overseas subsidiaries (excluding internal transactions)

9
Ⅲ. 2008 2Q Results (Parent) Sales & Profit
Sales Profit(Unit : KRW tn) (Unit : KRW bn)
5.47
1.76Domestic
Export
+9.6%
+2.9%
2Q’072Q’081Q’08
+1.0%
+31.5%4.16
1.74
7.23+4.4% +22.5%
5.90
5.32
1.61
6.931Q’08 2Q’08 2Q’07
564 635
925
707
811
QoQ YoY
OperatingProfit
146+13% +336%
EBITDA 732 323+11% +151%
RecurringProfit 498 461+86% +101%
Net Profit 422 385+67% +84%

10
Ⅲ. 2008 2Q Results (Parent) Non-operating items
Non-operating Items Equity Method(Unit : KRW bn)(Unit : KRW bn)
Financial Expenses 42
925
635
*Others
170
496
Op. Profit RecurringProfit
-17 142
1Q’08 2Q’08
273 287
496
7
265
8 6
Foreign Exchange Loss
Equity MethodGain
6
LG Display
LGEOverseas Subsidiaries
Others
Equity Method Total
* AR discount fee included in financial expenses

11
Ⅲ. 2008 2Q Results (Parent) Cash Flow
Net Cash Flow * Cash flow(Unit : KRW bn)(Unit : KRW bn)
Cash at the beginning of Quarter 993
707
176
140
496388
232
403
707176
△ 496△ 403
388
372
△ 232
Cash Flow from Operating Activities
Cash Flow from Investing Activities
Net IncomeDepreciationEquity Method GainIncrease in Working CapitalOthers
Others Equity MethodGain
Depreciation
Increase in Working Capital
CAPEX & Capital Investment △ 232
Net Income CAPEX &Capital Investment
△ 305Cash Flow from Financing Activities Debt
Cash Increase
Dividends Paid△ 167△ 138
△ 165Cash In Cash Out Net*
Cash at the end of Quarter 828
* Excludes cash flow from financing activities

12
Ⅲ. 2008 2Q Results (Parent) Financial Structure
Balance Sheet Financial Ratio(Unit : %)(Unit : KRW tn)
Dec ’06 Dec ’07 2Q’08Dec ’06 Dec ’072Q’08
13.23
3.16
7.09
6.14
4.902.19
2.47
0.511.10
11699 98
4028 23
3221 14
14.34
2.83
0.530.95
10.07 11.51
17.31
4.53
0.831.18
12.78
Assets
CashInventories
Current Assets
Fixed Assets
Total Liab. toEquity
Liabilities 7.13 8.55 Debt to Equity4.422.70
5.543.01
Current LiabilitiesLong-Term Liabilities
Equity 7.21 8.76 Net Debt toEquity
Debt 2.05 2.04
* KAI opinion 06-2 not applied to 2006 results.

13
Ⅳ. 2008 3Q Business Direction and Prospects
Growth*
Profitability*
Global economy to slowdown and entering low season for appliances - slower sales expected QoQ
Sales
Low season for air conditioners - profitability to decline QoQD A
FPTV sales to increase - continue to sustain positive profitability D D
Entering high season - profitability to improve D M
Slower demand and intensified competition in the premium segment in 2H expected –profitability decline QoQ expected but to sustain double digit profitability
M C
* Pertains solely LG Electronics and its overseas subsidiaries (excluding internal transactions)

14
http://www.lge.com

15
Appendix Financial Statement (Parent)
1Q 2Q 3Q 4Q 1Q 2Q 3Q 4QAssets 13,342 13,343 13,796 14,338 16,306 17,314
Current Asset 3,520 3,265 3,306 2,827 4,394 4,533Quick Asset 2,323 2,279 2,292 1,882 3,138 3,354Inventories 1,196 986 1,014 946 1,256 1,179
Fixed Asset 9,823 10,078 10,490 11,510 11,912 12,781Investment 5,225 5,555 5,974 7,075 7,553 8,464Tangible 4,152 4,126 4,118 4,037 3,962 3,852Intangible 446 398 398 398 397 465
Liabilities 7,624 7,214 7,315 7,127 8,514 8,553Current Liabilities 5,248 4,697 4,731 4,423 5,733 5,544LT Liabilities 2,376 2,517 2,584 2,704 2,781 3,009
Capital 5,718 6,129 6,482 7,211 7,791 8,761
2007 2008
1Q 2Q 3Q 4Q Total 1Q 2Q 3Q 4Q TotalSales 6,034 5,903 5,690 5,875 2,350 6,927 7,234COGS 4,693 4,580 4,490 4,577 1,834 5,142 5,264Gross Proft 1,341 1,323 1,200 1,298 516 1,786 1,970SG&A 1,168 1,178 1,107 1,144 460 1,221 1,335Op.Profit 173 145 92 154 56 564 635Non OP Item -30 32 29 61 9 -66 290Rec. Profit* -128 461 387 767 149 498 925Tax -6 76 48 146 26 76 218Net Profit -123 385 339 621 122 422 707
20082007
Income Statement
Balance Sheet
(Unit : KRW bn)
(Unit : KRW bn)
*Recurring profit is equal to pre-tax profit from continuous operation.

16
Appendix Divisional Sales (Parent)
QoQ YoY Sales 1,819 1,789 1,339 1,189 6,135 1,645 1,745 6.1% -2.5%
Op. Profit 218 173 65 55 511 186 207(%) (12.0%) (9.7%) (4.8%) (4.7%) (8.3%) (11.3%) (11.9%)
Sales 1,214 1,093 1,389 1,441 5,137 1,466 1,341 -8.5% 22.7%Op. Profit -194 -265 -160 -96 -714 -82 -117
(%) (-16.0%) (-24.2%) (-11.5%) (-6.6%) (-13.9%) (-5.6%) (-8.7%)Sales 713 613 698 688 2,712 692 654 -5.6% 6.7%
Op. Profit 6 -17 15 -6 -2 -7 3(%) (0.8%) (-2.7%) (2.1%) (-0.9%) (-0.1%) (-1.0%) (0.4%)
Sales 2,300 2,423 2,283 2,567 9,573 3,097 3,460 11.7% 42.8%Op. Profit 155 265 181 209 809 478 545
(%) (6.7%) (10.9%) (7.9%) (8.1%) (8.4%) (15.4%) (15.7%)Sales 2,136 2,253 2,131 2,422 8,942 2,954 3,360 13.7% 49.1%
Op. Profit 141 254 170 200 765 468 547(%) (6.6%) (11.3%) (8.0%) (8.3%) (8.6%) (15.9%) (16.3%)
Sales -12 -14 -19 -10 -55 27 34Op. Profit -11 -11 -9 -8 -38 -10 -2
Sales 6,034 5,903 569 5,875 23,502 6,927 7,234 4.4% 22.5%Op. Profit 173 146 92 154 565 564 635
(%) (2.9%) (2.5%) (1.6%) (2.6%) (2.4%) (8.1%) (8.8%)Recurring
Profit -128 461 387 767 1,487 498 925
Net Proft -123 385 339 621 1,222 422 707
Total
Others
DA
DD
DM
MC
Handset
1Q'07 2Q'07 3Q'07 4Q'07 3Q'08 4Q'08FY07 1Q'08 2Q'08
* Divisional sales includes internal transaction between divisions
(Unit :KRW bn)

17
Appendix Divisional Sales (Global*)
QoQ YoY Sales 2,941 3,604 2,785 2,473 11,803 3,047 3,781 24.1% 4.9%
Op. Profit 169 292 150 107 717 144 272(%) (5.7%) (8.1%) (5.4%) (4.3%) (6.1%) (4.7%) (7.2%)
Sales 2,754 2,727 3,170 3,968 12,619 3,637 3,742 2.9% 37.2%Op. Profit -262 -138 -29 -11 -440 1 38
(%) (-9.5%) (-5.1%) (-0.9%) (-0.3%) (-3.5%) (0.0%) (1.0%)Sales 1,382 1,246 1,336 1,430 5,394 1,310 1,220 -6.9% -2.1%
Op. Profit 11 -4 29 27 62 17 13(%) (0.8%) (-0.3%) (2.2%) (1.9%) (1.2%) (1.3%) (1.0%)
Sales 2,509 2,865 2,635 3,050 11,059 3,326 3,849 15.7% 34.3%Op. Profit 121 325 220 267 933 454 537
(%) (4.8%) (11.3%) (8.4%) (8.7%) (8.4%) (13.7%) (13.9%)Sales 2,354 2,709 2,496 2,917 10,476 3,195 3,754 17.5% 38.6%
Op. Profit 110 313 209 257 889 444 540(%) (4.7%) (11.6%) (8.4%) (8.8%) (8.5%) (13.9%) (14.4%)
Sales 8 -11 -16 -7 -27 -102 144Op. Profit -11 -11 -9 -8 -38 -10 -2
Sales 9,593 10,430 9,911 10,914 40,848 11,218 12,735 13.5% 22.1%Op. Profit 28 464 362 381 1,234 605 856
(%) (0.3%) (4.4%) (3.6%) (3.5%) (3.0%) (5.4%) (6.7%)
3Q'08 4Q'08
DA
4Q'07 FY07 1Q'081Q'07 2Q'07
Others
2Q'08
Total
DD
DM
MC
Handset
3Q'07
(Unit :KRW bn)
* Divisional sales pertains solely LG Electronics Korea and its overseas subsidiaries and includes internal transactions