2008 provisional national gcse results 16 october 2008
TRANSCRIPT

2008 provisional National GCSE results
16 October 2008

2008 PSA target of 60% met and exceeded. Latest increase is the greatest since 1997
45.146.3
47.949.2 50.0
51.652.9
56.3
53.7
64.258.560.9
34
38
42
46
50
54
58
62
66
1997 1998 1999 2000 2001 2002 2003 2004 2005 2006 2007 2008prov
% 1
5 y
ea
r o
lds
ac
hie
vin
g 5
+ A
*-C

2008 GCSE national results
National results for pupils at the end of key stage 4 in all schools
47.2 per cent 5+ A* - Cs (inc English and mathematics) 98.6 per cent any pass at GCSE
National results for pupils at the end of key stage 4 in the maintained sector
47.9 per cent 5+ A* - Cs (inc English and mathematics) 99.2 per cent any passes at GCSE

New PSA target sets a challenging trajectory (for all schools)
44.7 45.6 46.3 47.2
53.048.0
34
38
42
46
50
54
58
62
2005 2006 2007 2008 prov 2009 2010 2011
% p
up
ils
ac
hie
vin
g 5
+ A
*-C
in
c E
+M
(E
nd
KS
4)

Standards in LA maintained schools improving faster than in all schools

A widening gender gap in science% Achieving 2 "good" science (inc BTECs/OCRs) 2007 - 2008 Boys v Girls
47.7
48.748.848.5
49.2
50.850.9
51.5
45.0
46.0
47.0
48.0
49.0
50.0
51.0
52.0
2007 2008
National (LA Maintained) Boys
National (All) Boys
National (LA Maintained) Girls
National (All) Girls

Neither SATs nor SLTs in KS3•No national targets at KS3•Increased significance of APP for heads to monitor cohorts•Expert group will recommend new measures •Likely that national samples taken to track trends•Likely move to KS2-KS4 progress measure in 2011•Pilot MGP schools will continue to collect TA data each term•Progress measures likely to appear in School Report

National Challenge:Key principles and processes
• Schools lead their own improvement• A balance of action for rapid impact and capacity building• A focused, flexible, Raising Attainment Plan (RAP) developed and
monitored by a RAP Management Group (RMG) • Six-week improvement cycles • Challenge, support and brokerage through the National Challenge
Adviser (NCA) • Carefully tailored and mediated support rather than support
saturation
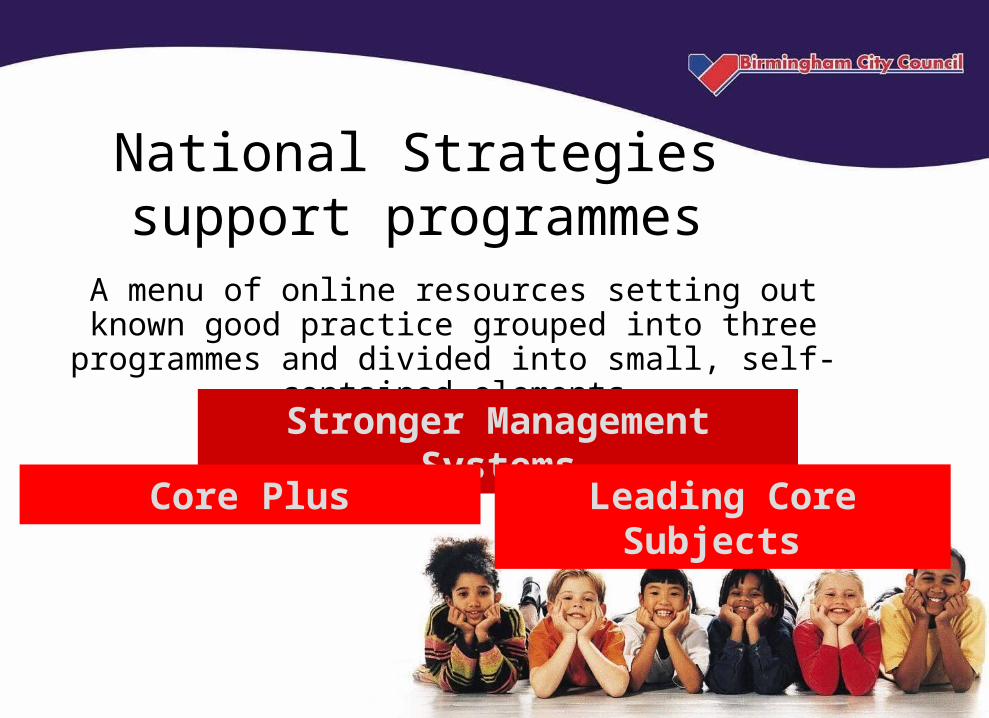
A menu of online resources setting out known good practice grouped into three programmes and divided into small, self-
contained elements
National Strategies support programmes
Stronger Management Systems
Core Plus Leading Core Subjects

SMS
A programme to ensure leadership results in:
strong classroom practice through effective management reduced in-school variation by improving consistency of practice at all levels

1 Developing and distributing leadership •Effective line management•Effective performance management•Professional development for impact2 Effective whole-school systems, policy and practice •Behaviour for learning•Assessment for learning •Effective identification and intervention •Quality standards in lesson planning 3 Monitoring and evaluation for impact and improvement•Self-evaluation and good practice•Monitoring and evaluation focused on standards •Tracking pupils’ progress
SMS – three themes and ten elements

•Two additional elements to address specific areas:-senior and subject leaders – developing support and challenge -creating a positive environment for retaining teachers and middle leaders
LCS – two elements
The next stage of the DCSF School Improvement
Strategy
Schools where children should be making better progress

Gaining Ground
Improving Progress in coasting secondary schools

Target group
•Overall respectable performance at GCSE but unimpressive progress•Have not benefited from previous funded interventions•Those that aren’t currently supported by either National or City Challenge

LAs have a central role
1. Identifying coasting schools2. Ensuring each one has an appropriate SIP3. Facilitating the SIP to broker in high impact
support4. Stepping up the challenge where schools do
not respond – using statutory powers where appropriate

Identifying coasting schools – quantitative indicators
Criteria Definition(?)Reasonably high attaining but progress unimpressive
Above 30% 5+A*-C EM
Below median 3L progress ks 2-4 (?)
Little or no improvement in progress from ks2 – 4 over time
< 1ppt rise in 3 yrs (Average 3 levels progress 2005-2007 = 3ppts)
Ofsted ratings disappointing Grade 3 or 4 overall
Complacent leadership Ofsted grade 3 or 4 for leadership
Significant variation in performance of groups e.g. FSM
Sig- performance in RAISE for any underperforming group
CVA significantly below average Sig - on RAISE all subjects (and En or Ma?)

Criteria (?)Weak AfL, tracking and interventionPoor implementation of workforce agreement…….
Identifying coasting schools – qualitative indicators

Brokering high impact support – the offer
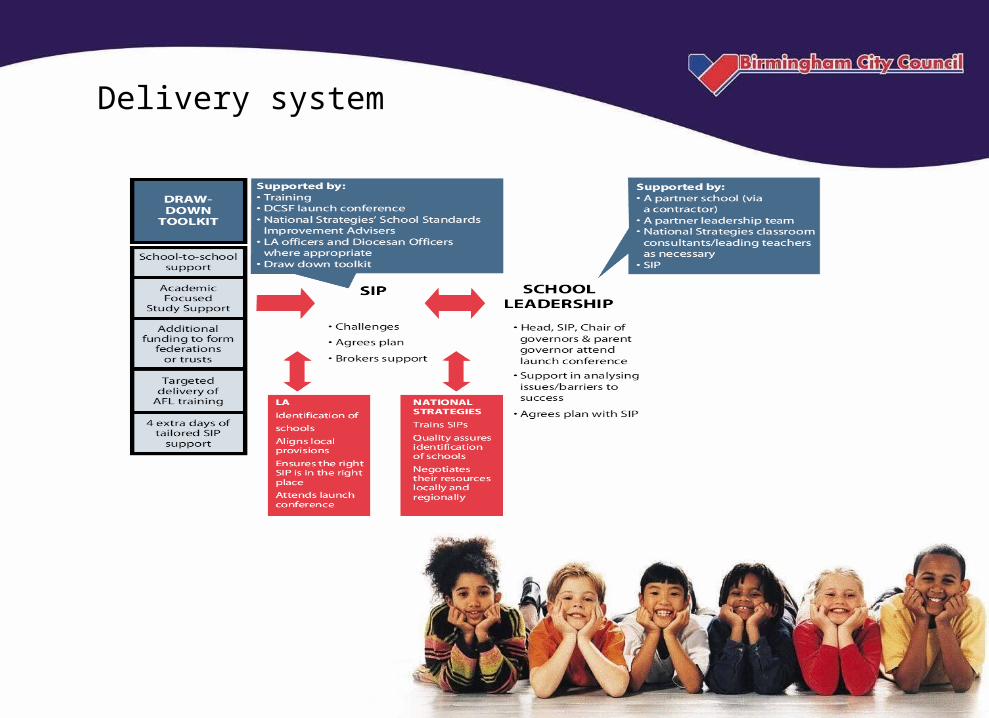
Delivery system

Timeline

Overcoming Barriers to Improvement
Strengthening AfL, the effectiveness of pupil tracking and its impact on planning for progressionImproving use of progression targets rather than threshold targets supported/challenged by SIPsImproving the impact/effectiveness of leadership at senior/subject leader levelAn end to uninspiring and inappropriate lessonsChallenge to raise low aspirations and expectations

•£25m package•Additional 4 days SIP time – to include additional training•Conference in spring for Heads, CoGs, parent governors and SIPs•Procurement of provider to facilitate school-to-school support•Targeted support to enhance pupil tracking•Extended study support•SMS and Core Plus versioned for this purpose
Support

Timeline
•Publication 13 Nov•LAs identify schools (and SIPs) – from 13 Nov – finalised once progress data released•Launch conference(s) March 09•Additional SIP training summer 09 (possibly May)

Fig 1c. GCSE and equivalent trends, Birmingham compared to National, 2002- 2008
GCSE and equivalent 5A*-C Trend
40
45
50
55
60
65
70
2002 2003 2004 2005 2006 2007 2008
NationalBirmingham

GCSE and equivalent 5+A*-C inc. Eng & Maths Trend
25
30
35
40
45
50
2002 2003 2004 2005 2006 2007 2008
Birmingham
National

GCSE and equivalent 5+A*-C inc. Eng & Maths by Gender Trend
25
30
35
40
45
50
55
2005 2006 2007 2008
Birmingham Boys
Birmingham Girls
National Boys
National Girls

GCSE and equivalent 5A*-G Trend
80
85
90
95
2002 2003 2004 2005 2006 2007 2008
National
Birmingham

Table 2. Pupil Performance 2008: Comparison with Core Cities and Statistical Neighbours (Provisional Results)
Phase Birmingham
Core City Average
Statistical Neighbour Average
Birmingham Rank Order (out of 17)
2008 GCSE and Equivalent
5 A* - C
5 A* - C including English & Maths
Any passes
66.4%
45.4%
98%
60%
39%
96%
59%
41%
98%
2nd
4th
=2nd

Fig 3a. End of Key Stage 3 N C Assessments Trends and Targets: Pupil at Level 5 and Above
57%
69% 69% 70%
62%
73% 70%
66% 65%
60%
56%
73% 70% 70%
67% 66%
62%
58% 56%
54%
69%
64% 65% 63%
61%
57% 59%
56% 54%
48%
0%
10%
20%
30%
40%
50%
60%
70%
80%
2000 2001 2002 2003 2004 2005 2006 2007 2008 2008
English
Maths
Science
Trends
Targets

Fig 3b. End of Key Stage 3 N C Assessments Trends and Targets:
60% 60%62% 62%
70%
30% 30%27% 28%
36%
47%
55%53%
56%58%
0%
10%
20%
30%
40%
50%
60%
70%
80%
2005 2006 2007 2008 2009
English and Maths
Two Levels Progress English
Two Levels Progress Maths
TargetsTrends

Fig 4b. Trends and Targets for Students Achieving 5 or more GCSE and equivalent A*-C Grades including GCSE
English and Maths
37%39%
41%42%
45%47%
49%
0%
10%
20%
30%
40%
50%
60%
70%
2004 2005 2006 2007 2008 2008 2009
Per
cent
age
TRENDS TARGET

Fig.6b) Progress on New Floor Targets 2006-2008 (Provisional 20/10/08)
77
30
66
27
51
20
0
20
40
60
80
100
120
KS2 English & Maths (Schools with less than 55% Level 4+) 5A*-C (Schools with less than 30% 5A*-C incl. English & Maths)
Nu
mb
er
of
sc
ho
ols
Primary Schools trends 2006 - 2008
Secondary Schools Trends 2006 - 2008 (National Challenge floor targets)

Fig 8a. 2008 GCSE and Equivalent 5+ A*-C by Ethnic Group, Gender and Free School Meals
0%
10%
20%
30%
40%
50%
60%
70%
80%
90%
100%
Wh
ite
B
Wh
ite
G
Afr
/Ca
rb.
B
Afr
/Ca
rb.
B
Ba
ng
la.
B
Pa
kis
t. B
Pa
kis
t. B
Pa
kis
t. G
Wh
ite
B
Ba
ng
la.
B
Ind
ian
B
Afr
/Ca
rb.
G
Ba
ng
la.
G
Pa
kis
t. G
Ba
ng
la.
G
Wh
ite
G
Afr
/Ca
rb.
G
Ind
ian
G
Ind
ian
B
Ind
ian
G
FSM FSM FSM NoFSM
FSM FSM NoFSM
FSM NoFSM
NoFSM
FSM FSM FSM NoFSM
NoFSM
NoFSM
NoFSM
FSM NoFSM
NoFSM
Pupils eligible for Free School Meals Pupils not eligible for Free School Meals
Boys Girls
LA Average
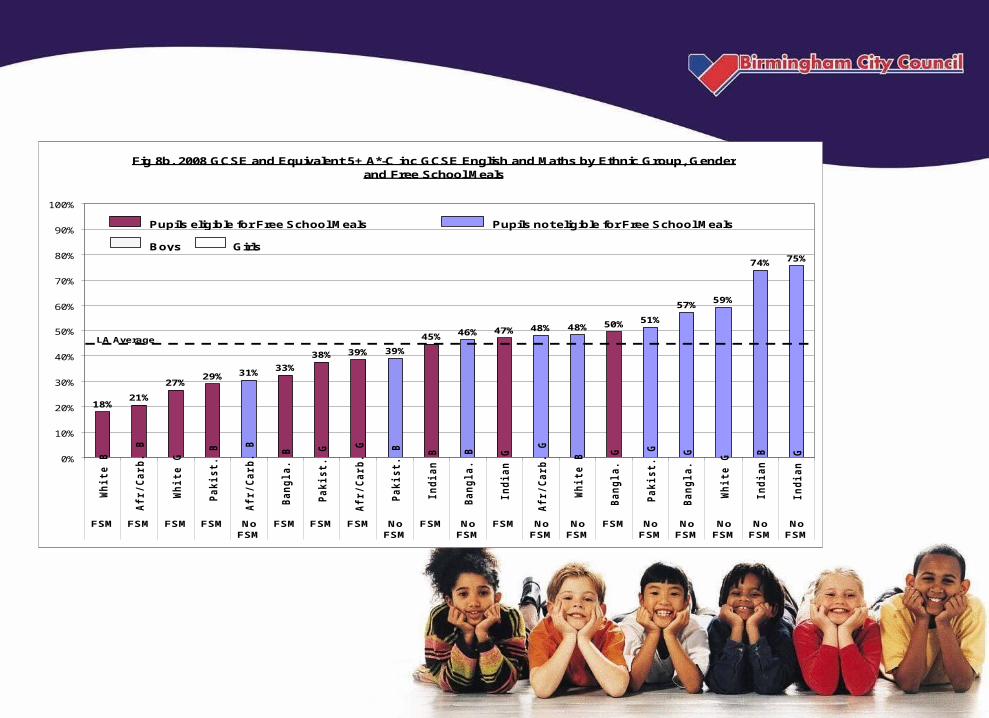
Fig 8b. 2008 GCSE and Equivalent 5+ A*-C inc GCSE English and Maths by Ethnic Group, Gender and Free School Meals
18%21%
27%29% 31%
33%
38% 39% 39%
45% 46% 47% 48% 48% 50% 51%
57%59%
74% 75%
0%
10%
20%
30%
40%
50%
60%
70%
80%
90%
100%
Wh
ite
B
Afr
/Ca
rb.
B
Wh
ite
G
Pa
kis
t. B
Afr
/Ca
rb.
B
Ba
ng
la.
B
Pa
kis
t. G
Afr
/Ca
rb.
G
Pa
kis
t. B
Ind
ian
B
Ba
ng
la.
B
Ind
ian
G
Afr
/Ca
rb.
G
Wh
ite
B
Ba
ng
la.
G
Pa
kis
t. G
Ba
ng
la.
G
Wh
ite
G
Ind
ian
B
Ind
ian
G
FSM FSM FSM FSM NoFSM
FSM FSM FSM NoFSM
FSM NoFSM
FSM NoFSM
NoFSM
FSM NoFSM
NoFSM
NoFSM
NoFSM
NoFSM
Pupils eligible for Free School Meals Pupils not eligible for Free School Meals
Boys Girls
LA Average

One-to-one tuition

• ‘Because every child should leave primary school able to read, write and count, any child who falls behind will not be left behind – but will now have a new guaranteed right to personal catch up tuition.’
• Gordon Brown, September 2008

Why one-to-one tuition?
•Ensuring the right support is in place for all children, regardless of class or social background is important in closing the attainment gap. For those who can afford it, individual tuition has always been the preferred method of additional support for pupils not achieving their potential.

Session objectives
•To outline the rationale for one-to-one tuition•To summarise the approach adopted in the Making good progress (MGP) pilot•To start to consider the role of local authorities in a roll-out programme

Tuition in the MGP pilot
•One-to-one•10 hours (plus funding for 2 hours liaison)•Minimum of one hour per session•Out-of-school hours•Delivered by a qualified teacher•Have agreed targets (with the class teacher) for the work of the pupils•Part of the overall provision for intervention

MGP selection criteria
•Pupils who have entered key stage below age-related expectations•Pupils who are falling behind trajectory during the latter stages of a key stage•Looked after children who need this support• * This selection must not exclude pupils because they are considered harder to reach and/or are considered to have behaviour issues.

The process
•Next steps for pupils identified using the Assessing pupils’ progress (APP) criteria•Clear targets agreed between the teacher and the tutor•Programme shaped around pupil’s needs•Informal liaison between teacher and tutor during sessions•Targets amended during the sessions as the pupil’s needs change

MGP: delivery of tuition
•Schools have found:•a variety of people to deliver tuition•a wide range of places to deliver tuition•a range of times to deliver tuition

The myths•An hour is too long•Pupils would prefer one-to-two or -three•Pupils will not want to stay after school or have sessions at the weekend•Young pupils will be too tired at the end of the day•Pupils will be stigmatised•You can’t send a tutor to the pupil’s home•A good classroom assistant or HLTA could deliver the tuition

Response from pupils (1)
•Pupils:•are overwhelmingly positive about the experience•are unfazed by one-to-one contact even if delivered by an unfamiliar adult•find that the hour flies by•say tuition is fun because of the wide range of activities used

Response from pupils (2)
Pupils:are able to identify what they need to improveknow they are improving because they are more confident and get better marks in class see tuition as a privilegevalue being able to shape the sessions and like that tuition is tailored to their needs

•‘The time goes really quickly because you are enjoying yourself.’
• ‘Sometimes your teacher can be scary but my tutor is just my friend who knows more than me so I can ask more questions.’
•In class, I’m scared people will make fun of me when I don’t know things.’
Pupils’ comments
• ‘There’s just her and you, so you can have all her time, she can help you when you are stuck.’
•‘I felt special.’

Response from parents
•Parents are extremely supportive of the offer – some have attended sessions•Evidence that the tuition passport is engaging parents in their children’s learning•Some parents report significant changes in their children’s attitudes to learning
Response from tutors
•Find the sessions intense but rewarding•Are confident about range of teaching and learning strategies required•Recognise the benefit of being able to intervene at the point of misconception•Are clear that the pedagogy for one-to-one tuition is different from that for whole-class teaching

•Following tuition, pupils are more willing to have a go, ask questions, put their hands up, etc.•Teachers report seeing the transfer of skills from tuition to the classroom•Focus now is on monitoring whether the initial impact seen in tutored pupils is sustained
Impact – confidence,self-esteem and motivation

Nationally we are committed to supporting 300,000 children a year with one to one tuition in English and 300,000 children a year in mathematics by 2010-11
To enable every LA to put the necessary infrastructure in place to help us meet this commitment, funding will be made available through the 2009 and 2010 Standards Fund Grants
This funding is ring-fenced for one to one tuition for a specified proportion of pupils in key stages 2,3 and, in National Challenge Schools, Key Stage 4
So what is the future?

How can we make it happen?
Biggest challenge will be tutor recruitment:plan it earlycast a wide net – private agencies, trusted supply, retired or part time teacherswork with schools to identify the spread – and the where and whenSupport from central services…and of course school improvement services

What will the funding cover?
marketing to and recruitment of tutorstraining for tutorsquality assuranceliaison with head teachersliaison with HRsupporting inclusion and accessmonitoring and evaluation
Impact – progress and attainment
•Teachers report that pupils who have finished tuition show improvements in attainment as recorded through termly teacher assessments•Overall tuition data in the MGP pilot indicates that a higher proportion of pupils who have tuition make expected progress than those who don’t

Pedagogy materials
•Developing one-to-one tuition:•operational handbook for local authorities and schools•guidance for local authorities and schools•guidance for tutors •supported by video extracts on DVD