2008 southern california investor conference september,...
TRANSCRIPT
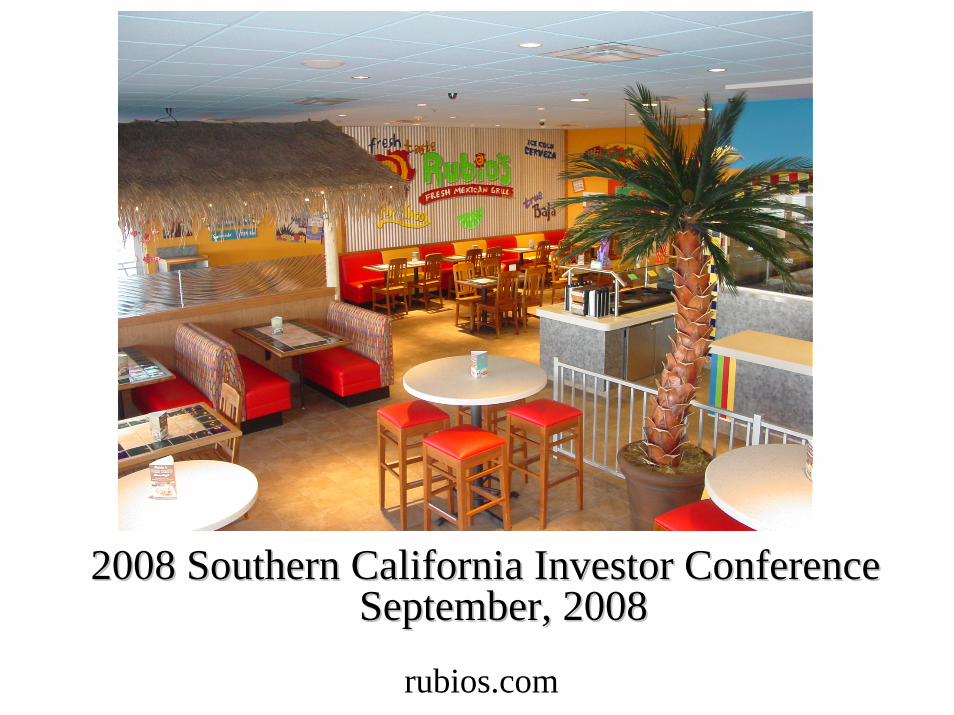
2008 Southern California Investor Conference 2008 Southern California Investor Conference September, 2008September, 2008
rubios.com
2
Forward-Looking Statements
Some of t he informat ion in t his present at ion may cont ain forward-looking st at ement s regarding fut ure event s or t he fut ure financial performance of t he Company. Forward-looking st at ement s are based on
management ’s current plans and assumpt ions and are subject t o known and unknown r isks and uncert aint ies, which may cause act ual result s t o differ mat erially from expect at ions. You should not place
reliance on forward-looking st at ement s. The following are some of t he considerat ions and fact ors t hat could mat er ially affect our result s: changes in comparable st ore sales growt h and revenues, increased product cost s , labor expense and ot her rest aurant cost s , t he success of our promot ions and market ing
st rat egies, our abilit y t o recruit and ret ain qualified personnel, adverse effect s of weat her , adequacy of reserves relat ed t o closed st ores or st ores t o be sold, increased depreciat ion, asset writ e downs, or
implement at ion cost s relat ed t o t he Rubio’s market ing and concept posit ioning init iat ives, our abilit y t o manage ongoing and unant icipat ed cost s, such as cost s t o comply wit h t he Sarbanes-Oxley Act and ot her regulat ory init iat ives, lit igat ion cost s , our abilit y t o implement a franchise st rat egy, our abilit y t o open
addit ional or maint ain exist ing rest aurant s in t he coming per iods and t he effect s of ever-increasing compet it ion. These and ot her fact ors t hat could mat er ially affect our result s can be found in our filings
wit h t he SEC including, wit hout limit at ion, in t he “Risk Fact ors” sect ion of our most recent Annual Report on Form 10-K and subsequent quart erly repor t s on Form 10-Q. The Company undert akes no obligat ion t o
release publicly t he result s of any revision t o t hese forward-looking st at ement s t o reflect event s or circumst ances following t he dat e of t his present at ion.
3
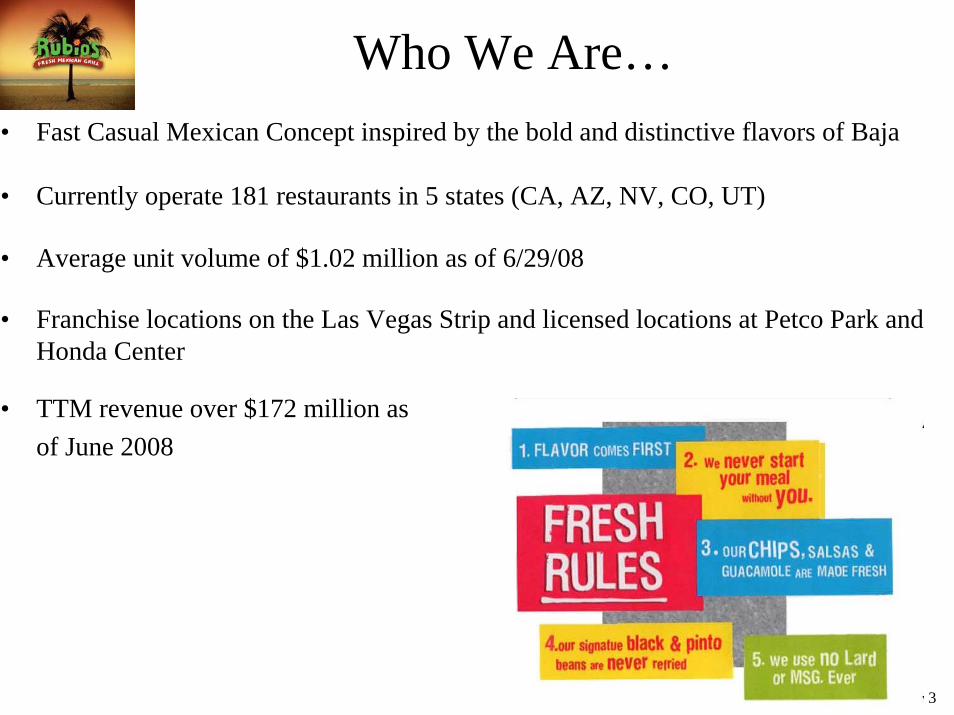
Who We Are…• Fast Casual Mexican Concept inspired by the bold and distinctive flavors of Baja
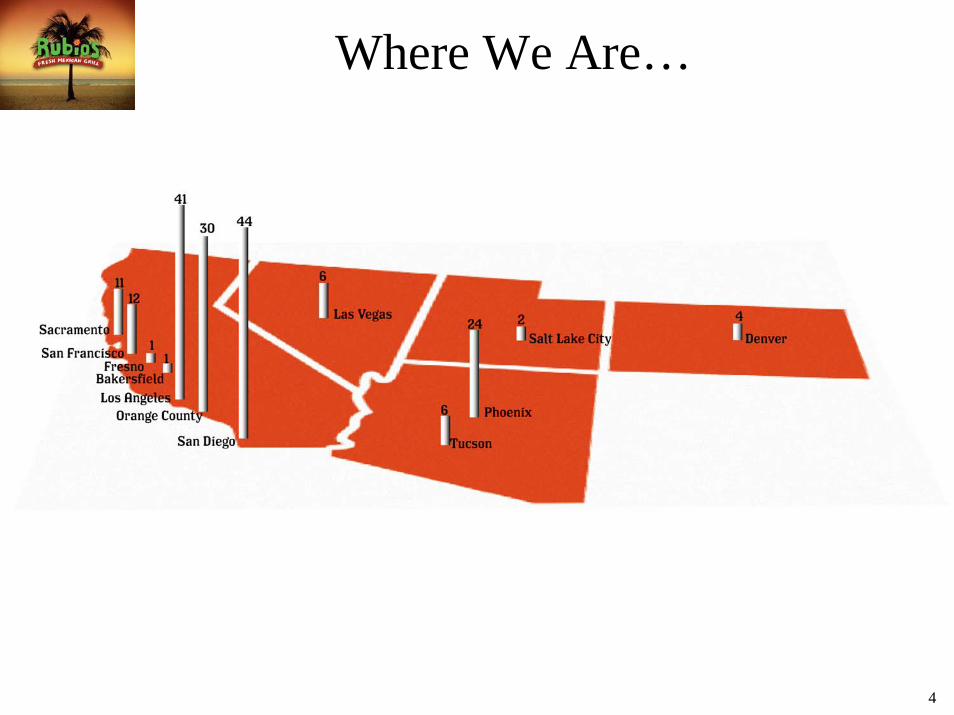
• Currently operate 181 restaurants in 5 states (CA, AZ, NV, CO, UT)
• Average unit volume of $1.02 million as of 6/29/08
• Franchise locations on the Las Vegas Strip and licensed locations at Petco Park and Honda Center
• TTM revenue over $172 million as of June 2008
4
Where We Are…
Market Outlook
Strategy
Results

666
Growth in Fast Casual Market (in billions)
* Estimated Growth
$14 .6$16.0
$23.5
20 06 20 07 2010
10.0% / yr.*
9.5% / yr.
Source: NRA

77
Industry Pressures
1. Food Cost
2. Healthy
3. Green/Packaging
4. Immigration

Market Outlook
Strategy
Results

99
Target Segment
Adults 25-49 w/above average income &
education who crave unsurpassed flavorful
foods, are health conscious, have limited time for a meal or snack
(10-30 minutes) and expect to spend $6-$10
for a meal.
Great Taste
1010
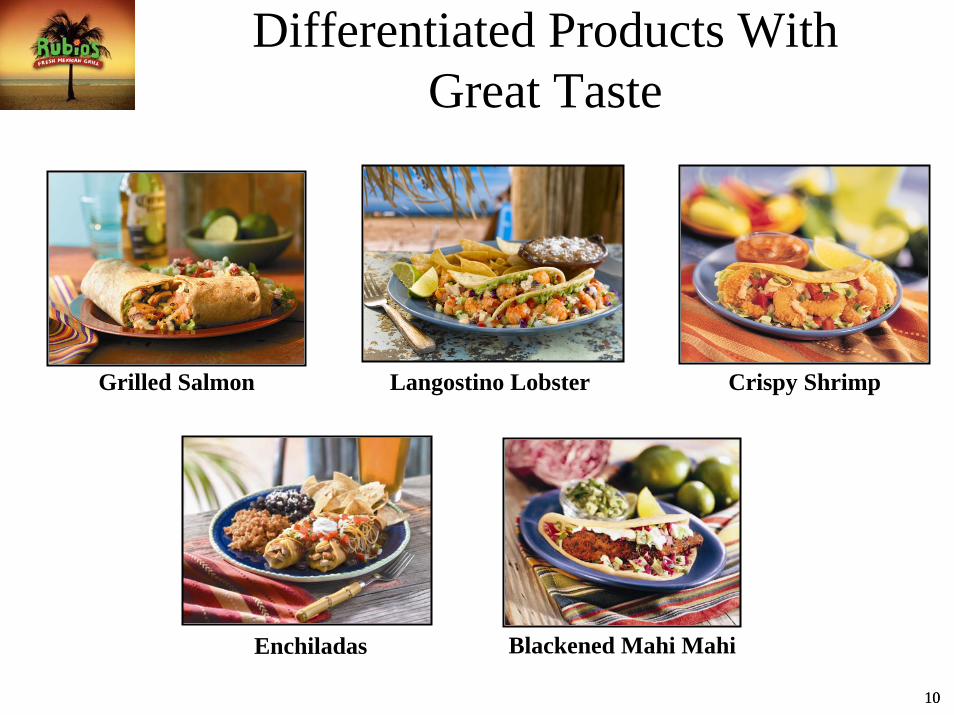
Differentiated Products With Great Taste
Grilled Salmon Langostino Lobster
Enchiladas
Crispy Shrimp
Blackened Mahi Mahi

111111
July 2008 New Products
Carnitas Rajas Burrito & TacoGrilled Gourmet Tacos
Tropical Wrapsaladaand Salad
Grilled Veggie Burrito

121212
July 2008 Menu
Re: The New Tacos Are Outstanding!!! 12-Aug-08 01:51 pmThe best steak taco I have ever tasted. After leaving the store I wanted to go back andget another one all night. The price is fine. People pay $200 for a pair of sheepskinboots, $4 for a gallon of gas, $2000 for a flat panel TV, $389 for Disneyland passes. Remember your not eating Dell Taco, or even Tito's Tacos. Your eating something thatactually tastes great. I think I'm going over there today and try the shrimp taco.
Source: Yahoo Message Board

Beach Mex is: fresh.Beach Mex is: flavorful.Beach Mex is: the best ingredients the planet has to offer.
It’s simple preparations, but complex tastes.It’s lighter, it’s healthier (but it’s completelysoul-satisfying).

141414
Two-Pronged Limited Time Offers

1515
New Website Homepage On-line Promotions
Connected with our Targeted Guests in a Wired World
1616
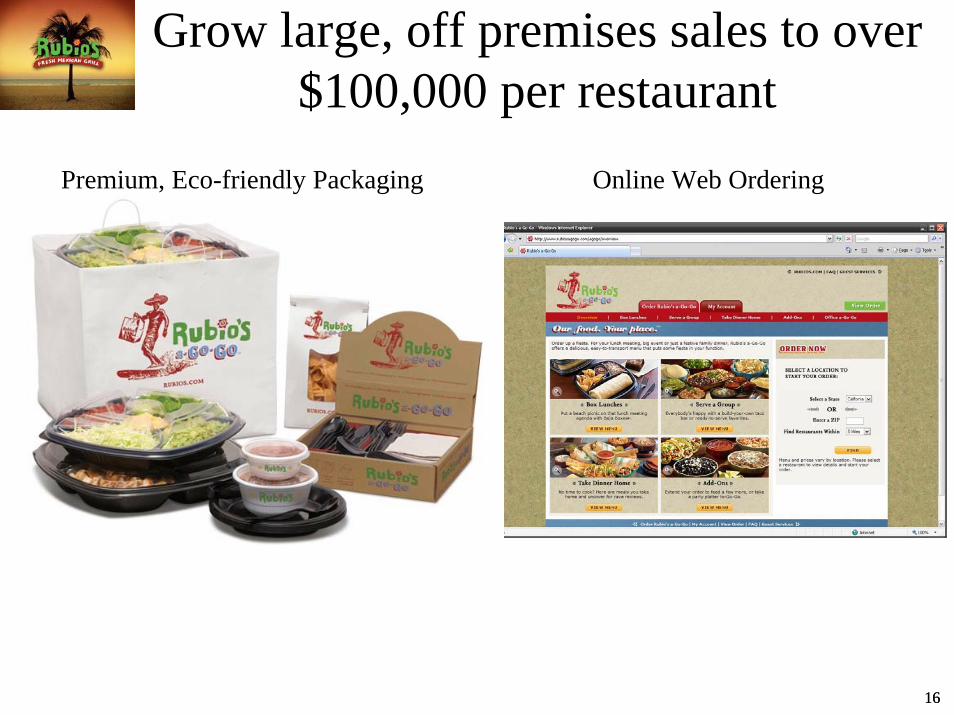
Grow large, off premises sales to over $100,000 per restaurant
Premium, Eco-friendly Packaging Online Web Ordering

1717
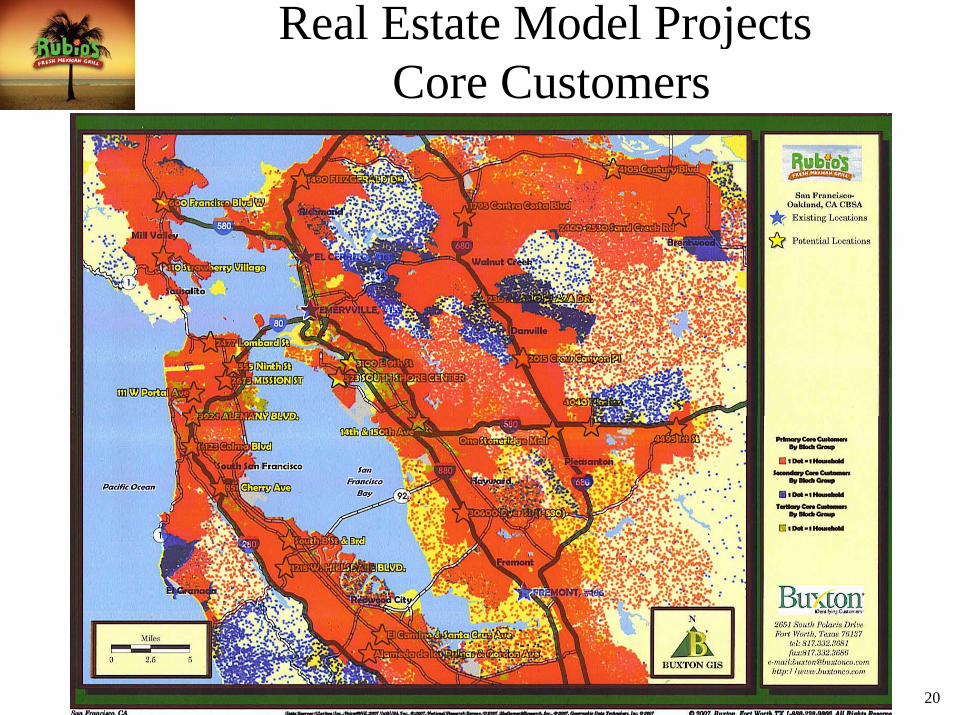
Focused Development Effort
Site Selection Process
• Fully-developed trade areas that have above average income
– High volume, upscale retail centers
– Lifestyle/entertainment centers
– Urban power dining locations
– Office complexes
• Maximize use of outdoor patio seating
• Rigorous pro forma after tax internal rate of return review (Target after Tax 20% IRR)

18
Compelling Unit Level Economics
($ in thousands) Comp Stores(1) Targeted New Stores(2)
Restaurant sales $1,017
$550
$16016%
29%
Net cash investment
$1,200
$600
$24020%
Restaurant cash flow(3)
% Margin(3)
Cash return on cash investment(3) 40%
(1) Figures reflect averages for the 160 Stores in the comparable base as of 6/29/08(2) New Store targeted unit economics for year three in mature markets(3) Computed using pre-tax restaurant cash flows
Quality site selection and effective execution leads to superior returns

19
New Restaurant Design
20
Real Estate Model ProjectsCore Customers

212121
Foreclosure Maps - Denver

22
Opportunity in Mature Trade Areas Evidenced by Recent NSO Success
New Store Weeks Open
AWS Annualized Market AWS % Over Market
The Plant 16 22,563 $1.2MM 20,770 8.6%
Rancho Cordova 10 27,224 $1.4MM 19,221 41.6%
Stockton 7 21,991 $1.1MM 20,035 9.8%
Pleasant Hill 3 38,996 $2.0MM 23,865 63.4%
2323
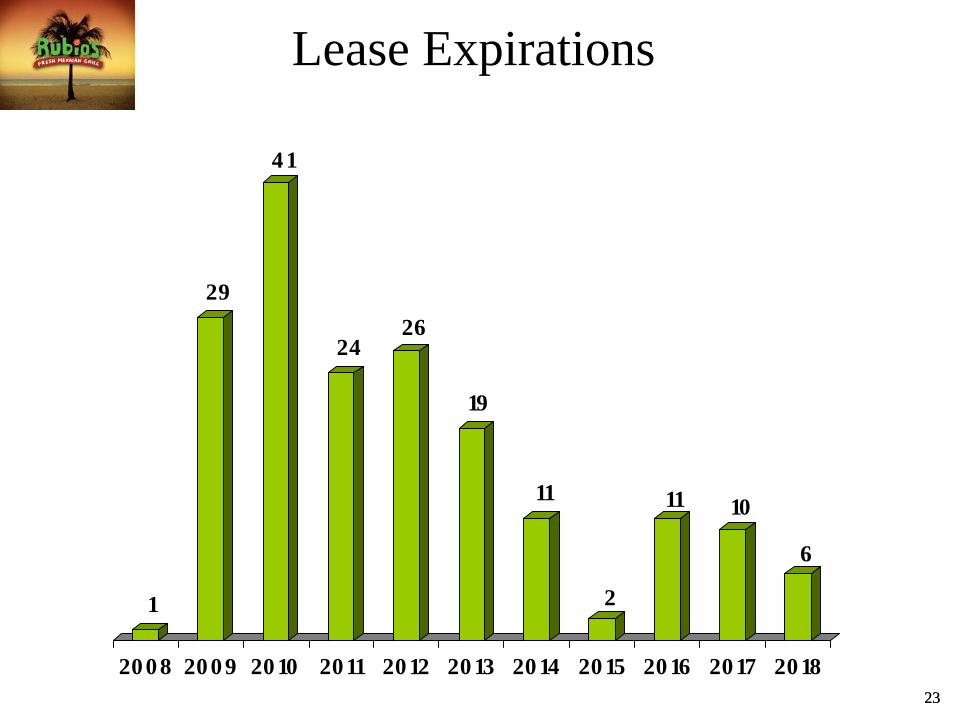
Lease Expirations
1
29
4 1
2426
19
11
2
11 10
6
20 08 20 0 9 20 10 2011 2012 20 13 20 14 20 15 20 16 2017 2018

2424
Cost Savings Initiatives
G&A Restructure $300,000 ‘08 & $600,000 ’09
Upgraded Labor Management System Q2 ‘07 Q2 ‘0832.0% to 31.3%
Unit Operating Expense Saving
Cost of Sales- Comprehensive Food Cost Review- Menu Cost - Multi-Sourcing
Q2 ‘07 Q2 ‘0811.7% to 11.5%
Q1 ‘08 Q2 ‘0829.2% to 28.8%

25
Strong Leverageable TeamYears
ExperiencePrevious Experience
Dan PittardPresident & CEO 30
Marc SimonSenior V. P. Operations 30
Larry RusinkoSenior V. P. Marketing 19
Ken HullSenior V. P. Development 26
Gerry LeneweaverSenior V. P. People Services 30
Frank HenigmanChief Financial Officer 20

26
Summary
STRATEGY PROGRESS
1. Create delicious Baja inspired foods with unique flavorful tastes derived from a perfect blend of spices for the respective proteins.
9 new items introduced
2. Position the brand around Beach Mex with two-prong promotion strategy. Beach Shack 6% MixGGTs – 8% Mix
3. Grow off premises business with best in class packaging, on line and text ordering as well as delivery in select trade areas.
From $25,000 to $47,000
4. Focus growth of new units in mature, above average income trade areas and close restaurants at the end of their leases in lower income trade areas that are under performing.
Last 4 units AUV run rate above $1.2 million
5. Maintain tight cost controls and achieve economies of scale with growth.
G&A $600,000 annualNew systems installed

2727
Rubio’s Competitive Edge
Adults 25-49 w/above average income & education who crave
unsurpassed flavorful foods, are health conscious, have limited time for a meal or snack (10-30 minutes) and
expect to spend $6-$10 for a meal.
Advantage vs. Competition
27
� QSR’s-Quality� Fast Casual-Variety/Unique Products
� Casual Dining-Price/Cost

Market Outlook
Strategy
Results

29
Value Perceptions Among Much of Core Target is Improving
52%
69%
0%
10%
20%
30%
40%
50%
60%
70%
80%
Under $50K Over $50K
2005 2006 2007
55%
64%
0%
10%
20%
30%
40%
50%
60%
70%
16-34yrs 35+yrs
2005 2006 2007
Value for the Money
Income Age
30
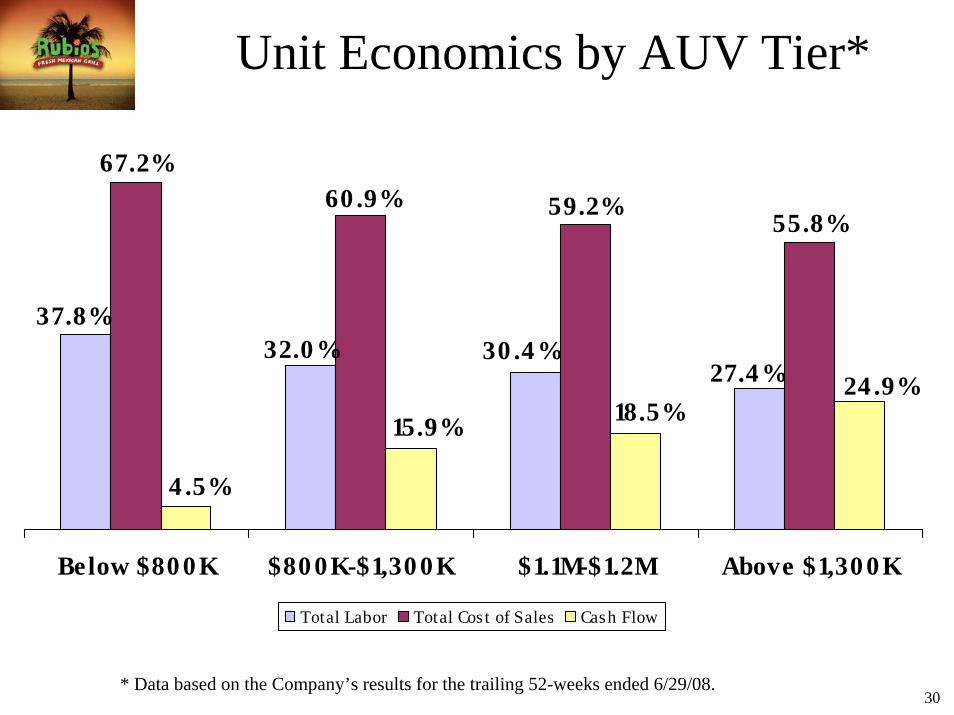
Unit Economics by AUV Tier*
* Data based on the Company’s results for the trailing 52-weeks ended 6/29/08.
27.4%30 .4%32.0 %
37.8%
55.8%59.2%
67.2%60 .9%
24 .9%18.5%15.9%
4 .5%
Below $80 0K $80 0K-$1,30 0K $1.1M-$1.2M Above $1,30 0K
Total Labor Total Cos t of Sales Cash Flow

3131
Comp Sales
4 .9%
8.3% 7.8% 7.1%
2.1%
-3.3% -3.9%
-6.5%
0.2%
Q42006
Q12007
Q22007
Q32007
Q42007
Q12008
Q22008
Q3Pre-7/ 15
Q37/ 15-8/ 31
*Actual comp sales of 1.7% adjusted to exclude estimated impact of Southern California wildfires. Estimated lost sales due to fires of $180,000 would have added 0.4% to comp figure.
1.7%
New Menu

32
Adjusted EBITDA vs. Same Quarter Prior Year*
*Adjusted EBITDA calculated as reported by the Company in its earnings releases for each of the quarterly periods listed above.
($1.0 )
$2.5$2.2
$2.8 $2.6
$3.3 $3.1
$3.8
$2.5 $2.4$2.8
$1.4
$3.3 $3.4
Q4 '06 Q1 '07 Q2 '07 Q3 '07 Q4 '07 Q1 '08 Q2 '08
‘07‘06 ‘07‘06 ‘07 ‘08 ‘07 ‘08‘05 ‘06 ‘06 ‘07 ‘07‘06