2009 final report team 14
TRANSCRIPT
Team 14:
Going Green
Engineering 340
Calvin College
5/19/2009
Final Design Report
Mike Vander Ploeg
Michael Dirkse
Jeff Bergman
1
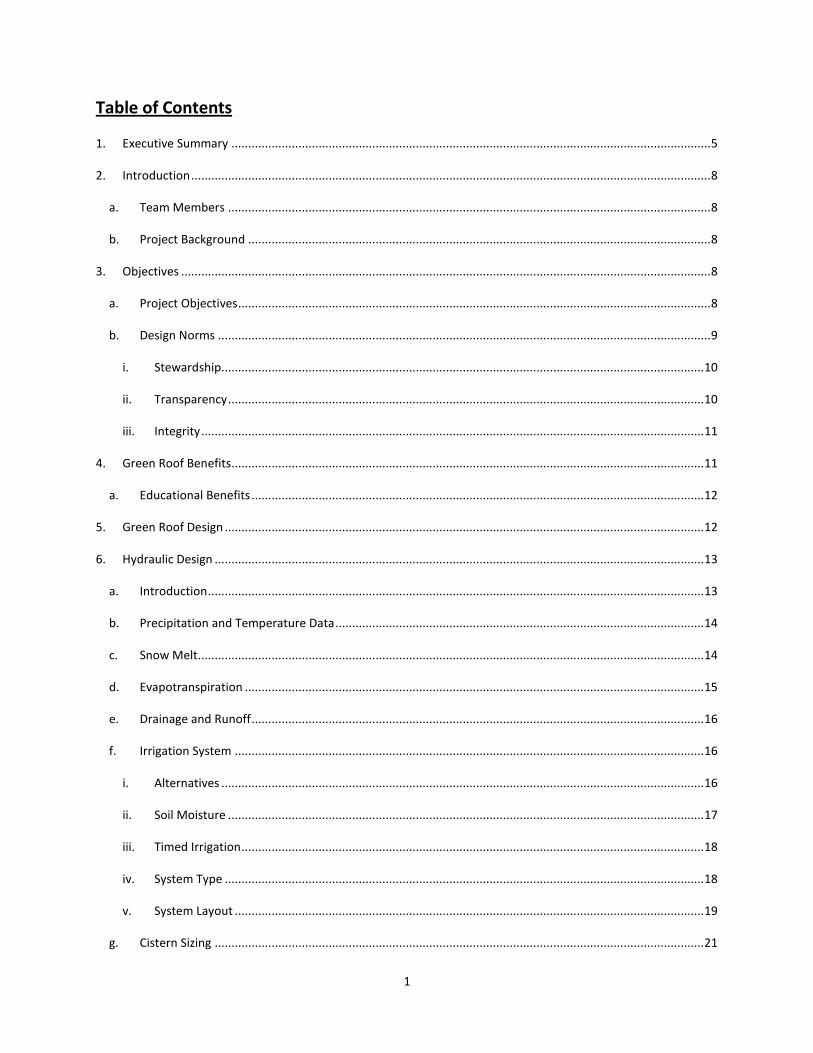
Table of Contents
1. Executive Summary ............................................................................................................................................... 5
2. Introduction ........................................................................................................................................................... 8
a. Team Members ................................................................................................................................................ 8
b. Project Background .......................................................................................................................................... 8
3. Objectives .............................................................................................................................................................. 8
a. Project Objectives ............................................................................................................................................. 8
b. Design Norms ................................................................................................................................................... 9
i. Stewardship................................................................................................................................................ 10
ii. Transparency .............................................................................................................................................. 10
iii. Integrity ...................................................................................................................................................... 11
4. Green Roof Benefits............................................................................................................................................. 11
a. Educational Benefits ....................................................................................................................................... 12
5. Green Roof Design ............................................................................................................................................... 12
6. Hydraulic Design .................................................................................................................................................. 13
a. Introduction .................................................................................................................................................... 13
b. Precipitation and Temperature Data .............................................................................................................. 14
c. Snow Melt....................................................................................................................................................... 14
d. Evapotranspiration ......................................................................................................................................... 15
e. Drainage and Runoff ....................................................................................................................................... 16
f. Irrigation System ............................................................................................................................................ 16
i. Alternatives ................................................................................................................................................ 16
ii. Soil Moisture .............................................................................................................................................. 17
iii. Timed Irrigation .......................................................................................................................................... 18
iv. System Type ............................................................................................................................................... 18
v. System Layout ............................................................................................................................................ 19
g. Cistern Sizing .................................................................................................................................................. 21
2
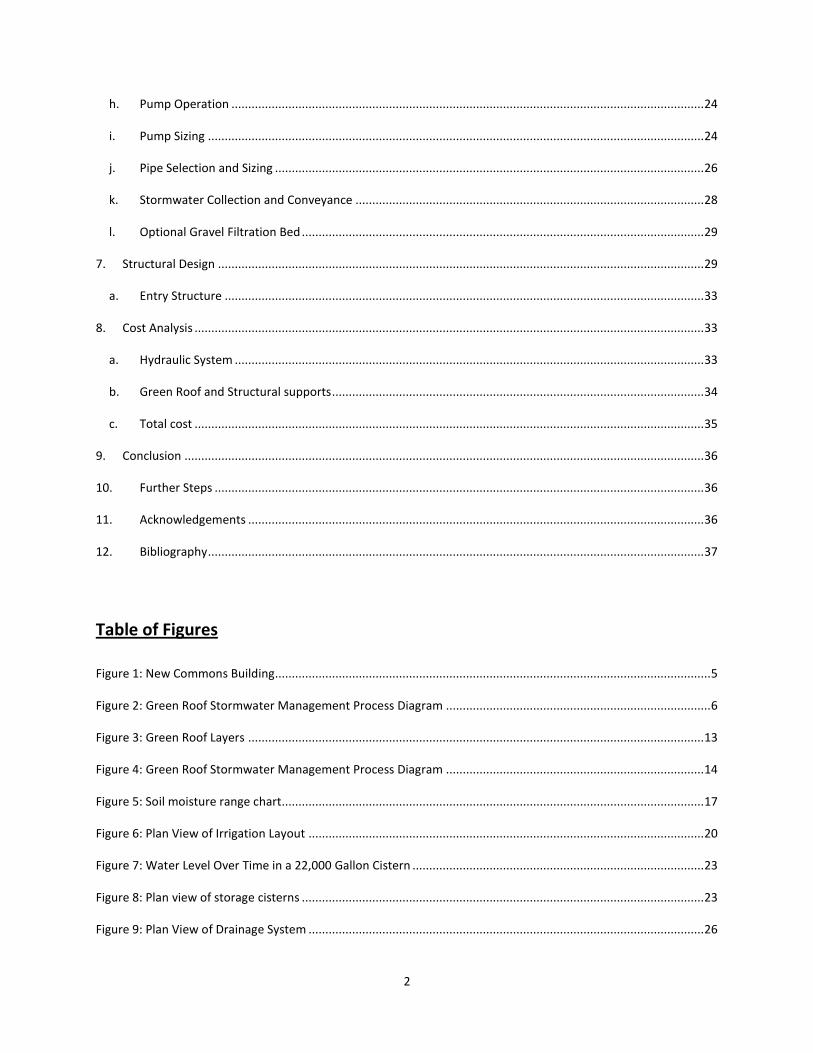
h. Pump Operation ............................................................................................................................................. 24
i. Pump Sizing .................................................................................................................................................... 24
j. Pipe Selection and Sizing ................................................................................................................................ 26
k. Stormwater Collection and Conveyance ........................................................................................................ 28
l. Optional Gravel Filtration Bed ........................................................................................................................ 29
7. Structural Design ................................................................................................................................................. 29
a. Entry Structure ............................................................................................................................................... 33
8. Cost Analysis ........................................................................................................................................................ 33
a. Hydraulic System ............................................................................................................................................ 33
b. Green Roof and Structural supports ............................................................................................................... 34
c. Total cost ........................................................................................................................................................ 35
9. Conclusion ........................................................................................................................................................... 36
10. Further Steps .................................................................................................................................................. 36
11. Acknowledgements ........................................................................................................................................ 36
12. Bibliography .................................................................................................................................................... 37
Table of Figures
Figure 1: New Commons Building .................................................................................................................................. 5
Figure 2: Green Roof Stormwater Management Process Diagram ............................................................................... 6
Figure 3: Green Roof Layers ........................................................................................................................................ 13
Figure 4: Green Roof Stormwater Management Process Diagram ............................................................................. 14
Figure 5: Soil moisture range chart.............................................................................................................................. 17
Figure 6: Plan View of Irrigation Layout ...................................................................................................................... 20
Figure 7: Water Level Over Time in a 22,000 Gallon Cistern ....................................................................................... 23
Figure 8: Plan view of storage cisterns ........................................................................................................................ 23
Figure 9: Plan View of Drainage System ...................................................................................................................... 26
3
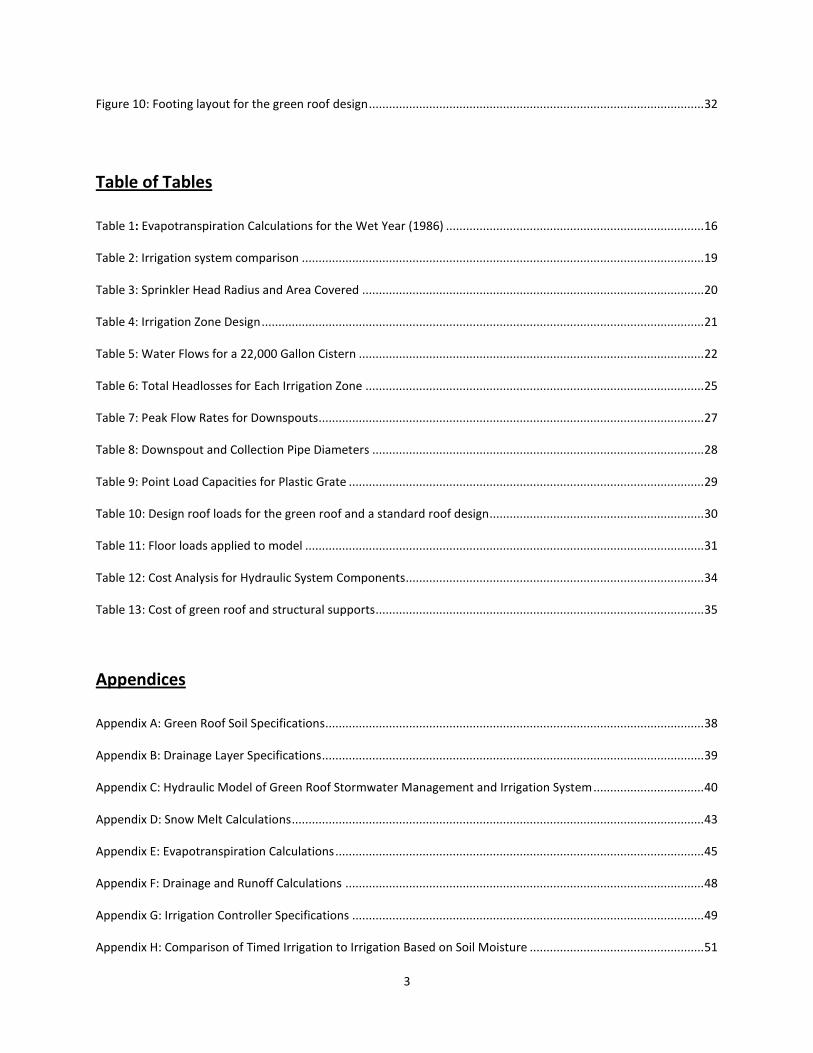
Figure 10: Footing layout for the green roof design .................................................................................................... 32
Table of Tables
Table 1: Evapotranspiration Calculations for the Wet Year (1986) ............................................................................. 16
Table 2: Irrigation system comparison ........................................................................................................................ 19
Table 3: Sprinkler Head Radius and Area Covered ...................................................................................................... 20
Table 4: Irrigation Zone Design .................................................................................................................................... 21
Table 5: Water Flows for a 22,000 Gallon Cistern ....................................................................................................... 22
Table 6: Total Headlosses for Each Irrigation Zone ..................................................................................................... 25
Table 7: Peak Flow Rates for Downspouts................................................................................................................... 27
Table 8: Downspout and Collection Pipe Diameters ................................................................................................... 28
Table 9: Point Load Capacities for Plastic Grate .......................................................................................................... 29
Table 10: Design roof loads for the green roof and a standard roof design................................................................ 30
Table 11: Floor loads applied to model ....................................................................................................................... 31
Table 12: Cost Analysis for Hydraulic System Components......................................................................................... 34
Table 13: Cost of green roof and structural supports .................................................................................................. 35
Appendices
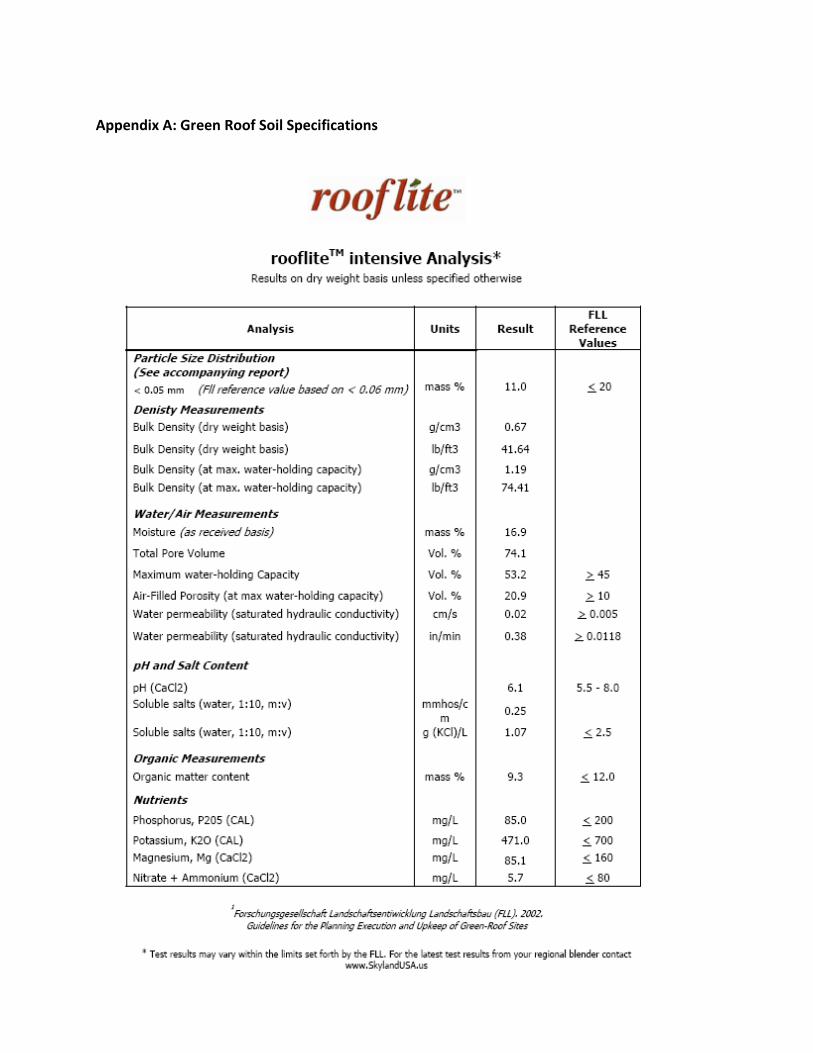
Appendix A: Green Roof Soil Specifications................................................................................................................. 38
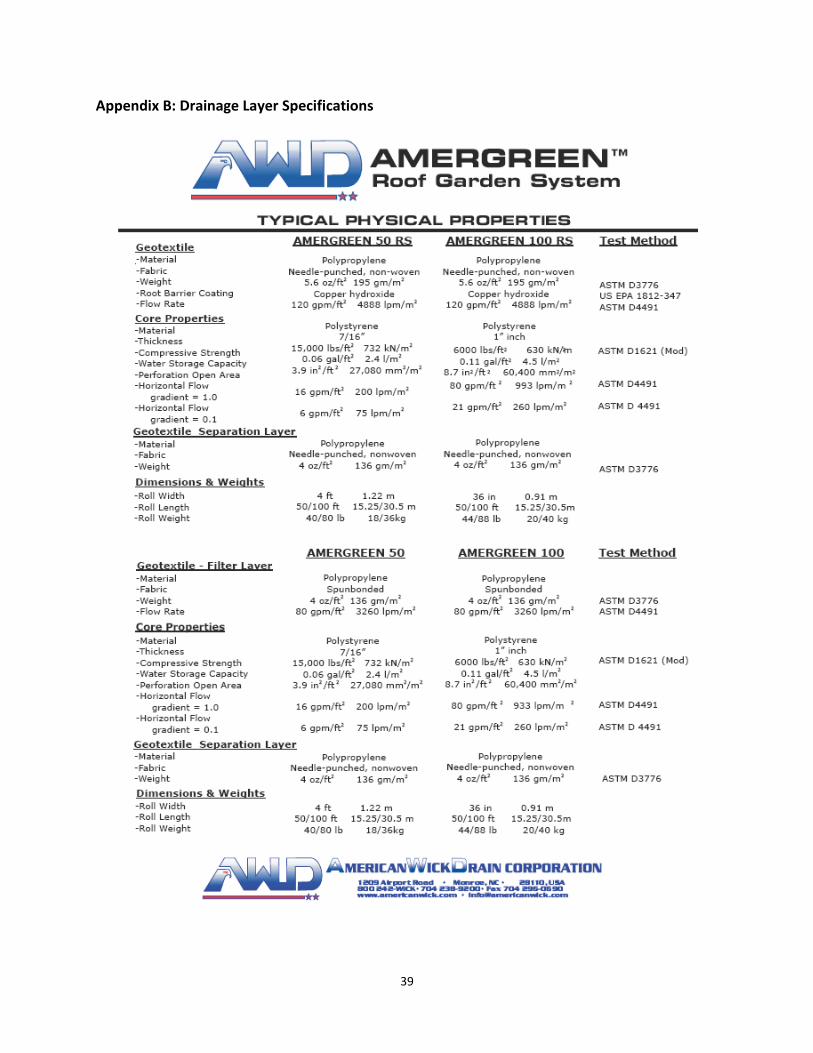
Appendix B: Drainage Layer Specifications .................................................................................................................. 39
Appendix C: Hydraulic Model of Green Roof Stormwater Management and Irrigation System ................................. 40
Appendix D: Snow Melt Calculations ........................................................................................................................... 43
Appendix E: Evapotranspiration Calculations .............................................................................................................. 45
Appendix F: Drainage and Runoff Calculations ........................................................................................................... 48
Appendix G: Irrigation Controller Specifications ......................................................................................................... 49
Appendix H: Comparison of Timed Irrigation to Irrigation Based on Soil Moisture .................................................... 51
4
Appendix I: Sprinkler Head Specifications ................................................................................................................... 53
Appendix J: Annual Energy Costs for Pumps ............................................................................................................... 54
Appendix K: Pump Curves and Specifications .............................................................................................................. 55
Appendix L: Minor Head losses Due to Pipe Bends ..................................................................................................... 58
Appendix M: Head losses for Pipes in each Irrigation Zone ........................................................................................ 60
Appendix N: Pump Head Calculations ......................................................................................................................... 61
Appendix O: Peak Flow Rate Calculations for Downspouts ......................................................................................... 62
Appendix P: IDF Curve for Kent County ....................................................................................................................... 63
Appendix Q: Downspout Size Calculations .................................................................................................................. 64
Appendix R: Drainage and Collection Pipe Calculations .............................................................................................. 65
Appendix S: Drainage Channel Size Calculations ......................................................................................................... 67
Appendix T: Beam and Column Check Calculations .................................................................................................... 68
Appendix U: Foundation Design and Calculations ....................................................................................................... 79
5
1. Executive Summary
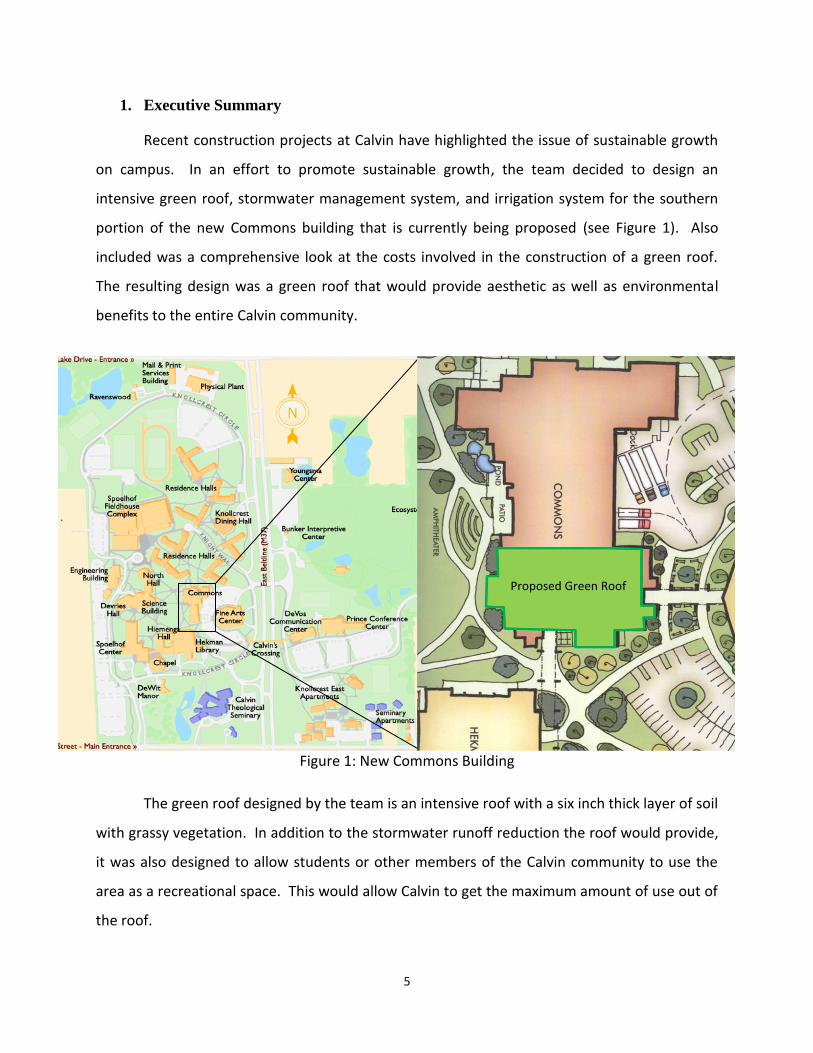
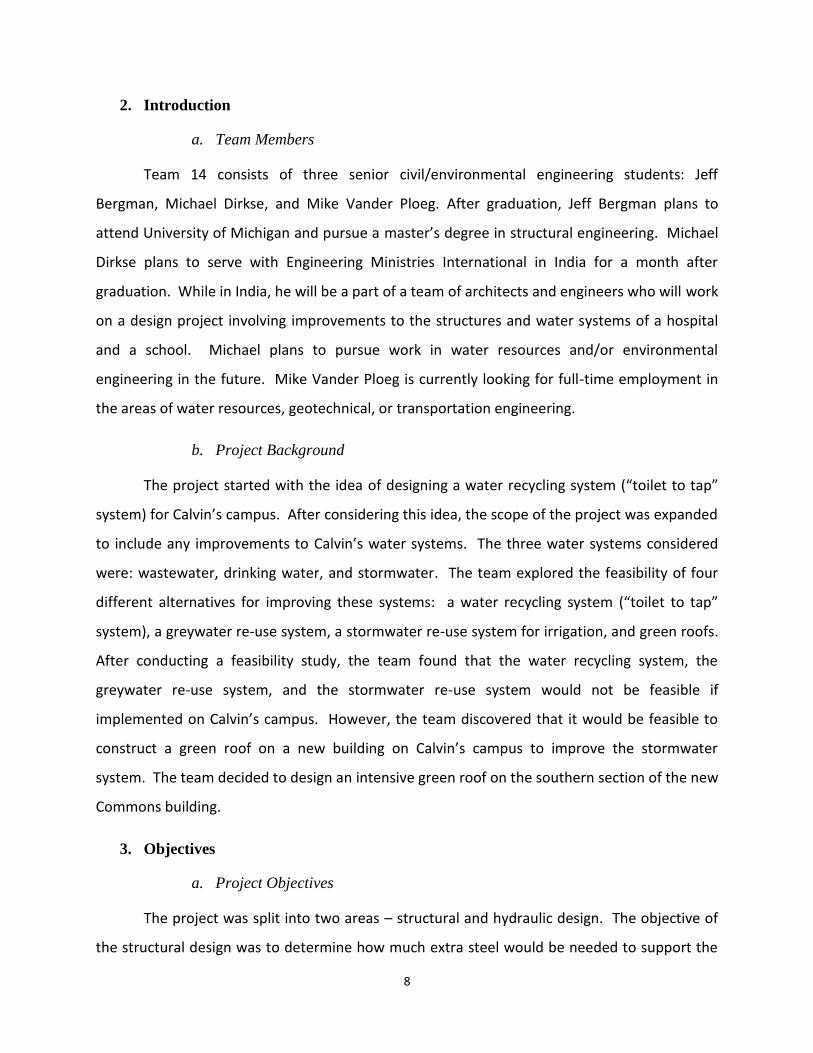
Recent construction projects at Calvin have highlighted the issue of sustainable growth
on campus. In an effort to promote sustainable growth, the team decided to design an
intensive green roof, stormwater management system, and irrigation system for the southern
portion of the new Commons building that is currently being proposed (see Figure 1). Also
included was a comprehensive look at the costs involved in the construction of a green roof.
The resulting design was a green roof that would provide aesthetic as well as environmental
benefits to the entire Calvin community.
Figure 1: New Commons Building
The green roof designed by the team is an intensive roof with a six inch thick layer of soil
with grassy vegetation. In addition to the stormwater runoff reduction the roof would provide,
it was also designed to allow students or other members of the Calvin community to use the
area as a recreational space. This would allow Calvin to get the maximum amount of use out of
the roof.
Proposed Green Roof
6
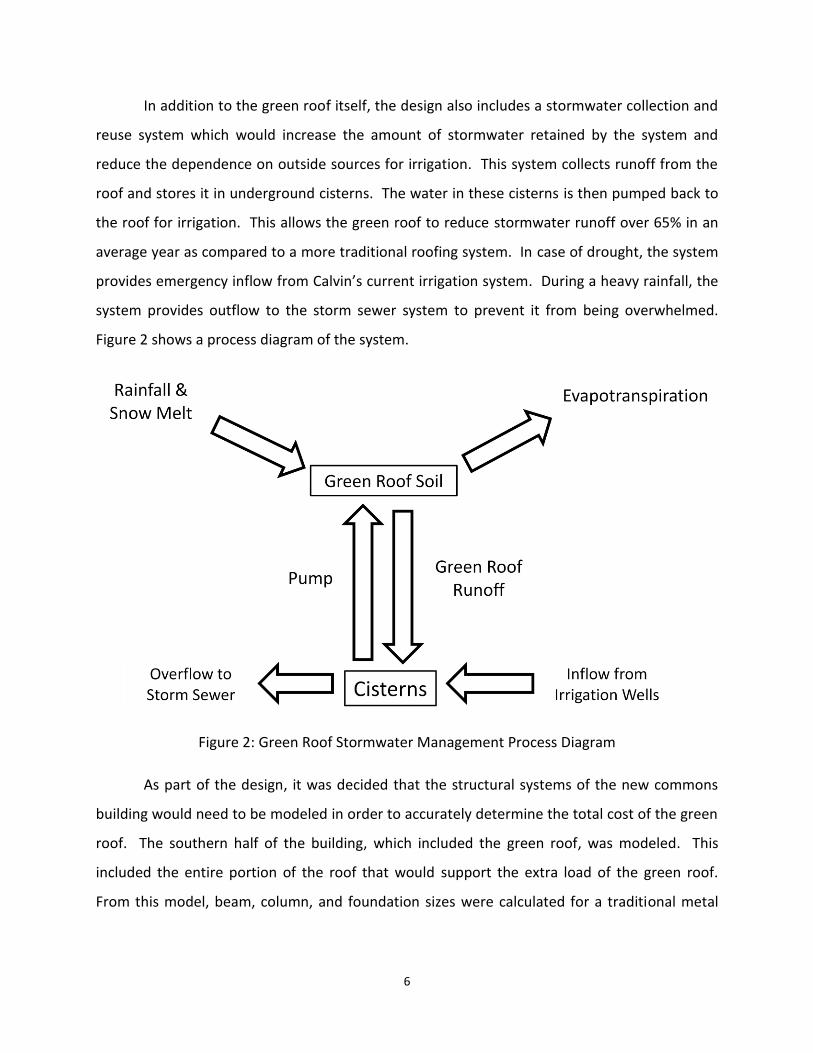
In addition to the green roof itself, the design also includes a stormwater collection and
reuse system which would increase the amount of stormwater retained by the system and
reduce the dependence on outside sources for irrigation. This system collects runoff from the
roof and stores it in underground cisterns. The water in these cisterns is then pumped back to
the roof for irrigation. This allows the green roof to reduce stormwater runoff over 65% in an
average year as compared to a more traditional roofing system. In case of drought, the system
provides emergency inflow from Calvin’s current irrigation system. During a heavy rainfall, the
system provides outflow to the storm sewer system to prevent it from being overwhelmed.
Figure 2 shows a process diagram of the system.
Figure 2: Green Roof Stormwater Management Process Diagram
As part of the design, it was decided that the structural systems of the new commons
building would need to be modeled in order to accurately determine the total cost of the green
roof. The southern half of the building, which included the green roof, was modeled. This
included the entire portion of the roof that would support the extra load of the green roof.
From this model, beam, column, and foundation sizes were calculated for a traditional metal
7
roof and the green roof. Comparing the extra support required for the green roof to the
standard roof allowed a good estimation of the additional costs for the green roof.
The total cost for the irrigation system was estimated at $41,000. This includes the
cisterns, pumps, sprinkler heads, and all required piping. The extra cost for the green roof
compared to a metal roof came out as estimated at $350,000. The total cost of the green roof is
around $700,000 or $32 per square foot. The entire green roof project would total less than
2.8% of the budget for the entire $25 million commons renovation project.
In order to pursue this project, it is recommended that Calvin begin talking local
engineering firms with experience in green roof design and construction. With their help,
Calvin can further refine the green roof design and move to a construction phase.
8
2. Introduction
a. Team Members
Team 14 consists of three senior civil/environmental engineering students: Jeff
Bergman, Michael Dirkse, and Mike Vander Ploeg. After graduation, Jeff Bergman plans to
attend University of Michigan and pursue a master’s degree in structural engineering. Michael
Dirkse plans to serve with Engineering Ministries International in India for a month after
graduation. While in India, he will be a part of a team of architects and engineers who will work
on a design project involving improvements to the structures and water systems of a hospital
and a school. Michael plans to pursue work in water resources and/or environmental
engineering in the future. Mike Vander Ploeg is currently looking for full-time employment in
the areas of water resources, geotechnical, or transportation engineering.
b. Project Background
The project started with the idea of designing a water recycling system (“toilet to tap”
system) for Calvin’s campus. After considering this idea, the scope of the project was expanded
to include any improvements to Calvin’s water systems. The three water systems considered
were: wastewater, drinking water, and stormwater. The team explored the feasibility of four
different alternatives for improving these systems: a water recycling system (“toilet to tap”
system), a greywater re-use system, a stormwater re-use system for irrigation, and green roofs.
After conducting a feasibility study, the team found that the water recycling system, the
greywater re-use system, and the stormwater re-use system would not be feasible if
implemented on Calvin’s campus. However, the team discovered that it would be feasible to
construct a green roof on a new building on Calvin’s campus to improve the stormwater
system. The team decided to design an intensive green roof on the southern section of the new
Commons building.
3. Objectives
a. Project Objectives
The project was split into two areas – structural and hydraulic design. The objective of
the structural design was to determine how much extra steel would be needed to support the
9
additional loads of a green roof compared to a conventional roof. To achieve this goal, the
team sought to model the beams and columns for the portion of the new Commons building
that would support the green roof. The objective of the hydraulic portion of the project was to
design a stormwater recycling and irrigation system which would provide adequate irrigation to
the vegetation on the green roof and provide a significant reduction in stormwater runoff when
compared to the runoff from a traditional roof of the same size. The team sought to optimally
size different components of the hydraulic system such as storage cisterns, pumps, pipes, and
sprinkler heads. An overall project objective was to complete a cost analysis of both the
hydraulic system and the structural requirements for the construction of a green roof on the
southern portion of the new commons building.
b. Design Norms
Design norms played an important role in this project because they provided ethical and
moral guidelines for the design. In an engineering design process it is critical to not only
evaluate the design from a technical perspective, but also from an ethical and moral
perspective. The way a design fits into the surrounding environment and culture is something
that cannot be overlooked in the design process. It is important to consider the impact that
design decisions will have on the people that will use the system that is being designed.
Three design norms applied specifically to the design of the green roof for the new
Commons building: stewardship, transparency, and integrity. The team sought to incorporate
these design norms into all design decisions. Stewardship in an engineering design accounts for
how well resources are used. Any engineering project will utilize both financial and
environmental resources. These resources should be used efficiently and in ways that preserve
the natural environment. People usually interact with engineered systems every day.
Transparency is a design norm that evaluates how well the users of the designed system
understand the system they interact with. It is critical for the users of the system to know why
the system was designed and what function it performs. Integrity in an engineering design
evaluates how close the appearance of the design is to the actual function of the design. Some
10
engineered systems may appear to perform a certain function, but if they do not actually
perform this function adequately, then the design does not show integrity.
i. Stewardship
As a Christian college, Calvin seeks to act as stewards of God’s creation. Stewardship
includes the responsibility to use natural resources and preserve ecosystems in a way that
honors God. With the addition of a green roof, Calvin can more efficiently manage its water
resources and preserve the natural environment. The stormwater recycling system will
significantly reduce the amount stormwater runoff from the roof of the commons building.
Stormwater runoff from the commons building currently flows into the seminary pond. This
stormwater contains fertilizers and other nutrients. When excess amounts of nutrients
accumulate in the seminary pond, this causes significant algae growth. When the growth of
algae becomes excessive, the amount of dissolved oxygen in the seminary pond decreases
significantly. Decreased dissolved oxygen levels are detrimental to aquatic life and disruptive to
the ecosystem of the pond. When stormwater runoff is decreased, it helps to maintain
ecological stability and diversity of species in the seminary pond. In this way, the green roof on
the new commons building would help Calvin fulfill God’s call to be stewards of the earth by
preserving the natural environment.
In addition to acting as God’s stewards of natural resources, Calvin also seeks to use
financial resources wisely. With this in mind, the team designed the green roof, the stormwater
recycling system, and the irrigation system to be low in cost, while still fulfilling their intended
purposes. Financial stewardship in this project was sought by choosing quality, cost effective
components in the design.
ii. Transparency
Transparency was another design norm that was incorporated into the design of the
green roof. It is vital that the Calvin community will be able to understand the purpose of the
green roof and feel comfortable with how the roof looks and operates. The green roof would
provide educational opportunities, which will help students to understand how the green roof
works and the benefits it provides to Calvin and the surrounding environment. The green roof
11
can act as a teaching tool to inform students about water quality issues associated with
stormwater runoff and aquatic life.
iii. Integrity
Integrity is the third design norm that was incorporated into the design of the green
roof. It is critical that the green roof and the structure supporting it be designed to adequately
fulfill their intended purposes. The Calvin community should be assured that the green roof
and its supporting structure will not fail. When storing a lot of water on a roof, leaking is a big
concern. It is important that the Calvin community also feels confident that this will not occur.
Calvin’s students, faculty, and staff should have the assurance that the stormwater recycling
system and the irrigation system will operate correctly and efficiently.
4. Green Roof Benefits
There are many benefits associated with a green roof. The primary benefit associated
with green roofs is the amount of water they are able to retain. Thus, stormwater runoff and
its associated pollution and negative effects on pond ecosystems would be reduced. A further
benefit of a green roof is a decrease in heating and cooling costs for the building. Layers of soil
and plant matter provide extra insulation in the winter, and in the summer evapotranspiration
acts to cool the roof. A green roof could also supply extra green space for recreational use by
the Calvin community.
Constructing a building on Calvin’s campus with a green roof would provide a positive
image for the college. In recent years, building projects at Calvin have required the removal of
a number of trees from the campus. This was a move that has been strongly opposed by
students as well as donors and faculty members. For example, the building of the Spoelhof
Fieldhouse Complex required the removal of a large wooded area. This was a controversial
move among the Calvin community. The situation has been further exacerbated by the fact
that Calvin’s administration has not sought LEED certification for many of its new projects. The
addition of a green roof to the new Commons building would be a major step in repairing these
relationships and well worth the moderate investment it would require. In addition, green
roofs are perceived by many people as a sign of environmental stewardship. Calvin would
12
further build its reputation as a college that is committed to conserving natural resources if a
green roof was constructed on the new commons building.
a. Educational Benefits
A green roof can provide many opportunities for advancement in education. A green
roof can provide the Calvin community with a working example of what a green roof is.
Another educational benefit could be for students to plant gardens with different types of
plants on the roof. Planting different gardens would not only improve the aesthetic value of
the roof but also allow students to take ownership of the roof and discover what types of plants
would thrive on green roofs. Another educational benefit of the roof would be the study of the
efficiency of the green roof. Students could measure the amount of runoff from the green roof
and compare it to a standard roof. This would show the community the value a green roof has
in stormwater reduction. Studies could also be done to analyze the quality of the recycled
stormwater that is used for irrigation on the green roof. Engineering students could design
ways to improve the quality of the stormwater, such as implementing a gravel bed for filtration.
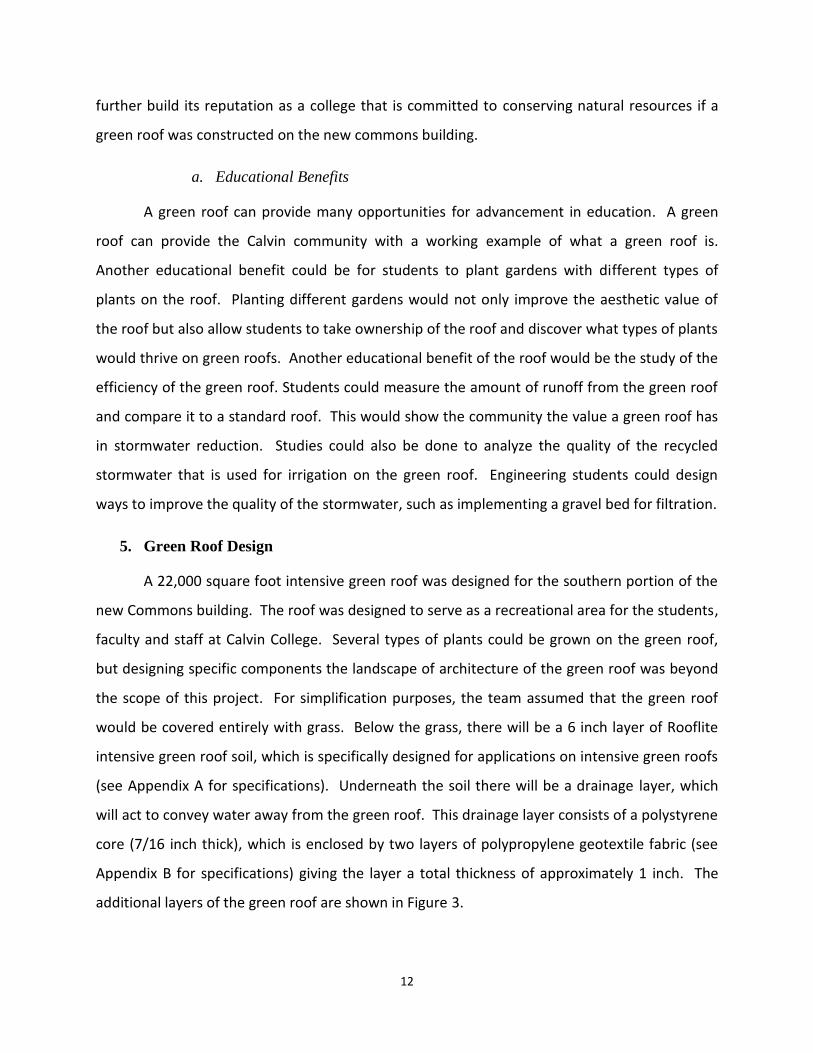
5. Green Roof Design
A 22,000 square foot intensive green roof was designed for the southern portion of the
new Commons building. The roof was designed to serve as a recreational area for the students,
faculty and staff at Calvin College. Several types of plants could be grown on the green roof,
but designing specific components the landscape of architecture of the green roof was beyond
the scope of this project. For simplification purposes, the team assumed that the green roof
would be covered entirely with grass. Below the grass, there will be a 6 inch layer of Rooflite
intensive green roof soil, which is specifically designed for applications on intensive green roofs
(see Appendix A for specifications). Underneath the soil there will be a drainage layer, which
will act to convey water away from the green roof. This drainage layer consists of a polystyrene
core (7/16 inch thick), which is enclosed by two layers of polypropylene geotextile fabric (see
Appendix B for specifications) giving the layer a total thickness of approximately 1 inch. The
additional layers of the green roof are shown in Figure 3.
13
Figure 3: Green Roof Layers
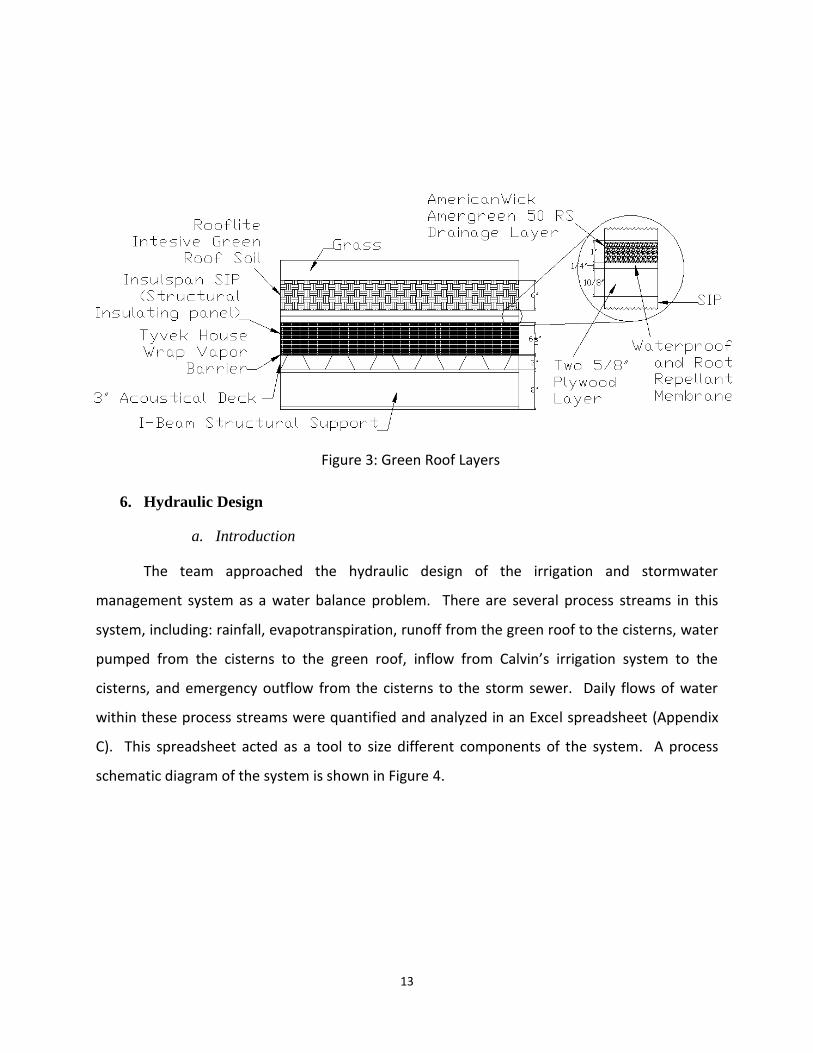
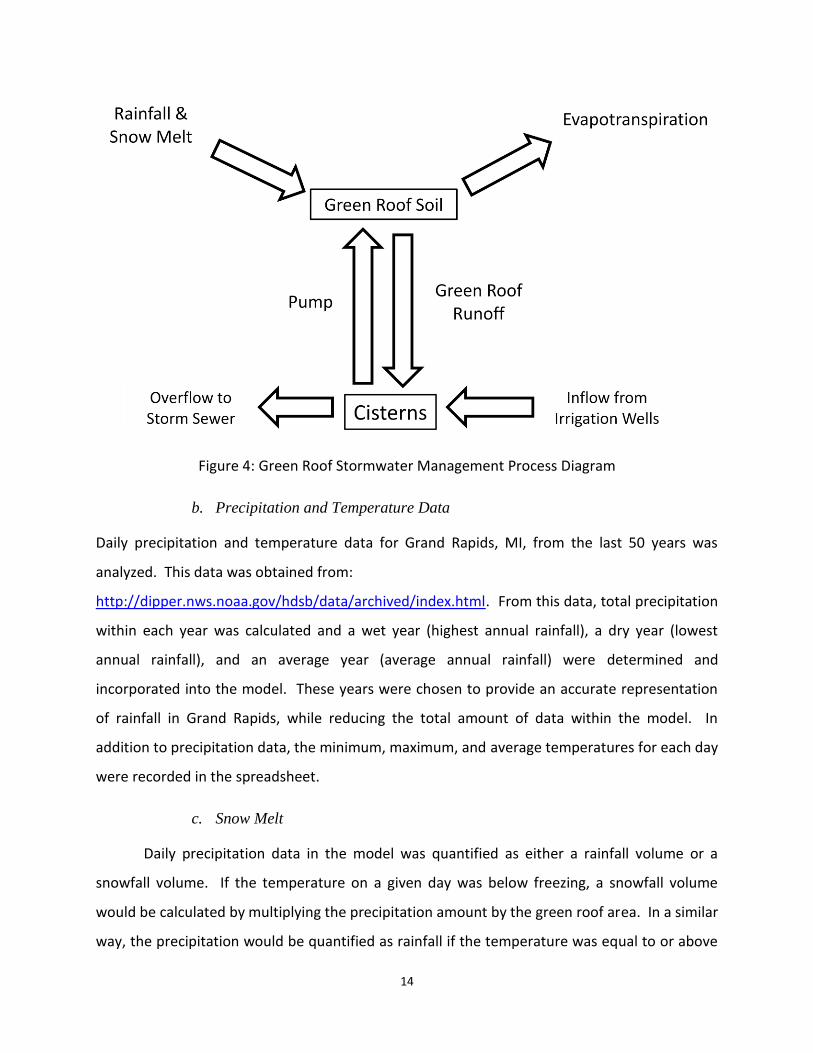
6. Hydraulic Design
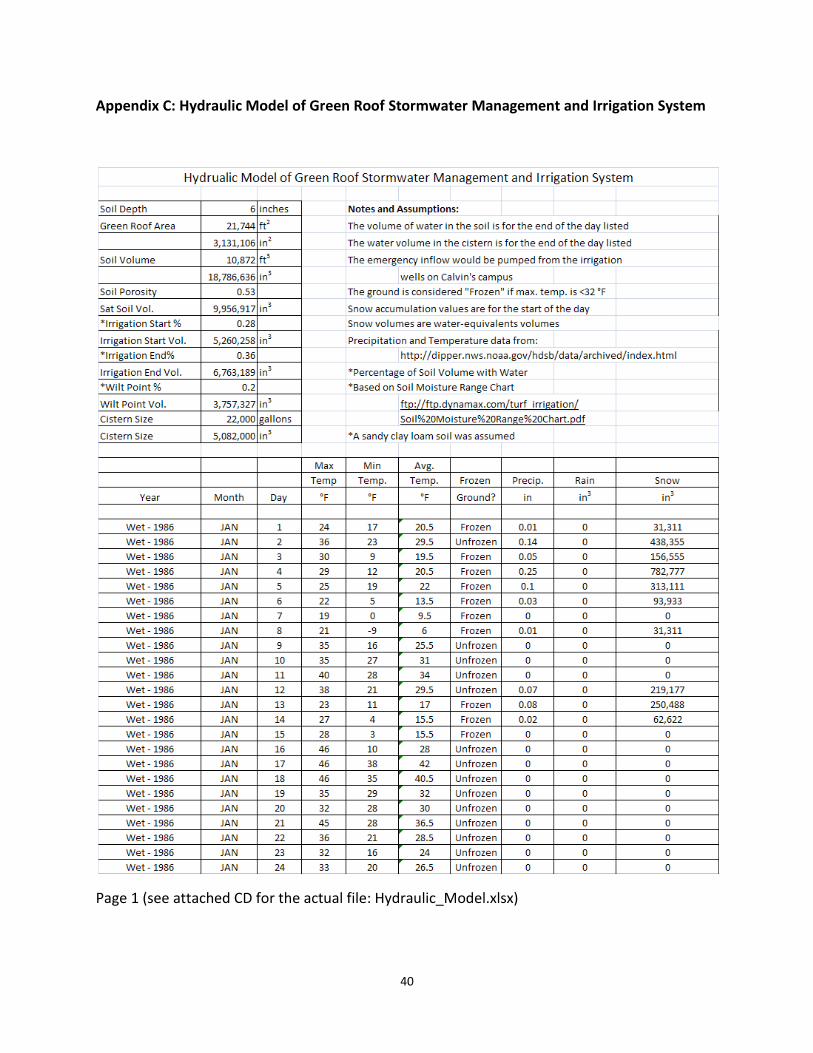
a. Introduction
The team approached the hydraulic design of the irrigation and stormwater
management system as a water balance problem. There are several process streams in this
system, including: rainfall, evapotranspiration, runoff from the green roof to the cisterns, water
pumped from the cisterns to the green roof, inflow from Calvin’s irrigation system to the
cisterns, and emergency outflow from the cisterns to the storm sewer. Daily flows of water
within these process streams were quantified and analyzed in an Excel spreadsheet (Appendix
C). This spreadsheet acted as a tool to size different components of the system. A process
schematic diagram of the system is shown in Figure 4.
14
Figure 4: Green Roof Stormwater Management Process Diagram
b. Precipitation and Temperature Data
Daily precipitation and temperature data for Grand Rapids, MI, from the last 50 years was
analyzed. This data was obtained from:
http://dipper.nws.noaa.gov/hdsb/data/archived/index.html. From this data, total precipitation
within each year was calculated and a wet year (highest annual rainfall), a dry year (lowest
annual rainfall), and an average year (average annual rainfall) were determined and
incorporated into the model. These years were chosen to provide an accurate representation
of rainfall in Grand Rapids, while reducing the total amount of data within the model. In
addition to precipitation data, the minimum, maximum, and average temperatures for each day
were recorded in the spreadsheet.
c. Snow Melt
Daily precipitation data in the model was quantified as either a rainfall volume or a
snowfall volume. If the temperature on a given day was below freezing, a snowfall volume
would be calculated by multiplying the precipitation amount by the green roof area. In a similar
way, the precipitation would be quantified as rainfall if the temperature was equal to or above
15
the freezing point. All snowfall volumes in the model are expressed as water-equivalent
volumes. The distinction between snow and rain was made in the model because spring snow
melts can cause a significant amount of runoff, which would directly affect the cistern level and
amount of discharge to the storm sewers.
Snow accumulation was quantified on a daily basis by adding the snow volume from the
previous day to the snowfall from the current day and then subtracting snow melt. A water-
equivalent snow melt volume for each day the year was calculated if there was any snow
accumulation on the roof (See Appendix D). The daily snow melt volumes were then
incorporated into calculating daily volumes of runoff from the green roof into the cisterns.
Including snow melt in the model increased the accuracy of the runoff calculations.
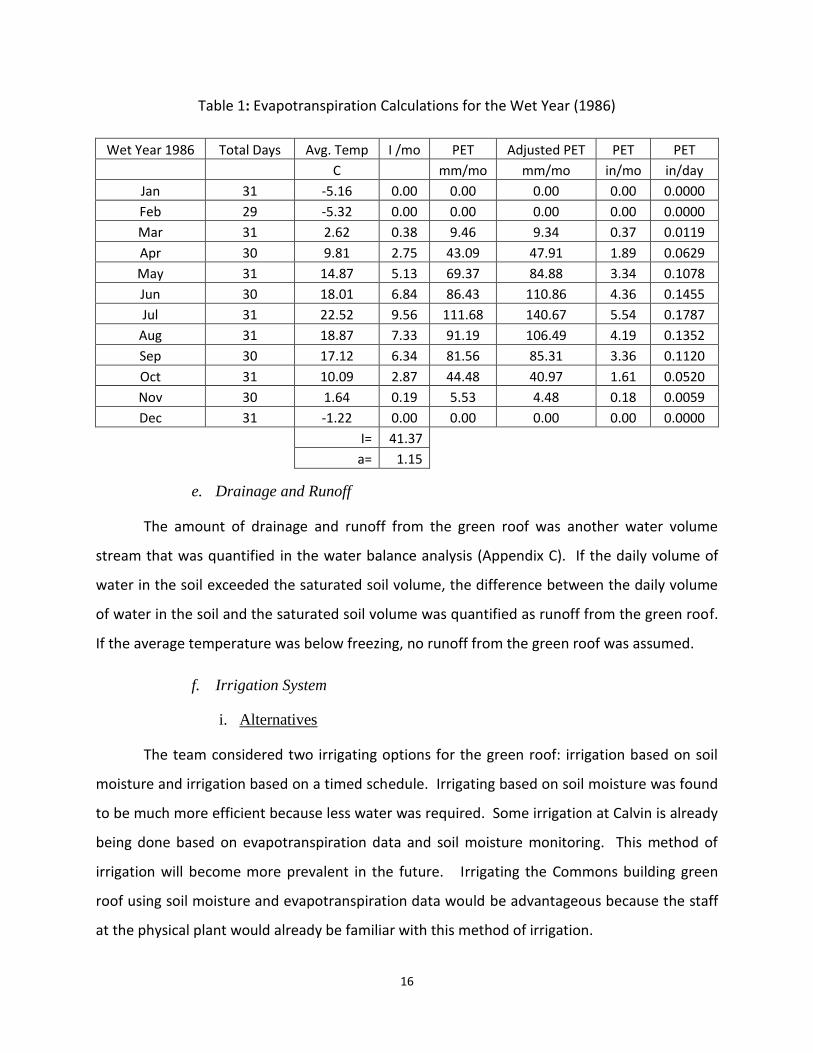
d. Evapotranspiration
Evapotranspiration is very difficult to accurately calculate because it depends on several
parameters that are highly variable and hard to quantify with readily available information.
These parameters include: wind speed, solar radiation, exposed water surface area, and
humidity. However, approximate estimates for evapotranspiration can be made using readily
available information such as air temperature. The Thornthwaite-Mather method was used to
make the evapotranspiration calculations for the green roof (See Appendix E).
Table 1 shows the evapotranspiration calculations for the wet year (1986).
Evapotranspiration data for the other two years was calculated in a similar way (See Appendix
E). The value for PET was multiplied by the area of the green roof to obtain the daily volume of
water that exited the green roof through evapotranspiration. This volume of water was
subsequently used to calculate the volume of water that was in the soil on any given day (See
Appendix F).
16
Table 1: Evapotranspiration Calculations for the Wet Year (1986)
Wet Year 1986 Total Days Avg. Temp I /mo PET Adjusted PET PET PET
C
mm/mo mm/mo in/mo in/day
Jan 31 -5.16 0.00 0.00 0.00 0.00 0.0000
Feb 29 -5.32 0.00 0.00 0.00 0.00 0.0000
Mar 31 2.62 0.38 9.46 9.34 0.37 0.0119
Apr 30 9.81 2.75 43.09 47.91 1.89 0.0629
May 31 14.87 5.13 69.37 84.88 3.34 0.1078
Jun 30 18.01 6.84 86.43 110.86 4.36 0.1455
Jul 31 22.52 9.56 111.68 140.67 5.54 0.1787
Aug 31 18.87 7.33 91.19 106.49 4.19 0.1352
Sep 30 17.12 6.34 81.56 85.31 3.36 0.1120
Oct 31 10.09 2.87 44.48 40.97 1.61 0.0520
Nov 30 1.64 0.19 5.53 4.48 0.18 0.0059
Dec 31 -1.22 0.00 0.00 0.00 0.00 0.0000
I= 41.37
a= 1.15
e. Drainage and Runoff
The amount of drainage and runoff from the green roof was another water volume
stream that was quantified in the water balance analysis (Appendix C). If the daily volume of
water in the soil exceeded the saturated soil volume, the difference between the daily volume
of water in the soil and the saturated soil volume was quantified as runoff from the green roof.
If the average temperature was below freezing, no runoff from the green roof was assumed.
f. Irrigation System
i. Alternatives
The team considered two irrigating options for the green roof: irrigation based on soil
moisture and irrigation based on a timed schedule. Irrigating based on soil moisture was found
to be much more efficient because less water was required. Some irrigation at Calvin is already
being done based on evapotranspiration data and soil moisture monitoring. This method of
irrigation will become more prevalent in the future. Irrigating the Commons building green
roof using soil moisture and evapotranspiration data would be advantageous because the staff
at the physical plant would already be familiar with this method of irrigation.
17
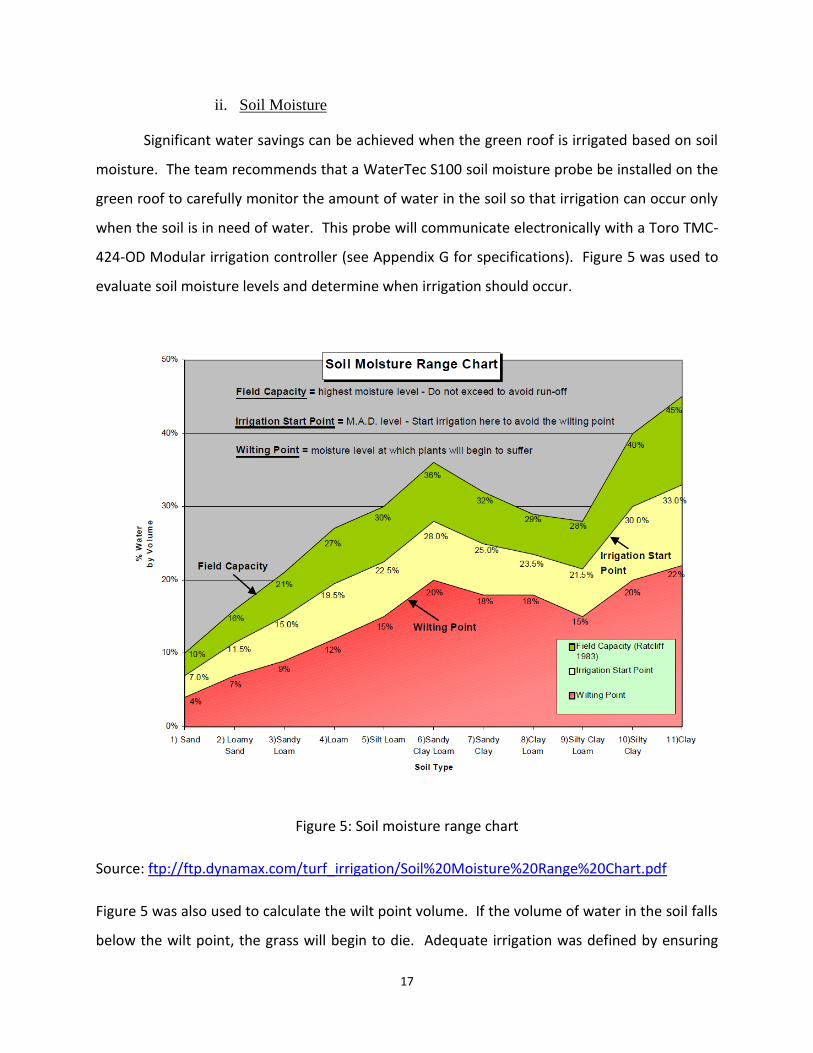
ii. Soil Moisture
Significant water savings can be achieved when the green roof is irrigated based on soil
moisture. The team recommends that a WaterTec S100 soil moisture probe be installed on the
green roof to carefully monitor the amount of water in the soil so that irrigation can occur only
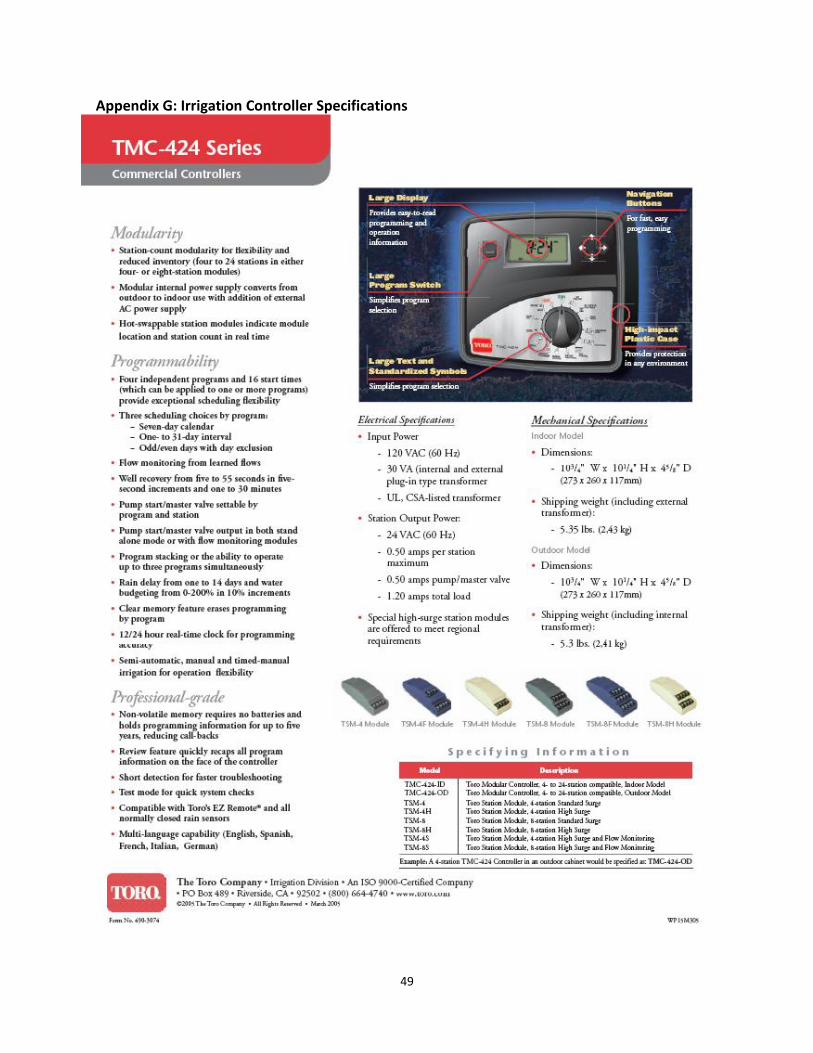
when the soil is in need of water. This probe will communicate electronically with a Toro TMC-
424-OD Modular irrigation controller (see Appendix G for specifications). Figure 5 was used to
evaluate soil moisture levels and determine when irrigation should occur.
Figure 5: Soil moisture range chart
Source: ftp://ftp.dynamax.com/turf_irrigation/Soil%20Moisture%20Range%20Chart.pdf
Figure 5 was also used to calculate the wilt point volume. If the volume of water in the soil falls
below the wilt point, the grass will begin to die. Adequate irrigation was defined by ensuring
18
that zero days within the three year period in the model had a soil water level that fell below
the wilt point. The team assumed a sandy clay loam soil. For this type of soil, irrigation should
begin when 28% of the volume of the soil is water. This “irrigation start volume” was calculated
in the model and was then compared to the water volume in the soil for each day (see
Appendix A). If the volume of water in the soil for a given day was less than the “irrigation start
volume” and no precipitation occurred for that day, irrigation would occur.
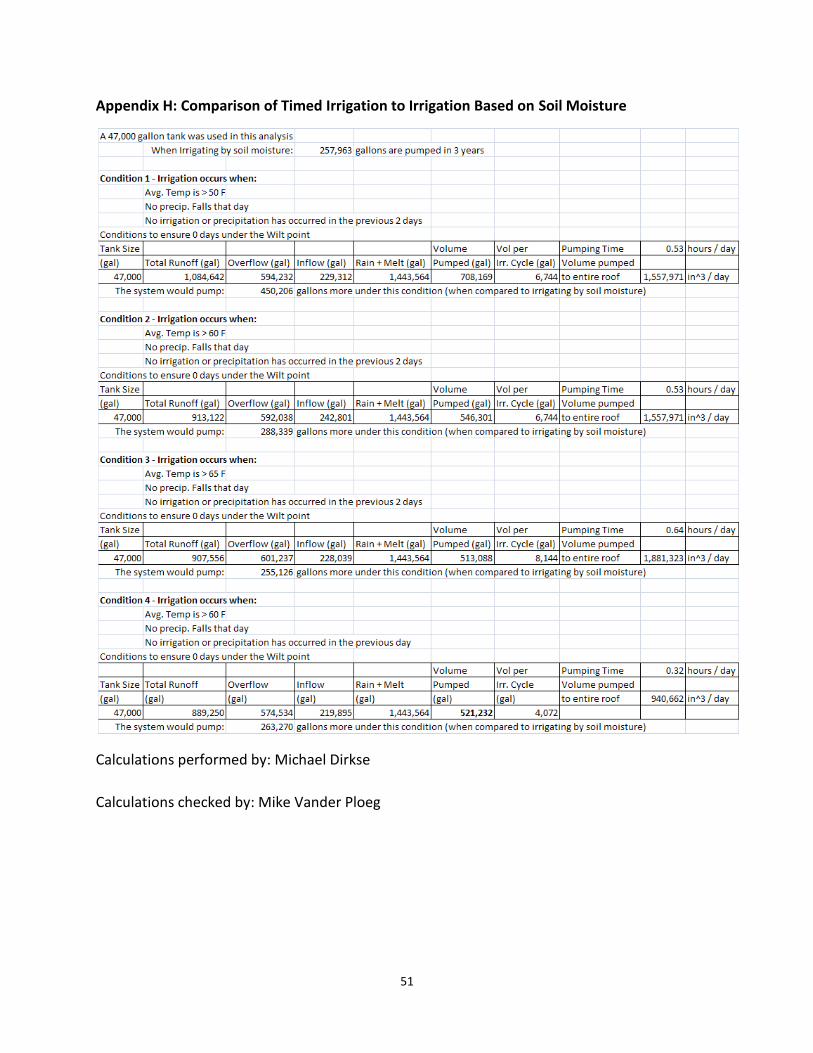
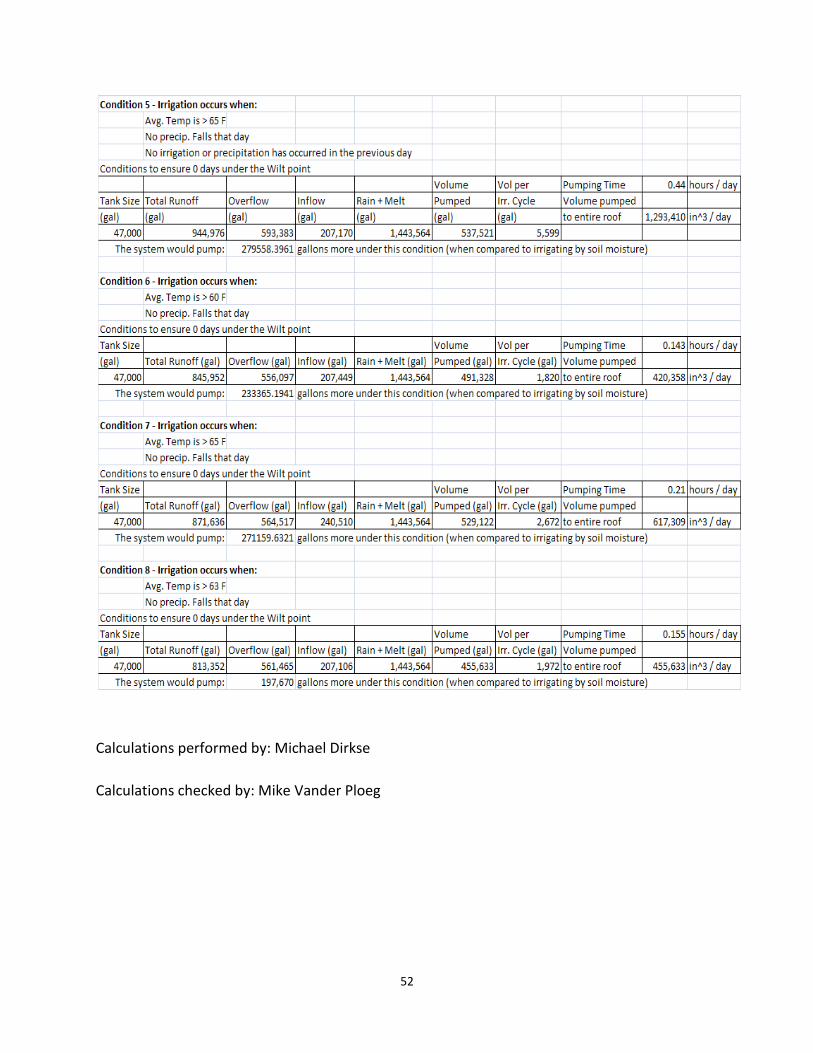
iii. Timed Irrigation
Another option for irrigation was irrigating based on rainfall, average temperature, and
irrigation on previous days. Eight different combinations of these conditions were analyzed
(See Appendix H). Based on these conditions, the amount of irrigation water that would need
to be pumped to ensure that the soil moisture level did not fall below the wilt point was
compared to the amount of water that would need to be pumped if irrigation based on soil
moisture was used instead. A total cistern volume of 47,000 gallons was used in this analysis.
The optimum condition under a timed schedule had the following criteria: irrigation would
occur when the average temperature was greater than 63 °F and no precipitation would fall
that day. Even under this condition, 1.77 times more water would have to be pumped over the
three year period in the model, when compared to irrigation based on soil moisture.
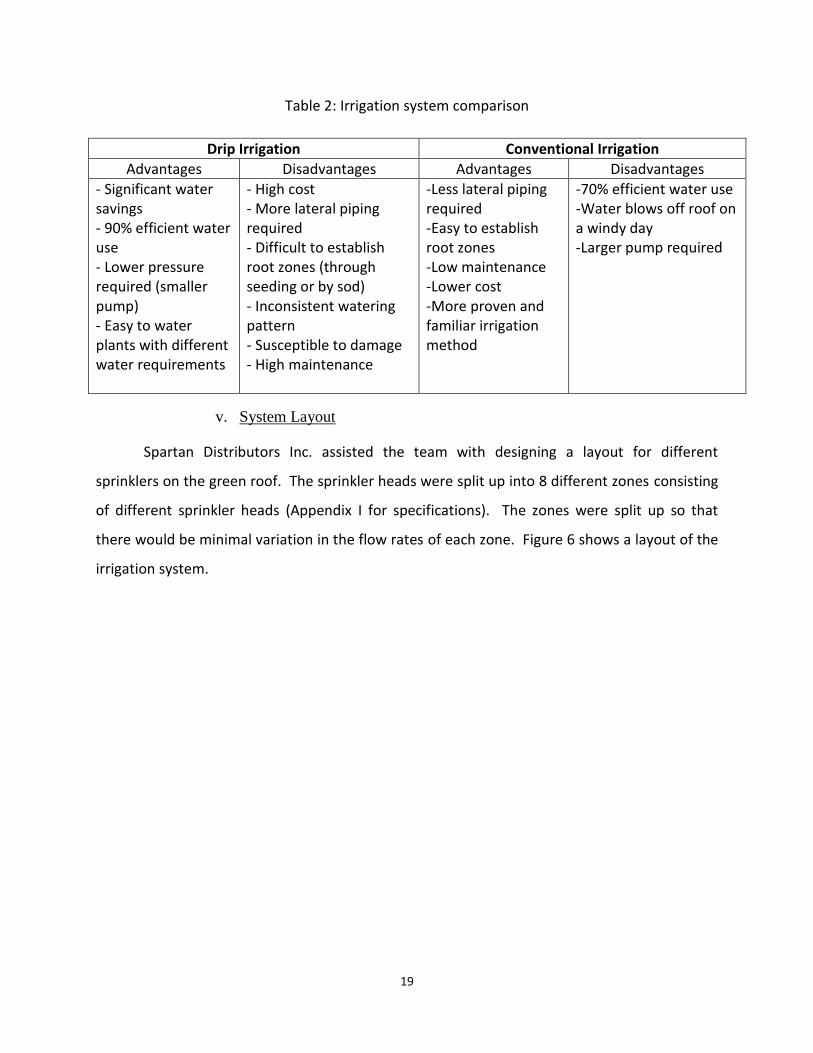
iv. System Type
The team considered two different types of irrigation for use on the green roof: drip
irrigation and conventional irrigation. The team consulted Charles Huizinga and Geoff Van
Berkel from Calvin’s physical plant, as well as Bruce Funnel from Spartan Distributors Inc. for
guidance in deciding between these two options. They recommended using a conventional
irrigation system rather than a drip irrigation system. After considering their advice and the
advantages and disadvantages of both drip and conventional irrigation, the team decided to
implement a conventional irrigation system on the commons building green roof. Table 2
summarizes the advantages and disadvantages of each system.
19
Table 2: Irrigation system comparison
Drip Irrigation Conventional Irrigation
Advantages Disadvantages Advantages Disadvantages
- Significant water savings - 90% efficient water use - Lower pressure required (smaller pump) - Easy to water plants with different water requirements
- High cost - More lateral piping required - Difficult to establish root zones (through seeding or by sod) - Inconsistent watering pattern - Susceptible to damage - High maintenance
-Less lateral piping required -Easy to establish root zones -Low maintenance -Lower cost -More proven and familiar irrigation method
-70% efficient water use -Water blows off roof on a windy day -Larger pump required
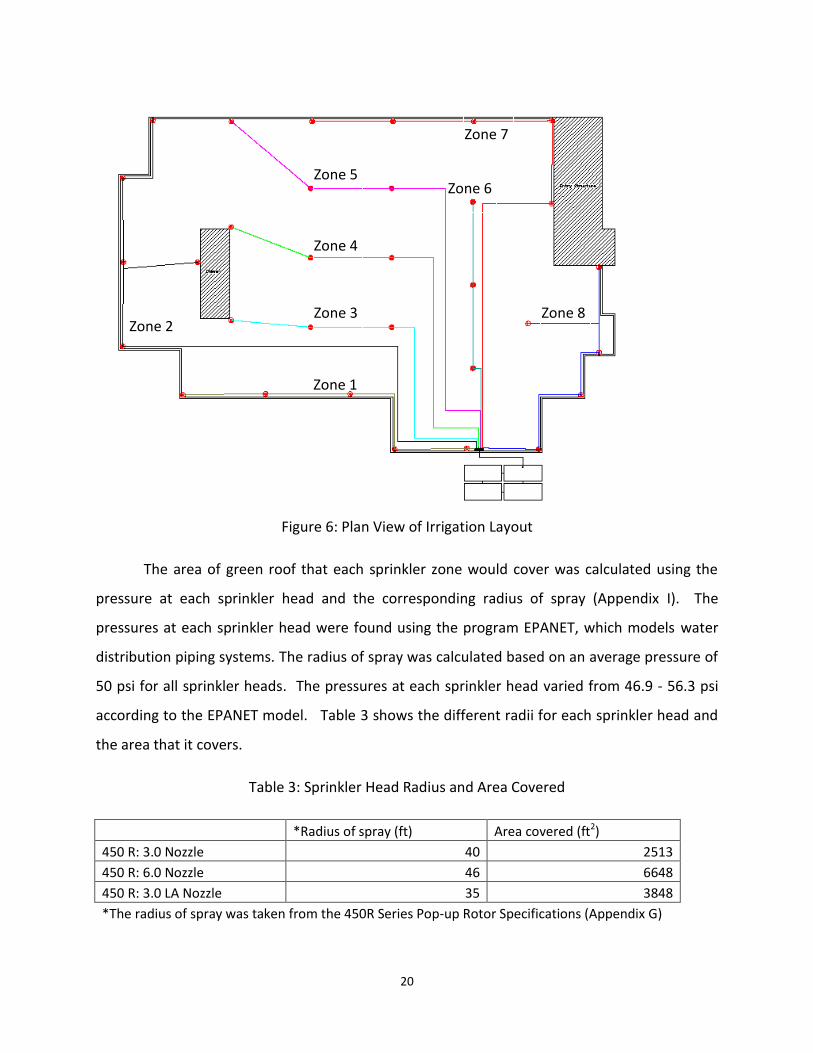
v. System Layout
Spartan Distributors Inc. assisted the team with designing a layout for different
sprinklers on the green roof. The sprinkler heads were split up into 8 different zones consisting
of different sprinkler heads (Appendix I for specifications). The zones were split up so that
there would be minimal variation in the flow rates of each zone. Figure 6 shows a layout of the
irrigation system.
20
Figure 6: Plan View of Irrigation Layout
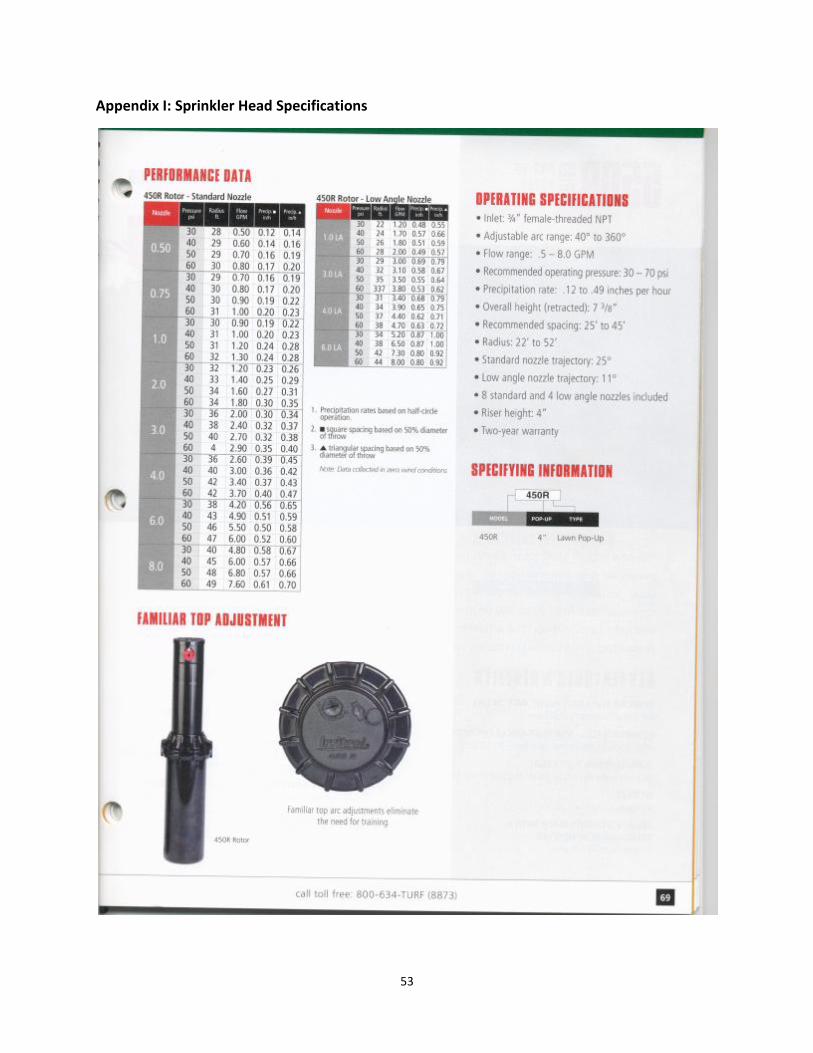
The area of green roof that each sprinkler zone would cover was calculated using the
pressure at each sprinkler head and the corresponding radius of spray (Appendix I). The
pressures at each sprinkler head were found using the program EPANET, which models water
distribution piping systems. The radius of spray was calculated based on an average pressure of
50 psi for all sprinkler heads. The pressures at each sprinkler head varied from 46.9 - 56.3 psi
according to the EPANET model. Table 3 shows the different radii for each sprinkler head and
the area that it covers.
Table 3: Sprinkler Head Radius and Area Covered
*Radius of spray (ft) Area covered (ft2)
450 R: 3.0 Nozzle 40 2513
450 R: 6.0 Nozzle 46 6648
450 R: 3.0 LA Nozzle 35 3848
*The radius of spray was taken from the 450R Series Pop-up Rotor Specifications (Appendix G)
Zone 6
Zone 1
Zone 8 Zone 3
Zone 5
Zone 4
Zone 7
Zone 2
21
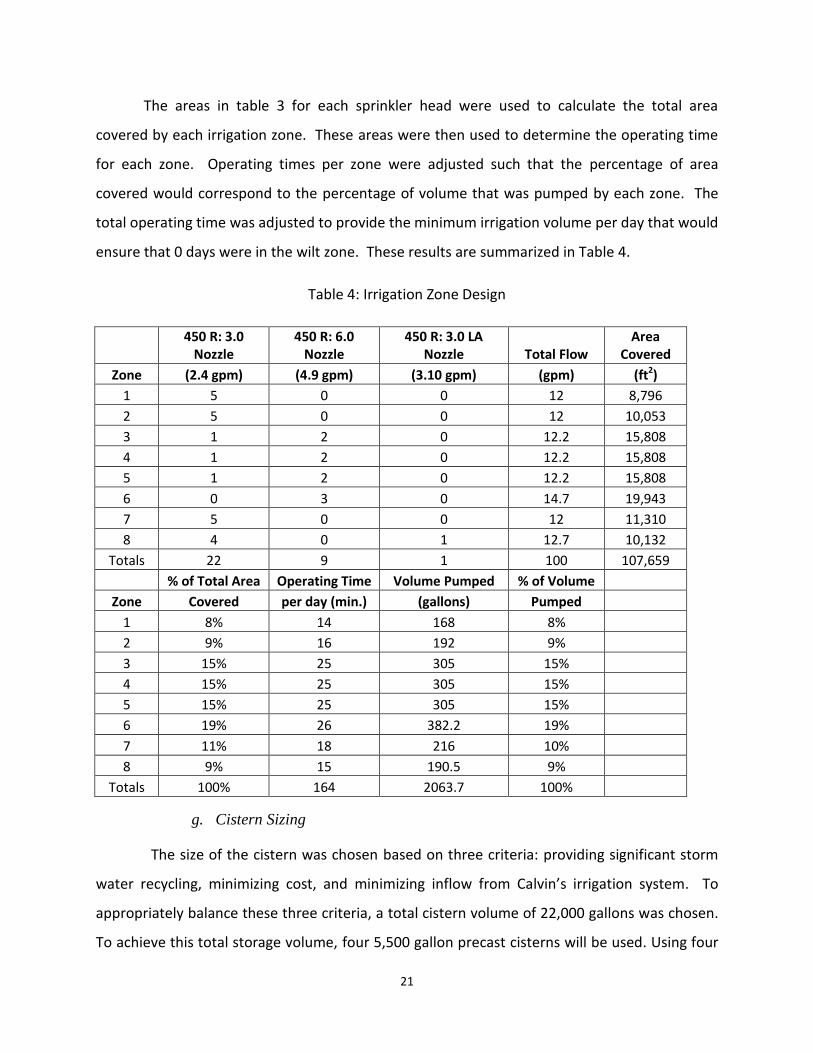
The areas in table 3 for each sprinkler head were used to calculate the total area
covered by each irrigation zone. These areas were then used to determine the operating time
for each zone. Operating times per zone were adjusted such that the percentage of area
covered would correspond to the percentage of volume that was pumped by each zone. The
total operating time was adjusted to provide the minimum irrigation volume per day that would
ensure that 0 days were in the wilt zone. These results are summarized in Table 4.
Table 4: Irrigation Zone Design
450 R: 3.0
Nozzle 450 R: 6.0
Nozzle 450 R: 3.0 LA
Nozzle Total Flow Area
Covered
Zone (2.4 gpm) (4.9 gpm) (3.10 gpm) (gpm) (ft2)
1 5 0 0 12 8,796
2 5 0 0 12 10,053
3 1 2 0 12.2 15,808
4 1 2 0 12.2 15,808
5 1 2 0 12.2 15,808
6 0 3 0 14.7 19,943
7 5 0 0 12 11,310
8 4 0 1 12.7 10,132
Totals 22 9 1 100 107,659
% of Total Area Operating Time Volume Pumped % of Volume
Zone Covered per day (min.) (gallons) Pumped
1 8% 14 168 8%
2 9% 16 192 9%
3 15% 25 305 15%
4 15% 25 305 15%
5 15% 25 305 15%
6 19% 26 382.2 19%
7 11% 18 216 10%
8 9% 15 190.5 9%
Totals 100% 164 2063.7 100%
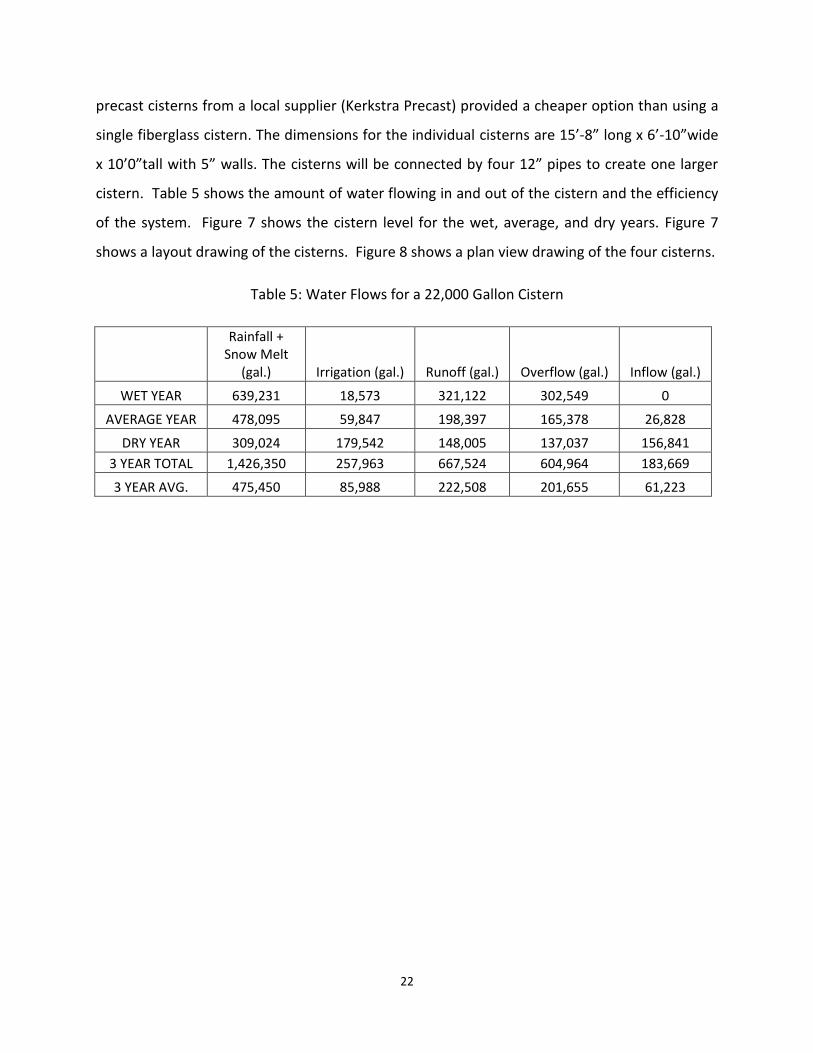
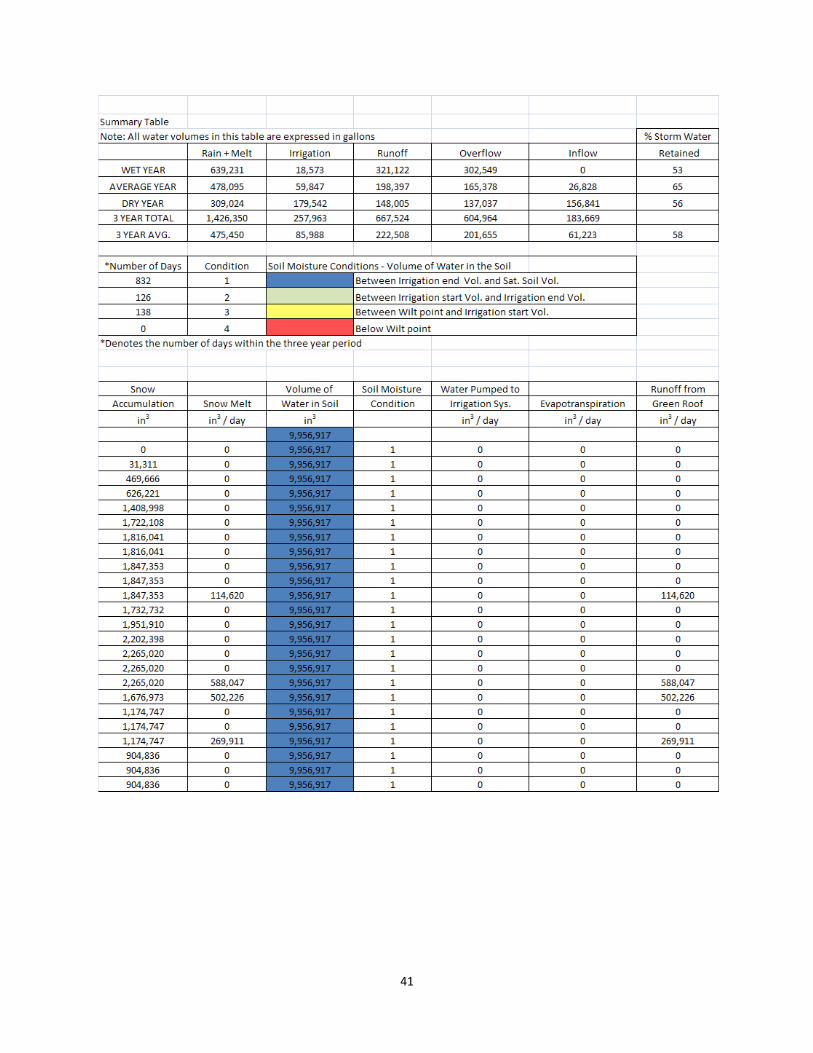
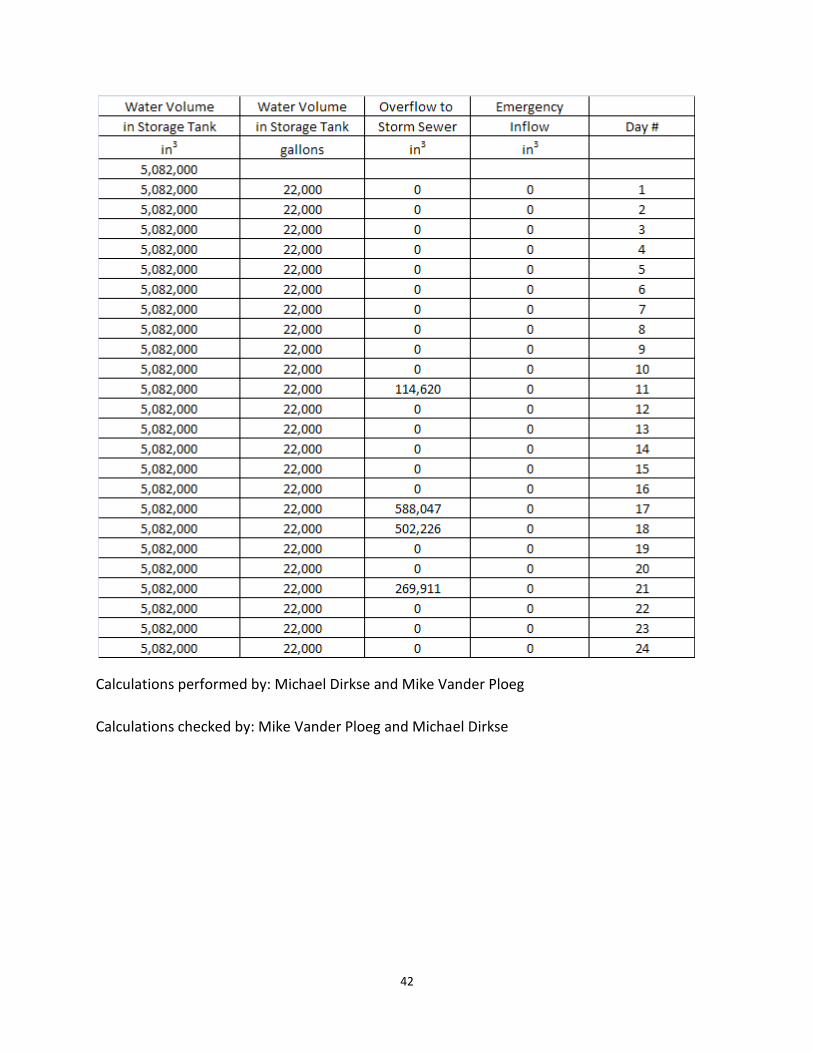
g. Cistern Sizing
The size of the cistern was chosen based on three criteria: providing significant storm
water recycling, minimizing cost, and minimizing inflow from Calvin’s irrigation system. To
appropriately balance these three criteria, a total cistern volume of 22,000 gallons was chosen.
To achieve this total storage volume, four 5,500 gallon precast cisterns will be used. Using four
22
precast cisterns from a local supplier (Kerkstra Precast) provided a cheaper option than using a
single fiberglass cistern. The dimensions for the individual cisterns are 15’-8” long x 6’-10”wide
x 10’0”tall with 5” walls. The cisterns will be connected by four 12” pipes to create one larger
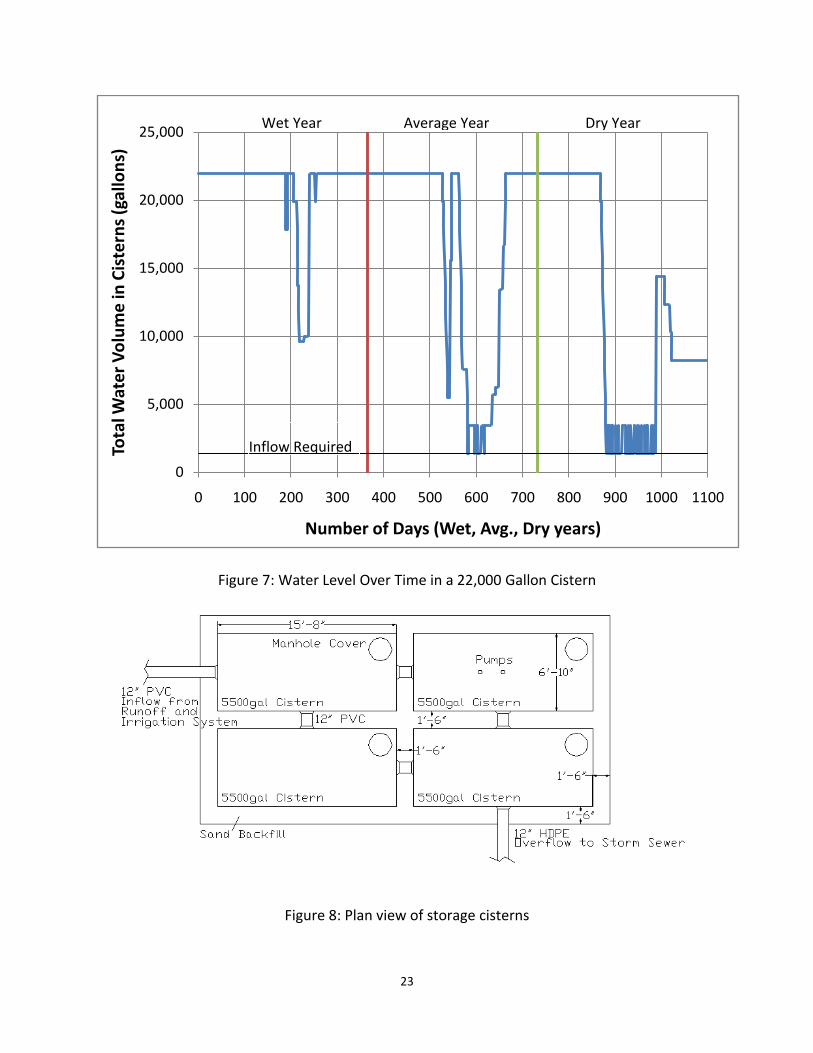
cistern. Table 5 shows the amount of water flowing in and out of the cistern and the efficiency
of the system. Figure 7 shows the cistern level for the wet, average, and dry years. Figure 7
shows a layout drawing of the cisterns. Figure 8 shows a plan view drawing of the four cisterns.
Table 5: Water Flows for a 22,000 Gallon Cistern
Rainfall + Snow Melt
(gal.) Irrigation (gal.) Runoff (gal.) Overflow (gal.) Inflow (gal.)
WET YEAR 639,231 18,573 321,122 302,549 0
AVERAGE YEAR 478,095 59,847 198,397 165,378 26,828
DRY YEAR 309,024 179,542 148,005 137,037 156,841
3 YEAR TOTAL 1,426,350 257,963 667,524 604,964 183,669
3 YEAR AVG. 475,450 85,988 222,508 201,655 61,223
23
Figure 7: Water Level Over Time in a 22,000 Gallon Cistern
Figure 8: Plan view of storage cisterns
0
5,000
10,000
15,000
20,000
25,000
0 100 200 300 400 500 600 700 800 900 1000 1100
Tota
l Wat
er
Vo
lum
e in
Cis
tern
s (g
allo
ns)
Number of Days (Wet, Avg., Dry years)
Wet Year
Average Year
Dry Year
Inflow Required
24
The proposed storage cisterns were thought to be beneficial, but not necessary
components of the hydraulic system. The use of storage cisterns will make the green roof more
efficient in recycling stormwater and will reduce demand on the current irrigation system. To
provide adequate pressure at the sprinkler heads on the green roof, a booster pump may be
needed anyway if the cisterns were not included in the design. However, eliminating the
cisterns from the design could provide cost savings. If the cisterns were eliminated, then all
irrigation water would have to be pumped from Calvin’s current irrigation system. For its
irrigation water, Calvin uses irrigation wells rather than potable water from the city of Grand
Rapids. The cost of operating the irrigation pumps would be the only additional cost incurred
by Calvin for extra irrigation. The annual energy cost for operating the irrigation pump and the
cistern pump would be only $9.82 (See Appendix J).
h. Pump Operation
Two identical submersible pumps will be installed in one of the storage cisterns to pump
water to the green roof for irrigation. One pump will be needed for normal operation, and a
second will be installed for redundancy. During each day, one pump will operate for 164
minutes and provide 2,064 gallons of water to the green roof. Flow will switch to 8 different
irrigation zones during this time.
The pumps require 2ft of water to operate. If the water level in the cistern drops below
2ft, a sensor will open an electronic valve which will allow water to flow into the cisterns from
Calvin’s current irrigation system.
i. Pump Sizing
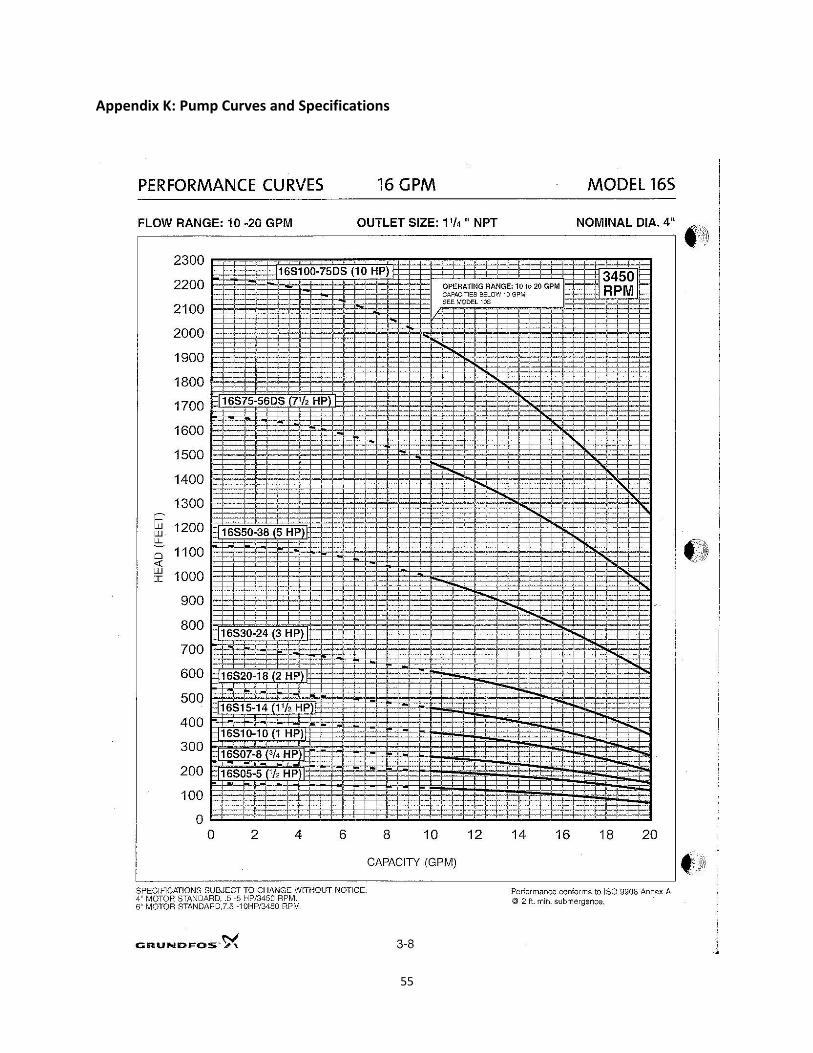
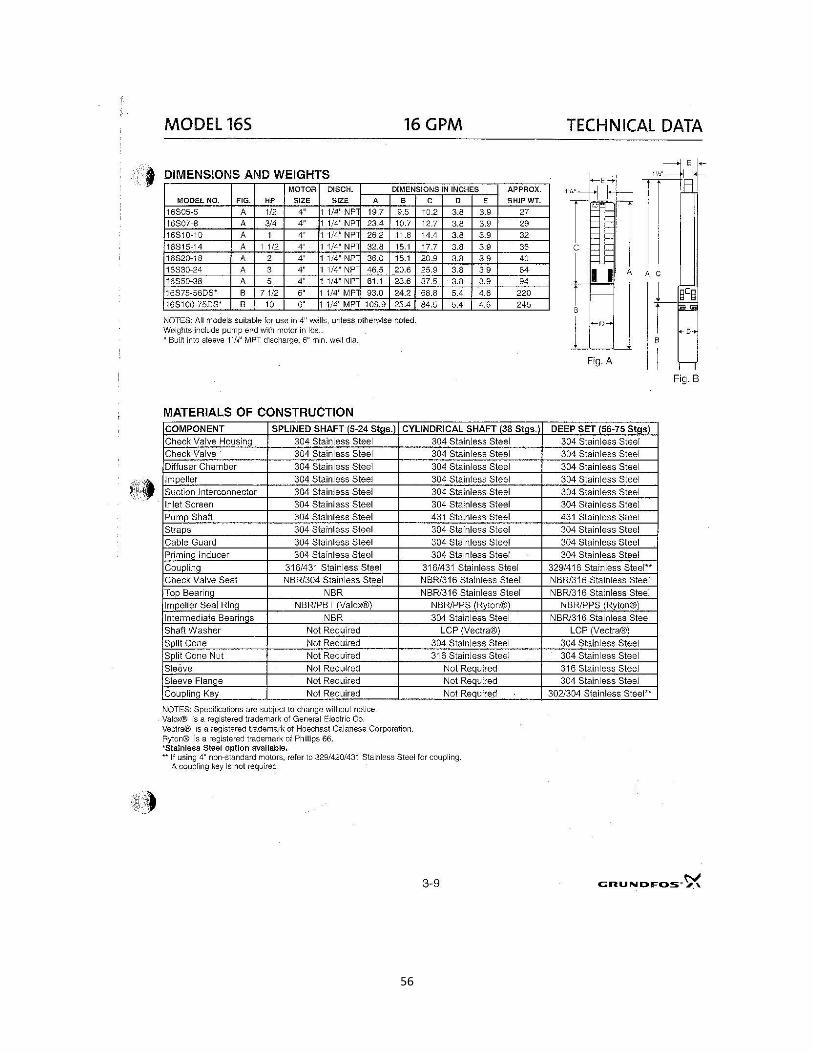
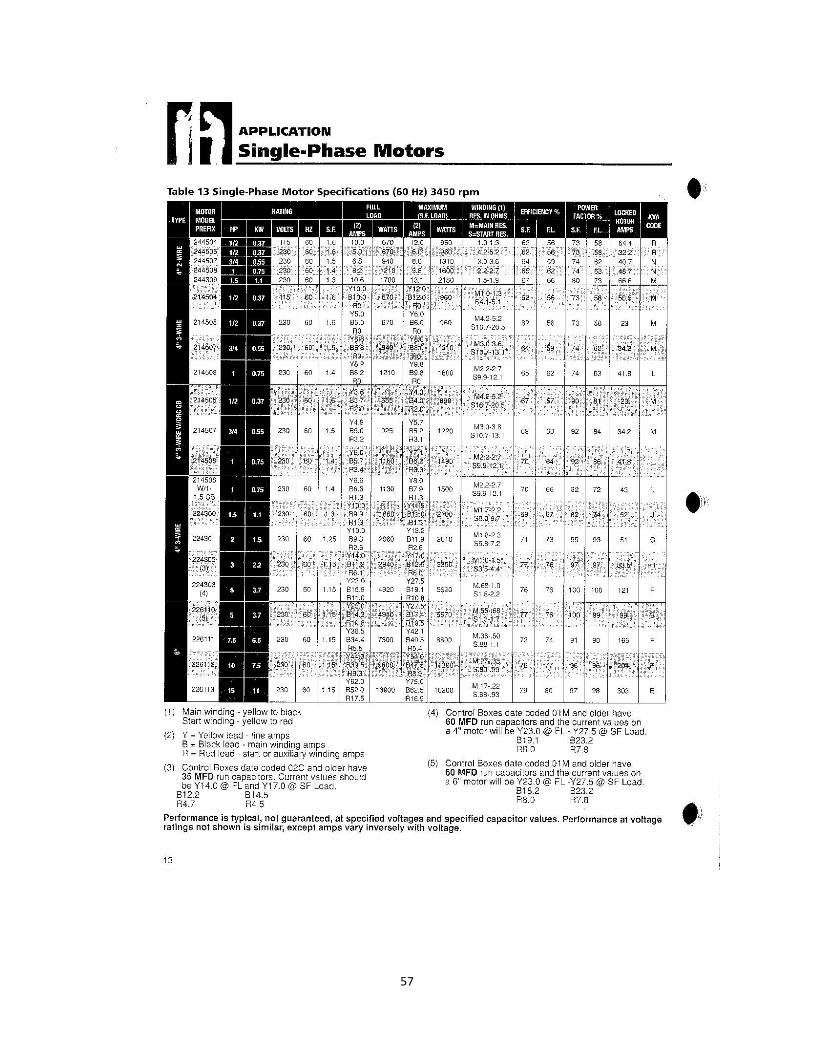
Two Grundfos 16S07-8 (¾ HP) submersible pumps are recommended for the system.
This pump operates within the flow ranges of 10 – 20 gpm (see Appendix K for pump curves
and specifications). This is an acceptable range for all 8 irrigation zones, which vary from 12 -
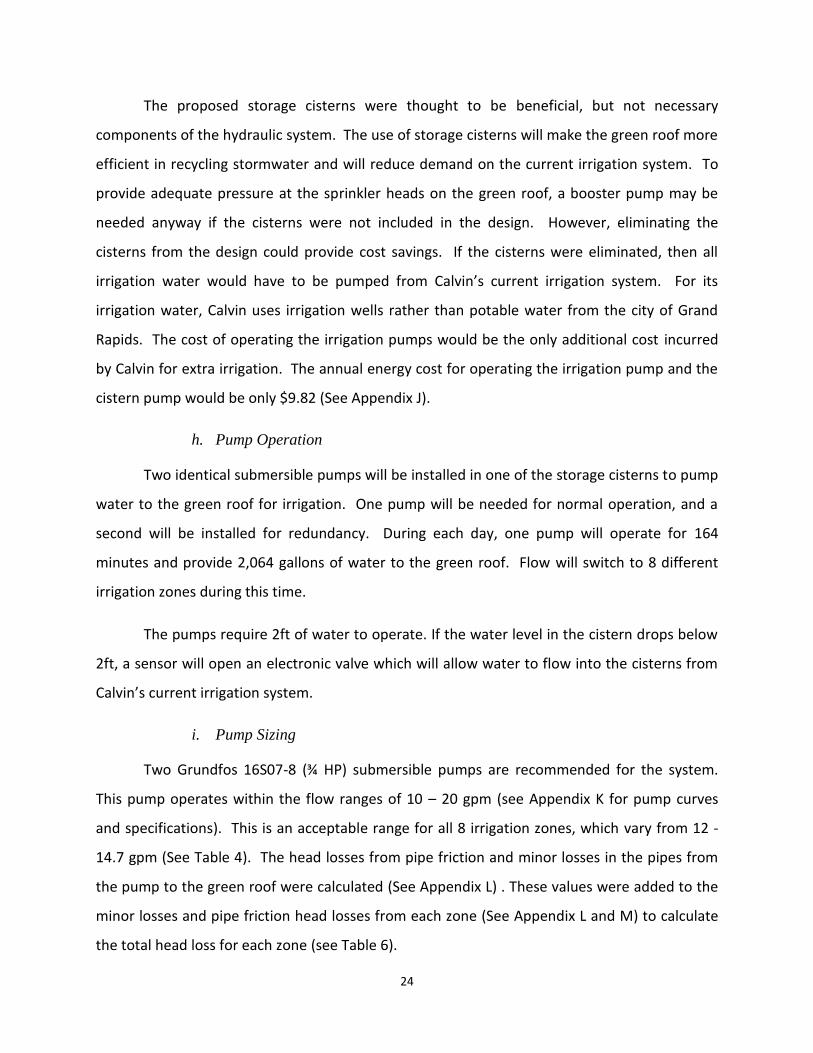
14.7 gpm (See Table 4). The head losses from pipe friction and minor losses in the pipes from
the pump to the green roof were calculated (See Appendix L) . These values were added to the
minor losses and pipe friction head losses from each zone (See Appendix L and M) to calculate
the total head loss for each zone (see Table 6).
25
Table 6: Total Headlosses for Each Irrigation Zone
From pump to roof In each zone
Zone Minor Losses
(ft) Pipe HL
(ft) Minor Losses (ft) Pipe HL (ft) TOTAL HEADLOSS
(ft)
1 1.12 4.00 0.67 9.83 15.62
2 1.12 4.00 1.57 22.56 29.25
3 1.12 4.00 0.75 10.40 16.27
4 1.12 4.00 0.42 12.57 18.12
5 1.12 4.00 0.80 15.10 21.02
6 1.12 4.00 0.82 5.76 11.71
7 1.12 4.00 1.04 18.06 24.22
8 1.12 4.00 1.49 10.45 17.07
Based on these values, zone two had the highest head loss (29.25 feet). This head loss was
used in the energy equation to calculate the total pump head needed for the pump (See
Appendix N). The total pump head was calculated to be 178.9 feet. The team consulted Eric
Neubecker from Raymer Water Supply Contractors – Wells and Pumps (Marne, MI), requesting
a pump to provide 179 feet of head and a flow rate of 15 gpm. After receiving pump
information (Appendix K) the team chose the Grundfos 16S07-8 (¾ HP) pump.
The pump curve for the Grundfos 16S07-8 (¾ HP) pump was put into 8 different EPANET
models (one for each zone), and it was found that 45-55 psi was provided at most sprinkler
heads. The sprinkler heads require at least 40 psi, so the pump will provide adequate pressure,
which is within the recommended pressure range of the sprinkler heads (30-70 psi). The mean
velocity (V) was initially estimated at 4 feet per second. After modeling the 8 different
irrigation zones in EPANET with the specified pump curve, it was confirmed by looking at the
velocities in each pipe that this was a reasonable estimate.
26
j. Pipe Selection and Sizing
The stormwater management system for the green roof was designed to handle both a
100-year, 24-hour rain event and snow melt from the snow load used to design the building (40
lb. / ft2). The probability of this event occurring is very low, but using this event for design will
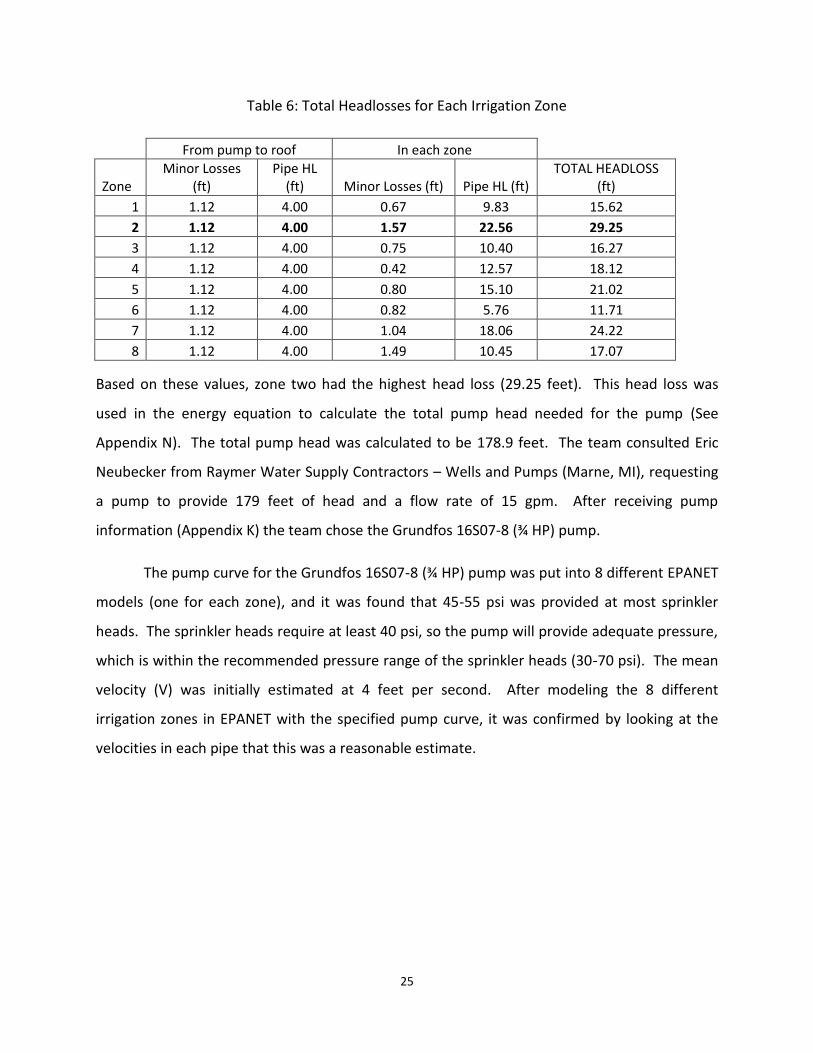
ensure an adequate safety factor for the pipe sizes. Three downspout pipes are to be used to
convey drainage and runoff from the green roof to the cisterns. For a layout drawing which
shows the locations of the downspouts and drainage areas of the green roof that drain to each
downspout pipe, see Figure 9. The downspout pipes are to be PVC pipes, which will be installed
inside the walls of the commons building. This will be done to prevent water from freezing, and
also to be more aesthetically pleasing.
Figure 9: Plan View of Drainage System
A peak discharge was calculated at the top of each downspout using the rational
method. The rational method was used because it assumes no initial abstraction. This is a
good assumption for the design condition, because saturated soil conditions were assumed.
27
Under saturated soil conditions, the soil acts like concrete and runoff occurs immediately. The
rational method was also used because it works well for drainage areas less than 40 acres. The
complete calculations, variable definitions, and assumptions made to find the peak flow rates
of the downspouts are shown in Appendix O. The time of concentration was originally
calculated using the Federal Aviation Administration equation (Mays, 566). However these
values were so low that an intensity value could not be read from the IDF curve (See Appendix
P). Therefore, the time of concentration was assumed to be 15 minutes, because this is a
typical lower limit that is commonly used in industry. The entire snow load (40 lbs/ft2) was
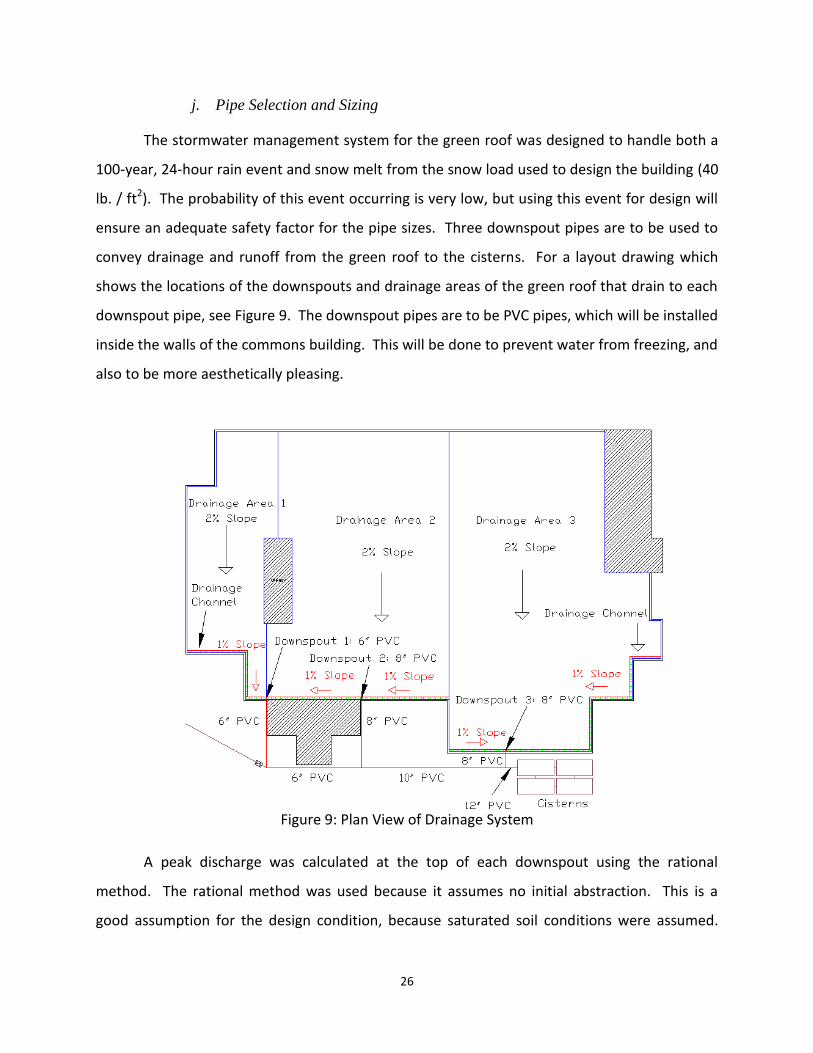
assumed to melt at an even rate over the time of the 24 hour storm. A snow melt flow rate was
calculated and added to the peak flow rate (from the rational method) for each drainage area
to yield the total flow rate. These results are summarized in Table 7.
Table 7: Peak Flow Rates for Downspouts
Peak Flow Rates (ft3 / s)
Area (ft2)
Area (acres) L (ft.) S (%)
Rational Method Snow Load Total
*Drainage Area 1 3,304 0.076 136 2 0.48 0.025 0.50
*Drainage Area 2 8,383 0.192 169 2 1.21 0.062 1.28
*Drainage Area 3 10,057 0.231 186 2 1.46 0.075 1.53
*See Figure 9 for layout drawing of drainage areas
These peak flow rates for each downspout were then used in the orifice equation to
calculate the diameters of the downspout pipes (See Appendix Q). These results are
summarized in Table 8. The orifice equation was used because the downspout pipes are
vertical and can be modeled as holes.
The downspout pipes will convey water from the top of the green roof to drainage
pipes. The drainage pipes will take the water to collector pipes. The collector pipes will bring
the water to underground storage cisterns. The first two drainage pipes will form at “T” and
collect in the first collector pipe. This pipe will then form another “T” with the third drainage
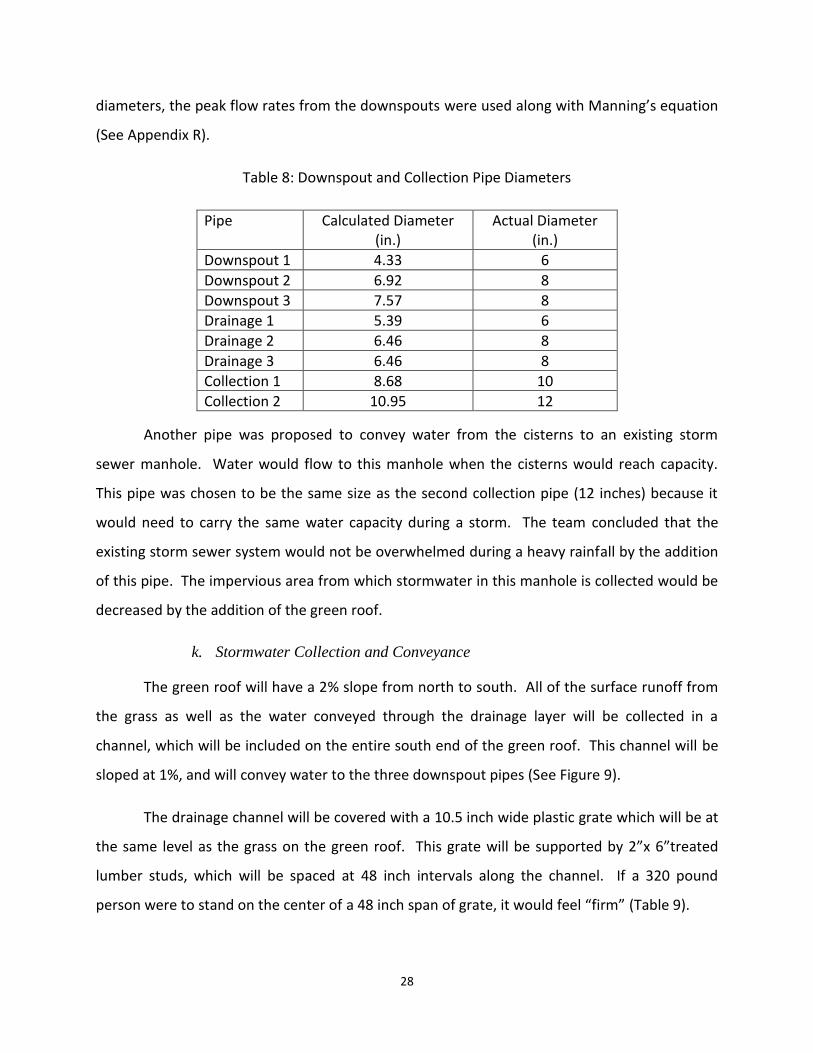
pipe, leading to a second collection pipe. Table 8 shows the calculated and actual diameters of
the collection and downspout pipes. To calculate the drainage pipe and collection pipe
28
diameters, the peak flow rates from the downspouts were used along with Manning’s equation
(See Appendix R).
Table 8: Downspout and Collection Pipe Diameters
Pipe Calculated Diameter (in.)
Actual Diameter (in.)
Downspout 1 4.33 6
Downspout 2 6.92 8
Downspout 3 7.57 8
Drainage 1 5.39 6
Drainage 2 6.46 8
Drainage 3 6.46 8
Collection 1 8.68 10
Collection 2 10.95 12
Another pipe was proposed to convey water from the cisterns to an existing storm
sewer manhole. Water would flow to this manhole when the cisterns would reach capacity.
This pipe was chosen to be the same size as the second collection pipe (12 inches) because it
would need to carry the same water capacity during a storm. The team concluded that the
existing storm sewer system would not be overwhelmed during a heavy rainfall by the addition
of this pipe. The impervious area from which stormwater in this manhole is collected would be
decreased by the addition of the green roof.
k. Stormwater Collection and Conveyance
The green roof will have a 2% slope from north to south. All of the surface runoff from
the grass as well as the water conveyed through the drainage layer will be collected in a
channel, which will be included on the entire south end of the green roof. This channel will be
sloped at 1%, and will convey water to the three downspout pipes (See Figure 9).
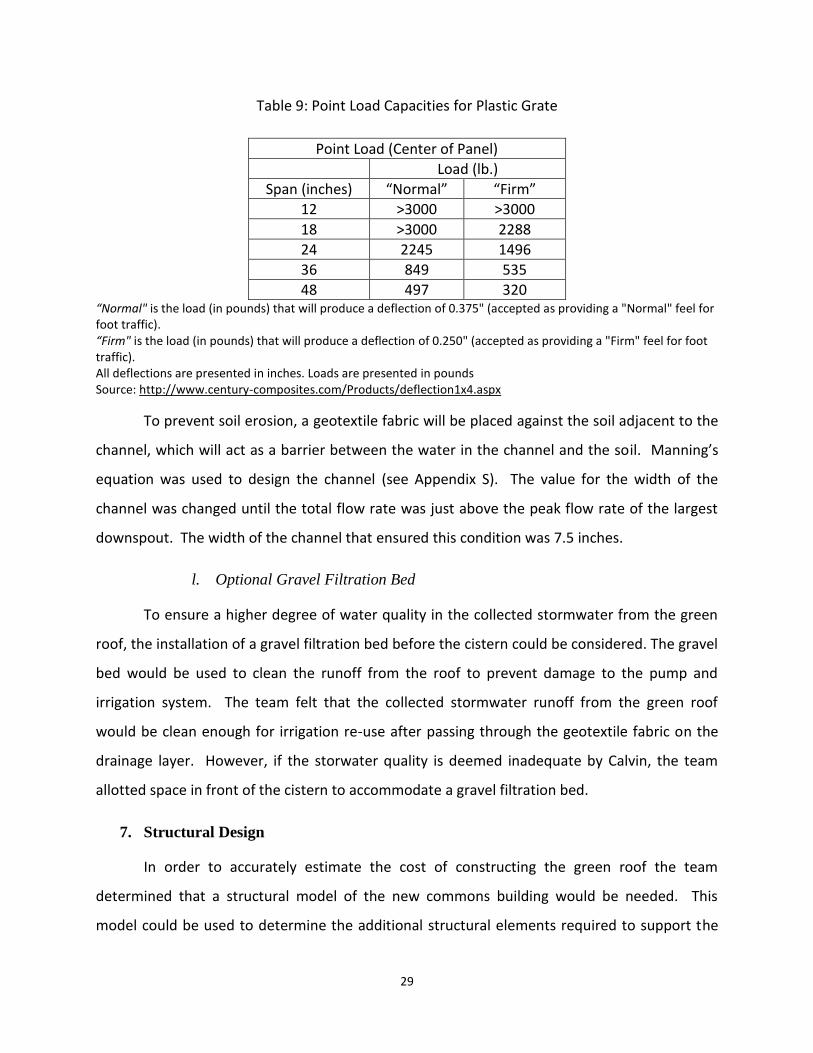
The drainage channel will be covered with a 10.5 inch wide plastic grate which will be at
the same level as the grass on the green roof. This grate will be supported by 2”x 6”treated
lumber studs, which will be spaced at 48 inch intervals along the channel. If a 320 pound
person were to stand on the center of a 48 inch span of grate, it would feel “firm” (Table 9).
29
Table 9: Point Load Capacities for Plastic Grate
Point Load (Center of Panel)
Load (lb.)
Span (inches) “Normal” “Firm”
12 >3000 >3000
18 >3000 2288
24 2245 1496
36 849 535
48 497 320 “Normal" is the load (in pounds) that will produce a deflection of 0.375" (accepted as providing a "Normal" feel for foot traffic). “Firm" is the load (in pounds) that will produce a deflection of 0.250" (accepted as providing a "Firm" feel for foot traffic). All deflections are presented in inches. Loads are presented in pounds Source: http://www.century-composites.com/Products/deflection1x4.aspx
To prevent soil erosion, a geotextile fabric will be placed against the soil adjacent to the
channel, which will act as a barrier between the water in the channel and the soil. Manning’s
equation was used to design the channel (see Appendix S). The value for the width of the
channel was changed until the total flow rate was just above the peak flow rate of the largest
downspout. The width of the channel that ensured this condition was 7.5 inches.
l. Optional Gravel Filtration Bed
To ensure a higher degree of water quality in the collected stormwater from the green
roof, the installation of a gravel filtration bed before the cistern could be considered. The gravel
bed would be used to clean the runoff from the roof to prevent damage to the pump and
irrigation system. The team felt that the collected stormwater runoff from the green roof
would be clean enough for irrigation re-use after passing through the geotextile fabric on the
drainage layer. However, if the storwater quality is deemed inadequate by Calvin, the team
allotted space in front of the cistern to accommodate a gravel filtration bed.
7. Structural Design
In order to accurately estimate the cost of constructing the green roof the team
determined that a structural model of the new commons building would be needed. This
model could be used to determine the additional structural elements required to support the
30
green roof. The team modeled the southern half of the new commons building. This included
the area on which the green roof would be placed as well as conventionally roofed areas
immediately adjacent to it. In this way, the team determined that they could use a model to
find the increase in structural steel without taking the time necessary to model the entire
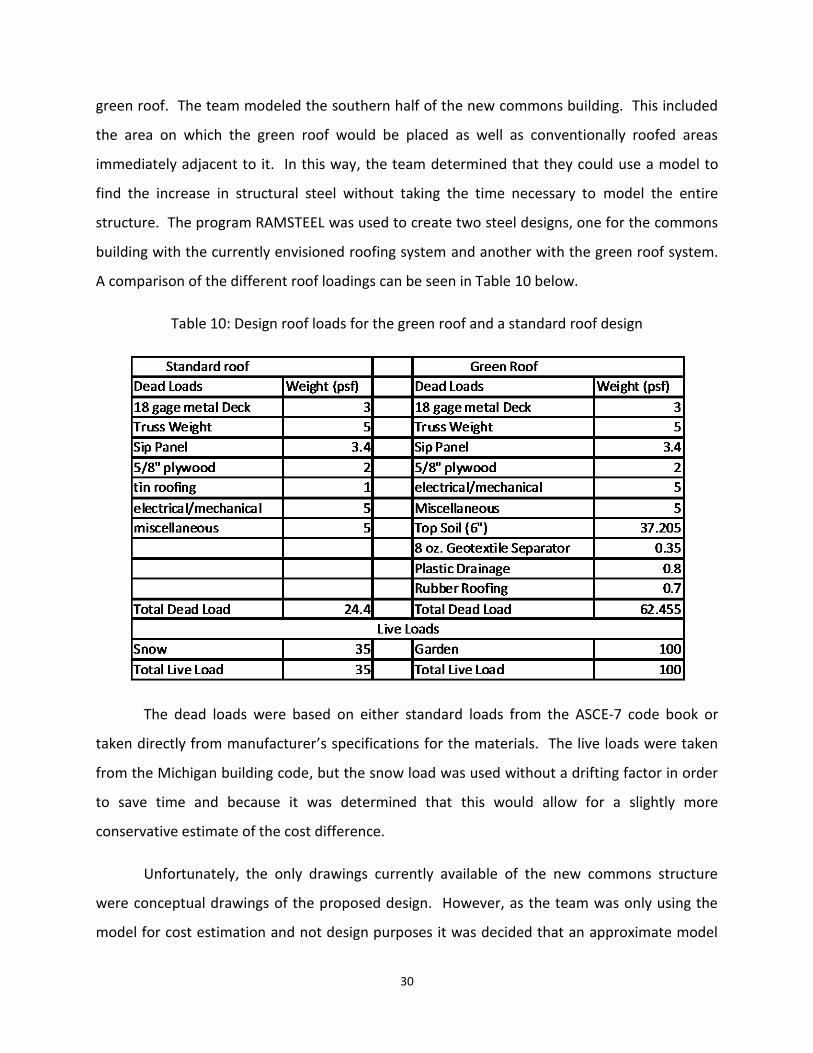
structure. The program RAMSTEEL was used to create two steel designs, one for the commons
building with the currently envisioned roofing system and another with the green roof system.
A comparison of the different roof loadings can be seen in Table 10 below.
Table 10: Design roof loads for the green roof and a standard roof design
The dead loads were based on either standard loads from the ASCE-7 code book or
taken directly from manufacturer’s specifications for the materials. The live loads were taken
from the Michigan building code, but the snow load was used without a drifting factor in order
to save time and because it was determined that this would allow for a slightly more
conservative estimate of the cost difference.
Unfortunately, the only drawings currently available of the new commons structure
were conceptual drawings of the proposed design. However, as the team was only using the
model for cost estimation and not design purposes it was decided that an approximate model
31
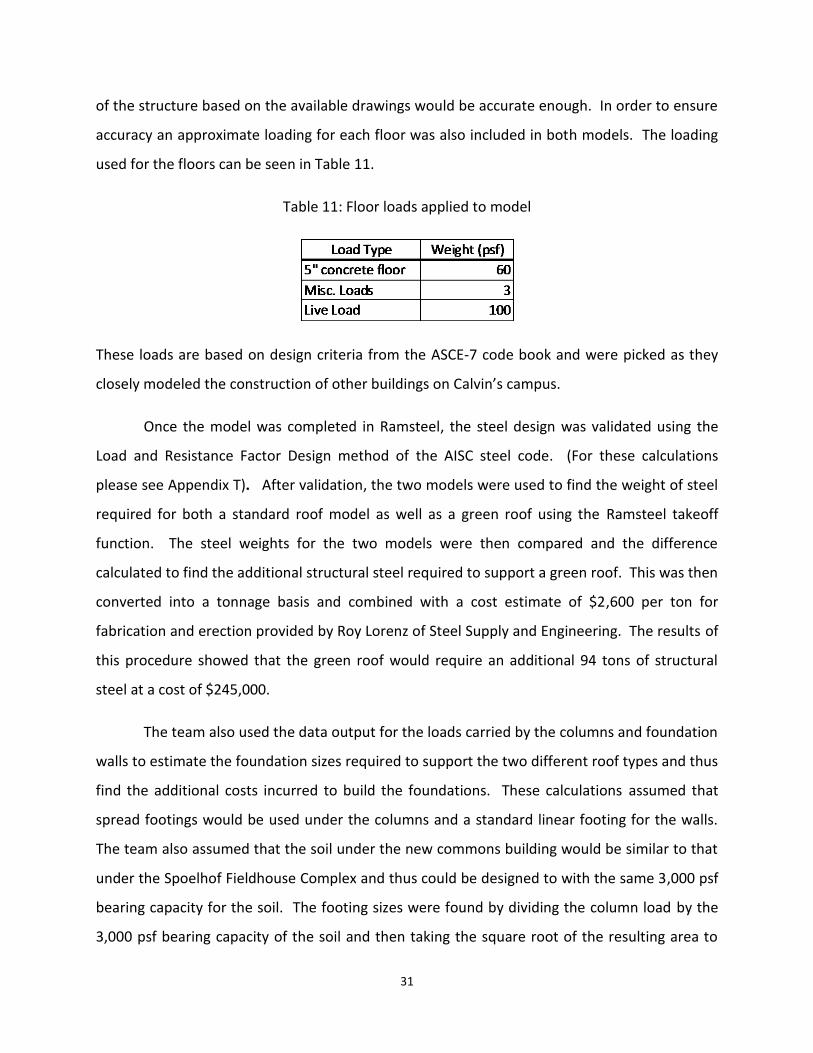
of the structure based on the available drawings would be accurate enough. In order to ensure
accuracy an approximate loading for each floor was also included in both models. The loading
used for the floors can be seen in Table 11.
Table 11: Floor loads applied to model
These loads are based on design criteria from the ASCE-7 code book and were picked as they
closely modeled the construction of other buildings on Calvin’s campus.
Once the model was completed in Ramsteel, the steel design was validated using the
Load and Resistance Factor Design method of the AISC steel code. (For these calculations
please see Appendix T). After validation, the two models were used to find the weight of steel
required for both a standard roof model as well as a green roof using the Ramsteel takeoff
function. The steel weights for the two models were then compared and the difference
calculated to find the additional structural steel required to support a green roof. This was then
converted into a tonnage basis and combined with a cost estimate of $2,600 per ton for
fabrication and erection provided by Roy Lorenz of Steel Supply and Engineering. The results of
this procedure showed that the green roof would require an additional 94 tons of structural
steel at a cost of $245,000.
The team also used the data output for the loads carried by the columns and foundation
walls to estimate the foundation sizes required to support the two different roof types and thus
find the additional costs incurred to build the foundations. These calculations assumed that
spread footings would be used under the columns and a standard linear footing for the walls.
The team also assumed that the soil under the new commons building would be similar to that
under the Spoelhof Fieldhouse Complex and thus could be designed to with the same 3,000 psf
bearing capacity for the soil. The footing sizes were found by dividing the column load by the
3,000 psf bearing capacity of the soil and then taking the square root of the resulting area to
32
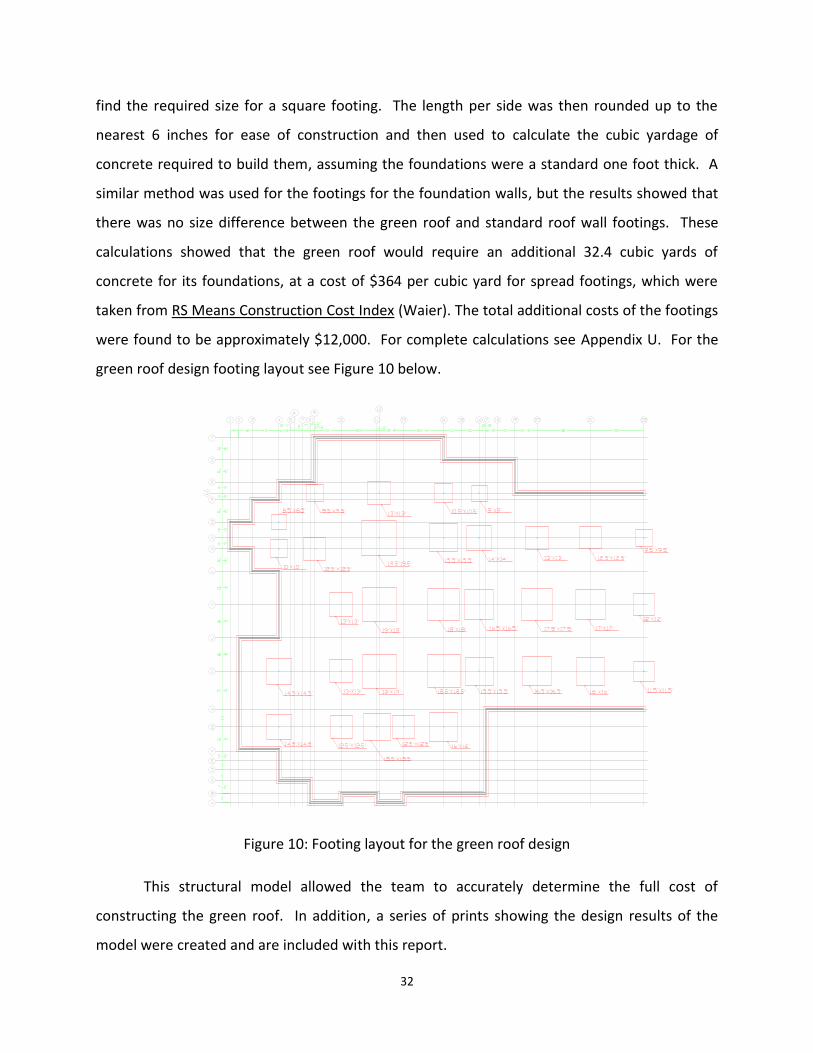
find the required size for a square footing. The length per side was then rounded up to the
nearest 6 inches for ease of construction and then used to calculate the cubic yardage of
concrete required to build them, assuming the foundations were a standard one foot thick. A
similar method was used for the footings for the foundation walls, but the results showed that
there was no size difference between the green roof and standard roof wall footings. These
calculations showed that the green roof would require an additional 32.4 cubic yards of
concrete for its foundations, at a cost of $364 per cubic yard for spread footings, which were
taken from RS Means Construction Cost Index (Waier). The total additional costs of the footings
were found to be approximately $12,000. For complete calculations see Appendix U. For the
green roof design footing layout see Figure 10 below.
Figure 10: Footing layout for the green roof design
This structural model allowed the team to accurately determine the full cost of
constructing the green roof. In addition, a series of prints showing the design results of the
model were created and are included with this report.
33
a. Entry Structure
In addition to the three floors of the commons building, a fourth floor was included in the
structural design. This floor serves as an entryway to the green roof. After viewing the
conceptual drawings of the new Commons building, the team decided to include this structure
in the northeast corner of the proposed green roof because an elevator shaft was nearby. The
team did not design the details of this structure, but simply allotted an appropriate area for
necessary components of this structure. A 20 x 61 foot area was allotted for the entry
structure. This area was chosen in order to provide adequate space for an elevator and
stairwell that would comply with ADA standards. In addition to an elevator shaft and a stairwell,
extra space was allotted for the storage of lawn maintenance equipment. This extra space
would also allow flexibility in the future architectural design of the foyer leading to the green
roof.
8. Cost Analysis
Once the team had completed the design and found the types and amounts of materials
needed to construct the green roof they began the process of estimating the cost of the roof.
The cost estimates were based on a variety of sources. For most of the components including
piping, the roof access structure and railings a current copy of RS Means Construction Cost
Index (Waier) with the costs localized for Grand Rapids MI was used to estimate costs. For
many of the larger components of the roof, including soil, steel, drainage material, and cisterns
the costs estimated were based on quotes provided by suppliers.
a. Hydraulic System
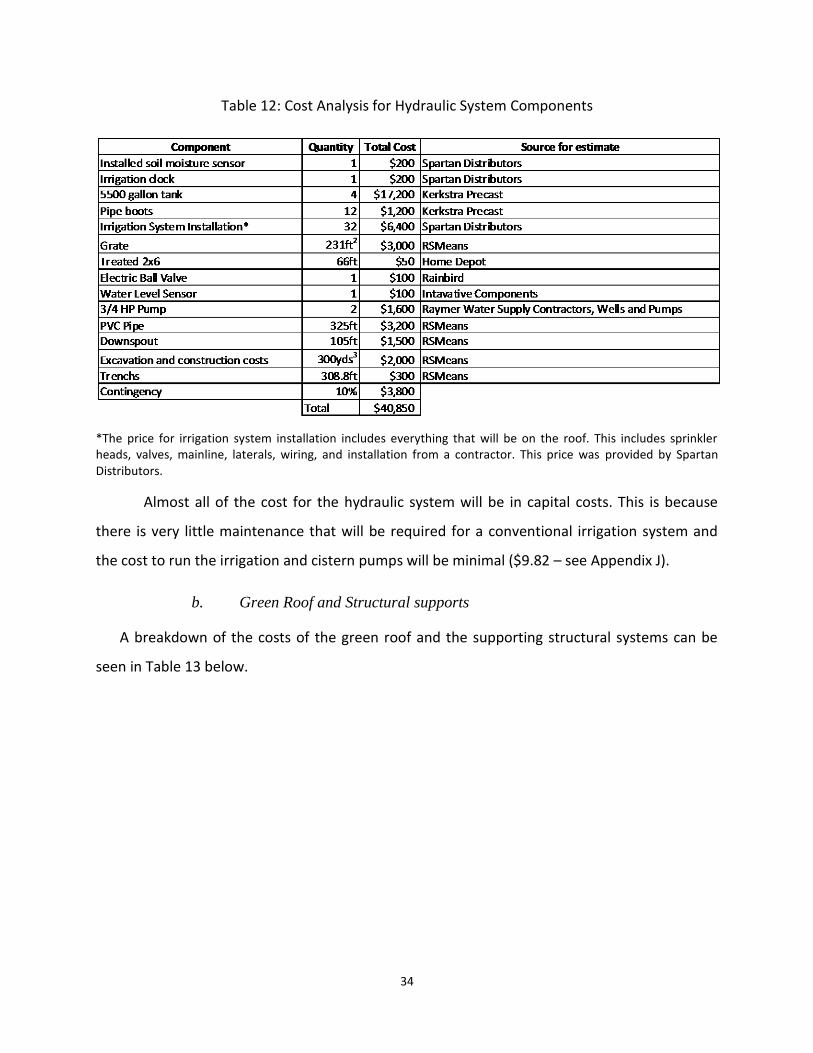
Table 12 shows the capital costs for the various components of the hydraulic system.
34
Table 12: Cost Analysis for Hydraulic System Components
*The price for irrigation system installation includes everything that will be on the roof. This includes sprinkler heads, valves, mainline, laterals, wiring, and installation from a contractor. This price was provided by Spartan Distributors.
Almost all of the cost for the hydraulic system will be in capital costs. This is because
there is very little maintenance that will be required for a conventional irrigation system and
the cost to run the irrigation and cistern pumps will be minimal ($9.82 – see Appendix J).
b. Green Roof and Structural supports
A breakdown of the costs of the green roof and the supporting structural systems can be
seen in Table 13 below.
35
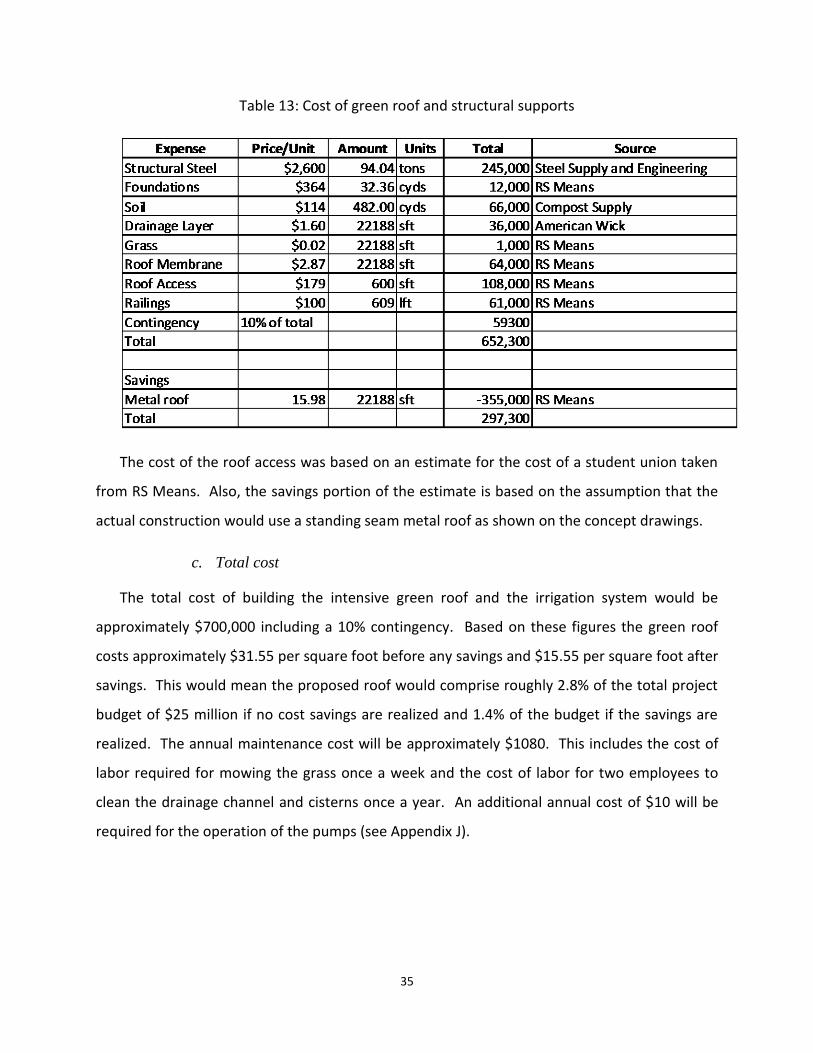
Table 13: Cost of green roof and structural supports
The cost of the roof access was based on an estimate for the cost of a student union taken
from RS Means. Also, the savings portion of the estimate is based on the assumption that the
actual construction would use a standing seam metal roof as shown on the concept drawings.
c. Total cost
The total cost of building the intensive green roof and the irrigation system would be
approximately $700,000 including a 10% contingency. Based on these figures the green roof
costs approximately $31.55 per square foot before any savings and $15.55 per square foot after
savings. This would mean the proposed roof would comprise roughly 2.8% of the total project
budget of $25 million if no cost savings are realized and 1.4% of the budget if the savings are
realized. The annual maintenance cost will be approximately $1080. This includes the cost of
labor required for mowing the grass once a week and the cost of labor for two employees to
clean the drainage channel and cisterns once a year. An additional annual cost of $10 will be
required for the operation of the pumps (see Appendix J).
36
9. Conclusion
Even though West Michigan does not suffer from a scarcity of water resources, it is
Calvin’s duty as a Christian college to use its resources wisely as stewards of God’s creation. A
green roof would be an important way in which Calvin could support these ideals. Moreover,
the project shows that the cost for a fairly large and complex green roof design for the
commons building would be manageable at $700,000 or less than 2.8% of the project budget.
Thus, a green roof would be a good investment for Calvin College.
10. Further Steps
In order to pursue this project, it is recommended that Calvin begin talking with local
engineering firms with experience in green roof design and construction. Calvin should work to
refine the design to further fit their needs. Furthermore they should look for reputable and
experienced contractors to build the green roof as they move into a construction phase.
11. Acknowledgements
Team 14 – Going Green would like to thank all of those who helped us with our project by
giving advice and guidance.
Professor David Wunder – Our team advisor
Professor Bob Hoeksema – For advice about our model of the hydraulic system
Professor Leonard De Rooy- For help with the structural design and cost estimation
Tom Newhof, Prein and Newhof – Our industrial consultant
Charlie Huizinga and Geoff Van Berkel, Calvin Physical Plant – For assistance with
irrigation design
Shirley Hoogstra, Gail Heffner, and Frank Gorman, Calvin College – For their ideas and
help with our project
37
Bruce Funnel and Dan Cummings, Spartan Distributors Inc. – For assistance with
irrigation design and cost estimates
Eric Neubecker, Raymer Water Supply Contractors – For assistance with pump selection
Jim Saxpon, American Wick – for Drainage Layer cost estimates
Roy Lorenz, Steel Supply and Engineering – for steel cost estimates
12. Bibliography
American Institute of Steel Construction. Steel Construction Manual. 13th ed. 2005.
American Society of Civil Engineers. ASCE-7 Minimum Design Loads for Buildings and Other
Structures. 2005.
Bras, Rafael L. Hydrology: An Introduction to Hydrologic Science. Reading, MA: Addison-Wesley
Publishing Company, 1990. 270
Funnel, Bruce. Spartan Distributors Inc. Personal interview. 2009.
Idema, Brett. Kerkstra Precast. Personal interview. 2009.
Lorenz, Roy. Steel Supply and Engineering. Personal interview. 2009.
Mays, Larry W. Water Resources Engineering. Hoboken, NJ: John Wiley & Sons, Inc., 2005.
MDOT Drainage Manual – Appendix 3-D: Wetland Hydrology – The Water Budget:
http://www.michigan.gov/documents/MDOT_MS4_App_91720_7._03_D_Drainage_Manual.pdf
Neubecker, Eric. Raymer Water Supply Contractors. Personal interview. 2009.
Van Berkel, Geoff, and Charles Huizinga. Calvin College Physical Plant. Personal interview. 2009.
Volumt, Jeff. Compost Supply Inc. Personal interview. 2009.
Waier, Phillip R, ed. Building Construction Cost Data. 67th ed. Kingston, MA: RS Means
Company, Inc, 2009.
38
Appendix A: Green Roof Soil Specifications
39
Appendix B: Drainage Layer Specifications
40
Appendix C: Hydraulic Model of Green Roof Stormwater Management and Irrigation System
Page 1 (see attached CD for the actual file: Hydraulic_Model.xlsx)
41
42
Calculations performed by: Michael Dirkse and Mike Vander Ploeg
Calculations checked by: Mike Vander Ploeg and Michael Dirkse
43
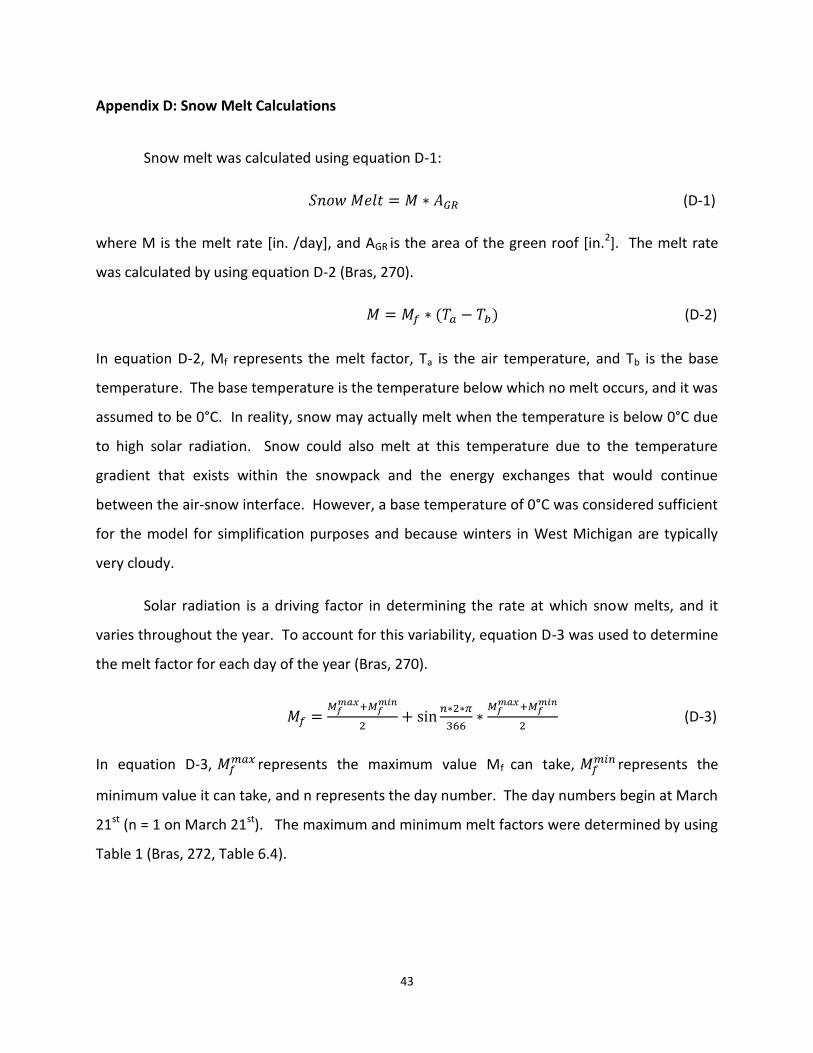
Appendix D: Snow Melt Calculations
Snow melt was calculated using equation D-1:
(D-1)
where M is the melt rate [in. /day], and AGR is the area of the green roof [in.2]. The melt rate
was calculated by using equation D-2 (Bras, 270).
(D-2)
In equation D-2, Mf represents the melt factor, Ta is the air temperature, and Tb is the base
temperature. The base temperature is the temperature below which no melt occurs, and it was
assumed to be 0°C. In reality, snow may actually melt when the temperature is below 0°C due
to high solar radiation. Snow could also melt at this temperature due to the temperature
gradient that exists within the snowpack and the energy exchanges that would continue
between the air-snow interface. However, a base temperature of 0°C was considered sufficient
for the model for simplification purposes and because winters in West Michigan are typically
very cloudy.
Solar radiation is a driving factor in determining the rate at which snow melts, and it
varies throughout the year. To account for this variability, equation D-3 was used to determine
the melt factor for each day of the year (Bras, 270).
(D-3)
In equation D-3, represents the maximum value Mf can take, represents the
minimum value it can take, and n represents the day number. The day numbers begin at March
21st (n = 1 on March 21st). The maximum and minimum melt factors were determined by using
Table 1 (Bras, 272, Table 6.4).
44
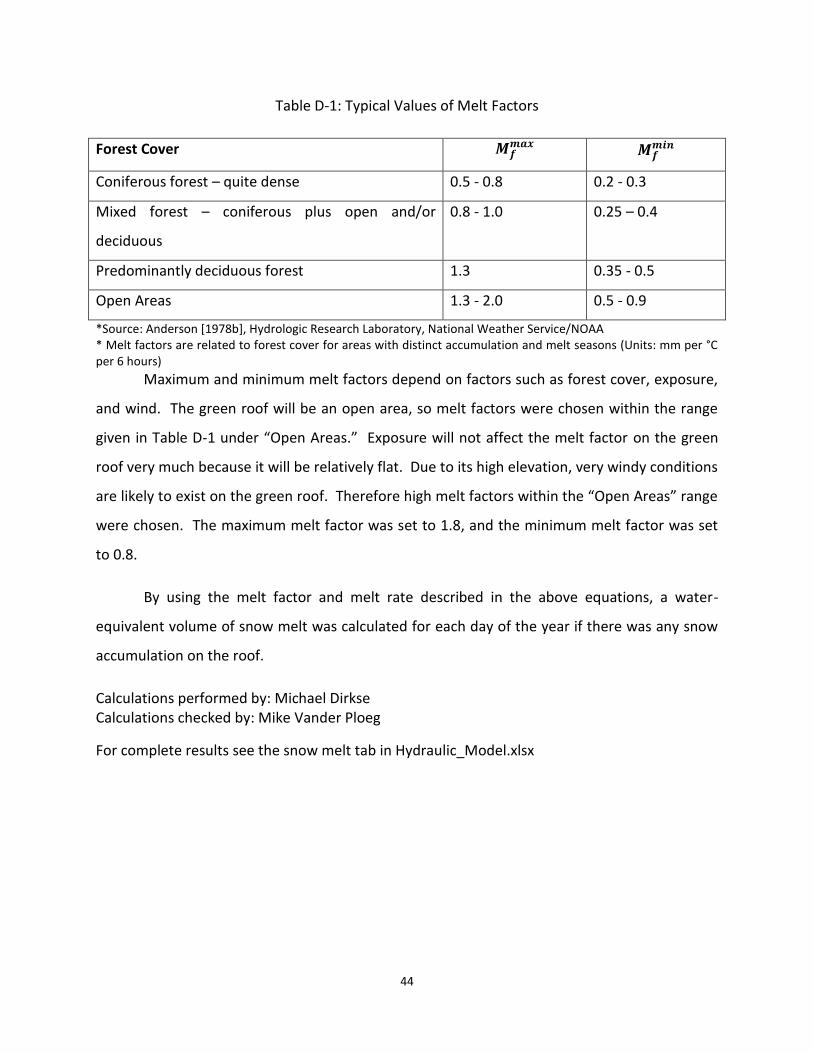
Table D-1: Typical Values of Melt Factors
Forest Cover
Coniferous forest – quite dense 0.5 - 0.8 0.2 - 0.3
Mixed forest – coniferous plus open and/or
deciduous
0.8 - 1.0 0.25 – 0.4
Predominantly deciduous forest 1.3 0.35 - 0.5
Open Areas 1.3 - 2.0 0.5 - 0.9
*Source: Anderson [1978b], Hydrologic Research Laboratory, National Weather Service/NOAA * Melt factors are related to forest cover for areas with distinct accumulation and melt seasons (Units: mm per °C per 6 hours)
Maximum and minimum melt factors depend on factors such as forest cover, exposure,
and wind. The green roof will be an open area, so melt factors were chosen within the range
given in Table D-1 under “Open Areas.” Exposure will not affect the melt factor on the green
roof very much because it will be relatively flat. Due to its high elevation, very windy conditions
are likely to exist on the green roof. Therefore high melt factors within the “Open Areas” range
were chosen. The maximum melt factor was set to 1.8, and the minimum melt factor was set
to 0.8.
By using the melt factor and melt rate described in the above equations, a water-
equivalent volume of snow melt was calculated for each day of the year if there was any snow
accumulation on the roof.
Calculations performed by: Michael Dirkse Calculations checked by: Mike Vander Ploeg
For complete results see the snow melt tab in Hydraulic_Model.xlsx
45
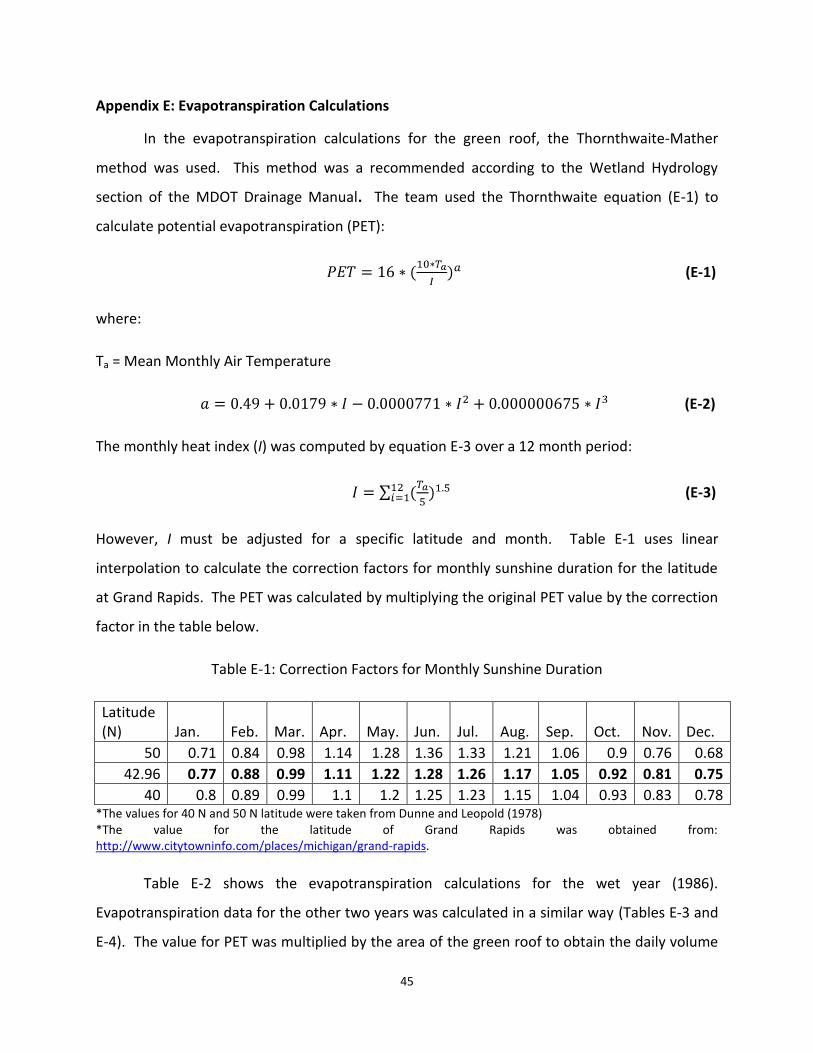
Appendix E: Evapotranspiration Calculations
In the evapotranspiration calculations for the green roof, the Thornthwaite-Mather
method was used. This method was a recommended according to the Wetland Hydrology
section of the MDOT Drainage Manual. The team used the Thornthwaite equation (E-1) to
calculate potential evapotranspiration (PET):
(E-1)
where:
Ta = Mean Monthly Air Temperature
(E-2)
The monthly heat index (I) was computed by equation E-3 over a 12 month period:
(E-3)
However, I must be adjusted for a specific latitude and month. Table E-1 uses linear
interpolation to calculate the correction factors for monthly sunshine duration for the latitude
at Grand Rapids. The PET was calculated by multiplying the original PET value by the correction
factor in the table below.
Table E-1: Correction Factors for Monthly Sunshine Duration
Latitude (N) Jan. Feb. Mar. Apr. May. Jun. Jul. Aug. Sep. Oct. Nov. Dec.
50 0.71 0.84 0.98 1.14 1.28 1.36 1.33 1.21 1.06 0.9 0.76 0.68
42.96 0.77 0.88 0.99 1.11 1.22 1.28 1.26 1.17 1.05 0.92 0.81 0.75
40 0.8 0.89 0.99 1.1 1.2 1.25 1.23 1.15 1.04 0.93 0.83 0.78 *The values for 40 N and 50 N latitude were taken from Dunne and Leopold (1978) *The value for the latitude of Grand Rapids was obtained from: http://www.citytowninfo.com/places/michigan/grand-rapids.
Table E-2 shows the evapotranspiration calculations for the wet year (1986).
Evapotranspiration data for the other two years was calculated in a similar way (Tables E-3 and
E-4). The value for PET was multiplied by the area of the green roof to obtain the daily volume
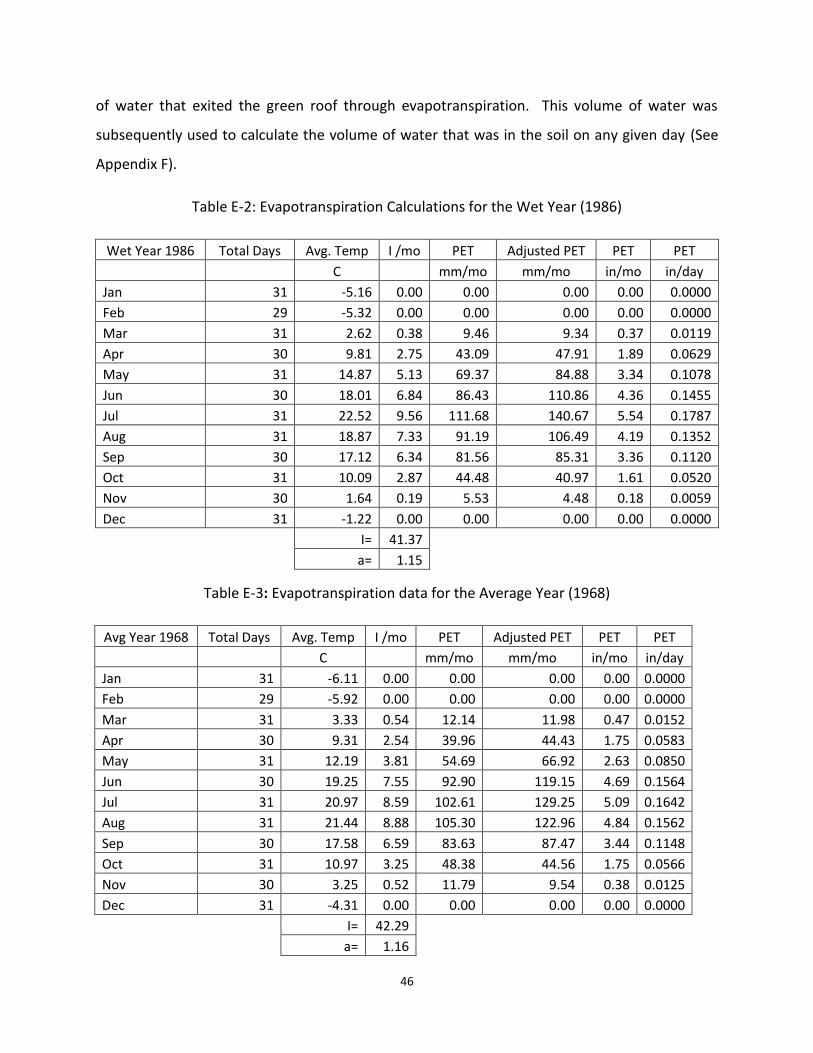
46
of water that exited the green roof through evapotranspiration. This volume of water was
subsequently used to calculate the volume of water that was in the soil on any given day (See
Appendix F).
Table E-2: Evapotranspiration Calculations for the Wet Year (1986)
Wet Year 1986 Total Days Avg. Temp I /mo PET Adjusted PET PET PET
C
mm/mo mm/mo in/mo in/day
Jan 31 -5.16 0.00 0.00 0.00 0.00 0.0000
Feb 29 -5.32 0.00 0.00 0.00 0.00 0.0000
Mar 31 2.62 0.38 9.46 9.34 0.37 0.0119
Apr 30 9.81 2.75 43.09 47.91 1.89 0.0629
May 31 14.87 5.13 69.37 84.88 3.34 0.1078
Jun 30 18.01 6.84 86.43 110.86 4.36 0.1455
Jul 31 22.52 9.56 111.68 140.67 5.54 0.1787
Aug 31 18.87 7.33 91.19 106.49 4.19 0.1352
Sep 30 17.12 6.34 81.56 85.31 3.36 0.1120
Oct 31 10.09 2.87 44.48 40.97 1.61 0.0520
Nov 30 1.64 0.19 5.53 4.48 0.18 0.0059
Dec 31 -1.22 0.00 0.00 0.00 0.00 0.0000
I= 41.37
a= 1.15
Table E-3: Evapotranspiration data for the Average Year (1968)
Avg Year 1968 Total Days Avg. Temp I /mo PET Adjusted PET PET PET
C mm/mo mm/mo in/mo in/day
Jan 31 -6.11 0.00 0.00 0.00 0.00 0.0000
Feb 29 -5.92 0.00 0.00 0.00 0.00 0.0000
Mar 31 3.33 0.54 12.14 11.98 0.47 0.0152
Apr 30 9.31 2.54 39.96 44.43 1.75 0.0583
May 31 12.19 3.81 54.69 66.92 2.63 0.0850
Jun 30 19.25 7.55 92.90 119.15 4.69 0.1564
Jul 31 20.97 8.59 102.61 129.25 5.09 0.1642
Aug 31 21.44 8.88 105.30 122.96 4.84 0.1562
Sep 30 17.58 6.59 83.63 87.47 3.44 0.1148
Oct 31 10.97 3.25 48.38 44.56 1.75 0.0566
Nov 30 3.25 0.52 11.79 9.54 0.38 0.0125
Dec 31 -4.31 0.00 0.00 0.00 0.00 0.0000
I= 42.29
a= 1.16
47
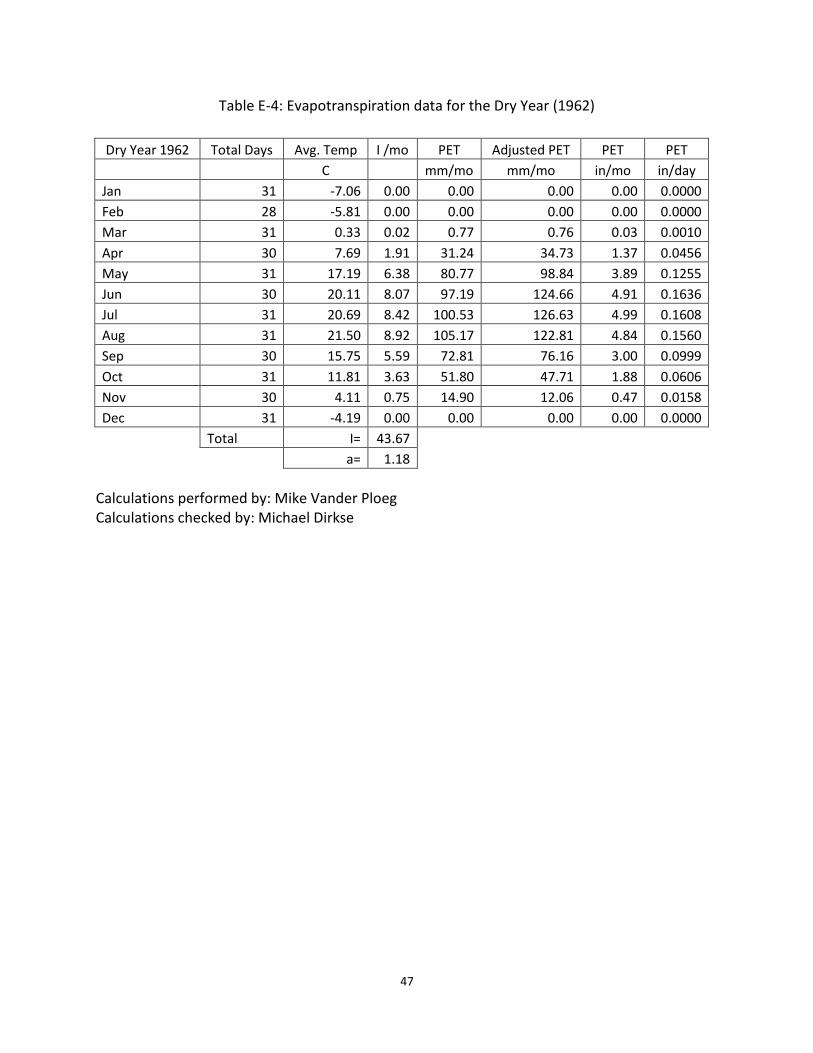
Table E-4: Evapotranspiration data for the Dry Year (1962)
Dry Year 1962 Total Days Avg. Temp I /mo PET Adjusted PET PET PET
C mm/mo mm/mo in/mo in/day
Jan 31 -7.06 0.00 0.00 0.00 0.00 0.0000
Feb 28 -5.81 0.00 0.00 0.00 0.00 0.0000
Mar 31 0.33 0.02 0.77 0.76 0.03 0.0010
Apr 30 7.69 1.91 31.24 34.73 1.37 0.0456
May 31 17.19 6.38 80.77 98.84 3.89 0.1255
Jun 30 20.11 8.07 97.19 124.66 4.91 0.1636
Jul 31 20.69 8.42 100.53 126.63 4.99 0.1608
Aug 31 21.50 8.92 105.17 122.81 4.84 0.1560
Sep 30 15.75 5.59 72.81 76.16 3.00 0.0999
Oct 31 11.81 3.63 51.80 47.71 1.88 0.0606
Nov 30 4.11 0.75 14.90 12.06 0.47 0.0158
Dec 31 -4.19 0.00 0.00 0.00 0.00 0.0000
Total I= 43.67
a= 1.18
Calculations performed by: Mike Vander Ploeg Calculations checked by: Michael Dirkse
48
Appendix F: Drainage and Runoff Calculations
To properly calculate the volumes of drainage and runoff from the green roof, the
amount of water in the soil layer of the green roof was calculated for each day. The soil on the
green roof has a porosity of 0.53, so 53% of the soil volume was assumed to be empty space
that could be filled with water. The saturated soil volume (the total volume within the soil that
water could occupy) was calculated by multiplying the soil depth, the green roof area, and the
soil porosity. The daily volume of water in the soil (Vsoil) was calculated using equation Q-1:
(Q-1)
Vsoil_prev represents the volume of water in the soil from the previous day. Vpumped represents the
volume of water that was pumped from the cisterns to the green roof for irrigation for that day.
R represents a daily volume of rainfall, SM represents the daily volume of snow melt, and ET
represents the volume of water leaving the green roof through evapotranspiration.
Calculations performed by: Mike Vander Ploeg
Calculations checked by: Michael Dirkse
49
Appendix G: Irrigation Controller Specifications

50
51
Appendix H: Comparison of Timed Irrigation to Irrigation Based on Soil Moisture
Calculations performed by: Michael Dirkse
Calculations checked by: Mike Vander Ploeg
52
Calculations performed by: Michael Dirkse
Calculations checked by: Mike Vander Ploeg
53
Appendix I: Sprinkler Head Specifications
54
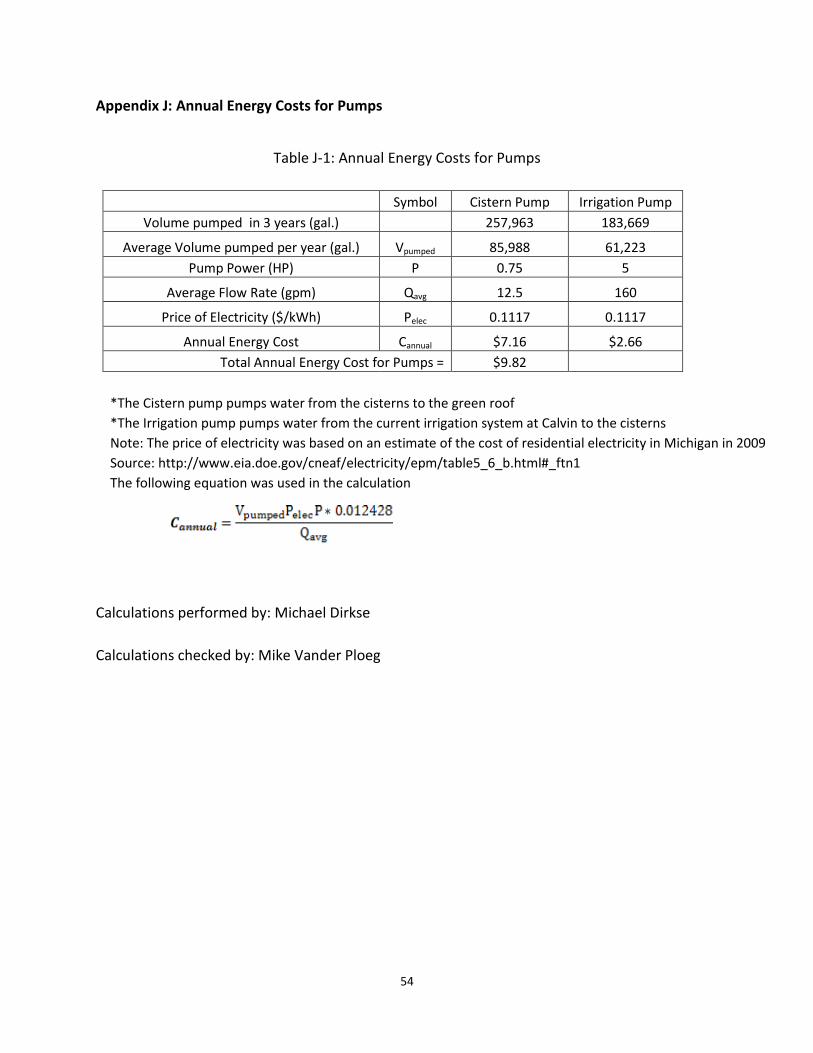
Appendix J: Annual Energy Costs for Pumps
Table J-1: Annual Energy Costs for Pumps
Symbol Cistern Pump Irrigation Pump Volume pumped in 3 years (gal.) 257,963 183,669 Average Volume pumped per year (gal.) Vpumped 85,988 61,223 Pump Power (HP) P 0.75 5 Average Flow Rate (gpm) Qavg 12.5 160 Price of Electricity ($/kWh) Pelec 0.1117 0.1117 Annual Energy Cost Cannual $7.16 $2.66 Total Annual Energy Cost for Pumps = $9.82
*The Cistern pump pumps water from the cisterns to the green roof *The Irrigation pump pumps water from the current irrigation system at Calvin to the cisterns
Note: The price of electricity was based on an estimate of the cost of residential electricity in Michigan in 2009
Source: http://www.eia.doe.gov/cneaf/electricity/epm/table5_6_b.html#_ftn1 The following equation was used in the calculation
Calculations performed by: Michael Dirkse
Calculations checked by: Mike Vander Ploeg
55
Appendix K: Pump Curves and Specifications
56
57
Pipe Headloss Calculations
This is a sample calculation for the pipe head loss in irrigation zone 1. This calculation was carried out multiple times for each irrigation zone.
Length of pipe in irrigation zone
Diameter of pipe
Mean velocity of water flowing through the pipe
Kinematic viscosity of water at 70 F
Source: Water Resources Engineering by Mays pg. 16 Table 2.1.1
Reynolds Number
Pipe friction factor, which was obtained from the Moody Diagram. Since the pipe material is PVC, a smooth pipe was assumed, and the corresponding curve was used to find the friction factor.
Darcy-Weisbach equation
Pipe head loss
L 140ft
D 1 in
V 4ft
s
1.059105 ft
2
s
ReV D
Re 3.148 104
f 0.023
hL fL
D
V2
2g
hL 9.608ft
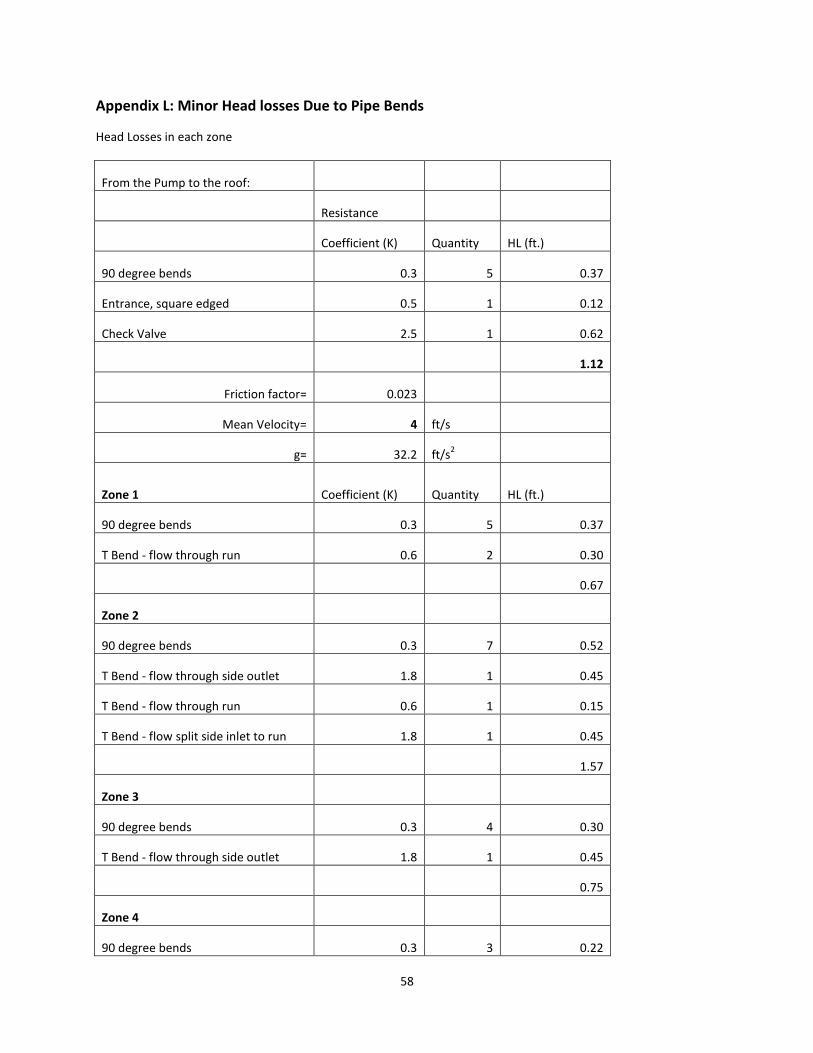
58
Appendix L: Minor Head losses Due to Pipe Bends
Head Losses in each zone
From the Pump to the roof:
Resistance
Coefficient (K) Quantity HL (ft.)
90 degree bends 0.3 5 0.37
Entrance, square edged 0.5 1 0.12
Check Valve 2.5 1 0.62
1.12
Friction factor= 0.023
Mean Velocity= 4 ft/s
g= 32.2 ft/s2
Zone 1 Coefficient (K) Quantity HL (ft.)
90 degree bends 0.3 5 0.37
T Bend - flow through run 0.6 2 0.30
0.67
Zone 2
90 degree bends 0.3 7 0.52
T Bend - flow through side outlet 1.8 1 0.45
T Bend - flow through run 0.6 1 0.15
T Bend - flow split side inlet to run 1.8 1 0.45
1.57
Zone 3
90 degree bends 0.3 4 0.30
T Bend - flow through side outlet 1.8 1 0.45
0.75
Zone 4
90 degree bends 0.3 3 0.22
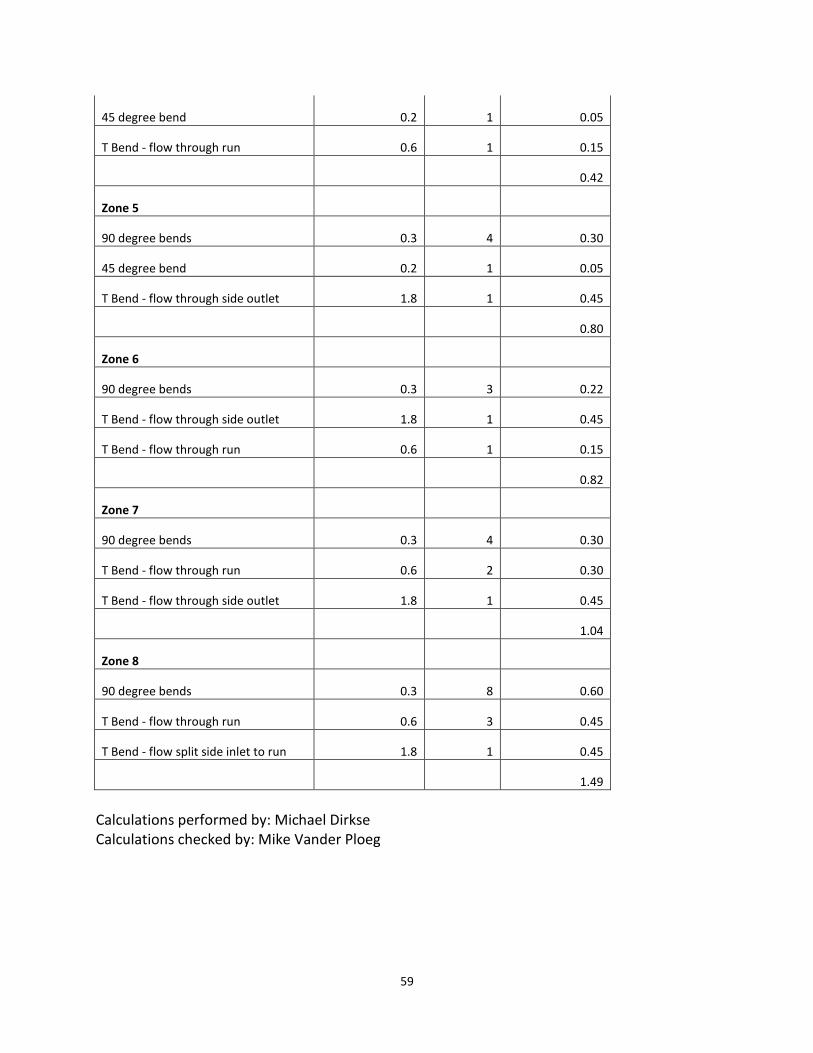
59
45 degree bend 0.2 1 0.05
T Bend - flow through run 0.6 1 0.15
0.42
Zone 5
90 degree bends 0.3 4 0.30
45 degree bend 0.2 1 0.05
T Bend - flow through side outlet 1.8 1 0.45
0.80
Zone 6
90 degree bends 0.3 3 0.22
T Bend - flow through side outlet 1.8 1 0.45
T Bend - flow through run 0.6 1 0.15
0.82
Zone 7
90 degree bends 0.3 4 0.30
T Bend - flow through run 0.6 2 0.30
T Bend - flow through side outlet 1.8 1 0.45
1.04
Zone 8
90 degree bends 0.3 8 0.60
T Bend - flow through run 0.6 3 0.45
T Bend - flow split side inlet to run 1.8 1 0.45
1.49
Calculations performed by: Michael Dirkse Calculations checked by: Mike Vander Ploeg
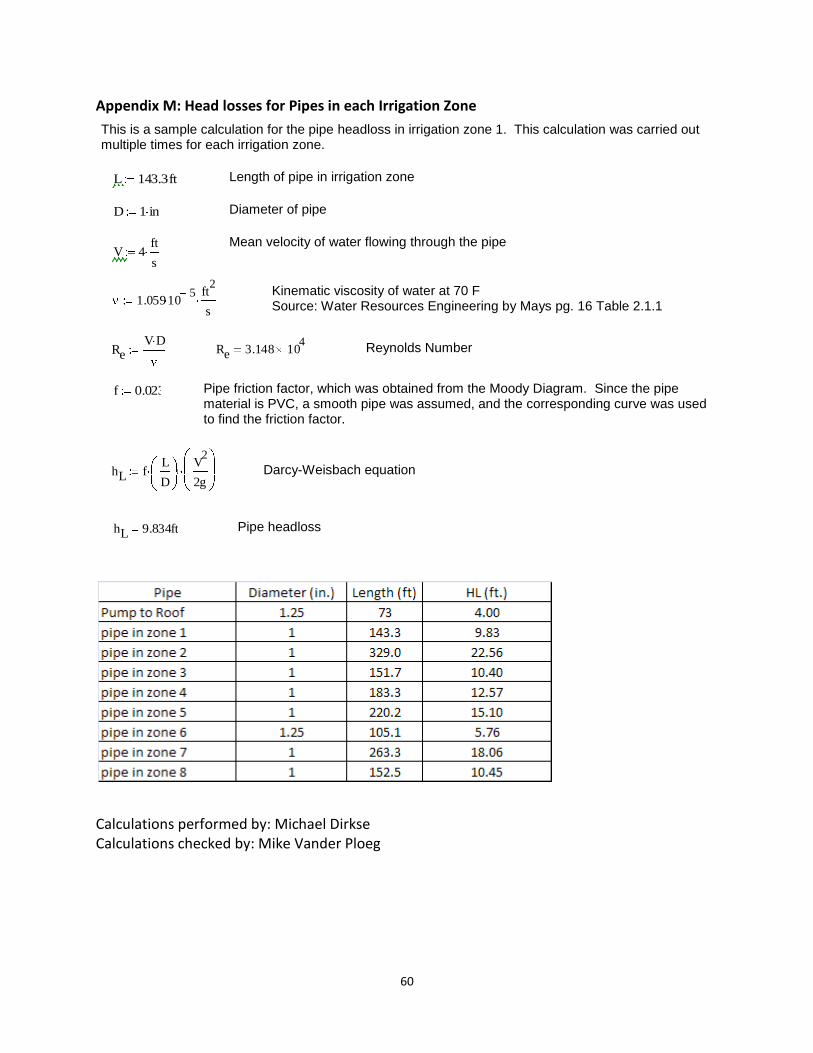
60
Appendix M: Head losses for Pipes in each Irrigation Zone
Calculations performed by: Michael Dirkse Calculations checked by: Mike Vander Ploeg
This is a sample calculation for the pipe headloss in irrigation zone 1. This calculation was carried out multiple times for each irrigation zone.
Length of pipe in irrigation zone
Diameter of pipe
Mean velocity of water flowing through the pipe
Kinematic viscosity of water at 70 F Source: Water Resources Engineering by Mays pg. 16 Table 2.1.1
Reynolds Number
Pipe friction factor, which was obtained from the Moody Diagram. Since the pipe material is PVC, a smooth pipe was assumed, and the corresponding curve was used to find the friction factor.
Darcy-Weisbach equation
Pipe headloss
L 143.3ft
D 1 in
V 4ft
s
1.059105 ft
2
s
ReV D
Re 3.148 104
f 0.023
hL fL
D
V2
2g
hL 9.834ft
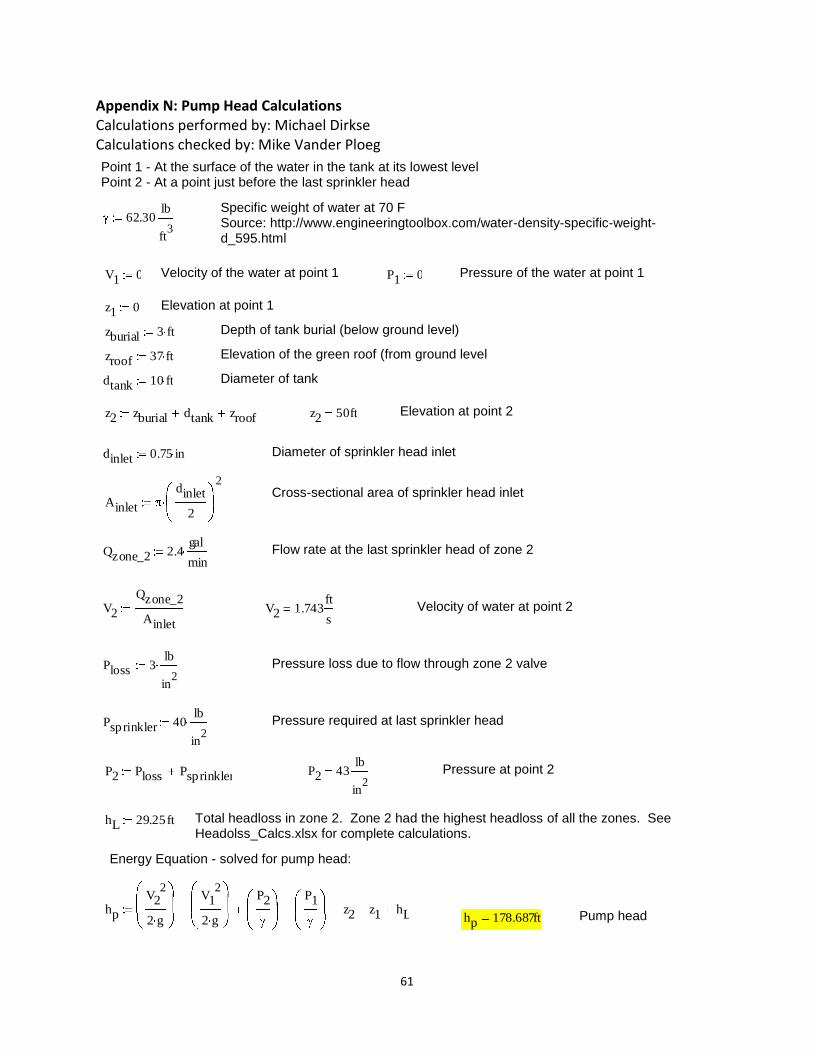
61
Appendix N: Pump Head Calculations Calculations performed by: Michael Dirkse Calculations checked by: Mike Vander Ploeg
Point 1 - At the surface of the water in the tank at its lowest level Point 2 - At a point just before the last sprinkler head
Specific weight of water at 70 F Source: http://www.engineeringtoolbox.com/water-density-specific-weight-d_595.html
Velocity of the water at point 1 Pressure of the water at point 1
Elevation at point 1
Depth of tank burial (below ground level)
Elevation of the green roof (from ground level
Diameter of tank
Elevation at point 2
Diameter of sprinkler head inlet
Cross-sectional area of sprinkler head inlet
Flow rate at the last sprinkler head of zone 2
Velocity of water at point 2
Pressure loss due to flow through zone 2 valve
Pressure required at last sprinkler head
Pressure at point 2
Total headloss in zone 2. Zone 2 had the highest headloss of all the zones. See Headolss_Calcs.xlsx for complete calculations.
Energy Equation - solved for pump head:
Pump head
62.30lb
ft3
V1 0 P1 0
z1 0
zburial 3 ft
zroof 37 ft
dtank 10 ft
z2 zburial dtank zroof z2 50ft
dinlet 0.75 in
Ainlet
dinlet
2
2
Qzone_2 2.4gal
min
V2
Qzone_2
Ainlet
V2 1.743ft
s
Ploss 3lb
in2
Psprinkler 40lb
in2
P2 Ploss Psprinkler P2 43lb
in2
hL 29.25ft
hp
V22
2 g
V12
2 g
P2 P1z2 z1 hL hp 178.687ft
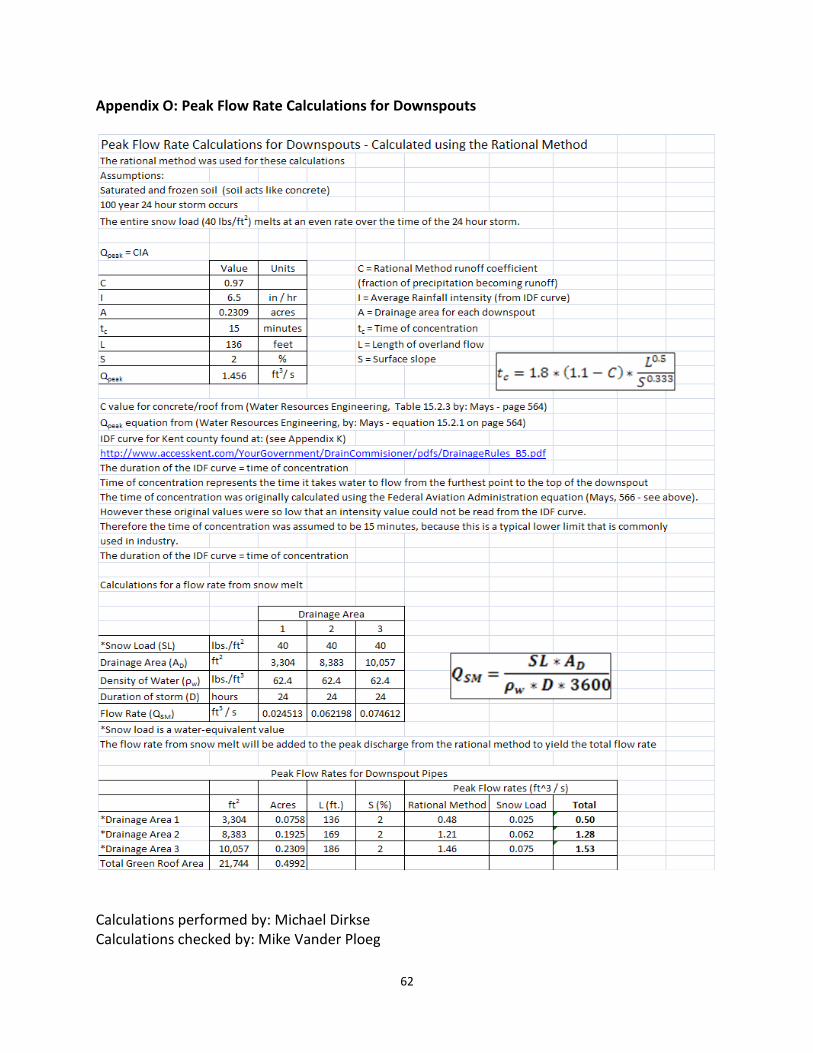
62
Appendix O: Peak Flow Rate Calculations for Downspouts
Calculations performed by: Michael Dirkse Calculations checked by: Mike Vander Ploeg
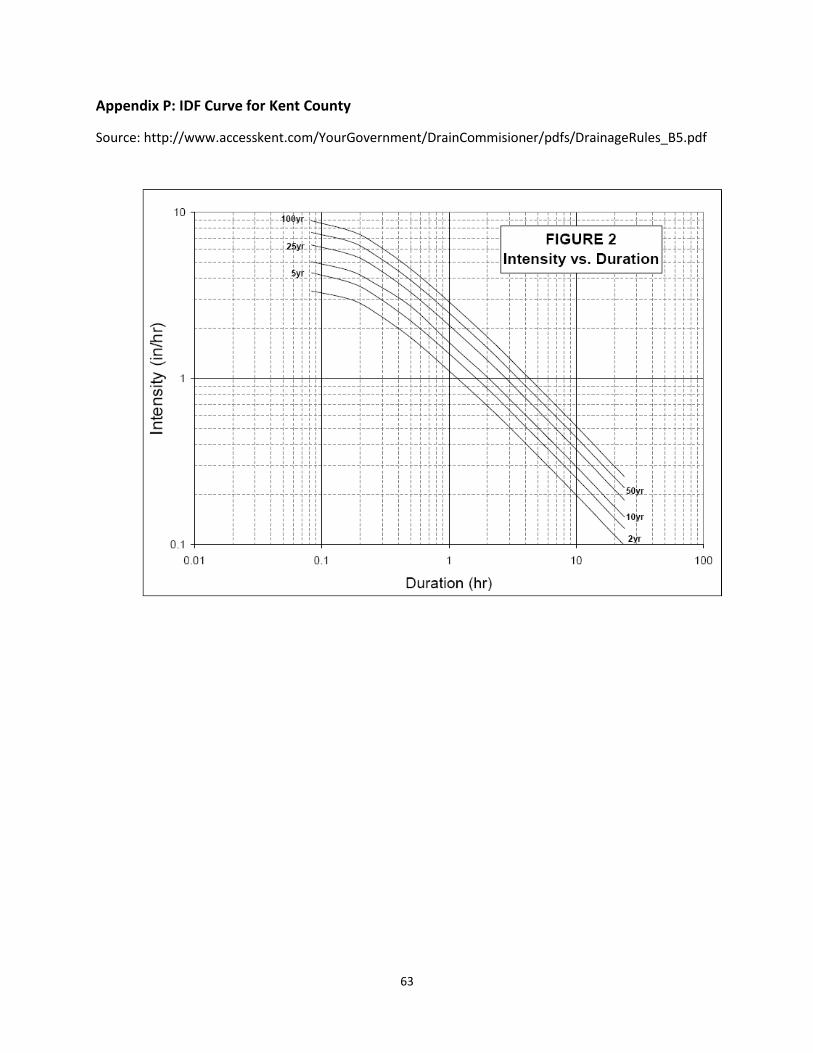
63
Appendix P: IDF Curve for Kent County
Source: http://www.accesskent.com/YourGovernment/DrainCommisioner/pdfs/DrainageRules_B5.pdf
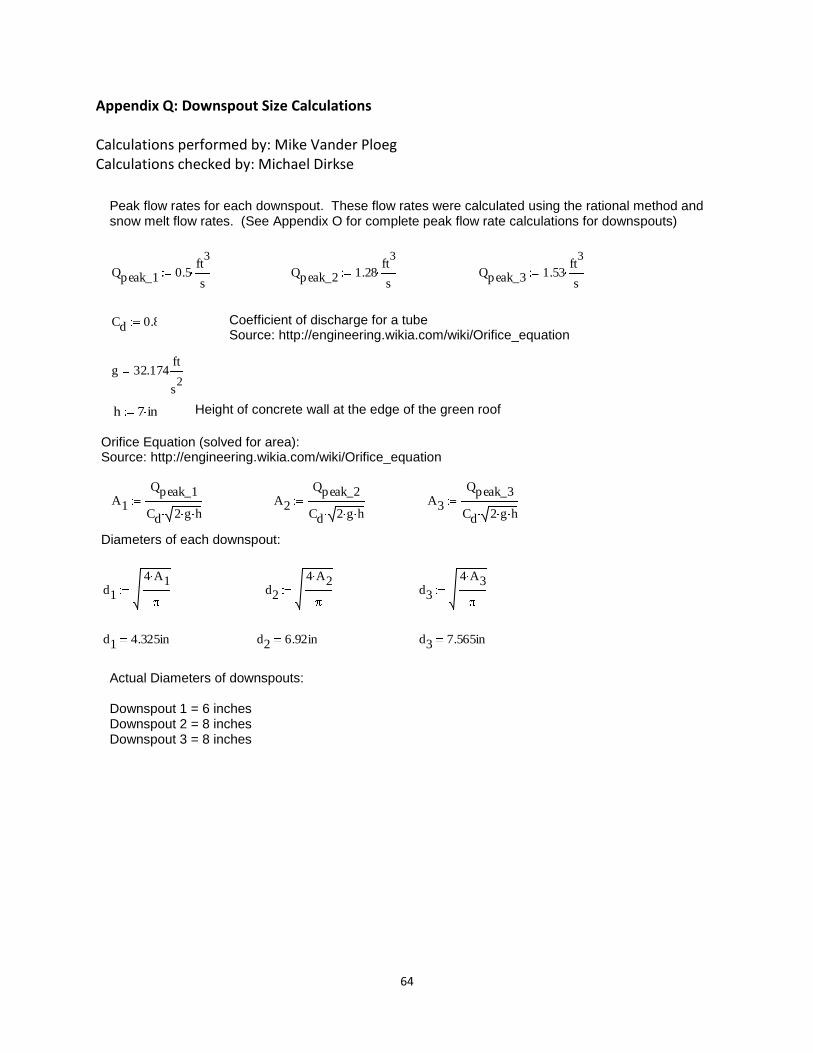
64
Appendix Q: Downspout Size Calculations Calculations performed by: Mike Vander Ploeg Calculations checked by: Michael Dirkse
Peak flow rates for each downspout. These flow rates were calculated using the rational method and snow melt flow rates. (See Appendix O for complete peak flow rate calculations for downspouts)
Coefficient of discharge for a tube Source: http://engineering.wikia.com/wiki/Orifice_equation
Height of concrete wall at the edge of the green roof
Orifice Equation (solved for area): Source: http://engineering.wikia.com/wiki/Orifice_equation
Diameters of each downspout:
Actual Diameters of downspouts: Downspout 1 = 6 inches Downspout 2 = 8 inches Downspout 3 = 8 inches
Qpeak_1 0.5ft
3
sQpeak_2 1.28
ft3
sQpeak_3 1.53
ft3
s
Cd 0.8
g 32.174ft
s2
h 7 in
A1
Qpeak_1
Cd 2 g hA2
Qpeak_2
Cd 2 g hA3
Qpeak_3
Cd 2 g h
d1
4 A1d2
4 A2d3
4 A3
d1 4.325in d2 6.92in d3 7.565in
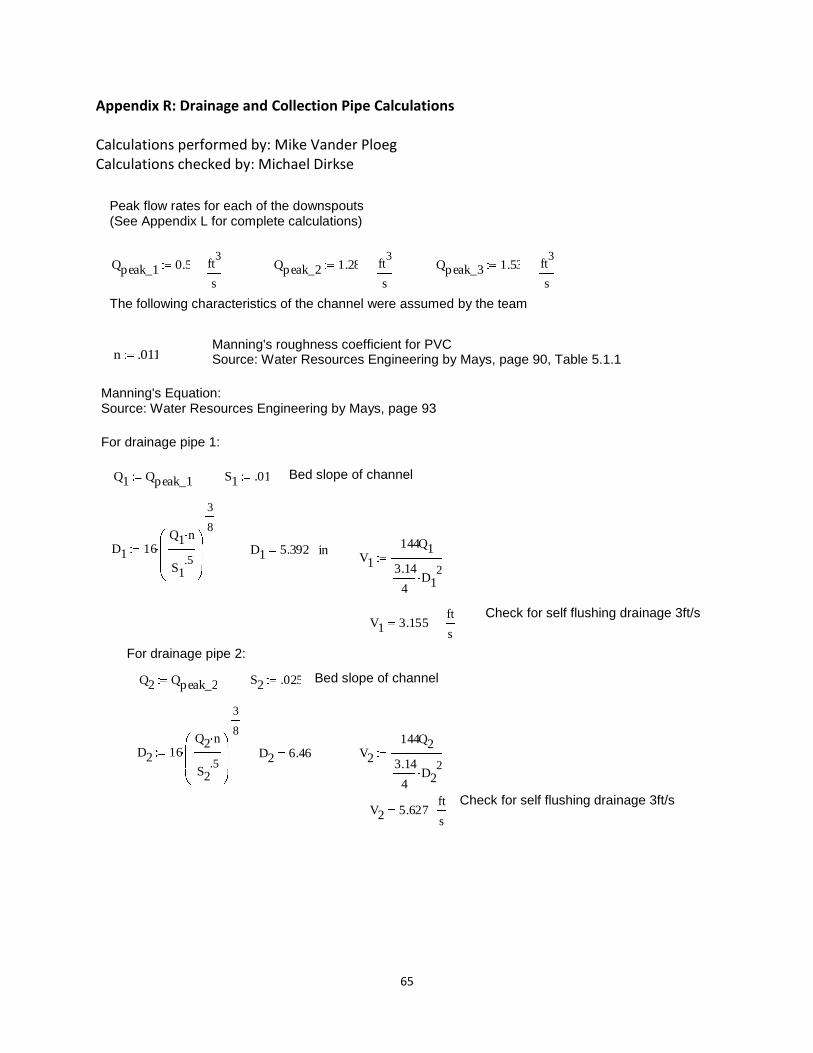
65
Appendix R: Drainage and Collection Pipe Calculations Calculations performed by: Mike Vander Ploeg Calculations checked by: Michael Dirkse
Peak flow rates for each of the downspouts (See Appendix L for complete calculations)
The following characteristics of the channel were assumed by the team
Manning's roughness coefficient for PVC Source: Water Resources Engineering by Mays, page 90, Table 5.1.1
Manning's Equation: Source: Water Resources Engineering by Mays, page 93
For drainage pipe 1:
Bed slope of channel
Check for self flushing drainage 3ft/s
For drainage pipe 2:
Bed slope of channel
Check for self flushing drainage 3ft/s
Qpeak_1 0.5 Qpeak_2 1.28 Qpeak_3 1.53ft3
s
ft3
s
ft3
s
n .011
Q1 Qpeak_1 S1 .01
D1 16Q1 n
S1.5
3
8
D1 5.392 inV1
144Q1
3.14
4D1
2
V1 3.155ft
s
Q2 Qpeak_2 S2 .025
D2 16Q2 n
S2.5
3
8
D2 6.46 V2
144Q2
3.14
4D2
2
V2 5.627ft
s
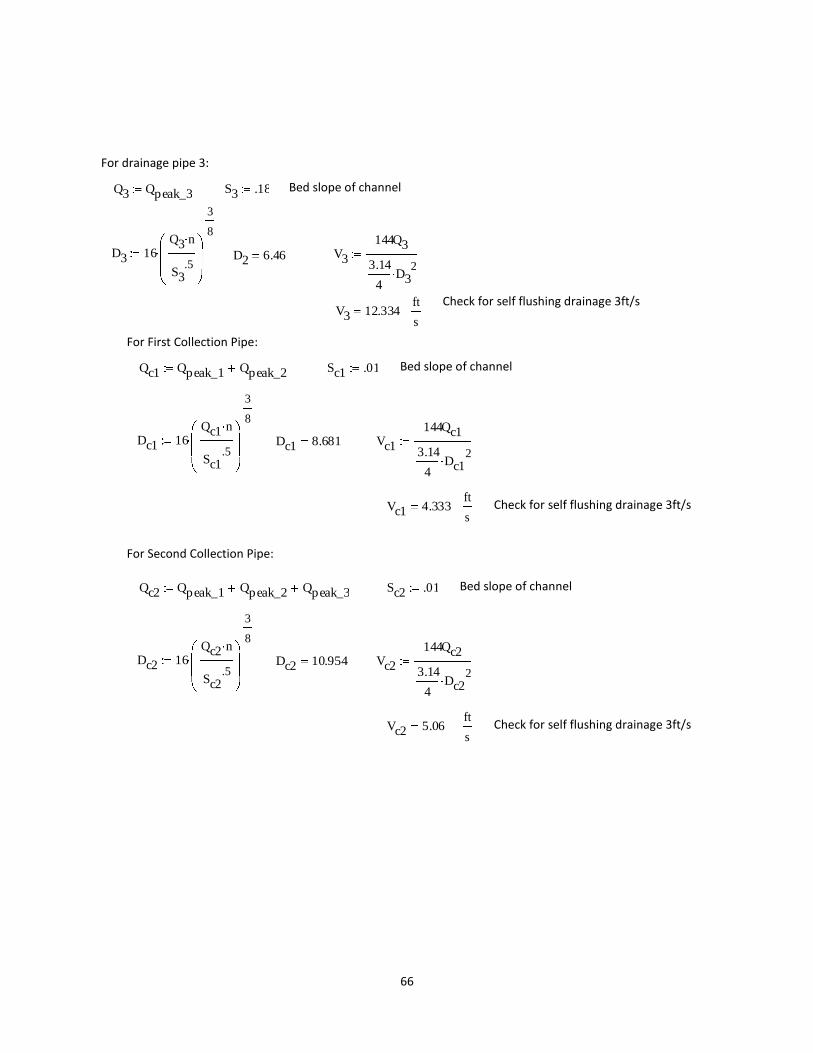
66
For drainage pipe 3:
Bed slope of channel
Check for self flushing drainage 3ft/s
For First Collection Pipe:
Bed slope of channel
Check for self flushing drainage 3ft/s
For Second Collection Pipe:
Bed slope of channel
Check for self flushing drainage 3ft/s
Q3 Qpeak_3 S3 .18
D3 16Q3 n
S3.5
3
8
D2 6.46 V3
144Q3
3.14
4D3
2
V3 12.334ft
s
Qc1 Qpeak_1 Qpeak_2 Sc1 .01
Dc1 16Qc1 n
Sc1.5
3
8
Dc1 8.681 Vc1
144Qc1
3.14
4Dc1
2
Vc1 4.333ft
s
Qc2 Qpeak_1 Qpeak_2 Qpeak_3 Sc2 .01
Dc2 16Qc2 n
Sc2.5
3
8
Dc2 10.954 Vc2
144Qc2
3.14
4Dc2
2
Vc2 5.06ft
s
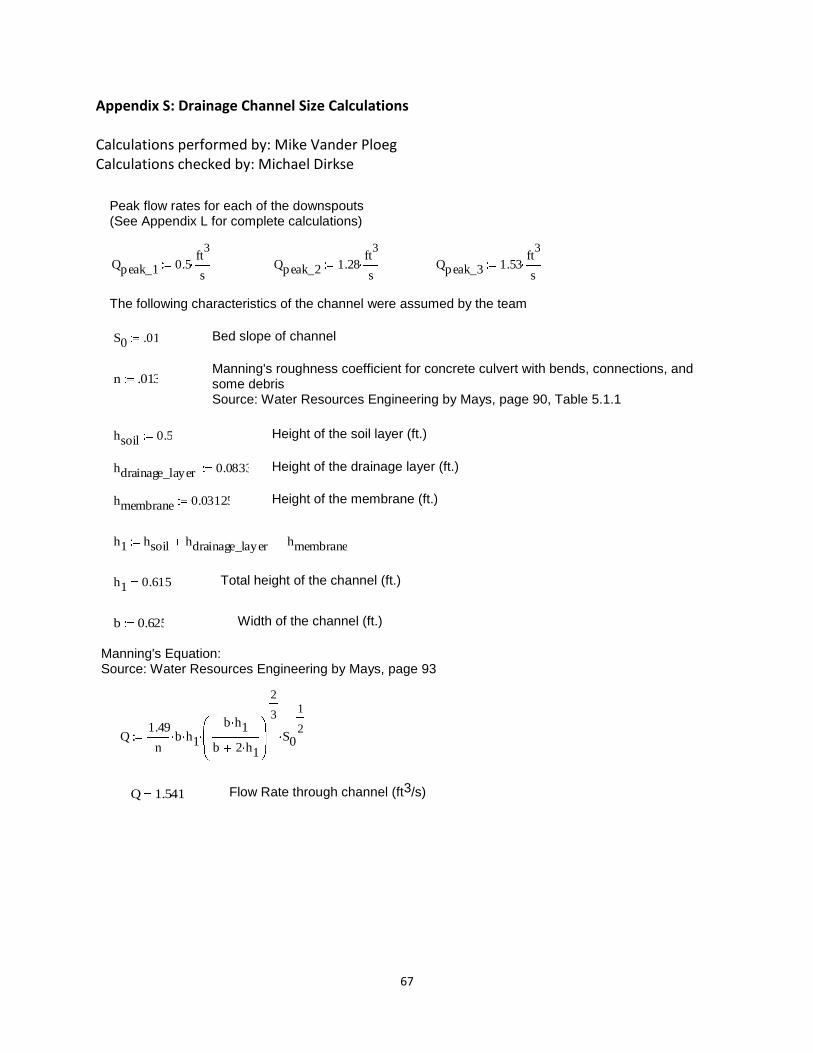
67
Appendix S: Drainage Channel Size Calculations Calculations performed by: Mike Vander Ploeg Calculations checked by: Michael Dirkse
Peak flow rates for each of the downspouts (See Appendix L for complete calculations)
The following characteristics of the channel were assumed by the team
Bed slope of channel
Manning's roughness coefficient for concrete culvert with bends, connections, and some debris Source: Water Resources Engineering by Mays, page 90, Table 5.1.1
Height of the soil layer (ft.)
Height of the drainage layer (ft.)
Height of the membrane (ft.)
Total height of the channel (ft.)
Width of the channel (ft.)
Manning's Equation: Source: Water Resources Engineering by Mays, page 93
Flow Rate through channel (ft3/s)
Qpeak_1 0.5ft
3
sQpeak_2 1.28
ft3
sQpeak_3 1.53
ft3
s
S0 .01
n .013
hsoil 0.5
hdrainage_layer 0.0833
hmembrane 0.03125
h1 hsoil hdrainage_layer hmembrane
h1 0.615
b 0.625
Q1.49
nb h1
b h1
b 2 h1
2
3
S0
1
2
Q 1.541
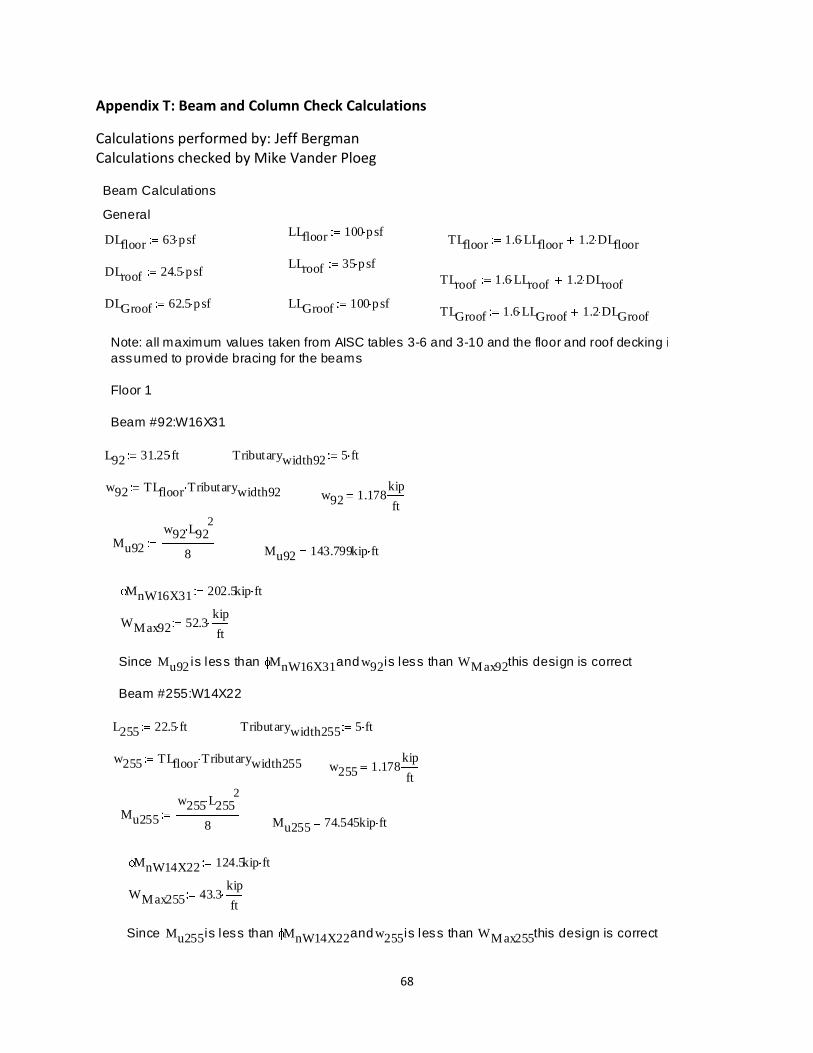
68
Appendix T: Beam and Column Check Calculations
Calculations performed by: Jeff Bergman Calculations checked by Mike Vander Ploeg
Beam Calculations
General
LLfloor 100 psfDLfloor 63 psf TLfloor 1.6 LLfloor 1.2 DLfloor
LLroof 35 psfDLroof 24.5 psf
TLroof 1.6 LLroof 1.2 DLroof
DLGroof 62.5 psf LLGroof 100 psfTLGroof 1.6 LLGroof 1.2 DLGroof
Note: all maximum values taken from AISC tables 3-6 and 3-10 and the floor and roof decking is
assumed to provide bracing for the beams
Floor 1
Beam #92:W16X31
L92 31.25ft Tributarywidth92 5 ft
w92 TLfloor Tributarywidth92 w92 1.178kip
ft
Mu92
w92 L922
8 Mu92 143.799kip ft
MnW16X31 202.5kip ft
WMax92 52.3kip
ft
Since Mu92 is less than MnW16X31 and w92 is less than WMax92 this design is correct
Beam #255:W14X22
L255 22.5 ft Tributarywidth255 5 ft
w255 TLfloor Tributarywidth255 w255 1.178kip
ft
Mu255
w255 L2552
8 Mu255 74.545kip ft
MnW14X22 124.5kip ft
WMax255 43.3kip
ft
Since Mu255 is less than MnW14X22 and w255 is less than WMax255 this design is correct
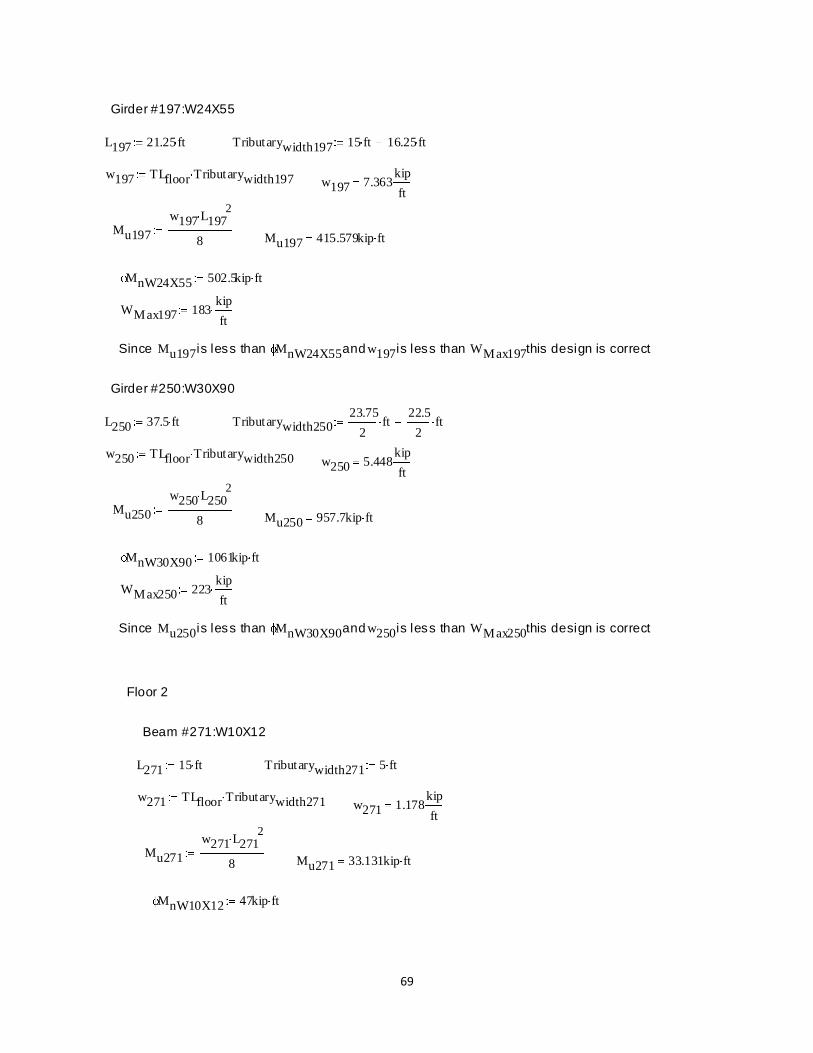
69
Girder #197:W24X55
L197 21.25 ft Tributarywidth197 15 ft 16.25 ft
w197 TLfloor Tributarywidth197 w197 7.363kip
ft
Mu197
w197 L1972
8 Mu197 415.579kip ft
MnW24X55 502.5kip ft
WMax197 183kip
ft
Since Mu197 is less than MnW24X55 and w197 is less than WMax197 this design is correct
Girder #250:W30X90
L250 37.5 ft Tributarywidth25023.75
2ft
22.5
2ft
w250 TLfloor Tributarywidth250 w250 5.448kip
ft
Mu250
w250 L2502
8 Mu250 957.7kip ft
MnW30X90 1061kip ft
WMax250 223kip
ft
Since Mu250 is less than MnW30X90 and w250 is less than WMax250 this design is correct
Floor 2
Beam #271:W10X12
L271 15 ft Tributarywidth271 5 ft
w271 TLfloor Tributarywidth271 w271 1.178kip
ft
Mu271
w271 L2712
8 Mu271 33.131kip ft
MnW10X12 47kip ft
WMax271 25kip
ft
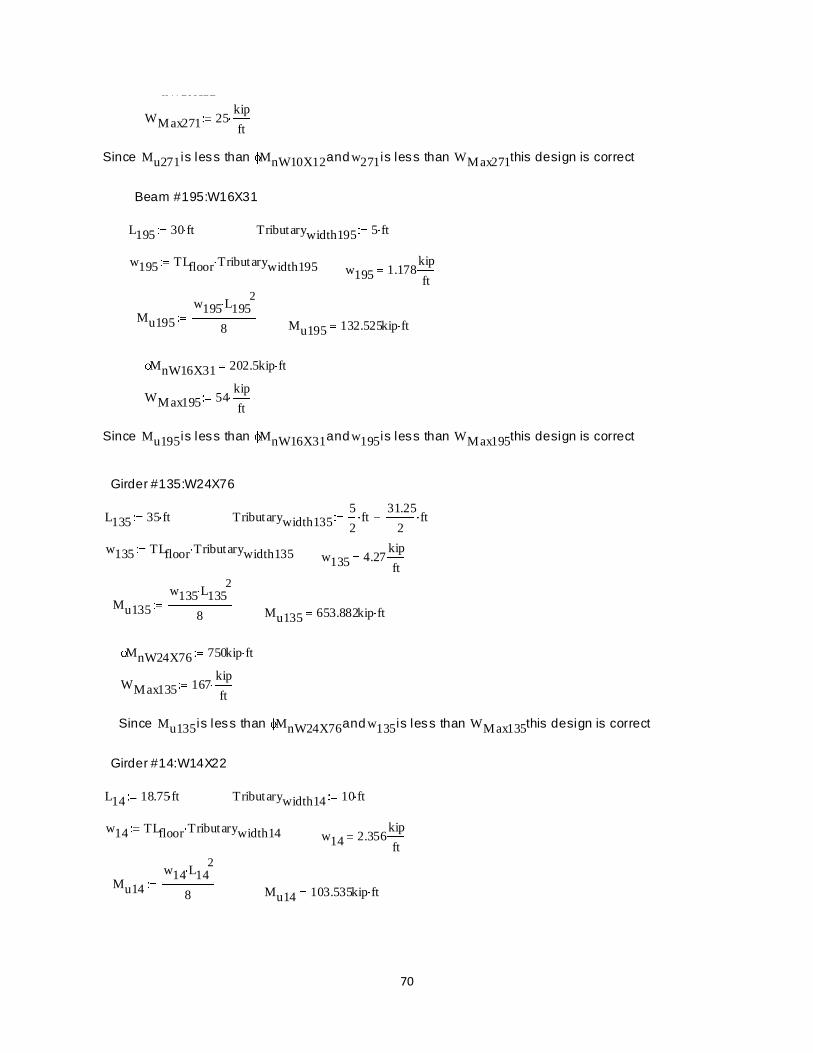
70
MnW10X12 47kip ft
WMax271 25kip
ft
Since Mu271 is less than MnW10X12 and w271 is less than WMax271 this design is correct
Beam #195:W16X31
L195 30 ft Tributarywidth195 5 ft
w195 TLfloor Tributarywidth195 w195 1.178kip
ft
Mu195
w195 L1952
8 Mu195 132.525kip ft
MnW16X31 202.5kip ft
WMax195 54kip
ft
Since Mu195 is less than MnW16X31 and w195 is less than WMax195 this design is correct
Girder #135:W24X76
L135 35 ft Tributarywidth1355
2ft
31.25
2ft
w135 TLfloor Tributarywidth135 w135 4.27kip
ft
Mu135
w135 L1352
8 Mu135 653.882kip ft
MnW24X76 750kip ft
WMax135 167kip
ft
Since Mu135 is less than MnW24X76 and w135 is less than WMax135 this design is correct
Girder #14:W14X22
L14 18.75 ft Tributarywidth14 10 ft
w14 TLfloor Tributarywidth14 w14 2.356kip
ft
Mu14
w14 L142
8 Mu14 103.535kip ft
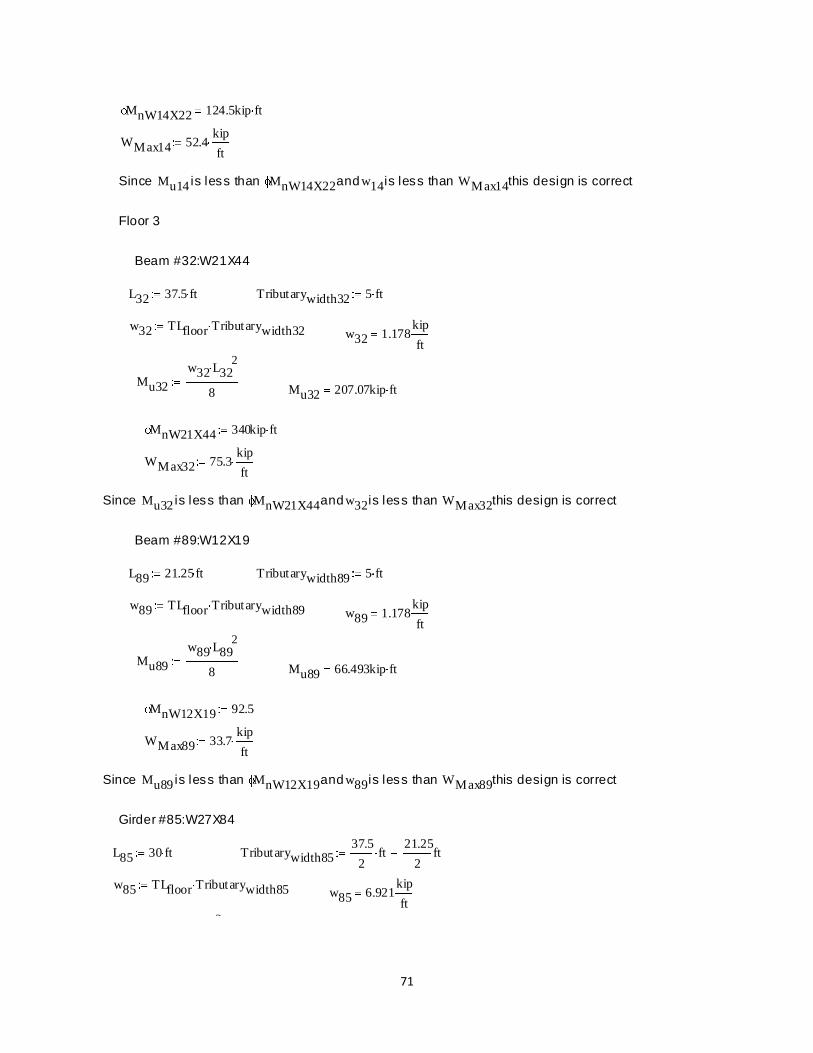
71
MnW14X22 124.5kip ft
WMax14 52.4kip
ft
Since Mu14 is less than MnW14X22 and w14 is less than WMax14 this design is correct
Floor 3
Beam #32:W21X44
L32 37.5 ft Tributarywidth32 5 ft
w32 TLfloor Tributarywidth32 w32 1.178kip
ft
Mu32
w32 L322
8 Mu32 207.07kip ft
MnW21X44 340kip ft
WMax32 75.3kip
ft
Since Mu32 is less than MnW21X44 and w32 is less than WMax32 this design is correct
Beam #89:W12X19
L89 21.25ft Tributarywidth89 5 ft
w89 TLfloor Tributarywidth89 w89 1.178kip
ft
Mu89
w89 L892
8 Mu89 66.493kip ft
MnW12X19 92.5
WMax89 33.7kip
ft
Since Mu89 is less than MnW12X19 and w89 is less than WMax89 this design is correct
Girder #85:W27X84
L85 30 ft Tributarywidth8537.5
2ft
21.25
2ft
w85 TLfloor Tributarywidth85 w85 6.921kip
ft
Mu85
w85 L852
8
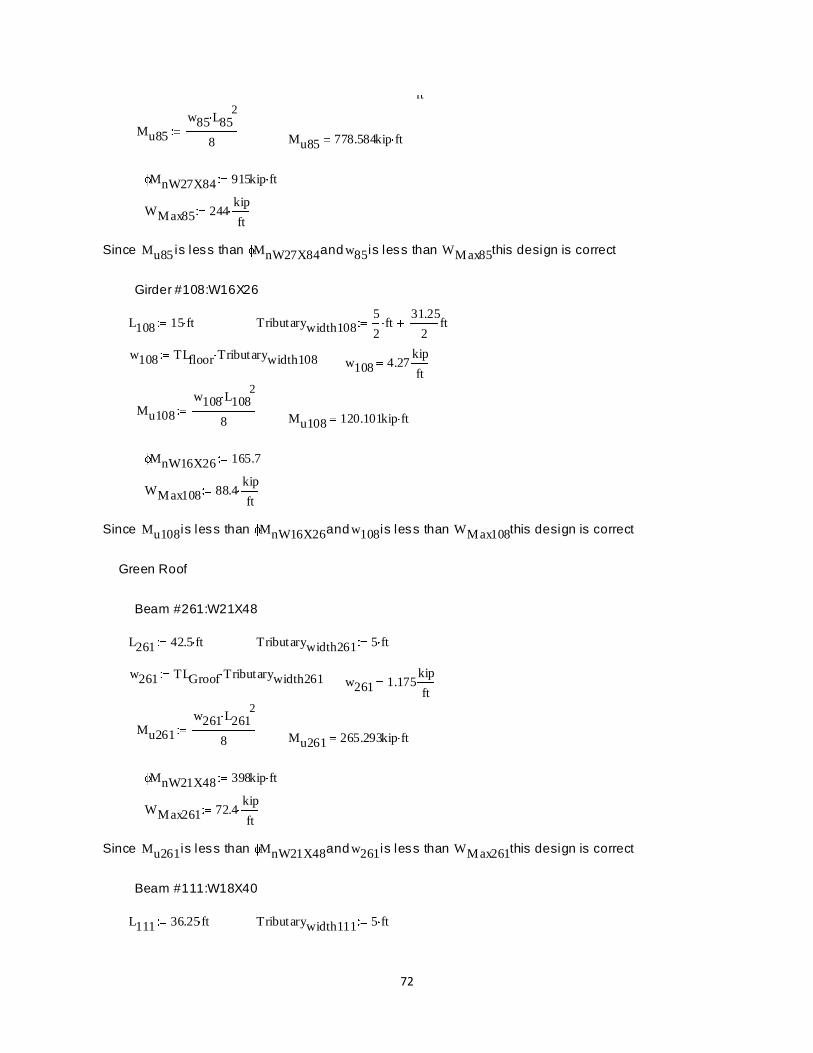
72
w85 6.921kip
ft
Mu85
w85 L852
8 Mu85 778.584kip ft
MnW27X84 915kip ft
WMax85 244kip
ft
Since Mu85 is less than MnW27X84 and w85 is less than WMax85 this design is correct
Girder #108:W16X26
L108 15 ft Tributarywidth1085
2ft
31.25
2ft
w108 TLfloor Tributarywidth108 w108 4.27kip
ft
Mu108
w108 L1082
8 Mu108 120.101kip ft
MnW16X26 165.7
WMax108 88.4kip
ft
Since Mu108 is less than MnW16X26 and w108 is less than WMax108 this design is correct
Green Roof
Beam #261:W21X48
L261 42.5 ft Tributarywidth261 5 ft
w261 TLGroof Tributarywidth261 w261 1.175kip
ft
Mu261
w261 L2612
8 Mu261 265.293kip ft
MnW21X48 398kip ft
WMax261 72.4kip
ft
Since Mu261 is less than MnW21X48 and w261 is less than WMax261 this design is correct
Beam #111:W18X40
L111 36.25ft Tributarywidth111 5 ft
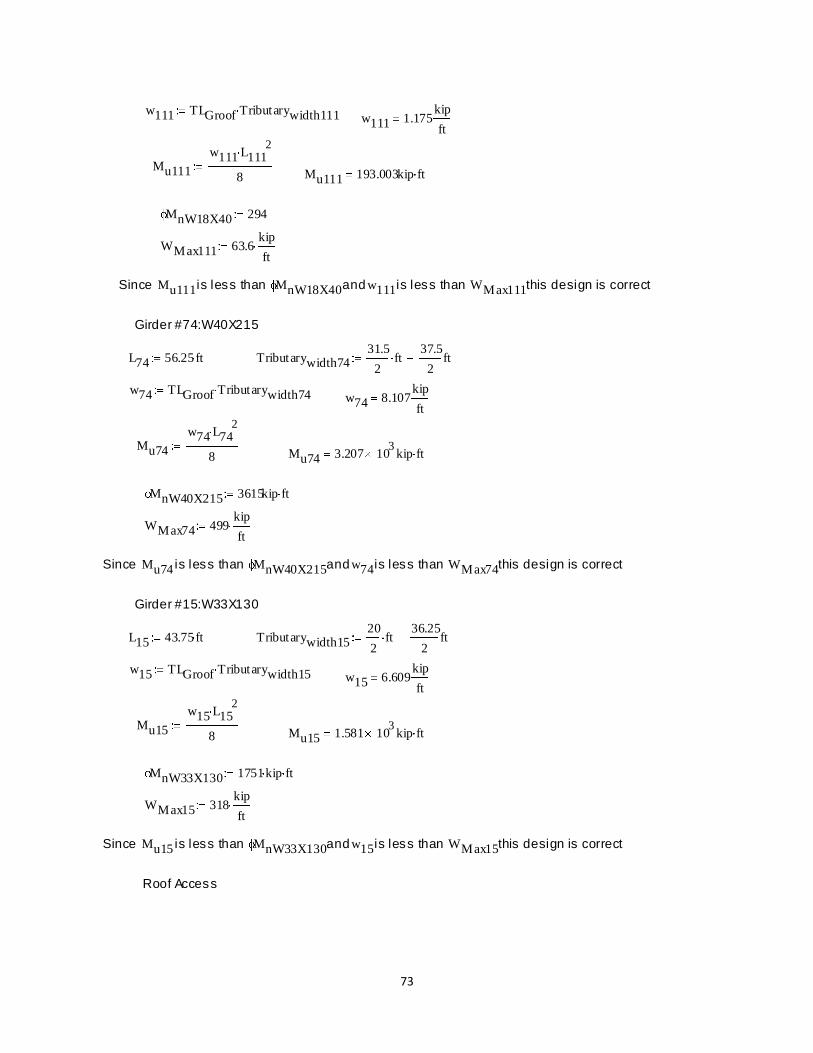
73
w111 TLGroof Tributarywidth111 w111 1.175kip
ft
Mu111
w111 L1112
8 Mu111 193.003kip ft
MnW18X40 294
WMax111 63.6kip
ft
Since Mu111 is less than MnW18X40 and w111 is less than WMax111 this design is correct
Girder #74:W40X215
L74 56.25ft Tributarywidth7431.5
2ft
37.5
2ft
w74 TLGroof Tributarywidth74 w74 8.107kip
ft
Mu74
w74 L742
8 Mu74 3.207 103
kip ft
MnW40X215 3615kip ft
WMax74 499kip
ft
Since Mu74 is less than MnW40X215 and w74 is less than WMax74 this design is correct
Girder #15:W33X130
L15 43.75ft Tributarywidth1520
2ft
36.25
2ft
w15 TLGroof Tributarywidth15 w15 6.609kip
ft
Mu15
w15 L152
8 Mu15 1.581 103
kip ft
MnW33X130 1751kip ft
WMax15 318kip
ft
Since Mu15 is less than MnW33X130 and w15 is less than WMax15 this design is correct
Roof Access
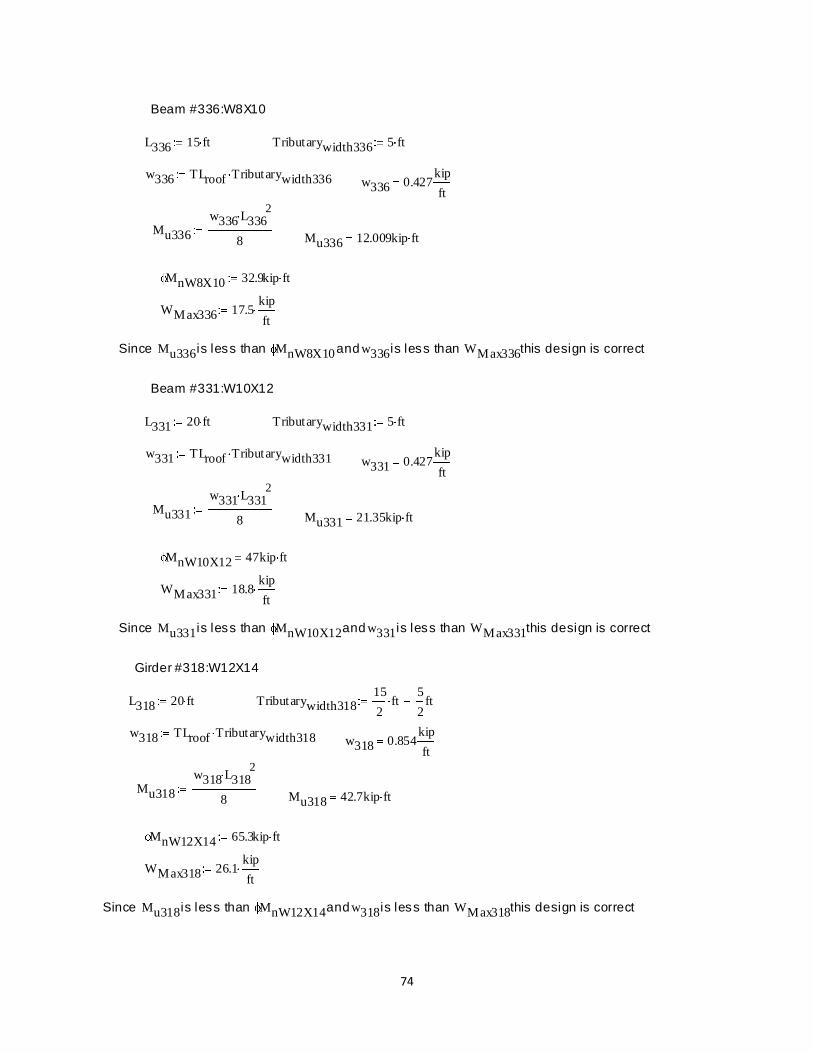
74
Beam #336:W8X10
L336 15 ft Tributarywidth336 5 ft
w336 TLroof Tributarywidth336 w336 0.427kip
ft
Mu336
w336 L3362
8 Mu336 12.009kip ft
MnW8X10 32.9kip ft
WMax336 17.5kip
ft
Since Mu336 is less than MnW8X10 and w336 is less than WMax336 this design is correct
Beam #331:W10X12
L331 20 ft Tributarywidth331 5 ft
w331 TLroof Tributarywidth331 w331 0.427kip
ft
Mu331
w331 L3312
8 Mu331 21.35kip ft
MnW10X12 47kip ft
WMax331 18.8kip
ft
Since Mu331 is less than MnW10X12 and w331 is less than WMax331 this design is correct
Girder #318:W12X14
L318 20 ft Tributarywidth31815
2ft
5
2ft
w318 TLroof Tributarywidth318 w318 0.854kip
ft
Mu318
w318 L3182
8 Mu318 42.7kip ft
MnW12X14 65.3kip ft
WMax318 26.1kip
ft
Since Mu318 is less than MnW12X14 and w318 is less than WMax318 this design is correct
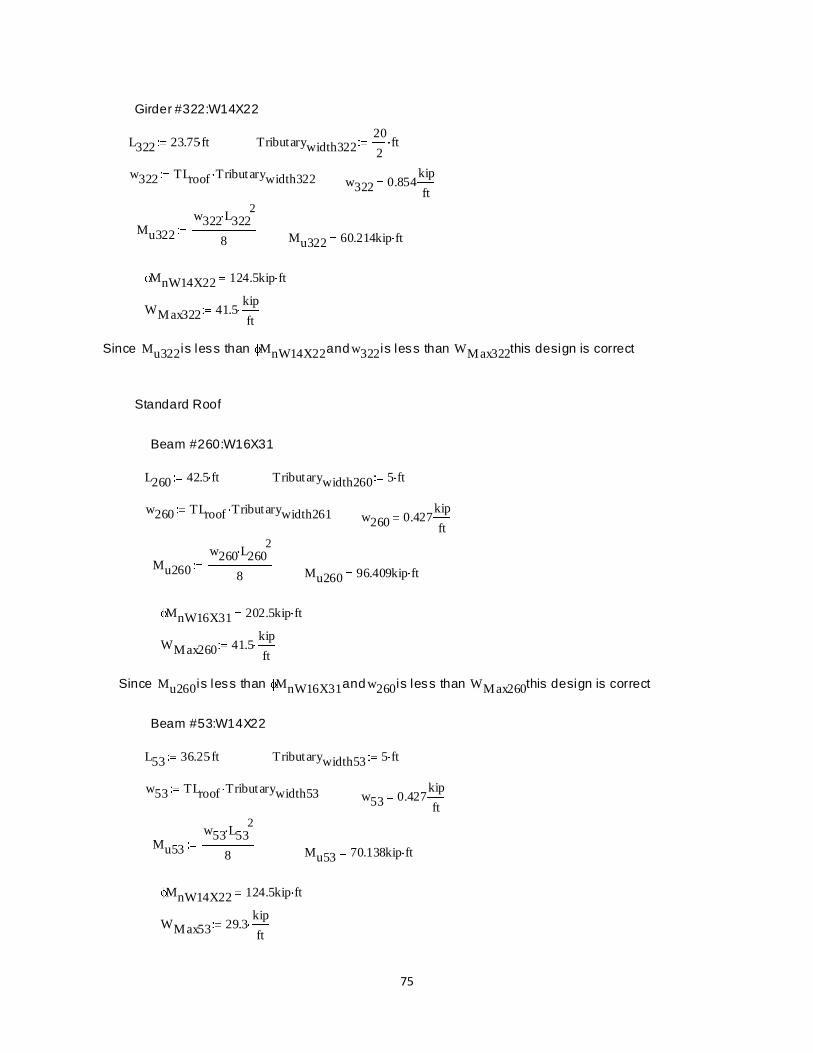
75
Girder #322:W14X22
L322 23.75 ft Tributarywidth32220
2ft
w322 TLroof Tributarywidth322 w322 0.854kip
ft
Mu322
w322 L3222
8 Mu322 60.214kip ft
MnW14X22 124.5kip ft
WMax322 41.5kip
ft
Since Mu322 is less than MnW14X22 and w322 is less than WMax322 this design is correct
Standard Roof
Beam #260:W16X31
L260 42.5 ft Tributarywidth260 5 ft
w260 TLroof Tributarywidth261 w260 0.427kip
ft
Mu260
w260 L2602
8 Mu260 96.409kip ft
MnW16X31 202.5kip ft
WMax260 41.5kip
ft
Since Mu260 is less than MnW16X31 and w260 is less than WMax260 this design is correct
Beam #53:W14X22
L53 36.25 ft Tributarywidth53 5 ft
w53 TLroof Tributarywidth53 w53 0.427kip
ft
Mu53
w53 L532
8 Mu53 70.138kip ft
MnW14X22 124.5kip ft
WMax53 29.3kip
ft
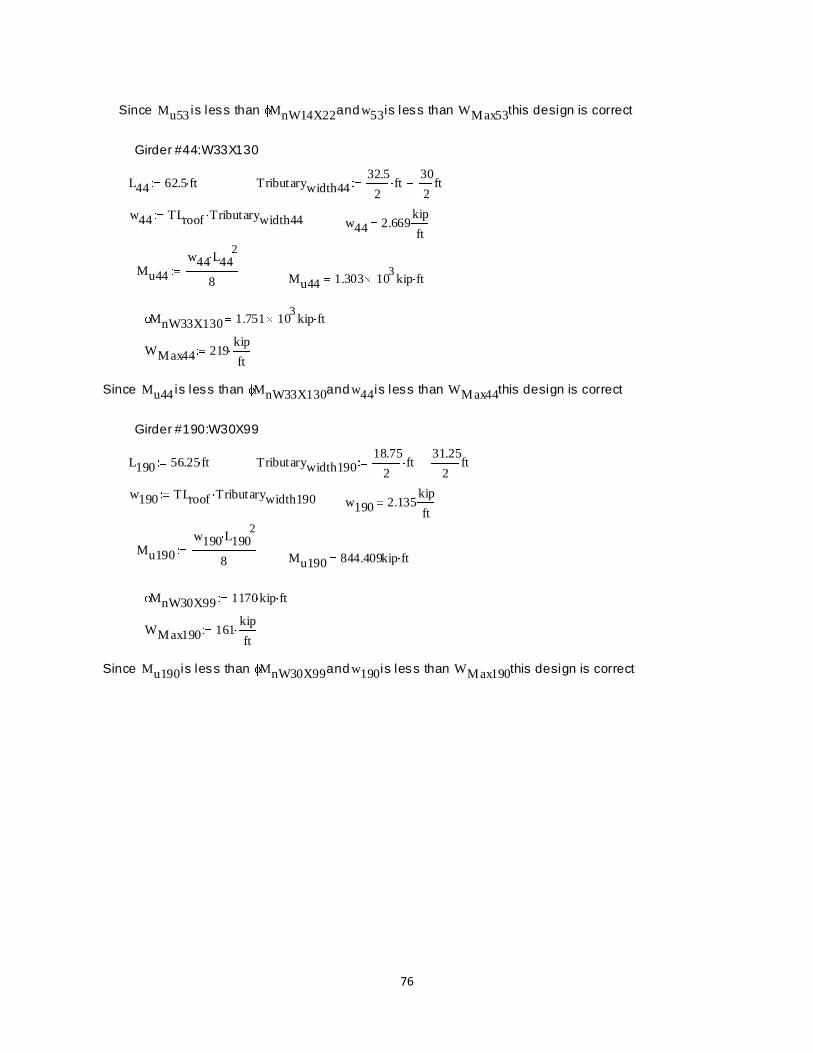
76
Since Mu53 is less than MnW14X22 and w53 is less than WMax53 this design is correct
Girder #44:W33X130
L44 62.5 ft Tributarywidth4432.5
2ft
30
2ft
w44 TLroof Tributarywidth44 w44 2.669kip
ft
Mu44
w44 L442
8 Mu44 1.303 103
kip ft
MnW33X130 1.751 103
kip ft
WMax44 219kip
ft
Since Mu44 is less than MnW33X130 and w44 is less than WMax44 this design is correct
Girder #190:W30X99
L190 56.25ft Tributarywidth19018.75
2ft
31.25
2ft
w190 TLroof Tributarywidth190 w190 2.135kip
ft
Mu190
w190 L1902
8 Mu190 844.409kip ft
MnW30X99 1170kip ft
WMax190 161kip
ft
Since Mu190 is less than MnW30X99 and w190 is less than WMax190 this design is correct
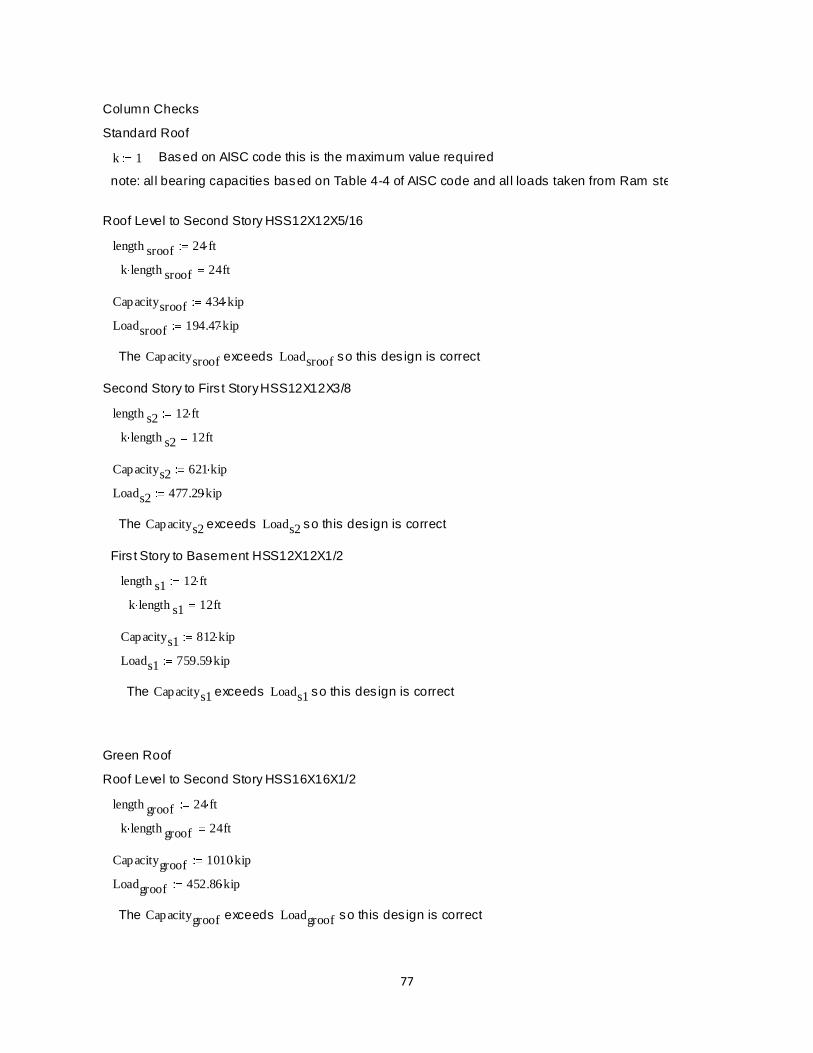
77
Column Checks
Standard Roof
k 1 Based on AISC code this is the maximum value required
note: al l bearing capacities based on Table 4-4 of AISC code and all loads taken from Ram steel
Roof Level to Second Story HSS12X12X5/16
length sroof 24 ft
k length sroof 24ft
Capacitysroof 434 kip
Loadsroof 194.47kip
The Capacitysroof exceeds Loadsroof so this des ign is correct
Second Story to Firs t Story HSS12X12X3/8
length s2 12 ft
k length s2 12ft
Capacitys2 621 kip
Loads2 477.29kip
The Capacitys2 exceeds Loads2 so this des ign is correct
Firs t Story to Basement HSS12X12X1/2
length s1 12 ft
k length s1 12ft
Capacitys1 812 kip
Loads1 759.59kip
The Capacitys1 exceeds Loads1 so this des ign is correct
Green Roof
Roof Level to Second Story HSS16X16X1/2
length groof 24 ft
k length groof 24ft
Capacitygroof 1010kip
Loadgroof 452.86kip
The Capacitygroof exceeds Loadgroof so this des ign is correct
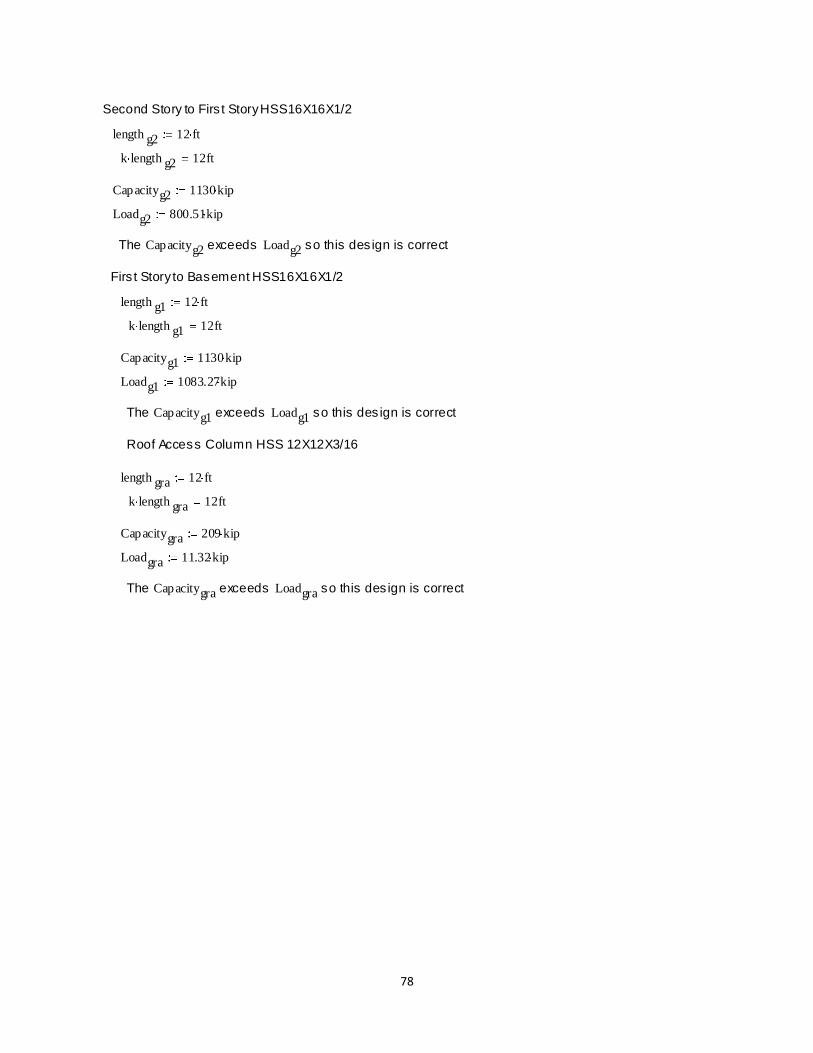
78
Second Story to Firs t Story HSS16X16X1/2
length g2 12 ft
k length g2 12ft
Capacityg2 1130kip
Loadg2 800.51kip
The Capacityg2 exceeds Loadg2 so this des ign is correct
Firs t Story to Basement HSS16X16X1/2
length g1 12 ft
k length g1 12ft
Capacityg1 1130kip
Loadg1 1083.27kip
The Capacityg1 exceeds Loadg1 so this des ign is correct
Roof Access Column HSS 12X12X3/16
length gra 12 ft
k length gra 12ft
Capacitygra 209 kip
Loadgra 11.32kip
The Capacitygra exceeds Loadgra so this des ign is correct
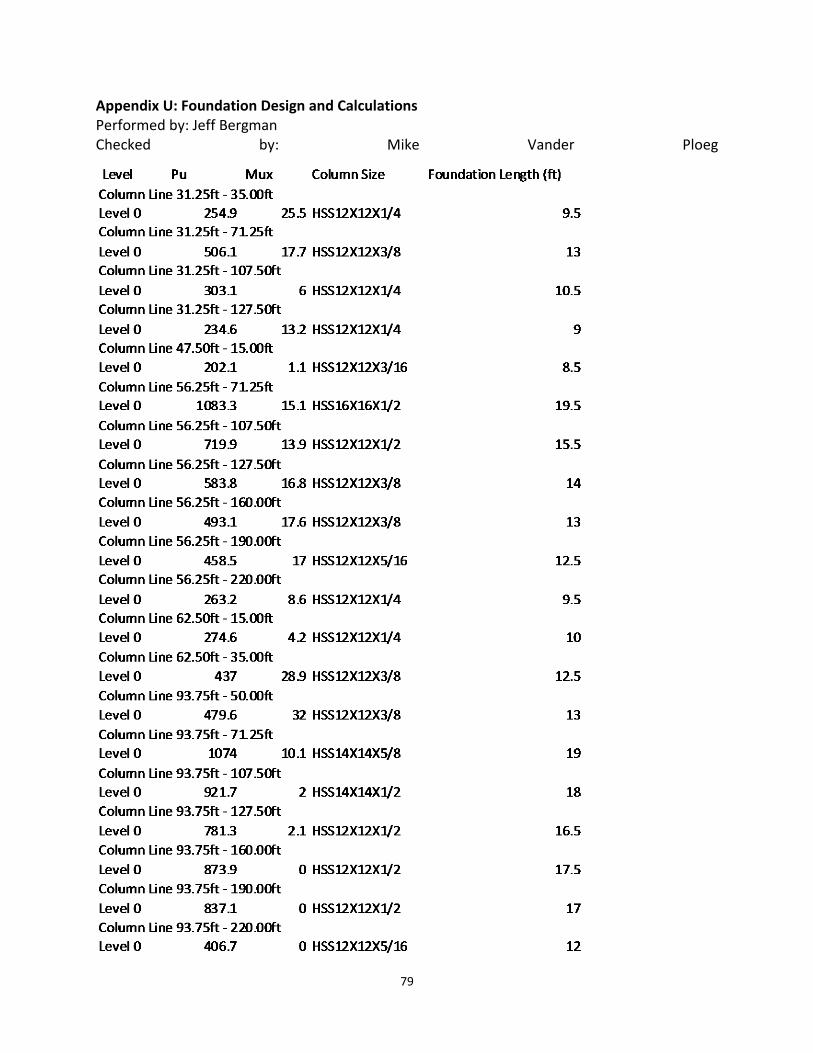
79
Appendix U: Foundation Design and Calculations Performed by: Jeff Bergman Checked by: Mike Vander Ploeg
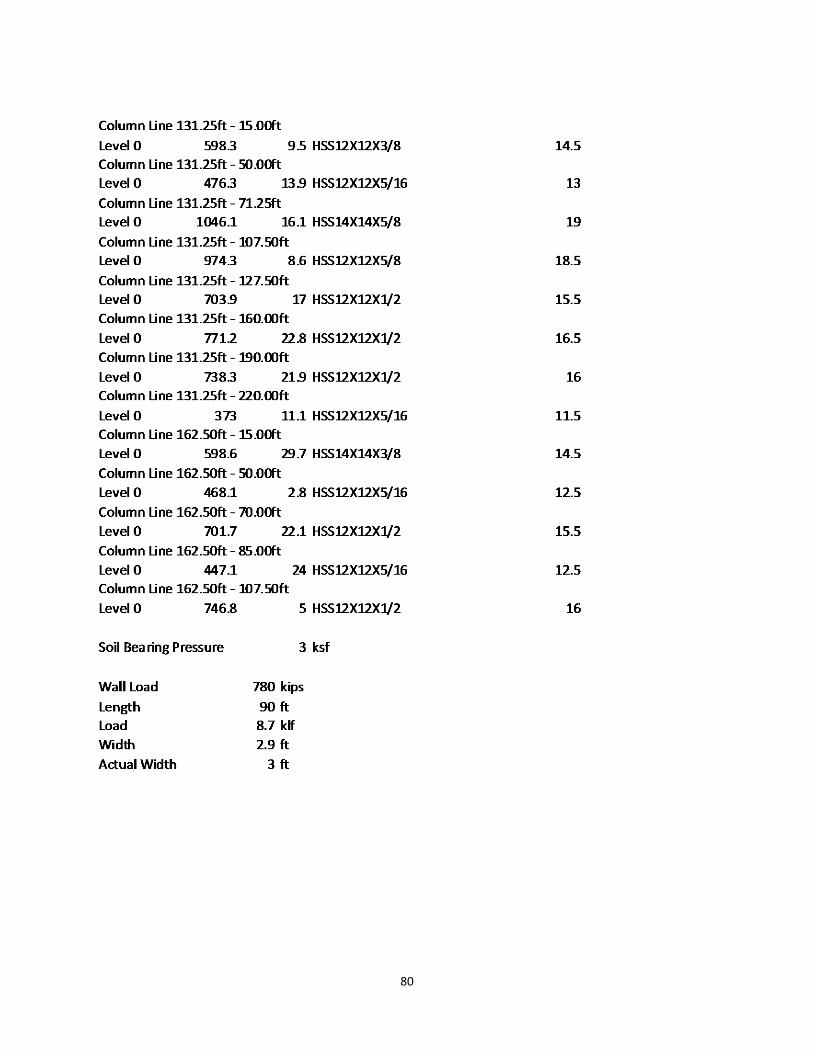
80
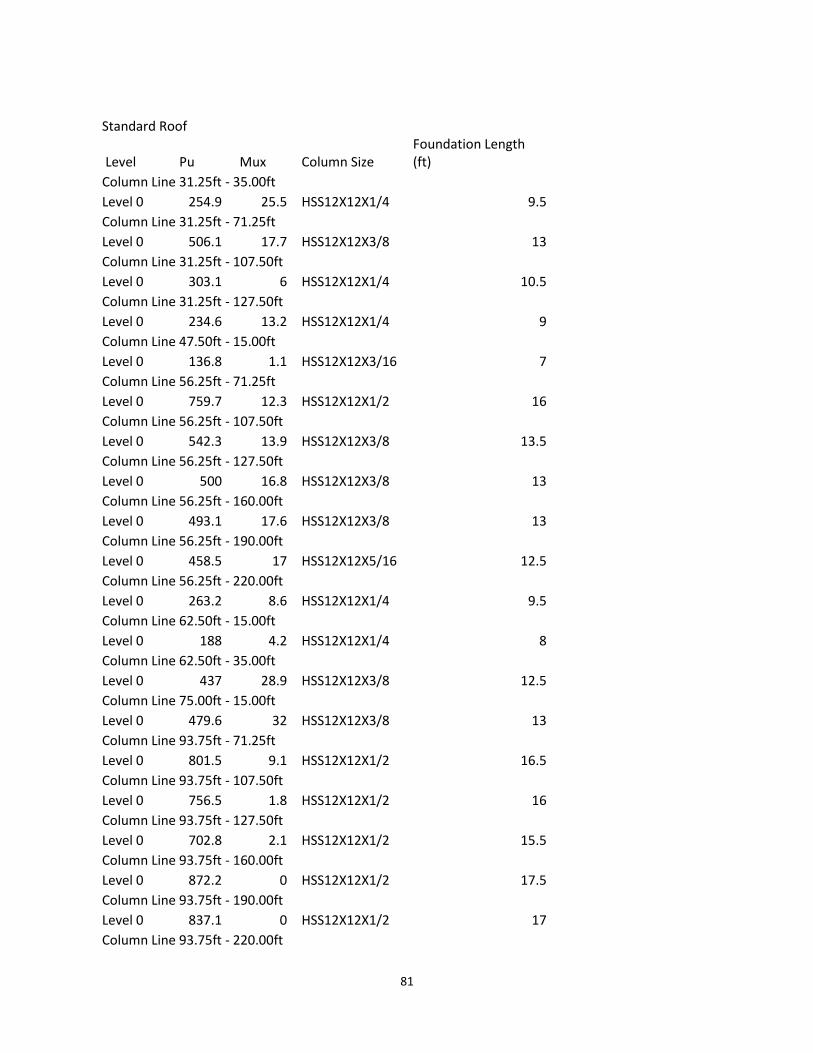
81
Standard Roof
Level Pu Mux Column Size Foundation Length (ft)
Column Line 31.25ft - 35.00ft Level 0 254.9 25.5 HSS12X12X1/4 9.5
Column Line 31.25ft - 71.25ft Level 0 506.1 17.7 HSS12X12X3/8 13
Column Line 31.25ft - 107.50ft Level 0 303.1 6 HSS12X12X1/4 10.5
Column Line 31.25ft - 127.50ft Level 0 234.6 13.2 HSS12X12X1/4 9
Column Line 47.50ft - 15.00ft Level 0 136.8 1.1 HSS12X12X3/16 7
Column Line 56.25ft - 71.25ft Level 0 759.7 12.3 HSS12X12X1/2 16
Column Line 56.25ft - 107.50ft Level 0 542.3 13.9 HSS12X12X3/8 13.5
Column Line 56.25ft - 127.50ft Level 0 500 16.8 HSS12X12X3/8 13
Column Line 56.25ft - 160.00ft Level 0 493.1 17.6 HSS12X12X3/8 13
Column Line 56.25ft - 190.00ft Level 0 458.5 17 HSS12X12X5/16 12.5
Column Line 56.25ft - 220.00ft Level 0 263.2 8.6 HSS12X12X1/4 9.5
Column Line 62.50ft - 15.00ft Level 0 188 4.2 HSS12X12X1/4 8
Column Line 62.50ft - 35.00ft Level 0 437 28.9 HSS12X12X3/8 12.5
Column Line 75.00ft - 15.00ft Level 0 479.6 32 HSS12X12X3/8 13
Column Line 93.75ft - 71.25ft Level 0 801.5 9.1 HSS12X12X1/2 16.5
Column Line 93.75ft - 107.50ft Level 0 756.5 1.8 HSS12X12X1/2 16
Column Line 93.75ft - 127.50ft Level 0 702.8 2.1 HSS12X12X1/2 15.5
Column Line 93.75ft - 160.00ft Level 0 872.2 0 HSS12X12X1/2 17.5
Column Line 93.75ft - 190.00ft Level 0 837.1 0 HSS12X12X1/2 17
Column Line 93.75ft - 220.00ft
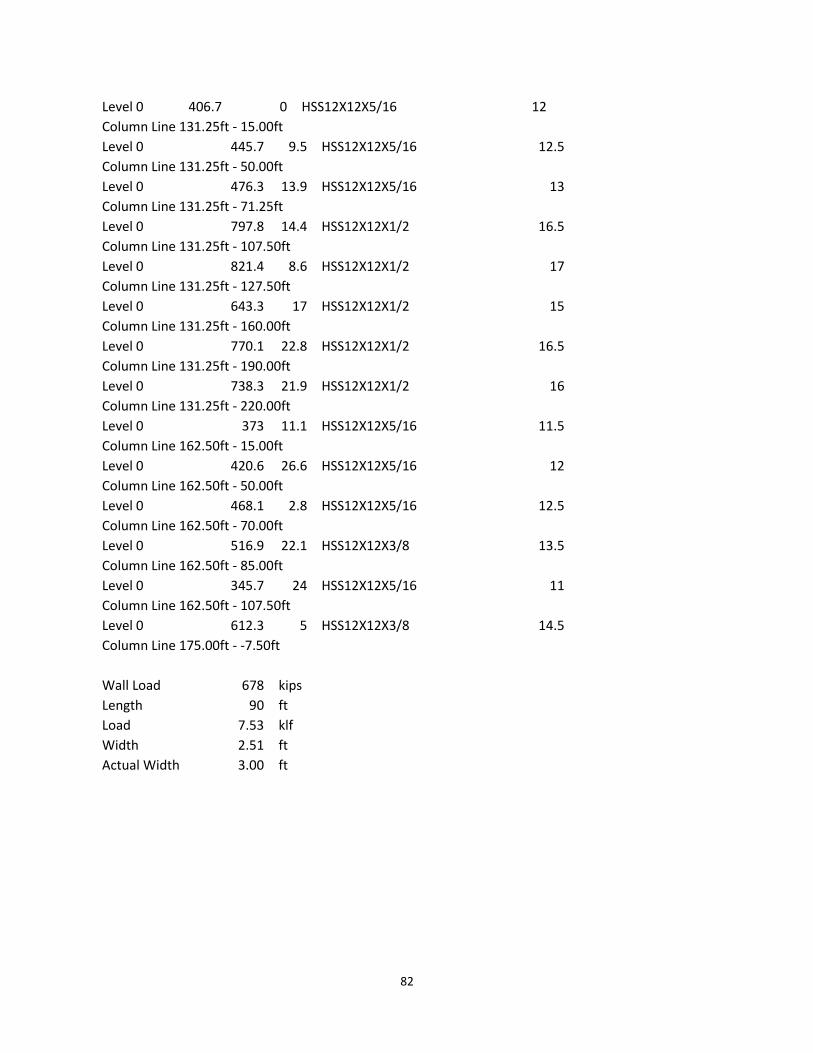
82
Level 0 406.7 0 HSS12X12X5/16 12
Column Line 131.25ft - 15.00ft Level 0 445.7 9.5 HSS12X12X5/16 12.5
Column Line 131.25ft - 50.00ft Level 0 476.3 13.9 HSS12X12X5/16 13
Column Line 131.25ft - 71.25ft Level 0 797.8 14.4 HSS12X12X1/2 16.5
Column Line 131.25ft - 107.50ft Level 0 821.4 8.6 HSS12X12X1/2 17
Column Line 131.25ft - 127.50ft Level 0 643.3 17 HSS12X12X1/2 15
Column Line 131.25ft - 160.00ft Level 0 770.1 22.8 HSS12X12X1/2 16.5
Column Line 131.25ft - 190.00ft Level 0 738.3 21.9 HSS12X12X1/2 16
Column Line 131.25ft - 220.00ft Level 0 373 11.1 HSS12X12X5/16 11.5
Column Line 162.50ft - 15.00ft Level 0 420.6 26.6 HSS12X12X5/16 12
Column Line 162.50ft - 50.00ft Level 0 468.1 2.8 HSS12X12X5/16 12.5
Column Line 162.50ft - 70.00ft Level 0 516.9 22.1 HSS12X12X3/8 13.5
Column Line 162.50ft - 85.00ft Level 0 345.7 24 HSS12X12X5/16 11
Column Line 162.50ft - 107.50ft Level 0 612.3 5 HSS12X12X3/8 14.5
Column Line 175.00ft - -7.50ft
Wall Load 678 kips Length 90 ft Load 7.53 klf Width 2.51 ft Actual Width 3.00 ft
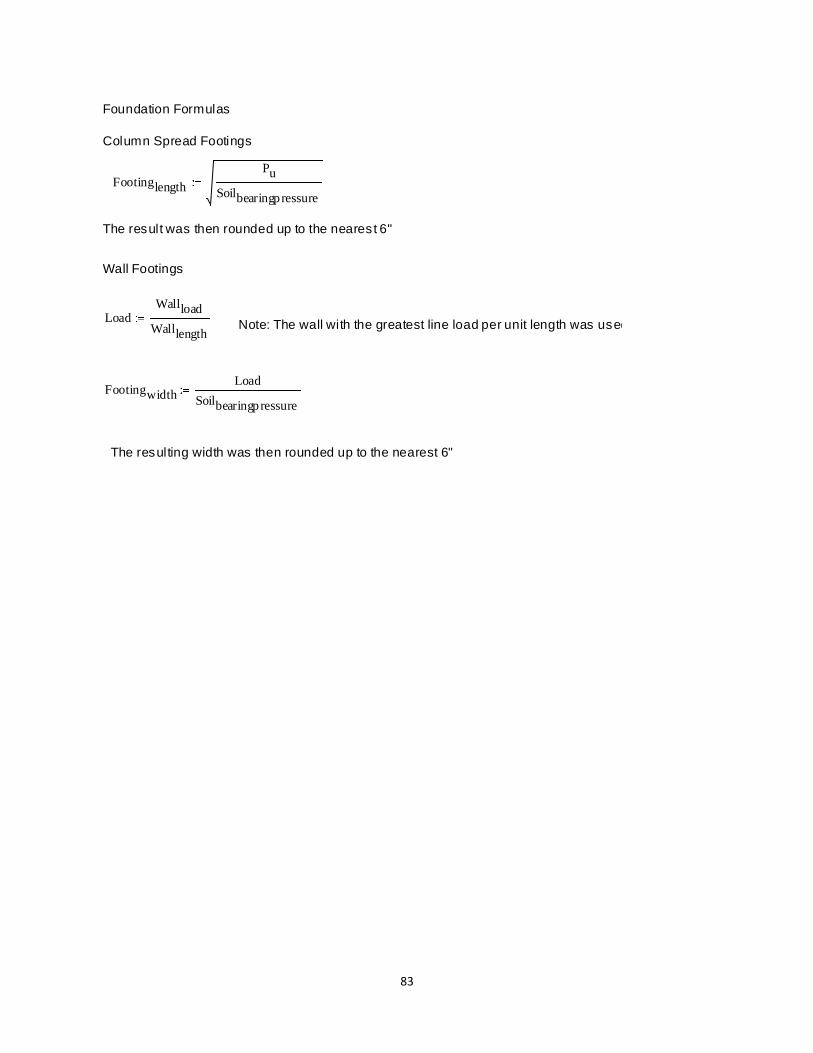
83
Foundation Formulas
Column Spread Footings
Footinglength
Pu
Soilbearingpressure
The result was then rounded up to the nearest 6"
Wall Footings
LoadWallload
WalllengthNote: The wall with the greatest line load per unit length was used
FootingwidthLoad
Soilbearingpressure
The resulting width was then rounded up to the nearest 6"