2009 no child left behind - blue ribbon schools program · web viewthis test includes letter...
TRANSCRIPT

U.S. Department of Education2009 No Child Left Behind - Blue Ribbon Schools Program
Type of School: (Check all that apply) [X ] Elementary [] Middle [] High [] K-12 [] Other
[] Charter [X] Title I [] Magnet [] Choice
Name of Principal: Mr. Michael Key
Official School Name: Leavenworth Elementary School
School Mailing Address: 346 E SR 62 Leavenworth, IN 47137-2238
County: Crawford State School Code Number*: 1037
Telephone: (812) 739-2210 Fax: (812) 739-2211
Web site/URL: http://mustang.doe.state.in.us/SEARCH/snapshot.cfm?schl=1037 E-mail: [email protected]
I have reviewed the information in this application, including the eligibility requirements on page 2 (Part I - Eligibility Certification), and certify that to the best of my knowledge all information is accurate.
Date (Principal‘s Signature)
Name of Superintendent*: Dr. Mark Eastridge
District Name: Crawford County Community School Corporation Tel: (812) 365-2135
I have reviewed the information in this application, including the eligibility requirements on page 2 (Part I - Eligibility Certification), and certify that to the best of my knowledge it is accurate.
Date (Superintendent‘s Signature)
Name of School Board President/Chairperson: Ms. Debbie Kaiser
I have reviewed the information in this application, including the eligibility requirements on page 2 (Part I - Eligibility Certification), and certify that to the best of my knowledge it is accurate.
Date (School Board President‘s/Chairperson‘s Signature)
*Private Schools: If the information requested is not applicable, write N/A in the space. Original signed cover sheet only should be mailed by expedited mail or a courier mail service (such as USPS Express Mail, FedEx or UPS) to Aba Kumi, Director, NCLB-Blue Ribbon Schools Program, Office of Communications and Outreach, US Department of Education, 400 Maryland Ave., SW, Room 5E103, Washington, DC 20202-8173.
document.doc 1

PART I - ELIGIBILITY CERTIFICATION
The signatures on the first page of this application certify that each of the statements below concerning the school‘s eligibility and compliance with U.S. Department of Education, Office for Civil Rights (OCR) requirements is true and correct.
1. The school has some configuration that includes one or more of grades K-12. (Schools on the same campus with one principal, even K-12 schools, must apply as an entire school.)
2. The school has made adequate yearly progress each year for the past two years and has not been identified by the state as “persistently dangerous” within the last two years.
3. To meet final eligibility, the school must meet the state’s Adequate Yearly Progress (AYP) requirement in the 2008-2009 school year. AYP must be certified by the state and all appeals resolved at least two weeks before the awards ceremony for the school to receive the award.
4. If the school includes grades 7 or higher, the school must have foreign language as a part of its curriculum and a significant number of students in grades 7 and higher must take the course.
5. The school has been in existence for five full years, that is, from at least September 2003.
6. The nominated school has not received the No Child Left Behind – Blue Ribbon Schools award in the past five years, 2004, 2005, 2006, 2007, or 2008.
7. The nominated school or district is not refusing OCR access to information necessary to investigate a civil rights complaint or to conduct a district-wide compliance review.
8. OCR has not issued a violation letter of findings to the school district concluding that the nominated school or the district as a whole has violated one or more of the civil rights statutes. A violation letter of findings will not be considered outstanding if OCR has accepted a corrective action plan from the district to remedy the violation.
9. The U.S. Department of Justice does not have a pending suit alleging that the nominated school or the school district as a whole has violated one or more of the civil rights statutes or the Constitution‘s equal protection clause.
10. There are no findings of violations of the Individuals with Disabilities Education Act in a U.S. Department of Education monitoring report that apply to the school or school district in question; or if there are such findings, the state or district has corrected, or agreed to correct, the findings.
document.doc 2
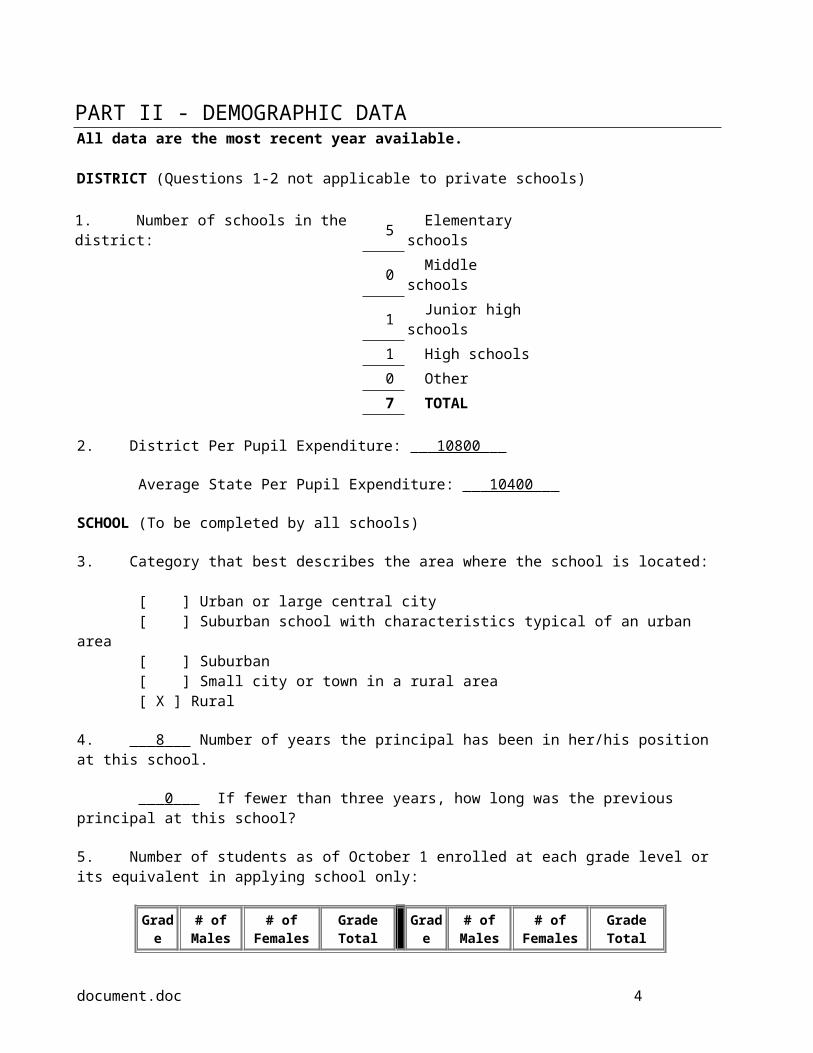
PART II - DEMOGRAPHIC DATA All data are the most recent year available. DISTRICT (Questions 1-2 not applicable to private schools) 1. Number of schools in the district: 5 Elementary schools
0 Middle schools 1 Junior high schools1 High schools0 Other7 TOTAL
2. District Per Pupil Expenditure: 10800
Average State Per Pupil Expenditure: 10400
SCHOOL (To be completed by all schools)
3. Category that best describes the area where the school is located: [ ] Urban or large central city [ ] Suburban school with characteristics typical of an urban area [ ] Suburban [ ] Small city or town in a rural area [ X ] Rural
4. 8 Number of years the principal has been in her/his position at this school.
0 If fewer than three years, how long was the previous principal at this school?
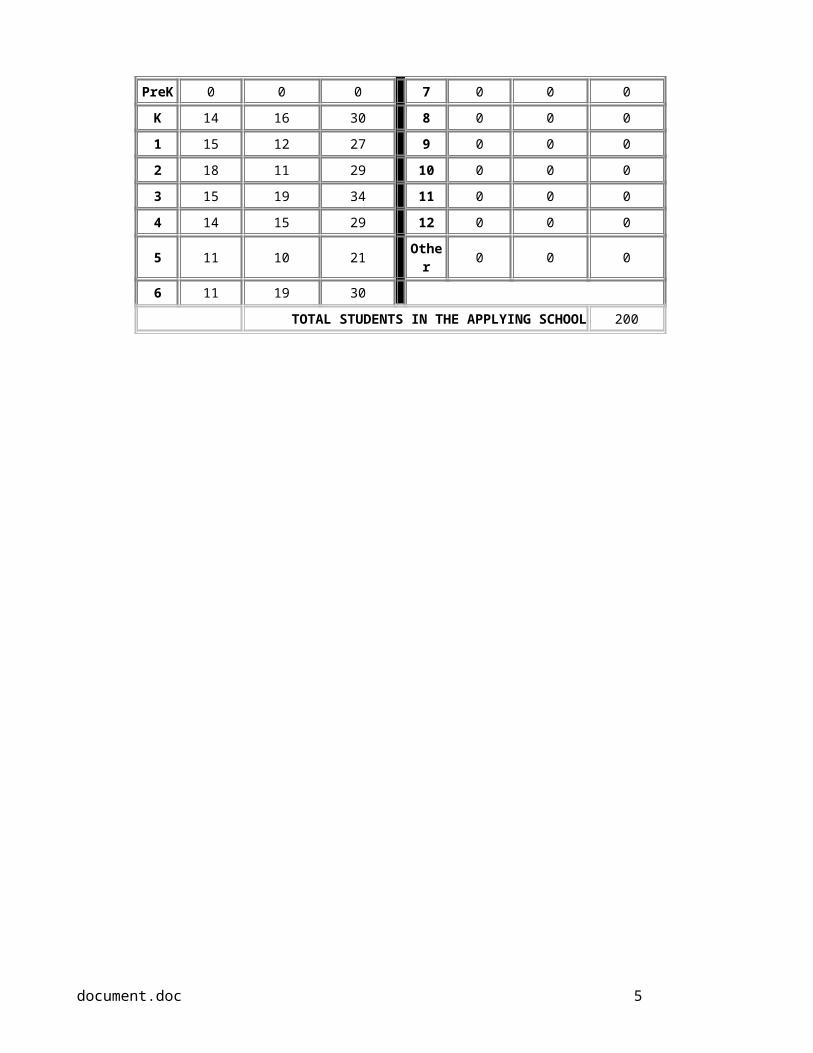
5. Number of students as of October 1 enrolled at each grade level or its equivalent in applying school only:
Grade # of Males # of Females Grade Total Grade # of Males # of Females Grade Total
PreK 0 0 0 7 0 0 0
K 14 16 30 8 0 0 0
1 15 12 27 9 0 0 0
2 18 11 29 10 0 0 0
3 15 19 34 11 0 0 0
4 14 15 29 12 0 0 0
5 11 10 21 Other 0 0 0
6 11 19 30
TOTAL STUDENTS IN THE APPLYING SCHOOL 200
document.doc 3
6. Racial/ethnic composition of the school: 0 % American Indian or Alaska Native
0 % Asian0 % Black or African American0 % Hispanic or Latino0 % Native Hawaiian or Other Pacific Islander
100 % White0 % Two or more races
100 % TotalOnly the seven standard categories should be used in reporting the racial/ethnic composition of your school. The final Guidance on Maintaining, Collecting, and Reporting Racial and Ethnic data to the U.S. Department of Education published in the October 19, 2007 Federal Register provides definitions for each of the seven categories.
7. Student turnover, or mobility rate, during the past year: 17 %
This rate is calculated using the grid below. The answer to (6) is the mobility rate.
(1) Number of students who transferred to the school after October 1 until theend of the year.
16
(2) Number of students who transferred from the school after October 1 until the end of the year.
18
(3) Total of all transferred students [sum of rows (1) and (2)]. 34
(4) Total number of students in the school as of October 1. 197
(5) Total transferred students in row (3)divided by total students in row (4).
0.173
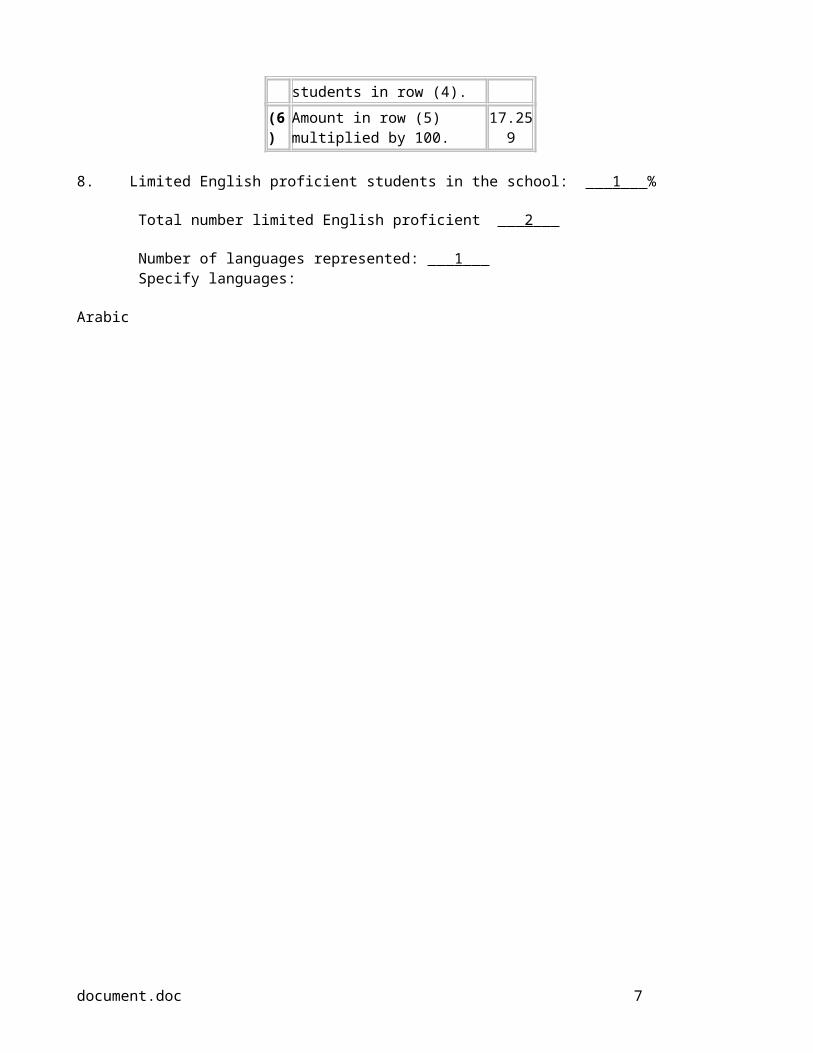
(6) Amount in row (5) multiplied by 100. 17.259
8. Limited English proficient students in the school: 1 %
Total number limited English proficient 2
Number of languages represented: 1 Specify languages:
Arabic
document.doc 4
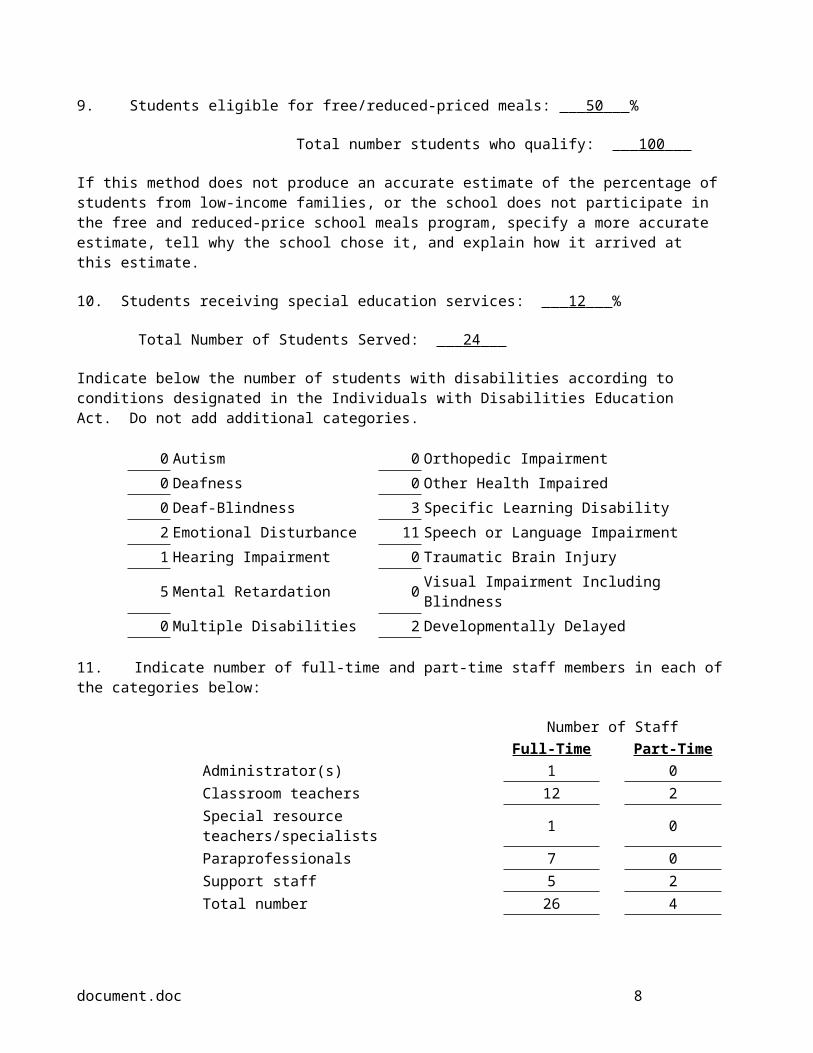
9. Students eligible for free/reduced-priced meals: 50 %
Total number students who qualify: 100
If this method does not produce an accurate estimate of the percentage of students from low-income families, or the school does not participate in the free and reduced-price school meals program, specify a more accurate estimate, tell why the school chose it, and explain how it arrived at this estimate.
10. Students receiving special education services: 12 %
Total Number of Students Served: 24
Indicate below the number of students with disabilities according to conditions designated in the Individuals with Disabilities Education Act. Do not add additional categories.
0 Autism 0 Orthopedic Impairment0 Deafness 0 Other Health Impaired0 Deaf-Blindness 3 Specific Learning Disability2 Emotional Disturbance 11 Speech or Language Impairment1 Hearing Impairment 0 Traumatic Brain Injury5 Mental Retardation 0 Visual Impairment Including Blindness0 Multiple Disabilities 2 Developmentally Delayed
11. Indicate number of full-time and part-time staff members in each of the categories below:
Number of StaffFull-Time Part-Time
Administrator(s) 1 0 Classroom teachers 12 2 Special resource teachers/specialists 1 0 Paraprofessionals 7 0 Support staff 5 2 Total number 26 4
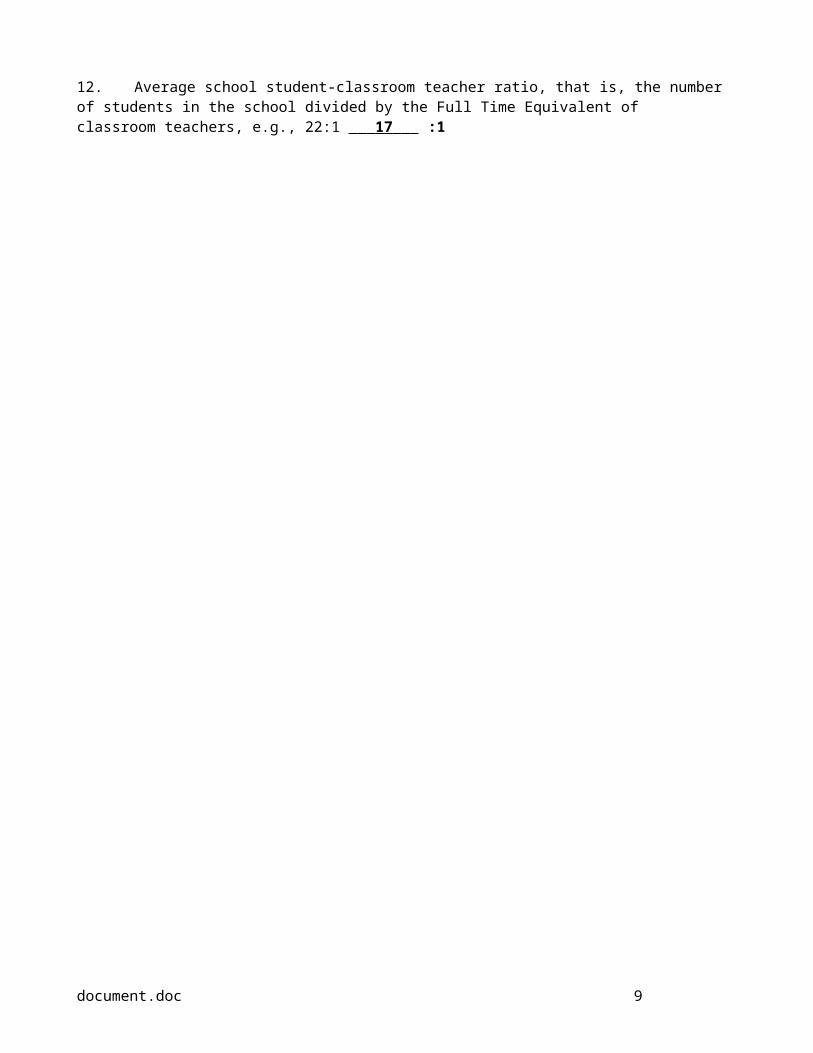
12. Average school student-classroom teacher ratio, that is, the number of students in the school divided by the Full Time Equivalent of classroom teachers, e.g., 22:1 17 :1
document.doc 5

13. Show the attendance patterns of teachers and students as a percentage. Only middle and high schools need to supply dropout rates. Briefly explain in the Notes section any attendance rates under 95%, teacher turnover rates over 12%, or student dropout rates over 5%.
2007-2008 2006-2007 2005-2006 2004-2005 2003-2004
Daily student attendance 97% 98% 97% 97% 97%Daily teacher attendance 98% 98% 97% 96% 97%Teacher turnover rate 8% 0% 16% 0% 0%
Please provide all explanations below.
Teachers that were retirement age were offered incentives to retire in the form of a health insurance package paid by the school corporation after retirement for three consecutive years. We had two teachers that took the retirement package and retired in 2005-06.
14. For schools ending in grade 12 (high schools).
Show what the students who graduated in Spring 2008 are doing as of the Fall 2008.
Graduating class size 0
Enrolled in a 4-year college or university 0
%
Enrolled in a community college 0
%
Enrolled in vocational training 0
%
Found employment 0
%
Military service 0
%
Other (travel, staying home, etc.) 0
%
Unknown 0
%
Total 100%
document.doc 6
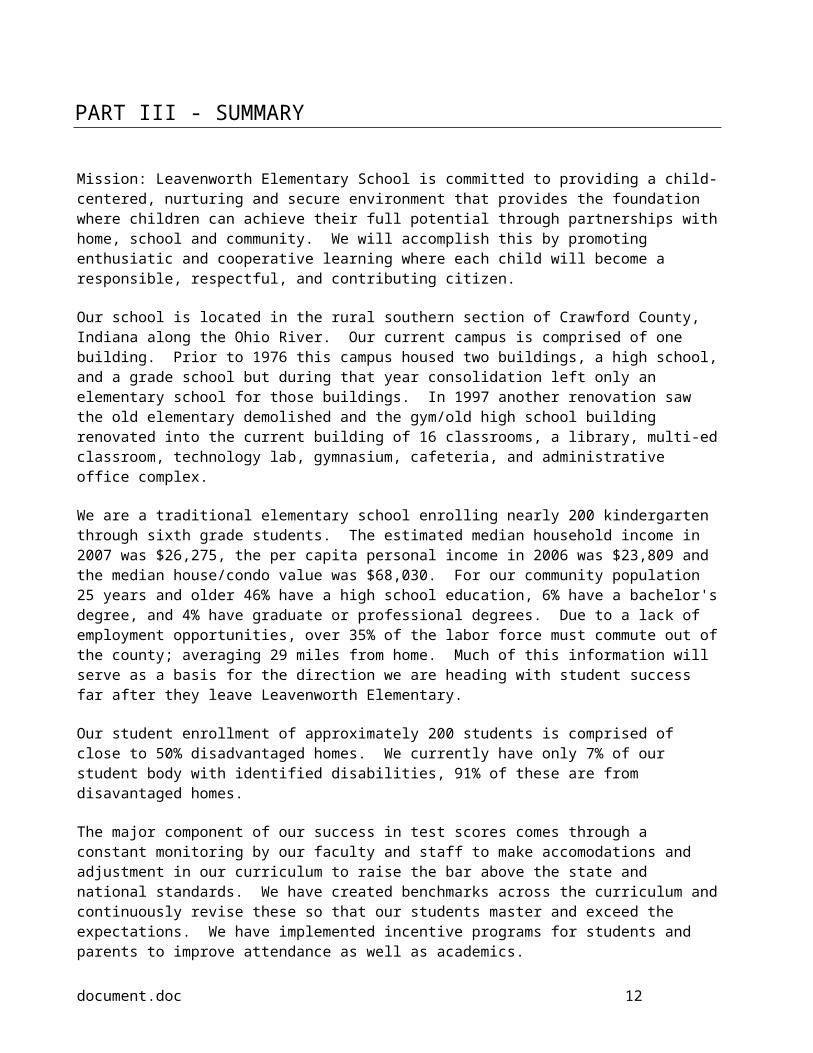
PART III - SUMMARY
Mission: Leavenworth Elementary School is committed to providing a child-centered, nurturing and secure environment that provides the foundation where children can achieve their full potential through partnerships with home, school and community. We will accomplish this by promoting enthusiatic and cooperative learning where each child will become a responsible, respectful, and contributing citizen.
Our school is located in the rural southern section of Crawford County, Indiana along the Ohio River. Our current campus is comprised of one building. Prior to 1976 this campus housed two buildings, a high school, and a grade school but during that year consolidation left only an elementary school for those buildings. In 1997 another renovation saw the old elementary demolished and the gym/old high school building renovated into the current building of 16 classrooms, a library, multi-ed classroom, technology lab, gymnasium, cafeteria, and administrative office complex.
We are a traditional elementary school enrolling nearly 200 kindergarten through sixth grade students. The estimated median household income in 2007 was $26,275, the per capita personal income in 2006 was $23,809 and the median house/condo value was $68,030. For our community population 25 years and older 46% have a high school education, 6% have a bachelor's degree, and 4% have graduate or professional degrees. Due to a lack of employment opportunities, over 35% of the labor force must commute out of the county; averaging 29 miles from home. Much of this information will serve as a basis for the direction we are heading with student success far after they leave Leavenworth Elementary.
Our student enrollment of approximately 200 students is comprised of close to 50% disadvantaged homes. We currently have only 7% of our student body with identified disabilities, 91% of these are from disavantaged homes.
The major component of our success in test scores comes through a constant monitoring by our faculty and staff to make accomodations and adjustment in our curriculum to raise the bar above the state and national standards. We have created benchmarks across the curriculum and continuously revise these so that our students master and exceed the expectations. We have implemented incentive programs for students and parents to improve attendance as well as academics.
We have over the past several years greatly improved test scores on statewide testing. While this is great news and serves as a basis for recognition, we are not satisified. Five years ago we looked at the number of Leavenworth Elementary students that were still passing statewide testing in high school and how many of these students were continuing on to post high school education, whether it be vocational or college bound. We found that only 50% of our sixth grade graduates were going beyond high school education. We changed our thinking.
1. We started explaining to parents what the test scores mean and what opportunities are available to their children if they want to be college bound, especially affordability and options for paying for college.
2. We changed our belief in field trips and school programs. We believe that showing children new and exciting places was not good enough if the parents were not seeing the same things and could have an understanding of what potential their child could have.
3. Everyone wants the best for their child. However the best for the child may not have encouraged the child's potential. We started putting programs and incentives in place so that when the parent participates with the child, we reward that participation.
document.doc 7
Since the inception of these ideas, we have seen vocational and college bound graduates who attended Leavenworth Elementary increase steadily from the original 50% to 60% and last year to 80%. These are the numbers we are probably most proud of and give us cause to be worthy of Blue Ribbon status.
document.doc 8
PART IV - INDICATORS OF ACADEMIC SUCCESS
1. Assessment Results:
Indiana Schools participate in statewide assessment. This test is the Indiana Statewide Testing for Educational Progress Plus (ISTEP+) which was created to align Indiana's statewide assessment test with the Indiana State Standards. This test is Criterion-Referenced Information and has received wide recognition from the United States Department of Education as being an excellent standards-based assessment test. All students in grades three through ten have taken this test in September of each year since 2002 and beginning this year (2009), the test will also be given in the spring where it will remain after this year.
Indiana sets cut scores on their assessments that characterize a student's performance on the assessment as at or above each performance level (for example Pass, Pass+). The method used to set these cut scores is called Standard Setting. Setting cut scores depend on having participants in the standard setting who are very knowledgeable about the state's content standards. They must be willing to help the state define the level of knowledge and skill expected of a student at each performance level demonstrated by the cut scores. These are called Indiana Scale Scores and the score is called the Indiana Performance Index which is the measure of a student's mastery of the skills tested.
Leavenworth Elementary has used DIBELS as an assessment tool for kindergarten students for the past several years. This test was administered within the first three weeks of school to all Kindergarteners. The information gained from this assessment was used to select Title I students. Kindergarten Title I students were given a follow-up DIBELS tests at mid-year and at the year’s end to assess progress. The Reading Recovery assessment tool was given to first grade students who were ranked in the bottom quarter of their class at the beginning of the year by their classroom teacher. This test includes letter recognition, word recognition, concepts of print, writing vocabulary, hearing sounds in words, and a running record of reading. A combined evaluation of this information is used to choose the lowest students to receive Reading Recovery services. Students who qualify are retested after approximately twenty weeks and again at the end of the year. Two random and two average students are also given this assessment tool to establish an average score. Past Reading Recovery students are given the running record portion of the assessment at the end of each year to determine their long term progress.
Each grade level gives standard-based assessments of the reading series. This is also carried out for Saxon Math. District-wide teachers share research-based information to help develop benchmarks for monitoring weekly success. Remediation for those struggling is done through reteaching, tutoring with an aide, resource teacher, and a daily review in the classroom.
Beginning in the fall of 2008, we added computerized assessment. We have introduced the Northwest Evaluation Association (NWEA) testing for our staff and students. At this time, we would not have conclusive information from this test but look forward to seeing positive results
Leavenworth Elementary has consistantly improved test scores in all grade levels over the past five years in statewide (ISTEP+) testing. Beginning in 2003-2004, the state average for all students passing both English/Language Arts and Math was 71%. Leavenworth Elementary was 70.5% for all students in English/Language Arts and Math. This has improved over the years in increments of approximately 4 to 6 percentage points with this years scores being the highest. All tested students in Indiana was 73.6% and Leavenworth Elementary was 86.7%.
document.doc 9

The only disparity in test scores from any group was the 6th grade class of 2007. This particular class started in the 70th percentile at the third grade and degressed to the 45th percentile by the sixth grade. Several factors we believe caused this. During that period, this class had a high rate of migration to our school. This migration ranged from students from other school corporations who were low achievers to students from the middle east who had limited English. The class was never split. It continued to have 28+ students in the classroom.
All students at Leavenworth Elementary have scored very well on the ISTEP+ exam despite having approximately 50% of our students qualify for free and reduced meals. As stated before, we consistantly score higher than the state average. This statistic is something we are proud of.
Website: http://mustang.doe.state.in.us/search/snapshot.cfm?schl=1037
document.doc 10
2. Using Assessment Results:
We feel that assessment results become most useful when we bring the information to grade level meetings and share that information. We also pass the information across grade levels so that revisions or changes can be made. This provides the opportunity to make sure that the right people are getting the information to make continuous development and improvement in our curriculum. Teachers align instuction directly with state standards and a continuous flow of assessment reinforces that curriculum.
To help us achieve school-wide goals, the following assessment tools are used; ISTEP+, NWEA, CTBS, and grade level benchmark tests developed from state standards. Students requiring remediation are served through Title 1, Safe Haven, peer-tutoring, after-school tutoring, and assigned pull-out with at-risk tutoring during school hours. At the conclusion of the academic year, we also assign students at-risk to a Jump Start remediation program during the summer months. To encourage all students to prepare for the next school year, we give each student a summer packet of language arts and math worksheets to complete and then have a major reward celebration for those who completed their packets. These summer packets are generated to target areas of weakness in our curriculum. Tracking student success does not end at the 6th grade. We critique test scores from the junior and senior high school so that we can monitor any weaknesses and strengths our former students show and adjust our curriculum accordingly
3. Communicating Assessment Results:
We have a variety of student assessment data that we report to our students, parents, and community. Teachers use a weekly newsletter to keep students and parents informed of weekly progress and curriculum choices. Daily and weekly progress reports are sent home in student folders. Mid-term reports followed by end of the quarter report cards are sent home for students and parents. We have a district student messenger system we use to communicate information about test scores and how to interprete them. ISTEP+ statewide testing scores are sent home to parents with information on how to interpret the results. Beginning three years ago, we invited parents to the school for an evening of food and a more in-depth explanation of the test scores so they would understand the potential of their children and the opportunities that are availble to them after high school. We also wanted to make sure they knew the opportunities for financial help or grants for those who might need them. This was done to encourage our parents to set higher goals for their children. Our reward for this is to see our former students college- or vocation- bound.
4. Sharing Success:
Leavenworth Elementary continuously shares our successes with schools in our county and with others that approach us for advice and ideas. Our district elementary schools have regular grade-level meetings to share successes, ideas, and information gained at workshops.
Full-time Kindergarten in Crawford County has had a long-lasting effect on the success rate of our students. The Kindergarten teachers meet to align curriculum and share ideas that have proven helpful to student
document.doc 11
achievement. L.E.S. kindergarten teachers have presented their findings and shared information with schools outside of Crawford County as well.
L.E.S. representatives have been asked to attend school board meetings to discuss our curriculum, best-practices, and test score improvements with the school board and representatives from other schools and the community.
Crawford County’s after-school program, C.A.R.E.S., and the Title I staff advise parents how to help students using success-proven strategies.
Student teachers request to train at L.E.S. on a regular basis because of the quality of our teaching staff, the curriculum we have developed, and to observe our innovative intermediate departmentalization.
Teachers from schools in our county and also from surrounding counties are invited to observe our teaching practices, our acceleration program, and see how we administer standards and benchmark instruction. The intermediate math instructor has trained other math teachers in our county. Her students’ consistently high ISTEP+ scores have proven her methods to be very successful.
If we are awarded Blue Ribbon School status, we will continue to be leaders at our grade-level meetings and share techniques, strategies, and curriculum that we feel have contributed to our successes.
document.doc 12
PART V - CURRICULUM AND INSTRUCTION
1. Curriculum:
Indiana State Standards and the needs of our students establish the framework for Leavenworth’s curriculum. Leavenworth Elementary teachers recognize the state standards as a minimum requirement and strive to exceed the standards. Committees of teachers organized each grade-level set of Indiana State Standards into six grading period mastery checklists. An Indiana Department of Education Language Arts consultant worked with county teachers to develop age-appropriate and challenging benchmarks in the areas of Language Arts and writing assessment strategies. A grant to provide full-time Kindergarten classes enables students to be more prepared to meet the challenges of first grade. Students are encouraged to compete in writing contests at the local, state, and national levels. Teachers take advantage of the computer lab available for all students in the building to enhance topics taught by the use of instructional games, publishing writing pieces, and creating PowerPoint presentations. Writing is incorporated throughout the curriculum with all subject areas.
Differentiated instruction is incorporated into the classrooms to meet the different needs of learners in a single classroom. Meeting the needs of all students in the building is a priority at Leavenworth Elementary. The Accelerated Program was created and designed to meet the special needs of fourth, fifth, and sixth-grade Gifted and Talented students. The special needs staff and Title I staff continually provides additional support, materials, and time to ensure that “no child is left behind”. Intermediate grades are departmentalized in language, math, reading, science, social studies, and writing to allow instructors to specialize in their area of expertise.
The Four Block literacy program, McGraw Hill Reading series, Reading Recovery, 6+1 Traits of Writing, Wordly Wise Vocabulary, standards-based benchmarks, and Ruby Payne strategies are incorporated into a balanced curriculum providing essential tools for the master of language arts standards. Students in grades four through six gain a love for reading by selecting trade books and grouping into literature circles to discuss content.
Saxon Math has been utilized in the building for Kindergarten classes through the sixth grade for eight years. The thoroughly researched skills-based mathematics program has proven to be effective with meeting the individual student’s needs. Saxon Math combined with additional standards-based benchmarks used district wide has produced an increase in ISTEP test scores throughout the building. Students that have mastered their grade-level math standards are encouraged to move through the required material more quickly and venture deeper and more elaborately into the area under study in order to allow challenging experiences with math. Members of the teaching staff have been trained to teach and work with programs such as Muggin’s Math, Touch Math, and other programs to assist in remediation and offer a variety of instruction to cater to different learning styles.
The Scott Foresman Social Studies series is used throughout the building as a teaching resource. State standards are further reinforced through hands-on project based activities and field trips. Students in the intermediate grades benefit from the weekly subscription to Scholastic News, a magazine that tailors to current events in the world. Guest speakers are invited to address the body concerning state, local, and national issues through Project LEAD, a program designed to create an interest with government and jobs created through the government and local agencies. The county academic competition tests student knowledge of Geography facts based on state standards. Through the use of positive life skills such as integrity, respect, responsibility, and caring, the importance of good citizenship is reinforced daily at all grade levels.
document.doc 13

The Scott Foresman Science series is incorporated into the curriculum as a teaching resource. Science instruction has been greatly enriched through the Merlin curriculum, provided through a grant from the Lilly Corporation. The standards-based science units in the Merlin Curriculum were designed and developed by a professional curriculum writing group with input from staff throughout the county. Teachers perfected and completed the curriculum based on the needs of the students and enriched the learning in the classroom by pursuing field trips centered around the area of study. An outdoor learning lab was constructed on the school’s property to provide hands-on science training and tools such as microscopes and telescopes were purchased to create visual and hands-on learning for the students. The academic competitions recently added a Science Bowl that tests the student knowledge of science terms and theories. Leavenworth Elementary won the first competition held last year. The annual, local, and county-wide science fair enables students to showcase specific processes learned through individual study. Visitors from Crawford County Recycling bring their knowledge and resources to the school to broaden environmental awareness.
Art, music, and physical education are integrated across the curriculum by each classroom teacher. A licensed physical education teacher provides organized instruction once a week for all students. Students in the fourth-grade are encouraged to participate in an art contest sponsored by Crawford County Recycling and a calendar contest is available for all students. Leavenworth’s athletic department offers fourth through sixth-grade students award-winning extracurricular activities such as basketball, track, cross-country, football, cheerleading, and dance which compliment the physical education curriculum and provide opportunities for growth in organization, socialization, time management, and self discipline. Funded by a local agency, students in the sixth-grade rock climb, hike, canoe, and ski for added physical activity.
2a. (Elementary Schools) Reading:
The reading instruction is based on a combination of programs and strategies proven to be effective for the varied learning styles of the students participating and to sufficiently reach the students’ instructional needs.
Literacy benchmarks are used as teaching guides and assessments. The benchmarks were aligned by a curriculum team to address the language arts standards at each grade level. Benchmark tests are given at the end of each grading period and remediation is given as needed to the students.
All grade levels within the school utilize trade books into their reading instruction. Throughout the school year, RIF (Reading is Fundamental) provides trade books for every child in the building based on acquiring the RIF Grant.
Students in the primary and intermediate grades participate in reading incentive programs such as Scholastic Reading and Pizza Hut’s Book-It.
All 4-6 students are required to read a minimum of twenty minutes per night to build and continue developing an interest in reading.
Student-created reading activities such as literature circles are incorporated into the reading program to provide an opportunity for students to control their own learning, to share thoughts, concerns, and other understanding of the events of novels.
Students in all grade levels partake in guided and self-selected stories and novels to develop and enhance reading skills.
Wordly Wise Vocabulary Development provides an enriched word choice for students. This program presents the words in context, applies meanings in different situations, and allows the students to answer comprehension questions using complete sentences making these words their own.
Intermediate students compete every year in district Academic Bowls. Battle of the Books is a reading comprehension competition that allows students to confer with team members about numerous chosen books. Spell Bowl provides students with a list of words to spell and these words often become part of their every day language. Groups of students from Leavenworth Elementary compete with other groups of students within the district.
document.doc 14
Scott Foresman, the district’s adopted reading series, is used within the school to meet the state standards to assist in providing a balanced literacy program.
A Title I teacher at Leavenworth Elementary has been trained to teach Reading Recovery to the students.
All K-3 instructors, Title I staff and selected 4-6 instructors were trained in and use daily The Four Block literacy program
Title I remediation and At-Risk tutors help students to be more successful readers and comprehend material.
Quarterly testing is provided through Northwest Evaluation Association that allows decisions to be made to promote students’ academic progress and growth with basic skills taught in reading.
2b. (Secondary Schools) English:
This question is for secondary schools only
3. Additional Curriculum Area:
Writing instruction at Leavenworth Elementary is a priority. The ability to communicate clearly and effectively through the process of writing is encouraged on a daily basis through a variety of purposes. At all grade levels, students are reassured that no matter what their skill level, they will be accepted and encouraged as writers.
Students write for a variety of purposes every day through journal writing, specific writing prompts, and in response to math, science, social studies, and literature.
Instruction is constantly adapted to meet the students’ needs and learning styles. Selected instructors in the primary and intermediate grades were appointed to attend 6+1 Traits of
Writing workshops. The knowledge gained from the workshop provides numerous opportunities for students to write successful writing pieces.
The contents of award winning novels are shared with students to provide excellent models of writing to assist students with their writing pieces.
Writing benchmarks are used as teaching guides and assessments for all grade levels in the building. The benchmarks were aligned by a curriculum team to address the writing standards at each grade level. Writing prompts are given at the end of each grading period and remediation is given as needed to the students.
The Four Block writing model is utilized in the primary grades and individual and small writing group conferences provide immediate feedback and support to the student.
Strong word choice is stressed daily to improve students’ writing ability. Strong words are posted and reinforced daily in the classroom.
Students are encouraged to use the power of voice to give their writing pieces a personal flavor. Writing strategies and the elements of writing are modified and adapted to young writers’
developmental needs. Instructors in the classroom model the procedures and provide the structure that help young writers
productively pursue and practice their writing craft. Instructors create writing communities in the classroom by providing a reliable, consistent, and
sufficient block of time for daily writing. Students execute the steps of the writing process on a daily basis through the editing and revising of
sentences in the primary grades and paragraphs in the intermediate grades. Published pieces of students’ writing are on continuous display for staff members and visitors to
view. Title I remediation and At-Risk tutors help students to be more successful writers.
document.doc 15

Quarterly testing is provided through Northwest Evaluation Association that allows decisions to be made to promote students’ academic progress and growth with basic skills taught in writing.
Instructors do not take control of the revision or editing of young writers’ pieces but encourage peer editing and conferencing with other writers.
Math has been one of our most successful stories in the past five years. Our ISTEP+ statewide test scores have averaged very high in all grades tested, particularly in the upper elementary.
Saxon Math has been proven to be a very good means helping our students achieve math goals. We departmentalize our math instruction at the intermediate level. This allows our math teacher to
instruct all 4th, 5th, and 6th grades. We believe this gives the instructor a better insight on the strengths of each class as they pass through in consective years. By the time they reach the 6th-grade, the teacher has guided them to higher levels of success.
Gender clustering has also proven to increase the test scores in math. We do this at the 6th grade level. Males are placed in one section and females in another. A reduction in discipline issues occurred and homework completion is at a much higher level.
Math benchmarks are used as a teaching guide for assessment. Our benchmarks are aligned to meet state standards at each grade level. Benchmark tests are then given at the end of each lesson section and remediation is given instead of at the end of the grading period.
Our children participate in a districtwide Math competition each spring. Selection for math competitors is made from all 4th, 5th, and 6th grade students.
4. Instructional Methods:
Leavenworth staff incorporates a variety of instructional methods to meet the diverse needs and learning styles of all students in our building. Using the state standards as a base for instruction, the staff incorporates the key points of differentiation, brain-research strategies, and learning-styles to promote mastery learning for all students.
Leavenworth Elementary intermediate teachers have “departmentalized”. Each of the four teachers has become an “expert” in different subject areas. Administration, staff, parents, and students believe this has been one of the most important methods we have incorporated at the intermediate level.
Gender grouping at the intermediate level has also proven very successful. Separating sixth grade boys and girls into different classes has alleviated many problems associated with social issues that were obstructing students’ academic success.
Reinforcement, remediation, and re-teaching techniques are utilized through-out the building with the help of Title I staff, at-risk tutors, Reading Recovery, and General Intervention plans, to supplement classroom instruction encouraging continued success for struggling learners.
Instructional methods incorporating concrete manipulatives to teach abstract concepts are used at all grade levels and in all subject areas. This method of teaching is used with great success at the intermediate level as demonstrated by exceptionally high student math test scores on the ISTEP+ national test. Experiments, learning centers, and projects enhance content area taught and meets individual learning styles of the students.
All staff incorporates a variety of grouping when instructing students. Peer-tutoring, intermediate and primary student pairing, small group, individualization, literature groups, like-interest grouping, gender and learning style grouping are utilized in every classroom on a daily basis at all grade levels.
Corporation-wide grade level meetings encourage teacher collaboration. In addition, L.E.S. teachers work together analyzing test data, improving current curriculum and sharing ideas for new lessons, establishing and
document.doc 16

updating student-centered goals, and coordinating subject areas.
5. Professional Development:
The staff and administration at Leavenworth Elementary School believe research and standards-based professional development is imperative to the continued success of the students. Current philosophies are then incorporated into our curriculum and implemented into teaching practices administered by all staff. Administration, teaching, and support staff have attended many workshops, conventions and conferences, and attended college classes to be knowledgeable of the most current practices. Professional development examples include:
2-day Kindergarten, First Grade and National Title I Conferences Partners in Education Conference C.L.A.S.S. project with Barb Peterson (life skills) Mentor Certification Classroom Management: Ruby Payne Workshops (L.E.S. 6th grade teacher trained Crawford County
teachers, K-12, after attending a weeklong conference), Smart Discipline, School Safety Workshops Reading Workshops including: 4 Blocks, Dr. Jean, Reading Comprehension for K-6, Reading
Recovery, Title I Retreat (reading strategies), Six Super Strategies to Promote Thinking and Comprehension, Literacy Groups and How to Incorporate Them, Book Adoption meetings
Writing Workshops including: Smekens Writing Math Workshops including: Muggin’s Math, Marcy Cook, Saxon Math Institute Science Convention: H.A.S.T.I. Social Studies workshops including American History 14 day intense workshops Parent Involvement: Partners in Education, Parent Involvement Retreat, Getting Parents on Your Side High Ability Identification, Differentiation in the Classroom Minds in Motion (brain research based activities), Signing (deaf student communication), Tucker
Signing (Used with K-3 students) STI and Harmony workshops (student identification and assessment management) RTI (Response to Intervention), NWEA Testing, ISTEP+ Testing
6. School Leadership:
Leavenworth Elementary leadership structure consists of a team of certified teachers, non-certified personnel, parent volunteers, and a veteran administrator working together to reach a common goal: to provide an environment where all students can feel safe and learn.
The leadership role of the principal at L.E.S. is to provide guidance, be accessible, and to be the ultimate decision and policy maker to ensure a safe learning environment for students and staff. The administrator at L.E.S. has many years of experience to provide effective leadership including 21 years as an administrator, 12 years as a classroom teacher, 20 years as youth basketball and track coach, 15 years as the county transportation director, and is an active community leader. To remain up-to-date with current best practices, he attends monthly meetings with other county administrators, workshops, and conferences. our principal's competitive nature encourages all to be the best they can be. Our principal depends on his staff to conduct themselves in a professional manner, making decisions concerning the curriculum that are in the best interest of the student. He provides planning time, resources, and support to make sure the educational needs of our students are always met in a timely manner. He expects consistent and realistic goals and expectations to be carried out and updated on a regular basis ensuring that “no child is left behind.” School policies such as dress codes, discipline-related issues, homework, etc. are created to take away distractions and provide an environment that is conducive to academic success.
document.doc 17
Our principal was instrumental in starting innovative school programs in our county such as intermediate departmentalization and gender separation. Both proved to help students concentrate on learning, transition to stringent intermediate class requirements, and increased self-confidence. A looping-like atmosphere cemented teacher-student relationships as well as provided “expert” teachers in different subject areas.
He constantly researches and provides the latest in technology equipment, professional development opportunities, and classroom materials and equipment. He has also provided staff with exercise equipment and a comfortable staff room to ensure physical, mental, and social wellness for his staff.
Our principal takes a very active role in school activities and organizations in order to build healthy relationships with staff, students, and community members. He attends parent teacher organization meetings, takes our “citizens of the month” to lunch each month at a local restaurant, attends or coaches sports events and academic competitions where our students compete, is involved in an academic reward camping retreat with students, staff, and parents, attends field trips with all grade levels when possible. He believes a community of people working together to achieve the common goal of student success should be our top priority.
document.doc 18
document.doc 19
PART VII - ASSESSMENT RESULTS
STATE CRITERION-REFERENCED TESTS
Subject: Mathematics Grade: 3 Test: Indiana Statewide Testing for Educational Progress (ISTEP)
Edition/Publication Year: Updated Annually Publisher: CTB/McGraw-Hill
2007-2008 2006-2007 2005-2006 2004-2005 2003-2004
Testing Month Sep Sep Sep Sep Sep
SCHOOL SCORES
Pass plus Pass+ 69 71 61 61 43
Pass+ (Plus) 9 10 0 0 0
Number of students tested 32 21 23 23 28
Percent of total students tested 100 100 100 100 100
Number of students alternatively assessed
Percent of students alternatively assessed
SUBGROUP SCORES
1. Free and Reduced Lunch/Socio-Economic Disadvantaged Students
Pass plus Pass+ 40 0 42 50 35
Pass + (Plus) 13 0 0 0 0
Number of students tested 15 9 12 16 17
2. Racial/Ethnic Group (specify subgroup):
% Proficient plus % Advanced
% Advanced
Number of students tested
3. (specify subgroup): Special Education
Pass plus Pass+
Pass+ (Plus)
Number of students tested 6 5 2 2 2
4. (specify subgroup):
% Proficient plus % Advanced
% Proficient plus % Advanced
Number of students tested
Notes:
Pass- Passing State Standards-Proficient
Pass plus Pass+-Passing State Standards- Exemplary
document.doc 20
document.doc 21

Subject: Reading Grade: 3 Test: Indiana Statewide Testing for Educational Progress (ISTEP+)
Edition/Publication Year: Updated Annually Publisher: CTB/McGraw-Hill
2007-2008 2006-2007 2005-2006 2004-2005 2003-2004
Testing Month Sep Sep Sep Sep Sep
SCHOOL SCORES
Pass plus Pass+ 72 62 78 83 71
Pass+ (Plus) 9 5 4 22 0
Number of students tested 32 21 23 23 28
Percent of total students tested 100 100 100 100 100
Number of students alternatively assessed
Percent of students alternatively assessed
SUBGROUP SCORES
1. Free and Reduced Lunch/Socio-Economic Disadvantaged Students
Pass plus Pass+ 47 0 58 75 65
Pass+ (Plus) 0 6 0
Number of students tested 15 9 12 16 17
2. Racial/Ethnic Group (specify subgroup):
% Proficient plus % Advanced 0 0
% Advanced 0 0
Number of students tested 0 0
3. (specify subgroup): Special Education
Pass plus Pass+
Pass+ (Plus)
Number of students tested 6 5 2 2 2
4. (specify subgroup):
% Proficient plus % Advanced
% Proficient plus % Advanced
Number of students tested
Notes:
Pass- Passing State Standards-Profiecient
Pass plus Pass+-Passing State Standards- Exemplary
document.doc 22

Subject: Mathematics Grade: 4 Test: Indiana Statewide Testing for Educational Progress (ISTEP)
Edition/Publication Year: Updated Annually Publisher: CTB/McGraw-Hill
2007-2008 2006-2007 2005-2006 2004-2005 2003-2004
Testing Month Sep Sep Sep Sep Sep
SCHOOL SCORES
Pass plus Pass+ 90 88 91 70 83
Pass+ (Plus) 20 8 17 0 3
Number of students tested 20 24 23 27 30
Percent of total students tested 100 100 100 100 100
Number of students alternatively assessed
Percent of students alternatively assessed
SUBGROUP SCORES
1. Free and Reduced Lunch/Socio-Economic Disadvantaged Students
Pass plus Pass+ 80 73 87 60 93
Pass+ (Plus) 0 0 13 0 0
Number of students tested 10 11 15 15 15
2. Racial/Ethnic Group (specify subgroup):
% Proficient plus % Advanced
% Advanced
Number of students tested
3. (specify subgroup): Special Education
Pass plus Pass+
Pass+ (Plus)
Number of students tested 3 6 3 3 4
4. (specify subgroup):
% Proficient plus % Advanced
% Proficient plus % Advanced
Number of students tested
Notes:
Pass - Passing State Standards-Proficient
Pass plus Pass+ -Passing State Standards- Exemplary
document.doc 23
document.doc 24
Subject: Reading Grade: 4 Test: Indiana Statewide Testing for Educational Progress (ISTEP+)
Edition/Publication Year: Updated Annually Publisher: CTB/McGraw-Hill
2007-2008 2006-2007 2005-2006 2004-2005 2003-2004
Testing Month Sep Sep Sep Sep Sep
SCHOOL SCORES
Pass plus Pass+ 70 79 83 67 80
Pass+ (Plus) 5 0 13 4 7
Number of students tested 20 24 23 27 30
Percent of total students tested 100 100 100 100 100
Number of students alternatively assessed
Percent of students alternatively assessed
SUBGROUP SCORES
1. Free and Reduced Lunch/Socio-Economic Disadvantaged Students
Pass plus Pass+ 60 64 80 67 73
Pass+ (Plus) 0 0 7 0 0
Number of students tested 10 11 15 15 15
2. Racial/Ethnic Group (specify subgroup):
% Proficient plus % Advanced
% Advanced
Number of students tested
3. (specify subgroup): Special Education
Pass plus Pass+
Pass+ (Plus)
Number of students tested 3 6 3 3 4
4. (specify subgroup):
% Proficient plus % Advanced
% Proficient plus % Advanced
Number of students tested
Notes:
Pass- Passing State Standards-Proficient
Pass plus Pass+-Passing State Standards-Exemplary
document.doc 25
document.doc 26

Subject: Mathematics Grade: 5 Test: Indiana Statewide Testing for Educational Progress (ISTEP)
Edition/Publication Year: Updated Annually Publisher: CTB/McGraw-Hill
2007-2008 2006-2007 2005-2006 2004-2005 2003-2004
Testing Month Sep Sep Sep Sep Sep
SCHOOL SCORES
Pass plus Pass+ 90 84 78 70 85
Pass+ (Plus) 14 32 7 3 9
Number of students tested 29 19 27 33 34
Percent of total students tested 100 100 100 100 100
Number of students alternatively assessed
Percent of students alternatively assessed
SUBGROUP SCORES
1. Free and Reduced Lunch/Socio-Economic Disadvantaged Students
Pass plus Pass+ 83 80 79 71 78
Pass+ (Plus) 0 20 0 0 5
Number of students tested 12 10 14 17 22
2. Racial/Ethnic Group (specify subgroup):
% Proficient plus % Advanced
% Advanced
Number of students tested
3. (specify subgroup): Special Education
Pass plus Pass+
Pass+ (Plus)
Number of students tested 7 1 7 3 7
4. (specify subgroup):
% Proficient plus % Advanced
% Proficient plus % Advanced
Number of students tested
Notes:
Pass-Passing State Standards-Proficient
Pass plus Pass+- Passing State Standards- Exemplary
document.doc 27

Subject: Reading Grade: 5 Test: Indiana Statewide Testing for Educational Progress (ISTEP)
Edition/Publication Year: Updated Annually Publisher: CTB/McGraw-Hill
2007-2008 2006-2007 2005-2006 2004-2005 2003-2004
Testing Month Sep Sep Sep Sep Sep
SCHOOL SCORES
Pass plus Pass+ 79 89 52 73 71
Pass+ (Plus) 17 11 0 12 6
Number of students tested 29 19 27 33 34
Percent of total students tested 100 100 100 100 100
Number of students alternatively assessed
Percent of students alternatively assessed
SUBGROUP SCORES
1. Free and Reduced Lunch/Socio-Economic Disadvantaged Students
Pass plus Pass+ 67 90 36 59 68
Pass+ (Plus) 8 0 0 6 0
Number of students tested 12 10 14 17 22
2. Racial/Ethnic Group (specify subgroup):
% Proficient plus % Advanced
% Advanced
Number of students tested
3. (specify subgroup): Special Education
Pass plus Pass+
Pass+ (Plus)
Number of students tested 7 1 7 3 7
4. (specify subgroup):
% Proficient plus % Advanced
% Proficient plus % Advanced
Number of students tested
Notes:
Pass- Passing State Standards-Proficient
Pass plus Pass+-Passing State Standards-Exemplary
document.doc 28

document.doc 29

Subject: Mathematics Grade: 6 Test: Indiana Statewide Testing for Educational Progress (ISTEP)
Edition/Publication Year: Updated Annually Publisher: CTB/McGraw-Hill
2007-2008 2006-2007 2005-2006 2004-2005 2003-2004
Testing Month Sep Sep Sep Sep Sep
SCHOOL SCORES
Pass plus Pass+ 94 100 94 97 89
Pass+ (Plus) 44 21 22 34 14
Number of students tested 18 29 32 29 28
Percent of total students tested 100 100 100 100 100
Number of students alternatively assessed
Percent of students alternatively assessed
SUBGROUP SCORES
1. Free and Reduced Lunch/Socio-Economic Disadvantaged Students
Pass plus Pass+ 100 88 93 75
Pass+ (Plus) 14 18 33 8
Number of students tested 9 14 17 15 12
2. Racial/Ethnic Group (specify subgroup):
% Proficient plus % Advanced
% Advanced
Number of students tested
3. (specify subgroup): Special Education
Pass plus Pass+
Pass+ (Plus)
Number of students tested 0 6 3 5 6
4. (specify subgroup):
% Proficient plus % Advanced
% Proficient plus % Advanced
Number of students tested
Notes:
Pass- Passing State Standards-Proficient
Pass plus Pass+-Passing State Standards-Exemplary
document.doc 30

Subject: Reading Grade: 6 Test: Indiana Statewide Testing for Educational Progress
Edition/Publication Year: Updated Annually Publisher: CTB/McGraw-Hill 2007-2008 2006-2007 2005-2006 2004-2005 2003-2004
Testing Month Sep Sep Sep Sep Sep
SCHOOL SCORES
Pass plus Pass+ 83 45 78 90 79
Pass+ (Plus) 11 0 6 24 7
Number of students tested 18 29 32 29 28
Percent of total students tested 100 100 100 100 100
Number of students alternatively assessed
Percent of students alternatively assessed
SUBGROUP SCORES
1. Free and Reduced Lunch/Socio-Economic Disadvantaged Students
Pass plus Pass+ 0 36 59 87 67
Pass+ (Plus) 0 0 0 27 0
Number of students tested 9 14 17 15 12
2. Racial/Ethnic Group (specify subgroup):
% Proficient plus % Advanced
% Advanced
Number of students tested
3. (specify subgroup): Special Education
Pass plus Pass+
Pass+ (Plus)
Number of students tested 0 6 3 5 6
4. (specify subgroup):
% Proficient plus % Advanced
% Proficient plus % Advanced
Number of students tested
Notes:
Pass- Passing State Standards-Proficient
Pass plus Pass+- Passing State Standards-Exemplary
document.doc 31

--------------------------------------------- END OF DOCUMENT --------------------------------------------- document.doc 32
document.doc 32