2009 pfc meeting
DESCRIPTION
2009 PFC Meeting. ITER First Wall Qualification (FWQM) Mock-up Testing. M.A. Ulrickson, T.J. Lutz, T.T. Martin, J.M. McDonald, D.L. Youchison Sandia National Laboratories. Boston, MA July 9, 2009. - PowerPoint PPT PresentationTRANSCRIPT
15931/30.04 709/2009
2009 PFC Meeting
M.A. Ulrickson, T.J. Lutz, T.T. Martin, J.M. McDonald, D.L. Youchison
Sandia National Laboratories
Sandia is a multiprogram laboratory operated by Sandia Corporation, a Lockheed Martin Company,for the United States Department of Energy’s National Nuclear Security Administration
under contract DE-AC04-94AL85000.
ITER First Wall Qualification (FWQM) Mock-up Testing
Boston, MAJuly 9, 2009
25931/30.04 709/2009
Outline
• ITER First Wall Qualification Mock-ups
• Round 1 Testing (EU&US) Aug. 2008 – Nov. 2008EB-1200 Gun #1 Only
– 12,000 cycles (.875 MW/m2)– MARFE testing (1.4 MW/m2)– Additional testing (2.2 MW/m2)
• Round 2 Testing (CN,JA,KO,RF) Mar. 2009 – Aug. 2009EB-1200 Gun #1 & Gun #2
– 12,000 cycles (.875 MW/m2)– MARFE testing (1.4 MW/m2)
• Summary

35931/30.04 709/2009
FWQM geometrySS Back Plate
CuCrZr Heat Sink
80
mm
Be Tiles
(3)
All S65C Be tiles5/6 use HIPpingRF uses fast braze

45931/30.04 709/2009
FWQM mounting prior to testing
US EUdummy dummy

55931/30.04 709/2009
EB-1200 Door Mount
leak checking instrumentation calibrations
Targets: 20 TCs, 2 pressure transducers, 8 RTDs, 4 flowmeters2 pyrometers and 2 IR cameras

65931/30.04 709/2009
Diagnostics
1234567
1
2
4
5
3 6
7

75931/30.04 709/2009
Blue: Reverse Flow
Green: Normal Flow
Maximum surface temperature remains the same in reversed flow configuration
Rev
erse
Flo
w
Nor
mal
Flo
w
N R
TC1 268.4C 274.9C
TC2 272.9C 272.8C
TC3 274.9 268.5C
Thermocouple temperatures
UCLA FQWM CFD Conjugate Heat Transfer Modeling

85931/30.04 709/2009
TV0 raster patterns adjusted to match calculated surface temperature distribution.

95931/30.04 709/2009
Eval. °C
100.0
137.5
175.0
212.5
250.0
287.5
325.0
400.0
US Span
US
EU Span
EU
Tile6
Tile5
Tile4
Tile3
Tile2
Tile1
IR Thermography – North camera

105931/30.04 709/2009
EU Experimental temperature profile from uniform heat flux

115931/30.04 709/2009
IR Thermography – South cameraEval. °C
100.0
137.5
175.0
212.5
250.0
287.5
325.0
400.0
Tile6
Tile5
Tile4
Tile3
Tile2
Tile1
US Span
EU Span
EUUS
125931/30.04 709/2009
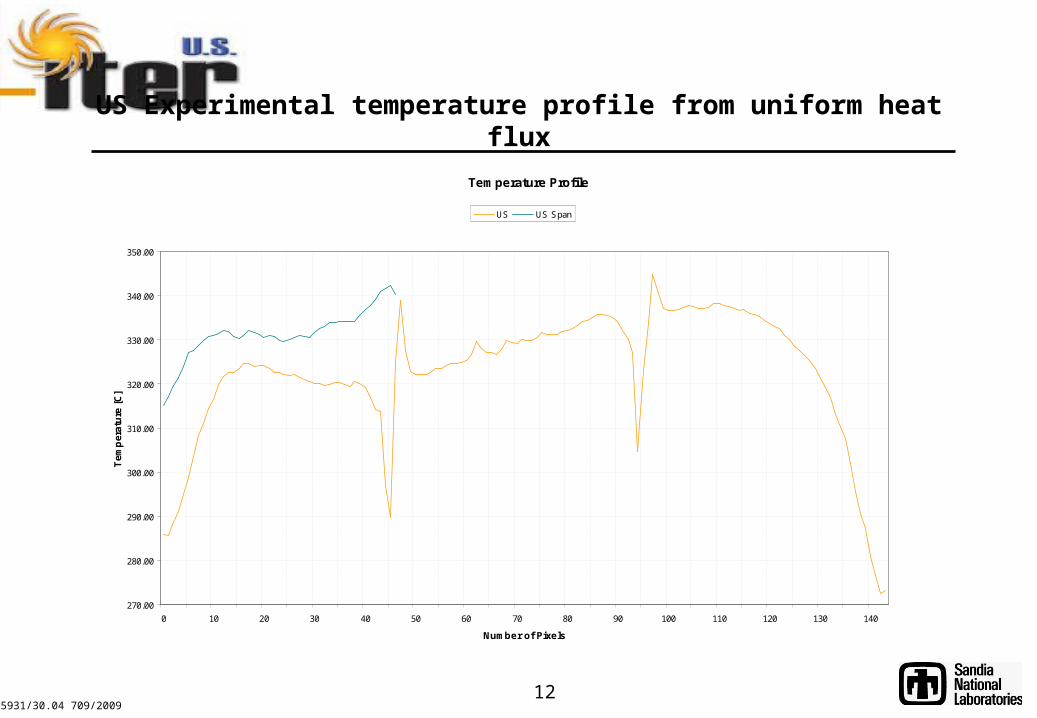
US Experimental temperature profile from uniform heat flux
Temperature Profile
270.00
280.00
290.00
300.00
310.00
320.00
330.00
340.00
350.00
0 10 20 30 40 50 60 70 80 90 100 110 120 130 140
Number of Pixels
Te
mp
era
ture
[C
]
US US Span

135931/30.04 709/2009
Emissivity Maps
Uncorrected (T=225C)corrected
Org. °C
130.5
138.7
146.9
155.1
163.3
171.5
179.7
196.1
RF SpanCN Span
RFCN
Til12
Til11
Til10
Tile3
Tile2
Tile1
Tile9
Tile8
Tile7
Tile6
Tile5
Tile4
JA Span M3 Span
M3JA
emissivity map
Eval. °C
100.0
137.5
175.0
212.5
250.0
287.5
325.0
400.0
RF SpanCN Span
RFCN
Til12
Til11
Til10
Tile3
Tile2
Tile1
Tile9
Tile8
Tile7
Tile6
Tile5
Tile4
JA Span M3 Span
M3JA
e-Map
0.00
0.04
0.08
0.11
0.15
0.19
0.23
0.30
RF SpanCN Span
RFCN
Til12
Til11
Til10
Tile3
Tile2
Tile1
Tile9
Tile8
Tile7
Tile6
Tile5
Tile4
JA Span M3 Span
M3JA

145931/30.04 709/2009
Last of 12000 cycles at 0.875 MW/m2
Absorbed power for last shot of the day, US absorbed power in red, EU absorbed power in green.
Temperatures read by thermocouples imbedded in the middle tile, US mockup (blue) and EU mockup (orange).
Pyrometer surface temperature reading from middle tile, EU (blue) mockup and US mockup (green).

155931/30.04 709/2009
1000 cycles at 1.4 MW/m2 (MARFE)
Absorbed power for MARFE conditions last shot, Green is EU and Red is US mockup
165931/30.04 709/2009
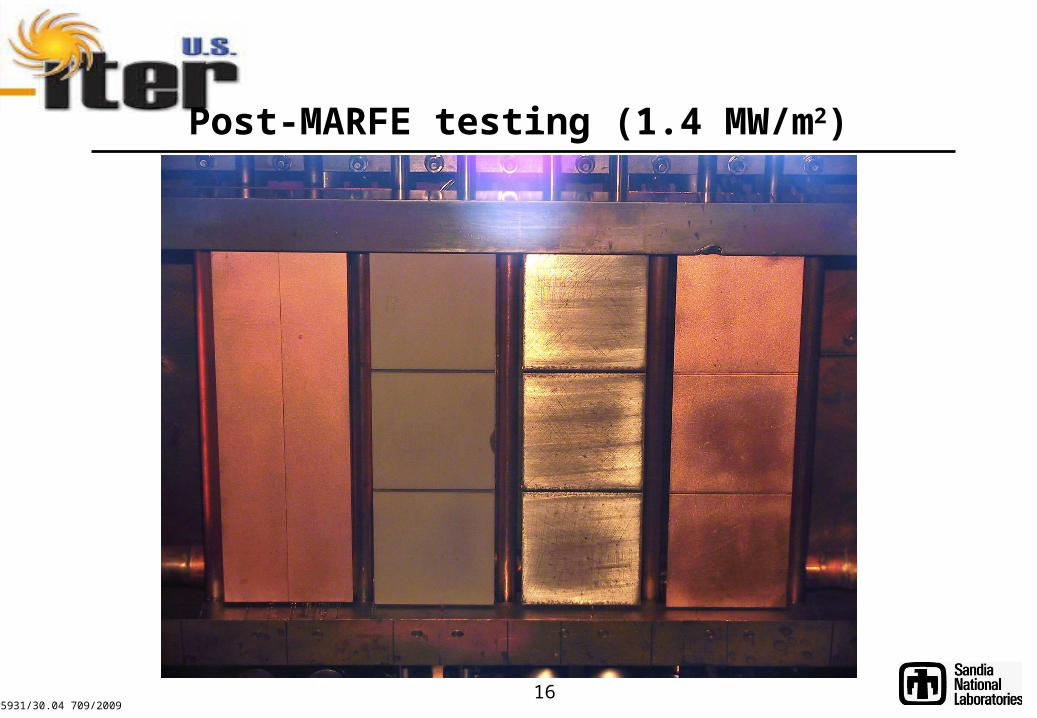
Post-MARFE testing (1.4 MW/m2)
175931/30.04 709/2009
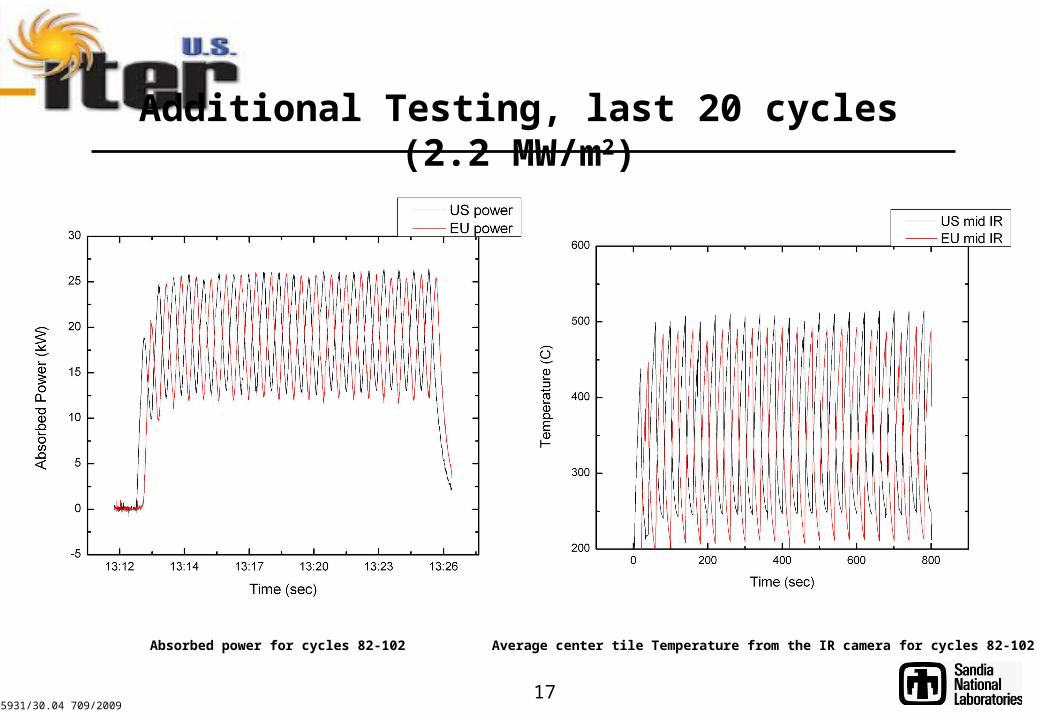
Additional Testing, last 20 cycles (2.2 MW/m2)
Absorbed power for cycles 82-102 Average center tile Temperature from the IR camera for cycles 82-102.

185931/30.04 709/2009
Post-Additional testing

195931/30.04 709/2009
Round 2, Pre-testing
CN JA KO RF

205931/30.04 709/2009
TC installation

215931/30.04 709/2009
IRControl image @ 2382 cyclesEval. °C
100.0
137.5
175.0
212.5
250.0
287.5
325.0
400.0
RF SpanCN Span
RFCN
Til12
Til11
Til10
Tile3
Tile2
Tile1
Tile9
Tile8
Tile7
Tile6
Tile5
Tile4
JA Span KO Span
KOJA
Infrared image during heating of mockups 1 and 3 at end of cycle 2382 – Grid areas are used for evaluating the mean and variance of each tile

225931/30.04 709/2009
Eval. °C
100.0
137.5
175.0
212.5
250.0
287.5
325.0
400.0
RF SpanCN Span
RFCN
Til12
Til11
Til10
Tile3
Tile2
Tile1
Tile9
Tile8
Tile7
Tile6
Tile5
Tile4
JA Span KO Span
KOJA
Infrared image during heating of mockups 2 and 4 at end of cycle 2382 – Grid areas are used for evaluating the mean and variance of each tile
IRControl image @ 2382 cycles

235931/30.04 709/2009
~200 cycles at 0.875 MW/m2 (48sON/48sOFF)
Absorbed Power traces for all four mockups during last shot of the day: Mockups 1 and 2 (tgt01 and tgt02) are heated by Gun2, mockups 3 and 4 (tgt03 and tgt04) are heated by Gun1.
32 min shot
>6300 cyclesas of 7/02/09

245931/30.04 709/2009
Current status, KO mock-up removed
•KO mock-up developed water leak at cycle 2383 in 12-mm-dia tube. Repair was not possible. Removed on 6/08/2009. •JA mock-up has partially un-bonded ss tubes since fabrication, but performing within acceptable margins.
CN JA RFdummy

255931/30.04 709/2009
EU BESTH device (Czech Rep.)

265931/30.04 709/2009
Summary
• FWQM testing in Round 1 (completed 11/08)• EU & US passed Round 1 in US
•Waiting for MARFE/Additional in Judith in EU• Currently above 6300 cycles in Round 2 testing
•CN, JA, KO, RF MARFE testing in August•KO mock-up pulled, replacement for MARFE testing•JA 12-mm-tubes not well attached to CuCrZr
• Following next year – semi-prototype testing ?