2009:058 master's thesis geology of the rockliden ...1032308/fulltext01.pdf · bothnian basin....
TRANSCRIPT

2009:058
M A S T E R ' S T H E S I S
Geology of the Rockliden volcanogenicmassive sulphide deposit, north
central Sweden
Gilles Depauw
Luleå University of Technology
Master Thesis, Continuation Courses Exploration and Environmental Geosciences
Department of Chemical Engineering and GeosciencesDivision of Ore Geology
2009:058 - ISSN: 1653-0187 - ISRN: LTU-PB-EX--09/058--SE
2
Abstract
The Rockliden deposit is located in north central Sweden in the middle of the
Bothnian Basin. It was formed at the contact above little isolated felsic volcanic rocks (dated at 1874±Ma by Welin, 1987) intercalated in the upper part of the 10km thick turbiditic sediments of the Härnö group (ca.1.95-1.87 Ga, Lundqvist et al., 1998) and strongly deformed during the Svecokarelian orogeny (1.87-1.82 Ga, Kousa & Lundqvist, 2000). It was discovered in the 80´s by Boliden Mineral AB but the project was put on hold because of the high antimony grade. Resources were estimated at the time at 2,2Mt @ 94 g/t Ag, 1.98 % Cu, 5.56% Zn, 0.97% Pb, 0.91% As, 0.18% Sb, and 27% S from 0-500m (Mattsson & Heeroma, 1985). Interest came back recently and new deep holes were drilled between 2007 and 2009. The aim of the master’s thesis was to describe the detailed geology of the Rockliden deposit and to classify it in the existing nomenclature.
The description (rocktype, alteration, mineralisation, tectonic structures) was based on 2700m of re-logged drillcores from a cross section in the central part of the deposit. Statistical information on metal content comes from the study of previous chemical assays performed on mineralised sections. New whole rock lithogeochemical analyses and thin sections were made from the footwall.
A geological model including the footwall with a zoned hydrothermal alteration, the mineralisation and the hanging wall, all strongly deformed and faulted, was interpreted on 3 cross sections separated by 10 m intervals and map levels at 100 m intervals. The hydrothermal alteration is mainly sericitic and chloritic in the central part. The Sb grades are lower at depth, the reason for that is still unknown but hypothetically linked to metamorphism or metasomatism. From the comparison to the existing nomenclature, it appears that the Rockliden VMS is a Palaeoproterozoic, bimodal felsic, Kuruko type deposit, rich in Zn, Cu, Ag but containing very little gold. The lithogeochemical analyses in the footwall show that the volcanic sequence has a dacitic composition of FII-type and calc-alkaline affinity. Comparisons to average upper continental crust and dacitic rocks from the Skellefte district show enrichment in HFSE, LILE, REE in Rockliden and underline the sedimentary rocks as a possible source of the melt, or at least as a contaminant.

3
Table of contents 1 Introduction ...................................................................................................................... 5
2 Area of study and exploration history ............................................................................ 6 2.1 Location, climate and geomorphology ....................................................................... 6 2.2 History of previous exploration work ........................................................................ 7
3 Methods ............................................................................................................................. 8
4 Volcanogenic massive sulphide deposits ...................................................................... 10 4.1 Global ....................................................................................................................... 10 4.2 Nomenclature ........................................................................................................... 10 4.3 VMS in the Fennoscandian Shield ........................................................................... 13
5 Geological setting and regional geology ....................................................................... 14 5.1 Tectonic evolution of the Fennoscandian shield ...................................................... 14
5.1.1 Palaeoproterozoic rifting of the Archaean continent at 2.5 to 1.96Ga ................. 14 5.1.2 Microcontinent accretion at 1.96 to 1.88 Ga ........................................................ 14 5.1.3 Continent–continent collision at 1.87 to 1.79 Ga ................................................. 15
5.2 The Bothnian Basin .................................................................................................. 17
6 Geology of the Rockliden VMS deposit ........................................................................ 20 6.1 Local geology of the Rockliden area ........................................................................ 20 6.2 Stratigraphy .............................................................................................................. 20
6.2.1 Supracrustal rocks ................................................................................................ 22 6.2.2 Svecokarelian early orogenic intrusions .............................................................. 25 6.2.3 Svecokarelian late and post orogenic intrusions .................................................. 25
6.3 Alteration .................................................................................................................. 26 6.4 Characteristics of the mineralisation ........................................................................ 27
6.4.1 Previous ore mineralogy study ............................................................................. 27 6.4.2 Modal mineral composition ................................................................................. 28 6.4.3 Recent mineralogical analysis from copper concentrate ...................................... 29
6.5 Structures .................................................................................................................. 29 6.6 Metamorphism ......................................................................................................... 29 6.7 Cross sections ........................................................................................................... 30 6.8 Discussion of the cross sections ............................................................................... 35
7 Assays statistics of the mineralisation .......................................................................... 36 7.1 Correlation between metals ...................................................................................... 39 7.2 Analysis of the antimony repartition ........................................................................ 40 7.3 Discussion of assays statistics .................................................................................. 41
8 Footwall lithogeochemical analysis ............................................................................... 43 8.1 Rock classification and volcanic affinity ................................................................. 44 8.2 Alteration plots ......................................................................................................... 46 8.3 Rare Earth Elements ................................................................................................. 47 8.4 Normalisation to mantle and continental crust ......................................................... 48 8.5 Discussion of the lithogeochemical analyses ........................................................... 49
9 Discussion ........................................................................................................................ 52 9.1 Classification of the Rockliden VMS deposit .......................................................... 52 9.2 Tectonic setting ........................................................................................................ 53
10 Conclusion ....................................................................................................................... 56

4
Table of Figures Figure 1 – Simplified geological map of the Fennoscandian shield, ....................................................................... 5 Figure 2- Map of Sweden and location of Rockliden ............................................................................................... 6 Figure 3 – Map of the re-logged drill holes and cross-sections location, coordinates in local grid ....................... 8 Figure 4 – The most common VMS classification, based on the base metal ratios, ............................................... 11 Figure 5 – VMS classification according to the rocktype and alteration, from Barrie and Hannington (1999) ... 12 Figure 6 - The geodynamic evolution of the Fennoscandian Shield between 2.06 and 1.78 Ga............................ 16 Figure 7 - General stratigraphy of the Bothnian Basin. The stratigraphy of the VMS bearing Skellefte district
(from Weihed et al. 1992) to the north is shown for comparison. ...................................................... 18 Figure 8 – Geological map of the Rockliden area, Mattsson & Heeroma (1985) ................................................. 21 Figure 9 – Detail of the geological map of the Rockliden area, from Mattsson et Heeroma (1985) ..................... 22 Figure 10 – Generalized Stratigraphy of the Rockliden deposit area, ................................................................... 23 Figure 11 – macroscopic and microscopic view of the footwall from drillhole 97 ................................................ 24 Figure 12 – schematic metals zonation in the reconstituted ore body of Rockliden, ............................................. 28 Figure 13 – cross section 7710Y ............................................................................................................................ 31 Figure 14 – Cross section 7720Y ........................................................................................................................... 32 Figure 15 – Cross section 7730Y ........................................................................................................................... 33 Figure 16 – map levels around the central part of the deposit at 100, 190 and 290m depth ................................. 34 Figure 17 – Distribution of Ag, Au, Cu, Zn, Pb, As and Sb concentrations in the mineralised sections containing
more than 25wt.% of S. ...................................................................................................................... 38 Figure 18 – Metals correlation diagrams for Sb-Ag and Sb-Pb ............................................................................ 39 Figure 19 – Antimony concentrations vs. depth ..................................................................................................... 40 Figure 20 – Percentage of samples over 0.1% Sb vs. depth .................................................................................. 40 Figure 21 – Percentage of samples over 0.2% Sb vs. depth .................................................................................. 41 Figure 22 - Map of hole 68 with rocktype and location of the samples collected for chemical analyses. ............. 43 Figure 23 – Volcanic rocks classification from immobile trace elements ratios, .................................................. 44 Figure 24 – immobile elements plots, from Barrett and McLean (1994). .............................................................. 45 Figure 25 – Alteration box plot, from Large et al. 2001. ....................................................................................... 46 Figure 26 – K2O vs. Al2O3 diagram, from Barrett & McLean, 1994, .................................................................... 47 Figure 27 – Normalization to the chondrite ( Nakamura 1974) ............................................................................ 47 Figure 28 – Above: normalisation to primordial mantle (Wood et al.1979) a) all Rockliden, b) averages of
Rockliden (blue), Maurliden (green),and Petiknäs (purple). Below: normalisation to the upper continental crust (Taylor & Mc Lennan, 1995) c) all Rockliden, d) averages of Rockliden (blue), Maurliden (green), and Petiknäs (purple). ......................................................................................... 49
Figure 29 – Rockliden dacite samples average normalized to Petiknäs and Maurliden dacites averages. ........... 50 Figure 30 – Rockliden samples in the VMS classification from Franklin et al. (1981), Large (1992) left, and in
the classification from Hannington et al. (1999) right. ...................................................................... 52 Figure 31 – Rockliden samples in the tectonic setting plots from Shandl et al.(2002). ......................................... 53 Figure 32 – F-type of felsic volcanic rocks from Lesher et al. (1986) plotted in a La/Yb vs. Yb normalized to the
chondrite, from Hart et al. (2004). ..................................................................................................... 54 Figure 33 – VMS tectonic setting, from Hart et al. 2004 ....................................................................................... 55
Table of tables
Table 1 – Entirely re-logged drillholes identification numbers and length. ............................................................ 8 Table 2 - Modal mineral composition from Mattsson & Heeroma (1985) ............................................................. 28 Table 3 – basic statistical values for analysed elements in mineralised sections above 25 wt.% of S. .................. 36 Table 4 – basic statistical values for elements analysed in all mineralised sections. ............................................ 36 Table 5- sample number and short description of the Maurliden and Petiknäs dacites, from Montelius (2005) and
Schlatter (2007) ....................................................................................................................................... 48 Table 6 : Ore calculations made in 1985 down to the depth of 500 m ................................................................... 52

5
1 Introduction
Rockliden is a volcanogenic massive sulphide (VMS) deposit located in north central Sweden (Figure 1). Geologically speaking it is associated with a small felsic metavolcanic intercalation situated in the middle of the Bothnian Basin. The latter is bordered by two major VMS ore bearing district, the Skellefte district to the north and the Bergslagen district to the south. These terranes are part of the Palaeoproterozoic rocks of the Fennoscandian Shield. The footwall of the Rockliden mineralisation has been dated at 1987±6 Ma by Welin (1987).
Figure 1 – Simplified geological map of the Fennoscandian shield, from Weihed et al. 2005, adapted from Koistinen et al. (2001).
Rockliden

6
Boliden Mineral AB discovered the Rockliden deposit in the 1980´s. The project was
then put on hold because of high antimony grades and high investment costs, but interest came back recently. Therefore, the aim of this master thesis was to describe in detail the geology (rocktype, mineralogy, alteration) of both hangingwall and footwall as well as the mineralisation of the volcanogenic massive sulphides deposit of Rockliden. The geology was studied in drillcores selected along several parallel NE-SW profiles in the centre of the deposit in order to draw an interpreted geological model. An accessory goal was to determine Rockliden in the existing classification of VMS deposits, with the help of previous chemical analysis on the mineralisation, its host geology and the geological setting. A closer look on the repartition of antimony, which often reaches high concentrations (>0.1%) in the deposit, and is problematic for exploitation was also done. New lithogeochemical analyses and thin sections have also been done on the footwall in this purpose. These new data also permitted an interpretation of origin and a tectonic setting for the felsic volcanic rocks of the Rockliden deposit.
2 Area of study and exploration history 2.1 Location, climate and geomorphology
The Rockliden area is located in north central Sweden about 200 km south of Boliden, in the Örnököldsvik commune, in the Västernorrland country. (Figure 2)
Figure 2- Map of Sweden and location of Rockliden
Skellefte district
7
The Rockliden area is located 300 km south of the Artic Polar Circle. It has a typical continental sub-arctic climate with a long period from November to February where the sun light does not last more than a few hours a day. The climate is rather dry. From the beginning of November to March, it snows and the latter does not melt before May. As a consequence, the landscape is covered in snow for about five months a year. Temperatures rise up to 25°C during summer but during winter, temperatures as extreme as -30°C can be experienced with lasting periods below -10°C.
The landscape comprises numerous lakes and widespread coniferous forests with moderately elevated eroded mountains and typically U-shaped valleys. It has been inherited from the Quaternary glaciations, the last of which ended 7000 years ago in the Rockliden area. The thickness of the glacial till overburden from the Quaternary glaciations can reach tens of meters. 2.2 History of previous exploration work
Boliden Mineral AB started exploration in the Rockliden area around 1930. During the
1940’s exploration was focused on nickel related to gabbroic intrusions at Kläpsjö, south-west of Rockliden. No economically interesting findings were encountered. The yearly mineral hunt of 1975 came up with an interesting Cu-Ni mineralised boulder close (10km) to the Rockliden area. Boliden Mineral AB made both airborne and ground geophysical measurements.
With increasing geological knowledge of the Skellefte District, mineral systems and their relation to submarine volcanism, it was decided by Boliden Mineral AB to reinvestigate the area again in 1981. Previous geological fieldwork indicated felsic volcanic rocks in the area and boulders of (semi) massive sulphides (Cu, Zn and Ag grades) were found 20 km southeast of the Rockliden deposit. New airborne and ground EM measurements in combination with field mapping and glacial reconstructions indicated a potential mineralisation on the northern side of Skravelåsen. The first test holes in 1982 intersected thin slices of massive sulphides of the nowadays known Rockliden mineralisation. Follow up drilling gave disappointing results, with low grades in comparison with the known grades from massive sulphide boulders. Several trenches were dug on top of the potential mineralisation were the known till/overburden was only a few meters thick. This resulted in the appearance of massive sulphides, which were much wider than intersections in the first test holes. New confidence was assured and follow-up drilling resulted in the first major massive sulphide intersection in 1983.
Drilling continued and new massive sulphide intersections were encountered. In combination with a gravity anomaly covering Rockliden, ore reserve calculations indicated more than 1Mt of ore in 1984. In 1985 drilling results were still promising and resources estimated at 2.2Mt@ 94g/t Ag, 1.98% Cu, 5.56% Zn, 0.97% Pb, 0.91% As, 27% S and 0.18% Sb from 0-500m. Boliden Mineral applied for a mining concession in 1985.
A total of 102 holes were drilled until the end of January 1986. Although, there was still a lot of potential for new, undiscovered mineralisation, it was the metallurgical results which put the project on hold. High antimony grades and the enormous investment costs for setting up the mining infrastructures (concentrator, tailing dam, roads etc) were at that time off limit.
During the recent boom of the mining industry, interest in the Rockliden area came back. Emphasize was put on the untested deeper part of the known mineralisation and its potential. Drilling started during summer 2007 and continued until April 2009.

8
3 Methods
Vertical cross sections were constructed at 7710Y, 7720Y, 7730Y and between 5100X and 5600X in the local grid which has a Northeast orientation (Figure 3). Horizontal sections were drawn each 10 m until 300 m depth. Data come from ca. 2700 m of re-logged drillcores (Table 1) and old logs existing in the Boliden database. Selected drillcores were located in the centre of the deposit, all of which are stored in Boliden.
Figure 3 – Map of the re-logged drill holes and cross-sections location, coordinates in local grid. A recent 3D model shows the location of the ore
Table 1 – Entirely re-logged drillholes identification numbers and length.
Drillhole 20 62 68 69 70 77 81 97 99 Length (m) 268 273 574 199 427 183 201 160 170
N
20
77
70 69
68
62
99 97 81
9
Simple assay statistics and different plots were completed from lithogeochemical
analyses and on old assays data: - 12 samples of the footwall along hole 68 (Figure 22, p 44) have been taken for
whole rock lithogeochemical analyses in majors and trace elements and were sent to ACME Analytical Laboratories in Vancouver, Canada. Sample 1 is at almost 400m, close to the mineralisation (423m); sample 12 is close to the surface. Samples are distant from each other of 30-40 m. 2 other samples come from the hole 71 (parallel to 67 in Figure 13 but 50 m to the east). 2 samples from the Renstöm mine were also send as standard andesite and rhyolite to check the quality of the analysis. In hole 68, available old chemical analysis of major elements around 350-400m (from Mattsson & Heeroma, 1985), were added when possible. Two thin sections were made in the same rocktype as hole 68, but in hole 97 at 7m and 32 m also in order to characterise the footwall.
- Since the beginning of the drilling program, all mineralised sections in drillcores (massive sulphide lenses and strong sulphide impregnation in the footwall) were split lengthwise and half of the core was analysed for Cu, Zn, Pb, Ag, Au, As, Sb, S, sometimes Bi, Hg and sometimes also for major elements in the footwall. Almost 1100 samples corresponding to 2300 m of drill core have been analysed and more than 300 samples equivalent to 600 m are above 25 w% of sulphur. Above this limit the samples were considered to be massive sulphides. Those data were taken from the existing Boliden database.

10
4 Volcanogenic massive sulphide deposits 4.1 Global
The following resume concerning the characteristics of volcanogenic massive sulphides deposits is summarizing the VMS synthesis of Galley et Al., 2007, and Allen et al. 2004.
Volcanogenic massive sulphide (VMS), also known as volcanic-hosted (VHMS) are associated with volcanic and volcano-sedimentary submarine environments. They typically occur as lenses of polymetallic massive sulfides that form at or near the seafloor through the focused discharge of hot, metal-rich fluids associated with seafloor hydrothermal convection. Their immediate host rocks can be either volcanic or sedimentary. VMS deposits are major sources of Zn, Cu, Pb, Ag and Au, and significant sources for Co, Sn, Se, Mn, Cd, In, Bi, Te, Ga and Ge. Some also contain significant amounts of As, Sb and Hg. Because of their polymetallic content, VMS deposits continue to be one of the best deposit types for security against fluctuating prices of different metals. They typically have a mound-shaped to tabular, stratabound body composed principally of massive (>40%) sulphide, quartz and subordinate phyllosilicates, iron oxide minerals and altered silicate wallrock. These stratabound bodies are typically underlain by discordant to semi-concordant stockwork veins and disseminated sulphides. The stockwork vein systems, or "pipes", are enveloped in distinctive asymmetric and zoned alteration halos, more extended and intense in the footwall but which may extend into the hanging-wall strata above the VMS deposit. VMS deposits are classified under the general heading of "exhalative" deposits, which includes sedimentary exhalative (SEDEX) or sedimentary hosted (SHMS). This latter group is known from rift basins without any associated volcanism.
4.2 Nomenclature
VMS deposits are grouped according to base metal content, gold content, host-rock lithology and tectonic setting, correlated with geological periods.
The base metal classification used by Franklin et al. (1981) is probably the most common. The Cu-Zn and Zn-Cu categories were further refined by Morton and Franklin (1987) (Figure 4) into Noranda and Mattabi types respectively, by including the character of their host and characteristic alteration mineral assemblages. It was then refined by Large (1992) who added the Zn-Pb-Cu category.
Poulsen and Hannington (1995) created a simple bimodal definition of "normal" vs. "Au-rich" VMS deposits. The latter are arbitrarily defined as those in which the concentrations of Au in ppm are greater than the combined base metals (Zn+Cu+Pb in wt. %).

11
Figure 4 – Worldwide VMS deposits in the most common VMS classification, based on the base metal ratios, from Franklin et al. (1981) extended by Large (1992)
A third classification is a fivefold grouping suggested by Barrie and Hannington
(1999) to indicate dominant host-rock lithology (up to 3000m below and 5000m along strike the deposit). The five groups are mafic-dominated, bimodal mafic, bimodal-felsic, siliciclastic-mafic, and bimodal-siliciclastic (Figure 5). The order of this grouping reflects not only a progressive change from a less effusive to a more volcaniclastic-dominated environment, but also one in which felsic volcanic rocks become generally more prominent. The groups associated with mafic volcanic and volcaniclastic strata are more common in oceanic arcs and spreading centers, whereas the two groups dominated by felsic strata are more common in arc-continent margin and continental arc regimes Finally the VMS classification could be summarized as follows: VMS (or VHMS):
o Cyprus or MORB type, (Franklin et al. 1981) Cu (±Zn) rich, in ophiolitic complexes. o Besshi (or Kieslager) type, (Fox 1984), clastic terrigenous sediments and basaltic
volcanism, Cu (±Zn±Co). o Polymetallic Cu-Pb-Zn types (Franklin et al., 1981, Large,1992 classifications)
- Archaean type Noranda: Cu-Zn rich, mafic effusive, chl-ser altered, - Archaean type Mattabi: Zn-Cu (Ag) rich, felsic volcaniclastic, ser-qz-carb altered. - Proterozoic to present Kuroko type: Zn-Pb-Cu rich, felsic.
SEDEX (or SHMS): Pb-Zn, silico-clastic, mainly Proterozoic

12
Figure 5 – VMS classification according to the rocktype and alteration, from Barrie and Hannington (1999)

13
4.3 VMS in the Fennoscandian Shield
Weihed et al. (2005) summarized information about ore deposits in the Fennoscandian field including VMS deposits:
Volcanogenic massive sulphide deposits are the ore type that is currently the most exploited in the Fennoscandian Shield. Five deposits are currently mined in the Skellefte district in northern Sweden, one deposit in the Pyhäsalmi area in central Finland and two deposits in the Bergslagen region of southcentral Sweden.
In the Fennoscandian Shield, significant VMS deposits are associated exclusively with Palaeoproterozoic volcanic arc terranes which were accreted to the old Karelian craton at different stages during the evolution of the Svecokarelian orogen, between ca. 1.95 and 1.85 Ga.
The deposits of the Outokumpu ophiolitic sequences, which formed at ca. 1.97 Ga and emplaced onto the Karelian Craton between 1.94 and 1.89 Ga have been described as potential “Cyprus-type” deposits. The 1.93 to 1.92 Ga Pyhäsalmi arc and the Skellefte volcanic arc that formed 20 to 30 million years later contain Kuroko-style VMS deposits. The Bergslagen-Uusimaa belt in south-central Sweden and southern Finland contains VMS deposits of a more continental arc affinity that formed roughly at the same time as the Skellefte deposits.
The main VMS deposits in Sweden are of Proterozoic age and located within the
Skellefte and Bergslagen volcanic arcs, which resulted from the subduction of the Bothnian Basin to the north and to the south. The VMS deposit in Rockliden seems to be isolated in the middle of the Bothnian Basin, where only few metavolcanic rocks are known in the sedimentary sequence. No other massive sulphides mineralisation is documented in the vicinity, except the Barsele-Norra to the north, closer to the Skellefte district.

14
5 Geological setting and regional geology 5.1 Tectonic evolution of the Fennoscandian shield
The Fennoscandian or Baltic Shield occupies the northern part of Europe and is composed of Archaean to Neoproterozoic rocks. It hosts VMS but also IOCG, Ni-Cu-PGE and orogenic gold deposits, mainly of Proterozoic ages.
This section is a summary from the latest model of tectonic evolution of the Fennoscandian shield, Weihed (2004) and Weihed et al. (2005), focussed on Sweden and VMS type deposits.
5.1.1 Palaeoproterozoic rifting of the Archaean continent at 2.5 to 1.96 Ga
The Archaean craton of Fennoscandia, Northeastern part of the map in Figure 6 consolidated after the last major phase of granitoid intrusions at 2.69 Ga. During the period 2.5 to 2.0 Ga, it underwent several episodes of continental rifting and related, dominantly mafic, magmatism, denudation and sedimentation. These resulted in the formation of intracratonic volcano-sedimentary sequences, which were deformed later. There are no indications of accretionary phases or formation of major new felsic crust at this stage.
Continental break-up occurred 2.1-2.0 Ga ago (Nironen, 1997) and resulted in the Archaean craton breaking into several megablocks: Karelian, Kola and Norbotten (Lahtinen, 2002, 2005). Oceanic crust formed during the latest phase of the extension. (Figure 6A). The Palaeoproterozoic Bothnian, Keitele and Bergslagen juvenile microcontinents without any known Archaean basement must have formed before 2.0 Ga but have no identified surface expressions (Lahtinen et al., 2005).
Svecofennian refers to rocks which formed between 2.0 and 1.75 Ga (Gaál and Gorbatschev, 1987) during the Svecokarelian Orogeny 1.9-1.8 Ga in a compressional tectonic regime.
A first prominent evidence of convergence is the obduction of ca. 1.97 to 1.96 Ga ophiolitic sequences at Jormua and Outokumpu in Finland leading to basin inversion, and the Svecokarelian orogeny.
5.1.2 Microcontinent accretion at 1.96 to 1.88 Ga
The most intense crustal growth in the Palaeoproterozoic took place during the Svecokarelian orogeny at ca. 1.9 to 1.8 Ga. Convergence continues after the obduction of the ophiolites. Subduction and back-arc rifting in the Lapland–Kola area, westward subduction under the Keitele microcontinent (Savo Belt) and Norrbotten microcontinent, and NE subduction under the Norrbotten microcontinent are the main tectonic features at ca. 1.93 Ga (Figure 6B).
1.92 Ga primitive island arc rocks in the Savo Belt (Korsman et al., 1997) which contain the VMS deposits of the Pyhäsalmi area in Finland (Lahtinen, 1994) and the ca.1.95 Ga rocks in the Knaften area (Wasström, 1993), south of the Skellefte District in Sweden, are

15
the oldest documented Svecofennian units in the shield, but older protoliths (~2.1 to 2.0 Ga) are inferred from Nd isotope geochemistry and detrital zircon studies (Lahtinen and Huhma, 1997).
The Savo belt was accreted to the craton at ca. 1.91 to 1.90 Ga during the peak of the Lapland–Kola and Lapland–Savo orogenies (Figure 6 C, D). The initial stage of collision of the Bothnian microcontinent with the Norrbotten and Keitele microcontinents also occurred at this stage.
The Skellefte arc formed during the collision of the Bothnian microcontinent with the Norrbotten and Keitele microcontinents (Figure 6 D), either as a continental margin arc or possibly as an accreted island arc. Weihed et al. (1992) concluded that the deposition of massive sulphides occurred at the end of volcanism at 1.89 Ga. There is evidence that this extensively mineralized arc was under extension during the formation of the VMS ores (Allen et al., 2002). Extension in the Skellefte district was followed by basin inversion and rapid uplift and erosion of the arc.
Docking of the Bothnian microcontinent with the Norrbotten and Keitele microcontinents and differences in relative plate motions resulted in a transform fault between the Keitele and Bothnian microcontinents (Figure 6 D). Polarity reversal of subduction, and the onset of subduction towards the north under the Keitele microcontinent, was also initiated at ca. 1.90 Ga (Figure 6 D). Subduction under the Keitele microcontinent locked up and the ocean basin was consumed by subduction towards the south under the combined Uusimaa island arc and the Bergslagen microcontinent (Figure 6 E, F).
The Bergslagen microcontinent started to accrete from the south due to consumption of the ocean by subduction at ca. 1.88 Ga. VMS formed in extensional settings within continental margin arcs within the Bergslagen continent. The peak of the Svecokarelian Orogeny at ca. 1.88 to 1.87 Ga in the eastern part of the shield (Finland) involved a strong compressional stage. The Keitele–Bergslagen collision resulted in substantial shortening within the collision zone, overthrusting at the western margin of the Karelian craton, basin inversion in Lapland, and reactivation of the Lapland–Savo suture zone. Subduction beneath the Bothnian microcontinent was still active. Subduction towards the east under the Norrbotten microcontinent commenced and local extensional domains in the Kola and Belomorian areas were initiated (Figure 6 F, G).
5.1.3 Continent–continent collision at 1.87 to 1.79 Ga
There is evidence of scattered magmatism as well as deformation and metamorphism that could finally have peaked in the western part of the Svecofennian Shield and the Skellefte District between 1.84 and 1.82 Ga (Weihed et al., 1992). Migmatites with granitic leucosomes associated with S-type granites of the second granite generation formed in the area of the Bothnian Basin between 1.82 and 1.80 Ga (Claesson and Lundqvist, 1995) and attest of the highest metamorphic grade which dies out to lower amphibolite and greenschist facies toward the Skellefte District to the north-west. The presence of the high metamorphic grades in the Bothnian Basin area is explained by the conjugation of the northward collisional movement of the Bothnian and Keitele microcontinent together with a transpressional shear zone to the east (Weihed et al., 2005).
Finally, the collision phase ended with amalgamation and cratonization at about 1.79 Ga, after the onset of the Nordic Orogeny at 1.82 Ga to the west of the Fennoscandian Shield (Figure 6 J, K, L). From 1.80 to 1.77 Ga, in central Sweden and the Skellefte District, the Revsund granitic suite intruded in a mature continental crust. They comprise granites and

16
granodiorites of both I- and A-type, formed at a deeper crustal level than the previous S-type second-generation granites (Weihed et al., 1992). Claesson and Lundqvist (1995) suggest that the suite coincident with the peak of cratonization.
Figure 6 - The geodynamic evolution of the Fennoscandian Shield between 2.06 and 1.78 Ga (from Weihed et al., 2005; after Lahtinen et al., 2005).
17
5.2 The Bothnian Basin
The Bothnian Basin, which formed during the Svecokarelian Orogeny (Kousa & Lundqvist, 2000) and constitutes a major part of the Fennoscandian Shield, is part of the juvenile Palaeoproterozoic units (Svecofennian). There is no documented Archaean basement. In northern Sweden these rocks are confined to the area south of the Archaean-Proterozoic palaeoborder: the Luleå-Jokkmokk line. The Bothnian Basin is limited to the north and to the south respectively by the Skellefte and the Bergslagen Proterozoic volcanic arc coinciding with ancient subduction zones. At least part of the Bothnian Basin rocks may constitute a basement to the ore-bearing Skellefte district to the north, emplaced between 1880 and 1890 Ma. The latter consists of marine, mainly felsic, meta-volcanic, interbeded with sedimentary rocks, hosting many massive sulphide deposits and which may have formed in a continental margin arc.
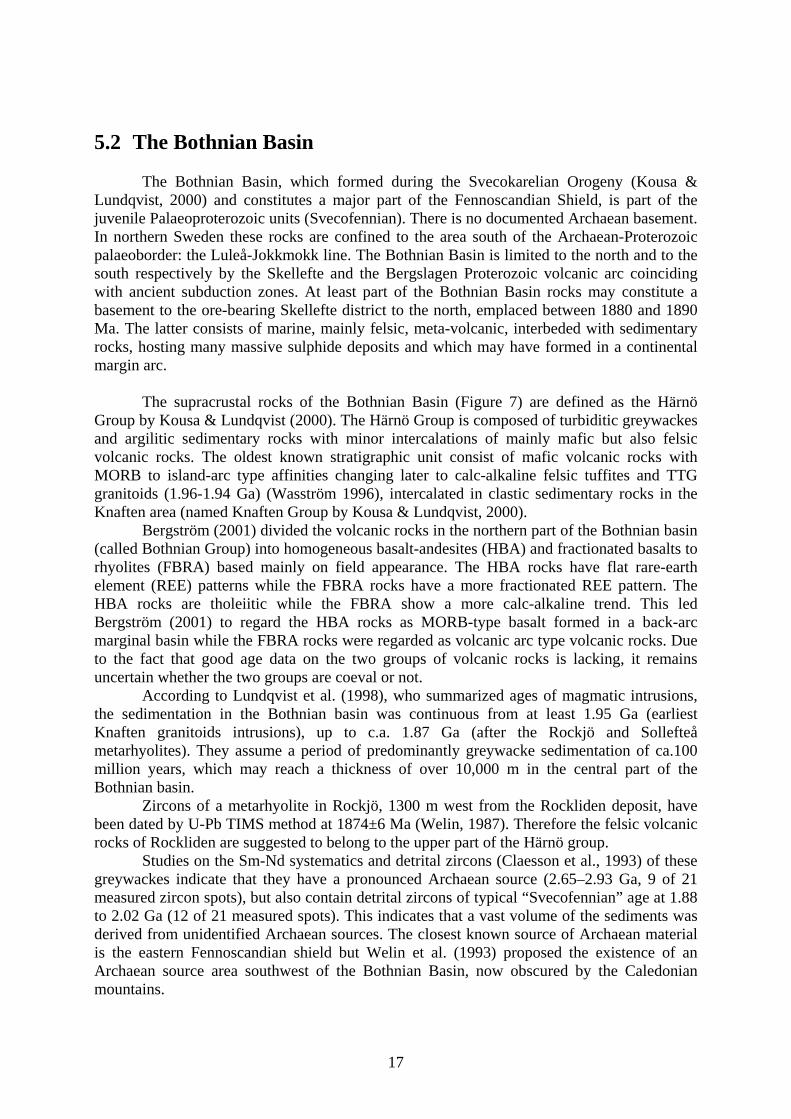
The supracrustal rocks of the Bothnian Basin (Figure 7) are defined as the Härnö
Group by Kousa & Lundqvist (2000). The Härnö Group is composed of turbiditic greywackes and argilitic sedimentary rocks with minor intercalations of mainly mafic but also felsic volcanic rocks. The oldest known stratigraphic unit consist of mafic volcanic rocks with MORB to island-arc type affinities changing later to calc-alkaline felsic tuffites and TTG granitoids (1.96-1.94 Ga) (Wasström 1996), intercalated in clastic sedimentary rocks in the Knaften area (named Knaften Group by Kousa & Lundqvist, 2000).
Bergström (2001) divided the volcanic rocks in the northern part of the Bothnian basin (called Bothnian Group) into homogeneous basalt-andesites (HBA) and fractionated basalts to rhyolites (FBRA) based mainly on field appearance. The HBA rocks have flat rare-earth element (REE) patterns while the FBRA rocks have a more fractionated REE pattern. The HBA rocks are tholeiitic while the FBRA show a more calc-alkaline trend. This led Bergström (2001) to regard the HBA rocks as MORB-type basalt formed in a back-arc marginal basin while the FBRA rocks were regarded as volcanic arc type volcanic rocks. Due to the fact that good age data on the two groups of volcanic rocks is lacking, it remains uncertain whether the two groups are coeval or not.
According to Lundqvist et al. (1998), who summarized ages of magmatic intrusions, the sedimentation in the Bothnian basin was continuous from at least 1.95 Ga (earliest Knaften granitoids intrusions), up to c.a. 1.87 Ga (after the Rockjö and Sollefteå metarhyolites). They assume a period of predominantly greywacke sedimentation of ca.100 million years, which may reach a thickness of over 10,000 m in the central part of the Bothnian basin.
Zircons of a metarhyolite in Rockjö, 1300 m west from the Rockliden deposit, have been dated by U-Pb TIMS method at 1874±6 Ma (Welin, 1987). Therefore the felsic volcanic rocks of Rockliden are suggested to belong to the upper part of the Härnö group.
Studies on the Sm-Nd systematics and detrital zircons (Claesson et al., 1993) of these greywackes indicate that they have a pronounced Archaean source (2.65–2.93 Ga, 9 of 21 measured zircon spots), but also contain detrital zircons of typical “Svecofennian” age at 1.88 to 2.02 Ga (12 of 21 measured spots). This indicates that a vast volume of the sediments was derived from unidentified Archaean sources. The closest known source of Archaean material is the eastern Fennoscandian shield but Welin et al. (1993) proposed the existence of an Archaean source area southwest of the Bothnian Basin, now obscured by the Caledonian mountains.

18
Early-orogenic granitoids (1.96-1.85 Ga in the Swedish part of the Bothnian Basin) are normally gneissic or more or less intensely foliated, in places augen-bearing or migmatised. Their composition is normally tonalitic-granodioritic, but diorite gabbros and ultramafic intrusions of similar ages also occur (Kousa and Lundqvist, 2000).
During the Svecokarelian orogeny 1.87-1.82Ga, with a peak of between 1.84 and 1.82Ga, a vast part of the Bothnian basin was metamorphosed in the upper amphibolite grade and migmatites are common. Generally the grade is decreasing towards the Skellefte district which is largely well-preserved in greenschist to lower amphibolite facies
Figure 7 - General stratigraphy of the Bothnian Basin. (compilation based on Lundqvist et al. (1998), Mattsson
& Heeroma (1985), Söderlund et al., (2006), Wasström (1996), Weihed et al. (1992), and Welin (1987)). The stratigraphy of the VMS bearing Skellefte district (from Weihed et al. 1992) to the north is shown for
comparison.
An alternative interpretation of the Svecofennian evolution is given by Skiöld &
Rutland (2006), who suggest that the most extensive NE trending (D1) deformation, metamorphism and migmatisation took place in older metasedimentary sequences before the eruption of the ~1,90-1,87 Ga volcanic sequence. This most important crustal thickening episode, distinguished as the early Svecofennian orogenic episode between 1.92-1.91 Ga and coeval to the Vammala Migmatite Belt (VMB) in Finland, should be due to the accretion of a pre-1.92 Ga large (Svionian) marginal basin (Skiöld & Rutland, 2006). Overprinting EW shears (D2) are allocated to a second and Middle Svecofennian orogenic episode between 1.88-1.85 Ga, affecting a wide area (Skiöld & Rutland, 2006).
The latter hypothesis by Skiöld & Rutland (2006) might explain why the sedimentary rocks south of the Rockliden felsic volcanic rocks are migmatised while the sedimentary rocks to the north, possibly younger and stratigraphically above the ~1.87 Ga volcanic rocks, only show greenschists metamorphic grades.
v v
+
+
+ + + +
+ +
+
+ +
+
+ + + +
+ 1.80-1.78 Ga
1.25 Ga
1.82-1.80 Ga
1.87 Ga ?
1.874 Ga
End of sedimentation
Rockliden felsic volcanic rocks Early orogenic intrusions
Revsund granite
Härnö granite
Härnö group 2.0-1.87 Ga
Volcanic Knaften Group 1.95 Ga
Svecokarelian Orogeny 1.87-1.82 Ga
Volcanic Bothnian Group
Dolerite dykes 1.25 Ga
Metamorphism

19
Late-orogenic, 1.82-1.80 Ga, S-type, Härnö granite is also common in the Bothnian Basin. It is a minimum melt granite with associated pegmatites, often Li and Sn rich. Claesson and Lundqvist (1990) suggested that it could have been formed by partial melting of an average Bothnian Basin greywacke due to the high metamorphic conditions.
The 1.81-1.77 Ga post-orogenic Revsund granitoids (Billström and Weihed, 1996) cover the largest area of the Bothnian Basin. It is an A-to I-type granitoids formed deeper and at higher temperature than the Härnö granite (Claesson and Lundqvist, 1995).
Anorogenic rapakivi complexes (1.70-1.50 Ga granite, gabbro and leucogabbro) occur as minor intrusion complexes in the southern half of the Swedish part of the Bothnian Basin, Ahl et al., (1997).
The youngest intrusions in the Bothnian Basin are 1.27-1.22 Ga dolerite dykes belonging to the Central Scandinavian Dolerite Group (CSDG). In Västerbotten country those intrusions are dated at about 1.26 Ga and in the Jämtland country about 1.25 Ga, (Söderlund et al., 2006) respectively north and south of Rockliden. They can have formed in two plausible tectonic settings: either a mantle plume tail activity beneath the Fennoscandian lithosphere or during a discrete extension behind the Laurentia-Baltica active margin (subduction), (Söderlund et al., 2006).

20
6 Geology of the Rockliden VMS deposit 6.1 Local geology of the Rockliden area
Geological information about the Rockliden area mainly come from Mattasson & Heeroma (1985) and the geological map of the Västernorrland country, Lundqvist et al. (1990).
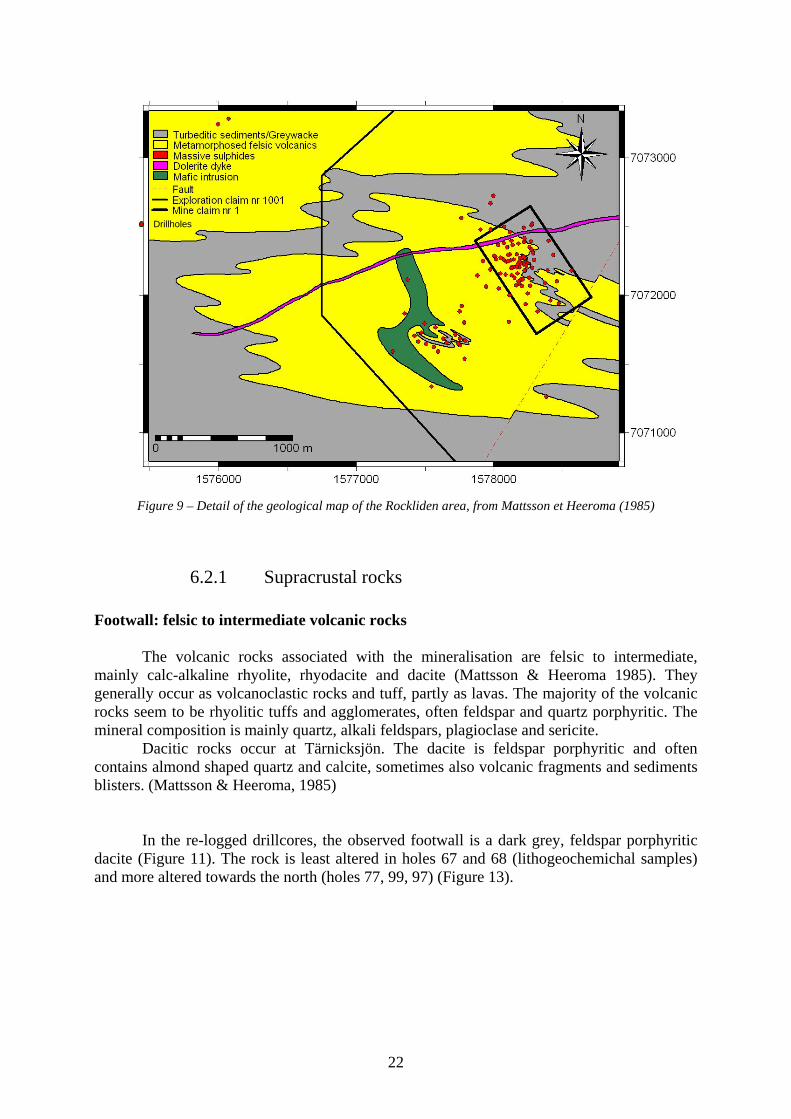
The greywackes and felsic to intermediate volcanic rocks in the Rockliden area (Figure 8 and 9) constitute mainly low regional metamorphic grade compared to the rest of the surrounding rocks of the Bothnian Basin. It is surrounded by granites on the northern and western side, and by gneissified and migmatised greywackes on the southern and eastern side. Several mafic intrusions also appear in the Rockliden area. Mattsson & Heeroma (1985) noted that the shales around Rockliden show magnetic and electromagnetic structures due to their content in graphite and pyrrhotite, geophysical signatures which have not been observed outside the Rockliden area (or it may be that the Rockliden area is composed of different rocktype at a different stratigraphic level).
The geological structures are often oriented in an EW direction and are steeply dipping. At least two deformation phases, with a steep axial plan have been identified. The first has a NS-trend and the second an EW-trend (Mattsson & Heeroma 1985). The interference of these two phases produces domes structures, this geometry can be observed at a large scale on the contact between the volcanic rocks and the metasediments. These structures are complicated by faults with NW-SE and NE-SW trends. Dolerite intrusions coincide with the NE-SW direction. 6.2 Stratigraphy
A felsic volcanic sample from Rockjö, 1300 m west of Rockliden, has been age
determined at 1874±6 Ma (U-Pb age on Zircon by Welin, (1987)). It is thought that this sample is part of the Rockliden deposit footwall. Metavolcanic rocks at Rockliden are composed of felsic to intermediate volcanic rocks situated in the upper part of the Bothnian supracrustal sequence. The hanging wall is composed of the same metamorphosed shales and turbiditic greywackes that have continued to deposit after the volcanic episode in the upper part of the Härnö group. The Rockliden massive sulphides are believed to be a seafloor deposit formed as one single lens at the contact of the volcanic rocks and the sedimentary rocks. Basaltic lava in the middle of the sedimentary rocks overlying the Rockliden ore, associated with uneconomic sulphides mineralisation (pyrite and pyrrhotite), was observed south of Solberg (Mattsson & Heeroma, 1985).
In the area several types of intrusions occur. Early orogenic gabbro, diorite, and ultrabasite, and at about the same time granitoids which were metamorphosed during the Svecokarelian orogeny. The Härnö granitoids are late orogenic and the Revsund granitoids post orogenic intrusions. Late dolerite dykes associated with NE-SW fracture zones (Mattsson & Heeroma, 1985) intruded around 1250 Ma (Söderlund et al, 2006).
The description of the various rocktypes in this chapter is mainly based on drillcore observations and findings by Mattsson & Heeroma (1985). A stratigraphic column is presented in Figure 10.

21
Figure 8 – Geological map of the Rockliden area, Mattsson & Heeroma (1985)
v
22
Figure 9 – Detail of the geological map of the Rockliden area, from Mattsson et Heeroma (1985)
6.2.1 Supracrustal rocks Footwall: felsic to intermediate volcanic rocks
The volcanic rocks associated with the mineralisation are felsic to intermediate, mainly calc-alkaline rhyolite, rhyodacite and dacite (Mattsson & Heeroma 1985). They generally occur as volcanoclastic rocks and tuff, partly as lavas. The majority of the volcanic rocks seem to be rhyolitic tuffs and agglomerates, often feldspar and quartz porphyritic. The mineral composition is mainly quartz, alkali feldspars, plagioclase and sericite.
Dacitic rocks occur at Tärnicksjön. The dacite is feldspar porphyritic and often contains almond shaped quartz and calcite, sometimes also volcanic fragments and sediments blisters. (Mattsson & Heeroma, 1985)
In the re-logged drillcores, the observed footwall is a dark grey, feldspar porphyritic
dacite (Figure 11). The rock is least altered in holes 67 and 68 (lithogeochemichal samples) and more altered towards the north (holes 77, 99, 97) (Figure 13).
Drillholes

23
Figure 10 – Generalized Stratigraphy of the Rockliden deposit area, modified from Mattsson & Heeroma 1985
B B
+ + + + + + + + + + + + + + + + +
+ + + + + + + + + + + +
~1.25 Ga (Söderlund et al. 2006)
Post orogenic 1.81-1.77 Ga (Claesson & Lundqvist, 1995)
Late orogenic 1.82-1.80 Ga (Claesson & Lundqvist, 1990)
Svecokarelian Orogeny 1.87-1.82 Ga (Kousa & Lundqvist, 2000)
Early orogenic intrusions > 1.85 Ga (Kousa & Lundqvist, 2000)
1874±6 Ma (Welin, 1987)
Gneissic granitoids
Gabbro, diorite, ultrabasite
Dolerite dikes
Revsund granite
Härnö granite
Basalt associated with non economic
sulphide mineralisation
Hanging wall: Greywackes and shales Mineralisation: Massive sulphides
Footwall: Felsic volcanic rocks
Greywackes and shales of the Härnö Group
Unknown basement
1.95-1.87 Ga (Lundqvist et al., 1998)

24
Two thin sections have been made from 7 and 32 m in hole 97 in order to describe the
footwall. The ground mass is composed of holocrystalline quartz mainly. It contains 3-5m silicified feldspars either phenocrysts or fragments and locally bigger 3-4 cm rockclasts can be seen. The fine grained ground mass and therefore more easily altered than the clasts, contains little sericite and minor chlorite. In the ground mass patches of sulphides have preferentially replace mafic minerals. However the rock still looks relatively unaltered.
Figure 11 – Macroscopic and microscopic view of the footwall from drillhole 97
The footwall described above, with feldspar phenocrysts and few mafic minerals is
likely to have a dacitic composition with an autoclastic breccia texture. More information about the dacite is given later with the results of the lithogeochemical analysis from hole 68. (see §8 p43). Hangingwall : Turbiditic sediments
The sediments stratigraphically above the mineralisation are siliciclastic. They are composed of dark shales, to more sandy layers with turbiditic sequences. The original sedimentary bedding outlined by grainsize variations can vary between mm to m layers. Younging direction is generally towards north, which is important for the interpretation of the tectonic structures. Usually the thinner beds have the finer grainsize and the thicker beds have coarser grainsize. Mattsson & Heeroma (1985) noticed that the arenitic part of the sedimentary rocks have a high content in volcanic products. The shales sometimes contain pyrrhotite but no metals of economic interest.
The sedimentary material in the Bothnian basin probably originates from continental margins to the north and to the south. Fine-grained argilitic sediments were deposited in deep marine environment offshore, below the limits of the wave’s action (ca. 200 m). More coarse-grained greywackes can be explained by turbiditic flows. Basalt
A small area of seafloor basaltic lava has been observed south of Solberg (Mattsson & Heeroma, 1985). The rock is sometimes brecciated and silicified with sulphide mineralisation (pyrite and pyrrhotite) but not of an economic interest. A chert horizon is overlying the sulphides. High-grade regional metamorphism changed the sediments into micaschists and the basalt into amphibolite.
1 cm 5 mm
25
6.2.2 Svecokarelian early orogenic intrusions
In the Rockliden area, the early-orogenic intrusions are of two types, but non is dated. They must have intruded in the sedimentary rocks before the peak of metamorphism, estimated at 1850-1825 Ma (Västernorrland geological map by Lundqvist 1990) and after deposition of the Rockliden volcanic rocks. Claesson and Lundqvist (1990) dated an early-orogenic tonalite in Sollefteå at 1877±6 Ma. Mafic intrusions
The earlier field studies on Rockliden have identified intrusions of gabbros, diorites and ultrabasites with sometimes peridotite in the most basic parts. These intrusions are found mainly in the sedimentary rocks west of Rockliden, but also at Skravelåsen in the central part of the felsic volcanic rocks.
Thin mafic dykes are regularly encountered in the drillcores (varying from a few dm to m in width). They are greenish-blue, altered and deformed during regional metamorphism. The coarse grained texture and the absence of chilled margins assets that they have intrude a relatively deep and hot environment. Granitoids
From the NW to the south of the Rockliden area, a grey, medium grained and gneissic granite which can also contain feldspars megacrysts occur (Mattsson & Heeroma, 1985). It is part of the erly-orogenic intrusive suite. These granitoids have not been observed in the drillcores.
6.2.3 Svecokarelian late and post orogenic intrusions
The late-orogenic (1.82-1.80 Ga) S-type Härnö granite (Claesson & Lundqvist, 1995) is greyish white to grey and fine to medium grained with small to coarse microcline phenocrysts. The granite often contains muscovite and commonly dykes as well as pods of pegmatites. It often also contains metasediment and gneiss fragments. The granites can contain graphite, of which the source is interpreted to be partly melted sedimentary rocks (Mattsson & Heeroma, 1985). The Härnö granite outcrops north of Rockliden, and in one locality to the south.
The post-orogenic (1.80-1.78 Ga) A- to I-type Revsund granite (Claesson &
Lundqvist, 1995) is grey to red and strongly microcline-porphyritic. It is commonly biotite and hornblende bearing monzogranitoids, volatile poor. It is outcropping over larger areas than the Härnö type in the Bothnian Basin. In the Rockliden area the Revsund granite outcrops a bit further away towards the west, north and east.
The late and post orogenic intrusions have not been observed in the drillcores.

26
Dolerite dykes
The youngest intrusions are the dolerite dykes which cross-cut all other mentioned rocktypes. They have an ENE-WSW direction, are steeply dipping and linked to a fault network. Field evidences show that the dolerite has intruded in different pulses during faults reactivation (Mattsson & Heeroma, 1985).
A 20-30 m thick dolerite dike cuts the Rockliden felsic volcanics. It is strongly feldspar and mafic crystals porphyritic, with a doleritic texture. The intrusion has chilled margins (± 5 m) where the crystals are progressively smaller and isolated. Smaller dolerite dykes have generally a greenish-brown-purple and aphyric groundmass, and 0.5-1 mm pyroxenes crystals and in places very thin feldspars needles less than 1 mm in size. They can also contain ± 1 mm rounded amygdules filled with carbonate-quartz. These textures and the intrusion along faults would favour a setting in a colder, brittle crust at the time of the emplacement.
The dolerite dykes are not metamorphosed. They are much younger and post-orogenic, but they are generally more fractured and partially altered to clay minerals. It can be explained by the fact that the NE-SW faults network weaknesses used by the dolerites to intrude have later been reactivated. The dykes were crushed and the faults drained surficial waters leading therefore to stronger clay alteration. 6.3 Alteration
The alteration related to the mineralisation is mainly sericitic and chloritic in the central part. The altered zone is often irregular and with varying amounts of sulphides (pyrite, pyrrhotite, chalcopyrite and sphalerite) impregnations. The sericite alteration is the most extensive in Rockliden and can reach tens of meters in the central part. The sericite alteration is generally becoming more quartz-sericite dominated close to the mineralisation. Chlorite alteration can also reach several meters in thickness and is believed to be the centre of the deposit and maybe the alteration pipe. The most proximal alteration has been identified in the central part just below the massive sulphide lenses (holes 70, 80). It consists of a few dm to meters of dark green and very soft altered rock, mainly composed of chlorite also contains red garnets (not observed elsewhere), which are signs of intense hydrothermal alteration. Previous chemical analyses (Mattsson & Heeroma, 1985) show a decrease of SiO2 and Na2O in the felsic footwall, and an increase of Al2O3, K2O, Fe and S, due to the destruction of feldspars and formation of sericite and sulphides.
In more distal parts (e.g. holes 68, 67) the rock is silicified to a large extent (hundreds of meters) with locally carbonate-altered zones with unknown shape. The proximal quartz-sericite alteration is restricted to the few meters below the ore, the chlorite alteration less than dm.
A narrow sericitic alteration can sometimes be observed in the sediments directly overlying the massive sulphides. A SiO2-rich chert horizon has also occasionally been noted (Mattsson & Heeroma, 1985) generally higher the sedimentary rocks.
The vicinity of fault zones can also show an alteration of the footwall. In the top 50 m,
the supergene alteration colours the rock red because of the iron oxides and hydroxydes produced. The main NE-SW fault (Figure 16) shows tectonic breccias in the fault zone and intense silicification and bleaching, signs of fluids circulation.
27
6.4 Characteristics of the mineralisation
It appears, with the current knowledge of the deposit, that the ore body is a unique lens situated at the contact between the felsic volcanic rocks and the sedimentary rocks and has a continuous extension.
The ore is generally rich in zinc, copper and silver, but less in lead. The main sulphide minerals observed were pyrite, pyrrhotite, chalcopyrite and sphalerite. From previous chemical analysis (Mattsson & Heeroma 1985), it can also contain high level of arsenic and antimony; occasionally crystals of arsenopyrite have been observed.
Several sulphides occurrences, up to 10 m thick, were also observed in the black shales (e.g. in hole 70). The sedimentary rocks on both sides of the sulphide occurrence have the same younging direction. They are unaltered and show a sharp contact with sulphides. Margins usually have more brecciated texture of sulphides and are pyrrhotite and chalcopyrite rich. This texture and mineral assemblage can be interpreted as a remobilisation because chalcopyrite is an easily remobilised sulphide and secondary pyrrhotite can be formed from pyrite by loss of sulphur.
The usual depositional zonation with a copper-rich bottom of the lens and zinc-rich top was not evident, maybe because the study was focused on a too small scale and on a limited amount of holes. The effects of deformation and metamorphism will also be discussed later. However Mattsson & Heeroma (1985) in their study described a zonation (Figure 12) of ore body from a study in holes 14 and 19 as follows.
6.4.1 Previous ore mineralogy study Impregnation ore
The altered volcanic rock under the ore hosts a variable pyrrhotite and pyrite impregnation. The central upper part of this zone is chalcopyrite and arsenopyrite rich with little sphalerite. The Cu rich part also contains 50g/t Ag and low Sb concentrations. Massive non-banded ore
Central and above the impregnation ore occurs with a limited thickness of more or less massive not banded ore which sometimes contains volcanic fragments. This ore contains Cu and As, some Ag and Zn and low Sb values. The more important minerals are pyrite, pyrrhotite, chalcopyrite, arsenopyrite and sphalerite. Massive banded ore
Above the non-banded ore the banded one is defined by the alternation of sphalerite and pyrite rich bands. The Ag and Zn content are higher, and Zn which increases from 1% to 7-8%. The Sb content is also higher, from c.a. 100 ppm to 0.5%. The main minerals are pyrite, sphalerite, chalcopyrite, galena, and tetrahedrite. Besides tetrahedrite, Sb occurs in gudmundite and bournonite. Ag is mainly in tetrahedrite with concentration ranging from 1 to 8% in the mineral.

28
The probable more distal part of the mineralisation (more to the northwest in hole 19)
has a somewhat different composition. The Zn and Pb content are usually slightly higher. Main minerals are pyrite, pyrrhotite, sphalerite, chalcopyrite, galena and tetrahedrite. Ag rich (up to 15%) tetrahedrite is generally common in the upper part. Sb grades are lower while Ag stays high. Upper non-banded ore
A non-banded ore with rounded massive sulphides fragments occur in the central part. Some of the fragments occur in fine-grained massive arsenopyrite. It could be a mixture of the non-banded ore and the lower part of the banded ore. The ore show signs of erosion and fragmentation. Tentatively the original ore was uplifted, eroded and deposited on top of the massive sulphide lens.
Figure 12 – Schematic metals zonation in the reconstituted ore body of Rockliden, from Mattsson & Heeroma (1985)
6.4.2 Modal mineral composition
According to Mattsson & Heeroma (1985), the modal mineral composition of the massive mineralisation is (Table 2): Table 2 - Modal mineral composition from Mattsson & Heeroma (1985)
Pyrite Pyrrhotite Sphalerite Chalcopyrite Arsenopyrite Galena Silicates
40 % 21 % 14 % 6 % 2 % 1 % 16 % Mattsson & Heeroma (1985) also noted that part of the pyrrhotite is secondary and
derived from the metamorphism of pyrite. Magnetite has also been observed and was interpreted as secondary. Thus the non metamorphosed ore was richer in pyrite and poorer in pyrrhotite.
Felsic volcanic rocks
Massive sulphides ore banded/ not banded “chert” horizon
Greywacke and shales
Impregnation ore
Metal zonation

29
6.4.3 Recent mineralogical analysis from copper concentrate
The mineralisation in Rockliden contains high concentrations of antimony and arsenic, which is not suitable for exploitation (0.18% Sb, 0.71% As, (Mattsson & Heeroma, 1985) and roughly 0.15%±0.18 Sb and 0.34%±0.71 As in Table 4 p. 36). It is important to know which mineral contains Sb and As, so they can be removed from the concentrate. Mineralogical studies by Scanning Electron Microscopy have been carried out in 2008 on a copper concentrate made from outcropping massive sulphides (Bolin, 2008). The main findings are as follows:
- Most of the antimony (90%) is in tetrahedrite (Cu,Fe,Ag,Zn)12Sb4S13, the rest in the Bournonite PbCuSbS3, traces in arsenopyrite Fe(As,Sb)S.
- Arsenic is in Arsenopyrite FeAsS, which can also contain some antimony. - Silver is in tetrahedrite with antimony.
6.5 Structures
The geological structures formed during the Svecokarelian orogeny (1.87-1.82 Ga) are often oriented in an EW direction and are steeply dipping. At least two deformation phases, with a steep axial plan have been identified (Mattsson & Heeroma, 1985). One has a NS trend and the other an EW trend. The interference of these two phases produced a dome structure. This geometry can be observed on a large scale at the contact between the volcanic rocks and the sedimentary rocks. Folds with an EW trending fold axes direction have been interpreted in the cross sections and map levels; they are usually associated with faults in the same EW direction (Figure 16 p. 34).
These structures are complicated by faults with NE-SW to ENE-WSW trends. One major fault of this NE-SW direction, with tens of meters of apparent displacement, brings volcanic rocks contact with sedimentary rocks. It is steeply dipping to the NW (more than the apparent dip in the cross sections). There are several smaller faults with the same direction. As mentioned above, all those faults are late and probably synchronous with the dolerite dykes intrusions (1250Ma). 6.6 Metamorphism
The Rockliden area is metamorphosed in greenschist facies. A lower metamorphic grade compared to the common regional metamorphism in The Bothnian Basin, ranging from lower amphibolite facies to upper amphibolite or lower granulite facies. The regional metamorphic grade decreases in the Bothnian Basin towards the north were the Skellefte district is well preserved in middle to upper greenshist facies. (Mattsson & Heeroma, 1985)
Some zones (deep in holes 110, 114 e.g.) of hydrothermal chlorite alteration linked to the VMS system contain neoblasts of andalusite and biotite, due to a higher grade at depth.
The different sulphides react differently to the metamorphism. Some are more ductile and can recrystallize. Pyrite stays brittle until high metamorphic grades, while chalcopyrite and galena are ductile at a low grade. Pyrrhotite and sphalerite have intermediate behaviours. These different behaviours can favour enrichment in Cu-Pb sulphides in isoclinals folds hinges. Pyrrhotite can easily be derived from primary pyrite during metamorphism by sulphur loss (which was in fact observed in Rockliden by Mattsson & Heeroma (1985), see §6.4.2.)

30
6.7 Cross sections
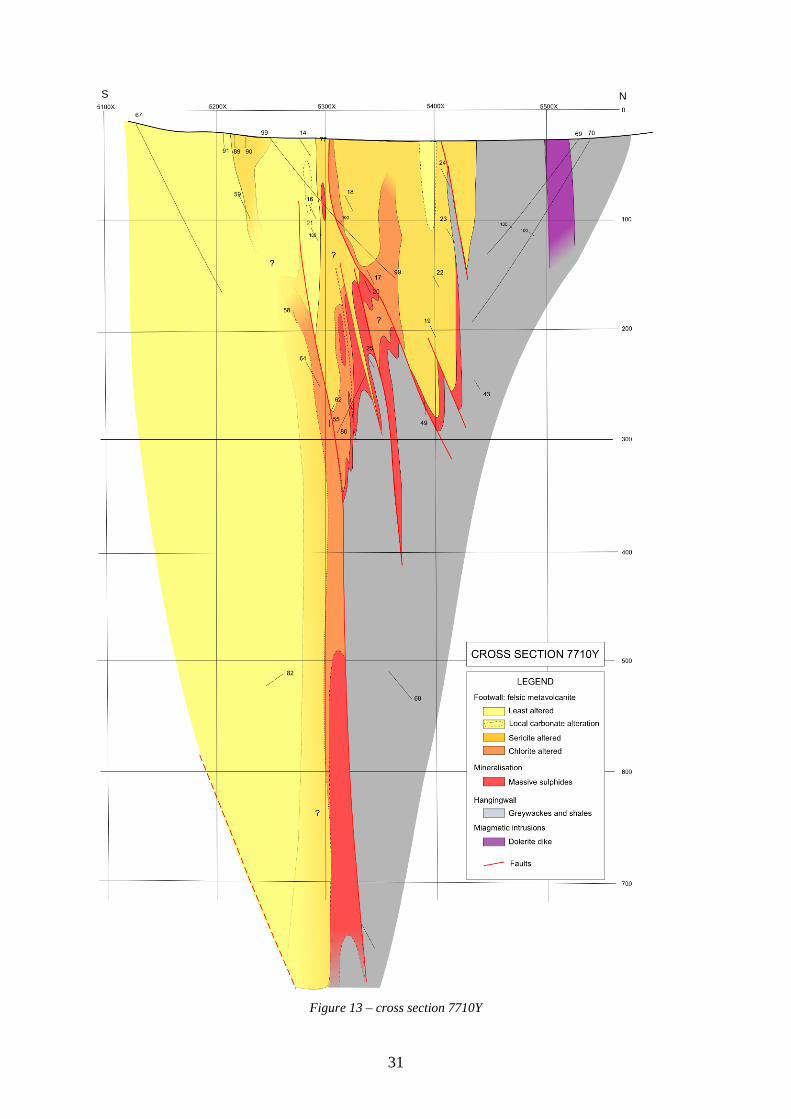
The detailed geometry was interpreted on vertical cross sections (Figures 13-15), roughly perpendicular to the EW structures and horizontal map levels. The initial cross section was divided in 3 parallel profiles because of the complicated and changing structures and the deviation of the holes which are not always parallel to the sections. A 30 m wide section was too thick for a proper representation of structures which have a limited EW extension and whose orientations are not perpendicular to the profile. The sections centred on Y coordinates 7710, 7720 and 7730 m have an interpretation thickness of 10 m (5 m on each side). Outlines of the drillholes are represented in this 10 m interval in each section. Map levels were made each 10 m. Levels 100, 190 and 290 m are showed below. There is less information at depth because of the limited amount of deep drillholes, therefore the degrees of details and confidence decrease at depth. When interpreting the geology, in order to have a continuous and coherent model over the whole depth, the steeply dipping EW structures were vertically connected. Description of the sections follows and more interpretation will be discussed later.
One big fault can be followed from the middle of the sections towards the north, cutting all other structures. It is a late fault with a NE-SW trend and steeply dipping towards the NW. A parallel fault exists towards the south and probably cuts the cross sections below 400 m. Several smaller faults are situated south of the late fault, in the central part of the deposit. They have a more EW trend and are more steeply dipping and associated with the EW folds.
The dacitic footwall is situated in the southern part of the cross section. The sedimentary rocks of the hangingwall are situated in the northern part. In the whole section the sulphide lens is continuous (except locally due to faulting) and can be followed at depth. However its thickness varies. In the upper part, the sulphides have a maximum thickness of ca. 10 m and the lens disappears towards the north in holes 62, 23, 24. The thicker intersections in the central upper part (holes 62, 81) are due to repetition and deformation of the same lens by tectonism. Below 400 m there are thick intersections, e.g. more than 50 m of massive sulphides in drillcore 114. The same thick intersections exist more westward in the section roughly under X5400 (recent holes 107 to 111). More drilling is needed to confirm the continuation of this thicker lens at depth. In the eastern part, isolated lenses in the sedimentary rocks cross-cut in the drillcores are believed to be tectonically emplaced. The extent of the mineralisation is still opened at least to the west and at depth. Between 5300X and 5400X and west of the 7700Y grid, few drillcores exist and they have not been re-logged. Therefore the extent of the mineralisation west of 7700Y and the extent and type of alteration is unknown (questions marks on horizontal cross sections, Figure 16).
A thick 20-30 m dolerite dike intrudes the sedimentary rocks (holes 69, 70). Thinner mafic and dolerite dykes intrude all other rocktypes, but were too thin and difficult to connect between drillholes to be represented.
The hydrothermal alteration, sericite and chlorite, increases towards the mineralisation. 69, 70, 62 and the end of core 99, 97 and 77, north of 5300Y, are more altered than the cores 67, 68 to the south and the beginning of cores 99, 97, 77. This zone is believed to be the main alteration pipe. Between 5300X and 5200X, local more strongly altered zones have been identified in old logs. There are two zones, one around holes 89, 90, 91, 59 and one around holes 58, 64. Their geometry is not well understood.
31
Figure 13 – cross section 7710Y
N S

32
Figure 14 – Cross section 7720Y
N S

33
Figure 15 – Cross section 7730Y
N S

34
Figure 16 – Map levels around the central part of the deposit at 100, 190 and 290m depth
N
35
6.8 Discussion of the cross sections Alteration
The locally more strongly altered zones in the otherwise unaltered footwall were identified from old log data that have not been re-logged, so the type of alteration is relatively uncertain. The two elongated zones do not seem to be connected but rather to be parallel in an EW direction. They might be alteration pipes related to different, deeper and/or eastward parts of the mineralisation: for instance, alteration can be related to the mineralisation in the recent deep drillholes 107 to 111 and 114 which have thick massive sulphides intersection and extensive chlorite alteration in the footwall rocks. This locally strong alteration (sericite and chlorite reported in the database) might also be linked to faults.
There is also little local alteration in the sedimentary rocks directly above the mineralisation. The alteration is stronger in a tuff-like layer compared to the fine grained sedimentary rocks, possibly because of the chemical composition and the higher permeability. Structural interpretation
Due to differences in reology, the massive sulphide lenses were folded with longer amplitude and shorter wavelength compared to the footwall, which makes them pinching out tens of meters into the sedimentary rocks (towards the east). The deformation started ductile, thickening the sulphides lenses at folds hinges and thinning them along the flanks, subsequently accentuated by faulting along the flanks, parallel to the folds axes during the most intense deformation stage. These faults might also have been more recent. Some faults remobilized the sulphides into the sedimentary rocks, which are thus not recognized as different lenses in the sedimentary rocks. Another reason is that the sedimentary rocks surrounding the ore are unaltered, or very little. Sometimes the pinch out is asymmetric, with a tip of volcanic rocks at the root, ripping the softer sedimentary rocks and pushing sulphides inside. There are in places volcanic rocks and sulphides in the middle of unaltered sedimentary rocks that are not connected to the ore lens. This is interpreted as a fold that has been stretched and faulted, until the hinge was isolated in the sedimentary rocks and the two flanks were connected.
These structures are complicated by faults with NW-SE and NE-SW trends. One major fault striking in this direction, with tens of meters of apparent displacement, brings volcanic rocks in contact with sedimentary rocks (Figure 16). It is steeply dipping to the NW (more than the apparent dip in the cross sections). The movement might be dextral and normal and it may have moved the main alteration pipe to the northeast. There are several other faults with the same direction. The location of the major NE-SW fault might be linked to the weakness of the altered rock in the pipe. All these faults are late and probably synchronous with the dolerite dyke intrusions (1250Ma). They might have somewhat changed the orientations, squeezed or reactivate the previous geological structures especially close to the largest fault.

36
7 Assays statistics of the mineralisation
Gold grades are low in Rockliden, the average in the massive sulphides is 0.1g/t. but silver is high with an average of 100 g/t with more than 60% of the samples evenly distributed below this value and then less and less frequent higher values up to 500 ppm.
The copper content ranges from 0 to 26 %. The mode of its distribution is between 0.5 and 1%, and more than half of the samples are below 2% of Cu. The average is at 2.54%.
Zinc is generally the richest metal in the samples, ranging from 0 to 20%. It has a mode around 6 % and is often present in high concentration. 60% of the samples have between 4 and 9% of zinc.
In general the content in lead is low, 5% maximum, in more than 60% of the samples the lead is below 1%, more than 20% below 0.1%.
Concentrations of Arsenic are between 0 and 3.6%. The mode of the distribution is between 0.2 and 0.4%. The average is at 0.44%, the median at 0.62%.
Antimony is always present, and sometimes with high concentrations ranging from 0.5 to 1%. Half of the samples have Sb concentrations below 0.1% (and 35% below 0.02%) but the other half present high values up to 1% Sb and 30% of the samples are over 0.2% of Sb. The average is at 0.15%.
(See figures below in Table 3-4 and graphical results given as histograms in Figure 17) Table 3 – Basic statistical values for analysed elements in mineralised sections above 25 wt.% of S.
> 25% S Section (m)
Au (g/t)
Ag (g/t)
Cu (wt.%)
Zn (wt.%)
Pb (wt.%)
As (wt.%)
Sb (wt.%)
S (wt.%)
Nb. samples 323 323 323 322 322 322 133 323 323 Average 1.91 0.10 100 2.54 6.76 0.92 0.34 0.15 35.98 Minimum 0.10 0.00 3 0.09 0.32 0.01 0.05 0.00 25.00 Maximum 4.75 1.20 484 25.80 19.30 4.76 3.60 1.02 48.10 Median 2.00 0.10 81 1.87 6.18 0.70 0.62 0.09 34.70 Std. Dev. 0.91 0.12 77 2.53 3.43 0.87 0.71 0.18 5.22
Table 4 – Basic statistical values for elements analysed in all mineralised sections.
All samples Section (m)
Au (g/T)
Ag (g/T)
Cu (wt.%)
Zn (wt.%)
Pb (wt.%)
As (wt.%)
Sb (wt.%)
S (wt.%)
Nb. samples 1162 1161 1161 1158 1156 1157 388 944 974
Average 1.96 0.08 51 1.29 2.78 0.47 0.18 0.08 12.83
Minimum 0.10 0.00 0 0.00 0.00 0.00 0.00 0.00 0.00
Maximum 7.40 1.20 597 25.80 30.10 17.20 4.20 3.13 48.10
Median 1.95 0.10 31 0.68 0.90 0.15 0.28 0.03 8.95
Std. Dev. 1.05 0.09 72 1.96 3.72 1.00 0.71 0.21 14.72

37
The calculated statistical values (average and standard deviation) in Table 3 and Table 4 should be taken with care, especially for metal with low grades like As, Sb, Au and Ag. Two phenomenons play an important role. Samples with grades under the detection limit result as a zero, which lowers the average. Samples with local high grades strongly increase the standard deviation (which uses the square of the deviations to the average). These effects are even more important in Table 4 (including all samples) because of the greater variety between samples (barren to massive sulphides). The result is that standard deviation values can be superior to average values. This does not mean that negative grades exist, but rather that the distribution is asymmetrical around the average: the deviation is much more important above the average than under. Thus the above Table 3 give acceptable averages (weighted by the length of the samples) for Cu, Zn, Pb and a rough idea of the grades for Au, Ag, As, Sb. The high standard deviation values are helpful to indicate elements with strong variations in the grades. Table 4, made on very different samples, give less interesting results with standard deviation systematically greater than the average.
0
2
4
6
8
10
12
14
20 40 60 80 100 120 140 160 180 200 220 240 260 280 300 320 340 360 380 400 More
Freq
uenc
y (%
)
Ag (ppm)
0
2
4
6
8
10
12
14
16
18
20
0.5 1.0 1.5 2.0 2.5 3.0 3.5 4.0 4.5 5.0 5.5 6.0 6.5 7.0 7.5 8.0 8.5 9.0 9.5 10.0 More
Freq
uenc
y (%
)
Cu (%)
0
10
20
30
40
50
60
0.05 0.10 0.15 0.20 0.25 0.30 0.35 0.40 0.45 0.50 0.55 0.60 0.65 0.70 0.75 0.80 0.85 0.90 0.95 1.00 More
Freq
uenc
y (%
)
Au (ppm)

38
Figure 17 – Distribution of Ag, Au, Cu, Zn, Pb, As and Sb concentrations in the mineralised sections containing
more than 25wt.% of S (and thus considered as massive sulphides). Average in red, median in blue.
0
5
10
15
20
25
30
0.2 0.4 0.6 0.8 1.0 1.2 1.4 1.6 1.8 2.0 2.2 2.4 2.6 2.8 3.0 3.2 3.4 3.6 3.8 4.0
Freq
uenc
y (%
)
As (%)
0
2
4
6
8
10
12
14
16
18
1 2 3 4 5 6 7 8 9 10 11 12 13 14 15 16 17 18 19 20
Freq
uenc
y (%
)
Zn (%)
0
5
10
15
20
25
30
35
40
45
50
0.05 0.10 0.15 0.20 0.25 0.30 0.35 0.40 0.45 0.50 0.55 0.60 0.65 0.70 0.75 0.80 0.85 0.90 0.95 1.00 More
Freq
uenc
y (%
)
Sb (%)
0
5
10
15
20
25
30
35
0.25 0.50 0.75 1.00 1.25 1.50 1.75 2.00 2.25 2.50 2.75 3.00 3.25 3.50 3.75 4.00 4.25 4.50 4.75 5.00
Freq
uenc
y (%
)
Pb (%)

39
7.1 Correlation between metals
Bivariate plots have been made with the data of the assays statistics of the mineralisation to search for correlation between metals (Figure 18).
Correlation between Sb and Ag (together in tetrahedrite) is not so evident. Ag can generally reach 50 ppm while Sb is quite low (below 0.05%), and higher Ag concentrations can also be associated with higher Sb values. This trend might be linked with the observations of Mattsson & Heeroma (1985), describing lower Sb values in distal parts while Ag grades in tetrahedrite were still high.
Correlations between base metals Cu, Zn, Pb do not give good results because those metals are found in too many different minerals. Pb show the best correlation observed (R²=0.7) with Sb, due to the fact that they occur together in bournonite.
Figure 18 – Metals correlation diagrams for Sb-Ag and Sb-Pb
Arsenic doesn’t show a good correlation with any other metal, which can be explained
by the fact that it is only present in arsenopyrite. There is very few analyses available for Bi and Hg and the concentrations are
generally low, but Bi and Hg seem to be slightly correlated with Sb and Pb (i.e. hosted mainly in bournonite and galena).
Finally Sb does not show a correlation with S, which would have indicated a preferential repartition in the impregnation ore or the massive ore.
y = 0.0013x + 0.0461R² = 0.2991
0.0
0.2
0.4
0.6
0.8
1.0
0 50 100 150 200 250 300 350 400 450 500
Sb (%
)
Ag (ppm)
y = 0.1913x + 0.0104R² = 0.7238
0.0
0.2
0.4
0.6
0.8
1.0
0.0 0.5 1.0 1.5 2.0 2.5 3.0 3.5 4.0
Sb (%
)
Pb (%)

40
7.2 Analysis of the antimony repartition
More statistic studies restricted to antimony have been carried out (Figures 19, 20, 21), as Sb concentrations seemed to decrease with depth. It might be difficult to interpret in detail the setting of antimony in the first 300 m since although a good amount of data exists the geometry of the ore body is complex. Folding and faulting in this part can bring proximal and distal zones of the deposit close together and as a result there are high antimony average values.
Towards depth, there are less drillholes and they are spatially more dispersed. Nevertheless, there are good reasons to think that the geometry is simpler and general trends can be outlined.
0
10
20
30
40
50
60
70
0.0
0.1
0.1
0.2
0.2
0.3
0.3
0.4
20 60 100
140
180
220
260
300
340
380
420
460
500
540
580
620
660
700
740
780
820
860
900 nu
mbe
r of
sam
ples
by
sect
ion
Sb w
.% (a
vera
ge o
n 20
m se
ctio
ns)
depth (m)Sb w.% (average on 20m sections) number of samples by section Trendline (moving average,period=2)
Figure 19 – Antimony concentrations vs. depth
0
10
20
30
40
50
60
70
0
10
20
30
40
50
60
70
80
90
100
20 60 100
140
180
220
260
300
340
380
420
460
500
540
580
620
660
700
740
780
820
860
900
num
ber
of s
ampl
es
perc
enta
ge o
f sam
ples
abo
ve 0
.1w
.%Sb
depth (m)percentage of samples above 0.1 w.% Sb number of samples trendline (moving average,period=2)
Figure 20 – Percentage of samples over 0.1% Sb vs. depth

41
0
10
20
30
40
50
60
70
0
10
20
30
40
50
60
70
80
90
100
20 60 100
140
180
220
260
300
340
380
420
460
500
540
580
620
660
700
740
780
820
860
900
num
ber
of sa
mpl
es
perc
enta
ge o
f sam
ples
abo
ve 0
.2 w
.% S
b
depth (m)percentage ofsamples over 0.2 w% Sb number of samples trendline (moving average,period=2)
Figure 21 – Percentage of samples over 0.2% Sb vs. depth
A first look at the data from below 300 m gives the impression of high peaks
alternating with low values and with large standard deviation of the concentrations. A closer look to distinguish the different drillholes and the lithologies associated with the analysis is needed. The high variability of the results can be explained as follows:
There are some true high values, i.e. the peaks at 360-420m due to the holes 68, 70. These holes are located under the central part of the deposit.
Low values, from 320-360, 420-440, 500-540 m respectively are mainly from holes 71, 74, 106, and are artificial because the analysis (sometimes very few samples) was made on only footwall sections with little sulphide impregnation and not from real sulphide lenses, which explains the low Sb content. From 600 to 640 there is no data.
Below approximately 600 m, the holes 107, 108, 114 109, 110, 111 penetrate in thick sulphide lenses (tens of meters) and have a low Sb content except in small metric sections logged as mafic or dolerite dykes and chloritized footwall (the high Sb zone in hole 114 is longer, around 10 m along core in the middle of the sulphide lens, containing several chloritized zones which might in fact be old dykes).
Finally, hole 72 has high antimony content in the sulphide lens and also in the altered sedimentary rocks surrounding the massive sulphide lens. Hole 78 has medium to high Sb concentrations in the massive sulphides and generally the highest values in the dykes.
7.3 Discussion of assays statistics
The Sb content seems to decrease with depth. Sb is precipitated at low temperature (Williams-Jones & Norman, 1997) and therefore it is likely to be remobilised with a little increase in temperature.
The main reasons for low Sb grades in the new deep drillholes is either a change of location towards a different part in the metals zonation of the deposit; or a change in metals composition and source in this part of the deposit. At depth the massive sulphides and the chloritic alteration are thick, which are signs of a more proximal zone.

42
The latest holes drilled are located in a different part of the deposit (deeper and westward) and closer to the large dolerite dike. Lower antimony concentrations below 600 m could be due to metasomatism caused by the younger intrusion. Sb is mobile at low temperature and could in some extent have been extracted from the sulphides and concentrated in the newly intruded dykes. The fact that in these drillholes the high values of antimony are concentrated in sections logged as dykes favours this hypothesis, but not all the dykes contain high antimony grades. The dykes could also have undergone a contamination in Sb deeper down, due to an unknown source.
In the deep drillholes, the chlorite altered zone contains metamorphic biotite and andalusite, which are signs of a metamorphic grade. This metamorphism could have provided the necessary heat to remove the Sb from the sulphides. The occurrence of Sb minerals in the upper part should be studied in order to know if there is proof of replacement and an increase in the Sb grades after the metamorphism.

43
8 Footwall lithogeochemical analysis The footwall in hole 68 (Figure 22) is a more or less homogeneous, slightly silicified,
dark grey, feldspar porphyritic felsic rock. The first 400 m looks only slightly altered and locally carbonate rich. The dark colour might be due to minor chlorite in the rock. This is followed by 23 m of quartz-sericite alteration with the last meter also being chlorite-rich. The massive sulphide lens is 10 m thick and generally sphalerite rich, with chalcopyrite stratigraphically above. In the hanging wall, almost 150 m of turbiditic graded sedimentary rocks together with fine-grained slumpy sediment, slightly altered in the first 2 m.
Figure 22 - Map of hole 68 with rocktype and location of the samples collected for chemical analyses.

44
12 samples have been taken along the hole 68 in the slightly altered dacitic footwall for
lithogeochemical analyses (depths indicated on the left of the drillhole, Figure 22). 3 old samples from Mattsson & Heeroma (1985) pre-existed (depths indicated on the right of the drillhole, Figure 22). In all the diagrams of §8, the new samples from hole 68 are in blue, the old ones (Mattsson & Herroma, 1985), added when possible, are in black. 2 new samples from hole 71 are in grey. 8.1 Rock classification and volcanic affinity
Ploted in a TAS (Total Alkali vs. Silica) diagram, the rocks plots as mainly dacite (samples 1,5,7,9,10,11) to rhyodacite (2,6,8,12) and some rhyolite (3,4), and rhyodacite to dacite for hole 71. It is however more suitable to use immobile elements plots because these elements are not significantly enriched or depleted during hydrothermal alteration and thus give more reliable information on the precursor. In the diagrams of Winchester & Floyd (1977) (Figure 23) the Rockliden samples plot in the rhyodacite/dacite field. The little spread of the samples in the diagram shows that they belong to the same rocktype.
Figure 23 – Rockliden samples in the volcanic rocks classification from immobile trace elements ratios,
(Winchester & Floyd 1977))
A K2O-SiO2 diagram shows a calc-alkaline affinity, for a majority of samples and high-K calc-alkaline for samples 4, 6, and 8. High-K content could be due to some sericite alteration (see also “alteration box plot” from Large et al. 2001 (Figure 25). In the immobile element plots proposed by Barrett and McLean (1994) the dacitic rock plots in the calc-alkaline to transitional fields (Figure 24, a, c, e). Note that the rocks have high Th values, around 15 ppm (Figure 24e).

45
As the samples are from only one rocktype, it was not possible to obtain fractionation trends. Nevertheless, in the immobile element binary plots involving Ti, Zr and Al, indicative common fractionation trends from andesite to rhyolite are given (green lines in Figure 24, b, d, f, taken from Barrett and McLean, 1994). Alteration lines are also represented (dashed-lines). In the Al2O3/TiO2 diagram, the only sample taken in the sericite altered zone plots effectively away on the alteration line, highlighting a mass loss in this sample. This sample has no equivalent in the other diagram because if was analysed only in major elements. Samples 3, 5 and 10 on the other hand seem to have undergone limited mass gain.
Figure 24 – immobile elements plots, from Barrett and McLean (1994). Are indicated: volcanic affinities, indicative fractionation trends (arrows) and alteration lines (dashed)
0.0
0.2
0.4
0.6
0.8
0 50 100 150 200 250 300
Zr (ppm)
TiO
2 (
%)
10 5
3
d)
TiO
2 (%
)
0
5
10
15
20
25
0.0 0.1 0.2 0.3 0.4 0.5 0.6 0.7 0.8 0.9
TiO2 (%)
Al2
O3
(%) 12
2
3 10 5
b)
0
10
20
30
40
50
60
0 1 2 3 4 5 6 7
Yb (ppm)
La
(p
pm
)
Tholeiitic
Calc-alkaline
Transitional
c)
0
2
4
6
8
10
12
14
16
18
20
0 1 2 3 4 5 6 7
Yb (ppm)
Th
(p
pm
)
Transitional
Tholeiitic
Calc-alkaline
e)
0
10
20
30
40
50
60
70
80
90
100
0 50 100 150 200 250 300 350 400
Zr (ppm)
Y(p
pm
)
4,5
7
Tholeiitic
Calc-alkaline
Transitional
a)
0
5
10
15
20
0 50 100 150 200 250 300
Zr (ppm)
Al2
O3
(%)
3 10
11 6
5
f)
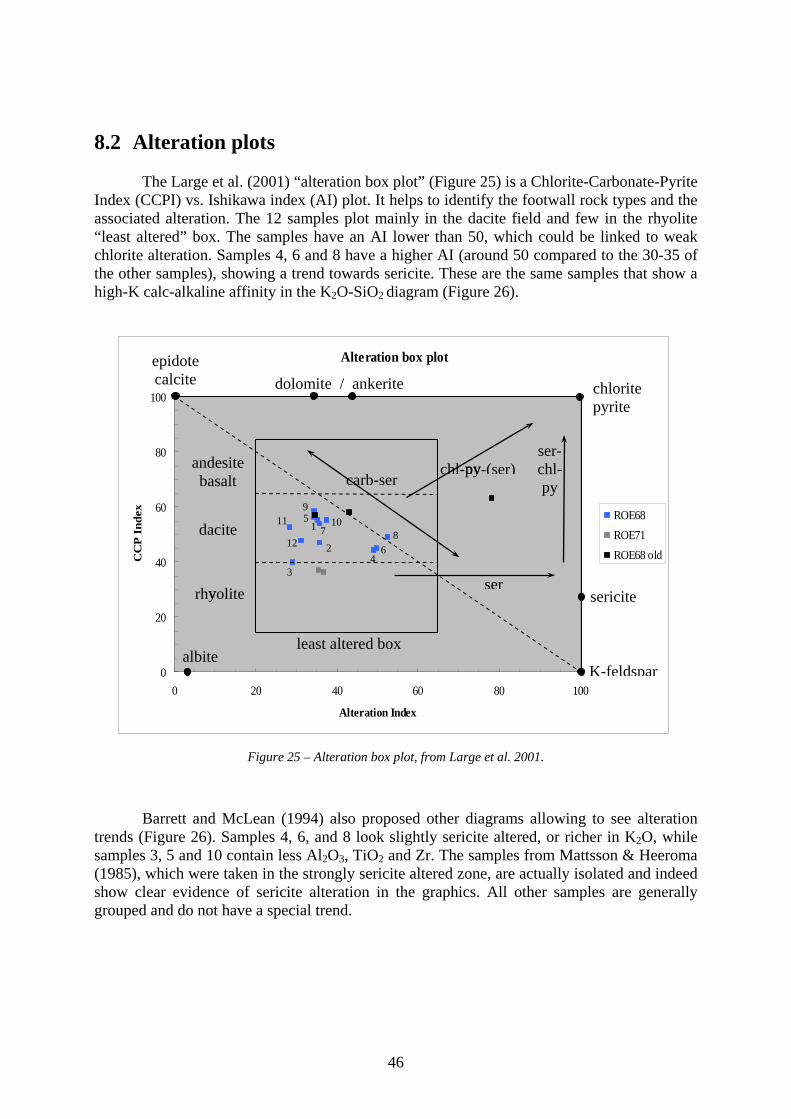
46
8.2 Alteration plots
The Large et al. (2001) “alteration box plot” (Figure 25) is a Chlorite-Carbonate-Pyrite Index (CCPI) vs. Ishikawa index (AI) plot. It helps to identify the footwall rock types and the associated alteration. The 12 samples plot mainly in the dacite field and few in the rhyolite “least altered” box. The samples have an AI lower than 50, which could be linked to weak chlorite alteration. Samples 4, 6 and 8 have a higher AI (around 50 compared to the 30-35 of the other samples), showing a trend towards sericite. These are the same samples that show a high-K calc-alkaline affinity in the K2O-SiO2 diagram (Figure 26).
Figure 25 – Alteration box plot, from Large et al. 2001.
Barrett and McLean (1994) also proposed other diagrams allowing to see alteration
trends (Figure 26). Samples 4, 6, and 8 look slightly sericite altered, or richer in K2O, while samples 3, 5 and 10 contain less Al2O3, TiO2 and Zr. The samples from Mattsson & Heeroma (1985), which were taken in the strongly sericite altered zone, are actually isolated and indeed show clear evidence of sericite alteration in the graphics. All other samples are generally grouped and do not have a special trend.
Alteration box plot
0
20
40
60
80
100
0 20 40 60 80 100
Alteration Index
CC
P I
ndex ROE68
ROE71ROE68 old
epidote calcite
dolomite / ankerite chlorite
pyrite
sericite
K-feldspar albite
andesite basalt
dacite
rhyolite
least altered box
ser
ser-chl-py
chl-py-(ser) carb-ser
4
8 12
11
3
6 2
10 9 5
1 7
y
p y

47
Figure 26 – K2O vs. Al2O3 diagram, from Barrett & McLean, 1994, with different alteration lines and the supposed localisation of the precursor
8.3 Rare Earth Elements
The REE patterns (Figure 27) of the different samples are similar, which strongly
indicate that they are derived from a unique rocktype. They are moderately fractionated from 20-30 (HREE) to 100-150 (LREE). All samples have a negative Eu anomaly.
Figure 27 – Normalization to the chondrite ( Nakamura 1974)
Strongly altered rock, close to the mineralisation

48
8.4 Normalisation to mantle and continental crust
Wholerock geochemical data from dacitic rocks from the Maurliden and Petiknäs VMS of the Skellefte district have been taken from former work (Montelius, 2005 and Schlatter, 2007, in Table 5). These samples will be used as a reference for the Skellefte district in a comparison with equivalent rocktype in Rockliden.
Table 5- Sample number and short description of the Maurliden and Petiknäs dacites, from Montelius (2005) and Schlatter (2007) Maurliden dacites M58A Feldspar porphyritic in-situ breccia 60201 80.9 Feldspar porphyritic dacite M36 Feldspar porphyritic dacite Maur 65-463 10%, feldspar porphyritic in-situ breccia M61-224 Feldspar porphyritic dacite MAUR-80112-39.05m 10%, feldspar porphyritic in-situ breccia 65 394.65M 1mm, 10%, feldspar porphyritic dacite Petiknäs dacites PETS-BH68-374.2m Dark-grey, massive, Fsp porphyritic, rhyolite; 2% of 1mm Fsp, Dacite I, Trans. PETS-BH662-91.35m Grey, mgr-cgr, volcaniclastic, sandstone, 20% Fsp crystals, 1-2mm, Dacite-I, Trans. ~Re 76 Dark-grey-greenish, fgr, very weakly Fsp-porphyritic, dacite, Dacite-II, Trans. PETS-BH9-171.65m Dark-green, Fsp-rich, sericite altered, dacitic, volcaniclastic breccia, Dacite II, Trans.
The spidergrams (Figures 27, 28) show Sr, Ba, and Eu negative anomalies, which could be linked to plagioclase accumulation during the differentiation (substituting for Ca). P anomalies can be related to Apatite. Ti, Nb, and Ta negative anomalies to the accumulation of ilmenite, rutile or sphene. Cs, Rb, Ba, and K can have high but variable values from on sample to another in Rockliden. These elements are more mobile and can easily be remobilised.
Compare to the upper crust, the dacite shows enrichment in Th, U, Hf, (Zr) and Y. The REE are also enriched compared to the upper crust, the HREE (Yb) more than the LREE (La,Ce). A comparison with all the elements available from wholerock lithogeochemistry (Figure 29) suggest the same enrichment in HFSE, LILE and REE compare to equivalent rocktypes from the Skellefte district. Enrichment in these particular groups of elements which have a crustal affinity might be linked either to the source of the volcanic rocks or to the surrounding sedimentary rocks by contamination. These possible origins of enrichment will be discussed below.
The Cu, Zn, Pb, As, Sb, variations have not been interpreted as an enrichment or depletion because of their mobility and link with the VMS formation. V and Ni are usually low in felsic rock but some isolated high values bias the average and produce artifacts.

49
Figure 28 – Above: normalisation to primordial mantle (Wood et al.1979) a) all Rockliden, b) averages of Rockliden (blue), Maurliden (green),and Petiknäs (purple). Below: normalisation to the upper continental crust (Taylor & Mc Lennan, 1995) c) all Rockliden, d) averages of Rockliden (blue), Maurliden (green), and Petiknäs
(purple).
8.5 Discussion of the lithogeochemical analyses
The dacitic rock samples have between 0.55 and 0.65 wt % Ti and 200 to 250 ppm Zr. In the Barrett and McLean (1994) diagrams (Figure 24, b, d, f), the samples are generally close to the dacite field but depending on the plots the high Ti and Zr values pull the samples more towards the fields of andesite or rhyolite. In the TiO2/Zr diagram, the samples plot away from the indicative fractionated crystallisation trend line. They plot likely on a dacite alteration line and look enriched in the immobile elements Ti and Zr.
In the other plots from Barrett and McLean (1994) regarding volcanic affinity (Figure 24, a, d, e), the dacitic rocks have high contents of Th (around 15 ppm) Yb (around 4.5 ppm), La and Y(both around 40 ppm). Th is pulling the samples towards the calc-alkaline field and Y towards the transitional field. The variation in volcanic affinities could thus be interpreted as a result of an enrichment in Th and Y.
a) b)
d) c)

50
Figure 29 – Rockliden dacite samples average normalized to Petiknäs and Maurliden dacites averages.
SiO
2Ti
O2
Al2O
3Fe
2O3
MnO M
gO CaO
Na2
OK2
OP2
O5
BaCu
ZnPb
AgAs Sb Bi
TlV
Ni
Co ScRb
SrCs
Ga
Mo
SnW
Hf Ta U Th
Nb
Y Zr La Ce Pr Nd
SmEu
Gd Tb Dy Ho Er Tm Yb Lu
0.1
1
10
100
Rockliden/PetiknäsSi
O2
TiO
2
Al2
O3
Fe2O
3
MnO M
gO CaO
Na2
O
K2O
P2O
5
Ba
Cu
Zn
Pb
Ag
As Sb
Bi Tl
V
Ni
Co Sc
Rb
Sr
Cs
Ga
Mo
Sn
W
Hf Ta
U
Th
Nb
Y
Zr
La Ce
Pr Nd
Sm
Eu
Gd
Tb Dy
Ho
Er Tm Yb Lu
0.1
1
10
100
Rockliden/Maurliden

51
Plots with incompatible elements give variable and sometimes incoherent
results. The variations cannot be explained by alteration and enrichment in incompatible elements by “mass loss” since the rock looks unaltered in the drillcore and in most of the diagrams. A more plausible explanation is that the volcanic rock is rich in elements from the lithophile groups HFSE (Hf, (Zr), Th, Ta, Sn, W, U and Y), LILE (Rb, Cs, Ba, Pb,), REE and Ti.
Variations in LILE elements concentrations should be treated with care since they are very mobile and can be enriched due to alteration. Nonetheless, the enrichement in lithophile elements mentioned above can originate from a contamination by the sedimentary rocks of the Bothnian Basin. The sedimentary rocks might also be source of the melt, as the crust below is assumed to be oceanic and the felsic rocks of Rockliden have a strong continental signature. The lithophile elements are commonly present in clay and resistant minerals in fine-grained, siliciclastic, continental derived sediments like the Bothnian Basin sedimentary rocks. Resistant accessory minerals could be: zircon (Zr,Hf), sphene (Ti,Th), rutile and ilmenite (Ti), monazite (REE, Cs, La, Ce, Nd, Sm, Y, Th), apatite (P), cassiterite (Sn). The sources of the sediments are the Archaean and pleoproterozoic greenstone belts and granitoids bordering the Basin (Claesson et al., 1993, Patchett et al., 1987). A further indication suggesting this contamination can be found in the Shandl and al. (2002) diagrams (Figure 31). Rockliden plots close to the Bathurst Camp deposit in Canada, mainly because of the high Th concentrations. Shandl et al. (2002) refered to Dostal (1989) and Lentz (1996, 1999) that suggested that partial melting of the crust (fusion and anatexis) played a significant part in the evolution of the two main suites of felsic volcanic rocks.
Hallberg (1989) highlighted the similarities between Rockliden (north-central
sweden), the Bergslagen district (south-central Sweden) and south-western Finland (Seinäjoki-Nurmo and Korsnäs), especially the lead isotopic homogeneity within and between deposits and the upper-crust affinity of this lead. He suggested that most of the hydrothermal lead leached in Rockliden could originate from the Archaean-derived metasedimentary rocks of the Bothnian Basin. Indeed these rocks have, due to their formation mode of (weathering, transport, deposition), homogenized isotopic compositions and lead of upper-crustal affinity (Hallberg, 1989). This could also explain why the HREE in Rockliden are more enriched than the LREE compared to the average upper continental crust, i.e. that the REE are less fractionated than in the upper continental crust (Figure 28). Part of the REE content comes from contamination and the sedimentary rocks, the source of this contamination, have a more homogeneous REE distribution. The sedimentary rocks have enriched the magma more in HREE than in LREE
However, if an enrichment of the magma by crustal contamination is plausible, despite the fact that the scattering of the samples seem to give a reliable information, the significance of this conclusion is limited by the limited amount of geochemical data (14 samples in one rocktype).
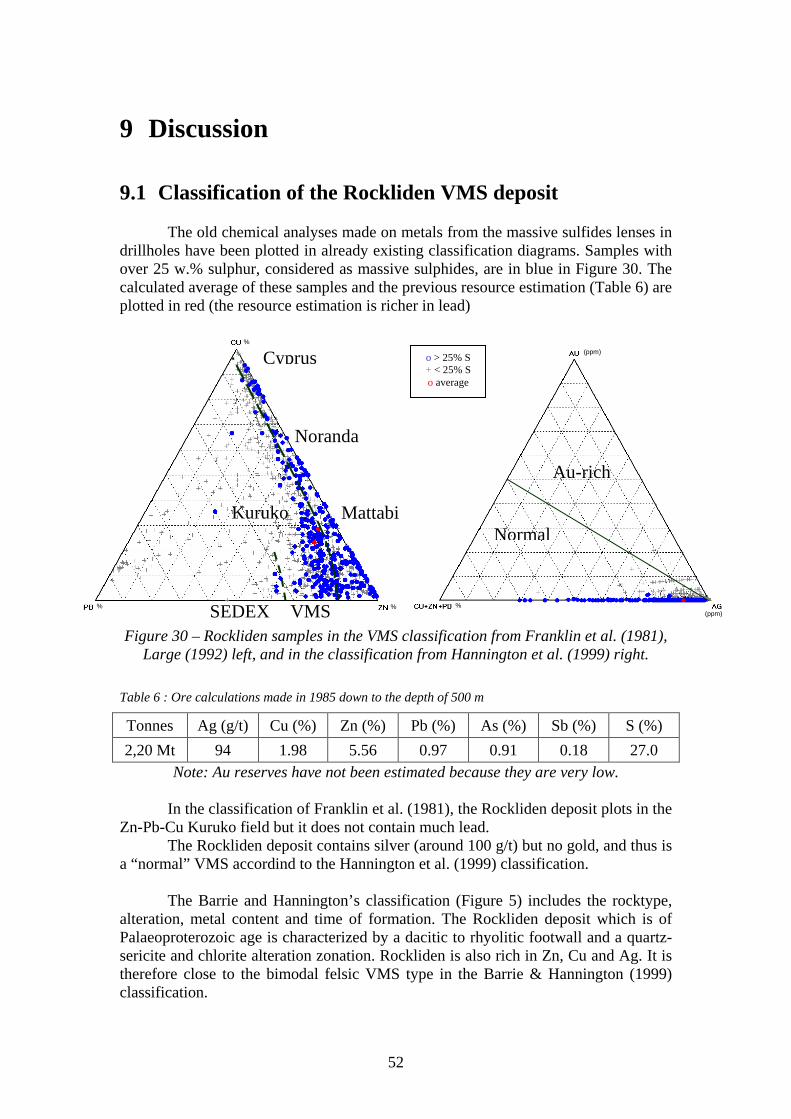
52
9 Discussion 9.1 Classification of the Rockliden VMS deposit
The old chemical analyses made on metals from the massive sulfides lenses in drillholes have been plotted in already existing classification diagrams. Samples with over 25 w.% sulphur, considered as massive sulphides, are in blue in Figure 30. The calculated average of these samples and the previous resource estimation (Table 6) are plotted in red (the resource estimation is richer in lead)
Figure 30 – Rockliden samples in the VMS classification from Franklin et al. (1981),
Large (1992) left, and in the classification from Hannington et al. (1999) right. Table 6 : Ore calculations made in 1985 down to the depth of 500 m
Tonnes Ag (g/t) Cu (%) Zn (%) Pb (%) As (%) Sb (%) S (%) 2,20 Mt 94 1.98 5.56 0.97 0.91 0.18 27.0
Note: Au reserves have not been estimated because they are very low. In the classification of Franklin et al. (1981), the Rockliden deposit plots in the
Zn-Pb-Cu Kuruko field but it does not contain much lead. The Rockliden deposit contains silver (around 100 g/t) but no gold, and thus is
a “normal” VMS accordind to the Hannington et al. (1999) classification. The Barrie and Hannington’s classification (Figure 5) includes the rocktype,
alteration, metal content and time of formation. The Rockliden deposit which is of Palaeoproterozoic age is characterized by a dacitic to rhyolitic footwall and a quartz-sericite and chlorite alteration zonation. Rockliden is also rich in Zn, Cu and Ag. It is therefore close to the bimodal felsic VMS type in the Barrie & Hannington (1999) classification.
Noranda
SEDEX
Kuruko
VMS
Cyprus
Mattabi
o > 25% S + < 25% S o average
Normal
Au-rich
%
% % %
(ppm)
(ppm)

53
9.2 Tectonic setting
In tectonic classification for granites of Pearce et al. (1984), Rockliden
samples plots in the volcanic arc domain (Granite in Pearce et al. (1984) is defined as a rock containing more than 5% of modal quartz), but Rb is very mobile and could biase the result. Bivariate plots (also from Pearce et al. (1984)) of the discriminant elements Y, Yb, Ta, Rb, Nb, aiming to sort granites into ocean-ridge (ORG), within-plate (WPG), volcani-arc (VAG) and syn-collisional (syn-COLG) categories give incoherent results. However, the dilution effect of plagioclase accumulation might shift the granites from WPG and ORG to VAG, and on the contrary, from VAG and syn-COL to WPG or ORG by accumulation of ferromagnesian and minor phases. Also these elements are believed to be enriched in the dacitic rock. Therefore no tectonic setting from these diagrams can be outlined.
From the tectonic setting plots of Shandl et al. (2002), (Figure 31) the Rockliden deposit it likely to have formed in an active continental margin. The authors separate the post-Archaean VMS deposits formed in subduction-related rift zones of arc environment from the Archaean deposits formed in an ensimatic rift environment. The enrichment of Th and LREE with respect to Ta, Nb and HREE is interpreted as a progressive enrichment of the mantle due to subduction.
Figure 31 – Rockliden samples in the tectonic setting plots from Shandl et al.(2002). Some major VMS deposits are also plotted as a reference
Th/H
f
Ta/Hf
Th/Y
b
Ta/Yb
Yb
Th/T
a
Th
Ta Hf

54
In the classification of Lesher et al. (1986), the samples belong to the FII type of felsic rocks (Figure 32). Hart et al. (2004) suggested the following settings for FII type rocks:
The group contains dacite to rhyolite rocks, with a calc-alkaline affinity. Petrogenetic models proposed are: fractional crystallization of intermediate magma; high-degree partial melting of felsic granulite at intermediate crustal depths; partial melting of hydrated, subducted oceanic slab or the overlying metasomatised mantle wedge, followed by fractional cristallisation; high temperature partial melting of crustal material with magma compositions controlled by differences in composition of crust. Associated tectonic environment expected are continental arc, rifted mature arc, continental back arc and extensional environments (e.g. intra-continental, intraoceanic intra-arc, intra-arc, back arc rift). Other VMS deposits belonging to the same group are: Sturgeon Lake, Kuroko, Rio Tinto, Bathurst, Myra Falls, Mt. Windsor, Tulsequah Chief, Mt. Read, Boliden, Selbaie, Salt Creek, Murgul and Benambra. The depth of the magma fractionation is expected to be intermediate, where amphibole and plagioclase are stable, below 10 km but above 15 km (Figure 33) which is the lower limit of brittle fracture permeability zone. Above 15 km the convective fluid flow allows the formation of VMS deposits, below this depth, FII felsic volcanics are barren.
Figure 32 – F-type of felsic volcanic rocks from Lesher et al. (1986) plotted in a La/Yb vs. Yb
normalized to the chondrite, from Hart et al. (2004).

55
Figure 33 – VMS tectonic setting, from Hart et al. 2004
The origin of the extensional setting needed for the formation of VMS deposits is difficult to define in Rockliden. The Rockliden deposit is isolated in the Bothnian Basin, there are few other felsic volcanic rocks intercalated in this basin and there is no trace of a subduction zone or a volcanic arc. During the Palaeoproterozoic the basin was subducted to the north and to the south under the Skellefte and Bergslagen district (hosting VMS deposits) (Lahtinen et al., 2005). This might have pulled the Bothnian Basin in two opposite directions to form a small rift. The limited extension was then quickly followed by the compressional stage of the Svecokarelian orogeny.

56
10 Conclusion
From former work, it can reasonably be said that the felsic volcanic rocks
from the Rockliden deposit are intercalated in the upper part of a 10 km thick mainly shale and turbiditic greywacke supracrustal sequence. These sediments were deposited in a deep basin on a juvenile Proterozoic crust and are the erosional products of Archaean and Palaeoproterozoic continental crust. The felsic volcanic rocks of Rockliden are isolated in the middle Bothnian Basin which was at the time subducted to the north under the continental volcanic arc of the Skellefte district and the Bergslagen to the south, both hosting VMS depostis.
In the studied cross section, the footwall is mainly a dacitic autoclastic breccia,
quartz-sericite altered and in the proximal part chlorite altered. The hanging wall is composed of turbiditic fine grained sedimentary rocks. The mineralisation contains mainly sphalerite, chalcopyrite, pyrrhotite and pyrite. The shape of deposit is very complicated and it is steeply dipping. It is deformed by Svecokarelian E-W vergent folds and E-W striking faults, and is later intersected by basic dykes and NE-SW striking faults.
From the description of the Rockliden VMS geology and classification
according to existing nomenclature, the deposit is a Palaeoproterozoic, bimodal felsic, Kuruko type VMS.
A study of the Sb distribution in recent holes (107 to 111 and 114) in the
deeper part of the deposit cross-cut thick massive sulphide lenses with lower Sb content. The reason for this is not known, but a change in the source, or a remobilization due to the metasomatism by the dolerite dykes or higher metamorphic grades are possible explanations.
From the lithogeochemical analyses, the dacitic rock sampled in the footwall
has a calc-alkaline F-II type affinity. The magma may have fractionated at between 10 and 15 km depth where amphibole and plagioclase are stable and the crust is brittle. The source of the magma might be the sedimentary rocks of the Bothnian Basin, or at least it underwent crustal contamination by these sediments.

57
Acknowledgment
I warmly thank Hans Årebäck of Boliden Mineral AB who made this Master Thesis possible and brought me the support I needed. The Rockliden VMS deposit was a really interesting subject and I learn a lot on VMS deposits and on the geology of Sweden. I also warmly thank Hein Raat of Boliden Mineral AB, with whom I work during this Master Thesis and on the field, for his continuous help and attention. I wish him good luck for the future of the Rockliden projet. I thank Nicolas Saintilan of Boliden Mineral AB for his help, the interest he put in my Master Thesis and his friendship. Thanks to all of them for reviewing and making constructive comments on my manuscript and my defence. It was a pleasure to work with all of them. I also would like to thank Pär Weihed and Olof Martinsson of the Luleå University of Technology for the final review of my Master Thesis which improved it substantially. Finally I thank the whole staff of the exploration department of Boliden Mineral AB for their sympathy during the months I spent in Boliden.

58
References Ahl M, Andersson U.B., Lundqvist T, Sundblad K, (eds.), 1997. Rapakivi granites and related rocks in
central Sweden. Sveriges Geologiska Undersörkning Ca 87, 99 pp. Allen, R.L. & Svenson, S.-Å., 2004: 1.9 Ga Volcanic Stratigraphy, Structure, and Zn-Pb-Cu-Au-Ag
Massive Sulfide Deposits of the Renström Area, Skellefte district, Sweden. In Allen, R.L., Martinsson, O. & Weihed, P. (Eds) Volcanic-associated Zn-Cu-Au-Ag deposits, Magnetite-Apatite deposits, Sediment-hosted Pb-Zn deposits, and Intrusion-associated Cu-Au deposits in northern Sweden. Society of Economic Geologists Guidebook Series, 33, 65-88.
Allen, R.L., Weihed, P. and the Global VHMS Research Project team, 2002. Global comparison of volcanic-associated massive sulphide districts. In: Blundell, D.J., Neubauer, F., von Quadt, A. (Eds.), The Timing and Location of Major Ore Deposits in an Evolving Orogen. Geological Society, London, Special Publications no. 204, 13-37.
Allen, R.L., Weihed, P., Svenson, S.-Å., 1996a. Setting of Zn–Cu–Au–Ag massive sulfide deposits in the evolution and facies architecture of a 1.9 Ga marine volcanic arc, Skellefte district, Sweden. Economic Geology 91, 1022–1053.
Barrett, T.J. and MacLean, W.H., 1994. Chemostratigraphy and hydrothermal alteration in exploration for VHMS deposits in greenstones and younger volcanic rocks. In: D.R. Lentz (Editor), Alteration and Alteration Processes Associated with Ore-Forming Systems. Geological Association of Canada, Short Course Notes Volume 11, p. 433-465.
Barett T.J., McLean W.H., 1999: Volcanic sequences, lithogeochemistry and hydrothermal alteration in some bimodal volcanic-associated massive sulphide systems. In: C.T. Barrie and M.D. Hannington (Eds), Volcanic-associated massive sulphide deposits: processes and examples in modern and ancient settings, 1999. Reviews in Economic Geology, Society of Economic Geologists, Inc., v. 8.
Barrie, C.T. & Hannington, M.D. 1999. Classification of volcanic-associated massive sulfide deposits based on host-rock composition. Reviews in Economic Geology Vol. 8: 325-356.
Bergström, U., 2001, Geochemistry and tectonic setting of volcanic units in the northern Västerbotten county, northern Sweden: SGU series C833, p. 69–92.
Billström, K.,Weihed, P., 1996. Age and provenance of host rocks and ores in the Palaeoproterozoic Skellefte district, northern Sweden. Economic Geology 91, 1054–1072.
Bolin, N.J., 2009. Mineralogical study of copper concentrates. Boliden Mineral AB, Process Technology Report TM_REP2009/001.
Claesson, S., 1987, Nd isotope data on 1.9-1.2 Ga old basic rocks and metasediments from the Bothnian basin, central Sweden. Precambrian Research, 35: 115-126.
Claesson, S., Huhma, H., Kinny, P. D., Williams I. S., 1993. Svecofennian detrital zircon ages—implications for the Precambrian evolution of the Baltic Shield Precambrian Research, Volume 64, Issues 1-4, December 1993, Pages 109-130.
Claesson, S., Lundqvist, T., 1995. Origins and ages of Proterozoic granitoids in the Bothnian Basin, central Sweden; isotopic and geochemical constraints. Lithos 36, 115–140.
Fox, J.S., 1984, Besshi-type volcanogenic sulfide deposits - A review. Canadian Institute Mining and Metallurgy Bulletin, v. 77, no. 864, p. 57-68.
Franklin, J.M., Sangster, D.M., and Lydon, J.W., 1981, Volcanic-associated massive sulfide deposits, in Skinner, B.J., ed., Economic Geology Seventy-fifth Anniversary Volume: Economic Geology Publishing Company, p. 485-627.
Gaál, G., Gorbatschev, R., 1987. An outline of the Precambrian evolution of the Baltic Shield. Precambrian Research 35, 15–52.
Galley, A.G., Hannington, M.D., and Jonasson, I.R., 2007, Volcanogenic massive sulphide deposits, Geological Association of Canada, Mineral Deposits Division, Special Publication No. 5, p. 141-161.
Hallberg, A., 1989. Metal sources in the early Proterozoic Svecofennian terrain of central Sweden: Pb isotope evidence. Mineralium Deposita 24, 250-257.
Hart, T.R., 2004, Trace elements geochemistry and petrogenesis of felsic volcanic rocks associated with volcanogenic massive Cu-Zn-Pb sulphide deposits, ECONOMIC GEOLOGY, vol. 99, pp. 1003-1013.
Koistinen, T., Stephens, M.B., Bogatchev, V., Nordgulen, Ø., Wennerström, M., Korhonen, J. (Eds.), 2001. Geological Map of the Fennoscandian Shield, Scale 1:2 000 000. Geological surveys of Finland, Norway and Sweden and the North-West Department of Natural Resources of Russia. ISBN: 951-690-810-1.

59
Korsman, K., Koistinen, T., Kohonen, J., Wennerström, M., Ekdahl, E., Honkamo, M., Idman, H., Pekkala, Y. (Eds.), 1997. Suomen kalliopera¨kartta — Berggrundskarta O¨ ver Finland — Bedrock Map of Finland 1:1 000 000. Geological Survey of Finland, Espoo, Finland.
Kousa, J., Lundqvist, Th., 2000. Svecofennian Domain. In: Lundqvist, Th., Autio, S. (Eds.), Description to the bedrock map of Central Fennoscandia (Mid-Norden). Geological Survey of Finland, Special Paper 28, 47–75.
Lahtinen, R., 1994. Crustal Evolution of the Svecofennian and Karelian Domains during 2.1–1.79 Ga, with Special Emphasis on the Geochemistry and Origin of 1.93–1.91 Ga Gneissic Tonalites and Associated Supracrustal Rocks in the Rautalampi Area, Central Finland. Geological Survey of Finland Bulletin, vol. 378, 128 pp.
Lahtinen, R., Huhma, H., Kousa, J., 2002. Contrasting source components of the Palaeoproterozoic Svecofennian metasediments: detrital zircon U–Pb, Sm–Nd and geochemical data, Precambrian Research 116 (2002), pp. 81–109.
Lahtinen, R., Korja, A., Nironen, M., 2005. Paleoproterozoic tectonic evolution. In: Lehtinen, M., Nurmi, P.A., Ra¨mo¨ , O.T. (Eds.), Precambrian Geology of Finland—Key to the Evolution of the Fennoscandian Shield. Elsevier Science, B.V., Amsterdam, 481– 532.
Lahtinen, R., Huhma, H., 1997. Isotopic and geochemical constraints on the evolution of the 1.93–1.79 Ga Svecofennian crust and mantle in Finland. Precambrian Res. 82, 13–34.
Large, R.R., 1992, Australian volcanic-hosted massive sulphide deposits: features, styles and genetic models: Economic Geology, v. 87, p. 471-510.
Large, R. R., Gemmell, J. B., Paulick, H., Huston, D. L. 2001. The Alteration Box Plot: A Simple Approach to Understanding the Relationship between Alteration Mineralogy and Lithogeochemistry Associated with Volcanic-Hosted Massive Sulfide Deposits, Economic Geology, Aug 2001; 96: 957 - 971.
Lesher, C. M., Gibson, H. L., Campbell, I. H., 1986. Composition-volume changes during hydrothermal alteration of andesite at Buttercup Hill, Noranda District, Quebec Geochimica et Cosmochimica Acta, Volume 50, Issue 12, 2693-2705.
Lundqvist, Th., 1987. Early Svecofennian stratigraphy of southern and central Norrland, Sweden, and the possible existence of an Archaean basement west of the Svecokarelides. Precambrian Research., 35: 343-352.
Lundqvist, T., Gee, D.G., Kumpulainen, R., Karis. L. & Krestsen, P., 1990: Berggrundsgeologiska kartan över Västernorrland, SGU Ser. Ba 31.
Lundqvist, T., Vaasjoki, M., Persson, P.-O., 1998. U–Pb ages of plutonic and volcanic rocks in the Svecofennian Bothnian Basin, central Sweden, and their implications for the Palaeoproterozoic evolution of the basin. GFF 120, 357– 363.
MacLean, W.H. and Barrett, T.J., 1993. Lithogeochemical techniques using immobile elements, Journal of Geochemical Exploration, v. 48, p. 109-133.
Mattsson, B., and Heeroma, P., 1985. Rockliden Prospekteringsresultat 1981-1985, Boliden Minerql AB, GP 85 005 2.
Montelius, C., The genetic relationship between rhyolitic volcanism and Zn-Cu-Au deposits in the Maurliden volcanic centre, Skellefte district, Sweden: volcanic facies, lithogeochemistry and geochronology, 2005. Luleå university of Technology, 135 p.
Montelius, C., Allen, R.L., Svenson, S.-Å. & Weihed, P., 2007, Facies architecture of the Palaeoproterozoic VMS-bearing Maurliden volcanic centre, Skellefte district, Sweden, GFF, Vol.129 (Pt. 3, Septembre), pp. 177-196.
Morton, R.L. et Franklin, J.M., 1987. Two-fold classification of Archean volcanic-associated massive sulfide deposits. Economic Geology, 82: 1957-1063.
Nironen, M., 1997. The Svecofennian Orogen: a tectonic model. Precambrian Research 86, p. 21–44. Patchett, P.J., Gorbatschev, R. and Todt, W., 1987. Origin of continental crust of 1.9-1.7 Ga age: Nd
isotopes in the Svecofennian orogenic terrains of Sweden. Precambrian Research., 35: 145-160. Pearce, J. A., Harris, N. B. W., Tindle, A. G., 1984. Trace element discrimination diagrams for the
tectonic interpretation of granitic rocks. Journal of Petrology, 25(4):956-983. Poulsen, H., and Hannington, M., 1995, Auriferous Volcanogenic Sulfide Deposits, in Eckstrand, O.R.,
Sinclair, W.D., and Thorpe, R.I., eds. Geology of Canadian Mineral Deposit Types, Geology of Canada, no. 8, Decade of North American Geology (DNAG): Geological Society of America, Part 1. p. 183-196.
Schandl, E.S., and Gorton, M.P., 2002, Application of high field strength elements to discriminate tectonic settings in VMS environments, ECONOMIC GEOLOGY, v.97, pp. 629-642.
60
Schlatter, D. M., Volcanic Stratigraphy and Hydrothermal Alteration of the Petiknäs South Zn-Pb-Cu-Au-Ag Volcanic-hosted Massive Sulfide Deposit, Sweden, 2007. Luleå University of Technology, 208 p.
Skiöld, T., Rutland, R.W. R., 2006. Successive 1.94 Ga plutonism qnd 1.92 Ga deformation and metamorphism south of the Skellefte district, northern Sweden : Substantiation of the marginal basin accretion hypothesis of Svecofennian evolution. Precambrian Research, 148, 181-204.
Soderlund, U., Elming, S.-A., Ernst, R. E., Schissel, D., 2006. The Central Scandinavian Dolerite Group--Protracted hotspot activity or back-arc magmatism?: Constraints from U-Pb baddeleyite geochronology and Hf isotopic data Precambrian Research, Volume 150, Issues 3-4, 10 November 2006, Pages 136-152.
Wasström, A., 1993. The Knaften granitoids of Västerbotten County, northern Sweden. Sveriges Geologiska Undersökning C 823, 60–64.
Wasström, A., 1996: U-Pb zircon dating of a quartz feldspar porphyritic dyke in the Knaften area, Västerbotten County, northern Sweden. Sveriges Geologiska Undersökning, C 828, 34-40.
Wasström, A., 2005, Petrology of a 1.95Ga granite-granodiorite-tonalite-trondhjemite complex and extrusive rocks in the Knaften area, northern Sweden, GFF, Vol.127 (Pt. 2, June), pp. 76-82.
Welin, E., 1987. The depositional evolution of the Svecofennian supracrustal sequence in Finland and Sweden. Precambrian Research., 35: 95-113.
Weihed, P., 2004, Overview of the Geology and Tectonic Setting of Northern Sweden, Society of Economic Geologists Guidebook Series, Volume 33, p. 1–15
Weihed P., Arndt N., Billström K., Duschene J-C., Eilu P., Martinsson O., Papunen H. & Lahtinen R., 2005: 8: Precambrian geodynamics and ore formation: The Fennoscandian Shield. Ore Geol. Rev., v. 27, p.273-322.
Weihed, P., Bergman, J. and Bergstrfim, U., 1992. Metallogeny and tectonic evolution of the Early Proterozoic Skellefte district, northern Sweden, Precambrian Research., 58: 143-167.
Winchester, J.A. and Floyd, P.A., 1977. Geochemical discrimination of different magma series and their differentiation products using immobile elements. Chem. Geol., 20 : 325--343.
Williams-Jones A. E. & Norman C, 1997. Controls of mineral parageneses in the system Fe-Sb-S-O. Economic Geology; v.92; no 3; p. 308-324.

61
Appendix I : Lithogeochemical analyses results, from ACME Analytical Laboratories ltd.
Method 4A-4B 4A-4B 4A-4B 4A-4B 4A-4B 4A-4B 4A-4B 4A-4B 4A-4B 4A-4B 4A-4B
4A-4B 4A-4B
Drillhole Sample start end average length Analyte SiO2 Al2O3 Fe2O3 MgO CaO Na2O K2O TiO2 P2O5 MnO Cr2O3 AI CCPI SI Ni Sc
m m m m Unit % % % % % % % % % % %
PPM PPM
MDL 0.01 0.01 0.04 0.01 0.01 0.01 0.01 0.001 0.001 0.01 0.002
20 1
68 1 392.63 392.87 392.75 0.24 Rock Pulp 70.19 13.64 4.83 1.26 2.26 3.22 1.74 0.633 0.136 0.03 <0.002 35.38 55.11 83.73 <20 23
68 2 360.60 360.88 360.74 0.28 Rock Pulp 70.4 14.18 4.48 0.82 2.12 3.62 2.39 0.647 0.129 0.03 <0.002 35.87 46.86 83.23 <20 22
68 3 325.15 325.39 325.27 0.24 Rock Pulp 74.95 11.95 3.15 0.5 1.87 3.76 1.8 0.536 0.122 0.03 <0.002 29.00 39.63 86.25 <20 18
68 4 285.54 285.80 285.67 0.26 Rock Pulp 71.53 13.43 3.87 1.08 1.98 2.74 3.49 0.637 0.129 0.03 <0.002 49.19 44.28 84.19 <20 19
68 5 256.52 256.77 256.65 0.25 Rock Pulp 67.48 12.19 4.37 1.76 5.26 2.46 2.32 0.555 0.121 0.05 <0.002 34.58 56.19 84.70 <20 18
68 6 220.39 220.53 220.46 0.14 Rock Pulp 69.14 14.43 3.82 1.29 2.98 2.32 3.96 0.643 0.131 0.04 <0.002 49.76 44.86 82.73 <20 20
68 7 179.96 180.12 180.04 0.16 Rock Pulp 68.79 13.93 5.87 0.92 2.78 3.32 2.48 0.605 0.123 0.06 <0.002 35.79 53.93 83.16 <20 23
68 8 149.37 149.61 149.49 0.24 Rock Pulp 69.68 13.45 5.11 1.18 2.34 2.43 4.13 0.611 0.134 0.04 <0.002 52.68 48.95 83.82 <20 23
68 9 118.29 118.55 118.42 0.26 Rock Pulp 66.67 13.61 6.45 1.28 3.78 3.17 2.37 0.619 0.135 0.08 <0.002 34.43 58.25 83.05 <20 22
68 10 90.20 90.45 90.33 0.25 Rock Pulp 69.23 12.99 5.73 1.22 3.1 3.1 2.51 0.596 0.126 0.06 <0.002 37.56 55.33 84.20 <20 22
68 11 59.75 60.00 59.88 0.25 Rock Pulp 68.83 14.53 4.99 1.37 2.72 4.34 1.44 0.654 0.15 0.07 <0.002 28.47 52.39 82.57 <20 24
68 12 29.82 30.09 29.96 0.27 Rock Pulp 69.1 13.45 5.28 0.65 2.78 4.05 2.44 0.604 0.122 0.05 <0.002 31.15 47.75 83.71 <20 21
71 1 52.06 52.32 52.19 0.26 Rock Pulp 70.28 14.95 2.86 0.7 3.06 3.3 2.82 0.649 0.138 0.02 <0.002 35.63 36.78 82.46 <20 22
71 2 123.74 124.02 123.88 0.28 Rock Pulp 71.8 14.14 2.88 0.72 2.4 3.58 2.78 0.628 0.139 0.03 <0.002 36.92 36.14 83.55 <20 17
old68_RhyoDacite
357
68.6 14.5 5 1.2 4.2 2.4 2.3 0.6
0.05
34.65 56.88 82.55
old68_RD light alt.
399
68.6 15 4.6 1.5 2.7 2.2 2.2 0.6
0.03
43.02 58.10 82.06
old68_RD strong alt.
404
57.4 20.7 9.1 1.3 1.3 0.6 5.5 0.8
0.01
78.16 63.03 73.50

62
4A-4B 4A-4B 4A-4B 4A-4B 4A-4B 4A-4B 4A-4B 4A-4B 4A-4B 4A-4B 4A-4B 4A-4B 4A-4B 4A-4B 4A-4B 4A-4B 4A-4B 4A-4B 4A-4B 4A-4B 4A-4B 4A-4B 4A-4B 4A-4B
LOI Sum Ba Be Co Cs Ga Hf Nb Rb Sn Sr Ta Th U V W Zr Y La Ce Pr Nd Sm
% % PPM PPM PPM PPM PPM PPM PPM PPM PPM PPM PPM PPM PPM PPM PPM PPM PPM PPM PPM PPM PPM PPM
-5.1 0.01 1 1 0.2 0.1 0.5 0.1 0.1 0.1 1 0.5 0.1 0.2 0.1 8 0.5 0.1 0.1 0.1 0.1 0.02 0.3 0.05
1.9 99.85 355 <1 3.7 3.4 17.7 7.4 13.6 85 3 157 1.1 15.3 5.5 16 2.9 240.1 46 40.7 86.3 10.21 38.2 7.79
1 99.85 509 2 5.1 4.5 19.6 7.2 13.7 127.6 3 128.7 1.1 15.8 5.5 15 1.9 242.7 44.6 39.3 83.3 9.88 38.2 7.58
1.2 99.89 329 2 3.5 6.7 14.1 6.1 11.6 94.7 2 133.3 1 13 4.3 11 1 195.6 36.6 33.5 69.8 8.34 31 6.12
0.9 99.86 479 3 4 5.8 19.8 7.1 13.3 170.9 4 106 1.1 15.7 5 15 1.7 234.7 42.8 39.2 82.1 9.96 38.8 7.6
3.3 99.86 400 2 4.8 3.8 17 6 11.7 115.4 3 129.6 0.8 12.8 4.5 12 1.1 204.4 39.9 33.8 71 8.46 32.7 6.48
1.1 99.84 492 3 5.7 10 19.7 7.4 14.4 163.2 3 116.9 1.1 16.2 5.4 17 2.1 249.5 42.2 41 84.6 10.16 39.9 7.56
1 99.86 446 2 4.2 10.9 19.2 7 13.3 113.8 3 120.8 1.1 13.4 4.9 14 2.1 228.8 44.7 38.8 81.4 9.73 37.7 7.57
0.7 99.83 661 3 4.1 8.4 19.2 7.9 12.9 152.8 2 117.6 1 14.4 4.9 14 1.5 234.1 45.1 39.3 81.4 9.83 36.7 7.47
1.7 99.85 507 2 4.9 11.9 18.6 7 12.7 126.8 3 143.6 1 14.4 4.8 15 1.5 231.8 44.4 38.3 80.4 9.69 37.4 7.44
1.2 99.87 367 2 4.2 9.5 17.1 6.8 12.3 113.6 3 117.7 1 13.7 4.7 14 2 218 42.7 35.6 77.2 8.95 36.7 6.75
0.7 99.82 483 2 5.2 4.2 19.8 7.6 13.6 61.9 3 187.4 1.1 15.5 5.7 17 1 251.5 51.5 42.1 90.8 10.48 42 8.01
1.3 99.83 692 1 4.3 7.3 18 6.8 12.8 116.3 2 154.1 1 13.9 5.1 14 4.4 230.2 41.9 36.5 80.3 9.13 36.6 7.28
1.1 99.83 642 2 5.4 3.8 21.8 6.9 13.1 140.3 3 108.6 1.1 16.6 5.5 18 3 258.1 38.7 42.1 92.8 10.47 39.5 7.73
0.8 99.85 505 2 3.9 4 19.2 7.4 12.9 122.5 3 191.7 1 14.3 5.9 16 1.9 249.5 44.2 40.4 87.2 9.73 36.2 7.58

63
4A-4B 4A-4B 4A-4B 4A-4B 4A-4B 4A-4B 4A-4B 4A-4B 4A-4B 2A Leco 2A Leco 1DX 1DX 1DX 1DX 1DX 1DX 1DX 1DX 1DX 1DX 1DX 1DX 1DX 1DX
Eu Gd Tb Dy Ho Er Tm Yb Lu TOT/C TOT/S Mo Cu Pb Zn Ni As Cd Sb Bi Ag Au Hg Tl Se
PPM PPM PPM PPM PPM PPM PPM PPM PPM % % PPM PPM PPM PPM PPM PPM PPM PPM PPM PPM PPB PPM PPM PPM
0.02 0.05 0.01 0.05 0.02 0.03 0.01 0.05 0.01 0.02 0.02 0.1 0.1 0.1 1 0.1 0.5 0.1 0.1 0.1 0.1 0.5 0.01 0.1 0.5
1.02 7.24 1.31 7.78 1.54 4.59 0.71 4.27 0.65 0.07 1.1 1.4 24.9 14.1 124 3 33.4 0.3 6 0.3 0.2 0.6 0.21 1.3 <0.5
0.94 7.25 1.29 7.27 1.53 4.6 0.7 4.24 0.68 0.03 0.43 0.5 18.6 9.1 90 1.3 6.7 0.2 1.8 0.3 <0.1 <0.5 0.03 0.8 <0.5
0.77 5.73 1.05 6.15 1.26 3.69 0.55 3.37 0.54 0.15 <0.02 0.6 22.5 10.7 96 1.3 4.3 0.3 1 0.3 <0.1 <0.5 0.04 0.4 <0.5
0.93 6.83 1.24 7.37 1.51 4.5 0.66 4.33 0.64 0.03 <0.02 0.5 9.8 5.1 86 1.4 1.3 0.1 0.6 0.1 <0.1 <0.5 0.01 0.6 <0.5
0.78 6.21 1.09 6.51 1.36 4.17 0.62 3.92 0.59 0.64 <0.02 0.6 6.9 10.3 92 1.9 2.4 0.2 0.3 0.3 <0.1 0.8 0.05 0.3 <0.5
0.84 6.9 1.23 7.35 1.49 4.57 0.71 4.34 0.67 0.03 <0.02 0.8 15.8 22.7 102 2.3 2.1 0.5 0.6 0.7 0.2 <0.5 0.03 0.9 <0.5
0.94 6.92 1.24 7.65 1.53 4.73 0.7 4.64 0.72 0.08 <0.02 0.8 8.2 6.8 99 0.9 0.5 0.3 0.6 0.2 <0.1 <0.5 0.02 0.5 <0.5
1.01 6.96 1.24 7.33 1.55 4.91 0.69 4.58 0.69 0.02 <0.02 0.7 19.6 8.2 66 1 <0.5 0.2 0.3 <0.1 <0.1 <0.5 0.02 0.6 <0.5
1 6.85 1.21 7.29 1.58 4.62 0.71 4.63 0.72 0.27 <0.02 0.6 2.5 9.6 93 1.5 0.6 0.2 0.2 0.2 <0.1 <0.5 <0.01 0.6 <0.5
0.85 6.65 1.16 7.42 1.5 4.72 0.69 4.36 0.66 0.19 0.07 0.6 43.5 7.8 89 1.5 0.7 0.1 0.6 0.1 <0.1 <0.5 <0.01 0.7 <0.5
1.09 7.55 1.36 9.05 1.79 5.35 0.8 5.29 0.78 0.03 <0.02 0.6 153.9 5.5 65 1.9 0.5 0.3 0.6 <0.1 0.2 <0.5 0.02 0.2 <0.5
0.9 6.54 1.16 7.26 1.51 4.67 0.69 4.53 0.66 0.24 0.09 0.6 29.5 11.7 82 1.7 1.1 0.1 0.6 0.1 <0.1 <0.5 0.02 0.5 <0.5
0.96 6.89 1.23 7.63 1.5 4.33 0.65 4.18 0.64 0.1 0.05 1.1 23.8 9.6 97 2.8 1.6 0.3 0.7 0.2 <0.1 <0.5 0.04 0.5 <0.5
0.92 6.89 1.26 7.91 1.57 4.8 0.71 4.34 0.65 0.07 0.03 0.8 15 9.3 94 2.6 1.9 0.2 0.9 0.3 <0.1 <0.5 0.02 0.5 <0.5

64
Appendix II : dacitic rocks used as comparison to the Rockliden dacitic rocks. From Montelius, 2005 (Maurliden) and Schlatter, 2007 (Petiknäs).
SiO2 TiO2 Al2O3 Fe2O3 MnO MgO CaO Na2O K2O P2O5 Total Ba Cu Zn Pb Ag As Sb Bi Tl V Ni Co Sc
(%) (%) (%) (%) (%) (%) (%) (%) (%) (%) (%) (ppm) (ppm) (ppm) (ppm) (ppm) (ppm) (ppm) (ppm) (ppm) (ppm) (ppm) (ppm) (ppm)
M58A 75.64 0.32 12.09 4.06 0.05 0.55 1.24 3.49 1.4 0.1 100.77 288 22 122 <5 <0.5 <5 1.5 <0.2 0.1 <5 87 2 22
6020180.9 72.91 0.359 12.63 1.32 0.14 1.21 2.1 0.3 3.35 0.1 98.86 328 47 85 540 <0.5 14 4.3 0.3 1 <5 <15 2 18
M36 68.91 0.34 11.89 5.87 0.14 1.54 3.22 2.6 2.3 0.11 100.72 259 <10 92 <5 <0.5 <5 1.8 <0.2 0.1 <5 <10 2 19
Maur65-463 68.43 0.359 12.11 6.07 0.1 1.82 3.58 1.68 2.01 0.1 99.92 343 35 78 3 0.1 5 1.6 0.1 0.1 12 <0.1 5 17
M61-224 71.44 0.44 14.54 5.24 0.07 3.22 0.22 0.47 2.13 0.12 100.85 246 <10 98 17 <0.5 49 1 0.2 0.5 16 <10 4 22
MAUR-80112-39.05m 53.18 0.393 12.75 13.47 0.37 1.84 9.75 1.57 0.33 0.1 99.87 86 18 108 4 0.2 17 4.3 0.1 0.7 24 0 16 18
65394.65M 61.48 0.425 12.32 7.58 0.15 1.72 6.46 1.66 1.69 0.1 100.66 164 30 61 <5 <0.5 <5 1.5 <0.2 0.2 77 <15 11 21
AVERAGE MAURLIDEN 67.43 0.38 12.62 6.23 0.15 1.70 3.80 1.68 1.89 0.10 100.24 244.86 30.40 92.00 141.00 0.15 21.25 2.29 0.18 0.39 32.25 43.50 6.00 19.57
Std Dev 7.69 0.04 0.90 3.75 0.11 0.81 3.29 1.12 0.92 0.01 0.73 91.63 11.41 19.99 266.08 0.07 19.19 1.40 0.10 0.36 30.25 61.52 5.45 2.07
% Dev 11.41 11.77 7.14 60.13 72.72 47.63 86.80 66.51 48.78 7.54 0.73 37.42 37.55 21.73 188.71 47.14 90.31 61.12 54.71 92.79 93.79 141.42 90.78 10.58
PETS-BH68-374.2m 70.43 0.402 15.34 4.01 0.06 1.6 1.3 5.48 1.21 0.079 99.9 316 11 56 3 0.1 3.3 0.9 0.1 0.2 15 1.9 6.3 16
PETS-BH662-91.35m 70.43 0.489 15.12 4.43 0.08 1.45 2.63 2.96 2.12 0.125 99.78 696 5 63 3 BDL 1.3 0.3 0.1 0.1 59 1.3 6.4 18
~Re 76 71.21 0.639 13.39 6.24 0.15 1.01 1.88 4.22 0.98 0.182 100.02 212 3 121 1 BDL 0.6 0.2 BDL BDL 3 BDL 3.7 20
PETS-BH9-171.65m 65.49 0.646 16.37 6.99 0.16 1.27 3.63 1.66 3.51 0.123
323 3 121 4 BDL 0.3 0.1 0.1 BDL 5 0.3 3 24
~220604-04 75.79 0.551 11.99 7.01 0.03 1.32 0.13 0.13 2.71 0.162
1028 123 42 5 0.2 115 0.7 0.7 BDL 3 1.6 1 17
AVERAGE PETIKNÄS 70.67 0.55 14.44 5.74 0.10 1.33 1.91 2.89 2.11 0.134 99.90 515.0 29.0 80.6 3.2 0.2 24.1 0.4 0.3 0.2 17.0 1.3 4.1 19.0
STD DEV 3.7 0.1 1.7 1.4 0.1 0.2 1.3 2.1 1.0 0.0 0.1 340.7 52.6 37.6 1.5 0.1 50.8 0.3 0.3 0.1 24.0 0.7 2.3 3.2
% DEV 5 19 12 25 59 17 69 73 50 30 0 66 182 47 46 47 211 78 120 47 141 54 56 17
Average ROE 69.86 0.62 13.63 4.55 0.04 1.05 2.82 3.24 2.62 0.13 490.50 28.18 91.07 10.04 0.20 4.39 1.06 0.26 0.60 14.86 1.79 4.50 21.00
ROE/MAUR 1.04 1.63 1.08 0.73 0.30 0.62 0.74 1.93 1.39 1.26 0.00 2.00 0.93 0.99 0.07 1.33 0.21 0.46 1.48 1.56 0.46 0.04 0.75 1.07
ROE/PETI 0.99 1.13 0.94 0.79 0.46 0.79 1.47 1.12 1.24 0.98 0.00 0.95 0.97 1.13 3.14 1.33 0.18 2.40 1.03 4.00 0.87 1.41 1.10 1.11

65
Rb Sr Cs Ga Mo Sn W Hf Ta U Th Nb Y Zr La Ce Pr Nd Sm Eu Gd Tb Dy Ho Er Tm Yb Lu
(ppm) (ppm) (ppm) (ppm) (ppm) (ppm) (ppm) (ppm) (ppm) (ppm) (ppm) (ppm) (ppm) (ppm) (ppm) (ppm) (ppm) (ppm) (ppm) (ppm) (ppm) (ppm) (ppm) (ppm) (ppm) (ppm) (ppm) (ppm)
16 90 <0.5 14 1 1 <0.5 3.1 0.3 1.8 2.6 4 31 100 14 30 3.5 16 3.9 0.9 4.3 0.8 5.1 1.2 4 0.7 4.4 0.8
51 43 0.7 17 <2 <1 <0.5 3.4 0.3 2.8 2.8 5.4 22.8 122.5 15.6 32.4 4.1 17.2 4.1 1.2 4.7 0.8 5 1 2.7 0.4 2.4 0.3
20 86 0.9 13 <0.5 <1 <0.5 3.1 0.2 1.7 2.4 4 34 102 13 28 3.4 15 4.1 0.9 4.6 0.8 5.4 1.2 3.9 0.6 4 0.7
25 89 0.4 15.6 1 1 0.5 3.4 0.3 1.9 2.7 4.2 39.1 116.1 14.1 28.6 3.7 16.8 4.3 0.9 4.9 1 6 1.3 3.9 0.6 4.3 0.7
24 34 <0.5 15 1 2 <0.5 3.3 0.2 1.7 2.5 4 30 105 9.3 20 2.7 12 3.5 0.7 4.2 0.8 4.7 1.1 3.5 0.6 3.6 0.6
5 110 0.2 15.4 1 2 0.4 3.3 0.3 1.7 2.6 4 47.6 108.5 12.8 29.1 3.7 16.3 4.4 1.2 5.2 0.9 6 1.3 4.3 0.7 4.5 0.8
19 82 <0.5 14.7 <2 <1 <0.5 2.6 0.2 1.3 1.9 2.5 26.5 91.2 10.5 22.6 3.1 12.9 3.3 0.9 3.7 0.7 4.4 1 2.9 0.5 2.9 0.4
22.86 76.29 0.55 14.96 1.00 1.50 0.45 3.17 0.26 1.84 2.50 4.01 33.00 106.47 12.76 27.24 3.46 15.17 3.94 0.96 4.51 0.83 5.23 1.16 3.60 0.59 3.73 0.61
14.06 27.41 0.31 1.26 0.00 0.58 0.07 0.28 0.05 0.46 0.29 0.84 8.27 10.42 2.18 4.36 0.45 2.00 0.41 0.18 0.49 0.10 0.61 0.13 0.60 0.11 0.81 0.20
61.53 35.94 56.53 8.46 0.00 38.49 15.71 8.87 20.79 25.04 11.78 20.96 25.07 9.78 17.10 16.01 13.13 13.18 10.34 18.94 10.96 11.48 11.72 11.00 16.59 18.25 21.66 31.77
27 108 0.8 16 0.6 1 0.1 4.1 0.4 2.4 5 7 22 139 15.2 33.1 4.3 17.8 3.8 0.9 3.4 0.6 3.2 0.7 2.1 0.3 2.1 0.4
34 158 0.6 17 1.1 1 0.8 3.8 0.4 2.1 4 6 21 121 19.9 42.3 5.5 20.3 4.5 1.2 3.9 0.6 3.7 0.7 2.2 0.3 2.2 0.4
17 94 0.2 20 0.2 BDL 0.3 4 0.3 1.2 3 7 21 141 17.1 39.1 5 19.9 3.9 1 3.9 0.6 3.3 0.8 2.2 0.4 2.5 0.4
51 68 0.3 21 2.1 2 0.5 5 0.4 1.9 5 9 42 179 26.8 59.3 7.3 31.7 7.4 1.8 6.5 1 7 1.6 4.3 0.6 4.5 0.7
41 26 0.3 21 1.2 2 0.1 4 0.4 1.3 4 8 36 146 4.5 8.2 0.9 4 2 0.3 3.4 0.8 5.2 1.2 3.4 0.6 3.5 0.6
34.0 90.8 0.4 19.0 1.0 1.5 0.4 4.2 0.4 1.8 4.2 7.4 28.4 145.2 16.7 36.4 4.6 18.7 4.3 1.0 4.2 0.7 4.5 1.0 2.8 0.4 3.0 0.5
13.0 48.8 0.3 2.3 0.7 0.6 0.3 0.5 0.0 0.5 0.8 1.1 9.9 21.1 8.1 18.5 2.3 9.9 2.0 0.5 1.3 0.2 1.6 0.4 1.0 0.2 1.0 0.1
38 54 57 12 69 38 82 11 12 29 20 15 35 15 49 51 51 53 45 52 31 25 36 39 34 34 35 28
121.77 136.64 6.73 18.63 0.73 2.86 2.01 7.04 1.04 5.12 14.64 12.99 43.24 233.50 38.61 82.04 9.64 37.26 7.35 0.93 6.82 1.22 7.43 1.52 4.59 0.69 4.36 0.66
5.33 1.79 12.23 1.25 0.73 1.90 4.46 2.22 4.03 2.78 5.86 3.24 1.31 2.19 3.03 3.01 2.79 2.46 1.87 0.97 1.51 1.47 1.42 1.31 1.27 1.17 1.17 1.08
3.58 1.50 15.29 0.98 0.70 1.90 5.58 1.68 2.73 2.88 3.49 1.76 1.52 1.61 2.31 2.25 2.10 1.99 1.70 0.89 1.61 1.69 1.66 1.52 1.62 1.56 1.47 1.33

66