compositional differences between felsic volcanic rocks
TRANSCRIPT

Kurkura et al., (MEJS) Volume 1 (1): 4 – 35, 2009
Compositional Differences between Felsic Volcanic Rocks from the Margin and Center of the Northern Main Ethiopian Rift
*Kurkura Kabeto1, 2, Yoshihiro Sawada2, Barry Roser2
1 Department of Earth Science, College Natural and Computitional Sciences, Mekelle University, P.O.Box 231, Mekelle, Ethiopia. (*[email protected]/ [email protected]) 2 Department of Geosciences, Shimane University, Matsue 690-8504, Japan
ABSTRACT Pliocene felsic rift margin and Quaternary rift center volcanic rocks from the northern Main Ethiopian Rift (MER) exhibit contrasts in major and trace element contents and Sr-Nd isotopic ratios. Quaternary rift center felsic volcanic rocks are mainly peralkaline trachytes and rhyolites, whereas Pliocene felsic rift margin volcanic rocks are represented by benmoreites, weakly peralkaline trachytes and rare rhyolites. Most of the felsic rift margin volcanic rocks have greater Al2O3, K2O, Nb, Zr, Rb, and Sr, and lesser CaO, Zr/Nb, and CaO/Al2O3 than rift center volcanic rocks. These contrasts may have been inherited from differences in the compositions of their parental basic magmas, which were produced by variable degrees of partial melting. In both series, the felsic volcanic rocks generally have higher initial Sr- isotopic (0.7038-0.7073) ratios than their basic equivalents (0.7035-0.7046). Nd- isotopic ratios of most felsic rift center samples (0.5129-0.5126) are similar to their associated basic volcanic rocks. In contrast, the Nd-isotopic ratios (0.5128-0.5124) of felsic rift margin volcanic rocks are commonly lower than their companion basic volcanic rocks (0.512806-0.512893), and are relatively lower than rift center equivalents. The elemental and Sr-Nd isotopic compositions of the volcanic rocks suggest that fractional crystallization from differing basic parents accompanied by a limited assimilation (AFC) was the dominant process controlling the genesis of the MER felsic volcanic rocks. Keywords: Ethiopia; Northern Main Ethiopian Rift; Bimodal Volcanism; parental difference;
Sr-Nd Isotopes, Fractional Crystallisation 1. INTRODUCTION
The Main Ethiopian Rift (MER), the Southwestern Ethiopian Rift Zone (SWERZ), the Tana Rift
and the Afar region represent the northernmost part of the East African Rift System (Fig. 1). The
Ethiopian volcanic province is dominated by up to 300,000 km3 of generally fissure-fed Mid-
Tertiary basic (SiO2 < 53 wt.%) volcanic rocks, and minor associated felsic (SiO2 > 53 wt.%)
products. However, the proportion of felsic products in the Ethiopian rift valley itself is high,
reaching about 90% of the total volume (Mohr, 1992).
Mekelle University ISSN: 2073-073X 4

Kurkura et al., (MEJS) Volume 1 (1): 4 – 35, 2009
Between 45 and 22 Ma, volcanic activity in the Ethiopian plateau (Figs. 1a and b) was
characterized by fissural flows. Central volcanoes covered the fissural flows beginning at about
30 Ma and 15-13 Ma, and erupted intermittently into the Pleistocene (Morton et al., 1979;
WoldeGabreil et al., 1990; Wolde, 1996; Stewart and Rogers, 1996; Chernet et al., 1998; Pik et
al., 1998; Ayalew et al., 2002). Recent geochemical and isotopic studies have focused on the
Oligocene-Miocene to Quaternary basic-felsic volcanism that accompanied the formation of the
MER. These studies have proposed the involvement of distinct mantle components in various
proportions, and the importance of the Afar mantle plume and lithospheric mantle in the sources
of the basic lavas (Fig. 1).
Figure 1. Maps showing the location of the study area. a) Index map showing surface expression of the Ethiopian rift system and volcanic cover (Wolde, 1996) and the Ethiopian Plateau (EP, Stewart and Rogers, 1996). b) Volcanic and tectonic structures of the MER. The white ellipses are the study areas. N (northern), C (central), and S (southern) sectors of the MER; SWERZ is the southwestern Ethiopian Rift Zone. c) Sample sites, felsic volcanic centers and volcanic and tectonic structures of the Addis-Nazreth region. YTVL Yerer Tulu Welel Volcano Tectonic Lineament from Abebe et al. 1998.
Although the previous studies have
provided a well-documented
framework for the genesis of the
basic magmas in MER, the
associated felsic magmas are not
well studied. Recently, several
geochemical and isotopic studies of
felsic products have been carried out in the rift center at Debre Zeit, Gedemsa, and Asela-Ziway
Mekelle University ISSN: 2073-073X 5

Kurkura et al., (MEJS) Volume 1 (1): 4 – 35, 2009
(Fig. 1) (Gasparon et al., 1993; Peccerillo et al., 1995; Trua et al., 1999; Abebe et al., 1998;
Boccaletti et al., 1999), on volcanic rocks which are mostly younger than 2 Ma. The felsic
volcanic products at the rift margin (Addis Ababa) and rift center (Nazreth) regions and their
compositional variations are not yet well studied.
This paper presents new elemental and Sr-Nd isotope data for selected volcanic sequences from
the northern sector of the MER (Fig. 1). Based on the petrographic, geochemical, and isotopic
characteristics of the volcanic units, we describe the compositional differences between the
volcanic rocks at the rift margin and rift center, and discuss the petrogenetic relationships
between basic and felsic magmas in order to assess the influence of basic parents and continental
crust in the genesis of the felsic melts.
2. GEOLOGICAL SUMMARY OF THE ADDIS ABABA AND NAZRETH REGIONS
The study area is located in the center of the Ethiopian dome (Fig 1), and contains volcanic
sequences that are directly related to the northern Main Ethiopian Rift (MER) activity. Re-
evaluation of seismic refraction data for the region by Makris and Ginzburg (1987) revealed
thinning of the crust from 44 km thick at Addis Ababa to 30-26 km in the center of the MER to
the east. This led Wolde (1996) to regard the volcanic sequences at Debre Zeit and to its east as
rift center, and Miocene to Pliocene volcanic rocks in the Addis Ababa region, west of Debre
Zeit as rift margin.
On the basis of whole-rock and mineral K-Ar and 40Ar-39Ar ages, Morton et al. (1979) and
Chernet et al. (1998) found that the volcanic cover extending from Addis Ababa to Nazreth
showed age progression from 22.8 Ma in plateau basalts to 0.21 Ma in the rift center volcanic
rocks. At the base of the rift margin volcanic rocks, alkaline-transitional basalt (22.8 Ma) of the
Plateau unit is in fault contact with the overlying Intoto unit (22.2-22 Ma) (Morton et al. 1979;
Chernet et al. 1998). The Intoto unit consists of trachyte-rhyolite flows and associated
ignimbrites at its base (22.2 Ma) and plagioclase phyric basalt (22 Ma) in its upper part. The
Early Miocene Plateau and Intoto units represent bimodal volcanic rocks, which were formed
during a localized terminal episode following the massive Oligocene fissural basalt activity of
the northwestern Ethiopian plateau and are present at the rift margin in the Addis Ababa region
(Morton et al., 1979; Begazi et al., 1993; Chernet et al., 1998). Because of their close
realationship, the Plateau and Intoto units are here collectively referred to as the Plateau unit
Mekelle University ISSN: 2073-073X 6

Kurkura et al., (MEJS) Volume 1 (1): 4 – 35, 2009
(22.8-22 Ma). The geochemical data for the Plateau unit is not discussed in this paper because
they are pre-rifting eruptions.
Volcanic activity resumed at the rift margin after a considerable hiatus between 22-10 Ma, by
eruption of transitional-alkaline basalts of the Addis Ababa unit (9-7 Ma). This was followed by
the welded trachytic tuffs (5.1 and 3.3 Ma) of the Nazreth unit, which are thought to have been
derived from the mostly trachytic Pliocene (4.6-3.09 Ma) Wechecha, Menagesha, Furi, and
Yerer volcanoes (Fig. 1). These centers are collectively designated as the Wechecha unit
(Chernet et al., 1998).
Predominantly felsic volcanic products were erupted in the Debre Zeit and Nazreth regions in the
rift center between 2.0-0.20 Ma. This sequence consists of the Nazreth, Keleta, Boku-Tede,
Bofa, Dera-Sodere, Gedemsa, Boseti, and Melkasa units in ascending order (Fig. 1; Boccaletti et
al., 1999). For simplicity, the felsic volcanic rocks of Nazreth, Keleta, Boku-Tede, and Dera-
Sodere units are here grouped as the Nazreth unit, whereas the basaltic rocks of the Bofa and
Melkasa units are collectively termed the rift center basic volcanic rocks.
3. CLASSIFICATION AND PETROGRAPHIC SUMMARY
Most of the samples investigated here were fresh, and collected from lava flows, except for a few
welded ignimbrites from the rift center (Table 1). According to the TAS classification diagram
(Le Bas et al., 1986) the rock types in both areas range from basalt to rhyolite, but trachytes and
rhyolites predominate (Fig. 2). The rocks fall in numerous compositional fields, making
terminology cumbersome. Therefore, a restricted set of terms has been adopted here. Rock
samples with SiO2 < 53 wt.% are defined as basic, whereas samples with SiO2 > 53 wt.% are
classed as felsic. In common with many bimodal suites in continental rifts and oceanic islands,
the basic rocks at the rift margin are generally alkaline or transitional, whereas rift center
equivalents are typically transitional (Wolde, 1996) (Fig. 2). Strongly felsic alkaline rocks at the
rift margin and center are weakly peralkaline and strongly peralkaline, respectively (Table 1).
According to Macdonald (1974), most of the peralkaline felsic volcanic rocks are commendites
with rare pantellerites. However, most of the Gedemsa unit samples are pantelleritic (Peccerillo
et al., 1995) (not shown in Figure).
Mekelle University ISSN: 2073-073X 7

Kurkura et al., (MEJS) Volume 1 (1): 4 – 35, 2009
Petrographically, the basic rocks in both rift margin and center are usually aphyric. Porphyritic
samples on the other hand are rare and contain about 15-25% phenocrysts. The phenocryst
minerals are olivine, clinopyroxene, and plagioclase with or without opaques. The groundmass
of the basic lavas consists of the above phenocryst phases and accessory glass, zircon, apatite,
and titanite, along with secondary alteration products including sericite/carbonate, iddingsite, and
hematite. Loss on ignition values in these samples differ little from the unaltered samples (Table
1).
Figure 2. Classification of volcanic rocks of the northern MER according to the scheme of Le Bas et al. (1986). The alkaline-sub-alkaline boundary is from Irvine and Baragar (1971). Additional data for the volcanic rocks from Abebe et al. 1998), Chernet (1995) and Peccerillo et al. (1995).
The felsic volcanic rocks in the rift
margin are relatively aphyric
compared to the basic rocks, and
generally show trachytic textures.
The phenocryst minerals (<15%)
are commonly plagioclase (albite-
oligoclase) and anorthoclase, and
lesser sanidine, nepheline, alkali amphibole (rebeckite), and aegirine-augite (Chernet, 1995;
Abebe et al., 1998). Plagioclase and anorthoclase are the common phenocryst minerals in the rift
margin felsic volcanic rocks. Groundmass contains plagioclase, K-feldspars, opaques, augite,
and aegirine-augite. Some feldspar grains show melt inclusions along their margins, and rarely
amphiboles are altered.
The felsic rift center volcanic rocks contain similar type of minerals as their rift margin
equivalents. Majority of the samples are aphyric, but few samples containing up to 35%
phenocryst phases with both felsic and ferromagnesian minerals forming the phenocryst and
groundmass phases. Felsic minerals are usually sanidine, quartz, sodic plagioclase, and
anorthoclase, whereas the ferromagnesian minerals are aegirine-augite, sodic-amphibole, olivine,
Mekelle University ISSN: 2073-073X 8

Kurkura et al., (MEJS) Volume 1 (1): 4 – 35, 2009
and opaques. Both the lavas and ignimbrites contain the same minerals, but differ in their
textures. The lavas commonly show perlitic cracks/spherulitic groundmass textures, whereas
ignimbrites show eutaxitic textures with dominantly vitrophyric fiamme groundmasses.
4. GEOCHEMISTRY
4.1. Analytical Procedures
Out of 125 collected samples, 75 selected samples from each unit were analyzed for major and
trace elements and Sr-Nd isotopes (Table 1) in the Department of Geoscience, Shimane
University, Japan. Samples were crushed in a tungsten carbide ring mill (Roser et al., 1998), and
dried at 1100C for 24 hours. No significant Nb or Ta contamination was present in the carbide
ring mill compared to that ground in agate (Roser et al., 1998). The remaining XRF data will be
provided upon request. Major and trace element analyses were performed using glass beads
prepared either by fusing 0.7g of rock powder mixed with 3.5g of Li2BB4O7 (Norrish and Hutton,
1969) or by mixing 1.8g sample with 3.6g alkali flux (LiBO2:LiB4O7 = 1:4) (Kimura and
Yamada, 1996). Analyses were made using a Rigaku RIX 2000 X-ray fluorescence spectrometer,
using conventional peak/background methods, with calibration against a suite of Geological
Survey of Japan (GSJ) and USGS rock standards. The reproducibility was monitored with
appropriate international standards JB01, JB02, and JB03, and was within +10% for all elements
with concentrations higher than 10 ppm.
Sr- and Nd- isotopic measurements and analyses of Sm and Nd (by isotope dilution) were carried
out using Finnigan MAT262 thermal ionization mass spectrometer, following the methods of
Iizumi et al. (1994, 1995). Measured 87Sr/86Sr and 143Nd/144Nd ratios were normalized to 87Sr/88Sr = 0.1194 and 146Nd/144Nd = 0.7219. During the analysis of unknowns, measurements of 87Sr/86Sr and 143Nd/144Nd in NBS 987 and JMC standard samples were 0.71026 ± 18 (2σ, n = 10)
and 0.51196 ± 10 (2σ, n = 10), respectively (Table.1)
4.2. Major Element Data
Whole rock analyses and Sr-Nd isotope data of representative samples are listed in Table 1. The
remaining data are available upon request. The basic (SiO2 < 53 wt.) rocks have MgO contents
between 4 and 14 wt.%, Mg-numbers (mg#) between 50 and 74, Ni ≤ 380 ppm and Cr ≤ 822
ppm. Most of these values suggest that very few rocks represent the primary mantle melts (Sato,
Mekelle University ISSN: 2073-073X 9

Kurkura et al., (MEJS) Volume 1 (1): 4 – 35, 2009
1977; Wilson, 1989). Majority of the samples having mg# between 44 and 50 suggest that they
do not represent primary magma compositions (Table.1).
Figure 3. Plots of selected major elements (wt.%) against differentiation index (SiO2) for northern MER volcanic rocks. Symbols as in Fig. 2.
Selected major and trace
elements plotted against
SiO2 are shown in Figs. 3, 4
and 5. With the exception of
two intermediate samples,
all the felsic rocks have SiO2
> 57 wt.%, and an apparent
SiO2 gap (53-57 wt.%)
exists between the basic and
felsic volcanic rocks. In all
volcanic sequences MgO,
∑FeO and CaO generally
decrease with increasing
SiO2 and K2O (Fig. 3).
However, Na2O contents
increase from about 2 wt.%
in the basic volcanic rocks
to about 7 wt.% in the felsic
rocks (at 65 wt.% SiO2), and
felsic samples. In the Boseti
unit, however, Na
0
5
10
15
20
0
1
2
TiO2
0
3
6
9
12
FeOtot
6555450
3
6
9
12
CaO
15
0
5
10
MgO
0.0
1.0
P2O5
0
2
4
6
8
Na2O
756555450
2
4
K2O
SiO2SiO275
0.5
1.5
Al2O3
Wt.%
oxi
de
then decreases to 4.2 wt.% increasing SiO2 (>70%) in most of the
2O continues to increase in some of the felsic rocks. Al2O3 contents in basic
samples range from 13.0 to 21.3 wt.%, maintain similar values (13.3-17.5 wt.%) in felsic
samples through to 65 wt.% SiO2, and then decrease to values as low as 9.2 wt.% at 75 wt.%
Mekelle University ISSN: 2073-073X 10

Kurkura et al., (MEJS) Volume 1 (1): 4 – 35, 2009
SiO2. P2O5 and TiO2 contents also tend to increase from basic to intermediate compositions (up
to 55 wt.% SiO2), and then sharply decrease up to 65 wt.% SiO2 and remain flat (Fig. 3).
Figure 4. Plots of selected trace elements (ppm) against differentiation index (SiO2 wt.%) for northern MER volcanic rocks. The lines on the Zr, Nb, Sr and Rb versus SiO2 illustrate the compositional contrasts between the volcanic rocks in the rift center and margins. The shaded area on the Zr and Nb plots indicate where samples from the Furi and Yerer Mountains overlap samples from the rift center. Symbols as in Fig. 2.
Mekelle University ISSN: 2073-073X 11

Kurkura et al., (MEJS) Volume 1 (1): 4 – 35, 2009
Compositional differences exist between the rift margin and rift center volcanic rocks (Table 1;
Fig. 3). For example, CaO contents in the rift center basic rocks (9.4-11.3 wt.%) are generally
higher than most of the rift margin equivalents (7.7-10 wt.%), except in few clinopyroxene-
phyric samples from the Addis Ababa unit that are younger (10.9-12.5 wt.%). In contrast, Al2O3
contents of most rift margin basic volcanic rocks are higher (14.8-18.6 wt.%) compared to the
rift center equivalents (13-17.5 wt.%).
The contrasts in CaO and Al2O3 seen in the basic lavas of the two regions are also apparent in the
felsic volcanic rocks. Al2O3 contents are greater in most of the felsic rift margin volcanic rocks
than in the rift center, whereas CaO contents are generally greater in the rift center (Fig. 3). K2O
concentrations are generally greater and ∑FeO contents lesser in the rift margin felsic volcanic
rocks than in the rift center. However, the above compositional differences become less
pronounced in samples with SiO2 contents > 67 wt.%. Rift center felsic samples are generally
richer in SiO2 than most from the Wechecha (Pliocene) unit at the rift margin (Fig. 3)
4.3. Trace Element Data
In both the rift margin and rift center volcanic sequences, compatible elements such as Ni, Co,
and Cr decrease in abundance with increasing SiO2 (Table 1). This indicates the influence of
olivine, clinopyroxene, and Fe-Ti oxide fractionation. Zr, Nb, Y, and Rb, being incompatible
elements show increase in their concentration with fractionation within each rock series, albeit
with some scatter (Fig. 4). Sr and Ba contents in the felsic volcanic rocks generally decrease with
fractionation, representing compatible behavior, though they too show wide variations.
Most rift margin basic lavas have greater Zr and Nb contents than do the rift center basic lavas.
Moreover, at given SiO2 content Sr is much more enriched in rift margin basic lavas than in their
rift center equivalents (Fig. 4, Table 1). Zr, Nb, Sr, and Rb are also generally more enriched in
their rift margin felsic rocks than in Quaternary rift center felsic equivalents. However, Y and Ba
abundances mostly overlap, as does Sr at > 65 wt.% SiO2. Among the Wechecha felsic samples,
high Zr and Nb are observed in the Menagesha and Wechecha mountain samples (Table 1),
whereas relatively low Nb and Zr contents characterise samples from the Furi and Yerer
mountains (Fig. 4).
4.4. Nd- and Sr- Isotope Data
Twenty-eight samples spanning the compositional range from the least fractionated MgO-rich
rocks to the most fractionated rhyolite samples were analysed for Sr- and Nd- isotopes. Isotopic
Mekelle University ISSN: 2073-073X 12

Kurkura et al., (MEJS) Volume 1 (1): 4 – 35, 2009
ratios as shown in table 1 are plotted in figure 5, together with data for 15 samples from Chernet
(1995) and Abebe et al. (1995). Initial 143Nd/144Nd ratios in the basic lavas range from 0.512812
to 0.51289, and from 0.51237 to 0.51286 in the felsic volcanic rocks. Initial 87Sr/86Sr ratios range
from 0.70349 to 0.70456 in the basic lavas, and from 0.70446 to 0.70783 in the felsic volcanic
rocks. The rift margin basic volcanic rocks have higher Nd- and lower Sr- isotopic ratios than rift
center equivalents (Table 1; Fig. 5).
In contrast, felsic volcanic rocks from the rift margin have lower Nd- isotopic ratios than most of
their rift center equivalents. However, their Sr- isotopic compositions are equally variable. The
felsic volcanic rocks extend from the isotopic range of the basic volcanic rocks towards higher 87Sr/86Sr (Fig. 5). Most of the felsic rift center volcanic rocks lie above the Debre Zeit field
(Gasparon et al. 1993), whereas the felsic rift margin volcanic rocks partly overlie it. Rift center
felsic volcanic rocks overlie the field defined by equally felsic lavas from northern Kenya
(Kabeto et al., 2001) (Fig.5).
Figure 5. Initial 87Sr/86Sr and 143Nd/144Nd ratios for volcanic rocks of the study area, compared to west central (WC) Afar and MER (Hart et al., 1989), Debre Zeit (Gasparon et al., 1993), south Ethiopian (Stewart and Rogers, 1996), Asela-Ziway & Chilalo (Trua et al., 1999), northern Kenyan volcanic rocks (Kabeto et al., 2001b), and the East African Carbonatite Line (EACL). Measured 143Nd/144Nd ratio is used for some samples (Table 1). Symbols as in Fig. 2.
5. DISCUSSION
It is well established that compositional differences in parental basaltic magmas are reflected in
the compositions of felsic melts (Wilson et al., 1995; Panter et al., 1997). Fractional
crystallization of basaltic magmas with some crustal assimilation and partial melting of basic
Mekelle University ISSN: 2073-073X 13

Kurkura et al., (MEJS) Volume 1 (1): 4 – 35, 2009
lower crust/underplated igneous rocks were proposed as dominant processes for generation of
felsic melts in the MER rift center (Fig. 1; Gasparon et al., 1993; Abebe et al., 1998; Peccerillo et
al., 1995; Trua et al., 1999; Boccaletti et al., 1999). The influence of different parental magma
compositions and the processes involved in the genesis of felsic melts in the northern sector of
the MER are discussed below.
5.1. Influence of Parental Magma Compositions
The general, elemental contrasts between the rift margin and rift center volcanic rocks discussed
above (Figs. 3 and 4; Table 1) are clearly evident on CaO/Al2O3 vs SiO2, Zr vs Nb, and Zr/Nb vs
Zr plots (Fig. 6). At a given SiO2 content most of the basic rocks (SiO2 < 53 wt.%) from the rift
center are displaced towards higher CaO/Al2O3 ratios (Fig. 6a). Few basic rocks from the rift
margin have CaO/Al2O3 ratios comparable with rift center equivalents, and in both groups the
ratio decreases with fractionation. CaO/Al2O3 ratios remain higher in the felsic rift center rocks
(SiO2 > 53 wt.%) than in rift margin equivalents, but a few felsic samples from the Wachecha
(Furi and Yerer Mts.) unit overlap (Table 1). This may be due to similar fractionating phases
controlling their evolution, or indicate that they were derived from compositionally similar basic
parents.
Zr and Nb contents show a well defined linear correlation (Fig. 6b), and both being incompatible
elements increase with fractionation (Kamber and Collerson, 2000; Kabeto et al., 2001).
Constancy of trace element ratios between basic and felsic melts (e.g., Zr/Nb; Fig. 6b and c) is
often cited as strong evidence that fractional crystallization has been the dominant process in
their evolution (Weaver, 1977; Wilson, 1989). At given Zr content most rift margin samples
show higher Nb contents than do the rift center samples. Kamber and Collerson (2000) have
indicated that Nb is more sensitive to variations in degrees of partial melting than Zr, and hence
can be used to decipher the influence of variable degrees of melting. In this regard, some rift
margin samples from the Furi and Yerer Mountains have Nb contents as low as the rift center
samples (Table 1; Figs. 4 and 6b). It is evident that Yerer and Furi mountains are
compositionally closer to rift center composition than the Wechecha and Menagesha Mountains.
Furthermore, samples from Yerer and Furi are younger and have a narrower age range (2.03-4.04
Ma) than the Wechacha and Mengasha Mountains samples (3.09-6.63 Ma) (Chernet et al., 1998)
(Fig.6).
Mekelle University ISSN: 2073-073X 14

Kurkura et al., (MEJS) Volume 1 (1): 4 – 35, 2009
Plotting Zr/Nb vs Zr (Fig. 6c) also shows that felsic volcanic rocks of the study area fall into two
clusters. Based on their Zr/Nb ratios, most samples from the rift margin plot along Zr/Nb ≤ 5,
whereas rift center volcanic rocks, and the few samples from the Yerer and Furi Mountains with
low Nb contents cluster along Zr/Nb ≥ 6. Similarly, Zr/Nb ratios in the basic rocks of the two
sequences also vary (Fig. 6c). The rift center basic rocks have Zr/Nb ratio ≥ 5, whereas most of
the basalts from the Addis Ababa area that are thought to be parental to the rift margin felsic
volcanic rocks, and a few rift center basic rocks; have Zr/Nb ≤ 5.
Zr/Nb ratios in volcanic rocks may also reflect crustal contamination,titanite fractionation or
variation in degree of partial melting (Wilson et al., 1995; Kamber and Collerson, 2000; Kabeto
et al., 2001). For example, basaltic sample ET1201 from the Plateau unit (Table 1) has a Zr/Nb
ratio of 13.0. ET1201 has a very low initial Nd- isotopic ratio (0.51222 ± 8) compared to other
basic lavas with lower Zr/Nb ratios, which may indicate that the higher Zr/Nb ratio reflects
crustal involvement (Kabeto et al. 2001). Hence, we consider the rift center volcanic rocks
(Zr/Nb > 6), and those rift margin volcanic rocks with Zr/Nb ratios > 5, to reflect either crustal
input, titanite fractionation (Fig. 6c) or different sources.
The clear differences in crustal thickness, extensional tectonics, age of volcanic activity (Morton
et al., 1979; Makris and Ginzburg, 1987; Wolde, 1996; Abebe et al., 1998; Boccaletti et al.,
1999), and compositions of volcanic rocks in the two regions suggest that they were derived
from different parantal magmas. The role of parental basic magma compositions in the rift
margin and center felsic melts must be considered in the light of elevated or depleted absolute
trace and major element abundances and the degree of silica saturation. Furthermore, the effects
of crustal contamination must be accounted for. For example, the silica saturation in the felsic
volcanic rocks in the rift center could be produced by substantial contamination of the basic
magma that is parental to most of the Pliocene rift margin eruptives by silica-rich crust.
However, this is an unsuitable mechanism to produce the felsic volcanic rocks from the rift
center, because open-system behavior would produce higher incompatible trace element
abundances in the more contaminated series (DePaolo, 1981; Nelson and Davidson, 1993). This
is not observed here. Moreover, the Nd- isotopic compositions of the felsic rift center volcanic
rocks lie within the range of basic volcanic rocks in the region (Fig. 5). The lowest Nd- isotopic
ratios are noted only in those felsic volcanic rocks at the rift margin that show higher degree of
contamination.
Mekelle University ISSN: 2073-073X 15
Kurkura et al., (MEJS) Volume 1 (1): 4 – 35, 2009
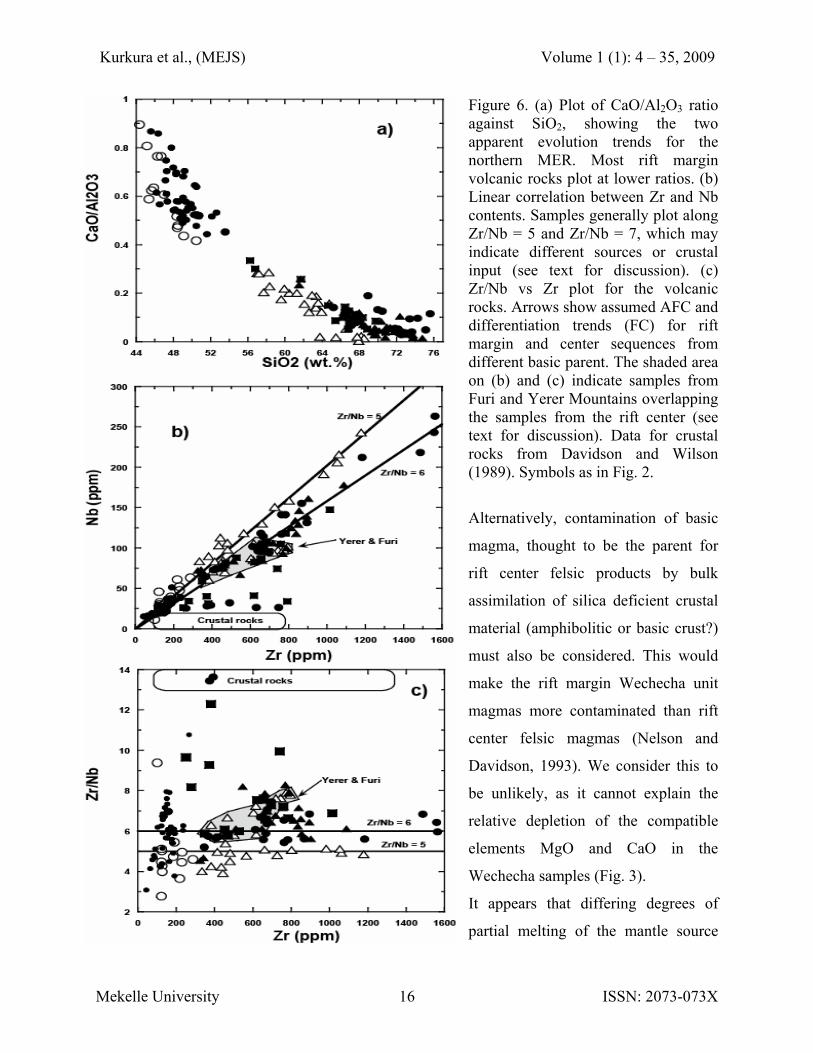
Figure 6. (a) Plot of CaO/Al2O3 ratio against SiO2, showing the two apparent evolution trends for the northern MER. Most rift margin volcanic rocks plot at lower ratios. (b) Linear correlation between Zr and Nb contents. Samples generally plot along Zr/Nb = 5 and Zr/Nb = 7, which may indicate different sources or crustal input (see text for discussion). (c) Zr/Nb vs Zr plot for the volcanic rocks. Arrows show assumed AFC and differentiation trends (FC) for rift margin and center sequences from different basic parent. The shaded area on (b) and (c) indicate samples from Furi and Yerer Mountains overlapping the samples from the rift center (see text for discussion). Data for crustal rocks from Davidson and Wilson (1989). Symbols as in Fig. 2.
Alternatively, contamination of basic
magma, thought to be the parent for
rift center felsic products by bulk
assimilation of silica deficient crustal
material (amphibolitic or basic crust?)
must also be considered. This would
make the rift margin Wechecha unit
magmas more contaminated than rift
center felsic magmas (Nelson and
Davidson, 1993). We consider this to
be unlikely, as it cannot explain the
relative depletion of the compatible
elements MgO and CaO in the
Wechecha samples (Fig. 3).
It appears that differing degrees of
partial melting of the mantle source
Mekelle University ISSN: 2073-073X 16
Kurkura et al., (MEJS) Volume 1 (1): 4 – 35, 2009
provide the best explanation for the compositional differences seen between the two volcanic
sequences (Nelson and Davidson, 1993). A lower degree of melting, deeper partial melting
(Kushiro, 1968; O’Hara, 1968) or melting in the presence of CO2 (Davies and Macdonald, 1987)
could easily have produced incompatible element-enriched magma that differentiated to produce
the most felsic rift margin samples. In contrast, higher degrees of melting could produce
incompatible element depleted magmas that subsequently differentiated to produce the rift center
felsic volcanic rocks.
It has been suggested that basic lavas produced by low degrees of mantle partial melting have
high incompatible element contents (e.g., Zr, Nb, Y, K, and Rb), high Al2O3, and low SiO2 and
CaO (Tatsumi and Kimura, 1991; Wolde, 1996; Kabeto et al., 2001b). In contrast, basic lavas
that are produced by high degrees of partial melting have lower incompatible element and Al2O3
contents, but higher CaO and SiO2. Wolde (1996) has shown that alkali basalts produced by a
low degree of partial melting are common in the western part of the rift and the margin, and are
found only locally east of Debre Zeit (the rift center). In contrast, transitional basalts which
originate from higher degrees of partial melting are commonly found within the rift center,
where thinning of the crust has been identified from seismic refraction studies (Makris and
Ginzburg, 1987). Moreover, Abebe et al. (1995) have suggested that the degree of alkalinity in
basaltic melts increases away from the rift center.
In the northern MER, the felsic melts in the rift center generally have lower Al2O3, K2O, Zr, Nb,
Y, Rb, and Sr and higher SiO2 and CaO than most rift margin equivalents (Figs. 3 and 4). Hence,
the major and trace element contrasts in the felsic products between the two regions could
originate from compositional differences in their basaltic parents. Wilson et al. (1995)
demonstrated that compositional differences between silica-undersaturated and oversaturated
felsic melts in the continental magmatism of the Central Massif (France) were controlled by
subtle compositional differences between their respective basic magmas. In line with this
suggestion Kabeto et al. (2001) have considered that silica-saturated (basalt-trachyte) and silica-
undersaturated (basanite-phonolite) lineages in the northern Kenyan rift sector (Lippard, 1973)
originated from compositional differences in their parental basic magmas, and both felsic by
differentiation combined with a little assimilation. This is also likely to be the case here.
Mekelle University ISSN: 2073-073X 17

Kurkura et al., (MEJS) Volume 1 (1): 4 – 35, 2009
5.2. Fractional Crystallization and/or Degree of Partial Melting
The general decrease of Ni, Cr, Sr, Ba, MgO, CaO, ∑FeO, TiO2, and P2O5 with increasing SiO2
(Figs. 3 and 4; Table 1) indicates that the geochemical evolution of these volcanic rocks was
governed by fractionation of olivine, clinopyroxene, Fe-Ti oxide, feldspars, and apatite. TiO2 and
P2O5 also show to decrease at the same SiO2 content in all rock suites, indicating simultaneous
apatite and Fe-Ti oxide fractionation. Moreover, the general increase in Zr, Nb, Rb, Y, and K
concentrations with increasing SiO2 is also consistent with fractional crystallization from a
similar basic parent, to produce the mugearites, benmoreites, trachytes, and rhyolites of both
regions. The well-defined linear correlation between Zr and Nb contents in the sequences (Fig.
6b and c) also suggests that fractional crystallization was a dominant process.
The Sr- and Nd- isotopic ratios of the felsic lavas (Fig. 5) also do not lie wholly within the
isotopic range of their associated basic lavas, indicating that fractional crystallization was not the
only process responsible for their genesis.
Genesis of the felsic MER volcanic rocks by anatexis of the upper continental crust must be
discarded on the basis of geochemical characteristics. The Afro-Arabian continental crust
displays a wide range of isotopic composition (Davidson and Wilson, 1989; Hegner and
Pallister, 1989; Möller et al., 1998) which is dissimilar to the felsic MER volcanic rocks (Table
1). The Nd- isotopic compositions of most felsic MER volcanic rocks are also more radiogenic
than mean upper crust. Hence, partial melting of the upper continental crust cannot be the source
for the felsic melts. Low degrees of partial melting of basic lower crust and/or underplated basic
magmas as possible source for the felsic melts can be tested by batch melting modeling
calculations (Shaw, 1970; Skjerlie and Johnston, 1993) performed on Rb vs Sr (not shown).
Based on the Sr- isotopic variations between the basic (0.70349 to 0.70456) and felsic (0.70446
to 0.70783) volcanic rocks (Table 1; Fig. 5), it is possible that fractional crystallization might not
be the only process responsible for the generation of felsic lavas. Even if the data appears to be
explained well by fractional crystallization from a basaltic parent, the fractionation stage could
be an open system, and hence some assimilation of crustal material is possible. The estimation of
the extent of contamination by crustal material is complicated by the diversity shown by Arabo-
African basement rocks (Hegner and Pallister, 1989; Davidson and Wilson, 1989; Möller et al.,
1998).
Mekelle University ISSN: 2073-073X 18

Kurkura et al., (MEJS) Volume 1 (1): 4 – 35, 2009
The Sr-Nd isotopic compositions of the felsic volcanic rocks from the rift margin also suggest
that assimilation of crustal material has occurred may be limited. Initial Nd- isotopic ratios,
which are insensitive to small degrees of contamination, are variable and range from 0.51276 to
0.51237. Hence, we favor fractional crystallization from different basic parents, combined with
assimilation of crustal materials, over a combined partial melt and fractionation origin for the
felsic volcanic rocks.
5.3. Assimilation and Fractional Crystallization (AFC)
A conventional way of identifying crustal contamination in a suite is to show that 87Sr/86Sr and 143Nd/144Nd initial ratios vary systematically (increase and/or decrease) with increasing degree of
differentiation. Using SiO2 as a fractionation index, most of the felsic rocks here show an overall
increase in Sr-isotopic ratio (Fig. 7b). Most intermediate samples from the Wechecha and Boseti
units exhibit lower Nd- isotopic ratios than the highly felsic samples, suggesting higher rates of
contamination occurred in the intermediate
lithotypes (Kabeto et al., 2001). The felsic
volcanic samples from the study area
apparently plot along AFC trend (Fig. 7a),
with some scatter.
Figure 7. Plots of (a) initial Sr- and (b) Nd- isotopic ratios against SiO2 for the northern MER volcanic rocks. The felsic rocks plot on two apparent AFC trends. Apparent AFC and differentiation trends (FC) are also shown. The Nd- isotopic ratios also show variations with SiO2 (see text for discussion). Symbols as in Fig. 2.
Few mineral aggregates and resorbed
feldspar with melt inclusions were observed
during our petrographic investigation.
Although this could indicate magma mixing
or assimilation, complete mixing can be
excluded, because no straight line
Mekelle University ISSN: 2073-073X 19

Kurkura et al., (MEJS) Volume 1 (1): 4 – 35, 2009
relationships exist on simple binary plots such as SiO2-MgO (Fig. 3). Therefore, we consider that
magma mixing is a minor process in the genesis of the felsic volcanic rocks.
Figure 8. Graphical presentation of the assimilation-fractional crystallization (AFC) model (DePaolo, 1981). (a) Plot of initial 87Sr/86Sr vs Sr (ppm), model AFC curves calculated using an average Sudanese upper crust as an assimilant (Davidson and Wilson, 1989; 87Sr/86Sr = 0.727967, 143Nd/144Nd = 0.511367, Sr = 426, Nd = 9.6, and Nb = 10 ppm) and starting basic parent ET1602 (Table 1). Symbols as in Fig. 2.
The elemental and Sr-Nd isotopic
compositions (e.g., Table 1; Figs.
4 , 5, 6b, 6c, and 7) of the felsic
rocks provide evidence of
operation of both fractional
crystallization and some crustal
assimilation (AFC) (DePaolo,
1981). AFC calculations were
carried out using sample ET1602
(143Nd/144Nd = 0.512894, and 87Sr/86Sr = 0.70350; Table 1) as
starting basaltic compositions
and using DePaolo’s (1981)
equations (Fig. 8). It is assumed
that the rock examined was little
modified by crustal contamination, and that crustal influence is of minor importance
(isotopically) in the basaltic sample. For example, sample ET1602 has higher 143Nd/144Nd and
lower 87Sr/86Sr ratios than rhyolite ET1302A, which is most radiogenic (87Sr/86Sr = 0.70727 and
Mekelle University ISSN: 2073-073X 20

Kurkura et al., (MEJS) Volume 1 (1): 4 – 35, 2009
143Nd/144Nd = 0.51273). In addition, the isotopic variability among the basalts is very small (Fig.
5; Table 1) compared to the diversity shown by Arabo-African basement rocks (Cohen et al.,
1984; Hegner and Pallister, 1987; Davidson and Wilson, 1989; Halliday et al., 1991; Möller et
al., 1998). Hence, the choice of initial compositions is therefore not critical for the AFC
calculations (Fig. 8).
Several calculations were made taking R (assimilation rate/crystallization rate ratio) to be 0.001,
0.01, 0.1, 0.3, 0.5, and 0.6. For each model, we assumed DSr = 3.2, DNb = 0.3, and DNd = 0.45.
The D values used are similar to those in the compilation of Rollinson (1995). An example of
AFC calculation performed from the average of the Sudanese upper crust (Davidson and Wilson,
1989, 87Sr/86Sr = 0.72797, Sr = 426 ppm, and 143Nd/144Nd = 0.51137, Nb = 9.6, Nd = 24 ppm) is
shown in Fig. 8a and b, with basalt sample ET1602 taken as the basic parent. Assimilation of the
assumed crustal rock by strongly differentiated trachytes and rhyolites at low mass assimilation
to mass crystallization rates (R = 0.001-0.6), and moderate to high F values (> 0.1 on AFC
curves) can produce the samples which exhibit high 87Sr/86Sr, low Sr (< 185 ppm), low 143Nd/144Nd and high Nb (> 200 ppm). 87Sr/87Sr ratios plotted against Sr concentration (Fig. 8a) clearly show the effects of AFC. The
data describes a curved differentiation trend with a sharp inflection around the highly felsic
compositions, reflecting the strong influence of plagioclase fractionation with concomitant
decrease in Sr (Figs. 4 and 8). The hypothetical trend describes the general differentiation trend
among the felsic rocks, along which Ni, Cr, CaO, and MgO contents broadly decrease. Such
hypothetical curves were also tested in the Jebel Marra area of the Sudan (Davidson and Wilson,
1989) and were successfully applied to northern Kenyan felsic lavas (Kabeto et al., 2001), to
examine the evolution of basaltic to trachytic and phonolitic magmas.
Relatively higher rates of assimilation are calculated for intermediate rocks (Fig. 8a and b). This
may be explained by differentiation of intermediate magmas at deeper levels in the crust, where
higher ambient wallrock temperatures and presence of hot basic magmas would facilitate higher
rates of assimilation (Davidson and Wilson, 1989; Macdonald et al., 1995; Panter et al., 1997).
Furthermore, high rates of assimilation (0.3-0.6) are evident for most felsic volcanic rocks from
the rift margin (Fig. 8b), indicating a greater degree of contamination than at the rift center. This
is also in agreement with the thicker crust at the rift margin than at the rift center (Makris and
Ginzburg, 1987).
Mekelle University ISSN: 2073-073X 21

Kurkura et al., (MEJS) Volume 1 (1): 4 – 35, 2009
6. CONCLUSIONS
Studies of the northern Main Ethiopian Rift (MER) volcanic rocks offer insight into the genetic
relations of basic and felsic volcanic rocks, and establish that compositional contrasts occur in
equivalent volcanic rocks at rift margin and center magma series within a single intraplate
continental setting. Higher Al2O3, K2O, Zr, Nb, Sr, and Rb and lower CaO, CaO/Al2O3, and
Zr/Nb concentrations in the rift margin felsic volcanic rocks erupted mostly in the Pliocene
compared to the Quaternary equivalents in the rift center reflect inheritance from their basic
parents. The spatial and temporal distinctions between the volcanic suites in the study area and
their markedly different geochemistry are explained by evolution along separate magma trends.
Hence, alkaline basaltic melts produced by lower degrees of partial melting are a possible source
for most of the felsic volcanic rocks at the rift margin. In contrast, transitional basaltic melts
produced at high degrees of partial melting are thought to be the parent for the felsic volcanic
rocks in the rift center.
Modeling of the geochemical variations suggests that crystal-liquid fractionation processes
within the shallow reservoirs were dominant during most trachyte-rhyolitic production in the rift
center, along with less well-developed AFC processes. AFC appears to play a greater role in the
genesis of intermediate rift center rocks and felsic rocks at the rift margin. We consider this to
partly be a function of depth of fractionation of the magmas, implying that intermediate and rift
margin magmas differentiated at deeper levels, whereas the more felsic trachytes and rhyolites of
the rift center originated at shallow crustal levels. This is also in agreement with known variation
in crustal thickness, variation as thinner crust is present in the rift center than at the rift margin.
7. ACKNOWLEDGMENTS
We thank Prof. S. Iizumi for his help with isotope analyses and Dr. T. Bary for AFC model
calculation and discussion. K. Kabeto acknowledges financial support from Japan Society for
Promotion of Science (JSPS) during post doctoral research at Shimane University. Thanks are
also due to Prof. K. Koeberl, Dr. D. Kuester and Dr. K. Bheemalingeswara for providing critical
comments and constructive suggestions that have undoubtedly improved the quality of the paper.
8. REFERENCES
Abebe, T., Mazzarini, F., Innocenti, F. & Manetti, P. 1998. The Yerer-Tullu Wellel
volcanotectonic lineament: a transtensional structure in central Ethiopia and the
associated magmatic activity. J. Afr. Earth Sci., 26:135-150.
Mekelle University ISSN: 2073-073X 22

Kurkura et al., (MEJS) Volume 1 (1): 4 – 35, 2009
Abebe, T. 1995. L’allineamento vulcano-tettonica Yerer-Tullu Wellel (Etiopia centrale):
evoluzione petrologica e volcanologica di un sistema transversale al rift etiopico. PhD
thesis University of Florence, Dipartimento di Scienze della Terra, (unpubl.).
Ayalew D., Barrey, P., Marty, B., Reisberg, L., Yirgu, G. & Pik. R. 2002. Source, genesis, and
timing of giant ignimbrite deposits associated with Ethiopian continental flood basalts
Geochemica et Cosmochimica Acta, 66: 1429-1448.
Boccaletti, M., Mazzuoli, R., Bonini, M., Tura, T. & Abebe, B. 1999. Plio-Quaternary
volcanotectonic activity in the northern sector of the Main Ethiopian Rift: relationships
with oblique rifting, J. Afr Earth Sci., 29: 679-698.
Bigazzi, B., Bonadonna, F.P., DiPaola, G.M. & Giuliani, A. 1993. K-Ar and fission track ages of
the last volcano tectonic phase in the Ethiopian Rift Valley (Tullu Moye area). In:
Geology and mineral resources of Somalia and surrounding regions. Ist. Argon.
Oltremare, Firenze, Relaz. E Monogr., 113: 311-322.
Chernet, T., Hart, W.K., Arson, J.L. & Walter R.C. 1998. New age constraints on the timing of
volcanism and tectonism in the northern Main Ethiopian Rift-southern Afar Transition
zone (Ethiopia) Journal of Volcanological and Geothermal Research, 80: 267-280.
Chernet, T. 1995. Petrological, Geochemical and Geochemical and Geological Investigation
of volcanism in the northern Main Ethiopian Rift-Southern Afar Transition Region. PhD
thesis, University of Miami, Oxford, Ohio, (unpubl.).
Cohen, R.W. S., O’Nions, R. K. & Dawson, J. B. 1984. Isotope geochemistry of xenoliths from
East Africa: Implications for the development of mantle reservoirs and their interactions.
Earth Planet. Sci. Lett., 68: 209-220.
Davidson, J.P. & Wilson, I.R. 1989. Evolution of an alkali basalt-trachyte suite from Jebel Marra
volcano, Sudan, through assimilation and fractional crystallization. Earth Planet. Sci.
Lett., 95: 141-160.
Davies, G.R. & Macdonald, R. 1987. Crustal Influences in the petrogenesis of the Naivasha
Complex: Combined Trace Element and Sr-Nd-Pb Isotope constraints. J. Petrol., 28:
1009-1031.
DePaolo, D. J. 1981. Trace element and isotopic effects of combined wallrock assimilation and
fractional crystallization. Earth Planet. Sci. Lett., 53: 189-202.
Mekelle University ISSN: 2073-073X 23
Kurkura et al., (MEJS) Volume 1 (1): 4 – 35, 2009
Gasparon, M., Innocenti, F., Manetti, M., Peccerillo, P. & Abebe, T. 1993. Genesis of the liocene
to Recent bimodal mafic-felsic volcanism in Debre Zeit area, central Ethiopia:
volcanological and geochemical constraints. J. Afr. Earth Sci., 17: 145-165.
Halliday, A.N., Davidson, J.P., Hildreth, W. & Holden, P. 1991. Modeling the petrogenesis of
high Rb/Sr silicic magmas. Chem. Geol., 92: 107-114.
Hart, W.K., WoldeGabriel.G., Walter, R.C. & Mertzman, S.A. 1989. Basaltic volcanism in
Ethiopia. Constraints on continental rifting and mantle interactions. J. Geophys. Res., 94:
7731-7748.
Hegner, E. & Pallister, J.S. 1989. Lead, strontium and neodymium isotopic characteristics of
Tertiary Red Sea rift volcanics from the central Saudi Arabian coastal plain. J. Geophys.
Res., 94: 7749-7755.
Iizumi, S., Maehara, K., Morris, P. & Sawada, Y. 1994. Sr isotope data of GSJ reference
samples. Mem. Fac. Sci., Shimane Univ., 28 : 83-86.
Iizumi, S., Morris, P. & Sawada, Y. 1995. Nd isotope data of GSJ reference samples. Mem. Fac.
Sci., Shimane Univ., 29: 73-76.
Irvine, T.N. & Baragar, W. R. A. 1971. A guide to the chemical classification of the common
volcanic rocks. Canadian Journal Earth Sciences, 8: 523-548.
Kabeto, K., Sawada, Y. & Wakatsuki, T. 2001. Different Evolution trends in Alkaline evolved
lavas from the Northern Kenyan Rift. J. Afr. Earth Sci., 3: 419-433.
Kamber, B.S. & Collerson, K.D. 2000. Zr/Nb Systematics of Ocean Island Basalts Reassessed—
the Case for Binary Mixing. J. Petrol., 41: 1007-1021.
Kimura, J. & Yamada, Y. 1996. Evaluation of major and trace element XRF analyses using a
flux to sample ratio of two to one glass beads. J. Min. Petr. Econ. Geol., 91: 62-72.
Kushiro, I. 1968. Compositions of magma formed by partial zone melting of the Earth’s upper
mantle. J. Geophys. Res., 73 : 619-634.
Le Bas, M. J., LeMaitre, R. W., Streckeisen, A. & Zanettin, B. 1986. A chemical classification
volcanic rocks based on the total alkali-SiO2 diagram. J. Petrol., 27: 45-750.
Lippard, S.J. 1973. The petrology of phonolites from the Kenyan rift. Lithos, 6: 217-34.
Macdonald, R. 1974. Nomenclature and petrochemistry of the peralkaline oversaturated
extrusive rocks. Bull. Volcanology, 35: 78-83.
Mekelle University ISSN: 2073-073X 24

Kurkura et al., (MEJS) Volume 1 (1): 4 – 35, 2009
Macdonald, R. Davies, G.R., Upton, B.G. J., Dunkley, P.N., Smith, M. & Leat, P.T. 1995.
Petrogenesis of Silali volcano, Gregory Rift, Kenya. J. Geol. Soc. London, 152: 703-720.
Makris, J. & Ginzburg, A. 1987. The Afar depression: transition between continental rifting and
sea-floor spreading. Tectonophysics, 141: 199-214.
Mohr, P. 1992. Nature of the crust beneath magmatically active continental rifts.
Tectonophysics, 213: 269-284.
Möller, A., Mezger, K. & Schenk, V. 1998. Crustal Age Domains and the Evolution of the
Continental Crust in the Mozambique Belt of Tanzania: Combined Sm-Nd, Rb-Sr, and
Pb-Pb Isotopic Evidence. J. Petrol., 39: 749-783.
Morton, W.H., Rex, D.C., Mitchell, J.G. & Mohr, P. 1979. Rift-ward younging of volcanic units
in the Addis Ababa region. Ethiopian rift valley. Nature, 280: 284-288.
Nelson, S. & Davidson, J.P. 1993. Intractions Between Mantle-Derived Magmas and mafic
Crust, Henry Mountains, Utah. J. Geophys. Res., 98: 1837-1852.
Norrish, K. & Hutton, J.T. 1969. An accurate X-ray spectrographic method for the analysis of a
wide range of geochemical samples. Gochem. et Cosmochem. Acta, 33: 431-453.
O’Hara, M.H. 1968. The bearing of phase equilibria studies in synthetic and natural systems on
the origin and evolution of basic and ultrabasic rocks, Ann. Rev. Earth Planet. Sci. lett.,
4: 69-133.
Panter, S. K., Philip, R. K. & John, L. S. 1997. Petrogenesis of a Phonolite-Trachyte Succession
at Mount Sidley, Marie Byrd Land, Antarctica. J. Petrol., 38: 1225-1253.
Peccerillo, A., Yirgu, G. & Ayalew, D. 1995. Genesis of Acid volcanics along The Main
Ethiopian Rift: Case history of the Gedemsa Volcano. SINET, Ethiop. J. Sci., 18: 23-50.
Pik. R., Daneil C., Yirgu, G., Hofmann, C. & Ayalew D. 1998. The northwestern Ethiopian flood
basalts: Classification and spatial distribution of magma types Journal of Volcanological
and Geothermal Research, 81: 91-111.
Rollinson, H. R. 1995. Using Geochemical Data: evaluation, presentation and interpretation.
Longman, London, 352 pp.
Roser, B.P., Sawada, Y. & Kabeto, K. 1998. Crushing performance and contamination trials of a
tungsten carbide ring mill compared to agate grinding. Geosci. Rept. Shimane Univ.,
17:1-9.
Mekelle University ISSN: 2073-073X 25
Kurkura et al., (MEJS) Volume 1 (1): 4 – 35, 2009
Mekelle University ISSN: 2073-073X 26
Sato, H. 1977. Nickel content of basalt magmas; identification of primary magmas and a
measure of the degree of olivine fractionation. Lithos, 10: 113-120.
Shaw, D.M. 1970. Trace element fractionation during anatexis. Gochem. et Cosmochem. Acta,
34: 237-243.
Skjerlie, K.P. & Johnston, D. 1993. Fluid absent melting behavior of F-rich tonolitic gneisses. J.
Petrol., 34: 785-803.
Stewart, K. & Rogers, N.W. 1996. Mantle plume and lithosphere contributions to basalts from
southern Ethiopia. Earth Planet. Sci. Lett., 139: 195-211.
Tatsumi, Y. & Kimura, N. 1991. Secular variation of basalt chemistry in the Kenya Rift:
evidence for the pulsing of asthenospheric upwelling. Earth Planet. Sci. Lett., 104: 99-
113.
Trua, T., Deniel, C. & Mazzuoli, R. 1999. Crustal control in the genesis of Plio-Quaternary
Bimodal magmatism of the Main Ethiopian Rift (MER): geochemical and isotopic (Sr,
Nd, Pb) evidence. Chem. Geol., 155: 201-231.
Weaver, S. D. 1977. The Quaternary Caldera Volcano Emuruangogolak, Kenya Rift, and the
Petrology of a Bimodal Ferrobasalt-Pantelleritic-Trachyte Association. Bull.
Volcanology, 40: 209-230.
Wilson, M. 1989. Igneous Petrogenesis. Unwin Hyman, London, 466 pp.
Wilson, M., Downes, H. & Cebriá, J. 1995. Contrasting fractionation trends in coexisting
continental alkaline magma series; Cantal, Massif Central, France. J. Petrol., 36: 1729-
1753.
Wolde, B. 1996. Spatial and temporal variations in the compositions of Upper Miocene to
Recent basic lavas in the northern main Ethiopian rift: implications for the causes of
Cenozoic magmatism in Ethiopia. Geol. Rundsch, 85: 380-389.
WoldeGabreil, G., Aronson, J.L. & Walter, R.C. 1990. Geology, geochronology and rift basin
development in the central sector of the Main Ethiopian Rift. Geol. Soc. Bull., 102: 439-
458.

Kurkura et al., (MEJS) Volume 1 (1): 4 – 35, 2009 Table 1. Chemical and Sr-Nd isotopic compositions of selected samples from the northern MER. Abbreviations are: nd = not detected; – = not measured; M = Measured ratio; I = initial ratio, Tra = trachyte, rhy = rhyolite, benm = benmoreite, ha = hawaite, ba = basalt, igni = ignimbrite, and obs/pst = obsidian/pitchstone. Major oxides in wt.% and trace elements in ppm. Major and trace element oxides are recalculated to 100% on an hydrous basis. Ages from Morton et al. (1979) and Boccaleti et al. (1999).
UNIT Nazreth Boseti
Sample No. ET14 ET
971602 ET 117 ET1607 ET1608
ET 1702A ET1504 ET1507 ET1505 ET1501 ET1506 ET1605 ET1604b ET1603b
Locality Tafu Kone Barko Harbona Kimbo Boku Boseti Boseti Boseti Wolenchiti Boseti Hada Hada Hada
Rock type trachyte rhyolite rhyolite rhyolite rhyolite rhyolite benmoreite trachyte trachyte trachyte rhyolite trachyte rhyolite rhyolite
Age (Ma) 0.6 0.3 0.5 0.6 0.83 0.5 0.5 0.5 0.5 0.5 0.5 0.5 0.5 0.5
SiO2
67.98
68.84
71.72
69.35
69.67
73.78 56.24 65.44
66.82 66.90 69.66 66.61 67.19 68.00
TiO2
0.59
0.41
0.40
0.38
0.61
0.31 2.13 0.63
0.41 0.47 0.32 0.45 0.41 0.41
Al2O3
14.07
13.02
11.00
14.94
15.35
10.85 15.38 12.07
13.71 14.50 9.84 15.42 15.18 15.04
Fe2O3
0.85
0.93
0.92
0.59
0.42
0.82 1.52 1.48
1.02 0.91 1.22 0.84 0.82 0.80
FeO
4.34
4.73
4.74
2.99
2.14
4.16 8.33 7.54
5.20 4.66 6.24 4.30 4.17 4.06
MnO
0.21
0.19
0.21
0.16
0.15
0.15 0.31 0.30
0.22 0.23 0.26 0.16 0.16 0.16
MgO
0.32
0.06
0.03
0.22
0.44
0.02 2.60 0.48
0.01 0.09 - 0.22 0.14 0.13
CaO
1.68
0.67
0.44
0.58
0.85
0.27 5.14 1.04
0.72 1.10 0.29 1.64 1.48 1.47
Na2O
5.86
6.82
5.77
6.57
6.16
5.02 5.56 7.49
7.89 6.38 8.04 6.38 6.22 5.90
K2O
3.99
4.30
4.77
4.17
4.12
4.62 1.99 3.47
3.98 4.72 4.12 3.92 4.20 3.99
P2O5
0.09
0.03
0.01
0.04
0.09 - 0.80 0.05
0.02 0.03 0.01 0.06 0.04 0.04
LOI
1.47 - -
1.48
2.10
0.20 0.20 2.45
0.29 1.07 0.73 1.08 1.98 0.45
Alkali total
9.85
11.12
10.53
10.74
10.28
9.64 7.55 10.96
11.87 11.10 12.16 10.29 10.42 9.89
Agpaitic index
0.99
1.22
1.33
1.03
0.95
1.22 0.73 1.33
1.26 1.08 1.80 0.96 0.97 0.93
Mg number
11.75
2.08
1.05
11.70
26.95
1.04 35.76 10.22
0.47 3.23 - 8.47 5.64 5.36
Mekelle University ISSN: 2073-073X 27

Kurkura et al., (MEJS) Volume 1 (1): 4 – 35, 2009
(Continued)
UNIT Plateau Addis Ababa Wechecha Rift center mafic
Sample No. ET1201 ET1303 ET1602 ET1403 ET1203B ET1405 ET1404A ET1203A ET1302 ET1301 ET1606
ET1508 ET1507b
Locality Intoto Wechecha Addis Akaki Menagesha Yerer Yerer Menagesha Wechecha Wechecha Wonji Sodorei Boku
Rock type basalt basalt basalt basalt benmoreite benmoreite benmoreite trachyte trachyte rhyolite basalt basalt hawaiite
Age (Ma) 22.8 7.5 7 7 4 3.09 3.09 3.6 4 4.6 0.5 0.5 0.5
SiO2 47.20 46.32 45.69 46.71 57.02 60.46 62.59 65.47 68.20
68.50
47.81 48.33 52.16
TiO2 1.72 2.24 2.63 2.21 2.08 1.14 0.92 0.27 0.21
0.22
1.92 2.32 2.20
Al2O3 21.17 14.75 15.52 15.21 15.48 16.44 16.53 17.79 15.85
16.00
14.12 15.14 15.56
Fe2O3 1.55 1.76 1.89 1.72 1.39 1.26 1.10 0.63 0.62
0.61
1.77 1.85 1.76
FeO 7.93 8.97 9.65 8.76 7.50 6.41 5.63 3.20 3.17
3.10
9.04 9.42 8.99
MnO 0.14 0.18 0.16 0.17 0.33 0.13 0.13 0.11 0.08
0.07
0.17 0.17 0.21
MgO 4.24 10.81 9.77 9.57 2.19 0.98 0.75 0.06 0.02
0.01
10.42 7.73 4.94
CaO 12.51 11.26 9.66 11.62 4.37 3.30 2.01 0.31 0.36
0.22
11.29 10.55 8.02
Na2O 2.67 2.50 3.41 2.84 5.55 4.62 5.50 7.02 6.51
6.21
2.43 2.93 4.11
K2O 0.63 0.79 1.07 0.80 3.14 4.86 4.56 5.12 4.97
5.03
0.66 0.92 1.31
P2O5 0.25 0.42 0.56 0.40 0.93 0.41 0.28 0.02 0.01
0.03
0.37 0.64 0.73
LOI 1.06 1.61 0.20 1.47 1.48 0.19 0.74 1.47 1.57
1.07
1.60 0.54 0.76
Alkali total 3.29 3.28 4.48 3.64 8.69 9.48 10.06 12.14 11.48
11.23
3.09 3.85 5.42
Agpaitic index 0.24 0.34 0.44
0.36 0.81 0.78 0.85 0.96 1.02
0.98
0.33 0.38 0.53
Mg number 48.83 68.23 64.34 66.08 34.25 21.39 19.14 3.31 0.95
0.81
67.26 59.39 49.51
Mekelle University ISSN: 2073-073X 28

Kurkura et al., (MEJS) Volume 1 (1): 4 – 35, 2009
(Continued)
UNIT Rift center mafic Gedemsa Nazreth
Sample No. ET
941503A ET
941502 ET
1706 ET
941503B ET60 ET54 ET38 ET 9865 ET
9840 ET06 ET103 ET94
Locality D.Zeit D.Zeit Mojo D.Zeit Sololuya Gedemsa Alula Gedemsa Koka Gedemsa Gedemsa Bulbula
Rock type basalt basalt basalt basalt rhyolite rhyolite obsidian rhyolite rhyolite obsidian ignimbrite ignimbrite
Age (Ma) 0.6 0.6 1 0.5 0.5 0.6 0.6 0.5 0.5 0.5 0.6 0.5
SiO2
49.09
46.38
49.45
49.08
71.88 72.19
72.69
73.59
72.91
72.34 73.47 67.14
TiO2
1.35
1.65
1.95
2.24 0.33 0.32
0.31
0.27
0.35
0.31 0.33 0.69
Al2O3
16.16
13.00
17.45
15.88
12.92 12.85
10.86
9.57
9.89
12.61 9.15 14.26
Fe2O3
1.51
1.73
1.76
1.92 0.62 0.62
0.89
1.07
0.94
0.61 1.00 0.91
FeO
7.70
8.81
8.96
9.80 3.21 3.20 4.59
5.51
4.81
3.13 5.16 4.66
MnO
0.14
0.16
0.14
0.18 0.13 0.13 0.17
0.23
0.21
0.12 0.22 0.21
MgO
9.28
13.93
6.27
6.36 0.13 0.12 0.06
0.11
0.05
0.06 0.05 0.52
CaO
11.00
11.15
9.43
9.42 0.70 0.65 0.41
0.30
0.35
0.55 0.85 1.78
Na2O
2.34
2.26
3.30
3.43 5.13 5.23 5.65
4.83
5.94
5.16 5.29 5.75
K2O
1.17
0.64
0.91
1.06 4.95 4.67 4.30
4.51
4.55
5.09 4.48 3.97
P2O5
0.25
0.30
0.38
0.64 0.01 0.01
0.06
0.01 -
0.00 0.00 0.13
LOI
0.11 - - - 0.17 1.12 0.86
-
-
0.22 0.18 1.17
Alkali total
3.51
2.91
4.21
4.49 10.07 9.90
9.96
9.34
10.49
10.24 9.77 9.72
Agpaitic index
0.32
0.09
0.37
0.43 1.07 1.06 1.28
1.34
1.49
1.11 1.48 0.96
Mg number
68.23
73.81
55.51
53.65 6.61 6.33 2.30
3.52
1.86
3.55 1.67 16.57
Mekelle University ISSN: 2073-073X 29

Kurkura et al., (MEJS) Volume 1 (1): 4 – 35, 2009
(Continued)
UNIT Plateau Addis Ababa Wechecha Rift center mafic
Sample No. ET1201 ET1303 ET1602 ET1403 ET1203B ET1405 ET1404A ET1203A ET1302 ET1301 ET1606 ET1508 ET1507b Locality Intoto Wechecha Addis Akaki Menagesha Yerer Yerer Menagesha Wechecha Wechecha Wonji Sodorei Boku
Rock type basalt basalt basalt basalt benmoreite benmoreite benmoreite trachyte trachyte rhyolite basalt basalt hawaiite
Cr 32
672
331 491 5 20 17 19 16 19
558 245 36
Ni 15
231
185 154 8 2 3 7 8 2 208 107 52
Ba 160
361
301 446 1,001 89 1,267 48 143 151
274 467 1,456
Nb 15.7
33.1
47.1 31.4 106.5 108.0 104.6 231.7 192.2
166.0
20.4 28.5 26.1
Zr 110.5
125.6
232.6 122.4 481.2 774.8 745.0 1,104 965.4
818.4
117.7 174.9 157.1
Y 15.1
23.7
23.8 20.7 65.0 66.2 82.0 74.9 204.8 44.3
21.2 16.3 28.0
Sr 792.6
675.8
643.7 629.0 540.0 313.0 276.1 5.3 5.6
6.6
401.6 481.4 466.9
Rb 19.2
16.6
16.6 16.2 79.0 119.3 120.1 189.5 159.3
151.1
12.0 16.0 16.9
La 12.9
24.4
24.9 21.7 - 93.3 104.2 175.3 694.2
17.8
17.0 24.3 28.9
Ce 28.7
47.8
55.9 45.4 -
191.5 183.0 152.1 229.0
74.9
37.3 52.9 63.3
Pr 3.7
5.9
6.9 5.5 -
22.1 22.3 25.0 25.0
4.3 4.8 6.6 8.3
Nd 15.8
24.9
28.3 23.5 -
84.5 83.3 99.8 100.0
16.0
20.7 26.9 -
Sm 3.6
5.2
5.8 5.0 -
15.9 15.5 14.6 30.0
4.0 4.7 5.6 -
Eu 1.3
1.8
1.9 1.7 -
3.8 3.7 0.8 5.0
0.8 1.6 2.1 3.5
Gd 3.5
5.2
5.5 4.8 -
13.7 13.9 10.4 20.0
4.8 4.6 5.7 7.1
Tb 0.5
0.8
0.8 0.7 -
2.1 2.1 1.8 5.0
1.0 0.7 0.8 1.0
Dy 3.1
4.4
4.5 4.2 -
12.9 13.3 12.0 20.0
7.9 4.2 4.7 5.7
Ho 0.6
0.8
0.8 0.8 -
2.5 2.7 2.6 6.7
1.8 0.8 0.9 1.1
Mekelle University ISSN: 2073-073X 30

Kurkura et al., (MEJS) Volume 1 (1): 4 – 35, 2009
(Continued)
UNIT Plateau Addis Ababa Wechecha Rift center mafic
Sample No. ET1201 ET1303 ET1602 ET1403 ET1203B ET1405 ET1404A ET1203A ET1302 ET1301 ET1606
ET1508
ET1507b
Locality Intoto Wechecha Addis Akaki Menagesha Yerer Yerer Menagesha Wechecha Wechecha Wonji Sodorei Boku
Rock type basalt basalt basalt basalt benmoreite benmoreite benmoreite trachyte trachyte rhyolite basalt basalt hawaiite
Er 1.6
2.3 1.9 2.2 - 7.2 8.0 8.1 17.7
5.9 2.2 2.2 2.9
Tm 0.2
0.3 0.3 0.3 - 1.0 1.1 1.3 2.4
0.9 0.3 0.3 0.4
Yb 1.3
1.9 1.8 1.8 - 6.9 7.4 8.8 15.6
6.6 1.9 2.0 2.5
Lu 0.2
0.3 0.2 0.3 - 1.0 1.1 1.4 2.2
1.0 0.3 0.3 0.4
Hf 2.6
3.0 5.2 3.0 - 17.6 17.3 23.2 21.7
18.5 2.9 3.5 3.8
Ta 1.0
1.9 5.7 1.9 - 6.1 5.8 13.7 10.6
9.1 1.2 2.5 1.5
Th 1.2
2.2 2.4 2.2 - 14.5 14.2 31.9 24.2
20.9 1.5 2.0 2.3
U 0.3
0.5 0.6 0.5 - 3.4 3.4 3.7 3.4
2.8 0.4 0.6 0.4
Zr/Nb 7.04
3.79 4.94 3.90 4.52 7.17 7.12 4.76 5.02
4.93
5.77 6.15 6.02
Isotope
(87Sr/86Sr) I 0.70376 0.70383 0.70350 0.70368 0.70387 0.70489 0.70490 0.70504 0.70727 0.70624 0.70427 0.70441 0.70456 (143Nd/144Nd)
I 0.51222 0.51281 0.51289 0.51288 0.51264 0.51262 0.51264 0.51276 0.51273 0.51237 0.51276 0.51279 0.51270
Mekelle University ISSN: 2073-073X 31

Kurkura et al., (MEJS) Volume 1 (1): 4 – 35, 2009
(Continued)
UNIT Rift center mafic Gedemsa Nazreth
Sample No. ET
941503A
ET
941502
ET
1706
ET
941503B
ET60 ET54 ET38 ET 9865 ET 9840 ET06 ET103 ET94
Locality D.Zeit D.Zeit Mojo D.Zeit Sololuya Gedemsa Alula Gedemsa Koka Gedemsa Gedemsa Bulbula
Rock type basalt basalt basalt basalt rhyolite rhyolite obsidian rhyolite rhyolite obsidian ignimbrite ignimbrite
Age (Ma) 0.6 0.6 1 0.5 0.5 0.6 0.6 0.5 0.5 0.5 0.6 0.5
Cr 298 822 114 139 14 9 28 13 12 16 13 15
Ni 148 380 46 73 28 28 17 28 27 25 28 27
Ba 331 278 320 518 491 492 183 128 53 397 66 1,246
Nb 24.1 26.6 26.4 32.2 104.1 103.7 100.9 140.0 128.6 109.8 113.9 75.4
Zr 106.1 109.7 143.8 165.5 761.2 764.1 791.3 1,077 918 813.8 668.8 503.1
Y 17.6 19.0 24.4 28.1 74.8 74.6 93.5 60.0 94.3 82.2 62.7 48.3
Sr 466.6 461.6 555.0 635.9 21.5 20.2 10.9 9.5 3.5 16.0 11.7 179.3
Rb 20.3 15.7 15.1 17.3 115.2 113.6 111.2 140.2 120.3 129.9 128.6 82.9
La 18.7 18.5 25.4 29.6 93.9 87.7 112.8 109.5 107.3 96.0 - 59.2
Ce 37.8 38.1 48.8 62.6 185.6 185.6 226.0 279.8 224.2 196.1 - 123.3
Pr 4.5 4.7 6.5 7.7 22.0 20.6 25.0 25.0 25.0 22.3 - 14.2
Nd 18.2 19.2 27.2 32.1 81.2 76.6 100.0 100.0 95.8 82.6 - 54.8
Sm 3.8 4.1 5.6 6.6 15.8 15.2 20.5 21.2 19.3 16.6 - 10.9
Eu 1.4 1.4 1.9 2.2 2.0 2.0 3.1 3.0 2.2 2.1 - 3.1
Gd 3.7 4.1 5.4 6.3 13.9 13.6 18.2 17.9 17.7 14.8 - 9.8
Tb 0.6 0.6 0.8 0.9 2.3 2.2 3.0 2.9 2.9 2.5 - 1.6
Dy 3.4 3.8 4.9 5.5 14.5 14.1 18.6 17.5 18.1 15.6 - 9.7
Ho 0.7 0.7 0.9 1.1 2.9 2.8 3.7 3.3 3.7 3.1 - 1.9
Mekelle University ISSN: 2073-073X 32

Kurkura et al., (MEJS) Volume 1 (1): 4 – 35, 2009
(Continued) UNIT Rift center mafic Gedemsa Nazreth
Sample No. ET
941503A
ET
941502
ET
1706
ET
941503B
ET60 ET54 ET38 ET 9865 ET 9840 ET06 ET103 ET94
Locality D.Zeit D.Zeit Mojo D.Zeit Sololuya Gedemsa Alula Gedemsa Koka Gedemsa Gedemsa Bulbula
Rock type basalt basalt basalt basalt rhyolite rhyolite obsidian rhyolite rhyolite obsidian ignimbrite ignimbrite
Age (Ma) 0.6 0.6 1 0.5 0.5 0.6 0.6 0.5 0.5 0.5 0.6 0.5
Er 1.9 2.0 2.6 3.0 8.4 8.4 10.6 9.3 10.7 9.2 - 5.5
Tm 0.3 0.3 0.4 0.4 1.2 1.2 1.5 1.4 1.6 1.3 - 0.8
Yb 1.7 1.8 2.3 2.7 8.2 8.2 10.0 9.6 10.2 8.9 - 5.4
Lu 0.3 0.3 0.3 0.4 1.2 1.2 1.4 1.4 1.5 1.3 - 0.8
Hf 2.5 2.6 3.5 3.9 18.7 18.5 19.2 26.4 22.3 19.9 - 12.4
Ta 1.4 1.6 1.5 1.8 6.1 6.1 5.9 8.1 7.5 6.7 - 4.3
Th 2.1 2.1 2.1 2.2 16.0 15.7 15.2 20.4 16.9 16.7 - 9.8
U 0.6 0.5 0.5 0.5 3.6 3.7 3.6 1.2 4.0 3.9 - 1.9
Zr/Nb 4.40 4.12 5.45 5.14 7.31 7.37 7.84 7.69 7.14 7.41 5.87 6.67
Isotope
(87Sr/86Sr)
I
0.70476 0.70469 0.70783 0.70463 0.70459 0.70589
(143Nd/144
Nd) I
0.51278 0.51278 0.51273 0.51282 0.51278 0.51281
Mekelle University ISSN: 2073-073X 33

Kurkura et al., (MEJS) Volume 1 (1): 4 – 35, 2009
(Continued)
UNIT Nazreth Boseti
Sample No. ET14
ET
971602 ET 117 ET1607 ET1608 ET1702A ET1504 ET1507 ET1505 ET1501 ET1506 ET1605 ET1604b ET1603b
Locality Tafu Kone Barko Harbona Kimbo Boku Boseti Boseti Boseti Wolenchiti Boseti Hada Hada Hada
Rock type trachyte rhyolite rhyolite rhyolite rhyolite rhyolite benmoreite trachyte trachyte trachyte rhyolite trachyte rhyolite rhyolite
Cr 10 18 11 17 20 13 - 25 20 16 17 16 20 17
Ni 28 1 28 1 2 26 10 2 1 2 4 2 2 3
Ba 1,290 602 95 974 857 67 657 1,974 821 461 394 968 695 973
Nb 81.7 126.7 111.9 114.2 92.1 129.2 33.8 85.1 109.1 92.4 160.8 88.0 92.3 91.3
Zr 539.7 579.0 772.3 756.4 686.9 1,024 161.4 492.9 706.7 528.0 1,065 645.6 680.0 679.4
Y 55.5 91.0 56.7 58.2 70.5 80.3 22.6 68.5 80.9 62.8 129.5 65.8 69.2 65.8
Sr 156.3 32.2 3.0 21.8 114.9 3.9 578.4 28.3 12.8 6.7 5.4 110.4 83.2 100.8
Rb 85.0 111.8 122.1 95.0 110.2 148.9 21.7 56.9 97.3 78.6 142.9 97.5 103.4 103.8
La 65.7 91.6 93.6 82.5 85.3 106.3 27.4 61.2 82.4 65.4 129.8 73.1 75.9 74.5
Ce 135.0 185.3 168.7 165.8 175.4 215.2 55.7 130.0 169.3 136.5 267.0 148.8 153.2 152.9
Pr 15.9 21.1 23.3 19.8 20.3 24.8 6.6 25.0 19.6 16.0 15.6 17.0 17.7 17.4
Nd 60.5 80.0 87.5 75.0 77.0 91.4 26.5 100.0 75.6 62.0 62.4 64.2 66.3 66.5
Sm 12.2 16.3 17.0 14.5 14.9 17.9 5.4 24.7 15.6 12.7 13.2 12.8 13.3 13.2
Eu 3.4 3.3 2.4 2.9 3.4 2.4 1.8 5.0 3.6 2.2 4.2 3.1 2.9 3.0
Gd 11.0 15.3 14.2 12.3 13.1 15.9 5.1 20.0 14.8 11.7 12.9 11.9 12.3 12.1
Tb 1.8 2.6 2.3 2.0 2.1 2.6 0.8 4.0 2.5 1.9 2.1 2.0 2.0 2.0
Dy 11.0 16.8 13.9 12.5 13.1 15.9 4.5 20.0 15.5 12.0 13.4 12.5 13.0 12.6
Ho 2.2 3.5 2.7 2.5 2.6 3.1 0.9 5.0 3.1 2.4 2.7 2.5 2.6 2.6
Mekelle University ISSN: 2073-073X 34

Kurkura et al., (MEJS) Volume 1 (1): 4 – 35, 2009
(Continued)
UNIT Nazreth Boseti
Sample No. ET14 ET
971602 ET 117 ET1607 ET1608 ET1702A ET1504 ET1507 ET1505 ET1501 ET1506 ET1605 ET1604b ET1603b
Locality Tafu Kone Barko Harbona Kimbo Boku Boseti Boseti Boseti Wolenchiti Boseti Hada Hada Hada
Rock type trachyte rhyolite rhyolite rhyolite rhyolite rhyolite benmoreite trachyte trachyte trachyte rhyolite trachyte rhyolite rhyolite
Er 6.3 10.5 7.7 7.1 7.7 8.8 2.4 14.7 9.2 7.2 7.8 7.5 7.8 7.6
Tm 0.9 1.5 1.2 1.1 1.1 1.3 0.3 2.1 1.3 1.1 1.1 1.1 1.1 1.1
Yb 6.1 9.9 8.0 7.7 7.5 8.6 2.1 13.6 8.6 7.2 7.2 7.3 7.6 7.3
Lu 0.9 1.5 1.2 1.2 1.1 1.3 0.3 2.0 1.3 1.1 1.1 1.1 1.1 1.1
Hf 13.1 19.2 18.7 17.8 16.3 22.9 3.7 25.8 16.5 12.9 11.8 15.2 15.9 15.9
Ta 4.7 7.4 6.3 6.5 4.6 7.2 1.9 9.4 6.3 5.0 4.9 5.0 5.3 5.3
Th 10.8 15.0 15.9 12.6 13.4 14.8 2.5 19.2 12.4 9.7 7.6 12.2 12.7 12.5
U 1.9 6.1 2.1 1.8 3.0 3.3 0.6 4.8 3.2 2.3 2.1 1.9 2.8 1.7
Zr/Nb 6.61 4.57 6.90 6.62 7.46 7.92 4.78 5.79 6.48 5.71 6.62 7.33 7.37 7.44
Isotope
(87Sr/86Sr) I 0.70502 0.70577 0.70477 0.70486 0.70628 0.70478 0.70553 0.70450 0.70538 0.70416 0.70447 0.70446 0.70474 (143Nd/144Nd)
I 0.51277 0.51285 0.51266 0.51281 0.51279 0.51262 0.51285 0.51286 0.51284 0.51277 0.51261 0.51280 0.51274
Mekelle University ISSN: 2073-073X 35