2010 - e.on · 2020-05-13 · 5 interim report i/2010 e.on stock e.on stock finished the first...
TRANSCRIPT

2010 January February March
April May June
July August September
October November December
Interim Report I/2010
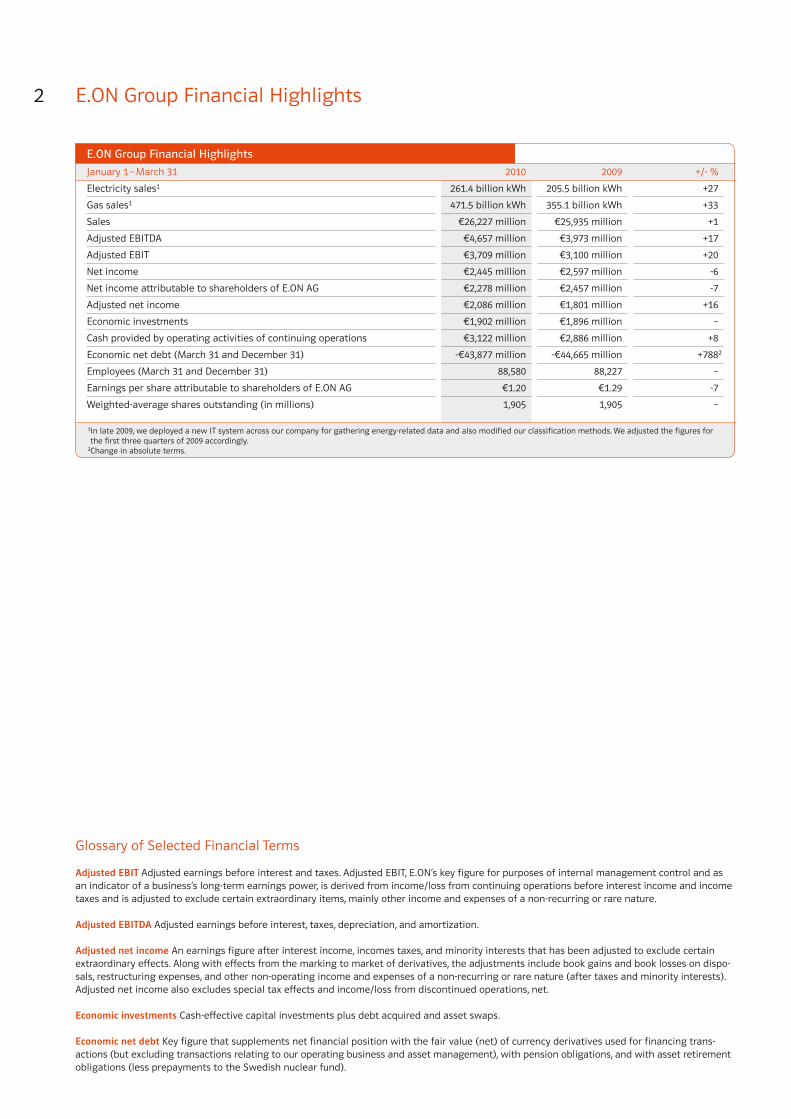
2 E.ON Group Financial Highlights
Glossary of Selected Financial Terms
Adjusted EBIT Adjusted earnings before interest and taxes. Adjusted EBIT, E.ON’s key figure for purposes of internal management control and as an indicator of a business’s long-term earnings power, is derived from income/loss from continuing operations before interest income and income taxes and is adjusted to exclude certain extraordinary items, mainly other income and expenses of a non-recurring or rare nature.
Adjusted EBITDA Adjusted earnings before interest, taxes, depreciation, and amortization.
Adjusted net income An earnings figure after interest income, incomes taxes, and minority interests that has been adjusted to exclude certain extraordinary effects. Along with effects from the marking to market of derivatives, the adjustments include book gains and book losses on dispo-sals, restructuring expenses, and other non-operating income and expenses of a non-recurring or rare nature (after taxes and minority interests). Adjusted net income also excludes special tax effects and income/loss from discontinued operations, net.
Economic investments Cash-effective capital investments plus debt acquired and asset swaps.
Economic net debt Key figure that supplements net financial position with the fair value (net) of currency derivatives used for financing trans-actions (but excluding transactions relating to our operating business and asset management), with pension obligations, and with asset retirement obligations (less prepayments to the Swedish nuclear fund).
E.ON Group Financial Highlights
January 1 – March 31 2010 2009 +/- %
Electricity sales1 261.4 billion kWh 205.5 billion kWh +27
Gas sales1 471.5 billion kWh 355.1 billion kWh +33
Sales €26,227 million €25,935 million +1
Adjusted EBITDA €4,657 million €3,973 million +17
Adjusted EBIT €3,709 million €3,100 million +20
Net income €2,445 million €2,597 million -6
Net income attributable to shareholders of E.ON AG €2,278 million €2,457 million -7
Adjusted net income €2,086 million €1,801 million +16
Economic investments €1,902 million €1,896 million –
Cash provided by operating activities of continuing operations €3,122 million €2,886 million +8
Economic net debt (March 31 and December 31) -€43,877 million -€44,665 million +7882
Employees (March 31 and December 31) 88,580 88,227 –
Earnings per share attributable to shareholders of E.ON AG €1.20 €1.29 -7
Weighted-average shares outstanding (in millions) 1,905 1,905 –
1In late 2009, we deployed a new IT system across our company for gathering energy-related data and also modified our classification methods. We adjusted the figures for the first three quarters of 2009 accordingly.
2Change in absolute terms.

3Interim Report I/2010
January 1 – March 31, 2010
• Adjusted EBIT up 20 percent year on year
• U.S. power and gas business sold
• 2010 forecast unchanged with adjusted EBIT expected up by 0 to 3 percent and adjusted net income at prior-year level
Contents
4 Letter to Shareholders
5 E.ON Stock
6 Interim Group Management Report
– Business and Operating Environment
– Earnings Situation
– Financial Condition
– Asset Situation
– Employees
– Risk Situation
– Subsequent Events
– Forecast
28 Review Report
29 Condensed Consolidated Interim Financial Statements
– Consolidated Statements of Income
– Statements of Recognized Income and Expenses
– Consolidated Balance Sheets
– Consolidated Statements of Cash Flows
– Statement of Changes in Equity
– Notes
45 Financial Calendar

4
Interim Report I/2010
E.ON started the year with a strong first quarter. Our adjusted EBIT of €3.7 billion and adjusted net income of €2.1 billion were
both significantly higher. We stand by our forecast for our 2010 adjusted EBIT to increase slightly, by 0 to 3 percent, and for our
adjusted net income to be at the prior-year level. In other words, in the current year E.ON will again be stable with some upside
potential. The economic crisis isn’t over. Our ability to post strong numbers and confirm our forecast in this environment dem-
onstrates that we’re on the right course. Volume and prices—across our European markets and all customer segments—remain
significantly below pre-crisis levels despite the first signs of economic recovery. This is particularly true in the industrial segment
and the gas wholesale business, which is under considerable pressure not only from the recession-driven drop in demand but
also from a supply surplus on the spot market. We succeeded in negotiating with key suppliers to make a first round of adjust-
ments to our long-term contracts to reflect the altered market situation. This gives us more flexibility in procurement and
reduces our costs. From today’s perspective, however, the gas market will continue to present us with challenges in the years
ahead. In our power business, forward selling our production for this year and next year has enabled us to successfully offset
the effects of the current weakness in wholesale prices. We owe our very good position in these tough times in part to our solid
performance but also to our presence in all key European markets and all segments of the value chain.
Another factor is that we acted early in three areas: enhancing our performance, systematically reassessing the strategic value
of our assets, and pursuing a disciplined investment strategy. PerformtoWin has enabled us, in accord with our employees,
to identify—and to a large degree already implement—annual efficiency improvements totaling €1.5 billion by 2011. This isn’t
just about cutting costs but about doing things like improving our power and gas sales business in Germany, England, and
Sweden, where we’ve reorganized our customer services. These kinds of measures pay off quickly. For example, a recent study
shows that customer loyalty to E.ON has increased by 30 percent in Sweden in the wake of the reorganization.
We’re also making good progress on our asset sales. The objectives are to generate at least €10 billion by the end of this year,
streamline our portfolio, and improve our investment strength. By finding a buyer for E.ON U.S. the week before last, we’ll
now significantly surpass this objective. The $7.6 billion purchase price to be paid by Pennsylvania Power & Light Corporation
is significantly above expectations. The sale will reduce our economic net debt by a total of €6 billion and give us valuable
flexibility. Because while it’s important to make it through the economic crisis in good shape, it’s even more important to selec-
tively invest today in tomorrow’s earnings streams. That’s why we’ll invest €24 billion for the period 2010–2012 to do things
like strengthening our generation fleet and reducing its carbon intensity (by building high-efficiency gas-fired and coal-fired
generating units, wind farms, and solar farms) and expanding our natural gas production and our power and gas networks.
For E.ON to invest wisely, we need to accurately assess when is the moment to make big investments in what technologies
(being a first mover isn’t always a good idea) and to design sustainable business models for these technologies. Along with
highly efficient power plants and networks and the operational excellence E.ON demonstrates every day, these are the most
important success factors for meeting the challenges of the future.
As E.ON’s new CEO, it’s now my responsibility to ensure—for the good of the company, its employees, and above all you, our
shareholders—that we understand these challenges, take them seriously, and act decisively to address them. E.ON is a strong,
confident company, a company with a superb position in the European market, deep experience in all aspects of the energy
business, and robust finances. In the weeks and months ahead, we’ll be working to decide what objectives we want to set for the
coming years and how to organize the company to achieve these objectives. I’ll be telling you more about this later in the year.
Best wishes,
Dr. Johannes Teyssen

5
Interim Report I/2010
E.ON Stock
E.ON stock finished the first quarter of 2010 slightly below
(-6 percent) its year-end closing price for 2009, thereby under-
performing its peer index, the STOXX Utilities, which declined
by 2 percent during the same period. The EURO STOXX 50 index
was also lower (-1 percent), while the German DAX index rose
slightly (+3 percent).
The stock-exchange trading volume of E.ON stock declined by
about 10 percent year on year to €13.7 billion. The decline is
mainly attributable to a 25-percent reduction in the number
of shares traded relative to the prior-year period. E.ON was
the DAX’s fourth most-traded stock by volume in the first quar-
ter of 2010. With a weighting of 9.6 percent as of March 31,
2010, E.ON stock was the second highest-weighted stock in
the DAX.
In the United States, E.ON stock is traded over the counter in
the form of American Depositary Receipts (“ADRs”). The con-
version ratio between E.ON ADRs and E.ON stock is one to one.
Visit eon.com for the latest information about E.ON stock.
Percentages E.ON EURO STOXX STOXX Utilities DAX
E.ON Stock Performance
100
90
80
12/30/09 1/7/10 1/14/10 1/21/10 1/28/10 2/4/10 2/11/10 2/18/10 2/25/10 3/4/10 3/11/10 3/18/10 3/25/10 3/31/10
E.ON Stock
Mar. 31, 2010 Dec. 30, 2009
Shares outstanding (in millions) 1,905 1,905
Closing price () 27.34 29.23
Market capitalization ( in billions)1 52.1 55.7
1Based on shares outstanding.
Performance and Trading Volume
January 1 – March 31 2010 2009
High (€)1 29.36 30.47
Low (€)1 25.60 18.19
Trading volume2 Millions of shares 508.0 679.9
€ in billions 13.7 15.2
1Xetra.2Source: Bloomberg (all German stock exchanges).

6
Interim Report I/2010
Interim Group Management Report
NordicE.ON Sverige manages our energy operations in Northern
Europe. The Regulated reporting unit consists of power and
gas distribution. The Non-regulated reporting unit consists
mainly of power generation, heat production, power, gas, and
heat sales, and energy services.
U.S. MidwestE.ON U.S. operates primarily in the regulated energy market
in Kentucky. Its operating companies are Louisville Gas and
Electric Company (“LG&E”) and Kentucky Utilities Company
(“KU”) whose activities encompass electric generation, trans-
mission, distribution, and retail services. In addition, LG&E
provides natural gas distribution services.
Energy TradingEnergy Trading combines our risk-management activities,
mainly for power, gas, coal, oil, and carbon allowances. These
activities consist of Optimization and Proprietary Trading.
Both are conducted in accordance with our risk-management
systems as well as trading limits and can involve intentionally
utilizing changes in market prices and risk positions. Energy
Trading also includes the financial results of Italy-based E.ON
Energy Trading S.p.A. whose operations it has managed cen-
trally since January 1, 2009.
New MarketsE.ON Climate & Renewables is responsible for managing and
expanding E.ON’s global renewables operations (with the
exception of large-scale hydroelectricity) and climate-protec-
tion projects.
E.ON Russia Power is responsible for the E.ON Group’s elec-
tricity operations in Russia. Our Russian business focuses on
the operation of thermal power stations in Central Russia,
Ural, and Siberia, predominantly fast-growing, industrialized
regions of the country.
E.ON Italia manages our power and gas business in Italy. Its
operations consist of power generation, power and gas sales,
and gas distribution.
E.ON España runs our integrated energy business in Spain.
Corporate CenterThe Corporate Center segment consists of E.ON AG, Düsseldorf,
and the ownership interests managed directly by E.ON AG.
We also allocate consolidation effects at the Group level to
this segment.
Business and Operating Environment
Corporate Structure and OperationsE.ON is one of the world’s largest investor-owned energy
companies. Our business extends along the entire value chain
in power and gas and is segmented geographically or func-
tionally into market units. The lead company of each market
unit is responsible for integrating and coordinating operations
across its target market. Business units manage day-to-day
operations.
For reasons of materiality, we combine our Climate & Renew-
ables, Russia, Italy, and Spain market units in a single reporting
segment called New Markets.
Central EuropeE.ON Energie is one of Europe’s largest energy companies and
has operations in many countries in Central Europe, including
Germany, the Benelux states, France, Hungary, Slovakia, and
the Czech Republic as well as in Bulgaria and Romania. The
Central Europe West Regulated and Non-regulated reporting
units consist of the operation of conventional and nuclear
power stations as well as renewable-source and waste-incin-
eration power generation, electric transmission via high-volt-
age wires networks, regional distribution (electricity, gas, and
heat), and electricity, gas and heat sales. The Central Europe
East reporting unit consists of our shareholdings in regional
electric and gas distributors in this region.
Pan-European GasE.ON Ruhrgas is one of Europe’s leading gas companies and
one of the world’s largest investor-owned gas importers. Its
customers are regional and municipal energy companies
as well as industrial enterprises in and outside Germany. The
Regulated reporting unit consists of ownership interests in
energy companies in European countries other than Germany
(E.ON Ruhrgas International) and the regulated transport
business. The Non-regulated reporting unit consists of the gas
wholesale business, the exploration and production business,
and the gas storage business. Thüga, which has minority
ownership interests in municipal gas and electric utilities in
Germany was sold to a consortium of municipal utilities
effective December 1, 2009. Other/Consolidation now there-
fore only includes consolidation effects.
U.K.E.ON UK runs our energy business in the United Kingdom. The
Regulated reporting unit consists of Central Networks, which
operates an electricity distribution business in central England.
The Non-regulated reporting unit includes the generation,
retail, and the energy services businesses. The generation busi-
ness covers activities including power generation, operation
and maintenance of combined heat and power plants, and
power station development and operation. The retail business
encompasses the sale of electricity and gas services to resi-
dential, business, and industrial customers.

7
Interim Report I/2010
Energy IndustryGermany consumed 1.4 percent more electricity in January
2010 and fully 5.1 percent more in February relative to the
prior-year figures. January was the first month with a year-on-
year increase in consumption since the onset of the reces-
sion. There were three main reasons: the economic recovery,
low consumption in the prior year due to the recession, and
an uncommonly cold and long winter. Germany also consumed
more natural gas in the first two months of 2010 than in the
corresponding prior-year months due to a partial recovery in
demand from industrial customers.
Electricity consumption in England, Scotland, and Wales
was 89 billion kWh in the first quarter of 2010 compared with
88 billion kWh in the first quarter of 2009. Gas consumption
(excluding power stations) was 248 billion kWh in the first quar-
ter of 2010 compared with 232 billion kWh in the first quarter
of 2009. The increases were largely due to very cold weather
in January and February partially offset by continuing energy-
efficiency improvements.
The Nordic region consumed 118 billion kWh of electricity in
the first quarter of 2010, about 6 billion kWh more than in
the same period of 2009. Consumption was driven by very cold
weather during the period. Net electricity imports to the
Nordic region from surrounding countries were 6.7 billion kWh
compared with imports of 0.5 billion kWh in the prior-year
period. Net imports from Germany were 2.7 billion kWh (prior
year: net exports of 2.4 billion kWh).
Electricity and gas consumption in the Midwestern United
States increased by approximately 4 percent in the first quar-
ter of 2010, due primarily to colder weather.
The Russian Federation generated 290 billion kWh of electricity
in the first quarter of 2010, 6 percent more than in the prior-
year period. Ongoing market liberalization and cold temper-
atures were the key drivers nationwide.
Italy consumed 80.9 billion kWh of electricity, an increase of
1.9 percent from the prior-year figure (2 percent if adjusted
for differences in temperature and number of working days).
Driven by the increase in consumption, domestic power pro-
duction rose by 3.3 percent to 70.6 billion kWh. Italy’s gas con-
sumption rose by 8.3 percent year on year to 306.3 billion kWh;
consumption was higher in all customer segments.
Peninsular electricity consumption in Spain was 68 billion kWh,
4.7 percent higher than in the prior-year quarter (2.8 percent
higher if adjusted for differences in temperature and the num-
ber of working days). Retail gas consumption rose by 12.1 per-
cent to 81 billion kWh.
Energy PricesFour main factors drove electricity and natural gas markets
in Europe and Russia in the first quarter of 2010:
• international commodity prices (especially oil, natural
gas, coal, and carbon allowance prices)
• macroeconomic developments
• the weather
• the availability of hydroelectricity in Scandinavia and
Russia.
Prices for electricity and commodities (except oil) moved lower
in Europe. After a temporary decline in February, the price of
Brent crude oil for next-month delivery rose to $82 per barrel
by the end of March on the back of robust demand from
non-OECD countries in Asia, positive economic indicators, and
colder-than-average temperatures in North America and
Europe. Natural gas and coal prices trended lower. Europe’s
wholesale gas market was affected by a global supply sur-
plus despite a significantly colder winter, a supply bottleneck
in Norway, and a slow recovery of demand in the wake of
the recession. Gas prices at Europe’s virtual trading points
continued to be decoupled from the prices of gas-import
contracts, which are indexed to oil prices. Coal prices were
higher due to extreme winter weather at the start of the
year. But after climbing to $100 per metric ton in January, the
price of coal for next-year delivery fell, ending March at about
$88. The decline was caused by increased production of favor-
ably priced Chinese coal, sufficient coal inventories in Europe,
and competition from natural gas, whose price was decreasing.
Wholesale Electricity Price Move-ments in E.ON‘s Core Markets
U.K. baseload Nord Pool baseload Spain€/MWh1 U.S. baseload EEX baseload
110
100
90
80
70
60
50
40
30
4/1/08 7/1/08 10/1/08 1/1/09 4/1/09 7/1/09 10/1/09 1/1/101For next-year delivery.

8
Interim Report I/2010
Interim Group Management Report
U.S. natural gas and wholesale electricity prices trended lower
even though the economy picked up in the first quarter (lead-
ing to an increase of new orders for manufactured goods),
with production returning to the level of the first quarter of
2008. The U.S. gas market saw a sufficient supply from domes-
tic unconventional gas resources (such as shale gas) and
from imported liquefied natural gas. Despite a slight increase
in electricity demand, electricity prices were under pressure
from excess supply and declining gas prices.
In the first quarter of 2010, the Russian electricity market
was influenced by lower temperatures than in the prior-year
quarter and a roughly 6-percent increase in electricity con-
sumption, which led to higher prices, particularly in the Europe
price zone. For the quarter as a whole, the weighted-average
price of electricity was 812 rubles (around €19.70) per MWh
in the Europe price zone and 482 rubles (around €11.70) in the
Siberian price zone.
Carbon Allowance PriceMovements in Europe
€/metric ton Phase-two allowances
30
25
20
15
10
5
4/1/08 7/1/08 10/1/08 1/1/09 4/1/09 7/1/09 10/1/09 1/1/10
In Europe, prices for baseload electricity for 2011 delivery
moved predominantly lower since the start of the year due to
declining prices for coal and particularly for gas and due to
sluggish economic growth. The German price for baseload elec-
tricity for 2011 delivery fell from about €53 per MWh at the
start of January to about €46 at the end of March. U.K. prices
showed a similar pattern. New generating capacity is expected
to increase supply in the years ahead in both Germany and
Britain.
Hydroelectricity accounts for a large share of Scandinavia’s
generation mix. As a result, Scandinavian electricity prices are
influenced not only by factors typical in other Northwest
European countries (like fuel and carbon costs and the macro-
economic situation) but also to a significant degree by hydro-
logical balances. Through the end of March, hydrological
balances reached very low levels. Low hydrological balances
along with cold weather caused dramatic price spikes for spot
electricity and in February supported prices for 2011 delivery,
which then moved lower, finishing March at €39 per MWh,
about €4 below the price at the start of the year.
Wholesale electricity markets in Italy and Spain are not yet
as liquid as those in Northwestern Europe, although trading
volume in the first quarter of 2010 was significantly higher
than in the prior-year quarter. As in Northwestern Europe, elec-
tricity prices in Spain moved lower in the first quarter, albeit
less sharply, and finished the quarter at €40 per MWh. In
Italy, only the spot market for next-day delivery is sufficiently
liquid to have information value; however, the share of for-
ward electricity sales (for next-month and next-year delivery)
is increasing. The monthly average price for baseload elec-
tricity for next-day delivery was around €63 per MWh in March,
negligibly lower than the January average price, despite a
slight increase in consumption.
Prices for carbon allowances under the EU-wide Emissions
Trading Scheme moved within a narrow range, staying close
to €13 per metric ton. Neither weak economic growth nor
the allocation of additional allowances in the United Kingdom
and Germany had a noteworthy effect on prices. Industrial
companies in particular withheld surplus allowances from the
market prior to the announcement, in early April, of EU emis-
sion figures for 2009.

9
Interim Report I/2010
nuclear generation because Oskarshamn 3 did not enter ser-
vice until March of this year after concluding a major over-
haul and upgrade. It is undergoing operational testing and
expected to reach full output by the end of May.
U.S. Midwest’s owned generation was higher due to higher
demand from residential customers due to colder weather.
The New Markets segment had owned generation of 22.8 bil-
lion kWh (prior year: 23.3 billion kWh). The breakdown is:
• Climate & Renewables 1.8 billion kWh (1.3 billion kWh)
• Russia 15.7 billion kWh (14.9 billion kWh)
• Italy 2.9 billion kWh (4.2 billion kWh)
• Spain 2.4 billion kWh (2.9 billion kWh).
Climate & Renewables’ owned generation was 38 percent
higher. Wind farms accounted for 98 percent of its owned gen-
eration, with biomass and micro-hydro facilities accounting
for the rest.
Power ProcurementThe E.ON Group’s owned generation fell by 2 percent, from
84.4 billion kWh in the first quarter of 2009 to 82.4 billion kWh
in 2010. By contrast, power procured increased by 44 percent
to 185.5 billion kWh.
The decline in Central Europe’s owned generation is attribut-
able to the disposal of power capacity in line with E.ON’s
commitment to the European Commission.
U.K. generated 8.8 billion kWh of electricity at its own power
plants in the first quarter of 2010, about 17 percent less than in
the first quarter of 2009 (10.6 billion kWh). The reduction is
mainly attributable to lower market spreads which made our
U.K. fleet less economic to operate.
Nordic’s owned generation increased by 0.4 billion kWh, with
the new CHP in Malmö adding 0.9 billion kWh. This increase
was partially mitigated by a 0.5 billion kWh decrease in
Average monthly prices
Brent crude oil front month $/bbl German gas import price €/MWh U.S. front month gas €/MWh NBP front month gas €/MWh TTF front month gas €/MWh NCG front month gas (EEX) €/MWh
Crude Oil and Natural Gas Price Movements in E.ON‘s Core Markets
€/MWh
50
40
30
20
10
$/bbl
120
100
80
60
40
4/1/08 7/1/08 10/1/08 1/1/09 4/1/09 7/1/09 10/1/09 1/1/10
Power Procurement1
Jan. 1 – Mar. 31Billion kWh
Central Europe U.K. Nordic U.S. Midwest Energy Trading New Markets Consolidation E.ON Group
2010 2009 2010 2009 2010 2009 2010 2009 2010 2009 2010 2009 2010 2009 2010 2009
Owned generation 35.6 36.3 8.8 10.6 6.7 6.3 8.5 7.9 – – 22.8 23.3 – – 82.4 84.4
Purchases 72.5 67.5 14.0 13.8 8.5 8.7 0.9 0.9 191.0 140.1 6.8 9.0 -108.2 -111.4 185.5 128.6jointly owned
power plants 0.7 1.3 0.2 0.3 2.1 2.8 – – – – – – – – 3.0 4.4
Energy Trading/
outside sources 71.8 66.2 13.8 13.5 6.4 5.9 0.9 0.9 191.0 140.1 6.8 9.0 -108.2 -111.4 182.5 124.2
Total 108.1 103.8 22.8 24.4 15.2 15.0 9.4 8.8 191.0 140.1 29.6 32.3 -108.2 -111.4 267.9 213.0
Station use, line loss, etc. -3.6 -4.0 -0.9 -1.4 -0.6 -0.6 -0.4 -0.5 – – -1.0 -1.0 – – -6.5 -7.5
Power sales 104.5 99.8 21.9 23.0 14.6 14.4 9.0 8.3 191.0 140.1 28.6 31.3 -108.2 -111.4 261.4 205.5
1In late 2009, we deployed a new IT system across our company for gathering energy-related data and also modified our classification methods. We adjusted the figures for the first three quarters of 2009 accordingly.

10
Interim Report I/2010
Interim Group Management Report
Trading VolumeTo execute its optimization and risk-management mission for
the E.ON Group, Energy Trading traded the following financial
and physical quantities:
Power SalesOn a consolidated basis, the E.ON Group increased its power
sales by 27 percent, from 205.5 billion kWh in the first quarter
of 2009 to 261.4 billion kWh in 2010.
Central Europe’s power sales rose mainly due to procurement
rights from nuclear power stations outside Germany obtained
through asset swaps in line with E.ON’s commitment to the
European Commission. These rights were onward sold to Energy
Trading.
U.K. sales to residential and small and medium-sized (“SME”)
customers increased by 1 percent. The increase in sales due to
cold weather was largely offset by reduced customer numbers
and energy-efficiency measures. Electricity sales to industrial
and commercial (“I&C”) customers rose significantly, largely
as a result of successful sales rounds.
Upstream Production
January 1 – March 31 2010 2009 +/- %
Liquids/oil (million barrels) 1.2 1.5 -20
Gas (million standard cubic meters) 351.3 381.9 -8
Total (million barrels of oil
equivalent) 3.4 4.0 -15
Trading Volume
January 1 – March 31 2010 2009
Power (billion kWh) 360 318
Gas (billion kWh) 292 347
Carbon allowances (million metric tons) 190 100
Oil (million metric tons) 23 18
Coal (million metric tons) 77 36
The Russia market unit met about 94 percent of its total needs
of 16.7 billion kWh with electricity from its own power plants.
When it made business sense, Russia met its delivery obliga-
tions by purchasing electricity instead of producing it.
The Italy market unit met 2.9 billion kWh, or 43 percent, of its
total needs of 6.8 billion kWh from its own power plants. The
prior-year figure includes 0.8 billion kWh of generation from
assets carved out to A2A effective the end of June 2009. Italy
procured 3.5 billion kWh of power on the ancillary market and
on the Italian Power Exchange. It purchased 0.4 billion kWh
from E.ON Energy Trading S.p.A., mainly for sales activities.
The Spain market unit generated 62 percent of its total needs
of 3.9 billion kWh with electricity from its own power plants.
Owned generation declined by 0.5 billion kWh relative to
the prior-year period; the decline was offset by an increase
in power purchases.
Gas ProcurementE.ON Ruhrgas procured about 207 billion kWh of natural gas
from producers in and outside Germany in the first quarter
of 2010, about 26 percent more than in the prior-year period.
The biggest suppliers were Russia (which accounted for
28 percent), Norway (25 percent), Germany (23 percent), and
the Netherlands (21 percent).
Pan-European Gas’s gas production in the North Sea declined
by about 8 percent year on year to 351 million cubic meters.
Liquid and condensates production of 1.2 million barrels was
also lower. The main reason was a natural production decline
at older fields which was not entirely offset by the very solid
performance of Rita field, which began production last year.
In addition to its North Sea production, Pan-European Gas had
1,707 million cubic meters of production from Yuzhno Russkoye,
which was acquired in late 2009 and is accounted for using
the equity method. Pan-European Gas’s own gas production
thus increased by more than 400 percent relative to the prior-
year period.
Owned Generation by Energy Source1
Jan. 1 – Mar. 31, 2010
Central Europe U.K. Nordic U.S. Midwest New Markets E.ON Group
BillionkWh %
BillionkWh %
BillionkWh %
BillionkWh %
BillionkWh %
BillionkWh %
Nuclear 16.0 45 – – 3.0 45 – – – – 19.0 23
Lignite 1.4 4 – – – – – – 3.1 14 4.5 5
Hard coal 11.8 33 4.1 47 – – 8.3 98 1.5 7 25.7 32
Natural gas, oil 4.1 12 4.7 53 1.2 18 0.1 1 15.3 67 25.4 31
Hydro 1.1 3 – – 2.1 31 0.1 1 1.1 4 4.4 5
Wind – – – – – – – – 1.8 8 1.8 2
Other 1.2 3 – – 0.4 6 – – – – 1.6 2
Total 35.6 100 8.8 100 6.7 100 8.5 100 22.8 100 82.4 100
1In late 2009, we deployed a new IT system across our company for gathering energy-related data and also modified our classification methods. We adjusted the figures for the first three quarters of 2009 accordingly.

11
Interim Report I/2010
U.S. Midwest’s utility power sales volumes were higher due
to colder weather and improved economic conditions.
The New Markets segment sold 28.6 billion kWh (prior year:
31.3 billion kWh) of electricity. The breakdown is:
• Climate & Renewables 2.2 billion kWh (1.6 billion kWh)
• Russia 16.2 billion kWh (15.4 billion kWh)
• Italy 6.7 billion kWh (10.8 billion kWh)
• Spain 3.5 billion kWh (3.5 billion kWh).
Climate & Renewables sold its power exclusively in non-regu-
lated markets. Its power sales rose by 38 percent, mainly due
to an increase in owned generation. Its prorated attributable
generating capacity at the end of March 2010 was 2,968 MW
compared with 2,265 MW at the end of March 2009.
The Russia market unit’s electricity sales on the wholesale
market rose by 5 percent to 16.2 billion kWh, mainly due to
cold weather.
The carve-out of assets to A2A was the main reason for the
decline in Italy’s power sales, which had the following break-
down by customer segment: 1.1 billion kWh to residential
and SME customers, 2.1 billion kWh to I&C customers, 0.5 bil-
lion kWh to sales partners, 2.7 billion kWh to the wholesale
market, and 0.3 billion kWh to E.ON Energy Trading S.p.A.
Spain’s power sales were in line with the prior-year figure.
Spain sold more power to residential and SME customers,
but less to the wholesale market.
Gas SalesOn a consolidated basis, the E.ON Group’s natural gas sales
rose by about 116.4 billion kWh relative to the prior-year figure.
The increase in Central Europe’s gas sales volume is mainly
attributable to the inclusion, effective January 1, 2010, of com-
panies in the Czech Republic.
Pan-European Gas sold 10 billion kWh, or 4 percent, more
natural gas than in the prior-year period. E.ON Ruhrgas sold
about 29 billion kWh more gas. The increase in sales volume
had the following main drivers. The beginning of economic
recovery had a positive effect on gas demand from industrial
Gas Sales1
January 1 – March 31Billion kWh 2010 2009 +/- %
Regional/municipal gas companies 141.8 132.4 +7
Industrial customers 27.5 19.0 +45
Outside Germany 51.8 40.3 +29
E.ON Ruhrgas AG sales 221.1 191.7 +15
Sales of other shareholdings 45.8 58.8 -22
Pan-European Gas internal sales -21.8 -15.8 –
Pan-European Gas sales 245.1 234.7 +4
thereof intragroup sales -71.1 -53.5 –
Other market units 297.5 173.9 +71
E.ON Group 471.5 355.1 +33
1In late 2009, we deployed a new IT system across our company for gathering energy-related data and also modified our classification methods. We adjusted the figures for the first three quarters of 2009 accordingly.
Nordic sold 0.2 billion kWh more electricity, mainly due to
colder weather in 2010. Sales to retail customers increased by
1.1 billion kWh, while sales to I&C customers, sales partners
(including minority shareholders of nuclear power plants), and
Energy Trading declined.
Power Sales1
Jan. 1 – Mar. 31Billion kWh
Central Europe U.K. Nordic U.S. Midwest Energy Trading New Markets Consolidation E.ON Group
2010 2009 2010 2009 2010 2009 2010 2009 2010 2009 2010 2009 2010 2009 2010 2009
Residential and SME 13.6 13.8 8.3 8.2 2.8 1.7 4.2 3.3 – – 1.8 0.7 – – 30.7 27.7
I&C 19.2 18.9 4.7 4.0 3.2 3.7 3.2 3.5 – – 3.1 2.5 – – 33.4 32.6
Sales partners 39.2 34.5 – – 1.4 1.7 1.3 1.2 – – 0.7 1.8 – – 42.6 39.2
Wholesale market/Energy Trading 32.5 32.6 8.9 10.8 7.2 7.3 0.3 0.3 191.0 140.1 23.0 26.3 -108.2 -111.4 154.7 106.0
Total 104.5 99.8 21.9 23.0 14.6 14.4 9.0 8.3 191.0 140.1 28.6 31.3 -108.2 -111.4 261.4 205.5
1In late 2009, we deployed a new IT system across our company for gathering energy-related data and also modified our classification methods. We adjusted the figures for the first three quarters of 2009 accordingly.

12
Interim Report I/2010
Interim Group Management Report
U.K.’s gas sales to residential and SME customers increased
by 9 percent. Most of this was due to very cold weather in
January and February 2010. The remainder of the change is
explained by increased customer numbers offset by continu-
ing energy-efficiency measures. Sales of gas to I&C customers
declined significantly due to changes within the customer
portfolio. This was slightly offset by the positive effect of colder
weather.
Nordic’s gas sales were 7 percent below the prior-year figure,
mainly due to lower sales to I&C customers and the wholesale
market. Heat sales of 3.7 billion kWh were up 19 percent from
the prior-year figure of 3.1 billion kWh, mainly due to colder
weather.
U.S. Midwest’s gas sales increased as a result of colder weather.
customers which E.ON Ruhrgas supplies indirectly through
resellers (regional gas companies and municipal utilities). Cold
weather also had a positive impact on sales in the reseller
segment, which accounted for about 30 percent of the increase
in E.ON Ruhrgas’s sales volume. Economic recovery also led
an increase in sales to industrial customers supplied directly
by E.ON Ruhrgas; this segment was also responsible for
30 percent of the increase in sales volume. Higher sales to
customers outside Germany was responsible for about 40 per-
cent of the increase. Additional amounts were supplied to
customers in Sweden, Austria, and Switzerland. An increase in
short-term trading with Energy Trading was a further positive
factor. About 64 percent of total gas sales went to regional
gas companies and municipal utilities, 12 percent to directly
supplied industrial customers, and 24 percent to customers
outside Germany. Gas sales of other shareholdings were lower
primarily due to a competition-driven decline in sales volume
at E.ON Földgáz Trade and from the absence of sales by the
Thüga Group, which was sold in the fourth quarter of 2009.
Gas Sales (Excluding Pan-European Gas)1
Jan. 1 – Mar. 31Billion kWh
Central Europe U.K. Nordic U.S. Midwest Energy Trading New Markets Consolidation E.ON Group
2010 2009 2010 2009 2010 2009 2010 2009 2010 2009 2010 2009 2010 2009 2010 2009
Residential and SME 31.6 28.5 24.6 22.6 0.1 – 3.4 2.9 – – 5.0 6.9 – – 64.7 60.9
I&C 24.1 22.9 5.6 6.6 1.2 1.3 1.7 1.6 – – 0.9 4.0 – – 33.5 36.4
Sales partners 10.1 10.3 – – – – 1.1 1.0 – – 0.5 1.3 – – 11.7 12.6
Wholesale market/Energy Trading 1.1 0.8 – – 0.1 0.2 – – 258.3 196.8 0.8 – -72.7 -133.8 187.6 64.0
Total 66.9 62.5 30.2 29.2 1.4 1.5 6.2 5.5 258.3 196.8 7.2 12.2 -72.7 -133.8 297.5 173.9
1In late 2009, we deployed a new IT system across our company for gathering energy-related data and also modified our classification methods. We adjusted the figures for the first three quarters of 2009 accordingly.
In the New Markets segment, Italy sold a total of 7.2 billion kWh
of natural gas (prior year: 12.2 billion kWh): 5 billion kWh to
residential customers and SME, 0.9 billion kWh to I&C custom-
ers, 0.5 billion kWh to sales partners, and 0.8 billion kWh to
the wholesale market. Gas sales volume declined primarily
due to lower demand from I&C customers.

13
Interim Report I/2010
Central Europe West Non-regulated’s sales declined by €0.8 bil-
lion, primarily due to lower gas prices. Sales were also reduced
by the disposal of power capacity in line with E.ON’s com-
mitment to the European Commission. This effect was offset
by the additional marketing of electricity from procurement
rights from nuclear power stations outside Germany obtained
in these transactions and by the commissioning of new gen-
erating units.
Central Europe East’s sales rose by €0.1 billion to €1.8 billion,
mainly due to the inclusion of gas companies in the Czech
Republic.
Sales reported under Other/Consolidation increased by €0.3 bil-
lion, primarily due to a reduction in intrasegment consolidation
effects.
Pan-European GasPan-European Gas’s sales declined by 27 percent to €6.3 billion
(prior year: €8.6 billion).
Sales
January 1 – March 31€ in millions 2010 2009 +/- %
Regulated 1,294 1,909 -32
Non-regulated 5,649 7,113 -21
Other/Consolidation -674 -462 -46
Pan-European Gas 6,269 8,560 -27
Earnings Situation
SalesOur first-quarter sales were at the prior-year level. Sales were
lower at nearly all market units; overall, however, external
sales were higher. Currency-translation effects and higher prices
at Nordic also had a positive effect.
Central EuropeCentral Europe’s sales declined by €0.3 billion relative to the
prior-year period.
Central Europe West Regulated’s sales were up €0.1 billion,
mainly due to a regulation-driven increase in network charges.
This more than offset the reduction in sales resulting from
the disposal of our ultrahigh-voltage transmission system in
late February 2010.
Sales
January 1 – March 31€ in millions 2010 2009 +/- %
Central Europe 11,943 12,279 -3
Pan-European Gas 6,269 8,560 -27
U.K. 3,128 3,214 -3
Nordic 1,336 1,015 +32
U.S. Midwest 543 586 -7
Energy Trading 12,900 15,556 -17
New Markets 1,671 2,166 -23
Corporate Center -11,563 -17,441 –
Total 26,227 25,935 +1
Sales
January 1 – March 31€ in millions 2010 2009 +/- %
Central Europe West 10,911 11,646 -6Regulated 3,234 3,174 +2
Non-regulated 7,677 8,472 -9
Central Europe East 1,802 1,696 +6
Other/Consolidation -770 -1,063 +28
Central Europe 11,943 12,279 -3
14
Interim Report I/2010
Interim Group Management Report
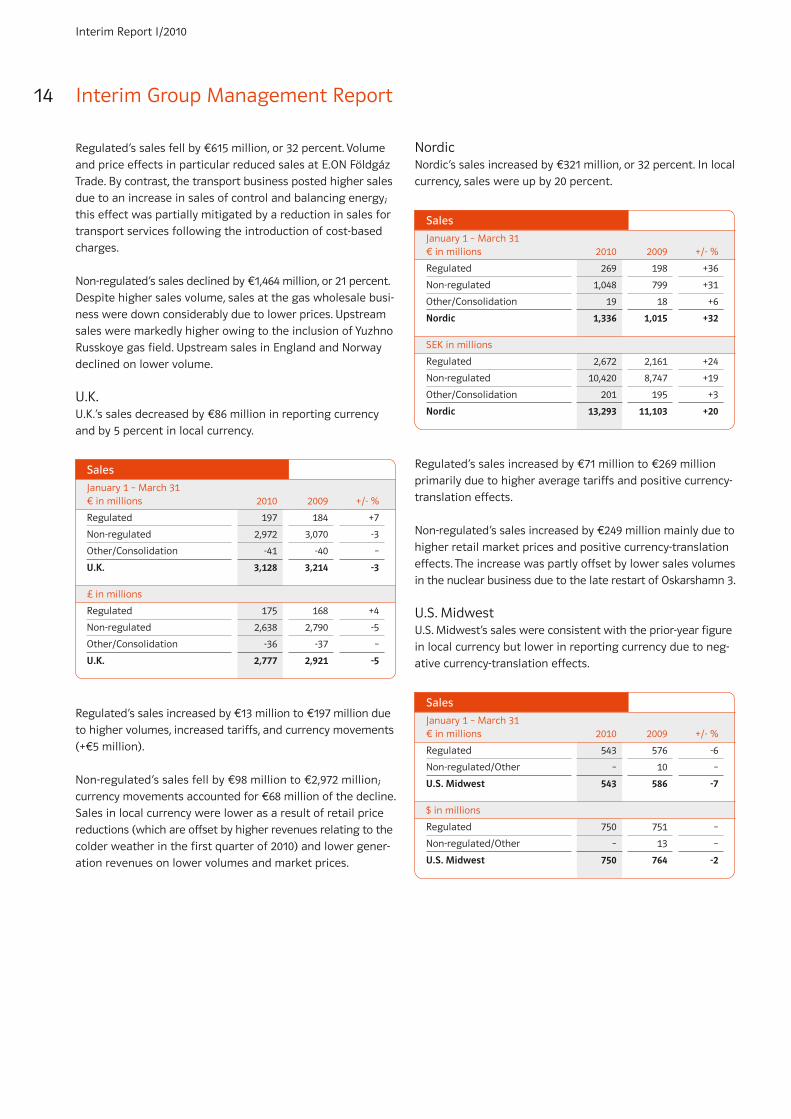
NordicNordic’s sales increased by €321 million, or 32 percent. In local
currency, sales were up by 20 percent.
Regulated’s sales increased by €71 million to €269 million
primarily due to higher average tariffs and positive currency-
translation effects.
Non-regulated’s sales increased by €249 million mainly due to
higher retail market prices and positive currency-trans lation
effects. The increase was partly offset by lower sales volumes
in the nuclear business due to the late restart of Oskarshamn 3.
U.S. MidwestU.S. Midwest’s sales were consistent with the prior-year figure
in local currency but lower in reporting currency due to neg-
ative currency-translation effects.
Sales
January 1 – March 31€ in millions 2010 2009 +/- %
Regulated 269 198 +36
Non-regulated 1,048 799 +31
Other/Consolidation 19 18 +6
Nordic 1,336 1,015 +32
SEK in millions
Regulated 2,672 2,161 +24
Non-regulated 10,420 8,747 +19
Other/Consolidation 201 195 +3
Nordic 13,293 11,103 +20
Sales
January 1 – March 31€ in millions 2010 2009 +/- %
Regulated 543 576 -6
Non-regulated/Other – 10 –
U.S. Midwest 543 586 -7
$ in millions
Regulated 750 751 –
Non-regulated/Other – 13 –
U.S. Midwest 750 764 -2
Regulated’s sales fell by €615 million, or 32 percent. Volume
and price effects in particular reduced sales at E.ON Földgáz
Trade. By contrast, the transport business posted higher sales
due to an increase in sales of control and balancing energy;
this effect was partially mitigated by a reduction in sales for
transport services following the introduction of cost-based
charges.
Non-regulated’s sales declined by €1,464 million, or 21 percent.
Despite higher sales volume, sales at the gas wholesale busi-
ness were down considerably due to lower prices. Upstream
sales were markedly higher owing to the inclusion of Yuzhno
Russkoye gas field. Upstream sales in England and Norway
declined on lower volume.
U.K.U.K.’s sales decreased by €86 million in reporting currency
and by 5 percent in local currency.
Regulated’s sales increased by €13 million to €197 million due
to higher volumes, increased tariffs, and currency movements
(+€5 million).
Non-regulated’s sales fell by €98 million to €2,972 million;
currency movements accounted for €68 million of the decline.
Sales in local currency were lower as a result of retail price
reductions (which are offset by higher revenues relating to the
colder weather in the first quarter of 2010) and lower gener-
ation revenues on lower volumes and market prices.
Sales
January 1 – March 31€ in millions 2010 2009 +/- %
Regulated 197 184 +7
Non-regulated 2,972 3,070 -3
Other/Consolidation -41 -40 –
U.K. 3,128 3,214 -3
£ in millions
Regulated 175 168 +4
Non-regulated 2,638 2,790 -5
Other/Consolidation -36 -37 –
U.K. 2,777 2,921 -5

15
Interim Report I/2010
Corporate CenterThe figure recorded under Corporate Center reflects, in partic-
ular, the intragroup offsetting of sales between our European
market units and Energy Trading.
Development of Other Significant Line Items of the Consolidated Statements of IncomeOwn work capitalized increased by 28 percent, or €21 million,
to €97 million (prior year: €76 million).
Other operating income declined by 22 percent to €5,245 mil-
lion (prior year: €6,751 million). Lower income from exchange-
rate differences of €1,798 million (prior year: €3,802 million)
and on derivative financial instruments of €2,395 million (prior
year: €2,609 million) were the main negative factors. In deriv-
ative financial instruments, there were significant effects
from commodity derivatives in the prior-year period. These
principally affected our coal, oil, and natural gas position.
Countervailing effects are recorded under other operating
expenses. Gains on the disposal of securities, shareholdings,
and fixed assets—primarily through the disposal of power
capacity and our ultrahigh-voltage transmission system
(transpower) in line with our commitment to the European
Commission—amounted to €733 million (prior year: €105 mil-
lion). Miscellaneous other operating income consisted primar-
ily of reductions of valuation allowances, rental and leasing
income, the sale of scrap metal and materials, and compen-
sation payments received for damages.
Costs of materials declined by €96 million to €19,961 million
(prior year: €20,057 million), primarily due to lower gas pro-
curement costs.
Personnel costs increased by €84 million to €1,354 million.
Depreciation charges rose to €1,818 million (prior year: €875 mil-
lion). The main reason was an impairment charge on good-
will at U.S. Midwest in conjunction with the sale of our U.S.
power and gas business.
Other operating expenses declined by 32 percent, or €2,080 mil-
lion, to €4,489 million (prior year: €6,569 million). This is
mainly attributable to lower expenses relating to currency
differences of €1,428 million (prior year: €3,760 million). By
contrast, expenses relating to derivative financial instruments
increased to €2,097 million (prior year: €1,501 million).
Energy TradingEnergy Trading recorded sales of about €13 billion in the first
quarter of 2010. Sales from proprietary trading are shown net,
along with the associated cost of materials, in the Consolidated
Statements of Income. The decline resulted mainly from
lower short-term prices affecting to the Group’s retail business.
New MarketsSales in this segment declined by 23 percent to €1,671 million.
Climate & Renewables’ sales increased by 30 percent. The
main factors were a significant increase in installed capacity,
predominantly in the United States, and a fully operational
portfolio in Italy in the current-year period; these effects were
mitigated by lower prices, particularly in Europe.
Russia’s sales rose by 41 percent year on year due to higher
electricity prices, the further liberalization of the electricity
market, and lower temperatures in the first quarter of 2010.
The ruble’s appreciation was another positive factor.
The decrease in Italy’s sales resulted in particular from lower
sales volumes and market prices. Another factor was that
the prior-year figure included €52 million in sales from assets
carved out to A2A at the end of June 2009.
Spain’s sales declined by 5 percent as a result of lower price
levels.
Sales
January 1 – March 31€ in millions 2010 2009 +/- %
Proprietary trading 17 74 -77
Optimization 12,883 15,482 -17
Energy Trading 12,900 15,556 -17
Sales
January 1 – March 31€ in millions 2010 2009 +/- %
Climate & Renewables 144 111 +30
Russia 343 244 +41Million rubles 14,103 10,826 +30
Italy 869 1,478 -41
Spain 315 333 -5
New Markets 1,671 2,166 -23

16
Interim Report I/2010
Interim Group Management Report
Central Europe West Regulated’s adjusted EBIT was adversely
affected by the disposal of our ultrahigh-voltage transmission
system in late February 2010. This was more than offset, in
particular by a regulation-driven increase in power and gas
network charges. Adjusted EBIT rose by €86 million from the
prior-year figure (€406 million).
Central Europe West Non-regulated’s adjusted EBIT declined
by €151 million. The absence of earnings streams due to the
disposal of power capacity and narrower margins in the gas
business were not entirely offset by the main positive effects,
which were efficiency improvements and the commissioning
of new generating units.
Central Europe East’s sales rose by €98 million. The increase
resulted from a positive earnings performance (primarily in
Hungary), the inclusion of gas companies in the Czech Republic,
less adverse impact from the recession, and positive currency-
translation effects.
Pan-European GasPan-European Gas’s adjusted EBIT declined by €111 million,
or 13 percent, to €713 million.
Regulated’s adjusted EBIT declined by €64 million, or 25 percent,
to €193 million. This resulted primarily from lower earnings
at E.ON Ruhrgas International, mainly due to lower earnings
from companies accounted for under the equity method.
This was slightly offset by improved earnings at E.ON Földgáz
Trade. In the prior-year period, an increase in procurement
prices resulting from higher oil prices and a weak Hungarian
forint could not be fully passed through to sales markets.
Furthermore, regulatory compensation payments in 2010 for
losses in earlier periods had a positive impact on earnings.
Earnings at the transport business were down, mainly due to
the application of cost-based charges effective October 1, 2009.
Pan-European Gas
January 1 – March 31€ in millions
Adjusted EBITDA Adjusted EBIT
2010 2009 2010 2009
Regulated 228 295 193 257
Non-regulated 615 542 522 488
Other/Consolidation -2 89 -2 79
Total 841 926 713 824
Income from companies accounted for under the equity
method was €181 million compared with €270 million in the
year-earlier period. The decline is primarily attributable to
the absence of income from Thüga shareholdings. We sold the
Thüga Group in the fourth quarter of 2009.
Adjusted EBITAdjusted EBIT, E.ON’s key figure for purposes of internal man-
agement control and as an indicator of a business’s long-term
earnings power, is derived from income/loss from continuing
operations before interest and taxes and adjusted to exclude
certain extraordinary items. The adjustments include book
gains and losses on disposals and other non-operating income
and expenses of a non-recurring or rare nature (see com-
mentary in Note 13 to the Condensed Consolidated Interim
Financial Statements).
Our adjusted EBIT in the first quarter of 2010 was €609 million
above the prior-year figure. The main drivers were:
• better retail margins, colder weather, and operating
improvements at U.K.
• wider margins at Energy Trading
• an increase in generating capacity at Climate & Renew-
ables and better margins at Russia and Spain.
Central EuropeCentral Europe’s adjusted EBIT declined by €13 million.
Adjusted EBIT
January 1 – March 31€ in millions 2010 2009 +/- %
Central Europe 1,638 1,651 -1
Pan-European Gas 713 824 -13
U.K. 433 75 +477
Nordic 234 223 +5
U.S. Midwest 129 133 -3
Energy Trading 348 107 +225
New Markets 246 159 +55
Corporate Center -32 -72 –
Total 3,709 3,100 +20
Central Europe
January 1 – March 31€ in millions
Adjusted EBITDA Adjusted EBIT
2010 2009 2010 2009
Central Europe West 1,710 1,774 1,429 1,494Regulated 649 563 492 406
Non-regulated 1,061 1,211 937 1,088
Central Europe East 312 204 239 141
Other/Consolidation 8 43 -30 16
Total 2,030 2,021 1,638 1,651

17
Interim Report I/2010
NordicNordic’s adjusted EBIT in reporting currency increased by
€11 million, or 5 percent. In local currency, it was down by
4 percent.
Regulated’s adjusted EBIT rose by €28 million, or 42 percent,
due primarily to a weather-driven increase in sales volume
and higher tariffs. Power distribution tariffs were increased
effective January 1 to cover higher costs of other system
operators (particularly Svenska Kraftnät) and substantial
investments in supply security. Currency-translation effects
constituted another positive factor.
Non-regulated’s adjusted EBIT declined by €24 million, or
15 percent, due to lower nuclear generation. The decline was
partly offset by higher average prices for hydropower sales,
increased heat production, and the deployment of reserve
power plants during particularly cold weather. In local currency,
adjusted EBIT was down by SEK 397 million, or 23 percent.
Nordic
January 1 – March 31€ in millions
Adjusted EBITDA Adjusted EBIT
2010 2009 2010 2009
Regulated 126 93 95 67
Non-regulated 190 199 137 161
Other/Consolidation 10 2 2 -5
Total 326 294 234 223
SEK in millions
Regulated 1,256 1,021 948 728
Non-regulated 1,892 2,174 1,365 1,762
Other/Consolidation 93 23 17 -55
Total 3,241 3,218 2,330 2,435
Non-regulated’s adjusted EBIT improved by €34 million, or
7 percent. Earnings at E.ON Ruhrgas’s gas wholesale business
were at the prior-year level, mainly due to higher gas sales
volume. They were adversely affected by competitive pressure
on sales prices and lower earnings from storage usage. Com-
pared with the prior-year period, less gas was withdrawn from
storage, and the spread between purchase prices and with-
drawal prices was less favorable. Upstream adjusted EBIT was
slightly higher, mainly due to the inclusion of Yuzhno Russkoye
gas field. A primarily volume-driven decline in earnings in
England and Norway adversely affected upstream earnings.
Adjusted EBIT recorded under Other/Consolidation declined
by €81 million, primarily due to the absence of earnings
streams from the Thüga Group, which was sold in late 2009.
U.K.U.K.’s adjusted EBIT increased by €358 million.
Regulated’s adjusted EBIT increased by €15 million due to
higher volumes and tariffs.
Non-regulated’s adjusted EBIT increased by €358 million, pre-
dominantly due to significantly improved margins in the
retail business compared with the exceptionally narrow margins
of the prior-year quarter (this positive effect is not expected
to continue in this magnitude for the remainder of the year),
the impact of the colder weather, and efficiency improvements.
U.K.
January 1 – March 31€ in millions
Adjusted EBITDA Adjusted EBIT
2010 2009 2010 2009
Regulated 153 138 123 108
Non-regulated 410 53 330 -28
Other/Consolidation -18 -3 -20 -5
Total 545 188 433 75
£ in millions
Regulated 136 126 109 98
Non-regulated 364 48 293 -25
Other/Consolidation -17 -3 -18 -4
Total 483 171 384 69

18
Interim Report I/2010
Interim Group Management Report
Climate & Renewables’ adjusted EBIT was considerably higher
mainly due to a significant increase in installed generating
capacity.
Russia’s adjusted EBIT rose by €45 million to €74 million,
mainly due to an improved energy margin.
Italy’s adjusted EBIT declined by 28 percent to €52 million,
primarily due to the carve-out of assets to A2A at the end of
June 2009.
Spain posted an adjusted EBIT of €56 million, of which €39 mil-
lion came from its generation and €17 million from its distri-
bution businesses. Wider margins constituted the main positive
factor in both businesses.
Net IncomeNet income attributable to shareholders of E.ON AG of €2.3 bil-
lion and corresponding earnings per share of €1.20 were both
down by 7 percent (prior year: €2.5 billion and €1.29).
Compared with the prior-year figure, adjusted interest expense
(net) declined by €51 million, due mainly to the positive devel-
opment of our net financial position and higher construction-
phase interest which is capitalized with the investments.
Net Income
January 1 – March 31€ in millions 2010 2009 +/- %
Adjusted EBIT 3,709 3,100 +20
Adjusted interest expense (net) -555 -606 –
Net book gains/losses 666 -10 –
Restructuring and cost-management expenses -127 -86 –
Other non-operating earnings -76 1,108 –
Income/loss from continuing
operations before income taxes 3,617 3,506 +3
Income taxes -1,171 -883 –
Income/loss from continuing
operations 2,446 2,623 -7
Income/loss from discontinued operations, net -1 -26 –
Net income 2,445 2,597 -6
Shareholders of E.ON AG 2,278 2,457 -7
Minority interests 167 140 +19
U.S. MidwestU.S. Midwest’s adjusted EBIT decreased by €4 million, or 3 per-
cent, due to negative currency-translation effects. Adjusted
EBIT in local currency was slightly higher due to higher elec-
tric and gas margins resulting from regulatory cost-recovery
mechanisms and to colder weather.
Energy TradingEnergy Trading recorded an adjusted EBIT of €348 million in
the first quarter of 2010. Optimization, whose main purpose is
to limit risks and optimize the deployment of the E.ON Group’s
generation and production assets, contributed €350 million
due to wider margins. Proprietary Trading recorded a loss of
€2 million. Its earnings performance was adversely affected
by volatile and challenging market developments.
New MarketsAdjusted EBIT in this segment rose by 55 percent to €246 million.
U.S. Midwest
January 1 – March 31€ in millions
Adjusted EBITDA Adjusted EBIT
2010 2009 2010 2009
Regulated 174 179 132 136
Non-regulated/Other -3 -2 -3 -3
Total 171 177 129 133
$ in millions
Regulated 241 233 183 177
Non-regulated/Other -5 -3 -5 -4
Total 236 230 178 173
Energy Trading
January 1 – March 31€ in millions
Adjusted EBITDA Adjusted EBIT
2010 2009 2010 2009
Proprietary Trading -2 54 -2 53
Optimization 352 55 350 54
Total 350 109 348 107
New Markets
January 1 – March 31€ in millions
Adjusted EBITDA Adjusted EBIT
2010 2009 2010 2009
Climate & Renewables 110 58 64 22
Russia 99 55 74 29Million rubles 4,089 2,444 3,022 1,291
Italy 113 136 52 72
Spain 85 60 56 36
Total 407 309 246 159

19
Interim Report I/2010
Adjusted Net IncomeNet income reflects not only our operating performance but
also special effects such as the marking to market of deriva-
tives. Adjusted net income is an earnings figure after interest
income, income taxes, and minority interests that has been
adjusted to exclude certain special effects. In addition to the
marking to market of derivatives, the adjustments include
book gains and book losses on disposals, restructuring expenses,
other non-operating income and expenses (after taxes and
minority interests) of a special or rare nature. Adjusted net
income also excludes income/loss from discontinued operations
and from the cumulative effect of changes in IFRS principles
(after taxes and minority interests), as well as special tax
effects.
Adjusted Net Income
January 1 – March 31€ in millions 2010 2009 +/- %
Net income attributable to shareholders of E.ON AG 2,278 2,457 -7
Net book gains/losses -666 10 –
Restructuring and cost-management expenses 127 86 –
Other non-operating earnings 76 -1,108 –
Taxes and minority interests on non-operating earnings 279 339 –
Special tax effects -9 -9 –
Income/loss from discontinued operations, net 1 26 –
Total 2,086 1,801 +16
Net book gains in the first quarter of 2010 were €676 million
above the prior-year level. This is mainly attributable to the
sale of power capacity and our ultrahigh-voltage transmis-
sion system in line with our commitment to the European
Commission.
Restructuring and cost-management expenses rose by about
€41 million. As in the prior-year period, a significant portion
of these expenses resulted from restructuring measures at our
regional utilities in Germany and from the continued imple-
mentation of the changes to the E.ON Group’s organizational
structure decided on in 2008. In addition, our PerformtoWin
project led to higher expenses than in the prior-year period.
Other non-operating earnings primarily reflect the marking
to market of derivatives used to protect our operating busi-
ness from price fluctuations. At March 31, 2010, the marking to
market of derivatives resulted in a positive effect of about
€0.8 billion compared with about €1.5 billion at March 31, 2009.
In addition, we recorded an impairment charge of €0.9 billion
on goodwill at the U.S. Midwest market unit in conjunction
with the disposal of our U.S. power and gas business. Other
non-operating earnings in the prior-year period were adversely
affected by write-downs on securities and financial invest-
ments as well as costs relating to a storm in Kentucky at the
start of 2009.
The €288 million increase in our tax expense compared with
the first quarter of 2009 is mainly attributable to the fact
that the impairment charge on goodwill at U.S. Midwest does
not result in tax relief and to a reduction in tax-free earnings.
Our effective tax rate therefore rose from 25 percent in the
prior-year period to 32 percent.
Income/loss from discontinued operations, net, consists of
Western Kentucky Energy, which was sold in 2009. Pursuant to
IFRS, its results are reported separately in the Consolidated
Statements of Income (see Note 5 to the Consolidated Finan-
cial Statements).
Adjusted Interest Expense (Net)
January 1 – March 31€ in millions 2010 2009
Interest expense shown in Consolidated Statements of Income -528 -625
Interest income (-)/expense (+) not affecting net income -27 19
Total -555 -606

20
Interim Report I/2010
Interim Group Management Report
Pan-European Gas invested €190 million. Of this figure, €185 mil-
lion (prior year: €301 million) went towards property, plant,
and equipment and intangible assets. It consisted mainly of
investments in the exploration business and in gas infrastruc-
ture. Share investments of €5 million were consistent with
the prior-year level (€8 million).
U.K. invested €196 million (prior year: €174 million) in property,
plant, and equipment and intangible assets. U.K.’s expenditure
mainly related to investments in its generation fleet (includ-
ing the construction of Grain gas-fired CHP plant) and in its
distribution network.
Nordic invested €37 million less. It invested €136 million (prior
year: €173 million) in intangible assets and property, plant,
and equipment to maintain and expand existing production
plants and to upgrade and modernize its distribution net-
work. Share investments of €2 million were consistent with
the prior-year level.
U.S. Midwest’s investments were lower than the prior year
due to completion of flue-gas desulfurization (“FGD”) at Ghent 3
(March 2009), lower spending on FGD at Brown, and lower
spending on the new generating unit at Trimble County.
The New Markets segment invested about €412 million (prior-
year: €505 million). Climate & Renewables invested €105 mil-
lion, less than in the prior-year period (€353 million). The
decline is due to timing effects related to large payments for
U.S. projects in the first quarter of 2009. Russia invested
€156 million (€61 million), mainly in its new-build program.
Italy’s investments of €21 million (€27 million) related mainly
to the retrofit of Terni hydroelectric station and to distribu-
tion grid maintenance. Spain’s investments of €130 million
(€64 million) mainly reflected expenditure on the CCGT under
construction in Algeciras.
Financial Condition
Cash-Effective and Economic InvestmentsOur cash-effective investments declined to €1.8 billion in the
first quarter of 2010. We invested €1.7 billion in property, plant,
and equipment and intangible assets (prior year: €1.8 billion).
Share investments totaled €40 million versus €68 million in
the prior-year period.
Our economic investments are equal to our cash-effective
investments plus the value of debt acquired and asset swaps.
Central Europe invested €178 million more in the first quarter
of 2010 than in the prior-year period. Investments in property,
plant, and equipment and in intangible assets rose by €204 mil-
lion to €711 million. Central Europe’s investments included
€532 million for power generation assets. The increase of
€184 million relative to the prior-year period resulted primarily
from higher expenditures for the Malzenice and Gönyü power
plant projects. Investments in network assets of €127 million
were up slightly. Share investments of €20 million were €26 mil-
lion below the prior-year figure (€46 million).
Cash-Effective Investments
January 1 – March 31€ in millions 2010 2009 +/- %
Central Europe 731 553 +32
Pan-European Gas 190 309 -39
U.K. 196 174 +13
Nordic 138 175 -21
U.S. Midwest 77 139 -45
Energy Trading 2 1 +100
New Markets 412 505 -18
Corporate Center 9 40 -78
Total 1,755 1,896 -7
Economic Investments
January 1 – March 31€ in millions 2010 2009
Cash-effective investments 1,755 1,896
Debt acquired – –
Asset swaps 147 –
Total 1,902 1,896

21
Interim Report I/2010
Cash Flow and Financial ConditionE.ON presents its financial condition using, among other
financial measures, cash provided by operating activities of
continuing operations and economic net debt.
Our cash provided by operating activities rose by 8 percent,
from €2.9 billion in the prior-year period to €3.1 billion. The
main positive factors were cash-effective items in our adjusted
EBITDA, other positive working-capital effects, cash grants
for wind farms in the United States, and the absence in the
current year of costs relating to a storm in Kentucky in early
2009. The main negative factors were effects from gas storage
usage, less income from the sale of carbon allowances, and
higher interest payments relating to the financing of our
investment program.
Cash provided by investing activities amounted to -€950 million
in the first quarter of 2010 (prior year: -€1,998 million). The
reduction in net expenditures compared with the prior-year
period is mainly attributable to disposals in the generation
and network areas.
Cash provided by financing activities of -€898 million (prior
year: €1,892 million) in the first quarter of 2010 primarily
reflects the repayment of bonds and payments to minority
shareholders. The positive prior-year figure was attributable
to the issue of new bonds.
Our economic net debt at March 31, 2010, of -€43,877 million
was €788 million lower than the figure at December 31, 2009
(-€44,665 million). In the first quarter of 2010, our strong cash
provided by operating activities and the disposal proceeds for
trans power exceeded our significant investments in property,
plant, and equipment.
Cash Provided by Operating Activities of Continuing Operations
January 1 – March 31€ in millions 2010 2009 +/-
Cash provided by operating
activities of continuing
operations 3,122 2,886 +236
Maintenance investments 176 269 -93
Growth and replacement investments, acquisitions, other 1,579 1,627 -48
Cash-effective effects from disposals 1,034 31 +1,003
The calculation of economic net debt includes the fair value
(net) of currency derivatives used for financing transactions
(but excluding transactions relating to our operating business
and asset management) in order to also reflect the foreign-
currency effects of financial transactions which, for account-
ing reasons, would not be included in the components of
net financial position.
E.ON did not issue new bonds in the first quarter of 2010.
Standard & Poor’s (“S&P”) long-term rating for E.ON is A; Moody’s
long-term rating for E.ON is A2. The short-term ratings are
A-1 (S&P) and P-1 (Moody’s). The ratings assigned by both agen-
cies thus correspond to E.ON’s target rating. Both S&P and
Moody’s confirmed their long-term and short-term ratings for
E.ON, all with a stable outlook, in December 2009 and April
2010, respectively.
Economic Net Debt
€ in millionsMar. 31,
2010Dec. 31,
2009
Liquid funds 7,564 6,116
Non-current securities 3,747 3,670
Total liquid funds and non-current
securities 11,311 9,786
Financial liabilities to banks and third parties -35,661 -35,579
Financial liabilities to Group companies -2,245 -2,198
Total financial liabilities -37,906 -37,777
Net financial position -26,595 -27,991
Fair value (net) of currency derivatives used for financing transactions1 -165 -6
Provisions for pensions -3,250 -2,884
Asset retirement obligations -15,210 -15,050
Less prepayments to Swedish nuclear fund 1,343 1,266
Economic net debt -43,877 -44,665
1Does not include transactions relating to our operating business or asset management.

22
Interim Report I/2010
Interim Group Management Report
Asset Situation
Non-current assets as of March 31, 2010, rose by 3 percent
compared with the figure at year-end 2009, mainly due to
investments in property, plant, and equipment.
Current assets rose by 9 percent from year-end 2009. The
main factor was a seasonal increase in current receivables
and other operating assets.
Our equity ratio of 29 percent is on par with the figure
recorded at year-end 2009.
Non-current liabilities increased by about €2 billion, or 3 per-
cent, to about €73 billion, primarily due to higher deferred
taxes and additions to non-current provisions.
Consolidated Assets, Liabilities, and Equity
€ in millions Mar. 31, 2010 % Dec. 31, 2009 %
Non-current assets 116,530 73 113,028 74
Current assets 43,304 27 39,568 26
Total assets 159,834 100 152,596 100
Equity 47,064 29 43,971 29
Non-current liabilities 73,112 46 70,772 46
Current liabilities 39,658 25 37,853 25
Total equity and liabilities 159,834 100 152,596 100
Current liabilities rose by 5 percent from year-end 2009, chiefly
due to a seasonal increase in operating liabilities in the first
quarter.
The following key figures underscore that the E.ON Group
has a solid asset and capital structure:
• Non-current assets are covered by equity at 40 percent
(December 31, 2009: 39 percent).
• Non-current assets are covered by long-term capital at
103 percent (December 31, 2009: 102 percent).
Additional information is contained in Notes 3 and 5 to the
Condensed Consolidated Interim Financial Statements.

23
Interim Report I/2010
Increasing competition in the natural gas market and increas-
ing trading volumes at virtual trading points and gas exchanges
could result in risks for natural gas purchased under long-
term take-or-pay contracts. On the other hand, these contracts
between producers and importers are subject to periodic
adjustments to the current market situation.
The demand for electric power and natural gas is seasonal,
with our operations generally experiencing higher demand
during the cold-weather months of October through March
and lower demand during the warm-weather months of April
through September. As a result of these seasonal patterns,
our sales and results of operations are higher in the first and
fourth quarters and lower in the second and third quarters.
Sales and results of operations for all of our energy operations
can be negatively affected by periods of unseasonably warm
weather during the autumn and winter months. Our Nordic
market unit also could be negatively affected by a lack of pre-
cipitation, which could lead to a decline in hydroelectric gen-
eration. We expect seasonal and weather-related fluctuations
in sales and results of operations to continue.
We use a comprehensive sales management system and
intensive customer management to minimize these risks.
The E.ON Group’s business operations are exposed to commod-
ity price risks. In order to limit our exposure to these risks,
we conduct systematic risk management. The key elements
of our risk management are, in addition to the above-men-
tioned binding Group-wide guidelines and Group-wide report-
ing system, the use of quantitative key figures, the limitation
of risks, and the strict separation of functions between depart-
ments. We also utilize derivative financial instruments that
are commonly used in the marketplace. These instruments are
transacted with financial institutions, brokers, power exchanges,
and third parties whose creditworthiness we monitor on an
ongoing basis. The creation of E.ON Energy Trading has enabled
us to systematically combine and consistently manage price
risks on Europe’s liquid commodity markets. Proprietary com-
modity trading is conducted in accordance with detailed
guidelines and within narrowly defined limits.
We also use systematic risk management to manage our
interest-rate and currency risks. E.ON’s use of derivative finan-
cial instruments and its operating activities expose E.ON to
credit risks. We use a Group-wide credit risk management
system to systematically monitor the creditworthiness of our
business partners and regularly monitor our credit risk. Further-
more, there are potential risks due to possible changes in
the value of current and non-current securities; we manage
Employees
As of March 31, 2010, the E.ON Group had 88,580 employees
worldwide, nearly unchanged from year-end 2009. E.ON also
had 2,075 apprentices and 333 board members and managing
directors.
As of the same date, 53,370 employees, or 60 percent of all
staff, were working outside Germany, also nearly unchanged
from year-end 2009.
The number of employees at our market units remained largely
stable in the first quarter of 2010. Central Europe gained
employees in the Czech Republic and Hungary due to the
inclusion of new subsidiaries and lost employees in Germany
due to the sale of its ultrahigh-voltage transmission system;
on balance, its workforce increased slightly to 48,314 employ-
ees. The inclusion of a new gas company at Spain increased
New Markets’ workforce by 4 percent.
Risk Situation
In the normal course of business, we are subject to a number
of risks that are inseparably linked to the operation of our
businesses.
Our market units operate in an international market environ-
ment that is characterized by general risks relating to the
business cycle. In connection with the current economic crisis,
E.ON faces risks from declining demand, primarily from
industrial and commercial customers who, increasingly, are
cutting their production and may cut it further. This could
result in us being unable to sell energy we have already pro-
cured. In addition, the entry of new suppliers into the market-
place along with more aggressive tactics by existing market
participants has created a keener competitive environment
for our electricity business in and outside Germany which could
reduce our margins. E.ON Ruhrgas also faces risks associated
with increased competitive pressure in the gas sector.
Employees1
Mar. 31,
2010Dec. 31,
2009 +/- %
Central Europe 48,314 48,126 –
Pan-European Gas 3,152 3,143 –
U.K. 16,040 16,098 –
Nordic 5,552 5,570 –
U.S. Midwest 3,114 3,119 –
Energy Trading 1,082 1,075 +1
New Markets 8,295 7,976 +4
Corporate Center2 3,031 3,120 -3
Total 88,580 88,227 –
1Figures do not include board members, managing directors, or apprentices.2Includes E.ON IT.

24
Interim Report I/2010
Interim Group Management Report
that lead to outages or power plant shutdowns. Operational
failures or extended production stoppages of facilities or com-
ponents of facilities could negatively impact our earnings.
We could be subject to environmental liabilities associated
with our nuclear and conventional power operations that
could materially and adversely affect our business. In addition,
new or amended environmental laws and regulations may
result in significant increases in our costs.
The following are among the comprehensive measures we
take to address these risks:
• systematic employee training, advanced training, and
qualification programs
• further refinement of our production procedures and
technologies
• regular facility and network maintenance and inspection
• company guidelines as well as work and process
instructions
• quality management, control, and assurance
• project, environmental, and deterioration management
• crisis-prevention measures and emergency planning.
Should an accident occur despite the measures we take, we
have a reasonable level of insurance coverage.
In addition, there are currently certain risks relating to legal
proceedings resulting from the E.ON Group’s operations. These
in particular include legal actions and proceedings concerning
price increases (including legal actions to demand repayment
of the increase differential in view of the increasing prepon-
derance of case law ruling that price-adjustment clauses are
invalid in the special-customer segment), alleged market-
sharing agreements, and anticompetitive practices.
On July 8, 2009, the European Commission fined E.ON Ruhrgas
and E.ON (as joint debtor) €553 million for an alleged market-
sharing agreement with GdF Suez. In September 2009, E.ON
Ruhrgas and E.ON filed an appeal with the European Court of
First Instance to have the ruling overturned. Filing an appeal
does not suspend the fine, which was paid, by the deadline, in
October 2009. We cannot rule out the possibility of subsequent
lawsuits.
E.ON is building a hard-coal-fired power plant in Datteln,
Germany. The plant is designed to have a net electric capacity
of about 1,055 MW. The Münster Superior Administrative Court
(“SAC”) issued a decision on September 3, 2009, that declares
void the City of Datteln’s Development Plan (No. 105 E.ON
Kraftwerk). The SAC criticized errors in judgment and, in partic-
ular, that the Development Plan did not sufficiently take into
consideration binding rules contained in North Rhine-West-
phalia’s State Development Plan and State Development
these risks by means of appropriate asset management. As
part of our diversified asset-management portfolio, we also
invest in government bonds.
E.ON could face liquidity risks due to margin calls resulting
from adverse price developments of derivative financial
instruments.
Even E.ON is not entirely unaffected by the current financial
environment. As mentioned above, production declines in
cyclical industries due to the financial and economic crisis
could, despite the largely non-cyclical nature of the energy
industry, over time have a negative impact on our business.
In addition, declining valuations and increased volatility could
require us to write down the value of some of our financial
assets. Furthermore, some of our business partners and end-
customers could default on their payments to us. We are
addressing this increase in credit default risk by stepping up
our risk-management efforts, particularly with regard to
financial institutions.
Thanks to its very good creditworthiness, E.ON has up to now
had no trouble accessing debt markets. We carry out both
short-term and long-term financial planning to monitor and
manage liquidity risks.
Our business strategy involves acquisitions and investments
in our core business as well as disposals. This strategy depends
in part on our ability to successfully identify, acquire, and
integrate companies that enhance our energy business on
acceptable terms. We have comprehensive preventive measures
in place to manage the potential risks associated with acqui-
sitions and investments. In addition to the relevant company
guidelines and manuals, these include, to the degree possible,
comprehensive due diligence, legally binding contracts, a
multi-stage approvals process, and shareholding and/or pro-
ject controlling. Comprehensive post-acquisition integration
projects also contribute to successful integration. In the case
of planned disposals, E.ON faces the non-assessable risk of
disposals not taking place or being delayed and the risk that
E.ON receives lower-than-anticipated disposal proceeds. In
such projects, it is not possible at this time to determine the
likelihood of these risks. If planned disposals do not take
place or are significantly delayed, this would have a negative
impact on the planned development of our debt factor.
Technologically complex production facilities are involved in
the production and distribution of energy. Our electricity
operations in and outside Germany could experience unanti-
cipated operating or other problems, including severe weather,

25
Interim Report I/2010
There are also lawsuits pending against E.ON AG and U.S. sub-
sidiaries in connection with the disposal of VEBA Electronics
in 2000. In addition, court actions, governmental investigations,
and proceedings, and other claims could be instituted or
asserted in the future against companies of the E.ON Group.
We attempt to minimize the risks of current and future legal
proceedings by managing these proceedings appropriately
and by designing appropriate contracts prior to agreements
being concluded.
E.ON Ruhrgas currently obtains about one fourth of its total
natural gas supply from Russia pursuant to long-term supply
contracts with Gazprom. In addition, E.ON Ruhrgas currently
obtains natural gas from five other supply countries, giving it
one of the most diversified gas procurement portfolios in
Europe. Certain past events in some Eastern European countries
have heightened concerns in parts of Western Europe about
the reliability of Russian gas supplies, even though Russia
has always been a very reliable supplier. Economic or political
instability or other disruptive events in any transit country
through which Russian gas must pass before it reaches its final
destination in Western Europe can have a material adverse
effect on the supply of such gas, and all such events are com-
pletely outside E.ON Ruhrgas’s control.
The political, legal, and regulatory environment in which the
E.ON Group does business is also a source of external risks.
Changes to this environment can lead to considerable uncer-
tainty with regard to planning.
European regulatory agencies have been putting together
recommendations for a legally binding set of rules on how
gas transmission system operators (“TSOs”) manage gas capac-
ity and bottlenecks in their systems. The rules will apply to
cross-border transfer points between member states and to
transfer points between different gas TSOs within a single
member state. Market participants have seen the recommen-
dations, which may create risks for existing supply contracts
and for intraday flexibility. In parallel, the German Federal
Ministry of Economics and Technology and the Federal Net-
work Agency (known by its German acronym, “BNetzA”) are
planning to make changes in how capacity is managed on
gas transmission pipelines in Germany. It is anticipated that
after the current consultations new draft amendments to
the Gas Network Access Ordinance, as well as the BNetzA’s
regulations, will be presented. The amendments could affect
our existing gas operations.
As established in its coalition agreement, the German fed-
eral government began the process of lifting the Gorleben
moratorium. The study of Gorleben will now continue in a
multi-stage, open-ended process. The Federal Ministry of the
Environment does not expect the preparatory phase (which
will determine whether Gorleben is suitable and end, if such
a determination is made, with the drafting of new nuclear-
energy legislation) to be completed before the end of the next
legislative period.
Program. On March 16, 2010, the Federal Administrative Court
in Leipzig upheld the SAC’s ruling, which is now legally bind-
ing. The Datteln City Council passed a resolution to institute a
new development plan process relating to the hard-coal-
fired power plant in Datteln. In December 2009, the North
Rhine-Westphalia state legislature eliminated from the State
Development Program the priority formerly given to domestic
energy sources in the state’s energy production. In early Feb-
ruary 2010, the North Rhine-Westphalia state cabinet took
action to deal first with the energy section of the new State
Development Program. In general, these measures are
designed to offer greater certainty with regard to planning for
projects to build new power plants in North Rhine-Westphalia,
including for the hard-coal-fired power plant in Datteln. In
view of these matters, however, we cannot rule out the possi-
bility that the power plant will enter service at a later date
than originally planned. In principle, these types of risks attend
our other power and gas new-build projects. We strive to
identify such risks early and to minimize them by monitoring
planning and consents processes.
In early 2009, the German Federal Cartel Office (“FCO”), as
part of a sector inquiry, sent a number of E.ON companies a
demand for information regarding the capacity situation in
Germany’s gas transport pipeline system. The companies in
question submitted their responses to the FCO. The sector
inquiry was concluded on December 15, 2009, with the publi-
cation of a final report. The FCO’s report did not announce
any proceedings against E.ON Group companies.
In 2009 and 2010, the European Commission conducted an
antitrust investigation of E.ON companies for alleged gas-
capacity hording. The Commission had expressed the suspi-
cion that E.ON Ruhrgas, by booking long-term capacity in the
gas transmission system of E.ON Gastransport (“EGT”), may
have been preventing competitors from gaining access to
gas supply markets and consequently may have violated
laws against anticompetitive practices. In negotiations with
the Commission in 2009, we reached an agreement in princi-
ple that the Commission would terminate the investigation
by means of a commitment decision pursuant to Article 9,
Council Regulation 1/2003, under which E.ON Ruhrgas would
relinquish a portion of its long-term capacity bookings in
EGT’s system. On March 26, 2010, E.ON formally made these
commitments which had been negotiated with the Commis-
sion. On May 4, 2010, the Commission issued a binding com-
mitment decision and terminated its investigation.

26
Interim Report I/2010
Interim Group Management Report
In late 2009, the BNetzA instituted formal proceedings against
all E.ON Energie regional distribution companies (“RDCs”) in
Germany that have implemented the new regional structure
and against E.ON Energie for allegedly not complying with
unbundling requirements. The BNetzA plans to treat the pro-
ceedings against E.ON Bayern and E.ON Energie as model-
case proceedings and to suspend the proceedings against the
other RDCs. E.ON Energie along with E.ON Bayern and E.ON
edis (both of which are RDCs with minority municipal share-
holders) have filed a detailed response to the formal proceed-
ings initiated against them.
E.ON Gastransport’s supraregional transport business will be
migrated to incentive-based regulation in 2010. Prior to migra-
tion, the BNetzA will conduct a benchmarking of Germany’s
small and very heterogeneous group of supraregional gas TSOs.
The preliminary individual efficiency factor was communicated
to companies in late March 2010. Negotiations between the
BNetzA and gas TSOs to set the final efficiency factor will take
place until the end of May. The individual efficiency factor
will have an impact on the revenue cap.
The Netherlands is currently drafting legislation that would
require the country’s TSOs to give preferential treatment to
renewable-source electricity and define rules for managing
any resulting bottlenecks. If the proposed legislation is
enacted, it and the actual occurrence of bottlenecks could
adversely affect our power stations in the Netherlands.
In August 2009, the European Commission, the European
Parliament, and the member states approved the third internal-
market package. In addition to the complete legal unbundling
of electricity and gas TSOs, the third internal-market package
allows the establishment of an independent transmission
operator (“ITO”) or an independent system operator (“ISO”). The
third legislative package will affect the entire value chain
and will grant national and European regulatory agencies far-
reaching new authority to intervene in markets. Risks result
not only from the increased scope of intervention options, but
also from the legislation that the member states enact to
transpose the third legislative package into national law, which
could go beyond the guidelines of the electricity and gas
directives. The two directives must be transposed into national
law by March 2011. The member states began drafting such
national laws earlier this year.
In addition, the European Commission, the European Parlia-
ment, and the Council passed the green legislative package
whose purpose is to enable the EU to achieve its climate
targets. By 2020, renewables are supposed to meet 20 percent
of the EU’s energy consumption, while greenhouse-gas emis-
sions are to be reduced by 20 percent from 1990 levels. ETS
emission allowances have so far been allocated at no cost.
No-cost allocation will gradually be replaced by the auctioning
of allowances. Starting in 2013, power producers will have to
acquire all of their allowances through auctions. The number
of allowances will be reduced each year. Industries not sub-
ject to the ETS will also have to reduce their emissions in accor-
dance with national targets; a portion of the fuel they use
must come from renewable sources. The EU will provide finan-
cial support for the development of carbon-capture-and-
storage technology. The green package will have a profound
impact on the future generation mix, network infrastructure,
and market rules.
We try to manage these risks by engaging in an intensive
and constructive dialog with government agencies and
policymakers.
The operational and strategic management of the E.ON Group
relies heavily on complex information technology. Our IT sys-
tems are maintained and optimized by qualified E.ON Group
experts, outside experts, and a wide range of technological
security measures. In addition, the E.ON Group has in place a
range of technological and organizational measures to coun-
ter the risk of unauthorized access to data, the misuse of data,
and data loss.
During the period under review, the risk situation of the E.ON
Group’s operating business did not change significantly from
year-end 2009. Sustained low price levels in commodity markets
and a lasting and significant reduction in demand, particu-
larly from industrial customers, continue to be the main factors
that could have a substantial impact on the E.ON Group’s
earnings situation over the medium term. From today’s perspec-
tive, however, we do not perceive any risks in the future that
would threaten the existence of the E.ON Group or individual
market units.
Subsequent Events
In April 2010, E.ON sold the power and gas business of E.ON U.S.
to PPL Corporation. The agreed-on purchase price is €7.6 bil-
lion. We expect the transaction, which is subject to antitrust
and regulatory approval, to close in late 2010. Effective the
second quarter, E.ON U.S. will be classified as a discontinued
operation for the entire financial year (see also Note 5 to the
Consolidated Interim Financial Statements).
In April 2010, we fulfilled our commitment to the European
Commission to divest certain power capacity and our ultra-
high-voltage transmission system in Germany.

27
Interim Report I/2010
We expect U.K.’s 2010 adjusted EBIT to be higher than in 2009,
due primarily to benefits from efficiency improvements. The
key challenges are an increasingly competitive marketplace
and the residual impact of the recession.
We expect Nordic’s 2010 adjusted EBIT to surpass the 2009
figure. Nuclear outages for upgrades and modernization
measures were the main negative factors in 2009, whereas 2010
earnings will benefit primarily from positive transfer-price
effects.
We expect Energy Trading’s 2010 adjusted EBIT to be above
the 2009 number, mainly due to the positive performance of
optimization activities.
We anticipate that New Markets’ 2010 adjusted EBIT will be
below the prior-year figure. Italy’s earnings will be adversely
affected by the absence of a positive one-off effect recorded
in 2009 and by the carve-out of significant generation activities
to Italian energy utility A2A. We expect a positive contribution
from Spain due to the optimization of power plants. Climate
& Renewables will benefit from a significant increase in its
generating capacity. Russia will benefit from the positive
impact of ongoing market liberalization and from a capacity
increase at Shaturskaya power station.
OpportunitiesPositive developments in foreign-currency rates and market
prices for commodities such as electricity, natural gas, coal,
oil, and carbon dioxide can create opportunities for our oper-
ations. Periods of exceptionally cold weather—very low aver-
age temperatures or extreme daily lows—in the fall and winter
months can create opportunities for us to meet higher
demand for electricity and natural gas.
Opportunities will also be created in the years ahead by the
establishment of the Agency for the Cooperation of Energy
Regulators (“ACER”), whose independence from purely national
considerations will enable it to do more to promote European
market integration. This will lead to the harmonization of
market structures, making it easier to enter, and achieve growth
in, other markets.
In the period under review, our opportunities did not change
significantly relative to those described in our 2009 Financial
Report.
Forecast
Discontinued OperationsFollowing the successful conclusion of sales negotiations for
our U.S. Midwest market unit, pursuant to IFRS 5 this segment
is classified as a discontinued operation effective the second
quarter of 2010. U.S. Midwest’s results will not be shown in
our adjusted EBIT or adjusted net income for the entire 2010
financial year; the 2009 figures will also be adjusted. U.S. Mid-
west is therefore no longer included in our forecast.
EarningsAs in the prior year, the forecast for the E.ON Group’s earnings
development is subject to significant uncertainty due to the
global financial and economic crisis. From today’s perspective,
it is difficult to predict the pace of economic recovery; in par-
ticular, the market environment of our gas business is adversely
affected by overcapacity. Under our PerformtoWin program,
we have already initiated a variety of measures to reduce our
costs and improve our efficiency and productivity. Despite
the portfolio changes completed in 2009, we therefore expect
our 2010 adjusted EBIT to be 0 to 3 percent above the prior-
year figure. We anticipate that 2010 adjusted net income will
be in line with 2009. We expect to record slightly higher inter-
est and tax expenditures. We stand by our dividend payout
ratio of 50 to 60 percent of adjusted net income.
Our forecast also remains unchanged from a pro forma per-
spective that includes U.S. Midwest’s results in our 2009 and
2010 adjusted EBIT and adjusted net income.
Our forecast by market unit:
We now expect Central Europe’s 2010 adjusted EBIT to be below
the 2009 figure. Its underlying business will benefit from posi-
tive effects that include the commissioning of new generating
units and a reduced impact from the recession. However,
earnings will be adversely affected by the disposal of power
capacity and the ultrahigh-voltage transmission system.
We anticipate that Pan-European Gas’s 2010 adjusted EBIT will
be below the 2009 figure. The absence of earnings streams
from Thüga is the main negative factor. Another is cost-based
regulation which will impact the gas transport business in
Germany for the entire year. These factors will be partially off-
set by higher upstream earnings due to the inclusion of Yuzhno-
Russkoye gas field for the entire year.
28
Interim Report I/2010
Review Report
To E.ON AG, Düsseldorf
We have reviewed the Condensed Consolidated Interim
Financial Statements - comprising the balance sheet, income
statement, statement of recognised income and expenses,
condensed cash flow statement, statement of changes in
equity and selected explanatory notes - and the Interim
Group Management Report of E.ON AG, Düsseldorf, for the
period from January 1 to March 31, 2010, which are part of
the quarterly financial report pursuant to § (Article) 37x Abs.
(paragraph) 3 WpHG (“Wertpapierhandelsgesetz”: German
Securities Trading Act). The preparation of the Condensed
Consolidated Interim Financial Statements in accordance
with the IFRS applicable to interim financial reporting as
adopted by the EU and of the Interim Group Management
Report in accordance with the provisions of the German
Securities Trading Act applicable to interim group manage-
ment reports is the responsibility of the parent Company’s
Board of Managing Directors. Our responsibility is to issue a
review report on the Condensed Consolidated Interim Finan-
cial Statements and on the Interim Group Management
Report based on our review.
We conducted our review of the Condensed Consolidated
Interim Financial Statements and the Interim Group Manage-
ment Report in accordance with German generally accepted
standards for the review of financial statements promul-
gated by the Institut der Wirtschaftsprüfer (Institute of Public
Auditors in Germany) (IDW) and additionally observed the
International Standard on Review Engagements “Review of
Interim Financial Information Performed by the Independent
Auditor of the Entity” (ISRE 2410). Those standards require
that we plan and perform the review so that we can pre-
clude through critical evaluation, with moderate assurance,
that the Condensed Consolidated Interim Financial state-
ments have not been prepared, in all material respects, in
accordance with the IFRS applicable to interim financial
reporting as adopted by the EU and that the Interim Group
Management Report has not been prepared, in all material
respects, in accordance with the provisions of the German
Securities Trading Act applicable to interim group manage-
ment reports. A review is limited primarily to inquiries of
company personnel and analytical procedures and therefore
does not provide the assurance attainable in a financial
statement audit. Since, in accordance with our engagement,
we have not performed a financial statement audit, we cannot
express an audit opinion.
Based on our review, no matters have come to our attention
that cause us to presume that the Condensed Consolidated
Interim Financial Statements have not been prepared, in all
material respects, in accordance with the IFRS applicable to
interim financial reporting as adopted by the EU nor that the
Interim Group Management Report has not been prepared,
in all material respects, in accordance with the provisions of
the German Securities Trading Act applicable to interim
group management reports.
Düsseldorf, May 10, 2010
PricewaterhouseCoopers
Aktiengesellschaft
Wirtschaftsprüfungsgesellschaft
Dr. Norbert Vogelpoth Dr. Norbert Schwieters
Wirtschaftsprüfer Wirtschaftsprüfer
(German Public Auditor) (German Public Auditor)

29
Interim Report I/2010
Condensed Consolidated Interim Financial Statements
January 1–March 31€ in millions Notes 2010 2009
Sales including electricity and energy taxes 26,868 26,569
Electricity and energy taxes -641 -634
Sales (13) 26,227 25,935
Changes in inventories (finished goods and work in progress) 15 15
Own work capitalized 97 76
Other operating income 5,245 6,751
Cost of materials -19,961 -20,057
Personnel costs -1,354 -1,270
Depreciation, amortization and impairment charges (5) -1,818 -875
Other operating expenses -4,489 -6,569
Income/Loss (–) from companies accounted for under the equity method 181 270
Income/Loss (–) from continuing operations before financial results and income taxes 4,143 4,276
Financial results (7) -526 -770Income from equity investments 2 -145
Income from other securities, interest and similar income 124 167
Interest and similar expenses -652 -792
Income taxes -1,171 -883
Income/Loss (–) from continuing operations 2,446 2,623
Income/Loss (–) from discontinued operations, net (5) -1 -26
Net income 2,445 2,597
Attributable to shareholders of E.ON AG 2,278 2,457
Attributable to minority interests 167 140
in €
Earnings per share (attributable to shareholders of E.ON AG)—basic and diluted (8)
from continuing operations 1.20 1.30
from discontinued operations 0.00 -0.01
from net income 1.20 1.29
E.ON AG and Subsidiaries Consolidated Statements of Income
January 1–March 31€ in millions 2010 2009
Net income 2,445 2,597
Cash flow hedges 14 187Unrealized changes 74 76
Reclassification adjustments recognized in income -60 111
Available-for-sale securities -57 243Unrealized changes -13 255
Reclassification adjustments recognized in income -44 -12
Currency translation adjustments 858 -595Unrealized changes 858 -596
Reclassification adjustments recognized in income – 1
Changes in actuarial gains/losses of defined benefit pension plans and similar obligations -306 -277
Companies accounted for under the equity method 34 -1Unrealized changes 34 -1
Reclassification adjustments recognized in income – –
Income taxes 144 43
Total income and expenses recognized directly in equity 687 -400
Total recognized income and expenses (total comprehensive income) 3,132 2,197
Attributable to shareholders of E.ON AG 2,851 2,115
Attributable to minority interests 281 82
E.ON AG and Subsidiaries Consolidated Statements of Recognized Income and Expenses

30
Interim Report I/2010
Condensed Consolidated Interim Financial Statements
E.ON AG and Subsidiaries Consolidated Balance Sheets
€ in millions Notes Mar. 31, 2010 Dec. 31, 2009
Assets
Goodwill 16,299 16,901
Intangible assets 8,673 8,242
Property, plant and equipment 62,994 60,732
Companies accounted for under the equity method (9) 7,419 7,342
Other financial assets (9) 9,132 9,131Equity investments 5,385 5,461
Non-current securities 3,747 3,670
Financial receivables and other financial assets 2,991 2,652
Operating receivables and other operating assets 4,240 3,388
Income tax assets 1,561 1,549
Deferred tax assets 3,221 3,091
Non-current assets 116,530 113,028
Inventories 3,888 4,518
Financial receivables and other financial assets 1,817 1,729
Trade receivables and other operating assets 27,370 23,007
Income tax assets 2,665 1,925
Liquid funds 7,564 6,116Securities and fixed-term deposits 1,822 1,722
Restricted cash and cash equivalents 236 184
Cash and cash equivalents 5,506 4,210
Assets held for sale (5) – 2,273
Current assets 43,304 39,568
Total assets 159,834 152,596
Equity and Liabilities
Capital stock 2,001 2,001
Additional paid-in capital 13,747 13,747
Retained earnings 28,560 26,594
Accumulated other comprehensive income 2,312 1,552
Treasury shares (10) -3,530 -3,530
Equity attributable to shareholders of E.ON AG 43,090 40,364
Minority interests (before reclassification) 4,521 4,157
Reclassification related to put options -547 -550
Minority interests 3,974 3,607
Equity 47,064 43,971
Financial liabilities 30,850 30,657
Operating liabilities 8,567 7,773
Income taxes 2,867 3,124
Provisions for pensions and similar obligations (12) 3,250 2,884
Miscellaneous provisions 19,229 18,808
Deferred tax liabilities 8,349 7,526
Non-current liabilities 73,112 70,772
Financial liabilities 7,056 7,120
Trade payables and other operating liabilities 24,908 23,099
Income taxes 2,732 1,643
Miscellaneous provisions 4,962 4,715
Liabilities associated with assets held for sale (5) – 1,276
Current liabilities 39,658 37,853
Total equity and liabilities 159,834 152,596

31
Interim Report I/2010
E.ON AG and Subsidiaries Consolidated Statements of Cash Flows
January 1–March 31€ in millions 2010 2009
Net income 2,445 2,597
Income from discontinued operations, net 1 26
Depreciation, amortization and impairment of intangible assets and of property, plant and equipment 1,818 875
Changes in provisions 383 319
Changes in deferred taxes 601 362
Other non-cash income and expenses -423 120
Gain/Loss on disposal of intangible assets and property, plant and equipment, equity investments and securities (>3 months) -714 -33
Changes in operating assets and liabilities and in income taxes -989 -1,380
Cash provided by operating activities of continuing operations (operating cash flow) 3,122 2,886
Proceeds from disposal of 1,034 31Intangible assets and property, plant and equipment 31 25
Equity investments 1,003 6
Purchase of investments in -1,755 -1,896Intangible assets and property, plant and equipment -1,715 -1,828
Equity investments -40 -68
Changes in securities and fixed-term deposits -171 -365
Changes in restricted cash and cash equivalents -58 232
Cash used for investing activities of continuing operations -950 -1,998
Payments received/made from changes in capital -354 -2
Payments for treasury shares, net – –
Cash dividends paid to shareholders of E.ON AG – –
Cash dividends paid to minority shareholders -60 -58
Changes of financial liabilities -484 1,952
Cash provided by (used for) financing activities of continuing operations -898 1,892
Net increase/decrease in cash and cash equivalents from continuing operations 1,274 2,780
Cash provided by operating activities of discontinued operations – 5
Cash used for investing activities of discontinued operations – -5
Cash provided by financing activities of discontinued operations – –
Net increase in cash and cash equivalents from discontinued operations 0 0
Effect of foreign exchange rates on cash and cash equivalents 22 -7
Cash and cash equivalents at the beginning of the year 4,210 3,671
Cash and cash equivalents of continuing operations at the end of the quarter 5,506 6,444

32
Interim Report I/2010
Condensed Consolidated Interim Financial Statements
Statement of Changes in Equity
€ in millions Capital stockAdditional
paid-in capitalRetained earnings
Accumulated other comprehensive income
Currency translation
adjustmentsAvailable-for-
sale securitiesCash flow
hedges
Balance as of January 1, 2009 2,001 13,741 22,181 -2,547 2,676 -19
Changes in scope of consolidation
Capital decrease
Dividends paid
Other changes
Share additions 7
Net additions/disposals from the reclassification related to put options
Total comprehensive income 2,226 -381 255 15Net income 2,457
Changes in actuarial gains/
losses of defined benefit
pension plans and similar
obligations -231
Other comprehensive income -381 255 15
Balance as of March 31, 2009 2,001 13,741 24,414 -2,928 2,931 -4
Balance as of January 1, 2010 2,001 13,747 26,594 -2,005 3,511 46
Changes in scope of consolidation
Capital increase
Capital decrease
Dividends paid
Share additions -125
Net additions/disposals from the reclassification related to put options
Total comprehensive income 2,091 823 -72 9Net income 2,278
Changes in actuarial gains/
losses of defined benefit
pension plans and similar
obligations -187
Other comprehensive income 823 -72 9
Balance as of March 31, 2010 2,001 13,747 28,560 -1,182 3,439 55

33
Interim Report I/2010
Treasury shares
Equity attributable
to shareholders of E.ON AG
Minority interests (before reclassification)
Reclassification related to
put options Minority interests Total
-3,549 34,484 4,538 -578 3,960 38,444
4 4 4
-10 -10 -10
-29 -29 -29
1 1 1
7 7
11 11 11
2,115 82 82 2,197 2,457 140 140 2,597
-231 10 10 -221
-111 -68 -68 -179
-3,549 36,606 4,586 -567 4,019 40,625
-3,530 40,364 4,157 -550 3,607 43,971
115 115 115
15 15 15
-3 -3 -3
-40 -40 -40
-125 -4 -4 -129
3 3 3
2,851 281 281 3,132 2,278 167 167 2,445
-187 -11 -11 -198
760 125 125 885
-3,530 43,090 4,521 -547 3,974 47,064

34
Interim Report I/2010
Notes to the Condensed Consolidated Interim Financial Statements
(1) Basis of Presentation
Based in Germany, the E.ON Group (“E.ON” or the “Group”) is
an international group of companies with integrated electricity
and gas operations. The E.ON Group’s reportable segments are
presented in line with the Group’s internal organizational and
reporting structure, as defined by International Financial
Reporting Standard (“IFRS”) 8, “Operating Segments” (“IFRS 8”):
• The Central Europe market unit, led by E.ON Energie AG
(“E.ON Energie”), Munich, Germany, operates E.ON’s
electricity business and the downstream gas business in
Central Europe.
• Pan-European Gas is responsible for the upstream and
midstream gas business. This market unit additionally
holds interests predominantly in energy businesses in
Europe outside of Germany. It is led by E.ON Ruhrgas AG
(“E.ON Ruhrgas”), Essen, Germany.
• The U.K. market unit encompasses the energy business
in the United Kingdom. This market unit is led by
E.ON UK plc (“E.ON UK”), Coventry, U.K.
• The Nordic market unit, which is led by the integrated
energy company E.ON Sverige AB (“E.ON Sverige”), Malmö,
Sweden, is concentrated on the energy business in
Northern Europe.
• The U.S. Midwest market unit, led by E.ON U.S. LLC
(“E.ON U.S.”), Louisville, Kentucky, USA, is primarily active
in the regulated energy market in the U.S. state of Kentucky.
• The Energy Trading market unit, led by E.ON Energy
Trading SE (“E.ON Energy Trading”), Düsseldorf, Germany,
holds the E.ON Group’s European trading activities for
electricity, gas, coal, oil, and CO2 allowances.
• All of the remaining operating segments have been com-
bined in accordance with IFRS 8, and are reported as the
“New Markets” segment. New Markets contains the activi-
ties of the Climate & Renewables, Italy, and Russia market
units, as well as the Spain market unit.
Furthermore, Corporate Center/Consolidation contains E.ON AG
itself (“E.ON” or the “Company”), the interests held directly by
E.ON AG, as well as the consolidation effects that take place
at Group level. Note 13 provides additional information about
the segments.
(2) Summary of Significant Accounting Policies
The Interim Report for the three months ended March 31, 2010,
has been prepared in accordance with all IFRS and Interna-
tional Financial Reporting Interpretations Committee (“IFRIC”)
interpretations effective and adopted for use in the European
Union (“EU”).
With the exception of the new regulations described in Note 3,
this Interim Report was prepared using the accounting, valu-
ation and consolidation policies used in the Consolidated
Financial Statements for the 2009 fiscal year. In addition, income
tax expense for the interim period is recognized based on the
effective tax rate expected for the full fiscal year in accordance
with IAS 34, “Interim Financial Reporting” (“IAS 34”). Taxes
relating to certain special items are reflected in the quarter
in which they occur.
This Interim Report prepared in accordance with IAS 34 is con-
densed compared with the scope applied to the Consolidated
Financial Statements for the full year. For further information,
including information about E.ON’s risk management system,
please refer to E.ON’s Consolidated Financial Statements for
the year ended December 31, 2009, which provide the basis for
this Interim Report.
(3) Newly Adopted Standards and Interpretations
IFRS 3, “Business Combinations”In January 2008, the IASB issued a revised version of IFRS 3
as part of its “Business Combinations II” project. The most
significant changes from the previous version relate to the
recognition and measurement of assets and liabilities acquired
through a business combination, the measurement of non-
controlling interests, as well as to the calculation of goodwill
and the presentation of transactions with variable purchase
prices. The revised standard is to be applied for transactions
taking place in fiscal years beginning on or after July 1, 2009.
The standard has been transferred by the EU into European
law. Given the option in the standard concerning the deter-
mination of goodwill, which may be exercised on an individual
basis, E.ON is unable to make a general statement at this time
on the future impact of IFRS 3 on its Consolidated Financial
Statements.
IAS 27, “Consolidated and Separate Financial Statements”As part of the same “Business Combinations II” project, the
IASB also issued a revised version of IAS 27, “Consolidated and
Separate Financial Statements” (“IAS 27”), which contains
guidance on consolidation, in January 2008. In particular, this
standard for the first time deals with transactions in which
shares in a company (subsidiary) are bought or sold without
resulting in a change of control. Additional significant changes
from the previous version relate in particular to the recognition
and measurement of the remaining investment in an entity

35
Interim Report I/2010
(4) Scope of Consolidation
The number of consolidated companies changed as follows
during the reporting period:
As of March 31, 2010, 123 companies were accounted for
under the equity method (December 31, 2009: 131).
Scope of Consolidation
Domestic Foreign Total
Consolidated companies as of December 31, 2009 145 441 586
Additions 5 16 21
Disposals/Mergers 5 20 25
Consolidated companies
as of March 31, 2010 145 437 582
after a loss of control of what had been a subsidiary, and to
the recognition of losses attributable to minority interests.
The amendments have been transferred into European law
and their application is mandatory for fiscal years beginning
on or after July 1, 2009. The amendments to IAS 27 may have
transaction-related effects on the E.ON Consolidated Financial
Statements that cannot be estimated at this time.
IFRIC 12, “Service Concession Arrangements”IFRIC 12, “Service Concession Arrangements” (“IFRIC 12”),
was published in November 2006. The interpretation governs
accounting for arrangements in which a public-sector insti tution
grants contracts to private companies for the performance
of public services. In performing these services, the private
company uses infrastructure that remains under the control
of the public-sector institution. The private company is respon-
sible for the construction, operation, and maintenance of the
infrastructure. The interpretation has been transferred by the
EU into European law and its application is thus mandatory for
fiscal years beginning on or after March 29, 2009. The transi-
tional provisions additionally require retrospective application
to transactions that took place on or after July 1, 2009. In that
context, E.ON has made corresponding, minor reclassifications
in the prior-year values.
IFRIC 18, “Transfers of Assets from Customers”IFRIC 18, “Transfers of Assets from Customers” (“IFRIC 18”),
was published in January 2009. IFRIC 18 applies in cases where
an entity receives from its customers a non-cash asset, or
the funds necessary for the production or acquisition of a
non-cash asset, in order to then provide those customers with
access to a network, a service or the delivery of goods. The
interpretation has been transferred by the EU into European
law and its application is thus mandatory, at the latest, for fiscal
years beginning after October 31, 2009. There was no material
impact on E.ON’s Consolidated Financial Statements.
All of the other standards and interpretations whose applica-
tion was mandatory for fiscal years beginning on or after
January 1, 2010, also have no material impact on E.ON’s Con-
solidated Financial Statements.

36
Interim Report I/2010
(5) Acquisitions, Disposals and Discontinued
Operations
Disposal Groups and Assets Held for Sale in 2010
U.S. Midwest At the end of April 2010, E.ON and Pennsylvania Power & Light
Corporation (“PPL”), Allentown, Pennsylvania, U.S., signed
agreements on the sale of the power and gas business in the
United States, bundled in the U.S. Midwest market unit. The
agreed purchase price for the equity and for the assumption
of certain liabilities is approximately €5.7 billion. The increased
probability of the intended sale taking place necessitated a
reexamination of the measurement assumptions and the actual
measurement of the U.S. businesses, taking into account the
expected proceeds on disposal. The result of this examination,
taken together with the purchase price actually agreed,
resulted in goodwill impairment of approximately €0.9 billion,
which already had to be recognized in the first quarter of 2010.
The U.S. Midwest market unit is being classified as a discon-
tinued operation from April only, because the criteria for
such classification were not met until the disposal process
took greater shape in April 2010. The agreed transaction is
expected to close by the end of 2010.
As of March 31, 2010, significant assets and liabilities of the
U.S. Midwest market unit contained in the consolidated balance
sheet included property, plant and equipment (€5.4 billion),
goodwill (€0.7 billion, after impairment) and operating receiv-
ables (€0.3 billion), along with financial liabilities to non-Group
third parties (€0.6 billion), pension obligations (€0.4 billion)
and operating liabilities (€0.4 billion). The market unit contrib-
uted approximately €0.1 billion to consolidated net income
in the first quarter of 2010.
Agreement with the European CommissionIn December 2008, E.ON’s commitment to the European
Commission to sell a variety of generating capacity and the
ultrahigh-voltage network in Germany took effect. The total of
approximately 5 GW in capacity to be sold, including associated
assets and liabilities, has been presented as a disposal group
since the end of 2008. The net carrying amounts of the disposal
group related exclusively to the Central Europe market unit
and initially amounted to approximately €0.4 billion. The dis-
posal of significant portions of the capacity to be sold took place
in several transactions during 2009. The first quarter of 2010
saw the closing of the contract with Stadtwerke Hannover AG,
Hanover, Germany, on the sale of a further 0.3 GW in capacity
with a gain on disposal of approximately €0.2 billion. The
disposal of the remaining 0.3 GW of generating capacity closed
in April 2010.
In November 2009, an agreement was reached with TenneT
B.V., Arnhem, The Netherlands, on the disposal of the German
ultrahigh-voltage network. The ultrahigh-voltage network
was therefore reclassified as a disposal group in the fourth
quarter of 2009 with a net carrying amount of approximately
€0.8 billion. Significant assets and liabilities included property,
plant and equipment and current assets in the amount of
€1.0 billion and €0.7 billion, respectively, along with liabilities
and deferred taxes in the amount of €0.9 billion and €0.2 billion,
respectively. The agreed transaction closed at the end of Feb-
ruary 2010. The gain on disposal was €0.1 billion.
The commitment to the European Commission was thus ful-
filled in its entirety in April 2010.
Notes to the Condensed Consolidated Interim Financial Statements

37
Interim Report I/2010
development license. This interest is accounted for as an
associated company, using the equity method, and carried at a
prorated acquisition cost of €0.2 billion. There were no signifi-
cant effects based on the preliminary purchase price allocation
for this acquisition. The gas attributable to E.ON’s interest is
marketed through the project company ZAO Gazprom YRGM
Development, Salekhard, Russian Federation, whose earnings
are attributable to E.ON in the form of preferred stock. Given
that the significant risks and rewards of ownership have been
transferred, this company had to be consolidated in full within
the E.ON Group since October 2009.
The following data refer to ZAO Gazprom YRGM Development:
Significant assets in the purchase price allocation include
favorable gas supply contracts, which account for the majority
of the difference. Non-current liabilities consist exclusively of
deferred taxes. The remaining difference at the project com-
pany, recognized as preliminary goodwill, is €138 million. The
purchase price allocation is preliminary as of March 31, 2010,
because the final evaluation of certain details remains
outstanding.
Major Balance Sheet Line Items—ZAO Gazprom YRGM Development
€ in millions
Carrying amounts before initial
recognitionPurchase price
allocation
Carrying amounts at initial
recognition
Intangible assets – 2,564 2,564
Other assets 1 4 5
Total assets 1 2,568 2,569
Non-current liabilities – 513 513
Total liabilities 0 513 513
Net assets 1 2,055 2,056
Attributable to shareholders of E.ON AG – 2,055 0
Attributable to minority interests 1 – 1
Acquisition cost 2,193
Remaining goodwill (preliminary) 138 138
Acquisitions in 2009
Yuzhno-RusskoyeIn October 2008, E.ON and OAO Gazprom (“Gazprom”), Mos-
cow, Russian Federation, reached an understanding on E.ON
acquiring an interest in the Yuzhno-Russkoye gas field in
Siberia. As consideration for this ownership stake, E.ON deliv-
ered to Gazprom the Gazprom shares indirectly held by E.ON,
which represent 2.93 percent of the equity of Gazprom and
are valued at €2.3 billion, along with a small cash component.
The interest in the gas field was purchased by acquiring
25 percent minus three of the shares of OAO Sever nefte-
gazprom, Krasnoselkup, Russian Federation, which holds the

38
Interim Report I/2010
Notes to the Condensed Consolidated Interim Financial Statements
Langerlo-Vilvoorde NVIn the course of implementing E.ON’s commitment to the
European Commission to dispose of a variety of generating
capacity in Germany, an agreement was made with Electra-
bel SA/NV (“Electrabel”), Brussels, Belgium, on the economic
exchange of a variety of power plant units and electricity
supplies in Germany and Belgium.
In this context, E.ON acquired all of the shares of a power plant
unit in Belgium, Langerlo-Vilvoorde NV, Vilvoorde, Belgium.
The unit operates coal- and gas-fired power plants at the
Langerlo and Vilvoorde locations. The acquisition of this unit
closed at the beginning of November 2009 in exchange for
the power plant units delivered to Electrabel. A small remainder
not covered by the transferred assets was settled by E.ON
in cash.
Carrying amounts before initial consolidation are generally
determined on the basis of IFRS. Reconciliation adjustments
to the accounting policies applied in the E.ON Group are
presented together with the adjustments from the purchase
price allocation.
The purchase price allocation is preliminary as of March 31, 2010,
because investigations relating to the property, plant and equip-
ment, as well as evaluations of legal issues, remain outstanding.
Major Balance Sheet Line Items—Langerlo-Vilvoorde NV
€ in millions
Carrying amounts before initial
recognitionPurchase price
allocation
Carrying amounts at initial
recognition
Intangible assets – 11 11
Property, plant and equipment 512 -71 441
Other assets 17 55 72
Total assets 529 -5 524
Non-current liabilities 16 – 16
Current liabilities 25 53 78
Total liabilities 41 53 94
Net assets 488 -58 430
Goodwill (preliminary) 40 40

39
Interim Report I/2010
(6) Research and Development Costs
The E.ON Group’s research and development costs amounted
to €12 million in the first quarter of 2010 (first quarter of 2009:
€6 million).
Discontinued Operations in 2009
WKEThrough Western Kentucky Energy Corp. (“WKE”), Henderson,
Kentucky, U.S., E.ON U.S. had a 25-year lease on and operated
the generating facilities of Big Rivers Electric Corporation
(“BREC”), a power-generation cooperative in western Kentucky,
and a coal-fired generating facility owned by the City of
Henderson, Kentucky, U.S.
In March 2007, E.ON U.S. and BREC signed an agreement to
terminate the lease and the operating agreements.
The agreed termination closed in July 2009. The agreement
involved offsetting payments amounting to approximately
€0.5 billion. Subsequent effects from the settlement of existing
contractual relationships that will be recognized in income
and cash flows are expected to continue to occur through the
end of 2010. These effects will continue to be reported within
the U.S. Midwest market unit under income/loss from discon-
tinued operations. The table below provides selected financial
information.
Selected Financial Information—WKE (Summary)
January 1–March 31€ in millions 2010 2009
Sales – 47
Other income/expenses, net -2 -89
Loss from continuing operations before
income taxes and minority interests -2 -42
Income tax benefit 1 16
Loss from discontinued operations -1 -26
Disposal Groups and Assets Held for Sale in 2009
Endesa Europa/ViesgoAs part of the acquisition of the Endesa Europa/Viesgo activities,
an agreement was reached with A2A S.p.A. (“A2A”), Milan,
Italy, the minority shareholder of E.ON Produzione S.p.A. (“E.ON
Produzione”), Sassari, Italy, to acquire the minority interest
primarily in return for company-owned generating capacity
of the Italy market unit valued at approximately €1.4 billion.
The disposal group was reported in the New Markets segment.
The agreed transaction closed in July 2009. Accordingly, the
assets and liabilities in question were sold in the third quar-
ter of 2009.
Interest in OAO GazpromIn October 2008, E.ON and Gazprom reached an understanding
on E.ON acquiring an interest in the Yuzhno-Russkoye gas
field in Siberia. As consideration for this ownership stake,
Gazprom received the Gazprom shares indirectly held by E.ON,
representing approximately one-half of the approximately
6 percent of the equity of Gazprom held by E.ON. The shares
were reported as assets held for sale since October 2008.
The relevant contracts were closed in October 2009. Upon dis-
posal of the interest, fair-value adjustments accumulated in
other comprehensive income were realized in income, which
resulted in a book gain of €1.8 billion.

40
Interim Report I/2010
Notes to the Condensed Consolidated Interim Financial Statements
(8) Earnings per Share
The computation of earnings per share (“EPS”) for the periods
indicated is shown below:
The computation of diluted EPS is identical to basic EPS, as
E.ON AG has not issued any potentially dilutive common stock.
Note 10 provides additional information.
January 1–March 31€ in millions 2010 2009
Income/Loss (–) from continuing operations 2,446 2,623
less: Minority interests -167 -140
Income/Loss (–) from continuing operations (attributable to shareholders of E.ON AG) 2,279 2,483
Income/Loss (–) from discontinued operations, net (attributable to shareholders of E.ON AG) -1 -26
Net income attributable to shareholders of E.ON AG 2,278 2,457
in €
Earnings per share (attributable to shareholders of E.ON AG)
from continuing operations 1.20 1.30
from discontinued operations 0.00 -0.01
from net income 1.20 1.29
Weighted-average number of shares outstanding (in millions) 1,905 1,905
Earnings per Share
(7) Financial Results
The following table provides details of financial results for the
periods indicated:
January 1–March 31€ in millions 2010 2009
Income from companies in which equity investments are held 12 11
Impairment charges/reversals on other financial assets -10 -156
Income from equity investments 2 -145
Income from securities, interest and similar income 124 167
Interest and similar expenses -652 -792
Interest and similar expenses (net) -528 -625
Financial results -526 -770
Financial Results
Price stabilization in the financial markets in the first quarter
of 2010 led to a marked reduction from the first quarter of 2009
of the impairments recognized on other financial assets to
a total of €12 million (first quarter of 2009: €156 million in
impairment charges).

41
Interim Report I/2010
(11) Dividends Paid
At the Annual Shareholders Meeting on May 6, 2010, the
shareholders voted to distribute a dividend of €1.50 for each
dividend-paying ordinary share, unchanged from the previous
dividend. The total dividend payout was €2,858 million.
(12) Provisions for Pensions and Similar Obligations
Provisions for pensions and similar obligations increased
compared with year-end 2009 primarily due to net actuarial
losses resulting mainly from lower discount rates.
The funded status, which is equal to the difference between
the present value of the defined benefit obligation and the
fair value of plan assets, is reconciled with the amounts
recognized in the Consolidated Balance Sheets as shown in
the following table:
Taking into account the periodic additions and pension pay-
ments in the present value of all defined benefit obligations
and in the plan assets, the funded status has increased by
comparison with year-end 2009 primarily due to net actuarial
losses. The actuarial losses resulting from lower discount
rates were partially offset by actuarial gains in the plan assets.
Discount Rate
PercentagesMar. 31,
2010Dec. 31,
2009
Germany 5.25 5.50
U.K. 5.60 5.70
U.S. 6.05 6.10
Net Amount Recognized
€ in millionsMar. 31,
2010Dec. 31,
2009
Present value of all defined benefit obligations 16,756 16,087
Fair value of plan assets -13,504 -13,205
Funded status 3,252 2,882
Unrecognized past service cost -10 -10
Net amount recognized 3,242 2,872
Thereof presented as operating
receivables -8 -12
Thereof presented as provisions for
pensions and similar obligations 3,250 2,884
(10) Treasury Shares
Pursuant to a resolution from the Annual Shareholders
Meeting of May 6, 2010, the Company is authorized to purchase
own shares until May 5, 2015. The shares purchased, combined
with other treasury shares in the possession of the Company,
or attributable to the Company pursuant to Sections 71a
et seq. AktG, may at no time exceed 10 percent of its capital
stock. The Board of Management was authorized at the afore-
mentioned Annual Shareholders Meeting to cancel treasury
shares without requiring a separate shareholder resolution
for the cancellation or its implementation. The total number
of outstanding shares as of March 31, 2010, was 1,905,456,817
(December 31, 2009: 1,905,456,817).
As of March 31, 2010, E.ON AG and one of its subsidiaries held
a total of 95,543,183 treasury shares (December 31, 2009:
95,543,183) having a consolidated book value of €3,530 million
(equivalent to 4.77 percent or €95,543,183 of the capital stock).
(9) Companies Accounted for under the Equity
Method and Other Financial Assets
The following table shows the structure of financial assets:
€ in millionsMar. 31,
2010Dec. 31,
2009
Companies accounted for under the equity method 7,419 7,342
Equity investments 5,385 5,461
Non-current securities 3,747 3,670
Total 16,551 16,473
Companies Accounted for under the Equity Method and Other Financial Assets

42
Interim Report I/2010
Notes to the Condensed Consolidated Interim Financial Statements
The net periodic pension cost for defined benefit plans
breaks down as follows:
January 1–March 31€ in millions 2010 2009
Employer service cost 62 48
Interest cost 222 211
Expected return on plan assets -177 -149
Past service cost 2 3
Total 109 113
Net Periodic Pension Cost for Defined Benefit Plans
Financial Information by Business Segment
January 1–March 31€ in millions
Central Europe Pan-European Gas U.K.
2010 2009 2010 2009 2010 2009
External sales 9,760 10,080 4,551 6,463 2,618 2,566
Intersegment sales 2,183 2,199 1,718 2,097 510 648
Sales 11,943 12,279 6,269 8,560 3,128 3,214
Adjusted EBITDA 2,030 2,021 841 926 545 188
Depreciation and amortization -382 -369 -128 -100 -112 -113
Impairments (–)/Reversals (+)1 -10 -1 – -2 – –
Adjusted EBIT 1,638 1,651 713 824 433 75
Earnings from companies accounted for under the equity method1 64 67 114 194 -6 7
Cash provided by operating activities 1,297 1,045 1,131 1,224 184 19
Investments 731 553 190 309 196 174Intangible assets and property, plant and equipment 711 507 185 301 196 174
Equity investments2 20 46 5 8 – –
1Impairments recognized in adjusted EBIT differ from the relevant amounts reported in accordance with IFRS due to impairments on companies accounted for under the equity method and impairments on other financial assets, and also due to impairments recognized in non-operating earnings. Under IFRS, impairments on companies accounted for under the equity method and impairments on other financial assets are included in income/loss (–) from companies accounted for under the equity method and financial results, respectively. In 2010, the differences resulted primarily from goodwill impairment charges, which are reported in non-operating earnings.
2In addition to those accounted for under the equity method, acquisitions of equity investments also include acquisitions of fully consolidated companies and investments in equity holdings that need not be consolidated. Acquisitions of equity investments are reported in the segment to which the acquiring entity is assigned.
(13) Segment Information
The segment information of the E.ON Group is presented in
line with the Company’s internal organizational and reporting
structure.
• The Central Europe market unit focuses on E.ON’s elec-
tricity business and the downstream gas business in
Central Europe.
• Pan-European Gas is responsible for the upstream and
midstream gas business. This market unit additionally
holds interests predominantly in energy businesses in
Europe outside of Germany.
• The U.K. market unit encompasses the energy business in
the United Kingdom.
• The Nordic market unit is concentrated on the energy
business in Northern Europe.
• The U.S. Midwest market unit is primarily active in the
regulated energy market in the U.S. state of Kentucky.
• Energy Trading combines E.ON’s European trading activi-
ties for electricity, gas, coal, oil and CO2 allowances.
• All of the remaining operating segments have been com-
bined in accordance with IFRS 8, and are reported as
the “New Markets” segment. New Markets contains the
activities of the Climate & Renewables, Italy, and Russia
market units, as well as the Spain market unit.

43
Interim Report I/2010
Nordic U.S. Midwest Energy Trading New MarketsCorporate Center/
Consolidation E.ON Group
2010 2009 2010 2009 2010 2009 2010 2009 2010 2009 2010 2009
1,002 734 543 586 6,227 3,794 1,518 1,683 8 29 26,227 25,935
334 281 – – 6,673 11,762 153 483 -11,571 -17,470 – –
1,336 1,015 543 586 12,900 15,556 1,671 2,166 -11,563 -17,441 26,227 25,935
326 294 171 177 350 109 407 309 -13 -51 4,657 3,973
-92 -71 -42 -44 -2 -2 -161 -150 -17 -22 -936 -871
– – – – – – – – -2 1 -12 -2
234 223 129 133 348 107 246 159 -32 -72 3,709 3,100
6 1 – 1 – – 6 2 – -2 184 270
210 33 104 133 877 620 93 216 -774 -404 3,122 2,886
138 175 77 139 2 1 412 505 9 40 1,755 1,896 136 173 77 139 2 1 386 501 22 32 1,715 1,828
2 2 – – – – 26 4 -13 8 40 68
Corporate Center/Consolidation contains E.ON AG itself, the
interests held directly by E.ON AG, as well as the consolidation
effects that take place at Group level.
Under IFRS, segments or material business units that have
been sold or are held for sale must be reported as discontinued
operations. For the first quarter of 2010 and the 2009 fiscal
year, this concerns WKE. The corresponding earnings and cash
flow figures as of March 31, 2010, as well as those for the
preceding periods, have been adjusted for all components of
the discontinued operations (see explanations in Note 5).

44
Interim Report I/2010
Notes to the Condensed Consolidated Interim Financial Statements
Adjusted EBIT is the key measure at E.ON for purposes of
internal management control and as an indicator of a business’s
long-term earnings power. Adjusted EBIT is derived from
income/loss before interest and taxes and adjusted to exclude
certain special items. The adjustments include adjusted net
interest income, net book gains, cost-management and
restructuring expenses, goodwill impairments, as well as other
non-operating income and expenses.
Adjusted net interest income is calculated by taking the net
interest income shown in the income statement and adjusting
it using economic criteria and excluding certain special items,
i.e., the portions of interest expense that are non-operating.
Net book gains are equal to the sum of book gains and losses
from disposals, which are included in other operating income and
other operating expenses. Cost-management and restructuring
expenses are non-recurring in nature. Other non-oper ating
earnings encompass other non-operating income and expenses
that are unique or rare in nature. Depending on the case, such
income and expenses may affect different line items in the
income statement. For example, effects from the marking to
market of derivatives are included in other operating income
and expenses, while impairment charges on property, plant
and equipment are included in depreciation, amortization and
impairments. Due to the adjustments, the key figures by seg-
ment may differ from the corresponding IFRS figures reported
in the Consolidated Financial Statements.
The following table shows the reconciliation of adjusted EBIT
to net income as reported in the IFRS Consolidated Financial
Statements:
Other non-operating earnings include the goodwill impairment
of €0.9 billion recognized at the U.S. Midwest market unit.
Page 18 of the Interim Group Management Report provides a
more detailed explanation of the reconciliation of adjusted
EBIT to net income.
Net Income
January 1–March 31€ in millions 2010 2009
Adjusted EBIT 3,709 3,100
Adjusted interest income (net) -555 -606
Net book gains/losses 666 -10
Restructuring/Cost management expenses -127 -86
Other non-operating earnings -76 1,108
Income/Loss (–) from continuing
operations before taxes 3,617 3,506
Income taxes -1,171 -883
Income/Loss (–) from continuing
operations 2,446 2,623
Income/Loss (–) from discontinued operations, net -1 -26
Net income 2,445 2,597
Attributable to shareholders of E.ON AG 2,278 2,457
Attributable to minority interests 167 140
Dänzer-Vanotti SchenckFeldmann
Teyssen

Financial Calendar
August 11, 2010November 10, 2010
March 9, 2011May 5, 2011May 6, 2011
May 11, 2011August 10, 2011
November 9, 2011
Interim Report: January – June 2010Interim Report: January – September 2010
Release of 2010 Annual Report2011 Annual Shareholders MeetingDividend PayoutInterim Report: January – March 2011Interim Report: January – June 2011Interim Report: January – September 2011
E.ON AG
E.ON-Platz 1
40479 Düsseldorf
Germany
T +49 211-4579-0
F +49 211-4579-501
www.eon.com
Media Relations
T +49 211-4579-453
Investor Relations
T +49 211-4579-549
Creditor Relations
T +49 211-4579-563
Only the German version of this Interim Report is legally binding.
Further information
This Interim Report may contain forward-looking statements based on current assumptions and forecasts made by E.ON Group
management and other information currently available to E.ON. Various known and unknown risks, uncertainties, and other
factors could lead to material differences between the actual future results, financial situation, development, or performance
of the company and the estimates given here. E.ON AG does not intend, and does not assume any liability whatsoever, to
update these forward-looking statements or to conform them to future events or developments.
