annual report 2018 - e.on · report of the supervisory board e.on stock strategy and objectives...
TRANSCRIPT
Annual Report2018

E.ON Group Financial Highlights€ in millions 2018 2017 +/- %
Sales1 30,253 37,965 -20
Adjusted EBITDA1, 2 4,840 4,955 -2
– Regulated business 2,783 2,742 +1
– Quasi-regulated and long-term contracted business 895 828 +8
– Merchant business 1,162 1,385 -16
Adjusted EBIT1, 2 2,989 3,074 -3
– Regulated business 1,750 1,677 +4
– Quasi-regulated and long-term contracted business 494 486 +2
– Merchant business 745 911 -18
Net income/loss 3,524 4,180 -16
Net income/loss attributable to shareholders of E.ON SE 3,223 3,925 -18
Adjusted net income1, 2 1,505 1,427 +5
Investments1 3,523 3,308 +6
Cash provided by operating activities1 2,853 -2,952 –
Cash provided by operating activities before interest and taxes1 4,087 -2,235 –
Economic net debt (at year-end)1 16,580 19,248 -14
Debt factor3 3.4 3.9 -0.54
Equity 8,518 6,708 +27
Total assets 54,324 55,950 -3
ROCE (%)1 10.4 10.6 -0.25
Pretax cost of capital (%) 6.4 6.4 –
After-tax cost of capital (%) 4.7 4.7 –
Value added1 1,145 1,211 -5
Employees (at year-end)1 43,302 42,699 +1
– Percentage of female employees 32 32 –
– Percentage of female executives and senior managers 21.2 19.6 +1.65
– Average turnover rate (%) 4.8 4.6 +0.25
– Average age 42 42 –
– TRIF6 2.5 2.3 +9
Earnings per share7, 8 (€) 1.49 1.84 -19
Adjusted net income per share1, 7, 8 0.69 0.67 +3
Equity per share7, 9 (€) 2.66 1.85 +44
Dividend per share10 (€) 0.43 0.30 +43
Dividend payout 932 650 +43
Market capitalization9 (€ in billions) 18.7 19.6 -5
1Includes the discontinued operations in the Renewables segment (see Note 4 to the Consolidated Financial Statements).2Adjusted for non-operating effects (see Glossary).3Ratio of economic net debt and adjusted EBITDA.4Change in absolute terms.5Change in percentage points.6For E.ON employees; for a definition of TRIF, see the Employees chapter.7Attributable to shareholders of E.ON SE.8Based on shares outstanding (weighted average).9Based on shares outstanding at year-end.10For the respective financial year; the 2018 figure represents management’s dividend proposal.

CEO Letter
Report of the Supervisory Board
E.ON Stock
Strategy and Objectives
Combined Group Management Report
Combined Non-Financial Report
Consolidated Financial Statements
Further Information
4 CEO Letter6 Report of the Supervisory Board14 E.ON Stock18 Strategy and Objectives22 Combined Group Management Report22 Corporate Profile
22 Business Model
24 Management System
25 Innovation
26 Business Report
26 Macroeconomic and Industry Environment
29 Business Performance
29 Earnings Situation
34 Financial Situation
38 Asset Situation
39 E.ON SE’s Earnings, Financial, and Asset Situation
41 Other Financial and Non-Financial Performance Indicators
41 – ROCE and Value Added
43 – Employees
50 Forecast Report
52 Risk and Chances Report
60 Business Segments
68 Internal Control System for the Accounting Process
70 Disclosures Regarding Takeovers
73 Corporate Governance Report
73 Corporate Governance Declaration
82 Compensation Report
100 Separate Combined Non-Financial Report 114 Consolidated Financial Statements114 Consolidated Statements of Income
115 Consolidated Statements of Recognized Income and Expenses
116 Consolidated Balance Sheets
118 Consolidated Statements of Cash Flows
120 Statement of Changes in Equity
122 Notes
216 List of Shareholdings
232 Further Information232 Declaration of the Management
233 Independent Auditor’s Report
240 Independent Practitioner’s Report on Non-Financial Reporting
242 Members of the Supervisory Board
244 Members of the Management Board
245 Summary of Financial Highlights
246 Glossary of Financial Terms
253 Financial Calendar
Contents


CEO Letter
Report of the Supervisory Board
4
Dear Shareholders,
At our Annual Shareholders Meeting in May 2018, a large majority of you gave us
the green light to acquire innogy and thus to give your E.ON an even sharper profile
and even better growth prospects. We will be the energy company fully dedicated
to the new energy world in which climate protection and customer benefit go hand
in hand. For my Management Board colleagues and me, your trust confers an
obligation to resolutely bring the vision of the new E.ON to life.
About a year ago, E.ON and RWE reached an extensive asset-swap agreement
under which E.ON will acquire RWE’s 76.8-percent stake in innogy and, in turn,
transfer substantially all of our renewables business to RWE. Since then, we’ve
taken all the intermediate steps as planned. In June we made a voluntary public
takeover offer for the stock of innogy’s other shareholders, who tendered about
9.4 percent of the stock to us. We’re very satisfied with this result. The preparations
for the integration and the antitrust approvals process are also fully on track.
Filing the transaction with the European Commission in January marked another
milestone. We’re firmly convinced that the takeover of innogy raises no antitrust
issues overall and can be completed from mid-year onward. In addition, we’ve
already made a series of decisions about the new E.ON’s future organizational setup.
It’s clear, for example, that your company will continue to be called E.ON, have its
headquarters in Essen, and have a very customer-proximate setup. In addition,
we want to further enhance our innovativeness and to manage all of our network
companies as we already do E.ON’s. These early decisions will help us swiftly
conclude the transaction after the approval from Brussels. And we continue to
expect to realize all of the anticipated €600 to €800 million in synergies from
2022 onward. The planned integration measures will be carried out in a socially
responsible manner, in keeping with the tradition of the companies involved.
Going forward, the new E.ON will be Europe’s first company to focus exclusively
on smart grids and innovative customer solutions. We want to implement one of
the most creative transactions in German industrial history, to seize the growth
potential in the new energy world every more effectively, and thus to become even
more attractive for you, our shareholders.
We’re conceiving the new E.ON to be radically customer-led. Our customers—
municipalities, companies, and households—are the ones who will decide how
successful we’ll be in the new energy world. They determine which energy products
and services are important and to whom they entrust their energy project or the
management of their energy network. This viewpoint alone guides us. We’re deter-
mined to provide our customers with the best there is in the new digital energy
world. How far have we come in realizing this ambition?
E.ON is entering the new financial year and is approaching the next steps of the
innogy takeover with strong earnings and confidence. We delivered an outstanding
operating and financial performance for the third year in a row. As anticipated,
our 2018 adjusted EBIT of roughly €3 billion was slightly lower than in the prior
year and at the upper end of our forecast range. Adjusted net income of €1.5 billion
CEO Letter
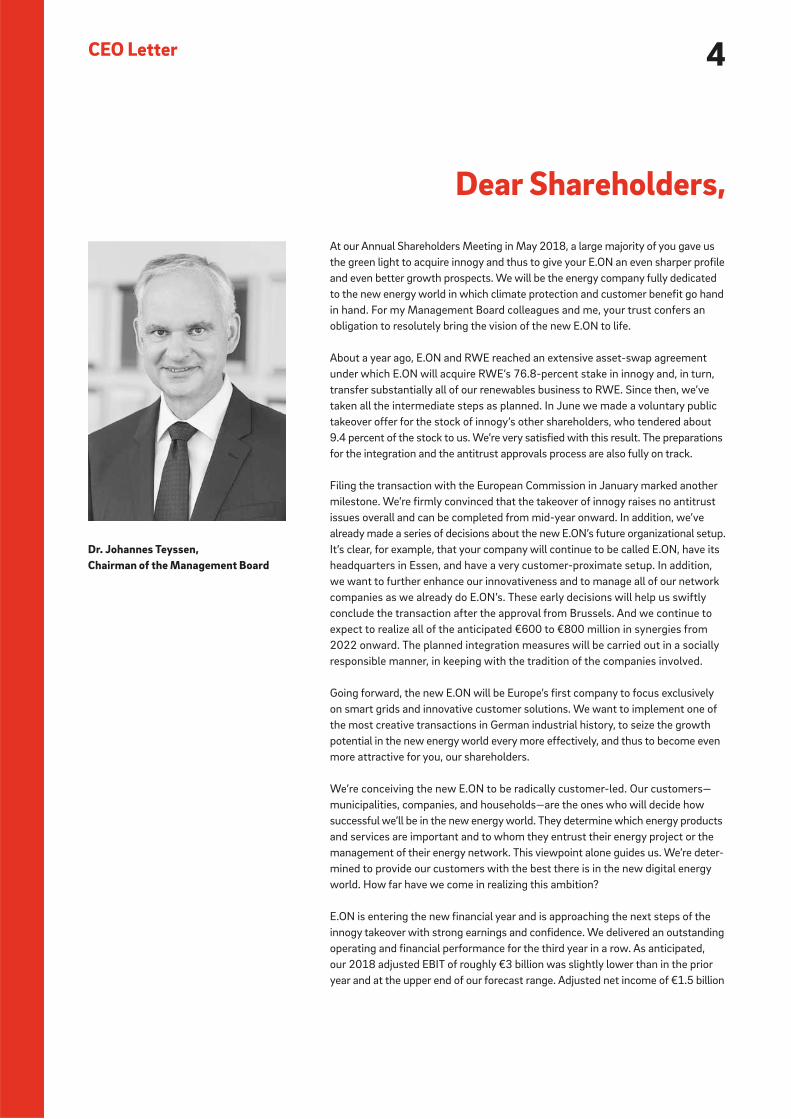
Dr. Johannes Teyssen, Chairman of the Management Board
5CEO Letter
Report of the Supervisory Board
E.ON Stock
Strategy and Objectives
Combined Group Management Report
Combined Non-Financial Report
Consolidated Financial Statements
Further Information
actually surpassed the prior-year figure and was likewise at the upper end
of our forecast range. What makes me particularly optimistic for the
future is that 2018 was again a strong year operationally: our earnings
were driven predominantly by the improvement of our business.
The Energy Networks segment is the undisputed mainstay of our earn-
ings, delivering stable earnings of €1.8 billion. In this regulated business,
efficiency is the decisive profitability driver. Consequently, I’m particularly
proud that the German Federal Network Agency’s most recent bench-
marking assigned all of our regional network companies a particularly high
efficiency factor of 100 percent. This again ranks them among the most
efficient of Germany’s nearly 900 electricity network operators. Two of
our network companies were awarded an additional efficiency bonus by
which they can increase their returns in the next regulation period. Through
expansions and upgrades, we’re already creating smart distribution grids
that actively promote the convergence of power, heat, and mobility. We’re
thus paving the way for today’s trend toward lower-carbon power gener-
ation to become the true energy transformation of tomorrow. This pre-
supposes, however, that policymakers in Berlin and Brussels finally make
the necessary decisions. Instead of a patchwork of climate- and energy-
policy regulations and subsidy scheme, the right approach is a carbon tax.
If this isn’t possible at the EU level, then individual countries will have
to take action. We’ll advocate this on our customers’ behalf because only
then will their efforts to modernize and decarbonize their energy systems
be worthwhile.
Our customers have long since embraced the objectives of the energy
transition. Increasingly, they’re opting for innovative, efficient, and dis-
tributed solutions. We provide them with the equipment, products, and
services. Although this business is fragmented and competition is tough,
we’re a partner of choice for municipalities and for commercial and
industrial customers. In 2018 we enlarged our customer base in nearly
all markets. Even in the highly competitive retail business we managed
to keep the overall number of customers stable and actually added about
100,000 customers on a net basis in Germany. This is doubtless partly
because we’ve significantly improved our service and because customer
satisfaction, which we measure regularly, again increased substantially.
Moreover, new strategic partnerships—like the one with Microsoft—are
further raising our profile in the new energy world.
Our Renewables segment delivered particularly strong earnings, even
though the wind yield was low. The significant 15-percent earnings
increase and our highly motivated employees demonstrate that E.ON has
an outstanding performance culture that we can be proud of. It’s this
performance culture that, across our business, makes us a little bit better
than many competitors and that gives me the certainty that we’ll actively
shape tomorrow’s energy world.
We want to continue our success story. For 2019,
we anticipate adjusted EBIT of €2.9 to €3.1 billion
and adjusted net income of €1.4 to €1.6 billion.
We want the positive development of our dividend
to continue as well. We’ll recommend to the Annual
Shareholders Meeting a fixed dividend of 43 cents
per share for the 2018 financial year. We intend
to propose a fixed dividend of 46 cents per share
for 2019 financial year. Our high proportion of
regulated businesses and our clear commitment to
a consistent dividend policy make E.ON a highly
attractive investment, particularly once again for
long-term, sustainability-oriented investors.
We’ve put ourselves into a solid starting position
so that we can be even better at seizing the oppor-
tunities of the green, distributed, and digital energy
world. Our ambition is and will remain to do the
best job possible of making the great opportunities
in the new energy world available to our customers
and to you, our shareholders. Something that’s
particularly important to my Management Board
colleagues and me, especially in the time ahead, is
that leadership and cultural adaptation are essential
for the integration of innogy to succeed and for
the new company to be more than the sum of its
parts. Success will depend on our willingness to
learn and actively shape change. I’m convinced that
E.ON will succeed in this task. I also sense that
innogy is willing to try something new. E.ON has
highly knowledgeable and dedicated employees
who work hard every day to enhance our company’s
performance and to propel its reorientation. And
we on the Management Board are convinced that
openness and diversity, mutual respect, and a
strong performance culture are the decisive factors
that will make the new E.ON even more customer-
oriented and successful. For our customers, for our
employees, and for you, our shareholders.
Best wishes,
Dr. Johannes Teyssen

6Report of the Supervisory Board
Dear Shareholders,
In 2018 E.ON again made German industrial history. The resolution adopted in
March to take over innogy will begin a new chapter in our company’s history.
In addition, E.ON also sold its remaining stake in Uniper SE and thus completed
its exit from conventional energy generation. The Supervisory Board would like
to thank the Management Board and all employees for their enormous efforts
connected with E.ON’s new strategic course.
In the 2018 financial year the Supervisory Board carefully performed all its duties
and obligations under law, the Company’s Articles of Association, and its own
policies and procedures. It thoroughly examined the Company’s situation and
devoted particular attention to its continually evolving energy-policy and economic
environment.
We advised the Management Board intensively about the Company’s manage-
ment and continually monitored the Management Board’s activities, assuring
ourselves that the Company’s management was legal, purposeful, and orderly.
We were directly involved in all business transactions of key importance to the
Company and discussed these transactions thoroughly based on the Management
Board’s reports. At the Supervisory Board’s six regular meetings, we addressed in
depth all issues relevant to the Company. In particular, we discussed the planned
takeover of innogy SE and the related asset swap with RWE, the closing of the sale
of the Company’s remaining Uniper stake, the refinement of its corporate strategy,
and the E.ON Group’s medium-term plan for 2019–2021. Two Supervisory Board
members were unable to attend Supervisory Board meetings in 2018. Apart from
that, all members attended all meetings. A table showing attendance by member
is on page 76 of this report.
The Management Board regularly provided us with timely and comprehensive
information about significant business transactions in both written and oral form.
At the meetings of the full Supervisory Board and its committees, we had sufficient
opportunity to actively discuss the Management Board’s reports, motions, and
proposed resolutions. After thoroughly examining and discussing the resolutions
proposed by the Management Board, we voted on such matters when it was
required by law, the Company’s Articles of Association, or the Supervisory Board’s
policies and procedures.
In addition, there was a regular exchange of information between the Chairman of
the Supervisory Board and the members of the Management Board, in particular
the Chairman, during the entire financial year. In the case of particularly pertinent
issues, the Chairman of the Supervisory Board was kept informed at all times. He
likewise maintained contact with the members of the Supervisory Board outside of
board meetings. The Supervisory Board was at all times informed about the current
operating performance of the major Group companies, significant business trans-
actions, the development of key financial figures, and decisions under consideration.
Dr. Karl-Ludwig Kley, Chairman of the Supervisory Board

7CEO Letter
Report of the Supervisory Board
E.ON Stock
Strategy and Objectives
Combined Group Management Report
Combined Non-Financial Report
Consolidated Financial Statements
Further Information
and business customers and for cities and communities. It identified
heating solutions as an additional strategic focus area. E.ON’s objective
is to satisfy customers’ needs in an efficient, smart, and sustainable
energy world.
Other Key Topics of the Supervisory Board’s Discussions
Policy and regulatory developments in countries in which E.ON is active
constituted another key topic of our discussions. Alongside the overall-
and economic-policy situation in the individual countries, we focused
primarily on the developments in European and German energy policy
and their respective consequences for E.ON’s business areas. In particular,
the Supervisory Board discussed the United Kingdom’s upcoming depar-
ture from the European Union and the various Brexit scenarios’ economic
consequences for E.ON. In addition, we dealt repeatedly with the intro-
duction of a price cap for electricity tariffs in the United Kingdom. Further-
more, developments in Turkey’s macroeconomic environment and elec-
tricity market were topics of the Supervisory Board’s deliberations.
Furthermore, in the context of the Group’s current operating business,
we discussed in detail national and international energy markets, the
currencies that are important to E.ON, the impact of low interest rates
on E.ON as well as the general business situation of the Group and its
companies. We discussed E.ON SE’s and the E.ON Group’s asset, financial,
and earnings situation, future dividend policy, workforce developments,
and earnings opportunities and risks. In addition, we and the Manage-
ment Board thoroughly discussed the E.ON Group’s medium-term plan
for 2019–2021. The Supervisory Board was provided information on
a regular basis about the Company’s health, (occupational) safety, and
environmental performance (in particular, the development of key accident
indicators) as well as the number of apprentices and measures to foster
diversity.
We also thoroughly discussed current developments in E.ON’s core
businesses. Topics of discussion included the regulatory environment
in individual markets, the development of customer numbers, new cus-
tomer solutions, and the digitalization of E.ON’s business. In addition,
the Management Board reported on the successful initial public offering
of Enerjisa Enerji A.S., the network and sales business in Turkey, in early
February 2018.
Takeover of innogy SE and Extensive Asset Swap with RWE
At its meeting in March 2018, the Supervisory Board
dealt comprehensively with the planned takeover of
innogy SE. Supported by outside consultants, the Man-
agement Board gave the Supervisory Board a detailed
presentation of the structure and the modalities of
the planned takeover. The presentation described the
financial parameters as well as the main economic
and strategic aspects of the agreement with RWE.
On this basis, the Supervisory Board is convinced that
this decision was and is the right one for the Company.
The transaction was a topic of discussion at all of the
Supervisory Board’s remaining meetings last year, at
which the Management Board kept us continually
informed about a variety of related matters, including
the status of the voluntary public takeover offer, the
merger-control procedure, and the progress of the
preparations for the integration.
Sale of the Remaining Uniper Stake and the Refinement of Corporate Strategy
At our January meeting, we approved the Management
Board’s decision to sell E.ON’s remaining 46.65-percent
Uniper stake to Fortum, a Finnish energy company.
Fortum’s payment of the purchase price along with the
antitrust approvals in June completed the execution of
E.ON’s decision to spin off its conventional generation
business.
The Supervisory Board dealt in detail with the refine-
ment of E.ON’s corporate strategy. At our September
meeting, we focused on the future strategic course
of the Energy Networks and Customer Solutions seg-
ments. As a network operator, E.ON will remain a reli-
able partner of policymakers and the general public in
the joint effort to make the energy transition a success.
Alongside making the investments necessary to main-
tain and expand its networks, E.ON is focusing on
developing innovative solutions for network operations.
On the customer solutions side, E.ON will continue to
be a leading provider of energy solutions for residential
8
Furthermore, the Supervisory Board discussed E.ON’s future funding
needs and, where necessary, adopted resolutions. We also discussed
E.ON’s current and future rating situation with the Management Board
on a regular basis. Finally, we examined the Group’s non-financial report-
ing (CSR), assured ourselves that it is legal, orderly, and purposeful, and
approved it. The report defines climate protection, occupational health and
safety, diversity, security of supply, customer satisfaction, the general
significance of human rights, and the general significance of compliance
as material topics for E.ON and describes the Company’s management
approach, key performance indicators, and risk estimates for each.
We thoroughly discussed the activity reports submitted by the Supervisory
Board’s committees.
Corporate Governance
In the 2018 financial year the Supervisory Board again duly addressed
the implementation of the recommendations of the German Corporate
Governance Code (known by its German abbreviation, “DCGK”).
In the declaration of compliance issued at the end of the year, we and the
Management Board declared that E.ON is in full compliance with the
recommendations of the “Government Commission German Corporate
Governance Code” dated February 7, 2017, published by the Federal
Ministry of Justice and for Consumer Protection in the official section of
the Federal Gazette (Bundesanzeiger), since the last annual declaration
on December 18, 2017, with no exceptions.
The current version of the declaration of compliance is in the Corporate
Governance Report on page 73; the current as well as earlier versions are
published online at www.eon.com.
One member of the Supervisory Board had a conflict of interest in the
2018 financial year in conjunction with the innogy transaction owing
to his position with another company. In accordance with Supervisory
Board rules, the member alerted the Chairman prior to the meeting on
March 11, 2018, and officially resigned this position before the meeting,
thus eliminating the conflict of interest. In addition, two members had
a conflict of interest in conjunction with a possible transaction owing
to their positions with other companies. In accordance with Supervisory
Board rules, the members made this known prior to the meeting on
December 18, 2018, and did not take part in the Supervisory Board’s
adoption of a resolution. Otherwise, the Supervisory Board is aware of
no indications of conflicts of interest involving members of the Manage-
ment Board or the Supervisory Board.
Report of the Supervisory Board
Two comprehensive education and training sessions
on selected operational issues were conducted for
Supervisory Board members in 2018.
The targets for the Supervisory Board’s composition,
including a competency profile and a diversity concept,
with regard to Item 5.4.1 of the German Corporate
Governance Code and Section 289f, Paragraph 2, Item 6
of the German Commercial Code and the status of their
achievement are described in the Corporate Governance
Report on pages 76 to 78.
In 2018 we conducted a regularly scheduled efficiency
review of the Supervisory Board’s work. Drawing on
suggestions from the Supervisory Board members, we
designed and implemented measures to improve the
Supervisory Board’s work. The measures are mainly
aimed at improving the discussion culture and thus time
management at Supervisory Board meetings as well
as extending the preliminary discussions of the share-
holder and employee representatives. In addition, in
the future the Management Board’s reports will devote
more attention to the analysis of industry-specific and
technological trends.
An overview of Supervisory Board members’ atten-
dance at meetings of the Supervisory Board and its
committees is on page 76.
Committee Work
To fulfill its duties carefully and efficiently, the Super-
visory Board has created the committees described
in detail below. Information about the committees’
composition and responsibilities is in the Corporate
Governance Report on pages 78 and 79. Within the
scope permissible by law, the Supervisory Board has
transferred to the committees the authority to adopt
resolutions. Committee chairpersons reported the
agenda and results of their respective committee’s
meetings to the full Supervisory Board on a regular
basis, typically at the Supervisory Board meeting sub-
sequent to their committee meeting.
9CEO Letter
Report of the Supervisory Board
E.ON Stock
Strategy and Objectives
Combined Group Management Report
Combined Non-Financial Report
Consolidated Financial Statements
Further Information
In the 2018 financial year the Executive Committee met
three times and conducted one written resolution pro-
cedure. All members took part in all of the committee’s
meetings and procedures. In particular, this committee
prepared the meetings of the full Supervisory Board.
At its March meeting, the committee discussed in detail
the planned takeover of innogy. In addition, the Execu-
tive Committee discussed significant personnel matters,
especially those relating to Management Board com-
pensation. Furthermore, it prepared the Supervisory
Board’s resolution to appoint Dr. Thomas König to the
Management Board and adopted a resolution based
on the Management Board’s proposal to change its
members’ respective task areas. Additionally, the Exec-
utive Committee was continually informed about the
progress toward the Management Board’s targets for
2018. The Committee also discussed the findings of
the efficiency review. Finally, it discussed the medium-
term plan for the period 2019–2021.
The Investment and Innovation Committee met four
times. All members attended all meetings. The matters
addressed by the committee included the planned sale
of the remaining Uniper stake and the Management
Board’s planned funding measures. In particular, at
its meetings the committee prepared the Supervisory
Board’s resolutions on these matters or, for matters for
which it had the authority, made the decision itself.
Furthermore, it discussed innovation topics related to
the Energy Networks and Customer Solutions seg-
ments. It addressed in detail the opportunities and risks
of selected innovative business activities.
The Audit and Risk Committee met four times in 2018.
All members took part in all meetings. With due atten-
tion to the Independent Auditor’s Report and in dis-
cussions with the independent auditor, the committee
devoted particular attention to the 2017 Financial
Statements of E.ON SE (prepared in accordance with
the German Commercial Code), the E.ON Group’s 2017
Consolidated Financial Statements (prepared in accor-
dance with International Financial Reporting Standards,
or “IFRS”), and the 2018 intermediate financial reports
of E.ON SE. The committee discussed the recommendation for selecting
an independent auditor for the 2018 financial year as well as the inter-
mediate financial reports and assigned the tasks for the auditing services,
established the audit priorities, determined the independent auditor’s
compensation, and verified the auditor’s qualifications and independence
in line with the recommendations of the German Corporate Governance
Code. The committee assured itself that the independent auditor has no
conflicts of interest. It also adopted a resolution regarding the mandatory
rotation of the independent auditor. Topics of particularly detailed discus-
sions included issues relating to accounting, the internal control system,
and risk management. In addition, the committee thoroughly discussed
the Combined Group Management Report and the proposal for profit
appropriation and prepared the relevant recommendations for the Super-
visory Board and reported them to the Supervisory Board. The committee
also discussed in detail market conditions, the long-term changes in
markets, and the resulting consequences for the underlying value of E.ON’s
operations. Other focus areas included an examination of E.ON’s risk sit-
uation, its risk-bearing capacity, and the quality control of its risk-manage-
ment system. This examination was based on consultations with the
independent auditor and, among other things, reports from the Company’s
Risk Committee. On the basis of the quarterly risk reports, the Audit and
Risk Committee noted that no risks were identified that might jeopardize
the existence of the Company or individual segments. The committee
also discussed the work done by Internal Audit including the audits con-
ducted in 2018 as well as the audit plan and audit priorities for 2019.
Furthermore, the committee discussed the health, safety, and environ-
ment report, compliance reports and E.ON’s compliance system, as well
as other issues related to auditing. The Management Board also reported
on ongoing legal proceedings and on legal and regulatory risks for the
E.ON Group’s business. In addition, the committee discussed E.ON’s cur-
rent rating and its development on a regular basis. Other topics included
the sale of the remaining Uniper stake, the progress of E.ON’s wind farm
projects, the relevance of cyber risks for E.ON’s business, the Company’s
tax situation, reportable incidents at the E.ON Group, financing and
insurance issues, and the Separate Combined Non-Financial Report.
The Nomination Committee met once in 2018 and carried out one written
resolution procedure. All members of the committee took part. The
purpose of the resolution process and the meeting was to prepare for
the elections to the Supervisory Board and for its expansion.
10Report of the Supervisory Board
Examination and Approval of the Financial Statements, Approval of the Consolidated Financial Statements, Proposal for Profit Appropriation for the Year Ended December 31, 2018
PricewaterhouseCoopers GmbH, Wirtschaftsprüfungsgesellschaft, Düsseldorf, the
independent auditor chosen by the Annual Shareholders Meeting and appointed
by the Supervisory Board, audited and submitted an unqualified opinion on the
Financial Statements of E.ON SE and the Combined Group Management Report
for the year ended December 31, 2018. The Consolidated Financial Statements
prepared in accordance with IFRS exempt E.ON SE from the requirement to publish
Consolidated Financial Statements in accordance with German law.
Furthermore, the auditor examined E.ON SE’s early-warning system regarding
risks. This examination revealed that the Management Board has taken appropriate
measures to meet the requirements of risk monitoring and that the early-warning
system regarding risks is fulfilling its task.
At the Supervisory Board’s meeting on March 12, 2019, we thoroughly dis-
cussed—in the presence of the independent auditor and with knowledge of, and
reference to, the Independent Auditor’s Report and the results of the preliminary
review by the Audit and Risk Committee—E.ON SE’s Financial Statements prepared
in accordance with the German Commercial Code, Consolidated Financial State-
ments, and Combined Group Management Report as well as the Management
Board’s proposal for profit appropriation. In this context, we considered in detail
the implications of the conclusion of the transaction agreement with RWE on the
Company’s financial statements. The independent auditor was available for sup-
plementary questions and answers. After concluding our own examination we
determined that there are no objections to the findings. We therefore acknowledged
and approved the Independent Auditor’s Report.
We approved the Financial Statements of E.ON SE prepared by the Management
Board and the Consolidated Financial Statements. The Financial Statements are
thus adopted. We agree with the Combined Group Management Report and, in
particular, with its statements concerning the Company’s future development.
We examined the Management Board’s proposal for profit appropriation, which
includes a cash dividend of €0.43 per ordinary share, also taking into consideration
the Company’s liquidity and its finance and investment plans. After examining
and weighing all arguments, we agree with the Management Board’s proposal for
profit appropriation.
In addition, we reviewed and approved the Separate Combined Non-Financial
Report.

11CEO Letter
Report of the Supervisory Board
E.ON Stock
Strategy and Objectives
Combined Group Management Report
Combined Non-Financial Report
Consolidated Financial Statements
Further Information
Personnel Changes on the Management Board
The Supervisory Board appointed Dr. Thomas König to
the E.ON SE Management Board effective June 1, 2018.
Page 244 of this report shows E.ON SE Management
Board members’ respective task areas as of year-end
2018.
Personnel Changes on the Supervisory Board
As a result of the resolution by the 2018 Annual Share-
holders Meeting to reduce the Supervisory Board
from 18 to 14 members, shareholder representatives
Prof. Dr. Ulrich Lehner, Dr. Theo Siegert, and Baroness
Denise Kingsmill ended their service on the Supervisory
Board effective May 9, 2018; employee representa-
tives Tibor Gila and Silvia Šmátralová ended their service
effective the same date. Employee representative
Thies Hansen had already ended his service effective
December 31, 2017. Klaus Fröhlich was elected as
a new member of the Supervisory Board on the share-
holder side effective May 29, 2018; Szilvia Pinczésné
Márton, as a new member on the employee side effec-
tive May 9, 2018.
Personnel Changes on the Super visory Board’s Committees
Klaus Fröhlich was elected as a new member of the Investment and
Innovation Committee effective May 29, 2018. Carolina Dybeck Happe
left the committee effective May 9, 2018. Shareholder representative
Carolina Dybeck Happe was elected as a new member of the Audit and Risk
Committee effective May 9, 2018; employee representatives Elisabeth
Wallbaum and Fred Schulz were reelected to the committee effective
May 9 and May 29, 2018, respectively. Fred Schulz, who in the new elec-
tions to the Supervisory Board was reelected to the Supervisory Board
pending the entry of the Supervisory Board’s enlargement into the Com-
mercial Register, was also reelected to the Executive Committee effective
May 29, 2018. In addition, Andreas Schmitz was elected Chairman of
the Audit and Risk Committee effective May 9, 2018. By being elected
Vice-Chairman of the Supervisory Board effective May 9, 2018, Erich
Clementi simultaneously became a member of the Executive Committee
and the Nomination Committee.
Essen, March 12, 2019
The Supervisory Board
Best wishes,
Dr. Karl-Ludwig Kley
Chairman


E.ON Stock

14
E.ON Stock Key Figures
Per share (€) 2018 2017
Net income attributable to the shareholders
of E.ON SE1 1.49 1.84
Earnings from adjusted net income1, 2 0.69 0.67
Dividend3 0.43 0.30
Dividend payout3 (€ in millions) 932 650
Twelve-month high4 9.93 10.69
Twelve-month low4 7.89 6.64
Year-end closing price4 8.63 9.06
Number of shares outstanding (in millions) 2,167 2,167
Market capitalization5 (€ in billions) 18.7 19.6
E.ON stock trading volume6 (€ in billions) 28.9 26.3
1Based on shares outstanding (weighted average).2Adjusted for non-operating effects.3For the respective financial year; the 2018 figure represents management’s dividend proposal.4Xetra. 5Based on ordinary shares outstanding at year-end.6On all German stock exchanges, including Xetra.
E.ON Stock in 2018
At the end of 2018, E.ON stock (including reinvested dividends)
was 2 percent below its year-end closing price for 2017. It
thereby somewhat underperformed its peer index, the STOXX
E.ON Stock
Dividend
At the 2019 Annual Shareholders Meeting, management will
propose a cash dividend of €0.43 per share for the 2018 financial
year (prior year: €0.30). The payout ratio (as a percentage
of adjusted net income) would be 62 percent. Based on E.ON
stock’s year-end 2018 closing price, the dividend yield would
be 5 percent.
0.50
0.25
2013 2014 2015 2016 2017 2018
0.60
0.50 0.50
0.21 0.30
0.43
51
59 59
4546
62
Dividend per Share
€ per share – Dividend —• • Payout ratio1 (%)
1Payout ratio in relation to adjusted net income; not adjusted for discontinued operations.
110
105
100
95
90
E.ON Stock Performance
Percentages – E.ON – EURO STOXX1 – STOXX Utilities1
1Based on the performance index.
12/29/17 1/31/18 2/28/18 3/31/18 4/30/18 5/31/18 6/30/18 7/31/18 8/31/18 9/30/18 10/31/18 11/30/18 12/31/18
Utilities (+2 percent), but outperformed the broader European
stock market as measured by the EURO STOXX 50 index
(-12 percent).
15CEO Letter
Report of the Supervisory Board
E.ON Stock
Strategy and Objectives
Combined Group Management Report
Combined Non-Financial Report
Consolidated Financial Statements
Further Information
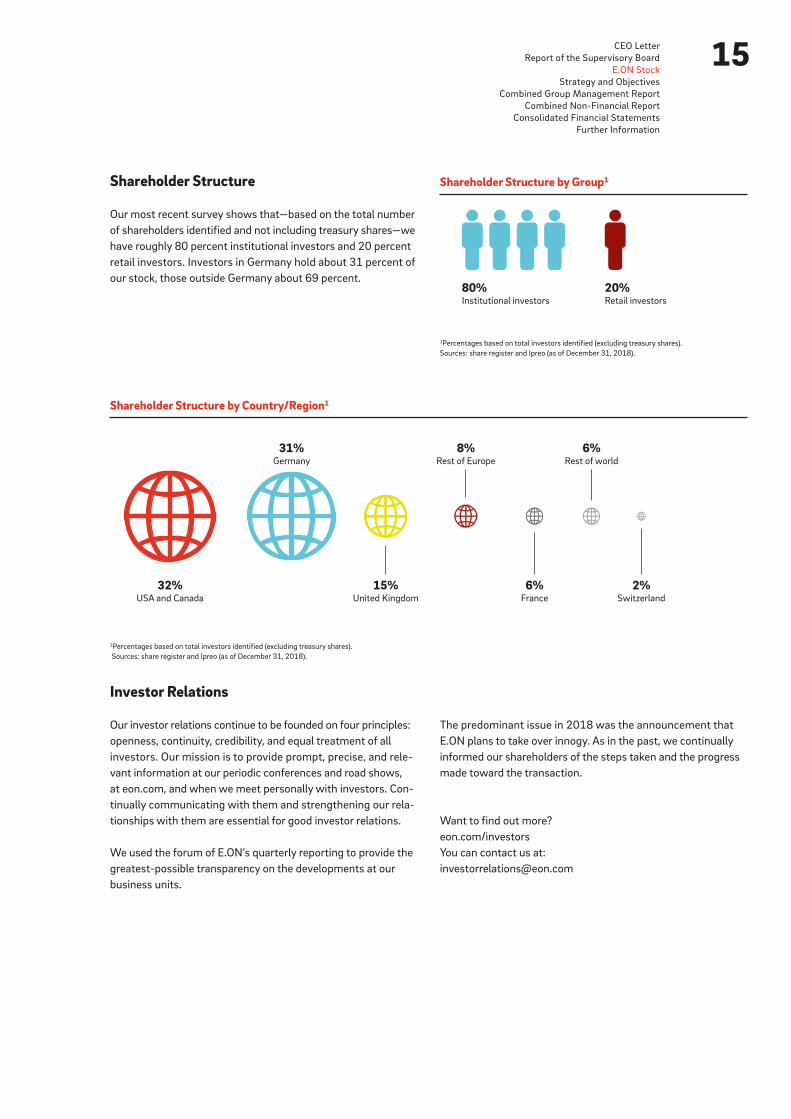
Shareholder Structure
Our most recent survey shows that—based on the total number
of shareholders identified and not including treasury shares—we
have roughly 80 percent institutional investors and 20 percent
retail investors. Investors in Germany hold about 31 percent of
our stock, those outside Germany about 69 percent. 80%Institutional investors
20%Retail investors
Shareholder Structure by Group1
1Percentages based on total investors identified (excluding treasury shares).
Sources: share register and Ipreo (as of December 31, 2018).
Shareholder Structure by Country/Region1
1Percentages based on total investors identified (excluding treasury shares).
Sources: share register and Ipreo (as of December 31, 2018).
32%USA and Canada
31%Germany
8%Rest of Europe
6%Rest of world
15%United Kingdom
6%France
2%Switzerland
Investor Relations
Our investor relations continue to be founded on four principles:
openness, continuity, credibility, and equal treatment of all
investors. Our mission is to provide prompt, precise, and rele-
vant information at our periodic conferences and road shows,
at eon.com, and when we meet personally with investors. Con-
tinually communicating with them and strengthening our rela-
tionships with them are essential for good investor relations.
We used the forum of E.ON’s quarterly reporting to provide the
greatest-possible transparency on the developments at our
business units.
The predominant issue in 2018 was the announcement that
E.ON plans to take over innogy. As in the past, we continually
informed our shareholders of the steps taken and the progress
made toward the transaction.
Want to find out more?
eon.com/investors
You can contact us at:


Strategy and Objectives

18
Increasingly, the renewable energy business worldwide is exposed
to market price risks and needs to interact with the wholesale
market. Moreover, it is becoming more global, and critical mass
is becoming a more important factor. Combining innogy and
E.ON’s renewables businesses at RWE will create a bigger plat-
form, one that has the critical mass that is indispensable for
successful business development on an international scale.
Objectives and Core Businesses
Going forward, E.ON will concentrate on energy networks and
customer solutions. With a clear focus on two strong core busi-
nesses, we aim to become the partner of choice for energy and
customer solutions.
• Energy Networks: distribution grids link our customers
together and are the backbone of the energy transformation.
After the integration of innogy, E.ON will operate distribution
grids in eight European countries with a regulated asset base
of €34 billion. The energy system is complex and increasingly
characterized by distributed generation. It connects the elec-
tricity market, heat market, and mobility. This complex system
is not possible without smart distribution grids. This means
that grids no longer only distribute power. They are evolving
into smart platforms that integrate processes, data, and
generation assets. E.ON is already a leader in network effi-
ciency and will continue to set new standards in the future.
• Customer Solutions: the integration of innogy’s customer-
solutions business will expand our customer base to around
50 million. Thus strengthened, E.ON intends to become
the partner of choice for public, commercial, and residential
customers and to create added value for them. We will con-
tinually improve or redefine our portfolio of products and
services for innovative heating solutions, energy efficiency,
distributed generation and storage, and sustainable mobility
solutions. We intend to achieve this through a consistently
convincing customer experience, a strong digital orientation,
and high-quality service.
Resources and Capabilities
Each of these core businesses has its own viable business logic.
But combining them in a single company offers significant
advantages. It enables E.ON to acquire and leverage a compre-
hensive understanding of the transformation of the energy
system and the interplay between the individual submarkets
in regional and local energy supply systems. In an increasingly
distributed and digital energy world, customer solutions and
Our Strategy: Partner for the New Energy World
E.ON’s strategy focuses the Company systematically on the
new energy world of increasingly empowered and proactive
customers. The planned acquisition of innogy and the planned
sale of the renewable energy business to RWE strengthens
this strategy. The energy world is becoming more electric and
customer-driven. Going forward, we intend to focus on energy
networks in a distributed energy world and more on customer
solutions that emphasize sustainability and energy efficiency.
Through the planned acquisition of innogy, E.ON is seizing the
initiative and—for the benefit of customers, employees, business
partners, shareholders, and society in general—taking advantage
of the significant opportunities created by the transformation
of the energy world. Examples include continual innovation, an
unambiguous commitment to sustainability, the expansion of
digital architecture across our organization, and a strong brand.
Health and safety remain indispensable corporate values. Our
unequivocal objective is to avoid accidents and to minimize
adverse health impacts on our employees.
Transaction with RWE
In March 2018 E.ON and RWE reached an extensive asset-swap
agreement under which E.ON will acquire RWE’s 76.8-percent
stake in innogy and transfer to RWE substantially all of its renew-
able energy business. In response to a voluntary public takeover
offer, innogy’s other shareholders tendered 9.4 percent of innogy
stock to E.ON (for more details on the planned transaction, see
pages 22 and 23 of the Combined Group Management Report).
After the transaction closes, E.ON will focus on two business
segments: regulated, highly efficient energy networks and
innovative customer solutions. We will be able to combine our
expertise and innovativeness in these two segments with innogy’s.
The takeover of innogy will also enable us to achieve significant
cost advantages.
The planned acquisition is a fundamental step in the implemen-
tation of our strategy and offers the opportunity to achieve our
strategic objectives within the constraints of our balance sheet.
Success in energy networks and customer solutions can only
be ensured through a systematic customer focus (municipalities,
residential customers, and commercial customers). New dis-
tributed customer solutions are based on a deep understanding
of the customer business as well as energy networks. Regulated
network assets together with growth opportunities in customer
solutions create an attractive and balanced portfolio.
Strategy and Objectives
19CEO Letter
Report of the Supervisory Board
E.ON Stock
Strategy and Objectives
Combined Group Management Report
Combined Non-Financial Report
Consolidated Financial Statements
Further Information
energy networks are already beginning to converge. For example,
smart meters are already providing the basis for new energy-
sales offerings, such as time-based electricity tariffs and
energy- efficiency solutions.
Focusing on two core businesses will enable E.ON to retain its
existing strengths and advantages and to build on them. Examples
include our outstanding record of managing energy networks
and systematically developing customer solutions. In 2018 our
customer solutions business compiled several achievements
in heat supply, e-mobility, energy efficiency, and energy storage.
For example, E.ON and Berliner Stadtwerke were awarded the
concession to provide heat and cooling to an urban development
project at the site of Tegel airport in Berlin thanks to a plan fea-
turing an innovative low-temperature network. The European
Spallation Source (“ESS”), a major research institute in Lund,
Sweden, chose E.ON as its partner for sustainable cooling, heat,
and compressed air.
On the e-mobility side, at year-end 2018 E.ON could already
offer its customers 4,000 charging points in Germany. In late
2018 E.ON joined EV100, a global initiative to accelerate the
transition to electric vehicles (“EVs”), and pledged to convert all
company vehicles under 3.5 metric tons to EVs by 2030. In
other e-mobility milestones in 2018, we entered the Norwegian
market, forged a strategic partnership with Nissan, and intro-
duced a digital platform that makes our charging network easier
to access and use. To promote energy efficiency, E.ON partnered
with European banks to offer standardized loans that make it
easier for property owners to finance energy-efficiency improve-
ments. This creates additional incentives for efficient energy
use. In energy storage, in early 2018 we launched E.ON Solar-
Cloud, which enables customers with solar panels to use
100 percent of the green power they produce, even if they
do not have a battery.
The network business achieved advances in 2018 as well. Avacon,
an E.ON subsidiary in north-central Germany, is testing a smart
grid hub that can control equipment like solar panels and battery
storage devices remotely. Part of the EU’s Interflex project,
the hub is a cost-effective way to help ensure stable network
operations. In the Czech Republic E.ON launched a project called
ACON, which stands for “again connected networks.” Its purpose
is to enhance the distribution networks in the regions along
the Czech-Slovak border and to upgrade them using smart-grid
technology.
Corporate Initiatives
The agreement with RWE was the dominant event of 2018.
Yet E.ON also moved forward with key corporate initiatives and
launched new ones with the aim of enhancing its competitiveness
and customer orientation. These initiatives lay an important
foundation for E.ON’s lasting success in the years ahead. All of
them are designed for rapid results and implementation. Below
are two examples of such initiatives.
• Launched at the end of 2016, the Phoenix program redesigned
the setup of E.ON’s corporate and support functions to make
them closer to customers and to reduce unnecessary bureau-
cracy and inefficiency. We are giving our customer-proximate
functions greater decision-making authority, enabling faster
decision-making and implementation. We successfully
completed the program in 2018, substantially reducing our
cost base.
• Sustainability is not only an important criterion in the design
of our corporate strategy, but also for our actions. In 2018
the Management Board pledged E.ON’s support for the UN
Sustainable Development Goals (“SDGs”), thereby under-
scoring our commitment to sustainability. E.ON’s business
operations contribute directly to the achievement of SDG 7
(affordable and clean energy), 11 (sustainable cities and
communities), and 13 (climate action). In 2018 E.ON also
launched a climate-protection initiative and set a target of
making all its buildings climate-neutral by 2030.
Finance Strategy
The section of the Combined Group Management Report entitled
Financial Situation contains explanatory information about our
finance strategy.
People Strategy
The section of the Combined Group Management Report entitled
Employees contains explanatory information about our people
strategy.

Combined Group Management Report
• Adjusted EBIT and adjusted net income both
at upper end of forecast range
• Economic net debt reduced significantly
• Management to propose dividend of €0.43 per share
for the 2018 financial year
• Transaction with RWE for acquisition of innogy
filed with European Commission
• 2019 adjusted EBIT expected to be between
€2.9 and €3.1 billion, adjusted net income
between €1.4 and €1.6 billion

22Corporate Profile
RenewablesThis segment consists of Onshore Wind/Solar and Offshore
Wind/Other. We plan, build, operate, and manage renewable
generation assets. We market their output in several ways:
in conjunction with renewable incentive programs, under long-
term electricity supply agreements with key customers, and
directly to the wholesale market. Substantially all of the opera-
tions in this segment are classified as discontinued operations
effective June 30, 2018 (for more information, see pages 22
and 23 of the Combined Group Management Report and Note 4
to the Consolidated Financial Statements).
Non-Core Business This segment consists of our non-strategic activities. This
applies to the operation of our nuclear power stations in
Germany (which is managed by our PreussenElektra unit) and
the generation business in Turkey.
Special Events in the Reporting Period
Asset Swap with RWEOn March 12, 2018, E.ON SE and RWE AG reached an agree-
ment under which E.ON will acquire RWE’s 76.8-percent stake
in innogy SE as part of an extensive asset swap. As part of this
swap, E.ON will transfer to RWE substantially all of its renew-
ables business as well as the minority stakes, held by its subsid-
iary PreussenElektra, in Emsland und Gundremmingen nuclear
power stations, which are operated by RWE. However, the
E.ON Group will retain certain assets reported in its Renewables
segment, namely: businesses operated by e.disnatur in Germany
and Poland as well as a 20-percent stake in Rampion offshore
wind farm. In return for its innogy stake, RWE will receive a
16.67-percent stake in E.ON. The stock will be issued by means
of a 20-percent capital increase against contributions in kind
from E.ON SE’s existing authorized capital. In addition, RWE will
make a cash payment of €1.5 billion to E.ON. Furthermore, RWE
will receive innogy’s gas storage business and its stake in Kelag,
an Austria-based energy supplier. The transaction, which was filed
with the European Commission in January 2019, will take place
in several steps and is subject to the usual antitrust approvals.
Corporate Profile
Business Model
E.ON is an investor-owned energy company with approximately
43,000 employees. Led by corporate headquarters in Essen,
our operations are segmented into three operating units: Energy
Networks, Customer Solutions, and Renewables. Our non-
strategic operations are reported under Non-Core Business.
Corporate HeadquartersCorporate headquarters’ main task is to lead the E.ON Group.
This involves charting E.ON’s strategic course and managing and
funding its existing business portfolio. Corporate headquarters’
tasks include optimizing E.ON’s overall business across countries
and markets from a financial, strategic, and risk perspective and
conducting stakeholder management.
Energy NetworksThis segment consists of our power and gas distribution net-
works and related activities. It is subdivided into three regional
markets: Germany, Sweden, and East-Central Europe/Turkey
(which consists of the Czech Republic, Hungary, Romania, Slo-
vakia, and Turkey). This segment’s main tasks include operating
its power and gas networks safely and reliably, carrying out any
necessary maintenance and repairs, and expanding its networks,
which frequently involves adding customer connections.
Customer SolutionsThis segment serves as the platform for working with our
customers to actively shape Europe’s energy transition. This
includes supplying customers in Europe (excluding Turkey)
with power, gas, and heat as well as with products and services
that enhance their energy efficiency and autonomy and provide
other benefits. Our activities are tailored to the individual needs
of customers across all segments: residential, small and medium-
sized enterprises, large commercial and industrial, and public
entities. E.ON’s main presence in this business is in Germany, the
United Kingdom, Sweden, Italy, the Czech Republic, Hungary,
and Romania. E.ON Connecting Energies, which provides cus-
tomers with turn-key distributed-energy solutions, is also part
of this segment.

23CEO Letter
Report of the Supervisory Board
E.ON Stock
Strategy and Objectives
Combined Group Management Report
Combined Non-Financial Report
Consolidated Financial Statements
Further Information
RenewablesPursuant to IFRS 5, the operations in the Renewables segment
that will be transferred are reported as discontinued operations
effective June 30, 2018 (for more information, see Note 4 to
the Consolidated Financial Statements). Until their final transfer
to RWE, however, these operations will be managed as before.
For the purpose of internal management control, their results
will therefore be fully included in the relevant key performance
indicators. In addition, the scheduled depreciation charges
required by IFRS 5 and the carrying amount of these discontinued
operations will be recorded in equity and disclosed accordingly.
The Combined Group Management Report’s presentation of the
key performance indicators relevant for management control and
of sales therefore includes the results of discontinued operations
in the Renewables segment. Pages 32 to 34 of the Combined
Group Management Report and Note 33 to the Consolidated
Financial Statements contain reconciliations of these indicators
to the disclosures in the E.ON SE and Subsidiaries Consolidated
Statements of Income, Consolidated Balance Sheets, and Con-
solidated Statements of Cash Flows.
Minority Stakes in Nuclear Power StationsUnder the agreement with E.ON, RWE will acquire not only
substantially all of E.ON’s renewables business but also its
minority stakes in Kernkraftwerke Lippe-Ems GmbH and
Kernkraftwerk Gundremmingen GmbH nuclear power stations,
which are operated by RWE. These minority stakes and the
associated debt, which had previously been reported at Non-
Core Business, were reclassified as a disposal group effective
June 30, 2018.
Voluntary Public Takeover Offer for innogy SE StockFollowing approval of the offer documents by the German
Federal Financial Supervisory Authority (known by its German
acronym, “BaFin”), on April 27, 2018, E.ON published its vol-
untary public takeover offer (“PTO”) for innogy SE stock. The
PTO’s extended acceptance period ended on July 25, 2018.
In addition to the 76.8-percent stake to be acquired from RWE,
9.4 percent of innogy stock was tendered under the PTO.
To finance the PTO, E.ON originally secured a €5 billion acquisi-
tion facility, which will fund the acquisition of innogy stock not
held by RWE. Considering the tender ratio under the PTO, E.ON
reduced the facility to €1.75 billion.
innogy’s Agreements in Principle with E.ON and RWEOn July 18, 2018, innogy concluded two legally binding agree-
ments—one with E.ON, another with RWE—on the planned
integration of innogy into E.ON and the planned integration of
innogy’s renewables business into RWE. The agreements call
for the planned transaction to be implemented in a transparent
process in which all employees will be treated fairly and as
equally as possible, regardless of which company they currently
work for. In addition, the integrations will take into account the
companies’ respective strengths. Essen will remain the regis-
tered office and headquarters of the new E.ON. innogy will play
a positive role in supporting the swift implementation of the
planned transaction between RWE and E.ON.
Sale of Uniper StakeIn September 2017 E.ON and Fortum Corporation of Espoo,
Finland, concluded an agreement under which E.ON had the
right to sell its 46.65-percent stake in Uniper to Fortum in early
2018. Until the end of September 2017 we classified this stake
as an associated company and accounted for it using the equity
method. We then reclassified it as an asset held for sale. In
January 2018 E.ON decided to exercise its option to tender its
Uniper stake. After all the necessary antitrust approvals were
obtained, the transaction closed on June 26, 2018, with E.ON
receiving liquid funds totaling €3.8 billion. The disposal of the
stake and the derecognition of the associated derivative financial
instruments resulted in income totaling €1.1 billion. Note 4 to the
Consolidated Financial Statements contains more information.
Changes in Segment ReportingAt the beginning of 2018 we made a number of reclassifications.
The generation business in Turkey is now reported under Non-
Core Business. Customer Solutions’ heat business in Germany
is no longer reported at its Germany unit but rather at its Other
unit. In addition, costs for the ongoing expansion of our business
of providing new digital products and services as well as inno-
vative projects, which were previously allocated to Corporate
Functions/Other, are now allocated to the appropriate operating
units at Customer Solutions. We adjusted the prior-year figures
accordingly. These reclassifications were already factored into
the earnings forecast for 2018 contained in our 2017 Annual
Report.

24Corporate Profile
Management System
Our corporate strategy aims to deliver sustainable growth in
shareholder value. We have in place a Group-wide planning and
controlling system to assist us in planning and managing E.ON
as a whole and our individual businesses with an eye to increas-
ing their value. This system ensures that our financial resources
are allocated efficiently. We strive to enhance our sustainability
performance efficiently and effectively as well. We have high
expectations for our sustainability performance. We embed these
expectations progressively more deeply into our organization—
across all organizational entities and all processes—by means of
binding company policies and minimum standards.
Key Performance IndicatorsOur most important key performance indicators (“KPIs”) for
managing our operating business are adjusted EBIT and cash-
effective investments. Other KPIs for managing the E.ON Group
are cash-conversion rate, ROCE, adjusted net income, earnings
per share (based on adjusted net income), and debt factor. The
Combined Group Management Report’s presentation of the
KPIs relevant for management control includes the results of
discontinued operations in the Renewables segment (for more
information, see pages 22 and 23 of the Combined Group Man-
agement Report).
Adjusted earnings before interest and taxes (“adjusted EBIT”)
is E.ON’s most important KPI for purposes of internal manage-
ment control and as an indicator of its businesses’ long-term
earnings power. The E.ON Management Board is convinced that
adjusted EBIT is the most suitable KPI for assessing operating
performance because it presents a business’s operating earnings
independently of non-operating factors, interest, and taxes.
The adjustments include net book gains, certain restructuring
expenses, impairment charges, the marking to market of deriv-
atives, and other non-operating earnings (see the explanatory
information on pages 31 to 33 to the Combined Group Man-
agement Report and in Note 33 of the Consolidated Financial
Statements).
Cash-effective investments are equal to the investment expen-
ditures shown in our Consolidated Statements of Cash Flows.
These include the investments of discontinued operations in
the Renewables segment.
IFRS 9, “Financial Instruments,” and IFRS 15, “Revenue from Contracts with Customers”We apply IFRS 9, “Financial Instruments,” and IFRS 15, “Revenue
from Contracts with Customers,” for the first time effective
the start of 2018. The impact of the initial application of these
standards on E.ON SE and Subsidiaries Consolidated Financial
Statements as of December 31, 2018—in particular, on sales,
costs of materials, and a reduction in the value of financial
assets—is explained in detail in Note 2 to the Consolidated
Financial Statements.
Sale of E.ON ElektrárneOn July 26, 2018, E.ON sold its stake in E.ON Elektrárne s.r.o. to
Západoslovenská energetika a.s. (“ZSE”). The parties agreed not
to disclose the sales price. The transaction included the repay-
ment of shareholder loans. ZSE is owned jointly by the Slovakian
state (51 percent) and the E.ON Group (overall, 49 percent).
The assets of E.ON Elektrárne s.r.o. include primarily Malženice
combined-cycle gas turbine.
Sale of E.ON Gas SverigeOn April 25, 2018, the E.ON Group closed the sale of E.ON Gas
Sverige AB, its gas distribution network company in Sweden,
with retroactive economic effect to January 1, 2018. The buyer
was the European Diversified Infrastructure Fund II.
Sale of Hamburg NetzIn 2017 E.ON agreed to sell its 74.9-percent stake in Hamburg
Netz GmbH to the Free and Hanseatic City of Hamburg. The
transaction closed on January 1, 2018. The payment was
received in 2017.
Initial Public Offering of Enerjisa EnerjiA 20-percent stake (E.ON’s share: 10 percentage points) of
Enerjisa Enerji A.Ş. was successfully placed on the stock market
on February 8, 2018. The issuance price was TRY 6.25 per
100 shares. Enerjisa Enerji A.Ş. continues to be a joint venture
between E.ON and Sabanci, each of which holds 40 percent.
The book gain on this transaction was more than offset by cumu-
lative adverse currency-translation effects.
25CEO Letter
Report of the Supervisory Board
E.ON Stock
Strategy and Objectives
Combined Group Management Report
Combined Non-Financial Report
Consolidated Financial Statements
Further Information
Cash-conversion rate is equal to operating cash flow before
interest and taxes divided by adjusted EBITDA. It indicates
whether our operating earnings are generating enough liquidity.
Return on capital employed (“ROCE”) assesses the value perfor-
mance of our operating business. ROCE is a pretax total return
on capital and is defined as the ratio of adjusted EBIT to annual
average capital employed.
Adjusted net income is an earnings figure after interest income,
income taxes, and non-controlling interests that has likewise
been adjusted to exclude non-operating effects (see the explan-
atory information on page 33 of the Combined Group Manage-
ment Report).
E.ON manages its capital structure by means of its debt factor
(see the section entitled Finance Strategy on page 34). Debt
factor is equal to our economic net debt divided by adjusted
EBITDA and is therefore a dynamic debt metric. Economic net
debt includes our net financial debt as well as our pension and
asset-retirement obligations.
Other KPIsAlongside our most important financial management KPIs, the
Combined Group Management Report includes other financial
and non-financial KPIs to highlight aspects of our business per-
formance and our sustainability performance vis-à-vis all our
stakeholders: our employees, customers, shareholders, bond
investors, and the countries in which we operate. Operating
cash flow and value added are examples of our other financial
KPIs. Our sustainability KPIs include total recordable frequency
index (“TRIF”), which measures reported work-related injuries
and illnesses. The section entitled Employees contains explana-
tory information about this KPI.
In addition, some KPIs are important for E.ON as a customer-
focused company. For example, we see our ability to acquire new
customers and retain existing ones as crucial to our success.
Net promoter score (“NPS”) measures customers’ willingness to
recommend E.ON to a friend or colleague. Our Sustainability
Report and the Separate Combined Non-Financial Report
describe how NPS fits into our management approach.
However, these other KPIs are not the focus of the ongoing
management of our businesses.
Innovation
E.ON’s innovation activities reflect its strategy of focusing
systematically on the new energy world of empowered and
proactive customers, renewables and distributed energy,
energy efficiency, local energy systems, and digital solutions.
E.ON therefore has the following Innovation Hubs:
• Retail and end-customer solutions: develop new business
models for distributed-energy supply, energy efficiency, and
mobility
• Renewables generation: increase the cost-effectiveness of
existing wind and solar assets and study new renewables
technologies
• Infrastructure and energy networks: develop energy-storage
and energy-distribution solutions for an increasingly distrib-
uted and volatile generation system
• Energy intelligence and energy systems: study potentially
fundamental changes to energy systems and the role of data
in the new energy world.
Strategic Co-Investments We want to identify promising energy technologies of the
future that will enhance our palette of offerings for our millions
of customers around Europe and will make us a pacesetter in
the operation of smart energy systems. We select new busi-
nesses that offer the best opportunities for partnerships, com-
mercialization, and equity investments. Our investments focus
on strategic technologies and business models that enhance
26Business Report
Macroeconomic and Industry Environment
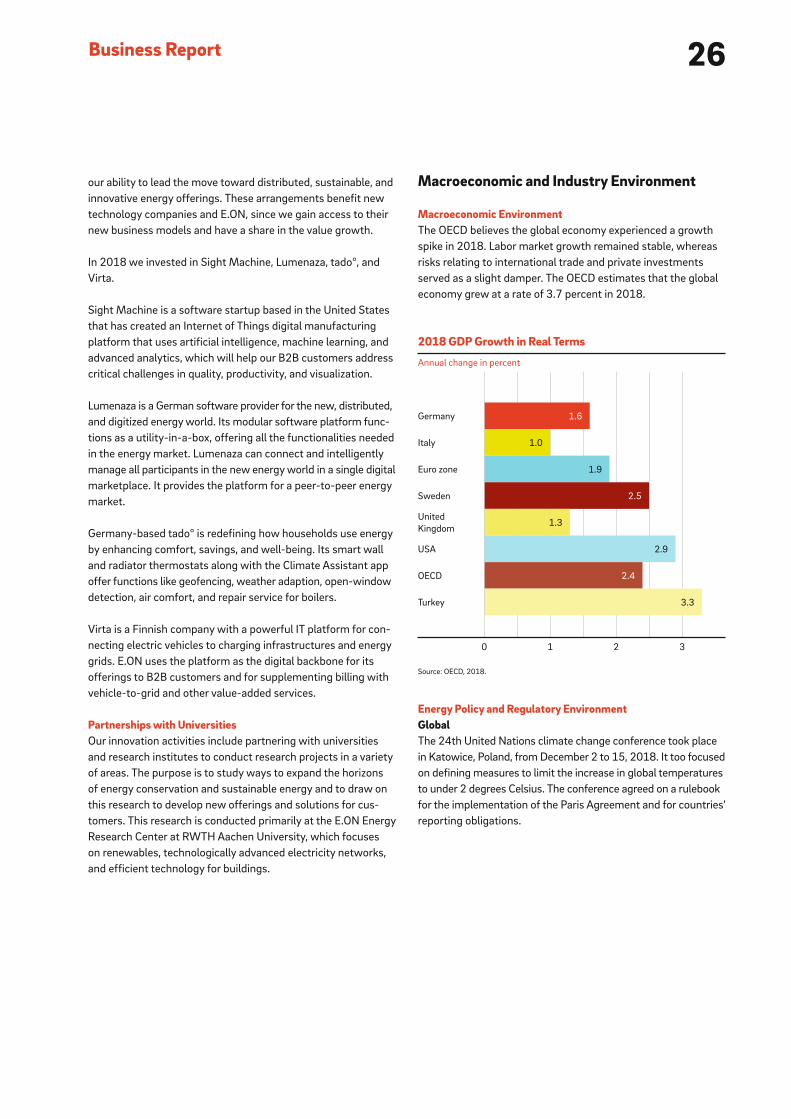
Macroeconomic EnvironmentThe OECD believes the global economy experienced a growth
spike in 2018. Labor market growth remained stable, whereas
risks relating to international trade and private investments
served as a slight damper. The OECD estimates that the global
economy grew at a rate of 3.7 percent in 2018.
Energy Policy and Regulatory EnvironmentGlobalThe 24th United Nations climate change conference took place
in Katowice, Poland, from December 2 to 15, 2018. It too focused
on defining measures to limit the increase in global temperatures
to under 2 degrees Celsius. The conference agreed on a rulebook
for the implementation of the Paris Agreement and for countries’
reporting obligations.
1.6
1.0
1.9
2.5
1.3
2.9
2.4
3.3
Germany
Italy
Euro zone
Sweden
United
Kingdom
USA
OECD
Turkey
0 1 2 3
2018 GDP Growth in Real Terms
Annual change in percent
Source: OECD, 2018.
our ability to lead the move toward distributed, sustainable, and
innovative energy offerings. These arrangements benefit new
technology companies and E.ON, since we gain access to their
new business models and have a share in the value growth.
In 2018 we invested in Sight Machine, Lumenaza, tado°, and
Virta.
Sight Machine is a software startup based in the United States
that has created an Internet of Things digital manufacturing
platform that uses artificial intelligence, machine learning, and
advanced analytics, which will help our B2B customers address
critical challenges in quality, productivity, and visualization.
Lumenaza is a German software provider for the new, distributed,
and digitized energy world. Its modular software platform func-
tions as a utility-in-a-box, offering all the functionalities needed
in the energy market. Lumenaza can connect and intelligently
manage all participants in the new energy world in a single digital
marketplace. It provides the platform for a peer-to-peer energy
market.
Germany-based tado° is redefining how households use energy
by enhancing comfort, savings, and well-being. Its smart wall
and radiator thermostats along with the Climate Assistant app
offer functions like geofencing, weather adaption, open-window
detection, air comfort, and repair service for boilers.
Virta is a Finnish company with a powerful IT platform for con-
necting electric vehicles to charging infrastructures and energy
grids. E.ON uses the platform as the digital backbone for its
offerings to B2B customers and for supplementing billing with
vehicle-to-grid and other value-added services.
Partnerships with UniversitiesOur innovation activities include partnering with universities
and research institutes to conduct research projects in a variety
of areas. The purpose is to study ways to expand the horizons
of energy conservation and sustainable energy and to draw on
this research to develop new offerings and solutions for cus-
tomers. This research is conducted primarily at the E.ON Energy
Research Center at RWTH Aachen University, which focuses
on renewables, technologically advanced electricity networks,
and efficient technology for buildings.
27CEO Letter
Report of the Supervisory Board
E.ON Stock
Strategy and Objectives
Combined Group Management Report
Combined Non-Financial Report
Consolidated Financial Statements
Further Information
EuropeIn 2018 the EU made important progress in enacting the pro-
posals contained in the Clean Energy for All Europeans package
of energy and climate legislation. The adoption of the gover-
nance regulation introduced a new instrument for monitoring
the member states’ climate policies. It obliges them to submit,
by the end of 2019, national energy and climate plans for 2021
to 2030. The new versions of the Energy Efficiency and Renew-
able Energy Directives set new binding EU-wide targets for 2030.
The EU intends to achieve energy savings of 32.5 percent rela-
tive to forecast primary energy consumption and for renewables
to meet 32 percent of gross final energy consumption in the
electricity, heat, and transport sectors. Both targets could be
reviewed and, if necessary, revised upward in 2023.
By contrast, the EU did not revise its binding decarbonization
targets. The newly adopted targets for energy efficiency and the
share of renewables are expected to raise the emission reduction
to 45 percent compared with 1990. At the end of 2018 the EU
set an emission-reduction target for personal transport. The dis-
cussion between the European Parliament, the European Com-
mission, and the member states resulted in a target of reducing
these emissions by 37.5 percent by 2030 compared with 2021.
GermanyFollowing the 2017 Bundestag elections, the CDU, CSU, and SPD
decided to continue the grand coalition. The coalition agreement
affirmed the climate targets for 2030 and 2050. One target is
for renewables to meet about 65 percent of the country’s gross
electricity consumption by 2030. The agreement also foresees
an ambitious action plan for upgrading and expanding energy
networks, recognizing the increased importance of distribution
networks. The scope for digital business models is to be expanded,
with data protection to be a top priority.
On June 6, 2018, the German federal government appointed a
Commission for Growth, Structural Change, and Employment
to assist with its climate-protection plans. The commission came
up with economic-development measures for lignite mining
regions in Germany and worked out a timetable and, in particular,
a target date for the phaseout of coal-fired power generation.
On January 26, 2019, the commission issued its final report, in
which it recommends to the German federal government that
the country completely phase out coal-fired generation by 2038
at the latest. The commission calls for the phaseout to be gradual.
It proposes that in 2022 a total of no more than 15 GW of lignite-
fired generating capacity and 15 GW of hard-coal-fired capacity
should be operational. By 2030 the figures are to decline to
9 GW for lignite and 8 GW for hard coal. The phaseout plan is
to be reviewed at regular intervals. In addition, the commission
recommends leaving the option open in 2032 to move the com-
plete phaseout of coal-fired generation forward to 2035.
Effective January 1, 2018, the preferential treatment of self-
supply combined-heat-and-power (“CHP”) units that entered
service after August 1, 2014, was rescinded. After the European
Commission and the German federal government reached an
agreement in principle during the year, the rescission was reversed
with retroactive effect for CHP units of less than 1 MW and
more than 10 MW, which received EU state aid approval. These
units will continue to pay 40 percent of the renewables levy.
Depending on their number of full-use hours, newer CHP units
between 1 and 10 MW will have to pay between 40 and
100 percent of the renewables levy unless they are used for
self-supply by specially approved enterprises.
At the end of 2018 the Bundestag and the Bundesrat passed
the Omnibus Energy Act, which makes various amendments to
energy legislation, such as the Renewable Energy Act and the
CHP Act. The Omnibus Energy Act extends the aforementioned
preferential treatment of self-supply for new CHP plants and
establishes special tenders for 4 GW of onshore wind and solar
capacity, as foreseen by the coalition agreement. The special ten-
ders will be conducted between 2019 and 2021. Furthermore,
the Omnibus Energy Act gradually reduces the remuneration for
solar arrays between 40 kW and 750 kW to 8.9 cents per kWh
by April 2019.
28Business Report
Great BritainFollowing a period of negotiations, on November 25, 2018, the
U.K. Government and the European Union formally approved the
Withdrawal Agreement and Political Declaration on the future
relationship between the U.K. and the EU. If approved by the
House of Commons, the agreement will be transposed into U.K.
law and then ratified by the EU before March 29, 2019. If the
agreement is rejected by the House of Commons, a number of
scenarios are possible. They include a revised deal, a second
Brexit referendum, and a disorderly no-deal exit. There remains
substantial uncertainty over the details of Brexit.
The Court of Justice of the European Union ruled the European
Commission’s approval of the introduction of a capacity market in
the United Kingdom invalid. The market is therefore suspended.
Until state aid approval is again obtained, no capacity auctions
can be held and no capacity payments can be made to market
participants holding contracts from previous auctions. The U.K.
government is working with the European Commission to sup-
port its investigation and ensure a timely relaunch of the capacity
market. It is unclear at this stage what impact Brexit could have
on the European Commission’s jurisdiction over the U.K. capacity
market.
Italy The Italian government aims for renewables to meet 55 percent
of the country’s electricity consumption by 2030. To achieve
this goal, the government intends to put in place a direct subsidy
scheme based on bilateral contracts for differences in the short
term and a market for efficient power purchase agreements in
the long term. Alongside growth in renewables, the Italian market
faces a decline in installed thermal capacity. To ensure supply
security and system stability and to continue the phaseout of
coal-fired generation, the Italian government proposed estab-
lishing a capacity market. Although the European Commission
approved the most recent version of the proposal in February
2018, the timetable for implementation remains uncertain.
This is because the Italian government temporarily suspended
implementation in September 2018 owing to the potential risk
that the proposed capacity market will favor carbon-intensive
generation technologies such as coal.
SwedenSweden’s energy policy is focused on the 2016 cross-party
energy agreement that foresees a fully renewable electricity
system over the long term. The agreement features a number
of climate policies, including a target of 100 percent renewable
electricity generation by 2040. The main policy instrument, the
elcertificate market scheme, has resulted in substantial growth
in wind power and the conversion of fossil fuel to biomass. With
nearly 9.5 TWh of new wind power capacity under construction
as of October 2018, Sweden will likely achieve its 2030 renew-
ables target in the early 2020s. General elections were held in
September 2018. A government was formed in January 2019.
East-Central EuropeThe Romanian electricity market has been fully liberalized since
January 1, 2018. However, a government ordinance took effect
on December 29, 2018, that places the residential power supply
under the oversight of the Romanian Energy Regulatory Author-
ity from March 1, 2019, to February 28, 2022. In addition,
in September 2018 the Romanian Energy Ministry presented
its draft energy strategy for 2018–2030 looking toward 2050.
It identifies a number of projects of strategic national interest,
including significant investments in nuclear and hydroelectric
capacity. Hungary announced that it will phase out coal-fired
generation by 2030. The gap will be made up by an existing
nuclear power plant (“NPP”) and two new units at Paks II NPP,
which are in the preparatory phase of construction. Slovakia
is preparing a national 2050 low-carbon strategy aided by the
World Bank, which may include the commissioning of two NPPs.
The Czech Republic is also considering nuclear as part of the
transition from coal-fired generation. It intends to decide in the
near future whether to build, and how to finance, a new unit at
one of its existing NPPs.
29CEO Letter
Report of the Supervisory Board
E.ON Stock
Strategy and Objectives
Combined Group Management Report
Combined Non-Financial Report
Consolidated Financial Statements
Further Information
Acquisitions, Disposals, and Discontinued Operations in 2018We executed the following significant transactions in 2018.
Note 4 to the Consolidated Financial Statements contains
detailed information about them:
• Reclassification of substantially all of our Renewables
segment as discontinued operations in conjunction with
the planned transaction with RWE
• Sale of our 46.65-percent Uniper stake
• Sale of E.ON Gas Sverige
• Sale of Hamburg Netz.
Cash provided by investing activities of continuing operations
includes cash-effective disposal proceeds totaling €4,306 mil-
lion in 2018 (prior year: €750 million).
Earnings Situation
SalesWe recorded sales of €30.3 billion in 2018, €7.7 billion less
than the prior-year figure. The initial application of IFRS 15
reduced sales by €7.9 billion. Energy Networks’ sales declined
by €8.2 billion, primarily because of the aforementioned netting
effects in conjunction with IFRS 15 in Germany and the Czech
Republic and by the sale of gas operations in Sweden and Ger-
many. Customer Solutions’ sales rose by about €0.6 billion, in
particular owing to price increases and a weather-driven increase
in gas sales volume in the United Kingdom. Higher sales prices
in Sweden, Italy, and Hungary along with the transfer of the gas
business in Sweden from Energy Networks were also positive
factors. By contrast, sales were adversely affected by netting
effects pursuant to IFRS 15 in the Czech Republic and the expi-
ration of sales contracts to certain wholesale customers in Ger-
many that were transferred to Uniper. Renewables’ sales rose
by €150 million year on year, owing primarily to an increase in
owned generation. This was because in 2018 some wind farms
in the United States were, for the first time, operational for the
entire year and because a wind farm came online in the United
Kingdom. Sales at Non-Core Business declined by €186 million,
principally because of lower sales prices and the absence of one-
off items in conjunction with legal proceedings. Sales recorded
under Corporate Functions/Other resulted mainly from intra-
group IT, finance, and HR services. The decline relative to the
prior year is due in part to the expiration of a service contract
with Uniper.
Business Performance
E.ON’s operating business continued to deliver a positive per-
formance in 2018. Nevertheless, our sales of €30.3 billion were
€7.7 billion below the prior-year figure. The decline resulted
largely from changes in the accounting treatment of certain
renewables-support payments pursuant to IFRS 15, which was
applied for the first time in 2018. These payments are no longer
reported in full but rather are netted against the corresponding
costs of materials.
Adjusted EBIT for the E.ON Group declined by €0.1 billion to
€3 billion. Adjusted net income increased by about €0.1 billion
to €1.5 bllion. Adjusted EBIT and adjusted net income were
therefore at the upper end of our forecast range of €2.8 to
€3 billion and €1.3 to €1.5 billion, respectively. In addition,
our objective was to record a cash-conversion rate of at least
80 percent. Cash-conversion rate is equal to operating cash
flow before interest and taxes (€4.1 billion) divided by adjusted
EBITDA (roughly €4.8 billion). Our cash-conversion rate was
therefore 84 percent. Our ROCE was 10.4 percent, slightly higher
than our forecast of 8 to 10 percent.
Our investments of €3.5 billion were slightly above the prior-
year figure of €3.3 billion but below the €3.8 billion forecasted
for 2018. The deviation is principally attributable to changes in
project planning at our Customers Solutions and Renewables
segments.
Cash provided by operating activities of continuing and discon-
tinued operations of €2.9 billion was substantially above the
prior-year figure of -€3 billion, primarily because of our payment
into Germany’s public fund for nuclear-waste disposal in July
2017. The non-recurrence of the nuclear-fuel-tax refund recorded
in 2017 was an adverse factor.
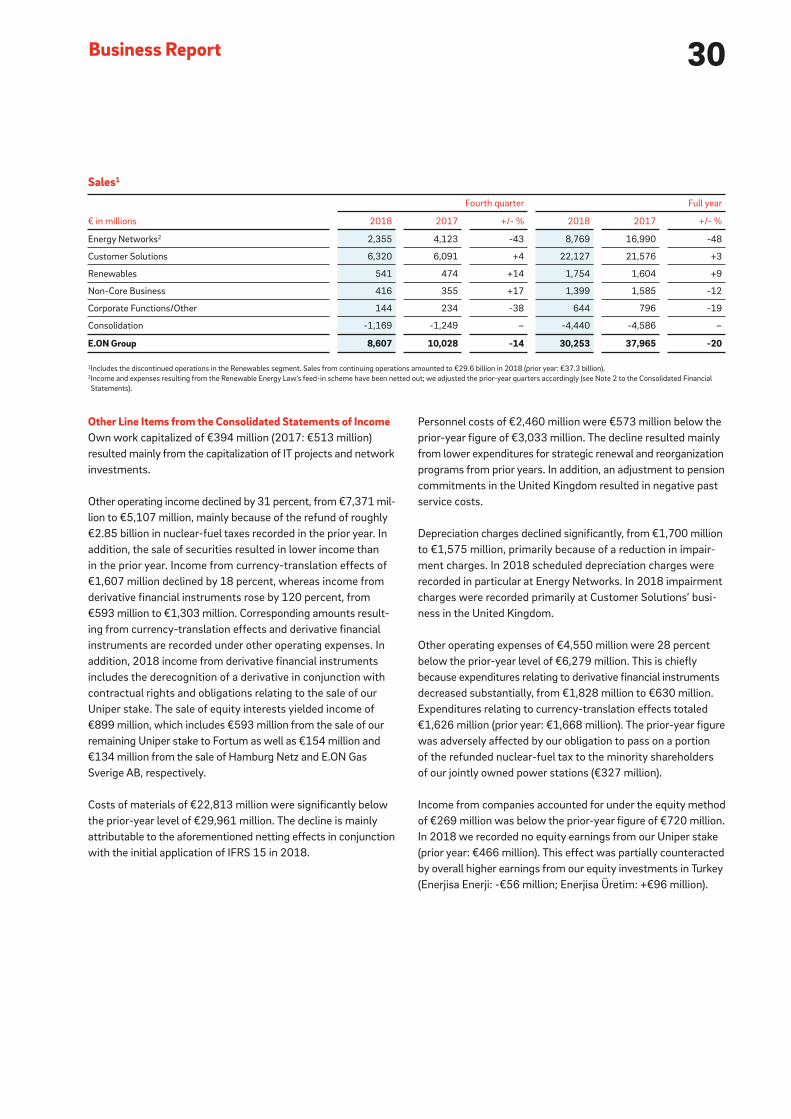
30Business Report
Personnel costs of €2,460 million were €573 million below the
prior-year figure of €3,033 million. The decline resulted mainly
from lower expenditures for strategic renewal and reorganization
programs from prior years. In addition, an adjustment to pension
commitments in the United Kingdom resulted in negative past
service costs.
Depreciation charges declined significantly, from €1,700 million
to €1,575 million, primarily because of a reduction in impair-
ment charges. In 2018 scheduled depreciation charges were
recorded in particular at Energy Networks. In 2018 impairment
charges were recorded primarily at Customer Solutions’ busi-
ness in the United Kingdom.
Other operating expenses of €4,550 million were 28 percent
below the prior-year level of €6,279 million. This is chiefly
because expenditures relating to derivative financial instruments
decreased substantially, from €1,828 million to €630 million.
Expenditures relating to currency-translation effects totaled
€1,626 million (prior year: €1,668 million). The prior-year figure
was adversely affected by our obligation to pass on a portion
of the refunded nuclear-fuel tax to the minority shareholders
of our jointly owned power stations (€327 million).
Income from companies accounted for under the equity method
of €269 million was below the prior-year figure of €720 million.
In 2018 we recorded no equity earnings from our Uniper stake
(prior year: €466 million). This effect was partially counteracted
by overall higher earnings from our equity investments in Turkey
(Enerjisa Enerji: -€56 million; Enerjisa Üretim: +€96 million).
Sales1
€ in millions
Fourth quarter Full year
2018 2017 +/- % 2018 2017 +/- %
Energy Networks2 2,355 4,123 -43 8,769 16,990 -48
Customer Solutions 6,320 6,091 +4 22,127 21,576 +3
Renewables 541 474 +14 1,754 1,604 +9
Non-Core Business 416 355 +17 1,399 1,585 -12
Corporate Functions/Other 144 234 -38 644 796 -19
Consolidation -1,169 -1,249 – -4,440 -4,586 –
E.ON Group 8,607 10,028 -14 30,253 37,965 -20
1Includes the discontinued operations in the Renewables segment. Sales from continuing operations amounted to €29.6 billion in 2018 (prior year: €37.3 billion).2Income and expenses resulting from the Renewable Energy Law’s feed-in scheme have been netted out; we adjusted the prior-year quarters accordingly (see Note 2 to the Consolidated Financial
Statements).
Other Line Items from the Consolidated Statements of IncomeOwn work capitalized of €394 million (2017: €513 million)
resulted mainly from the capitalization of IT projects and network
investments.
Other operating income declined by 31 percent, from €7,371 mil-
lion to €5,107 million, mainly because of the refund of roughly
€2.85 billion in nuclear-fuel taxes recorded in the prior year. In
addition, the sale of securities resulted in lower income than
in the prior year. Income from currency-translation effects of
€1,607 million declined by 18 percent, whereas income from
derivative financial instruments rose by 120 percent, from
€593 million to €1,303 million. Corresponding amounts result-
ing from currency-translation effects and derivative financial
instruments are recorded under other operating expenses. In
addition, 2018 income from derivative financial instruments
includes the derecognition of a derivative in conjunction with
contractual rights and obligations relating to the sale of our
Uniper stake. The sale of equity interests yielded income of
€899 million, which includes €593 million from the sale of our
remaining Uniper stake to Fortum as well as €154 million and
€134 million from the sale of Hamburg Netz and E.ON Gas
Sverige AB, respectively.
Costs of materials of €22,813 million were significantly below
the prior-year level of €29,961 million. The decline is mainly
attributable to the aforementioned netting effects in conjunction
with the initial application of IFRS 15 in 2018.
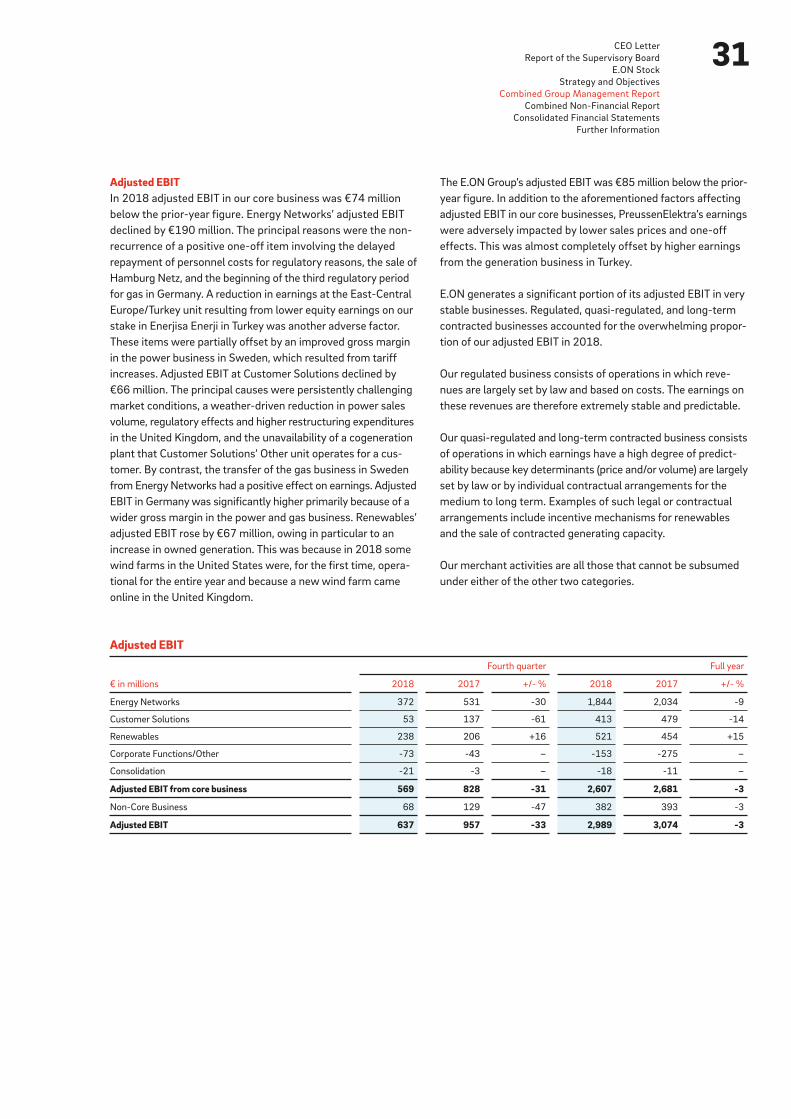
31CEO Letter
Report of the Supervisory Board
E.ON Stock
Strategy and Objectives
Combined Group Management Report
Combined Non-Financial Report
Consolidated Financial Statements
Further Information
The E.ON Group’s adjusted EBIT was €85 million below the prior-
year figure. In addition to the aforementioned factors affecting
adjusted EBIT in our core businesses, PreussenElektra’s earnings
were adversely impacted by lower sales prices and one-off
effects. This was almost completely offset by higher earnings
from the generation business in Turkey.
E.ON generates a significant portion of its adjusted EBIT in very
stable businesses. Regulated, quasi-regulated, and long-term
contracted businesses accounted for the overwhelming propor-
tion of our adjusted EBIT in 2018.
Our regulated business consists of operations in which reve-
nues are largely set by law and based on costs. The earnings on
these revenues are therefore extremely stable and predictable.
Our quasi-regulated and long-term contracted business consists
of operations in which earnings have a high degree of predict-
ability because key determinants (price and/or volume) are largely
set by law or by individual contractual arrangements for the
medium to long term. Examples of such legal or contractual
arrangements include incentive mechanisms for renewables
and the sale of contracted generating capacity.
Our merchant activities are all those that cannot be subsumed
under either of the other two categories.
Adjusted EBITIn 2018 adjusted EBIT in our core business was €74 million
below the prior-year figure. Energy Networks’ adjusted EBIT
declined by €190 million. The principal reasons were the non-
recurrence of a positive one-off item involving the delayed
repayment of personnel costs for regulatory reasons, the sale of
Hamburg Netz, and the beginning of the third regulatory period
for gas in Germany. A reduction in earnings at the East-Central
Europe/Turkey unit resulting from lower equity earnings on our
stake in Enerjisa Enerji in Turkey was another adverse factor.
These items were partially offset by an improved gross margin
in the power business in Sweden, which resulted from tariff
increases. Adjusted EBIT at Customer Solutions declined by
€66 million. The principal causes were persistently challenging
market conditions, a weather-driven reduction in power sales
volume, regulatory effects and higher restructuring expenditures
in the United Kingdom, and the unavailability of a cogeneration
plant that Customer Solutions’ Other unit operates for a cus-
tomer. By contrast, the transfer of the gas business in Sweden
from Energy Networks had a positive effect on earnings. Adjusted
EBIT in Germany was significantly higher primarily because of a
wider gross margin in the power and gas business. Renewables’
adjusted EBIT rose by €67 million, owing in particular to an
increase in owned generation. This was because in 2018 some
wind farms in the United States were, for the first time, opera-
tional for the entire year and because a new wind farm came
online in the United Kingdom.
Adjusted EBIT
€ in millions
Fourth quarter Full year
2018 2017 +/- % 2018 2017 +/- %
Energy Networks 372 531 -30 1,844 2,034 -9
Customer Solutions 53 137 -61 413 479 -14
Renewables 238 206 +16 521 454 +15
Corporate Functions/Other -73 -43 – -153 -275 –
Consolidation -21 -3 – -18 -11 –
Adjusted EBIT from core business 569 828 -31 2,607 2,681 -3
Non-Core Business 68 129 -47 382 393 -3
Adjusted EBIT 637 957 -33 2,989 3,074 -3
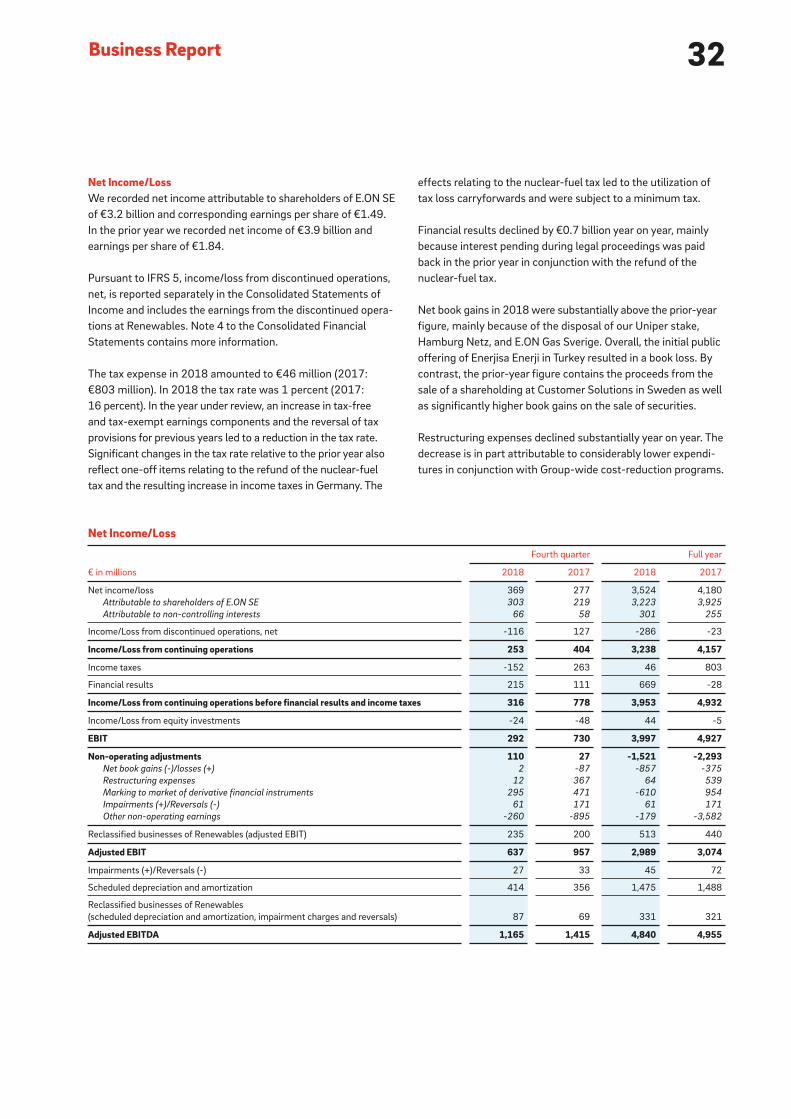
32Business Report
Net Income/LossWe recorded net income attributable to shareholders of E.ON SE
of €3.2 billion and corresponding earnings per share of €1.49.
In the prior year we recorded net income of €3.9 billion and
earnings per share of €1.84.
Pursuant to IFRS 5, income/loss from discontinued operations,
net, is reported separately in the Consolidated Statements of
Income and includes the earnings from the discontinued opera-
tions at Renewables. Note 4 to the Consolidated Financial
Statements contains more information.
The tax expense in 2018 amounted to €46 million (2017:
€803 million). In 2018 the tax rate was 1 percent (2017:
16 percent). In the year under review, an increase in tax-free
and tax-exempt earnings components and the reversal of tax
provisions for previous years led to a reduction in the tax rate.
Significant changes in the tax rate relative to the prior year also
reflect one-off items relating to the refund of the nuclear-fuel
tax and the resulting increase in income taxes in Germany. The
effects relating to the nuclear-fuel tax led to the utilization of
tax loss carryforwards and were subject to a minimum tax.
Financial results declined by €0.7 billion year on year, mainly
because interest pending during legal proceedings was paid
back in the prior year in conjunction with the refund of the
nuclear-fuel tax.
Net book gains in 2018 were substantially above the prior-year
figure, mainly because of the disposal of our Uniper stake,
Hamburg Netz, and E.ON Gas Sverige. Overall, the initial public
offering of Enerjisa Enerji in Turkey resulted in a book loss. By
contrast, the prior-year figure contains the proceeds from the
sale of a shareholding at Customer Solutions in Sweden as well
as significantly higher book gains on the sale of securities.
Restructuring expenses declined substantially year on year. The
decrease is in part attributable to considerably lower expendi-
tures in conjunction with Group-wide cost-reduction programs.
Net Income/Loss
€ in millions
Fourth quarter Full year
2018 2017 2018 2017
Net income/loss 369 277 3,524 4,180
Attributable to shareholders of E.ON SE 303 219 3,223 3,925
Attributable to non-controlling interests 66 58 301 255
Income/Loss from discontinued operations, net -116 127 -286 -23
Income/Loss from continuing operations 253 404 3,238 4,157
Income taxes -152 263 46 803
Financial results 215 111 669 -28
Income/Loss from continuing operations before financial results and income taxes 316 778 3,953 4,932
Income/Loss from equity investments -24 -48 44 -5
EBIT 292 730 3,997 4,927
Non-operating adjustments 110 27 -1,521 -2,293Net book gains (-)/losses (+) 2 -87 -857 -375
Restructuring expenses 12 367 64 539
Marking to market of derivative financial instruments 295 471 -610 954
Impairments (+)/Reversals (-) 61 171 61 171
Other non-operating earnings -260 -895 -179 -3,582
Reclassified businesses of Renewables (adjusted EBIT) 235 200 513 440
Adjusted EBIT 637 957 2,989 3,074
Impairments (+)/Reversals (-) 27 33 45 72
Scheduled depreciation and amortization 414 356 1,475 1,488
Reclassified businesses of Renewables
(scheduled depreciation and amortization, impairment charges and reversals) 87 69 331 321
Adjusted EBITDA 1,165 1,415 4,840 4,955
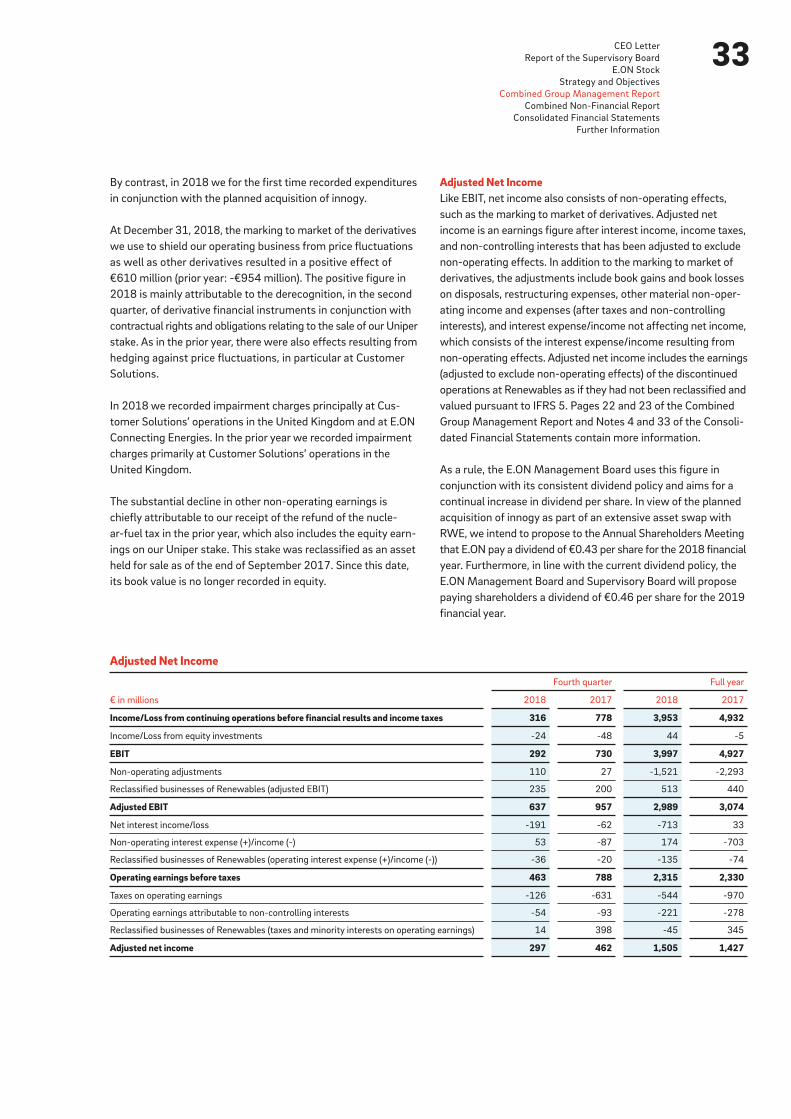
33CEO Letter
Report of the Supervisory Board
E.ON Stock
Strategy and Objectives
Combined Group Management Report
Combined Non-Financial Report
Consolidated Financial Statements
Further Information
By contrast, in 2018 we for the first time recorded expenditures
in conjunction with the planned acquisition of innogy.
At December 31, 2018, the marking to market of the derivatives
we use to shield our operating business from price fluctuations
as well as other derivatives resulted in a positive effect of
€610 million (prior year: -€954 million). The positive figure in
2018 is mainly attributable to the derecognition, in the second
quarter, of derivative financial instruments in conjunction with
contractual rights and obligations relating to the sale of our Uniper
stake. As in the prior year, there were also effects resulting from
hedging against price fluctuations, in particular at Customer
Solutions.
In 2018 we recorded impairment charges principally at Cus-
tomer Solutions’ operations in the United Kingdom and at E.ON
Connecting Energies. In the prior year we recorded impairment
charges primarily at Customer Solutions’ operations in the
United Kingdom.
The substantial decline in other non-operating earnings is
chiefly attributable to our receipt of the refund of the nucle-
ar-fuel tax in the prior year, which also includes the equity earn-
ings on our Uniper stake. This stake was reclassified as an asset
held for sale as of the end of September 2017. Since this date,
its book value is no longer recorded in equity.
Adjusted Net IncomeLike EBIT, net income also consists of non-operating effects,
such as the marking to market of derivatives. Adjusted net
income is an earnings figure after interest income, income taxes,
and non-controlling interests that has been adjusted to exclude
non-operating effects. In addition to the marking to market of
derivatives, the adjustments include book gains and book losses
on disposals, restructuring expenses, other material non-oper-
ating income and expenses (after taxes and non-controlling
interests), and interest expense/income not affecting net income,
which consists of the interest expense/income resulting from
non-operating effects. Adjusted net income includes the earnings
(adjusted to exclude non-operating effects) of the discontinued
operations at Renewables as if they had not been reclassified and
valued pursuant to IFRS 5. Pages 22 and 23 of the Combined
Group Management Report and Notes 4 and 33 of the Consoli-
dated Financial Statements contain more information.
As a rule, the E.ON Management Board uses this figure in
conjunction with its consistent dividend policy and aims for a
continual increase in dividend per share. In view of the planned
acquisition of innogy as part of an extensive asset swap with
RWE, we intend to propose to the Annual Shareholders Meeting
that E.ON pay a dividend of €0.43 per share for the 2018 financial
year. Furthermore, in line with the current dividend policy, the
E.ON Management Board and Supervisory Board will propose
paying shareholders a dividend of €0.46 per share for the 2019
financial year.
Adjusted Net Income
€ in millions
Fourth quarter Full year
2018 2017 2018 2017
Income/Loss from continuing operations before financial results and income taxes 316 778 3,953 4,932
Income/Loss from equity investments -24 -48 44 -5
EBIT 292 730 3,997 4,927
Non-operating adjustments 110 27 -1,521 -2,293
Reclassified businesses of Renewables (adjusted EBIT) 235 200 513 440
Adjusted EBIT 637 957 2,989 3,074
Net interest income/loss -191 -62 -713 33
Non-operating interest expense (+)/income (-) 53 -87 174 -703
Reclassified businesses of Renewables (operating interest expense (+)/income (-)) -36 -20 -135 -74
Operating earnings before taxes 463 788 2,315 2,330
Taxes on operating earnings -126 -631 -544 -970
Operating earnings attributable to non-controlling interests -54 -93 -221 -278
Reclassified businesses of Renewables (taxes and minority interests on operating earnings) 14 398 -45 345
Adjusted net income 297 462 1,505 1,427
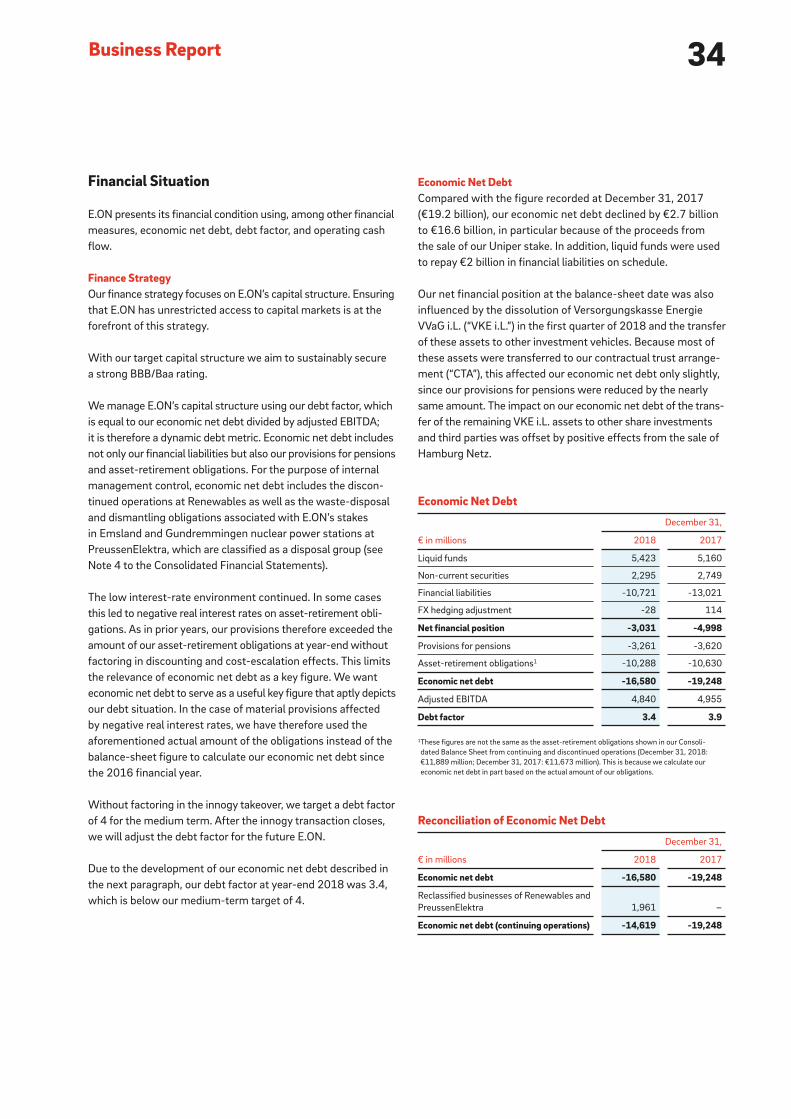
34Business Report
Financial Situation
E.ON presents its financial condition using, among other financial
measures, economic net debt, debt factor, and operating cash
flow.
Finance StrategyOur finance strategy focuses on E.ON’s capital structure. Ensuring
that E.ON has unrestricted access to capital markets is at the
forefront of this strategy.
With our target capital structure we aim to sustainably secure
a strong BBB/Baa rating.
We manage E.ON’s capital structure using our debt factor, which
is equal to our economic net debt divided by adjusted EBITDA;
it is therefore a dynamic debt metric. Economic net debt includes
not only our financial liabilities but also our provisions for pensions
and asset-retirement obligations. For the purpose of internal
management control, economic net debt includes the discon-
tinued operations at Renewables as well as the waste- disposal
and dismantling obligations associated with E.ON’s stakes
in Emsland and Gundremmingen nuclear power stations at
PreussenElektra, which are classified as a disposal group (see
Note 4 to the Consolidated Financial Statements).
The low interest-rate environment continued. In some cases
this led to negative real interest rates on asset-retirement obli-
gations. As in prior years, our provisions therefore exceeded the
amount of our asset-retirement obligations at year-end without
factoring in discounting and cost-escalation effects. This limits
the relevance of economic net debt as a key figure. We want
economic net debt to serve as a useful key figure that aptly depicts
our debt situation. In the case of material provisions affected
by negative real interest rates, we have therefore used the
aforementioned actual amount of the obligations instead of the
balance-sheet figure to calculate our economic net debt since
the 2016 financial year.
Without factoring in the innogy takeover, we target a debt factor
of 4 for the medium term. After the innogy transaction closes,
we will adjust the debt factor for the future E.ON.
Due to the development of our economic net debt described in
the next paragraph, our debt factor at year-end 2018 was 3.4,
which is below our medium-term target of 4.
Economic Net DebtCompared with the figure recorded at December 31, 2017
(€19.2 billion), our economic net debt declined by €2.7 billion
to €16.6 billion, in particular because of the proceeds from
the sale of our Uniper stake. In addition, liquid funds were used
to repay €2 billion in financial liabilities on schedule.
Our net financial position at the balance-sheet date was also
influenced by the dissolution of Versorgungskasse Energie
VVaG i.L. (“VKE i.L.”) in the first quarter of 2018 and the transfer
of these assets to other investment vehicles. Because most of
these assets were transferred to our contractual trust arrange-
ment (“CTA”), this affected our economic net debt only slightly,
since our provisions for pensions were reduced by the nearly
same amount. The impact on our economic net debt of the trans-
fer of the remaining VKE i.L. assets to other share investments
and third parties was offset by positive effects from the sale of
Hamburg Netz.
Economic Net Debt
€ in millions
December 31,
2018 2017
Liquid funds 5,423 5,160
Non-current securities 2,295 2,749
Financial liabilities -10,721 -13,021
FX hedging adjustment -28 114
Net financial position -3,031 -4,998
Provisions for pensions -3,261 -3,620
Asset-retirement obligations1 -10,288 -10,630
Economic net debt -16,580 -19,248
Adjusted EBITDA 4,840 4,955
Debt factor 3.4 3.9
1These figures are not the same as the asset-retirement obligations shown in our Consoli-
dated Balance Sheet from continuing and discontinued operations (December 31, 2018:
€11,889 million; December 31, 2017: €11,673 million). This is because we calculate our
economic net debt in part based on the actual amount of our obligations.
Reconciliation of Economic Net Debt
€ in millions
December 31,
2018 2017
Economic net debt -16,580 -19,248
Reclassified businesses of Renewables and
PreussenElektra 1,961 –
Economic net debt (continuing operations) -14,619 -19,248
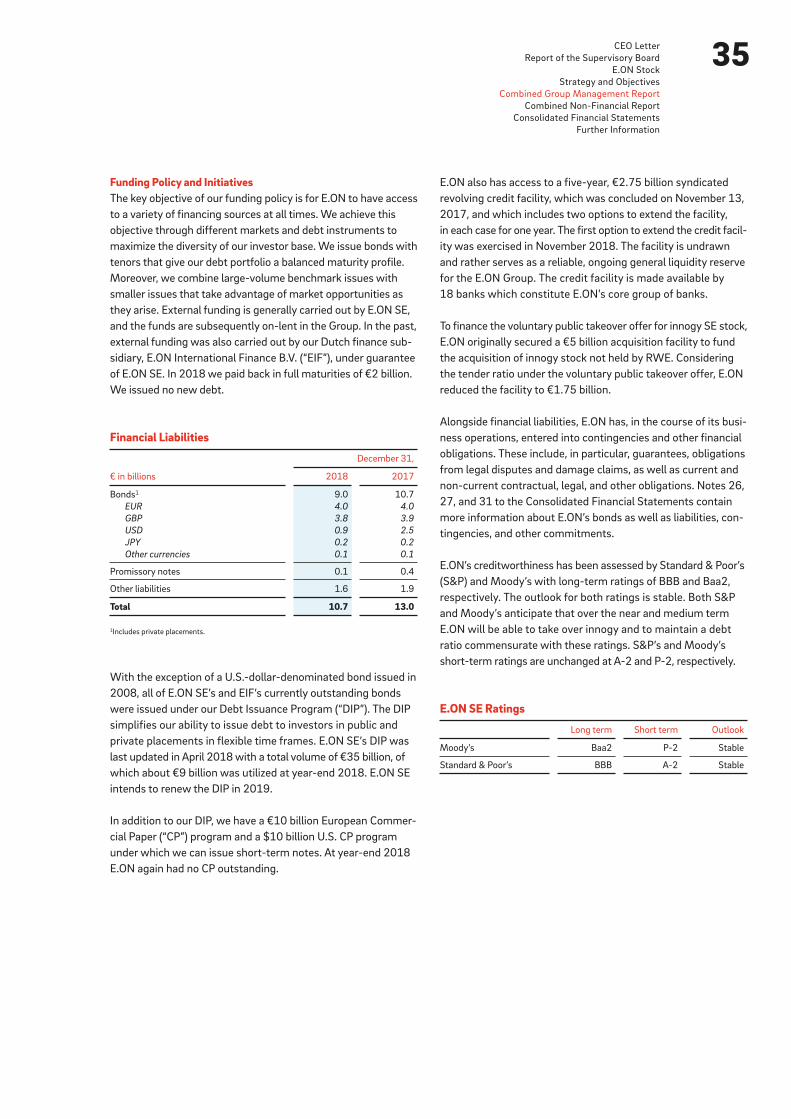
35CEO Letter
Report of the Supervisory Board
E.ON Stock
Strategy and Objectives
Combined Group Management Report
Combined Non-Financial Report
Consolidated Financial Statements
Further Information
E.ON also has access to a five-year, €2.75 billion syndicated
revolving credit facility, which was concluded on November 13,
2017, and which includes two options to extend the facility,
in each case for one year. The first option to extend the credit facil-
ity was exercised in November 2018. The facility is undrawn
and rather serves as a reliable, ongoing general liquidity reserve
for the E.ON Group. The credit facility is made available by
18 banks which constitute E.ON’s core group of banks.
To finance the voluntary public takeover offer for innogy SE stock,
E.ON originally secured a €5 billion acquisition facility to fund
the acquisition of innogy stock not held by RWE. Considering
the tender ratio under the voluntary public takeover offer, E.ON
reduced the facility to €1.75 billion.
Alongside financial liabilities, E.ON has, in the course of its busi-
ness operations, entered into contingencies and other financial
obligations. These include, in particular, guarantees, obligations
from legal disputes and damage claims, as well as current and
non-current contractual, legal, and other obligations. Notes 26,
27, and 31 to the Consolidated Financial Statements contain
more information about E.ON’s bonds as well as liabilities, con-
tingencies, and other commitments.
E.ON’s creditworthiness has been assessed by Standard & Poor’s
(S&P) and Moody’s with long-term ratings of BBB and Baa2,
respectively. The outlook for both ratings is stable. Both S&P
and Moody’s anticipate that over the near and medium term
E.ON will be able to take over innogy and to maintain a debt
ratio commensurate with these ratings. S&P’s and Moody’s
short-term ratings are unchanged at A-2 and P-2, respectively.
E.ON SE Ratings
Long term Short term Outlook
Moody’s Baa2 P-2 Stable
Standard & Poor’s BBB A-2 Stable
Funding Policy and InitiativesThe key objective of our funding policy is for E.ON to have access
to a variety of financing sources at all times. We achieve this
objective through different markets and debt instruments to
maximize the diversity of our investor base. We issue bonds with
tenors that give our debt portfolio a balanced maturity profile.
Moreover, we combine large-volume benchmark issues with
smaller issues that take advantage of market opportunities as
they arise. External funding is generally carried out by E.ON SE,
and the funds are subsequently on-lent in the Group. In the past,
external funding was also carried out by our Dutch finance sub-
sidiary, E.ON International Finance B.V. (“EIF”), under guarantee
of E.ON SE. In 2018 we paid back in full maturities of €2 billion.
We issued no new debt.
With the exception of a U.S.-dollar-denominated bond issued in
2008, all of E.ON SE’s and EIF’s currently outstanding bonds
were issued under our Debt Issuance Program (“DIP”). The DIP
simplifies our ability to issue debt to investors in public and
private placements in flexible time frames. E.ON SE’s DIP was
last updated in April 2018 with a total volume of €35 billion, of
which about €9 billion was utilized at year-end 2018. E.ON SE
intends to renew the DIP in 2019.
In addition to our DIP, we have a €10 billion European Commer-
cial Paper (“CP”) program and a $10 billion U.S. CP program
under which we can issue short-term notes. At year-end 2018
E.ON again had no CP outstanding.
Financial Liabilities
€ in billions
December 31,
2018 2017
Bonds1 9.0 10.7
EUR 4.0 4.0
GBP 3.8 3.9
USD 0.9 2.5
JPY 0.2 0.2
Other currencies 0.1 0.1
Promissory notes 0.1 0.4
Other liabilities 1.6 1.9
Total 10.7 13.0
1Includes private placements.
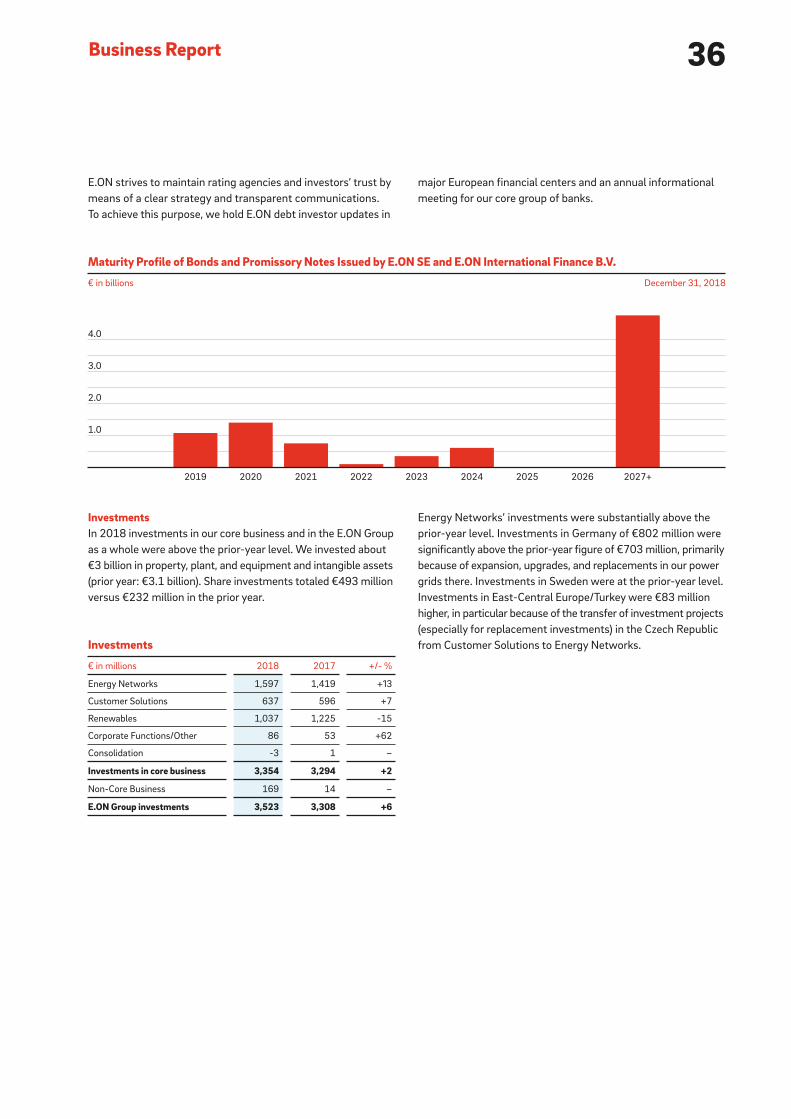
36Business Report
InvestmentsIn 2018 investments in our core business and in the E.ON Group
as a whole were above the prior-year level. We invested about
€3 billion in property, plant, and equipment and intangible assets
(prior year: €3.1 billion). Share investments totaled €493 million
versus €232 million in the prior year.
Investments
€ in millions 2018 2017 +/- %
Energy Networks 1,597 1,419 +13
Customer Solutions 637 596 +7
Renewables 1,037 1,225 -15
Corporate Functions/Other 86 53 +62
Consolidation -3 1 –
Investments in core business 3,354 3,294 +2
Non-Core Business 169 14 –
E.ON Group investments 3,523 3,308 +6
Energy Networks’ investments were substantially above the
prior-year level. Investments in Germany of €802 million were
significantly above the prior-year figure of €703 million, primarily
because of expansion, upgrades, and replacements in our power
grids there. Investments in Sweden were at the prior- year level.
Investments in East-Central Europe/Turkey were €83 million
higher, in particular because of the transfer of investment projects
(especially for replacement investments) in the Czech Republic
from Customer Solutions to Energy Networks.
4.0
3.0
2.0
1.0
2019 2020 2021 2022 2023 2024 2025 2026 2027+
Maturity Profile of Bonds and Promissory Notes Issued by E.ON SE and E.ON International Finance B.V.
€ in billions December 31, 2018
E.ON strives to maintain rating agencies and investors’ trust by
means of a clear strategy and transparent communications.
To achieve this purpose, we hold E.ON debt investor updates in
major European financial centers and an annual informational
meeting for our core group of banks.
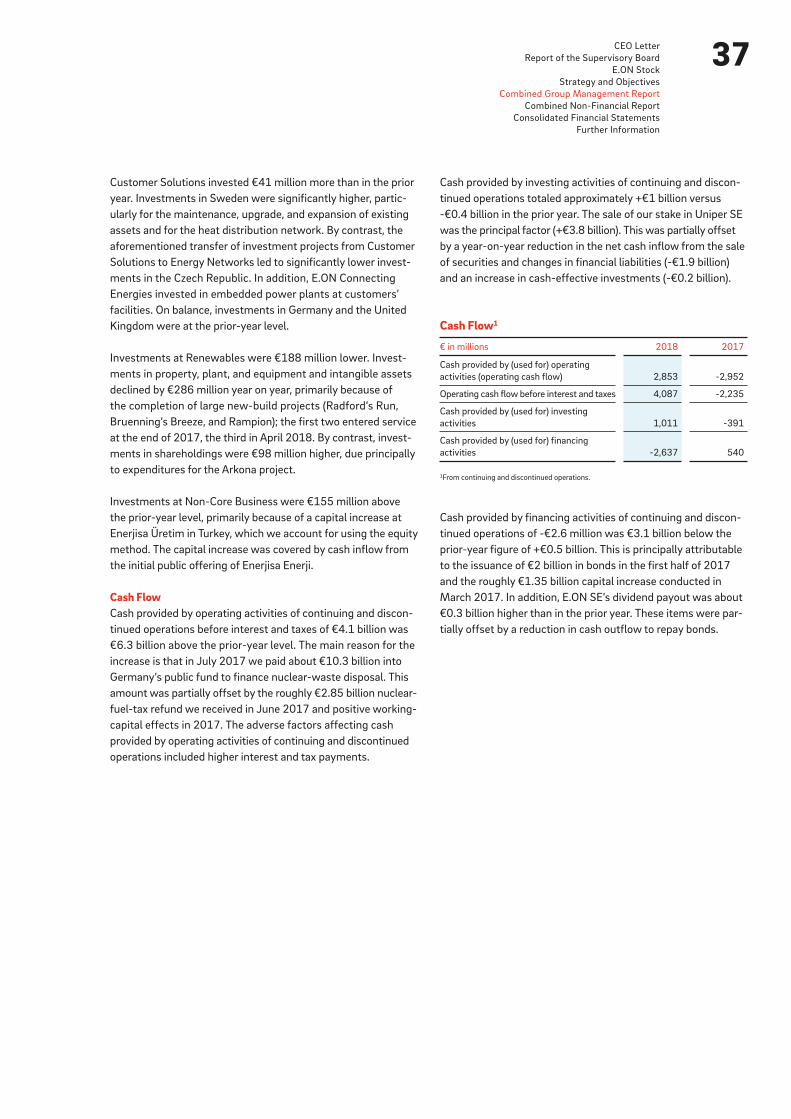
37CEO Letter
Report of the Supervisory Board
E.ON Stock
Strategy and Objectives
Combined Group Management Report
Combined Non-Financial Report
Consolidated Financial Statements
Further Information
Cash provided by investing activities of continuing and discon-
tinued operations totaled approximately +€1 billion versus
-€0.4 billion in the prior year. The sale of our stake in Uniper SE
was the principal factor (+€3.8 billion). This was partially offset
by a year-on-year reduction in the net cash inflow from the sale
of securities and changes in financial liabilities (-€1.9 billion)
and an increase in cash-effective investments (-€0.2 billion).
Cash provided by financing activities of continuing and discon-
tinued operations of -€2.6 million was €3.1 billion below the
prior-year figure of +€0.5 billion. This is principally attributable
to the issuance of €2 billion in bonds in the first half of 2017
and the roughly €1.35 billion capital increase conducted in
March 2017. In addition, E.ON SE’s dividend payout was about
€0.3 billion higher than in the prior year. These items were par-
tially offset by a reduction in cash outflow to repay bonds.
Cash Flow1
€ in millions 2018 2017
Cash provided by (used for) operating
activities (operating cash flow) 2,853 -2,952
Operating cash flow before interest and taxes 4,087 -2,235
Cash provided by (used for) investing
activities 1,011 -391
Cash provided by (used for) financing
activities -2,637 540
1From continuing and discontinued operations.
Customer Solutions invested €41 million more than in the prior
year. Investments in Sweden were significantly higher, partic-
ularly for the maintenance, upgrade, and expansion of existing
assets and for the heat distribution network. By contrast, the
aforementioned transfer of investment projects from Customer
Solutions to Energy Networks led to significantly lower invest-
ments in the Czech Republic. In addition, E.ON Connecting
Energies invested in embedded power plants at customers’
facilities. On balance, investments in Germany and the United
Kingdom were at the prior-year level.
Investments at Renewables were €188 million lower. Invest-
ments in property, plant, and equipment and intangible assets
declined by €286 million year on year, primarily because of
the completion of large new-build projects (Radford’s Run,
Bruenning’s Breeze, and Rampion); the first two entered service
at the end of 2017, the third in April 2018. By contrast, invest-
ments in shareholdings were €98 million higher, due principally
to expenditures for the Arkona project.
Investments at Non-Core Business were €155 million above
the prior-year level, primarily because of a capital increase at
Enerjisa Üretim in Turkey, which we account for using the equity
method. The capital increase was covered by cash inflow from
the initial public offering of Enerjisa Enerji.
Cash FlowCash provided by operating activities of continuing and discon-
tinued operations before interest and taxes of €4.1 billion was
€6.3 billion above the prior-year level. The main reason for the
increase is that in July 2017 we paid about €10.3 billion into
Germany’s public fund to finance nuclear-waste disposal. This
amount was partially offset by the roughly €2.85 billion nuclear-
fuel-tax refund we received in June 2017 and positive working-
capital effects in 2017. The adverse factors affecting cash
provided by operating activities of continuing and discontinued
operations included higher interest and tax payments.
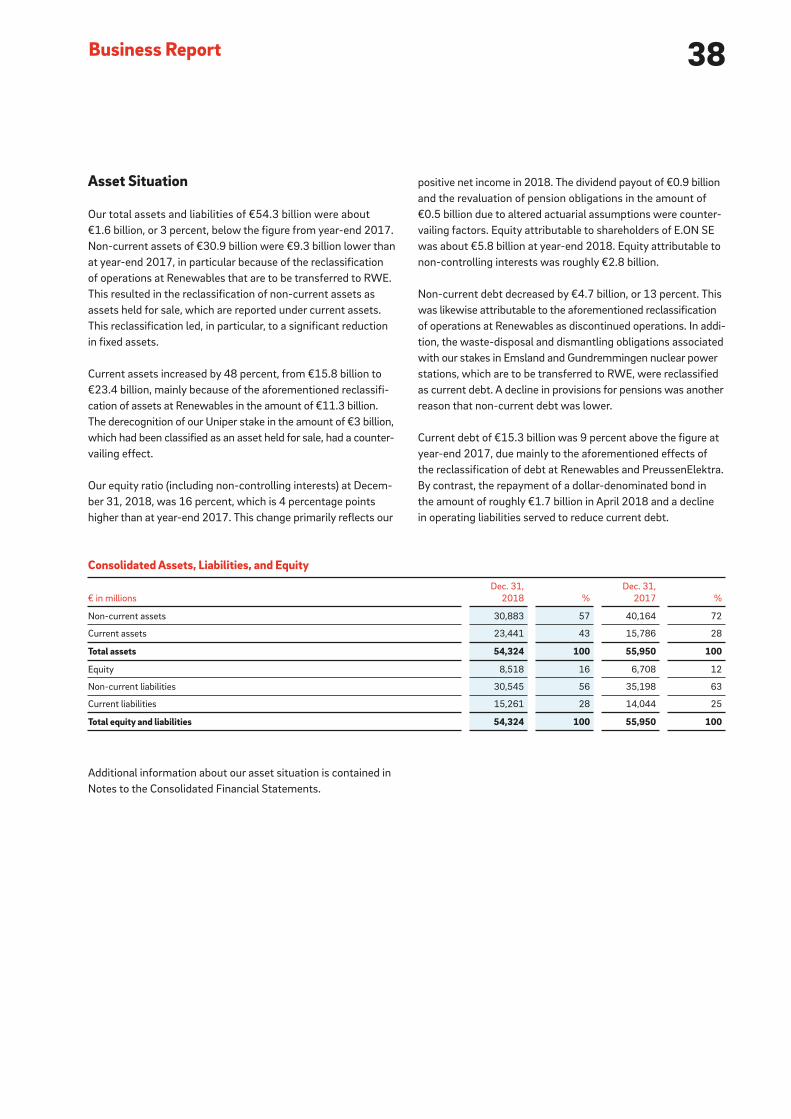
38Business Report
Asset Situation
Our total assets and liabilities of €54.3 billion were about
€1.6 billion, or 3 percent, below the figure from year-end 2017.
Non-current assets of €30.9 billion were €9.3 billion lower than
at year-end 2017, in particular because of the reclassification
of operations at Renewables that are to be transferred to RWE.
This resulted in the reclassification of non-current assets as
assets held for sale, which are reported under current assets.
This reclassification led, in particular, to a significant reduction
in fixed assets.
Current assets increased by 48 percent, from €15.8 billion to
€23.4 billion, mainly because of the aforementioned reclassifi-
cation of assets at Renewables in the amount of €11.3 billion.
The derecognition of our Uniper stake in the amount of €3 billion,
which had been classified as an asset held for sale, had a counter-
vailing effect.
Our equity ratio (including non-controlling interests) at Decem-
ber 31, 2018, was 16 percent, which is 4 percentage points
higher than at year-end 2017. This change primarily reflects our
positive net income in 2018. The dividend payout of €0.9 billion
and the revaluation of pension obligations in the amount of
€0.5 billion due to altered actuarial assumptions were counter-
vailing factors. Equity attributable to shareholders of E.ON SE
was about €5.8 billion at year-end 2018. Equity attributable to
non-controlling interests was roughly €2.8 billion.
Non-current debt decreased by €4.7 billion, or 13 percent. This
was likewise attributable to the aforementioned reclassification
of operations at Renewables as discontinued operations. In addi-
tion, the waste-disposal and dismantling obligations associated
with our stakes in Emsland and Gundremmingen nuclear power
stations, which are to be transferred to RWE, were reclassified
as current debt. A decline in provisions for pensions was another
reason that non-current debt was lower.
Current debt of €15.3 billion was 9 percent above the figure at
year-end 2017, due mainly to the aforementioned effects of
the reclassification of debt at Renewables and PreussenElektra.
By contrast, the repayment of a dollar-denominated bond in
the amount of roughly €1.7 billion in April 2018 and a decline
in operating liabilities served to reduce current debt.
Consolidated Assets, Liabilities, and Equity
€ in millions
Dec. 31,
2018 %
Dec. 31,
2017 %
Non-current assets 30,883 57 40,164 72
Current assets 23,441 43 15,786 28
Total assets 54,324 100 55,950 100
Equity 8,518 16 6,708 12
Non-current liabilities 30,545 56 35,198 63
Current liabilities 15,261 28 14,044 25
Total equity and liabilities 54,324 100 55,950 100
Additional information about our asset situation is contained in
Notes to the Consolidated Financial Statements.

39CEO Letter
Report of the Supervisory Board
E.ON Stock
Strategy and Objectives
Combined Group Management Report
Combined Non-Financial Report
Consolidated Financial Statements
Further Information
E.ON SE is the parent company of the E.ON Group. As such, its
earnings, financial, and asset situation is affected by income
from equity interests. The positive figure recorded for this item
in 2018 reflects, in particular, the in-phase distribution of net
income available for distribution from E.ON Beteiligungen
GmbH resulting from the release of capital reserves, of which
€2,320 million was recorded in earnings, and a profit transfer
of €725 million from E.ON Beteiligungen GmbH. The primary
countervailing factors were the expenditures from loss trans-
fers of €1,017 million from E.ON Finanzanlagen GmbH and of
€787 million from E.ON US Holding GmbH.
The change in liabilities resulted mainly from the aforementioned
distribution of net profit from E.ON Beteiligungen GmbH, as well
as, by contrast, from the sale of Uniper stock to energy company
Fortum Corporation, Espoo, Finland, by E.ON Beteiligungen GmbH
in June 2018 (€3.8 billion). Due to cash pooling, this led to an
increase in intragroup liabilities. Considering these items as well
as the repayment of mature bonds and the €650 million dividend
payout, on balance liquid funds increased by €1,016 million.
In addition, the aforementioned repayment of €755 million in
bonds and the €3,480 million of the distribution of net income
from E.ON Beteiligungen GmbH that was not recorded in earn-
ings were the main factors in the reduction in financial assets.
The change in equity results from net income and the divided
payout in 2018.
Information on treasury shares can be found in Note 19 to the
Consolidated Financial Statements.
E.ON SE’s Earnings, Financial, and Asset Situation
E.ON SE prepares its Financial Statements in accordance with
the German Commercial Code, the SE Ordinance (in conjunction
with the German Stock Corporation Act), and the Electricity and
Gas Supply Act (Energy Industry Act).
Balance Sheet of E.ON SE (Summary)
€ in millions
December 31,
2018 2017
Intangible assets and property, plant, and
equipment 10 12
Financial assets 33,241 37,358
Non-current assets 33,251 37,370
Receivables from affiliated companies 7,472 7,697
Other receivables and assets 1,932 1,349
Liquid funds 3,041 2,025
Current assets 12,445 11,071
Accrued expenses 28 36
Asset surplus after offsetting of benefit
obligations – 1
Total assets 45,724 48,478
Equity 9,432 9,029
Provisions 1,480 2,127
Bonds 2,000 2,000
Liabilities to affiliated companies 32,456 34,350
Other liabilities 354 970
Deferred income 2 2
Total equity and liabilities 45,724 48,478

40Business Report
The increase in interest income/loss is primarily attributable to
the market-value adjustment carried out in the previous year,
which resulted from the intragroup restructuring of liabilites due
to the transfer of loans to E.ON Finanzholding SE & Co. KG.
The negative figure recorded under other expenditures and
income results primarily from expenditures of €171 million for
third-party services, personnel expenditures of €138 million,
net currency translation losses of €106 million, expenditures
of €93 million for consulting and auditing services, and income
of €271 million from a necessary adjustment for certain environ-
mental remediation obligations of predecessor entities.
Income Statement of E.ON SE (Summary)
€ in millions 2018 2017
Income from equity interests 1,171 4,676
Interest income/loss -140 -1,368
Other expenditures and income -225 -497
Taxes 247 -171
Net income 1,053 2,640
Net income transferred to retained earnings – -1,320
Net income available for distribution 1,053 1,320
The Company recorded total income taxes of roughly
€248 million (income) in 2018. Applying the minimum tax
rate resulted in corporate taxes of €14 million, a solidarity
surcharge of about €1 million, and trade taxes of €10 million in
2018. Tax income for previous years amounted to €273 million.
At the Annual Shareholders Meeting on May 14, 2019, manage-
ment will propose that net income available for distribution
be used to pay a dividend of €0.43 per ordinary share and the
remaining amount of €121 million to be brought forward as
retained earnings.
Management’s proposal for the use of net income available
fordistribution is based on the number of ordinary shares on
February 28, 2019, the date the Financial Statements of E.ON SE
were prepared.
Furthermore, in line with the current dividend policy, the E.ON
Management Board and Supervisory Board will propose paying
shareholders a dividend of €0.46 per share for the 2019 financial
year.
The complete Financial Statements of E.ON SE, with an unqual-
ified opinion issued by the auditor, PricewaterhouseCoopers
GmbH, Wirtschaftsprüfungsgesellschaft, Düsseldorf, will be
announced in the Bundesanzeiger. Copies are available on request
from E.ON SE and at www.eon.com.
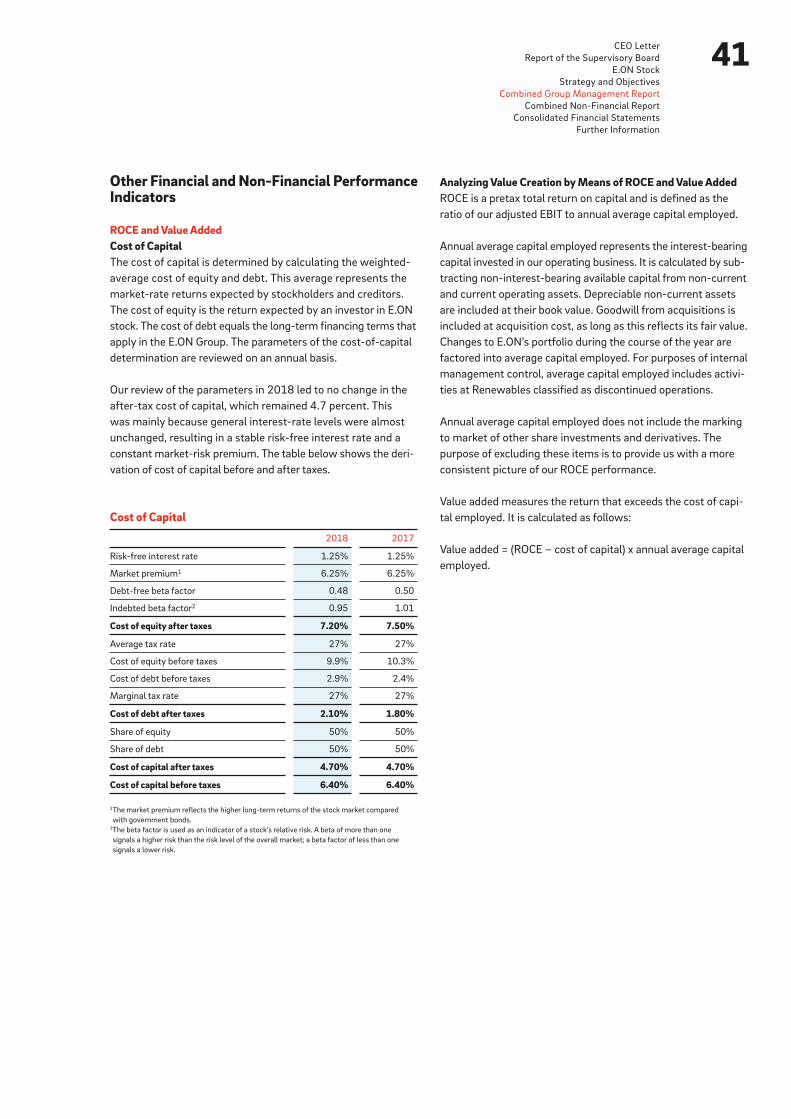
41CEO Letter
Report of the Supervisory Board
E.ON Stock
Strategy and Objectives
Combined Group Management Report
Combined Non-Financial Report
Consolidated Financial Statements
Further Information
Analyzing Value Creation by Means of ROCE and Value Added ROCE is a pretax total return on capital and is defined as the
ratio of our adjusted EBIT to annual average capital employed.
Annual average capital employed represents the interest-bearing
capital invested in our operating business. It is calculated by sub-
tracting non-interest-bearing available capital from non-current
and current operating assets. Depreciable non-current assets
are included at their book value. Goodwill from acquisitions is
included at acquisition cost, as long as this reflects its fair value.
Changes to E.ON’s portfolio during the course of the year are
factored into average capital employed. For purposes of internal
management control, average capital employed includes activi-
ties at Renewables classified as discontinued operations.
Annual average capital employed does not include the marking
to market of other share investments and derivatives. The
purpose of excluding these items is to provide us with a more
consistent picture of our ROCE performance.
Value added measures the return that exceeds the cost of capi-
tal employed. It is calculated as follows:
Value added = (ROCE – cost of capital) x annual average capital
employed.
Other Financial and Non-Financial Performance Indicators
ROCE and Value AddedCost of CapitalThe cost of capital is determined by calculating the weighted-
average cost of equity and debt. This average represents the
market-rate returns expected by stockholders and creditors.
The cost of equity is the return expected by an investor in E.ON
stock. The cost of debt equals the long-term financing terms that
apply in the E.ON Group. The parameters of the cost-of-capital
determination are reviewed on an annual basis.
Our review of the parameters in 2018 led to no change in the
after-tax cost of capital, which remained 4.7 percent. This
was mainly because general interest-rate levels were almost
unchanged, resulting in a stable risk-free interest rate and a
constant market-risk premium. The table below shows the deri-
vation of cost of capital before and after taxes.
Cost of Capital
2018 2017
Risk-free interest rate 1.25% 1.25%
Market premium1 6.25% 6.25%
Debt-free beta factor 0.48 0.50
Indebted beta factor2 0.95 1.01
Cost of equity after taxes 7.20% 7.50%
Average tax rate 27% 27%
Cost of equity before taxes 9.9% 10.3%
Cost of debt before taxes 2.9% 2.4%
Marginal tax rate 27% 27%
Cost of debt after taxes 2.10% 1.80%
Share of equity 50% 50%
Share of debt 50% 50%
Cost of capital after taxes 4.70% 4.70%
Cost of capital before taxes 6.40% 6.40%
1The market premium reflects the higher long-term returns of the stock market compared
with government bonds.2The beta factor is used as an indicator of a stock’s relative risk. A beta of more than one
signals a higher risk than the risk level of the overall market; a beta factor of less than one
signals a lower risk.
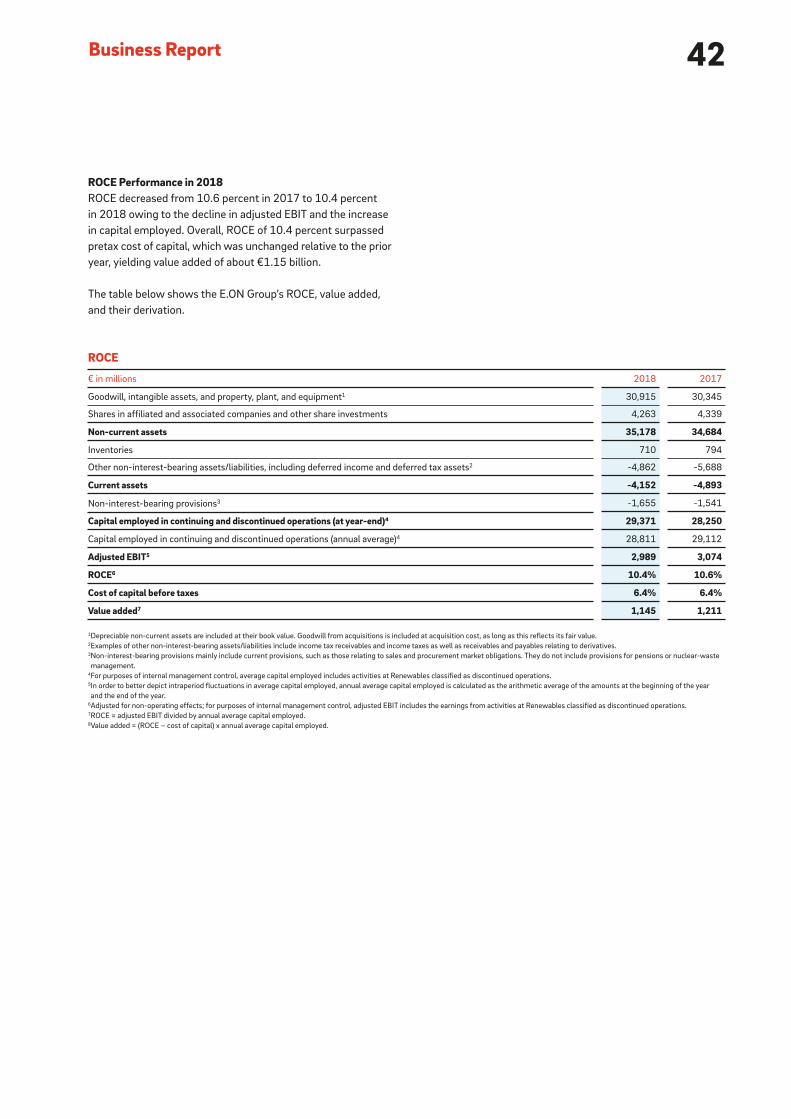
42Business Report
ROCE Performance in 2018ROCE decreased from 10.6 percent in 2017 to 10.4 percent
in 2018 owing to the decline in adjusted EBIT and the increase
in capital employed. Overall, ROCE of 10.4 percent surpassed
pretax cost of capital, which was unchanged relative to the prior
year, yielding value added of about €1.15 billion.
The table below shows the E.ON Group’s ROCE, value added,
and their derivation.
ROCE
€ in millions 2018 2017
Goodwill, intangible assets, and property, plant, and equipment1 30,915 30,345
Shares in affiliated and associated companies and other share investments 4,263 4,339
Non-current assets 35,178 34,684
Inventories 710 794
Other non-interest-bearing assets/liabilities, including deferred income and deferred tax assets2 -4,862 -5,688
Current assets -4,152 -4,893
Non-interest-bearing provisions3 -1,655 -1,541
Capital employed in continuing and discontinued operations (at year-end)4 29,371 28,250
Capital employed in continuing and discontinued operations (annual average)4 28,811 29,112
Adjusted EBIT5 2,989 3,074
ROCE6 10.4% 10.6%
Cost of capital before taxes 6.4% 6.4%
Value added7 1,145 1,211
1Depreciable non-current assets are included at their book value. Goodwill from acquisitions is included at acquisition cost, as long as this reflects its fair value.2Examples of other non-interest-bearing assets/liabilities include income tax receivables and income taxes as well as receivables and payables relating to derivatives.3Non-interest-bearing provisions mainly include current provisions, such as those relating to sales and procurement market obligations. They do not include provisions for pensions or nuclear-waste
management.4For purposes of internal management control, average capital employed includes activities at Renewables classified as discontinued operations.5In order to better depict intraperiod fluctuations in average capital employed, annual average capital employed is calculated as the arithmetic average of the amounts at the beginning of the year
and the end of the year. 6Adjusted for non-operating effects; for purposes of internal management control, adjusted EBIT includes the earnings from activities at Renewables classified as discontinued operations.7ROCE = adjusted EBIT divided by annual average capital employed.8Value added = (ROCE – cost of capital) x annual average capital employed.

43CEO Letter
Report of the Supervisory Board
E.ON Stock
Strategy and Objectives
Combined Group Management Report
Combined Non-Financial Report
Consolidated Financial Statements
Further Information
EmployeesPeople StrategyWe developed our People Strategy to enable E.ON to maintain
continuity in times of change, regardless of how the organiza-
tion structures its business or how we adjust our strategic pri-
orities in order to meet customer needs.
The three focus areas of our People Strategy are: Preparing Our
People for the Future, Providing Opportunities, and Recognizing
Performance. In 2018 we continued to bring these focus areas
to life through a combination of local unit-level activity and
Group-wide projects:
• Continuing to implement [email protected], a Group-wide frame-
work for the personal and professional development of our
employees and managers (Preparing for the Future)
• Developing and rolling out a Group-wide employee value
proposition (Providing Opportunities)
• Embedding YES! Awards, a way we recognize outstanding
achievements as they happen and further motivate employ-
ees (Recognizing Performance).
In addition, we continued the process of digitizing our HR offer-
ings. In particular, the basic components of [email protected] consist
of modern applications harnessing the potential of advanced IT
solutions, such as Cloud-based platforms that can be accessed
from anywhere.
Collaborative Partnership with Employee RepresentativesWorking with employee representatives as partners has a long
tradition at E.ON. This collaborative partnership is integral to
our corporate culture.
At a European level, E.ON management works closely together
with the SE Works Council of E.ON SE, which consists of repre-
sentatives from all European countries in which E.ON operates.
Under the SE Agreement, the SE Works Council of E.ON SE is
informed and consulted about issues that transcend national
borders. A special emphasis is placed on the early and open dis-
cussion of employee matters.
In 2014 management and the Group Works Council in Germany
concluded the Agreement on the Future Social Partnership. The
agreement stipulates key principles of the social partnership
between the Company and its employee representatives and
thus manifests a shared responsibility for the Company and its
employees. It has proven its worth and remains to this day the
foundation for a successful social partnership at E.ON.
Consequently, the mechanisms are in place for mutually trustful,
respectful, and transparent dialog between management and
employee representatives at a European and national level. For
the benefit of our employees and our company, management
and employee representatives’ shared objective is for this proven
collaborative partnership to continue and further develop in the
future.
innogy Integration and the Involvement of Employee RepresentativesSocial partnership is particularly important in times of change.
The planned integration of innogy into the E.ON Group also will
be conducted in a close, collaborative partnership between the
Company and its employee representatives. In July the E.ON
Management Board, the SE Works Council, and the Group Works
Council therefore concluded a Framework Agreement, which
applies to all E.ON companies in Europe.
In essence, the Framework Agreement provides that the close
cooperation and partnership which the Company and its employee
representatives have practiced for many years in Group-wide
transformation projects will be continued in the planned inte-
gration of innogy. In addition, the Agreement lays down key
principles for the social protection of employees affected by
changes. It also defines the key elements of a binding operational
framework for the future involvement of employee represen-
tatives and for change management related to the integration
process during the years ahead.
Specific points covered by the Agreement include:
• ensuring early and comprehensive transparency regarding
the project
• placing a strong and comprehensive focus on providing the
required training to employees
• mutually agreeing that management and employee repre-
sentatives will seek to reach consensus-based solutions to
necessary organizational changes
• taking into account the interests of severely disabled
employees when allocating jobs and filling positions

44Business Report
succession planning. Its management’s responsibilities include
ensuring that all new employees receive a company orientation
as well as training on essential topics like health and safety. For
this purpose, the units may use standardized E.ON e-learning
modules. These and other virtual learning tools as well as courses
and training programs are offered by the HR Business Solutions
team in Group HR. E-Learning is an effective, flexible, and up-to-
date way of delivering learning to our employees.
The Senior Vice President for HR is periodically invited to attend
Management Board meetings to talk about employee issues.
The Management Board discusses the current status of our talent
pool each time a top executive position is filled. Once or twice
a year, it gets an overview of our entire talent pool, including
lower levels of management.
To ensure our people have a consistent framework within our
decentralized management approach, the HR team and the
E.ON Management Board developed and approved our People
Commitments in 2017. They establish twelve principles that
articulate our values and how we treat our employees. These
principles are binding for the entire E.ON Group and are fully
supported by the SE Works Council of E.ON SE. Units have
adopted these principles in a way that reflects their particular
legal, cultural, and business environment. Our People Guidelines
and our People Commitments encompass a number of policies
and guidelines. Examples include agreements on remote working
and flexible work arrangements, such as sabbaticals, part-time
work, and special holidays. Our international transfer policy
governs the temporary foreign deployment of our employees.
The average length of a foreign deployment is between two
and three years.
We have in place a wide range of measures to make working
at E.ON attractive and to develop our employees. E.ON offers
vocational training in numerous careers and work-study pro-
grams. One example is the E.ON training initiative in Germany,
which helps school-leavers get a start on their careers through
internships that prepare them for an apprenticeship as well
as school projects and other programs. The E.ON Graduate Pro-
gram (“EGP”) recruits highly qualified university graduates for a
24-month program during which they receive a broad overview
• generally ensuring economically equivalent working condi-
tions when transferring employees
• continuing to place a particular emphasis on training young
people
• retaining current social support agreements, unless they are
superseded by other agreements.
In November innogy’s Group Works Council and SE Works Council
acceded to the Agreement. This now establishes that the Agree-
ment will apply to all employees of the future E.ON, regardless
of which company they work for prior to the planned integration.
It reflects the close and trusting collaboration between E.ON
and innogy’s codetermination councils. As soon as legally permis-
sible, innogy employee representatives will be involved in the
project work and in shaping overarching strategic processes.
Employee Development and Working ConditionsWe aim to attract talented people to our company and provide
them with a work environment that enables them to do their
best. Our People Strategy helps us do this, especially in times
of change. Its three focus areas—Preparing Our People for the
Future, Providing Opportunities, and Recognizing Performance—
are crucial for maintaining attractive working conditions and
fostering our employees’ personal and professional development.
A key enabler for the latter is [email protected], a Group-wide compe-
tency framework that is integrated into all our HR mechanisms.
It helps ensure that we recruit, retain, and develop the people
who will continue to drive E.ON’s success. We offer a range of
career paths. This ensures that we are an attractive employer
to people who wish to pursue a specialist or a generalist career.
In 2018 we decentralized our HR activities to be closer to the
business. One important function of Group HR is the HR man-
agement of our company’s top 100 leaders. These tasks include
executive development, placement, succession planning, and
talent pipeline management. Each unit must have in place its
own mechanisms to identify and develop talent and to conduct
45CEO Letter
Report of the Supervisory Board
E.ON Stock
Strategy and Objectives
Combined Group Management Report
Combined Non-Financial Report
Consolidated Financial Statements
Further Information
of skilled workers. In addition, a diverse workforce enables us
to do an even better job of meeting our customers’ needs and
requirements. In 2006 we issued a Group Policy on Equal Oppor-
tunity and Diversity. In late 2016 E.ON along with the SE Works
Council of E.ON SE renewed this commitment to diversity.
In April 2018 the E.ON Management Board, the German Groups
Works Council, and the Group representation for severely dis-
abled persons signed the Shared Understanding of Implementing
Inclusion at E.ON, creating a strong foundation for integrating
people with disabilities into our organization.
In 2008 E.ON publicly affirmed its commitment to fairness and
respect by signing the German Diversity Charter, which now
has about 2,700 signatories. E.ON therefore belongs to a large
network of companies committed to diversity, tolerance, fairness,
and respect.
Our approach to promoting diversity is holistic, encompassing
all dimensions of diversity. It ensures equal opportunity for all
employees and fosters and harnesses diversity in an individual
way. However, we prioritize three dimensions: gender, age, and
internationality.
In 2018 we again implemented numerous measures to promote
diversity at E.ON. An important purpose of these measures is
to foster the career development of female managers. We set
new, ambitious targets to increase the proportion of women in
management positions. By year-end 2026, we want the propor-
tion of women in management positions to be the same—32 per-
cent—as the proportion of women in our overall workforce was
at year-end 2016. Each unit has specific targets, and progress
towards these targets is monitored at regular intervals. We also
have Group-wide recruiting and hiring guidelines for management
positions. These guidelines require that at least one male and
one female must be on the short list for a vacant management
position. Through these measures, the proportion of women in
management positions rose from just over 11 percent in 2010
to 21.2 percent at year-end 2018 for the Group as a whole
and from 9 percent to 15.9 percent for Germany. Our units have
of our business through three to six deployments in different
E.ON units and departments. In 2018 we offered the EGP in
the United Kingdom, Sweden, the Czech Republic, Hungary, and
Romania.
We use a single management hiring process throughout the
Group. It is designed to improve how we fill senior management
positions, make hiring more transparent, and ensure equal
opportunity. Its main component is a biweekly placement con-
ference at which HR managers from around our company dis-
cuss vacancies and potential candidates. We also conduct an
annual management review. These mechanisms ensure that our
managers are engaged in ongoing professional development
and that we have a transparent view of our current talent situa-
tion and our needs for the future.
We believe that an attractive compensation package including
appealing fringe benefits is essential for rewarding our employ-
ees. The compensation plans of nearly all our employees contain
an element that reflects the company’s performance. This element
is typically based on the same key performance indicators that
are also used in the Management Board’s compensation plan.
E.ON has a long tradition of maintaining a constructive, mutually
trusting partnership with employee representatives (see the
section above entitled Collaborative Partnership with Employee
Representatives). Our relationship with employees and their rep-
resentatives is founded on a social partnership.
DiversityGoing forward, diversity will remain a key element of E.ON’s
competitiveness. Diversity and an appreciative corporate culture
promote creativity and innovation. This is a central aspect of
the E.ON vision as well. E.ON brings together a diverse team of
people who differ by nationality, age, gender, disability, religion,
and/or cultural and social background. We foster and utilize
diversity in specific ways and create an inclusive work environ-
ment. Diversity is a key success factor. Studies have shown that
heterogeneous teams outperform homogenous ones. Diversity
is equally crucial in view of demographic trends. Going forward,
only those companies that embrace diversity will be able to
remain attractive employers and be less affected by the shortage

46Business Report
The main reason for the increase in Energy Networks’ headcount
was the filling of vacancies (in Germany, predominantly with
apprentices who had successfully completed their training) to
expand the business and the integration of formerly outsourced
activities in Romania. In the Czech Republic, employees were
transferred to this segment from Customer Solutions. These
effects were partially offset by the sale of Hamburg Netz GmbH.
The increase in the number of employees at Customer Solutions
mainly reflects the transfer of employees who were previously
reported under Corporate Functions/Other and new hiring in the
Czech Republic, Romania, and Sweden. The increase was par-
tially offset by the impact of restructuring projects in Germany
and, in particular, the United Kingdom.
The expansion of onshore operations (particularly in the United
States), offshore operations in Germany and the United King-
dom, and support functions led to an increase in Renewables’
headcount.
The transfer of employees to other segments, in particular Cus-
tomer Solutions, was the main reason for the significant decline
in the number of employees at Corporate Functions/Other. The
Phoenix reorganization program also led to staff reductions.
Non-Core Business consists of our nuclear energy business in
Germany. Its headcount decreased because of the ongoing
transition from power generation to asset dismantling, which
requires fewer employees.
had support mechanisms for female managers in place for a
number of years. These mechanisms include mentoring programs
for female next-generation managers, coaching, training to
prevent unconscious bias, the provision of daycare, and flexible
work schedules. Increasing the percentage of women in our
internal talent pool is a further prerequisite for raising, over the
long term, their percentage in management and top executive
positions.
More information about E.ON’s compliance with Germany’s Law
for the Equal Participation of Women and Men in Leadership
Positions in the Private Sector and the Public Sector can be found
in management’s statement regarding this law.
Workforce FiguresAt year-end 2018 the E.ON Group had 43,302 employees world-
wide, slightly more (+1.4 percent) than at year-end 2017. E.ON
also had 899 apprentices in Germany and 132 board members
and managing directors worldwide.
Employees1
Headcount
December 31,
+/- %2018 2017
Energy Networks 17,896 17,379 +3
Customer Solutions 19,692 19,519 +1
Renewables 1,374 1,206 +14
Corporate Functions/Other2 2,447 2,683 -9
Core business 41,409 40,787 +2
Non-Core Business 1,893 1,912 -1
E.ON Group 43,302 42,699 +1
1Does not include board members, managing directors, or apprentices.2Includes E.ON Business Services.

47CEO Letter
Report of the Supervisory Board
E.ON Stock
Strategy and Objectives
Combined Group Management Report
Combined Non-Financial Report
Consolidated Financial Statements
Further Information
Gender and Age Profile, Part-Time Staff As at the end of 2017, 32 percent of our employees were women
at the end of 2018.
Proportion of Female Employees
Percentages 2018 2017
Energy Networks 21 20
Customer Solutions 43 43
Renewables 20 21
Corporate Functions/Other1 49 45
Core business 32 32
Non-Core Business 13 13
E.ON Group 32 32
1Includes E.ON Business Services.
Geographic ProfileAt year-end 2018, 27,399 employees, or 63 percent of all
employees, were working outside Germany, slightly more than
the 62 percent at year-end 2017.
Employees by Country1
Headcount FTE3
Dec. 31,
2018
Dec. 31,
2017
Dec. 31,
2018
Dec. 31,
2017
Germany 15,903 16,138 15,400 15,635
United Kingdom 9,502 9,975 9,077 9,504
Romania 6,427 5,711 6,363 5,648
Hungary 5,244 5,081 5,234 5,073
Czech Republic 2,771 2,563 2,758 2,549
Sweden 2,058 1,990 2,027 1,968
USA 681 585 679 585
Other2 716 656 703 647
1Figures do not include board members, managing directors, or apprentices.2Includes Poland, Italy, Denmark, and other countries. 3Full-time equivalent.
At year-end 2018 the average E.ON Group employee was about
42 years old and had worked for us for just under 14 years.
Employees by Age
Percentages at year-end 2018 2017
30 and younger 19 18
31 to 50 53 54
51 and older 28 28

48Business Report
Occupational Health and Safety Occupational health and safety have the highest priority at E.ON.
E.ON employees’ total recordable injury frequency (“TRIF”) was
2.5 in 2018, similarly low as in the prior year (2.3).
TRIF measures the number of reported fatalities and occupa-
tional injuries and illnesses per million hours of work. It includes
injuries that occur during work-related travel that result in
lost time or no lost time and/or that lead to medical treatment,
restricted work, or work at a substitute workstation.
Unfortunately, three E.ON employees died on the job in 2018.
In addition, two contractor employees died while working for us.
The accidents occurred in Germany, Romania, Sweden, the
Czech Republic, and Hungary.
To continually improve their safety performance, our units have
in place health, safety, and environmental (“HSE”) management
systems certified to internationally recognized standards. They
also develop HSE improvement plans based on a management
review. Centrally mandated HSE activities for all E.ON companies
in 2018 included conducting one-day HSE culture workshops
for our 100 most senior executives including other culture initia-
tives, rolling out a Group-wide software solution for reporting
and investigating incidents (PRISMA), and refining our processes
for incident management through stricter standards and special
training in root-cause analysis for investigators. In addition, all
units were required to continue conducting the HSE leadership
training begun in 2017 and to review risks posed by new cus-
tomer solutions.
A total of 3,328 employees, or 8 percent of all E.ON Group
employees, were on a part-time schedule. Of these, 2,673, or
80 percent, were women.
The turnover rate resulting from voluntary terminations averaged
4.8 percent across the organization, slightly higher than in the
prior year (4.6 percent).
Part-Time Rate
Percentages 2018 2017
Energy Networks 5 5
Customer Solutions 10 11
Renewables 3 3
Corporate Functions/Other1 12 12
Core business 7 8
Non-Core Business 8 6
E.ON Group 8 8
1Includes E.ON Business Services.
Turnover Rate
Percentages 2018 2017
Energy Networks 1.8 1.7
Customer Solutions 7.2 6.7
Renewables 8.7 9.3
Corporate Functions/Other1 7.6 8.6
Core business 4.9 4.8
Non-Core Business 1.6 2.1
E.ON Group 4.8 4.6
1Includes E.ON Business Services.
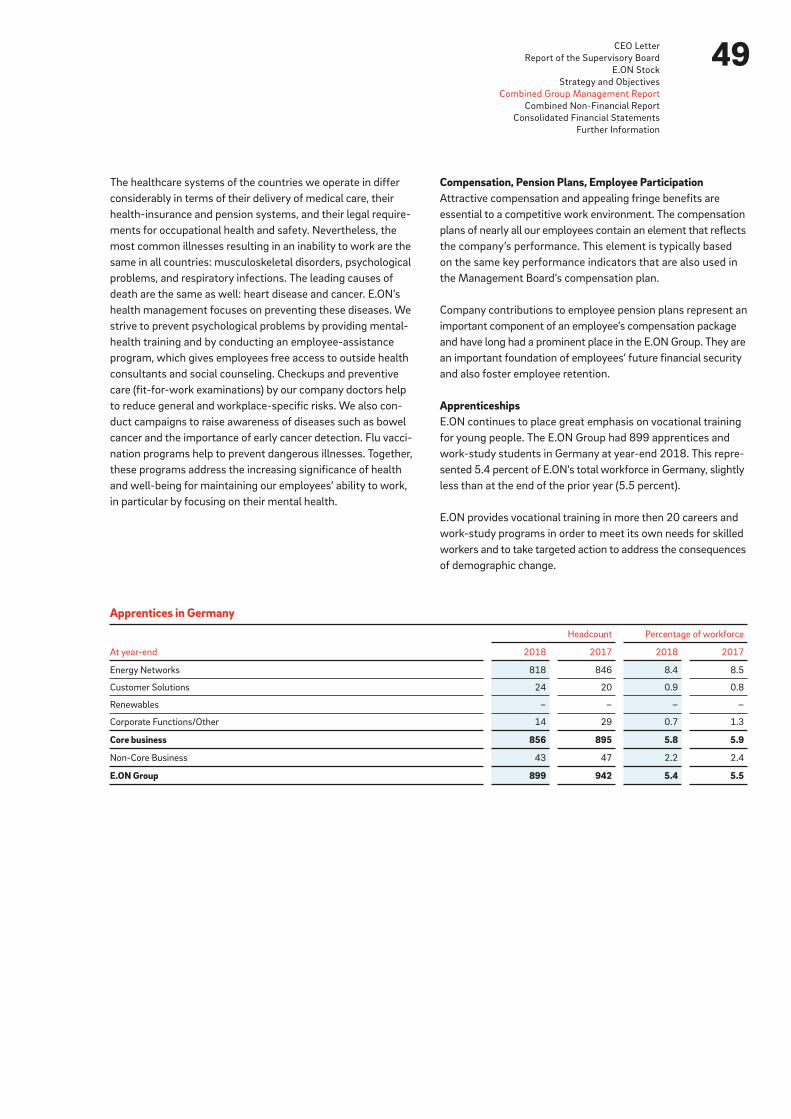
49CEO Letter
Report of the Supervisory Board
E.ON Stock
Strategy and Objectives
Combined Group Management Report
Combined Non-Financial Report
Consolidated Financial Statements
Further Information
The healthcare systems of the countries we operate in differ
considerably in terms of their delivery of medical care, their
health-insurance and pension systems, and their legal require-
ments for occupational health and safety. Nevertheless, the
most common illnesses resulting in an inability to work are the
same in all countries: musculoskeletal disorders, psychological
problems, and respiratory infections. The leading causes of
death are the same as well: heart disease and cancer. E.ON’s
health management focuses on preventing these diseases. We
strive to prevent psychological problems by providing mental-
health training and by conducting an employee-assistance
program, which gives employees free access to outside health
consultants and social counseling. Checkups and preventive
care (fit-for-work examinations) by our company doctors help
to reduce general and workplace-specific risks. We also con-
duct campaigns to raise awareness of diseases such as bowel
cancer and the importance of early cancer detection. Flu vacci-
nation programs help to prevent dangerous illnesses. Together,
these programs address the increasing significance of health
and well-being for maintaining our employees’ ability to work,
in particular by focusing on their mental health.
Compensation, Pension Plans, Employee ParticipationAttractive compensation and appealing fringe benefits are
essential to a competitive work environment. The compensation
plans of nearly all our employees contain an element that reflects
the company’s performance. This element is typically based
on the same key performance indicators that are also used in
the Management Board’s compensation plan.
Company contributions to employee pension plans represent an
important component of an employee’s compensation package
and have long had a prominent place in the E.ON Group. They are
an important foundation of employees’ future financial security
and also foster employee retention.
ApprenticeshipsE.ON continues to place great emphasis on vocational training
for young people. The E.ON Group had 899 apprentices and
work-study students in Germany at year-end 2018. This repre-
sented 5.4 percent of E.ON’s total workforce in Germany, slightly
less than at the end of the prior year (5.5 percent).
E.ON provides vocational training in more then 20 careers and
work-study programs in order to meet its own needs for skilled
workers and to take targeted action to address the consequences
of demographic change.
Apprentices in Germany
At year-end
Headcount Percentage of workforce
2018 2017 2018 2017
Energy Networks 818 846 8.4 8.5
Customer Solutions 24 20 0.9 0.8
Renewables – – – –
Corporate Functions/Other 14 29 0.7 1.3
Core business 856 895 5.8 5.9
Non-Core Business 43 47 2.2 2.4
E.ON Group 899 942 5.4 5.5
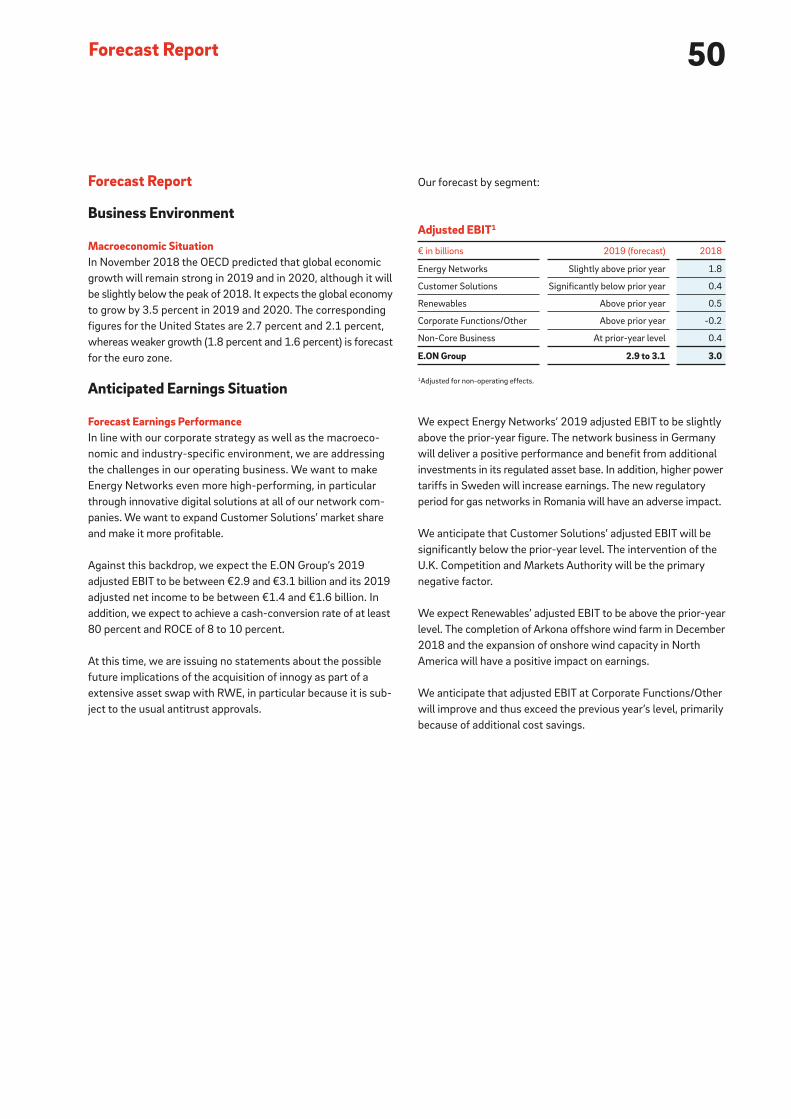
50Forecast Report
Our forecast by segment:
We expect Energy Networks’ 2019 adjusted EBIT to be slightly
above the prior-year figure. The network business in Germany
will deliver a positive performance and benefit from additional
investments in its regulated asset base. In addition, higher power
tariffs in Sweden will increase earnings. The new regulatory
period for gas networks in Romania will have an adverse impact.
We anticipate that Customer Solutions’ adjusted EBIT will be
significantly below the prior-year level. The intervention of the
U.K. Competition and Markets Authority will be the primary
negative factor.
We expect Renewables’ adjusted EBIT to be above the prior- year
level. The completion of Arkona offshore wind farm in December
2018 and the expansion of onshore wind capacity in North
America will have a positive impact on earnings.
We anticipate that adjusted EBIT at Corporate Functions/Other
will improve and thus exceed the previous year’s level, primarily
because of additional cost savings.
Adjusted EBIT1
€ in billions 2019 (forecast) 2018
Energy Networks Slightly above prior year 1.8
Customer Solutions Significantly below prior year 0.4
Renewables Above prior year 0.5
Corporate Functions/Other Above prior year -0.2
Non-Core Business At prior-year level 0.4
E.ON Group 2.9 to 3.1 3.0
1Adjusted for non-operating effects.
Forecast Report
Business Environment
Macroeconomic Situation In November 2018 the OECD predicted that global economic
growth will remain strong in 2019 and in 2020, although it will
be slightly below the peak of 2018. It expects the global economy
to grow by 3.5 percent in 2019 and 2020. The corresponding
figures for the United States are 2.7 percent and 2.1 percent,
whereas weaker growth (1.8 percent and 1.6 percent) is forecast
for the euro zone.
Anticipated Earnings Situation
Forecast Earnings Performance In line with our corporate strategy as well as the macroeco-
nomic and industry-specific environment, we are addressing
the challenges in our operating business. We want to make
Energy Networks even more high-performing, in particular
through innovative digital solutions at all of our network com-
panies. We want to expand Customer Solutions’ market share
and make it more profitable.
Against this backdrop, we expect the E.ON Group’s 2019
adjusted EBIT to be between €2.9 and €3.1 billion and its 2019
adjusted net income to be between €1.4 and €1.6 billion. In
addition, we expect to achieve a cash-conversion rate of at least
80 percent and ROCE of 8 to 10 percent.
At this time, we are issuing no statements about the possible
future implications of the acquisition of innogy as part of a
extensive asset swap with RWE, in particular because it is sub-
ject to the usual antitrust approvals.
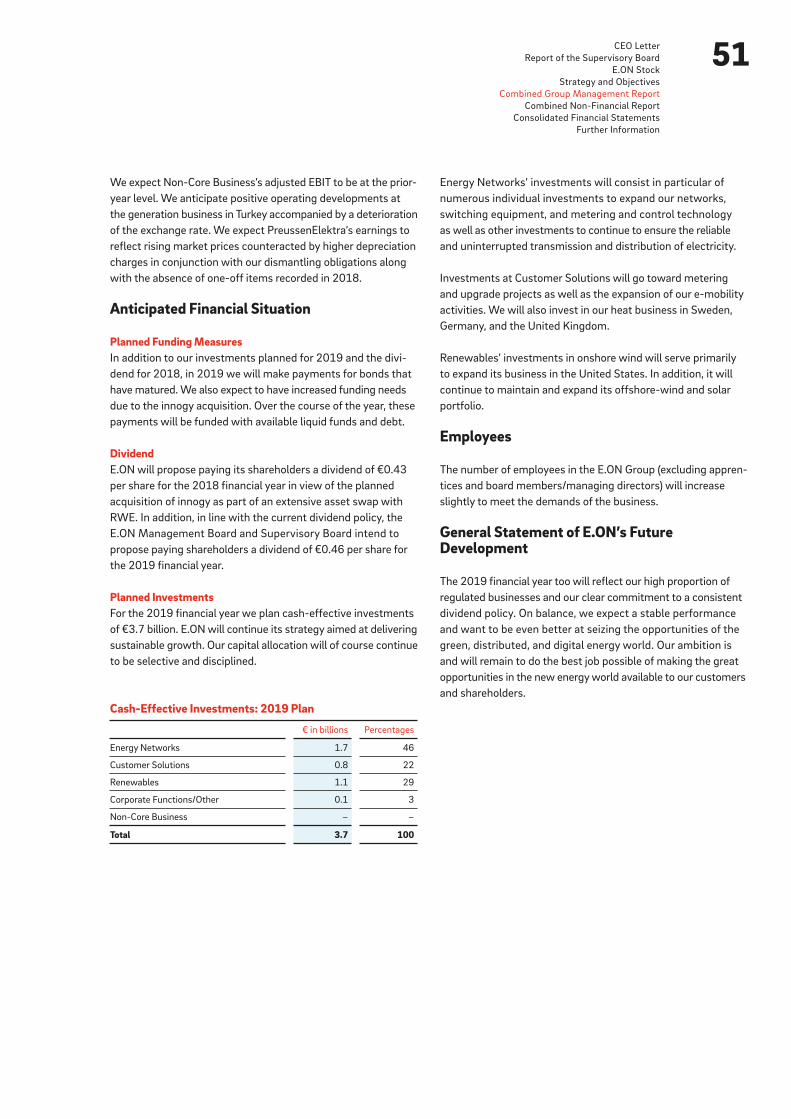
51CEO Letter
Report of the Supervisory Board
E.ON Stock
Strategy and Objectives
Combined Group Management Report
Combined Non-Financial Report
Consolidated Financial Statements
Further Information
We expect Non-Core Business’s adjusted EBIT to be at the prior-
year level. We anticipate positive operating developments at
the generation business in Turkey accompanied by a deterioration
of the exchange rate. We expect PreussenElektra’s earnings to
reflect rising market prices counteracted by higher depreciation
charges in conjunction with our dismantling obligations along
with the absence of one-off items recorded in 2018.
Anticipated Financial Situation
Planned Funding MeasuresIn addition to our investments planned for 2019 and the divi-
dend for 2018, in 2019 we will make payments for bonds that
have matured. We also expect to have increased funding needs
due to the innogy acquisition. Over the course of the year, these
payments will be funded with available liquid funds and debt.
DividendE.ON will propose paying its shareholders a dividend of €0.43
per share for the 2018 financial year in view of the planned
acquisition of innogy as part of an extensive asset swap with
RWE. In addition, in line with the current dividend policy, the
E.ON Management Board and Supervisory Board intend to
propose paying shareholders a dividend of €0.46 per share for
the 2019 financial year.
Planned InvestmentsFor the 2019 financial year we plan cash-effective investments
of €3.7 billion. E.ON will continue its strategy aimed at delivering
sustainable growth. Our capital allocation will of course continue
to be selective and disciplined.
Cash-Effective Investments: 2019 Plan
€ in billions Percentages
Energy Networks 1.7 46
Customer Solutions 0.8 22
Renewables 1.1 29
Corporate Functions/Other 0.1 3
Non-Core Business – –
Total 3.7 100
Energy Networks’ investments will consist in particular of
numerous individual investments to expand our networks,
switching equipment, and metering and control technology
as well as other investments to continue to ensure the reliable
and uninterrupted transmission and distribution of electricity.
Investments at Customer Solutions will go toward metering
and upgrade projects as well as the expansion of our e-mobility
activities. We will also invest in our heat business in Sweden,
Germany, and the United Kingdom.
Renewables’ investments in onshore wind will serve primarily
to expand its business in the United States. In addition, it will
continue to maintain and expand its offshore-wind and solar
portfolio.
Employees
The number of employees in the E.ON Group (excluding appren-
tices and board members/managing directors) will increase
slightly to meet the demands of the business.
General Statement of E.ON’s Future Development
The 2019 financial year too will reflect our high proportion of
regulated businesses and our clear commitment to a consistent
dividend policy. On balance, we expect a stable performance
and want to be even better at seizing the opportunities of the
green, distributed, and digital energy world. Our ambition is
and will remain to do the best job possible of making the great
opportunities in the new energy world available to our customers
and shareholders.
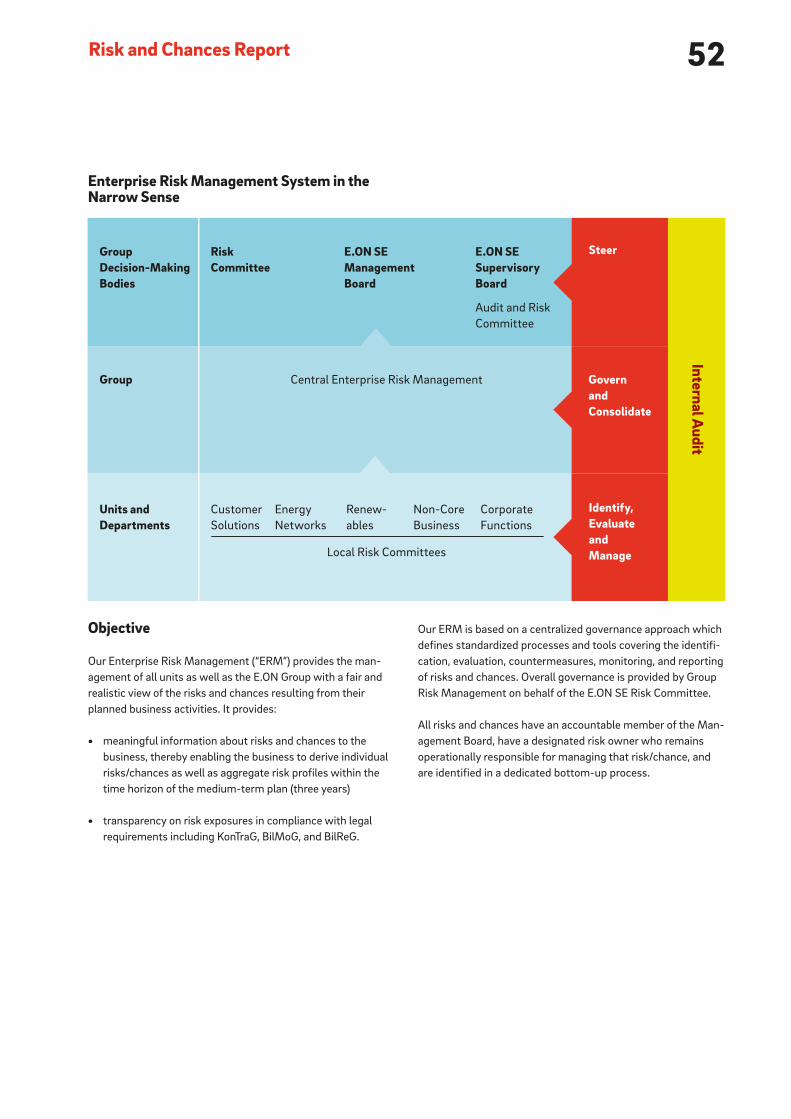
52Risk and Chances Report
Objective
Our Enterprise Risk Management (“ERM”) provides the man-
agement of all units as well as the E.ON Group with a fair and
realistic view of the risks and chances resulting from their
planned business activities. It provides:
• meaningful information about risks and chances to the
business, thereby enabling the business to derive individual
risks/chances as well as aggregate risk profiles within the
time horizon of the medium-term plan (three years)
• transparency on risk exposures in compliance with legal
requirements including KonTraG, BilMoG, and BilReG.
Enterprise Risk Management System in the Narrow Sense
Our ERM is based on a centralized governance approach which
defines standardized processes and tools covering the identifi-
cation, evaluation, countermeasures, monitoring, and reporting
of risks and chances. Overall governance is provided by Group
Risk Management on behalf of the E.ON SE Risk Committee.
All risks and chances have an accountable member of the Man-
agement Board, have a designated risk owner who remains
operationally responsible for managing that risk/chance, and
are identified in a dedicated bottom-up process.
GroupDecision-MakingBodies
Group
Units and Departments
E.ON SE Management Board
E.ON SE SupervisoryBoard
Audit and Risk
Committee
Energy
Networks
Renew-
ables
Non-Core
Business
Corporate
Functions
Central Enterprise Risk Management
Local Risk Committees
Risk Committee
Customer
Solutions
Internal Audit
Steer
Identify,Evaluate and Manage
Govern and Consolidate
53CEO Letter
Report of the Supervisory Board
E.ON Stock
Strategy and Objectives
Combined Group Management Report
Combined Non-Financial Report
Consolidated Financial Statements
Further Information
Scope
Our risk management system in the broader sense has a total of
four components:
• an internal monitoring system
• a management information system
• preventive measures
• the ERM, which is a risk management system in the narrow
sense.
The purpose of the internal monitoring system is to ensure the
proper functioning of business processes. It consists of organi-
zational preventive measures (such as policies and work
instructions) and internal controls and audits (particularly by
Internal Audit).
The E.ON internal management information system identifies
risks early so that steps can be taken to actively address them.
Reporting by the Controlling, Finance, and Accounting depart-
ments as well as Internal Audit reports are of particular impor-
tance in early risk detection.
General Measures to Limit Risks
We take the following general preventive measures to limit risks.
Managing Legal and Regulatory RisksWe engage in intensive and constructive dialog with govern-
ment agencies and policymakers in order to manage the risks
resulting from the E.ON Group’s policy, legal, and regulatory
environment. Furthermore, we strive to conduct proper project
management so as to identify early and minimize the risks
attending our new-build projects.
We attempt to minimize the operational risks of legal proceedings
and ongoing planning processes by managing them appropriately
and by designing appropriate contracts beforehand.
Managing Operational and IT RisksTo limit operational and IT risks, we continually improve our
network management and the optimal dispatch of our assets.
At the same time, we are implementing operational and infra-
structure improvements that will enhance the reliability of our
generation assets and distribution networks, even under extraor-
dinarily adverse conditions. In addition, we have factored the
operational and financial effects of environmental risks into our
emergency plan. They are part of a catalog of crisis and system-
failure scenarios prepared for the Group by our Incident and
Crisis Management team.
Our IT systems are maintained and optimized by qualified E.ON
Group experts, outside experts, and a wide range of technologi-
cal security measures. In addition, the E.ON Group has in place
a range of technological and organizational measures to counter
the risk of unauthorized access to data, the misuse of data, and
data loss.
Managing Health, Safety, and Environmental (“HSE”), Human Resources (“HR”), and Other RisksThe following are among the comprehensive measures we take
to address HSE, HR, and other risks (also in conjunction with
operational and IT risks):
• systematic employee training, advanced training, and quali-
fication programs for our employees
• further refinement of our production procedures, processes,
and technologies
• regular facility and network maintenance and inspection
• company guidelines as well as work and process instructions
• quality management, control, and assurance
• project, environmental, and deterioration management
• crisis-prevention measures and emergency planning.
Should an accident occur despite the measures we take, we
have a reasonable level of insurance coverage.
54Risk and Chances Report
Note 30 to the Consolidated Financial Statements contains
detailed information about the use of derivative financial instru-
ments and hedging transactions. Note 31 describes the general
principles of our risk management and applicable risk metrics
for quantifying risks relating to commodities, credit, liquidity,
interest rates, and currency translation.
Enterprise Risk Management (“ERM”)
Our risk management system, which is the basis for the risks
and chances described in the next section, encompasses:
• systematic risk and chance identification
• risk and chance analysis and evaluation
• management and monitoring of risks and chances by
analyzing and evaluating countermeasures and preventive
systems
• documentation and reporting.
As required by law, our ERM’s effectiveness is reviewed regularly
by Internal Audit. In compliance with the provisions of Section 91,
Paragraph 2, of the German Stock Corporation Act relating to
the establishment of a risk-monitoring and early warning system,
E.ON has a Risk Committee for the E.ON Group and for each of
its business units. The Risk Committee’s mission is to achieve a
comprehensive view of our risk exposure at the Group and unit
level and to actively manage risk exposure in line with our risk
strategy.
Our ERM applies to all fully consolidated E.ON Group companies
and all companies valued at equity whose book value in E.ON’s
Consolidated Financial Statements is greater than €50 million.
We take an inventory of our risks and chances at each quarterly
balance-sheet date.
To promote uniform financial reporting Group-wide, we have in
place a central, standardized system that enables effective and
automated risk reporting. Company data are systematically col-
lected, transparently processed, and made available for analysis
both centrally and decentrally at the units.
Managing Market RisksWe use a comprehensive sales-management system and inten-
sive customer management to manage margin risks.
In order to limit our exposure to commodity price risks, we con-
duct systematic risk management. The key elements of our risk
management are, in addition to binding Group-wide policies
and a Group-wide reporting system, the use of quantitative key
figures, the limitation of risks, and the strict separation of func-
tions between departments. Furthermore, we utilize derivative
financial instruments that are commonly used in the marketplace.
These instruments are transacted with financial institutions,
brokers, power exchanges, and third parties whose creditwor-
thiness we monitor on an ongoing basis. Our local sales units
and the remaining generation operations have set up local risk
management under central governance standards to monitor
these underlying commodity risks and to minimize them through
hedging.
Managing Strategic RisksWe have comprehensive preventive measures in place to manage
potential risks relating to acquisitions and investments. To the
degree possible, these measures include, in addition to the rele-
vant company guidelines and manuals, comprehensive due dili-
gence, legally binding contracts, a multi-stage approvals process,
and shareholding and project controlling. Comprehensive post-
acquisition projects also contribute to successful integration.
Managing Finance and Treasury RisksThis category encompasses credit, interest-rate, currency, tax,
and asset-management risks and chances. We use systematic
risk management to monitor and control our interest-rate and
currency risks and manage these risks using derivative and
non-derivative financial instruments. Here, E.ON SE plays a cen-
tral role by aggregating risk positions through intragroup trans-
actions and hedging these risks in the market. Due to E.ON SE’s
intermediary role, its risk position is largely closed.
We use a Group-wide credit risk management system to system-
atically measure and monitor the creditworthiness of our busi-
ness partners on the basis of Group-wide minimum standards.
We manage our credit risk by taking appropriate measures,
which include obtaining collateral and setting limits. The E.ON
Group’s Risk Committee is regularly informed about all credit
risks. A further component of our risk management is a conser-
vative investment strategy for financial funds and a broadly
diversified portfolio.
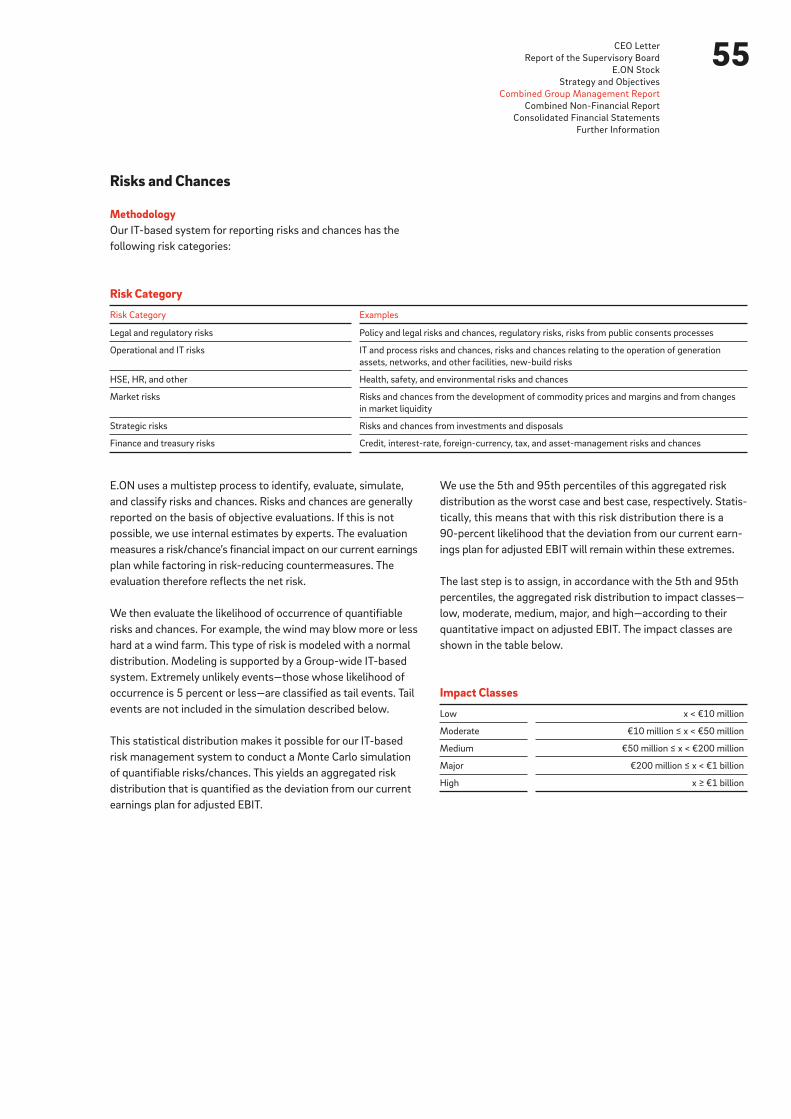
55CEO Letter
Report of the Supervisory Board
E.ON Stock
Strategy and Objectives
Combined Group Management Report
Combined Non-Financial Report
Consolidated Financial Statements
Further Information
E.ON uses a multistep process to identify, evaluate, simulate,
and classify risks and chances. Risks and chances are generally
reported on the basis of objective evaluations. If this is not
possible, we use internal estimates by experts. The evaluation
measures a risk/chance’s financial impact on our current earnings
plan while factoring in risk-reducing countermeasures. The
evaluation therefore reflects the net risk.
We then evaluate the likelihood of occurrence of quantifiable
risks and chances. For example, the wind may blow more or less
hard at a wind farm. This type of risk is modeled with a normal
distribution. Modeling is supported by a Group-wide IT-based
system. Extremely unlikely events—those whose likelihood of
occurrence is 5 percent or less—are classified as tail events. Tail
events are not included in the simulation described below.
This statistical distribution makes it possible for our IT-based
risk management system to conduct a Monte Carlo simulation
of quantifiable risks/chances. This yields an aggregated risk
distribution that is quantified as the deviation from our current
earnings plan for adjusted EBIT.
Risks and Chances
MethodologyOur IT-based system for reporting risks and chances has the
following risk categories:
We use the 5th and 95th percentiles of this aggregated risk
distribution as the worst case and best case, respectively. Statis-
tically, this means that with this risk distribution there is a
90-percent likelihood that the deviation from our current earn-
ings plan for adjusted EBIT will remain within these extremes.
The last step is to assign, in accordance with the 5th and 95th
percentiles, the aggregated risk distribution to impact classes—
low, moderate, medium, major, and high—according to their
quantitative impact on adjusted EBIT. The impact classes are
shown in the table below.
Impact Classes
Low x < €10 million
Moderate €10 million ≤ x < €50 million
Medium €50 million ≤ x < €200 million
Major €200 million ≤ x < €1 billion
High x ≥ €1 billion
Risk Category
Risk Category Examples
Legal and regulatory risks Policy and legal risks and chances, regulatory risks, risks from public consents processes
Operational and IT risks IT and process risks and chances, risks and chances relating to the operation of generation
assets, networks, and other facilities, new-build risks
HSE, HR, and other Health, safety, and environmental risks and chances
Market risks Risks and chances from the development of commodity prices and margins and from changes
in market liquidity
Strategic risks Risks and chances from investments and disposals
Finance and treasury risks Credit, interest-rate, foreign-currency, tax, and asset-management risks and chances

56Risk and Chances Report
The E.ON Group has major risk positions in the following cate-
gories: legal and regulatory risks and market risks. As a result,
the aggregate risk position of E.ON SE as a Group is major. In
other words, the E.ON Group’s average annual adjusted EBIT
risk ought not to exceed -€200 million to -€1 billion in 95 percent
of all cases.
Risks and Chances by CategoryE.ON’s major risks and chances by risk category are described
below. Also described are major risks and chances stemming
from tail events as well as qualitative risks that would impact
adjusted EBIT by more than €200 million. Risks and chances
that would affect net income and/or cash flow by more than
€200 million are included as well.
Legal and Regulatory RisksThe political, legal, and regulatory environment in which the
E.ON Group does business is a source of external risks, such as
the uncertainty surrounding Brexit and the possibility that the
United Kingdom could leave the European Union without an
agreement. This would confront E.ON with direct and indirect con-
sequences that could potentially lead to financial disadvantages.
Other risks result from decisions by governments to phase out
power generation using certain energy sources. In the recent past,
these decisions have been supplemented by energy- policy deci-
sions at the European and national level. These include, in
General Risk SituationThe table below shows the average annual aggregated risk
position (aggregated risk position) across the time horizon of
the medium-term plan for all quantifiable risks and chances
(excluding tail events) for each risk category based on our most
important financial key performance indicator, adjusted EBIT.
Risk Category
Risk category Worst case (5th percentile) Best case (95th percentile)
Legal and regulatory risks Major Medium
Operational and IT risks Medium Moderate
HSE, HR, and other Low Low
Market risks Major Major
Strategic risks Medium Low
Finance and treasury risks Medium Moderate
particular, the EU package of climate-protection measures and
the recommendations regarding the phaseout of hard-coal- and
lignite-fired power generation made by the commission appointed
by the German federal government. In addition, in the wake
of the economic and financial crisis in many EU member states,
interventionist policies and regulations have been adopted in
recent years, such as additional taxes, additional reporting require-
ments (for example, EMIR, REMIT, MiFID2), price moratoriums,
regulatory price reductions, and changes to support schemes
for renewables. Such intervention could pose major risks to, as
well as opportunities for, E.ON’s operations in these countries.
There may also be final risks from obligations arising from regu-
latory requirements following the Uniper split. This risk category
also includes the risk of litigation, fines, and claims, governance-
and compliance-related issues as well as risks and chances
related to contracts and permits. Changes to this environment
can lead to considerable uncertainty with regard to planning
and, under certain circumstances, to impairment charges but
can also create chances. This results in a major risk position and
a medium chance position.
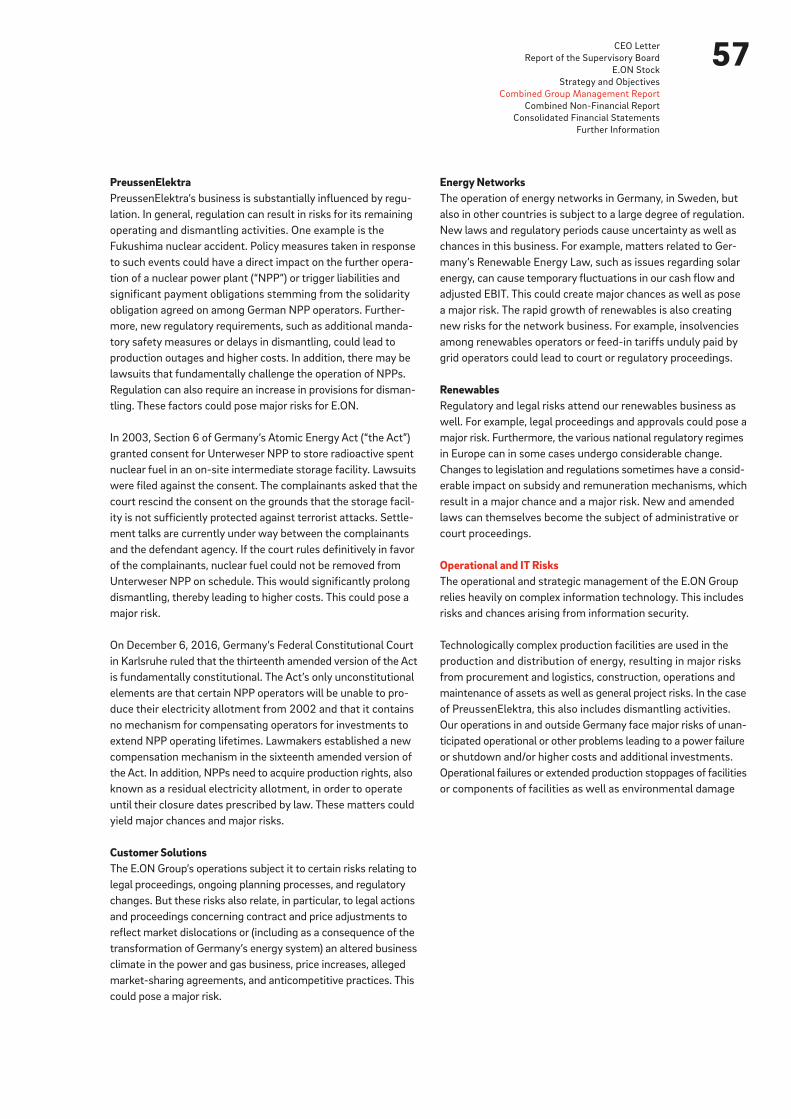
57CEO Letter
Report of the Supervisory Board
E.ON Stock
Strategy and Objectives
Combined Group Management Report
Combined Non-Financial Report
Consolidated Financial Statements
Further Information
PreussenElektraPreussenElektra’s business is substantially influenced by regu-
lation. In general, regulation can result in risks for its remaining
operating and dismantling activities. One example is the
Fukushima nuclear accident. Policy measures taken in response
to such events could have a direct impact on the further opera-
tion of a nuclear power plant (“NPP”) or trigger liabilities and
significant payment obligations stemming from the solidarity
obligation agreed on among German NPP operators. Further-
more, new regulatory requirements, such as additional manda-
tory safety measures or delays in dismantling, could lead to
production outages and higher costs. In addition, there may be
lawsuits that fundamentally challenge the operation of NPPs.
Regulation can also require an increase in provisions for disman-
tling. These factors could pose major risks for E.ON.
In 2003, Section 6 of Germany’s Atomic Energy Act (“the Act”)
granted consent for Unterweser NPP to store radioactive spent
nuclear fuel in an on-site intermediate storage facility. Lawsuits
were filed against the consent. The complainants asked that the
court rescind the consent on the grounds that the storage facil-
ity is not sufficiently protected against terrorist attacks. Settle-
ment talks are currently under way between the complainants
and the defendant agency. If the court rules definitively in favor
of the complainants, nuclear fuel could not be removed from
Unterweser NPP on schedule. This would significantly prolong
dismantling, thereby leading to higher costs. This could pose a
major risk.
On December 6, 2016, Germany’s Federal Constitutional Court
in Karlsruhe ruled that the thirteenth amended version of the Act
is fundamentally constitutional. The Act’s only unconstitutional
elements are that certain NPP operators will be unable to pro-
duce their electricity allotment from 2002 and that it contains
no mechanism for compensating operators for investments to
extend NPP operating lifetimes. Lawmakers established a new
compensation mechanism in the sixteenth amended version of
the Act. In addition, NPPs need to acquire production rights, also
known as a residual electricity allotment, in order to operate
until their closure dates prescribed by law. These matters could
yield major chances and major risks.
Customer SolutionsThe E.ON Group’s operations subject it to certain risks relating to
legal proceedings, ongoing planning processes, and regulatory
changes. But these risks also relate, in particular, to legal actions
and proceedings concerning contract and price adjustments to
reflect market dislocations or (including as a consequence of the
transformation of Germany’s energy system) an altered business
climate in the power and gas business, price increases, alleged
market-sharing agreements, and anticompetitive practices. This
could pose a major risk.
Energy NetworksThe operation of energy networks in Germany, in Sweden, but
also in other countries is subject to a large degree of regulation.
New laws and regulatory periods cause uncertainty as well as
chances in this business. For example, matters related to Ger-
many’s Renewable Energy Law, such as issues regarding solar
energy, can cause temporary fluctuations in our cash flow and
adjusted EBIT. This could create major chances as well as pose
a major risk. The rapid growth of renewables is also creating
new risks for the network business. For example, insolvencies
among renewables operators or feed-in tariffs unduly paid by
grid operators could lead to court or regulatory proceedings.
RenewablesRegulatory and legal risks attend our renewables business as
well. For example, legal proceedings and approvals could pose a
major risk. Furthermore, the various national regulatory regimes
in Europe can in some cases undergo considerable change.
Changes to legislation and regulations sometimes have a consid-
erable impact on subsidy and remuneration mechanisms, which
result in a major chance and a major risk. New and amended
laws can themselves become the subject of administrative or
court proceedings.
Operational and IT RisksThe operational and strategic management of the E.ON Group
relies heavily on complex information technology. This includes
risks and chances arising from information security.
Technologically complex production facilities are used in the
production and distribution of energy, resulting in major risks
from procurement and logistics, construction, operations and
maintenance of assets as well as general project risks. In the case
of PreussenElektra, this also includes dismantling activities.
Our operations in and outside Germany face major risks of unan-
ticipated operational or other problems leading to a power failure
or shutdown and/or higher costs and additional investments.
Operational failures or extended production stoppages of facilities
or components of facilities as well as environmental damage
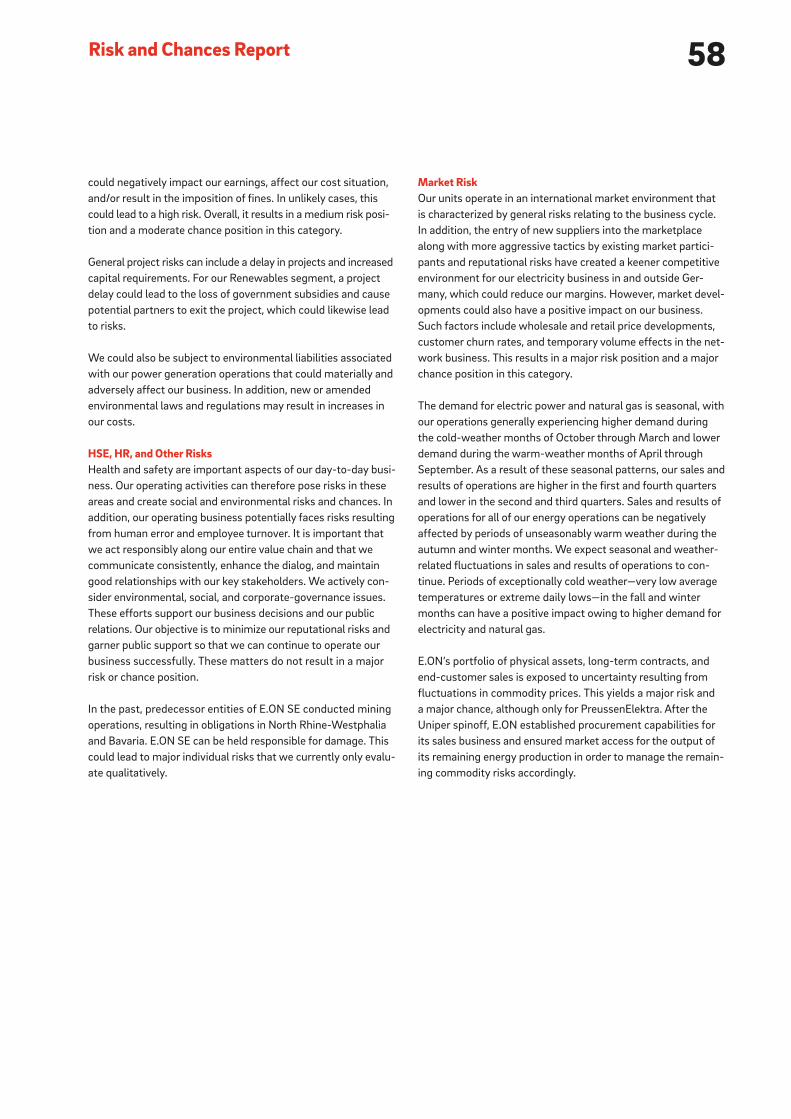
58Risk and Chances Report
Market RiskOur units operate in an international market environment that
is characterized by general risks relating to the business cycle.
In addition, the entry of new suppliers into the marketplace
along with more aggressive tactics by existing market partici-
pants and reputational risks have created a keener competitive
environment for our electricity business in and outside Ger-
many, which could reduce our margins. However, market devel-
opments could also have a positive impact on our business.
Such factors include wholesale and retail price developments,
customer churn rates, and temporary volume effects in the net-
work business. This results in a major risk position and a major
chance position in this category.
The demand for electric power and natural gas is seasonal, with
our operations generally experiencing higher demand during
the cold-weather months of October through March and lower
demand during the warm-weather months of April through
September. As a result of these seasonal patterns, our sales and
results of operations are higher in the first and fourth quarters
and lower in the second and third quarters. Sales and results of
operations for all of our energy operations can be negatively
affected by periods of unseasonably warm weather during the
autumn and winter months. We expect seasonal and weather-
related fluctuations in sales and results of operations to con-
tinue. Periods of exceptionally cold weather—very low average
temperatures or extreme daily lows—in the fall and winter
months can have a positive impact owing to higher demand for
electricity and natural gas.
E.ON’s portfolio of physical assets, long-term contracts, and
end-customer sales is exposed to uncertainty resulting from
fluctuations in commodity prices. This yields a major risk and
a major chance, although only for PreussenElektra. After the
Uniper spinoff, E.ON established procurement capabilities for
its sales business and ensured market access for the output of
its remaining energy production in order to manage the remain-
ing commodity risks accordingly.
could negatively impact our earnings, affect our cost situation,
and/or result in the imposition of fines. In unlikely cases, this
could lead to a high risk. Overall, it results in a medium risk posi-
tion and a moderate chance position in this category.
General project risks can include a delay in projects and increased
capital requirements. For our Renewables segment, a project
delay could lead to the loss of government subsidies and cause
potential partners to exit the project, which could likewise lead
to risks.
We could also be subject to environmental liabilities associated
with our power generation operations that could materially and
adversely affect our business. In addition, new or amended
environmental laws and regulations may result in increases in
our costs.
HSE, HR, and Other RisksHealth and safety are important aspects of our day-to-day busi-
ness. Our operating activities can therefore pose risks in these
areas and create social and environmental risks and chances. In
addition, our operating business potentially faces risks resulting
from human error and employee turnover. It is important that
we act responsibly along our entire value chain and that we
communicate consistently, enhance the dialog, and maintain
good relationships with our key stakeholders. We actively con-
sider environmental, social, and corporate-governance issues.
These efforts support our business decisions and our public
relations. Our objective is to minimize our reputational risks and
garner public support so that we can continue to operate our
business successfully. These matters do not result in a major
risk or chance position.
In the past, predecessor entities of E.ON SE conducted mining
operations, resulting in obligations in North Rhine-Westphalia
and Bavaria. E.ON SE can be held responsible for damage. This
could lead to major individual risks that we currently only evalu-
ate qualitatively.
59CEO Letter
Report of the Supervisory Board
E.ON Stock
Strategy and Objectives
Combined Group Management Report
Combined Non-Financial Report
Consolidated Financial Statements
Further Information
Strategic RisksOur business strategy involves acquisitions and investments in
our core business as well as disposals. This strategy depends in
part on our ability to successfully identify, acquire, and integrate
companies that enhance, on acceptable terms, our energy busi-
ness. In order to obtain the necessary approvals for acquisitions,
we may be required to divest other parts of our business or to
make concessions or undertakings that affect our business. In
addition, there can be no assurance that we will be able to achieve
the returns we expect from any acquisition or investment. It
is also possible that we will not be able to realize our strategic
ambition of enlarging our investment pipeline and that signifi-
cant amounts of capital could be used for other opportunities.
Furthermore, investments and acquisitions in new geographic
areas or lines of business require us to become familiar with new
sales markets and competitors and to address the attending
business risks.
In the case of planned disposals, E.ON faces the risk of dispos-
als not taking place or being delayed and the risk that E.ON
receives lower-than-anticipated disposal proceeds. In addition,
after transactions close we could face major liability risks
resulting from contractual obligations.
The overall risk and chance position in this category was not
major at the balance-sheet date.
Finance and Treasury Risks E.ON is exposed to credit risk in its operating activities and
through the use of financial instruments. Credit risk results from
non-delivery or partial delivery by a counterparty of the agreed
consideration for services rendered, from total or partial failure
to make payments owed on existing accounts receivable, and
from replacement risks in open transactions. For example, E.ON’s
historical connection with Uniper continues to pose major, albeit
unlikely, risks. In addition, in unlikely cases joint and several lia-
bility for jointly operated power plants could lead to a major risk.
E.ON’s international business operations expose it to risks from
currency fluctuation. One form of this risk is transaction risk,
which arises when payments are made in a currency other than
E.ON’s functional currency. Another form of risk is translation
risk, which arises when currency fluctuations lead to accounting
effects when assets/liabilities and income/expenses of E.ON
companies outside the euro zone are translated into euros and
entered into our Consolidated Financial Statements. Currency-
translation risk results mainly from our positions in U.S. dollars,
pounds sterling, Swedish kronor, Czech krona, Romanian leus,
Hungarian forints, and Turkish lira. Positive developments in
foreign-currency rates can also create chances for our operating
business.
E.ON faces earnings risks from financial liabilities and interest-
rate derivatives that are based on variable interest rates and
from asset-retirement obligations.
In addition, the price changes and other uncertainty relating to
the current and non-current investments E.ON makes to cover
its non-current obligations (particularly pension and asset-
retirement obligations) could, in individual cases, be major.
Declining or rising discount rates could lead to increased or
reduced provisions for pensions and asset-retirement obliga-
tions, including non-current liabilities. This can create a high
risk for E.ON.
In principle, E.ON could also encounter tax risks and chances;
in one case, the chance could be high.
This category’s overall risk and chance position is not major.
Management Board’s Evaluation of the Risk and Chances Situation
The overall risk and chances situation of the E.ON Group’s oper-
ating business at year-end 2018 remained nearly unchanged
relative to year-end 2017. Although the average annual risk
for the E.ON Group’s adjusted EBIT is classified as major, from
today’s perspective we do not perceive any risk position that
could threaten the existence of the E.ON Group or individual
segments.
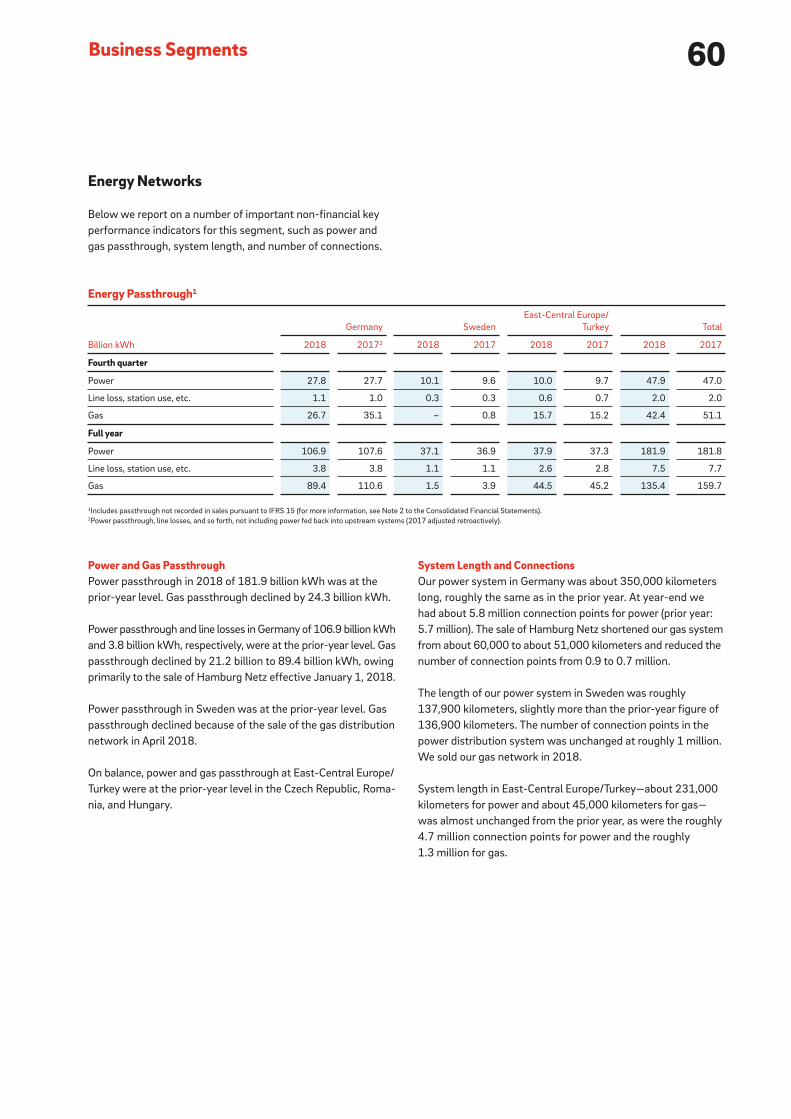
60Business Segments
Energy Networks
Below we report on a number of important non-financial key
performance indicators for this segment, such as power and
gas passthrough, system length, and number of connections.
Energy Passthrough1
Billion kWh
Germany Sweden
East-Central Europe/
Turkey Total
2018 20172 2018 2017 2018 2017 2018 2017
Fourth quarter
Power 27.8 27.7 10.1 9.6 10.0 9.7 47.9 47.0
Line loss, station use, etc. 1.1 1.0 0.3 0.3 0.6 0.7 2.0 2.0
Gas 26.7 35.1 – 0.8 15.7 15.2 42.4 51.1
Full year
Power 106.9 107.6 37.1 36.9 37.9 37.3 181.9 181.8
Line loss, station use, etc. 3.8 3.8 1.1 1.1 2.6 2.8 7.5 7.7
Gas 89.4 110.6 1.5 3.9 44.5 45.2 135.4 159.7
1Includes passthrough not recorded in sales pursuant to IFRS 15 (for more information, see Note 2 to the Consolidated Financial Statements).2Power passthrough, line losses, and so forth, not including power fed back into upstream systems (2017 adjusted retroactively).
Power and Gas PassthroughPower passthrough in 2018 of 181.9 billion kWh was at the
prior-year level. Gas passthrough declined by 24.3 billion kWh.
Power passthrough and line losses in Germany of 106.9 billion kWh
and 3.8 billion kWh, respectively, were at the prior-year level. Gas
passthrough declined by 21.2 billion to 89.4 billion kWh, owing
primarily to the sale of Hamburg Netz effective January 1, 2018.
Power passthrough in Sweden was at the prior-year level. Gas
passthrough declined because of the sale of the gas distribution
network in April 2018.
On balance, power and gas passthrough at East-Central Europe/
Turkey were at the prior-year level in the Czech Republic, Roma-
nia, and Hungary.
System Length and Connections Our power system in Germany was about 350,000 kilometers
long, roughly the same as in the prior year. At year-end we
had about 5.8 million connection points for power (prior year:
5.7 million). The sale of Hamburg Netz shortened our gas system
from about 60,000 to about 51,000 kilometers and reduced the
number of connection points from 0.9 to 0.7 million.
The length of our power system in Sweden was roughly
137,900 kilometers, slightly more than the prior-year figure of
136,900 kilometers. The number of connection points in the
power distribution system was unchanged at roughly 1 million.
We sold our gas network in 2018.
System length in East-Central Europe/Turkey—about 231,000
kilometers for power and about 45,000 kilometers for gas—
was almost unchanged from the prior year, as were the roughly
4.7 million connection points for power and the roughly
1.3 million for gas.
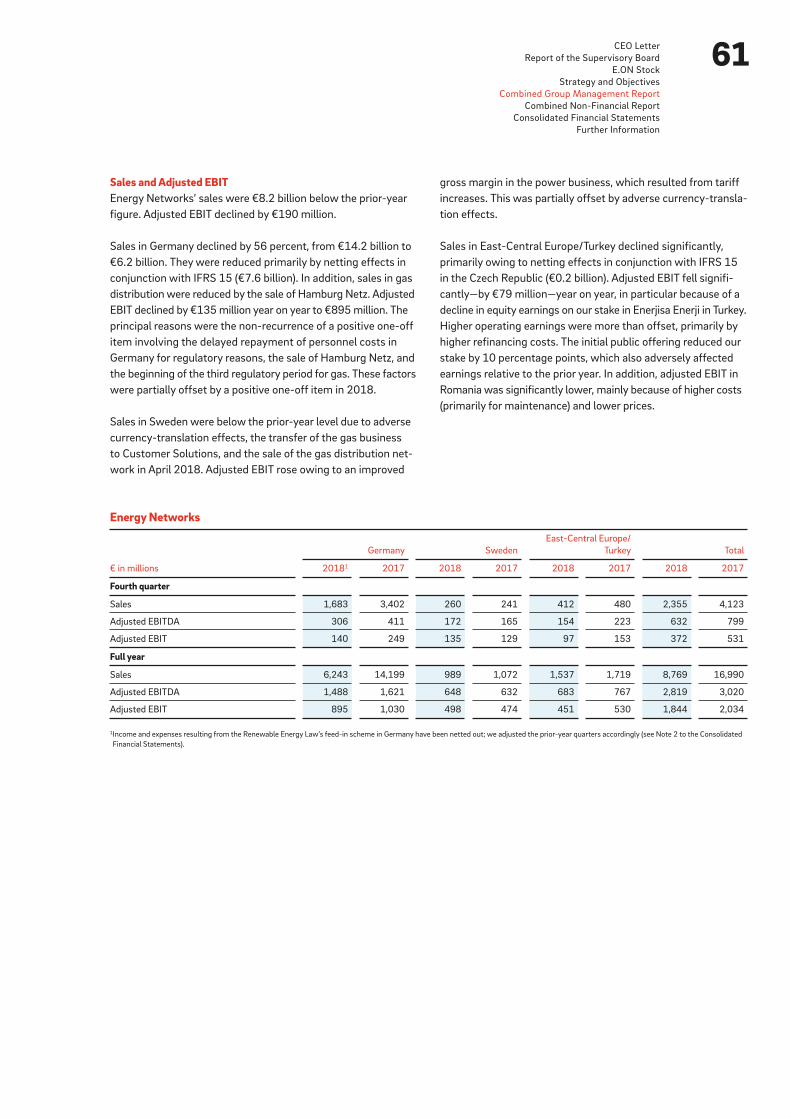
61CEO Letter
Report of the Supervisory Board
E.ON Stock
Strategy and Objectives
Combined Group Management Report
Combined Non-Financial Report
Consolidated Financial Statements
Further Information
Sales and Adjusted EBITEnergy Networks’ sales were €8.2 billion below the prior-year
figure. Adjusted EBIT declined by €190 million.
Sales in Germany declined by 56 percent, from €14.2 billion to
€6.2 billion. They were reduced primarily by netting effects in
conjunction with IFRS 15 (€7.6 billion). In addition, sales in gas
distribution were reduced by the sale of Hamburg Netz. Adjusted
EBIT declined by €135 million year on year to €895 million. The
principal reasons were the non-recurrence of a positive one-off
item involving the delayed repayment of personnel costs in
Germany for regulatory reasons, the sale of Hamburg Netz, and
the beginning of the third regulatory period for gas. These factors
were partially offset by a positive one-off item in 2018.
Sales in Sweden were below the prior-year level due to adverse
currency-translation effects, the transfer of the gas business
to Customer Solutions, and the sale of the gas distribution net-
work in April 2018. Adjusted EBIT rose owing to an improved
gross margin in the power business, which resulted from tariff
increases. This was partially offset by adverse currency-transla-
tion effects.
Sales in East-Central Europe/Turkey declined significantly,
primarily owing to netting effects in conjunction with IFRS 15
in the Czech Republic (€0.2 billion). Adjusted EBIT fell signifi-
cantly—by €79 million—year on year, in particular because of a
decline in equity earnings on our stake in Enerjisa Enerji in Turkey.
Higher operating earnings were more than offset, primarily by
higher refinancing costs. The initial public offering reduced our
stake by 10 percentage points, which also adversely affected
earnings relative to the prior year. In addition, adjusted EBIT in
Romania was significantly lower, mainly because of higher costs
(primarily for maintenance) and lower prices.
Energy Networks
€ in millions
Germany Sweden
East-Central Europe/
Turkey Total
20181 2017 2018 2017 2018 2017 2018 2017
Fourth quarter
Sales 1,683 3,402 260 241 412 480 2,355 4,123
Adjusted EBITDA 306 411 172 165 154 223 632 799
Adjusted EBIT 140 249 135 129 97 153 372 531
Full year
Sales 6,243 14,199 989 1,072 1,537 1,719 8,769 16,990
Adjusted EBITDA 1,488 1,621 648 632 683 767 2,819 3,020
Adjusted EBIT 895 1,030 498 474 451 530 1,844 2,034
1Income and expenses resulting from the Renewable Energy Law’s feed-in scheme in Germany have been netted out; we adjusted the prior-year quarters accordingly (see Note 2 to the Consolidated
Financial Statements).

62Business Segments
Customer Solutions
Below we report on a number of important non-financial key
performance indicators for this segment, such as power and
gas sales volume and customer numbers.
Power Sales1
Billion kWh
Germany Sales United Kingdom Other 2 Total
2018 2017 2018 2017 2018 2017 2018 2017
Fourth quarter
Residential and SME 4.8 4.6 4.7 5.2 6.0 5.9 15.5 15.7
I&C 2.0 2.0 3.1 3.7 6.3 7.1 11.4 12.8
Sales partners – – – – 0.2 0.2 0.2 0.2
Customer groups 6.8 6.6 7.8 8.9 12.5 13.2 27.1 28.7
Wholesale market 3.5 4.1 0.2 0.5 2.6 2.7 6.3 7.3
Total 10.3 10.7 8.0 9.4 15.1 15.9 33.4 36.0
Full year
Residential and SME 16.7 17.0 17.7 18.9 22.5 21.7 56.9 57.6
I&C 8.4 8.3 13.7 14.8 25.6 26.6 47.7 49.7
Sales partners – – – – 0.7 0.8 0.7 0.8
Customer groups 25.1 25.3 31.4 33.7 48.8 49.1 105.3 108.1
Wholesale market 13.0 14.2 0.9 1.1 8.9 9.8 22.8 25.1
Total 38.1 39.5 32.3 34.8 57.7 58.9 128.1 133.2
1Includes passthrough not recorded in sales pursuant to IFRS 15 (for more information, see Note 2 to the Consolidated Financial Statements).2Excludes E.ON Connecting Energies.
Gas Sales1
Billion kWh
Germany Sales United Kingdom Other 2 Total
2018 2017 2018 2017 2018 2017 2018 2017
Fourth quarter
Residential and SME 7.4 7.0 11.7 11.8 9.8 9.8 29.0 28.6
I&C 2.0 1.6 2.3 2.1 6.3 6.4 10.6 10.1
Sales partners – – – – 0.7 1.5 0.7 1.5
Customer groups 9.4 8.6 14.0 13.9 16.9 17.7 40.3 40.2
Wholesale market 1.2 4.2 – – 1.6 1.2 2.8 5.4
Total 10.6 12.8 14.0 13.9 18.5 18.9 43.1 45.6
Full year
Residential and SME 22.0 21.9 35.9 34.8 28.2 28.9 86.1 85.6
I&C 6.4 5.0 8.2 7.7 22.3 20.9 36.9 33.6
Sales partners – – – – 1.7 2.2 1.7 2.2
Customer groups 28.4 26.9 44.1 42.5 52.2 52.0 124.7 121.4
Wholesale market 4.6 17.0 – – 5.8 2.7 10.4 19.7
Total 33.0 43.9 44.1 42.5 58.0 54.7 135.1 141.1
1Includes passthrough not recorded in sales pursuant to IFRS 15 (for more information, see Note 2 to the Consolidated Financial Statements).2Excludes E.ON Connecting Energies.

63CEO Letter
Report of the Supervisory Board
E.ON Stock
Strategy and Objectives
Combined Group Management Report
Combined Non-Financial Report
Consolidated Financial Statements
Further Information
Power and Gas Sales VolumeThis segment’s power and gas sales declined by 5.1 billion kWh
and 6 billion kWh, respectively.
Power sales in Germany of 38.1 billion kWh were 4 percent
below the prior-year level. Power sales to the wholesale market
declined owing to lower sales volume on already-contracted
deliveries to some Uniper wholesale customers relative to 2017.
By contrast, buybacks through the direct marketing of output in
conjunction with Germany’s Renewable Energy Law were higher.
Power sales to residential and small and medium enterprise
(“SME”) customers and to industrial and commercial (“I&C”) cus-
tomers were at the prior-year level. Gas sales of 33 billion kWh
were 25 percent below the prior-year level. The reason for
the significant decline in gas sales to the wholesale market
(-12.4 billion kWh) is the same as for power. Residential and
SME customers consumed about as much gas as in the prior
year. By contrast, gas sales to I&C customers rose.
Power sales in the United Kingdom declined by 2.5 billion kWh.
Lower average consumption and lower customer numbers were
the principal factors for residential and SME customers. Power
sales to I&C customers likewise decreased owing to lower
average offtake per customer. By contrast, gas sales rose by
1.6 billion kWh. Gas sales to residential and SME customers and
to I&C customers increased mainly because of weather factors.
Power sales at the Other unit (Sweden, Hungary, the Czech
Republic, Romania, and Italy) declined by 1.2 billion kWh.
Power sales to I&C customers in the Czech Republic declined
owing primarily to keener competition. The expiration of a sales
contract in the Czech Republic was the principal factor in the
significant decline in power sales to the wholesale market. This
was partially offset by increased deliveries to existing wholesale
customers in Hungary. Power sales to residential and SME cus-
tomers were higher, due in particular to the acquisition of new
customers in Italy and Sweden. Gas sales were 3.3 billion kWh
higher. Gas sales to I&C customers rose mainly because of the
transfer of the gas business in Sweden, which in the prior year
was reported at Energy Networks. This was partially offset by a
weather-driven decline in gas sales to I&C customers in Romania.
The increase in gas sales to the wholesale market is attributable
to weather-driven demand spikes in Romania and the advent of
direct market access in Italy. By contrast, gas sales to residential
and SME customers declined owing to weather factors, partic-
ularly in Romania.
Customer NumbersThis segment had about 21 million customers at year-end 2018,
fewer than the prior-year figure of 21.1 million. The number of
customers in the United Kingdom declined form 6.8 to 6.6 million;
power customers accounted for most of the customer losses. In
Germany they increased from 5.9 million in 2017 to 6 million in
2018; of these, 5.1 million were power customers and 0.9 million
gas customers (2017: 5.1 million power customers, 0.8 million
gas customers). We had a total of 8.5 million customers in the
other countries where this segment operates, about as many as
in 2017.

64Business Segments
Sales at this segment’s Other unit rose by €244 million, princi-
pally because of higher sales prices in Sweden, Italy, and Hun-
gary. The transfer of the gas business in Sweden from Energy
Networks and higher sales volume in Italy were also positive
factors. Sales in the Czech Republic declined, mainly because of
netting effects pursuant to IFRS 15. Adverse currency-transla-
tion effects in Sweden had a negative impact as well. Adjusted
EBIT declined year on year, in particular because of the unavail-
ability of a cogeneration plant at E.ON Connecting Energies that
this unit operates for a customer. In addition, an improved gross
power margin in Romania was more than offset by a narrower
gas margin resulting from higher procurement costs. By contrast,
the aforementioned transfer of the gas sales business in Sweden
had a positive impact on adjusted EBIT.
Sales and Adjusted EBITCustomer Solutions’ sales rose by €551 million. Its adjusted
EBIT decreased by €66 million.
Sales in Germany declined primarily because of the expiration
of sales contracts to certain wholesale customers that were
transferred to Uniper. Price adjustments and a decline in power
sales to residential and SME customers were additional adverse
factors. These effects were partially offset by an increase in gas
sales to I&C customers. Adjusted EBIT was significantly above
the prior-year level, primarily because of a wider gross margin
in the power and gas sales business.
Sales in the United Kingdom were higher due to price increases
and a weather-driven increase in gas sales volume. This was
partially offset by a reduction in power sales volume and adverse
currency-translation effects. Adjusted EBIT declined owing to
persistently challenging market conditions, higher restructuring
expenditures, regulatory effects, and a weather-driven decline
in power sales volume.
Customer Solutions
€ in millions
Germany Sales United Kingdom Other Total
2018 2017 2018 2017 2018 2017 2018 2017
Fourth quarter
Sales 1,876 1,892 2,326 2,122 2,118 2,077 6,320 6,091
Adjusted EBITDA 45 33 26 137 63 57 134 227
Adjusted EBIT 36 26 -1 108 18 3 53 137
Full year
Sales 6,768 7,014 7,758 7,205 7,601 7,357 22,127 21,576
Adjusted EBITDA 193 132 237 351 294 312 724 795
Adjusted EBIT 160 102 142 248 111 129 413 479
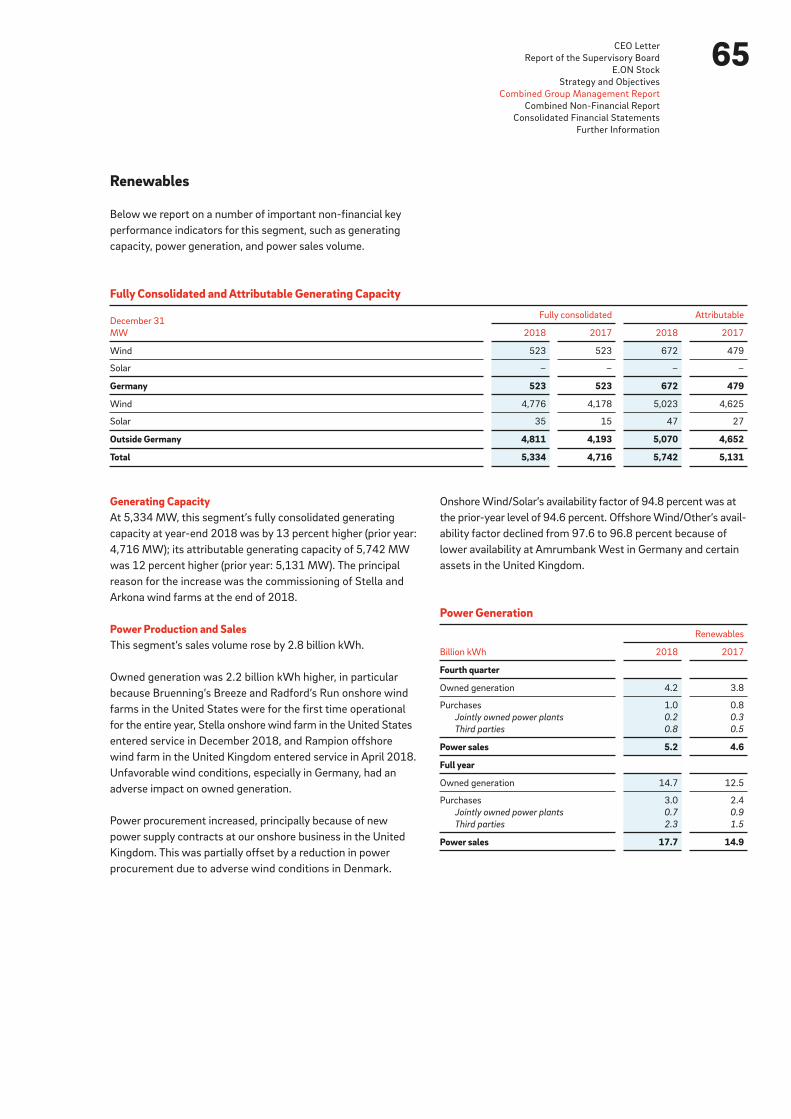
65CEO Letter
Report of the Supervisory Board
E.ON Stock
Strategy and Objectives
Combined Group Management Report
Combined Non-Financial Report
Consolidated Financial Statements
Further Information
Renewables
Below we report on a number of important non-financial key
performance indicators for this segment, such as generating
capacity, power generation, and power sales volume.
Fully Consolidated and Attributable Generating Capacity
December 31
MW
Fully consolidated Attributable
2018 2017 2018 2017
Wind 523 523 672 479
Solar – – – –
Germany 523 523 672 479
Wind 4,776 4,178 5,023 4,625
Solar 35 15 47 27
Outside Germany 4,811 4,193 5,070 4,652
Total 5,334 4,716 5,742 5,131
Generating Capacity At 5,334 MW, this segment’s fully consolidated generating
capacity at year-end 2018 was by 13 percent higher (prior year:
4,716 MW); its attributable generating capacity of 5,742 MW
was 12 percent higher (prior year: 5,131 MW). The principal
reason for the increase was the commissioning of Stella and
Arkona wind farms at the end of 2018.
Power Production and SalesThis segment’s sales volume rose by 2.8 billion kWh.
Owned generation was 2.2 billion kWh higher, in particular
because Bruenning’s Breeze and Radford’s Run onshore wind
farms in the United States were for the first time operational
for the entire year, Stella onshore wind farm in the United States
entered service in December 2018, and Rampion offshore
wind farm in the United Kingdom entered service in April 2018.
Unfavorable wind conditions, especially in Germany, had an
adverse impact on owned generation.
Power procurement increased, principally because of new
power supply contracts at our onshore business in the United
Kingdom. This was partially offset by a reduction in power
procurement due to adverse wind conditions in Denmark.
Onshore Wind/Solar’s availability factor of 94.8 percent was at
the prior-year level of 94.6 percent. Offshore Wind/Other’s avail-
ability factor declined from 97.6 to 96.8 percent because of
lower availability at Amrumbank West in Germany and certain
assets in the United Kingdom.
Power Generation
Billion kWh
Renewables
2018 2017
Fourth quarter
Owned generation 4.2 3.8
Purchases 1.0 0.8
Jointly owned power plants 0.2 0.3
Third parties 0.8 0.5
Power sales 5.2 4.6
Full year
Owned generation 14.7 12.5
Purchases 3.0 2.4
Jointly owned power plants 0.7 0.9
Third parties 2.3 1.5
Power sales 17.7 14.9
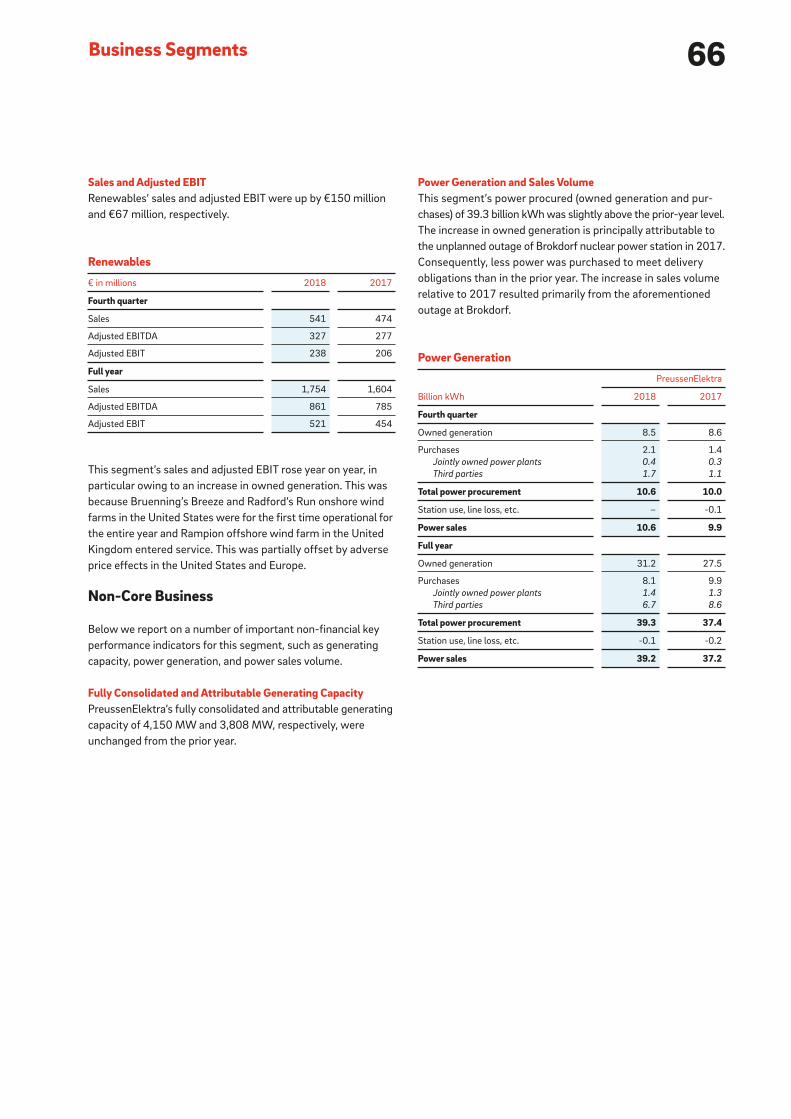
66Business Segments
Sales and Adjusted EBITRenewables’ sales and adjusted EBIT were up by €150 million
and €67 million, respectively.
This segment’s sales and adjusted EBIT rose year on year, in
particular owing to an increase in owned generation. This was
because Bruenning’s Breeze and Radford’s Run onshore wind
farms in the United States were for the first time operational for
the entire year and Rampion offshore wind farm in the United
Kingdom entered service. This was partially offset by adverse
price effects in the United States and Europe.
Non-Core Business
Below we report on a number of important non-financial key
performance indicators for this segment, such as generating
capacity, power generation, and power sales volume.
Fully Consolidated and Attributable Generating Capacity PreussenElektra’s fully consolidated and attributable generating
capacity of 4,150 MW and 3,808 MW, respectively, were
unchanged from the prior year.
Renewables
€ in millions 2018 2017
Fourth quarter
Sales 541 474
Adjusted EBITDA 327 277
Adjusted EBIT 238 206
Full year
Sales 1,754 1,604
Adjusted EBITDA 861 785
Adjusted EBIT 521 454
Power Generation and Sales VolumeThis segment’s power procured (owned generation and pur-
chases) of 39.3 billion kWh was slightly above the prior-year level.
The increase in owned generation is principally attributable to
the unplanned outage of Brokdorf nuclear power station in 2017.
Consequently, less power was purchased to meet delivery
obligations than in the prior year. The increase in sales volume
relative to 2017 resulted primarily from the aforementioned
outage at Brokdorf.
Power Generation
Billion kWh
PreussenElektra
2018 2017
Fourth quarter
Owned generation 8.5 8.6
Purchases 2.1 1.4
Jointly owned power plants 0.4 0.3
Third parties 1.7 1.1
Total power procurement 10.6 10.0
Station use, line loss, etc. – -0.1
Power sales 10.6 9.9
Full year
Owned generation 31.2 27.5
Purchases 8.1 9.9
Jointly owned power plants 1.4 1.3
Third parties 6.7 8.6
Total power procurement 39.3 37.4
Station use, line loss, etc. -0.1 -0.2
Power sales 39.2 37.2

67CEO Letter
Report of the Supervisory Board
E.ON Stock
Strategy and Objectives
Combined Group Management Report
Combined Non-Financial Report
Consolidated Financial Statements
Further Information
Sales and Adjusted EBITPreussenElektra’s sales declined by €186 million, mainly because
of lower sales prices and the absence of one-off items in con-
junction with legal proceedings.
Adjusted EBIT decreased from €393 million to €382 million.
The decline is mainly attributable to lower sales prices and the
absence of one-off items at PreussenElektra. This was partially
offset by lower expenditures to procure power to cover delivery
obligations due to the increase in owned generation.
Non-Core Business
€ in millions
PreussenElektra Generation/Turkey Total
2018 2017 2018 2017 2018 2017
Fourth quarter
Sales 416 355 – – 416 355
Adjusted EBITDA 120 157 23 -20 143 137
Adjusted EBIT 45 149 23 -20 68 129
Full year
Sales 1,399 1,585 – – 1,399 1,585
Adjusted EBITDA 556 654 -17 -113 539 541
Adjusted EBIT 399 506 -17 -113 382 393
By contrast, adjusted EBIT at the generation business in Turkey
was higher because prior-year equity earnings on our stake in
Enerjisa Üretim were adversely affected in particular by a book
loss on the sale of a hydroelectric station. In addition, Enerjisa
Üretim recorded a volume- and price-driven increase in earnings
in 2018.

68Internal Control System for the Accounting Process
statements of subsidiaries belonging to its scope of consolida-
tion into its Consolidated Financial Statements using standard
consolidation software. Group Accounting is responsible for
conducting the consolidation and for monitoring adherence to the
guidelines for scheduling, processes, and contents. Monitoring
of system-based automated controls is supplemented by manual
checks.
In conjunction with the year-end closing process, additional
qualitative and quantitative information relevant for accounting
is compiled. Furthermore, dedicated quality-control processes
are in place for all relevant departments to discuss and ensure
the completeness of relevant information on a regular basis.
E.ON SE’s Financial Statements are prepared with SAP software.
The accounting and preparation processes are divided into
discrete functional steps. Bookkeeping processes are handled
by our Business Service Centers: Cluj has responsibility for pro-
cesses relating to subsidiary ledgers and several bank activities,
Regensburg for those relating to the general ledgers. Automated
or manual controls are integrated into each step. Defined proce-
dures ensure that all transactions and the preparation of E.ON SE’s
Financial Statements are recorded, processed, assigned on an
accrual basis, and documented in a complete, timely, and accu-
rate manner. Relevant data from E.ON SE’s Financial Statements
are, if necessary, adjusted to conform with IFRS and then trans-
ferred to the consolidation software system using SAP-supported
transfer technology.
The following explanations about our internal control system
and our general IT controls apply equally to the Consolidated
Financial Statements and to E.ON SE’s Financial Statements.
Internal Control System Internal controls are an integral part of our accounting processes.
Guidelines define uniform financial-reporting requirements and
procedures for the entire E.ON Group. These guidelines encom-
pass a definition of the guidelines’ scope of application; a Risk
Catalog (ICS Model); standards for establishing, documenting,
and evaluating internal controls; a Catalog of ICS Principles;
a description of the test activities of our Internal Audit division;
Disclosures Pursuant to Section 289, Para-graph 4, and Section 315, Paragraph 4 of the German Commercial Code on the Internal Control System for the Accounting Process
General PrinciplesWe apply Section 315e, Paragraph 1, of the German Commercial
Code and prepare our Consolidated Financial Statements in
accordance with International Financial Reporting Standards
(“IFRS”) and the interpretations of the IFRS Interpretations
Committee that were adopted by the European Commission for
use in the EU as of the end of the fiscal year and whose appli-
cation was mandatory as of the balance-sheet date (see Note 1
to the Consolidated Financial Statements). Energy Networks
(Germany, Sweden, and East-Central Europe/Turkey), Customer
Solutions (Germany, United Kingdom, Other), Renewables, Non-
Core Business, and Corporate Functions/Other are our IFRS
reportable segments.
E.ON SE prepares its Financial Statements in accordance with
the German Commercial Code, the SE Ordinance (in conjunction
with the German Stock Corporation Act), and the German
Energy Act.
We prepare a Combined Group Management Report which
applies to both the E.ON Group and E.ON SE.
Accounting Process All companies included in the Consolidated Financial Statements
must comply with our uniform Accounting and Reporting Guide-
lines for the Annual Consolidated Financial Statements and
the Interim Consolidated Financial Statements. These guidelines
describe applicable IFRS accounting and valuation principles.
They also explain accounting principles typical in the E.ON Group,
such as those for provisions for nuclear-waste management,
the treatment of financial instruments, and the treatment of
regulatory obligations. We continually analyze amendments
to laws, new or amended accounting standards, and other pro-
nouncements for their relevance to, and consequences for, our
Consolidated Financial Statements and, if necessary, update our
guidelines and systems accordingly.
Corporate headquarters defines and oversees the roles and
responsibilities of various Group entities in the preparation of
E.ON SE’s Financial Statements and the Consolidated Financial
Statements. These roles and responsibilities are described in a
Group Policy document.
E.ON Group companies are responsible for preparing their
financial statements in a proper and timely manner. They receive
substantial support from Business Service Centers in Regensburg,
Germany, and Cluj, Romania. E.ON SE combines the financial
69CEO Letter
Report of the Supervisory Board
E.ON Stock
Strategy and Objectives
Combined Group Management Report
Combined Non-Financial Report
Consolidated Financial Statements
Further Information
and a description of the final Sign-Off process. We believe that
compliance with these rules provides sufficient certainty to pre-
vent error or fraud from resulting in material misrepresentations
in the Financial Statements, the Combined Group Management
Report, the Half-Year Financial Report, and the Quarterly State-
ments.
COSO FrameworkOur internal control system is based on the globally recognized
COSO framework, in the version published in May 2013 (COSO:
The Committee of Sponsoring Organizations of the Treadway
Commission). The Central Risk Catalog (ICS Model), which
encompasses company- and industry-specific aspects, defines
possible risks for accounting (financial reporting) in the functional
areas of our units and thus serves as a check list and provides
guidance for the establishment, documentation, and implemen-
tation of internal controls.
The Catalog of ICS Principles, which is another key component
of our internal control system, defines the minimum require-
ments for the system to function. These principles encompass
overarching principles for matters such as authorization, the
separation of functions, and master data management as well
as specific requirements for managing risks in a range of issue
areas and processes, such as contractor management, project
management, audit, and transactions.
ScopeEach year we conduct a process using qualitative criteria and
quantitative materiality metrics to define which E.ON units
must document and evaluate their financial-reporting-related
processes and controls in a central documentation system.
Central Documentation SystemThe E.ON units to which the internal control system applies use
a central documentation system to document key controls. The
system defines the scope, detailed documentation requirements,
the assessment requirements for process owners, and the final
Sign-Off process.
AssessmentAfter E.ON units have documented their processes and controls,
the individual process owners conduct an annual assessment
of the design and the operational effectiveness of the processes
as well as the controls embedded in these processes.
Tests Performed by Internal AuditThe management of E.ON units relies on the assessment per-
formed by the process owners and on the testing of the internal
control system performed by Internal Audit. These tests are a
key part of the process. Using a risk-oriented audit plan, Inter-
nal Audit tests the E.ON Group’s internal control system and
identifies potential deficiencies (issues). On the basis of its own
evaluation and the results of tests performed by Internal Audit,
an E.ON unit’s management carries out the final Sign-Off.
Sign-Off ProcessThe final step of the internal evaluation process is the submission
of a formal written declaration called a Sign-Off confirming the
effectiveness of the internal control system. The Sign-Off process
is conducted at all levels of the Group before E.ON SE, as the
final step, conducts it for the Group as a whole. The Chairman of
the E.ON SE Management Board and the Chief Financial Officer
make the final Sign-Off for the E.ON Group.
Internal Audit regularly informs the E.ON SE Supervisory Board’s
Audit and Risk Committee about the internal control system
for financial reporting and any significant issue areas it identifies
in the E.ON Group’s various processes.
General IT ControlsA functionally managed digital organization and third-party
service providers provide digital and IT services for the E.ON
Group. IT systems used for accounting are subject to provisions
of the internal control system, which encompasses the general
IT controls. These include access controls, the separation of
functions, processing controls, measures to prevent the inten-
tional and unintentional falsification of the programs, data,
and documents as well as controls related to contractor manage-
ment. The documentation of the general IT controls is stored
in our documentation system.

70Disclosures Regarding Takeovers
The Supervisory Board appoints members to the Management
Board for a term not exceeding five years; reappointment is per-
missible. If more than one person is appointed as a member of
the Management Board, the Supervisory Board may appoint
one of the members as Chairperson of the Management Board.
If there is a vacancy on the Management Board for a required
member, the court makes the necessary appointment upon
petition by a concerned party in the event of an urgent matter.
The Supervisory Board may revoke the appointment of a mem-
ber of the Management Board and of the Chairperson of the
Management Board for serious cause (for further details, see
Sections 84 and 85 of the AktG).
Resolutions of the Shareholders Meeting require a majority of
the valid votes cast unless mandatory law or the Articles of
Association explicitly prescribe otherwise. An amendment to
the Articles of Association requires a two-thirds majority of the
votes cast or, in cases where at least half of the share capital is
represented, a simple majority of the votes cast unless manda-
tory law explicitly prescribes another type of majority.
The Supervisory Board is authorized to decide by resolution on
amendments to the Articles of Association that affect only their
wording (Section 10, Paragraph 7, of the Articles of Association).
Furthermore, the Supervisory Board is authorized to revise the
wording of Section 3 of the Articles of Association upon utiliza-
tion of authorized or conditional capital.
Disclosures Pursuant to Section 289a, Paragraph 1, and Section 315a, Paragraph 1, of the German Commercial Code and Explana-tory Report
Composition of Share CapitalThe share capital totals €2,201,099,000.00 and consists of
2,201,099,000 registered shares without nominal value. Each
share of stock grants the same rights and one vote at a Share-
holders Meeting.
Restrictions on Voting Rights or the Transfer of SharesShares acquired by an employee under the Company-sponsored
employee stock purchase program are subject to a blackout
period that begins the day ownership of such shares is trans-
ferred to the employee and that ends on December 31 of the
next calendar year plus one. As a rule, an employee may not sell
such shares until the blackout period has expired. The employee
stock purchase program was not offered in 2018.
Pursuant to Section 71b of the German Stock Corporation Act
(known by its German abbreviation, “AktG”), the Company’s
treasury shares give it no rights, including no voting rights.
Legal Provisions and Rules of the Company’s Articles of Associ-ation Regarding the Appointment and Dismissal of Management Board Members and Amendments to the Articles of AssociationPursuant to the Company’s Articles of Association, the Manage-
ment Board consists of at least two members. The Supervisory
Board decides on the number of members as well as on their
appointment and dismissal.
71CEO Letter
Report of the Supervisory Board
E.ON Stock
Strategy and Objectives
Combined Group Management Report
Combined Non-Financial Report
Consolidated Financial Statements
Further Information
Management Board’s Power to Issue or Buy Back SharesPursuant to a resolution of the Shareholders Meeting of May 10,
2017, the Company is authorized, until May 9, 2022, to acquire
treasury shares. The shares acquired and other treasury shares
that are in possession of or to be attributed to the Company
pursuant to Sections 71a et seq. of the AktG must altogether
at no point account for more than 10 percent of the Company’s
share capital.
At the Management Board’s discretion, the acquisition may be
conducted:
• through a stock exchange
• by means of a public offer directed at all shareholders or a
public solicitation to submit offers
• by means of a public offer or a public solicitation to submit
offers for the exchange of liquid shares that are admitted to
trading on an organized market, within the meaning of the
German Securities Purchase and Takeover Law, for Company
shares
• by the use of derivatives (put or call options or a combination
of both).
These authorizations may be utilized on one or several occasions,
in whole or in partial amounts, in pursuit of one or more objec-
tives by the Company and also by its affiliated companies or by
third parties for the Company’s account or one of its affiliate’s
account.
With regard to treasury shares that will be, or have been, acquired
based on the aforementioned authorization and/or prior autho-
rizations by the Shareholders Meeting, the Management Board
is authorized, subject to the Supervisory Board’s consent and
excluding shareholder subscription rights, to use these shares—
in addition to a disposal through a stock exchange or an offer
granting a subscription right to all shareholders—as follows:
• to be sold and transferred against cash consideration
• to be sold and transferred against contributions in kind
• to be used in order to satisfy the rights of creditors of bonds
with conversion or option rights or, respectively, conversion
obligations issued by the Company or its Group companies
• to be offered, with or without consideration, for purchase
and transferred to individuals who are or were employed
by the Company or one of its affiliates as well as to board
members of affiliates of the Company
• to be used for the purpose of a scrip dividend where share-
holders may choose to contribute their dividend entitlement
to the Company in the form of a contribution in kind in
exchange for new shares.

72Disclosures Regarding Takeovers
Significant Agreements to which the Company Is a Party That Take Effect on a Change of Control of the Company Following a Takeover BidThe underlying contracts of debt issued since 2007 contain
change-of-control clauses that give the creditor the right of can-
cellation. This applies, inter alia, to bonds issued by E.ON SE
and E.ON International Finance B.V. and guaranteed by E.ON SE,
promissory notes issued by E.ON SE, and other instruments
such as credit contracts. Granting change-of-control rights
to creditors is considered good corporate governance and has
become standard market practice. More information about
financial liabilities is contained in the section of the Combined
Group Management Report entitled Financial Situation and in
Note 26 to the Consolidated Financial Statements.
Settlement Agreements between the Company and Management Board Members or Employees in the Case of a Change-of-Control EventIn the event of a premature loss of a Management Board posi-
tion due to a change-of-control event, the service agreements
of Management Board members entitle them to severance and
settlement payments (see the detailed presentation in the
Compensation Report).
To the extent that the Company has agreed to settlement pay-
ments for Management Board members in the case of a change
of control, the purpose of such agreements is to preserve the
independence of Management Board members.
A change-of-control event would also result in the early payout
of virtual shares under the E.ON Share Matching Plan and the
E.ON Performance Plan.
Other Disclosures Relevant to TakeoversThe Company has not been informed about, nor is it aware of,
any direct or indirect interests in its share capital that exceed
10 percent of the voting rights. Note 19 to the Consolidated
Financial Statements contains more information about the
planned acquisition of E.ON SE stock by RWE Downstream
Beteiligungs GmbH. Stock with special rights granting power
of control has not been issued. In the case of stock given by the
Company to employees, employees exercise their rights of con-
trol directly and in accordance with legal provisions and the pro-
visions of the Articles of Association, just like other shareholders.
These authorizations may be utilized on one or several occa-
sions, in whole or in partial amounts, separately or collectively,
including with respect to treasury shares acquired by affiliated
companies or companies majority-owned by the Company or
by third parties for their account or the Company’s account.
In addition, the Management Board is authorized to cancel
treasury shares, without such cancellation or its implementation
requiring an additional resolution by the Shareholders Meeting.
In each case, the Management Board will inform the Share-
holders Meeting about the utilization of the aforementioned
authorization, in particular about the reasons for and the purpose
of the acquisition of treasury shares, the number of treasury
shares acquired, the amount of the registered share capital
attributable to them, the portion of the registered share capital
represented by them, and their equivalent value.
By shareholder resolution adopted at the Annual Shareholders
Meeting of May 10, 2017, the Management Board was autho-
rized, subject to the Supervisory Board’s approval, to increase
until May 9, 2022, the Company’s share capital by a total of up
to €460 million through one or more issuances of new registered
no-par-value shares against contributions in cash and/or in
kind (authorized capital pursuant to Sections 202 et seq. AktG;
Authorized Capital 2017). Subject to the Supervisory Board’s
approval, the Management Board is authorized to exclude share-
holders’ subscription rights.
With the Supervisory Board’s approval, the Management Board
adopted a resolution that took effect on March 12, 2018, to
utilize almost all of Authorized Capital 2017, which had been
resolved by the Annual Shareholders Meeting of May 10, 2017,
to increase E.ON SE’s share capital—excluding shareholders’
subscription rights pursuant to Section 203, Paragraph 2, and
Section 186, Paragraph 3 of the AktG—from €2,201,099,000
to €2,641,318,800 through the issuance of 440,219,800 new
registered no-par-value shares against contributions in kind.
The capital increase and its implementation have not yet been
filed for entry into the Commercial Register. This is to take place
after certain conditions precedent are met. The capital increase
and the issuance of new stock will not take effect until the
capital increase has been implemented and entered into the
Commercial Register of E.ON SE. Note 19 to the Consolidated
Financial Statements contains more information about Autho-
rized Capital 2017.
At the Annual Shareholders Meeting of May 10, 2017, share-
holders approved a conditional increase of the share capital
(with the option to exclude shareholders’ subscription rights)
up to the amount of €175 million (Conditional Capital 2017).
Note 19 to the Consolidated Financial Statements contains more
information about Conditional Capital 2017.

73CEO Letter
Report of the Supervisory Board
E.ON Stock
Strategy and Objectives
Combined Group Management Report
Combined Non-Financial Report
Consolidated Financial Statements
Further Information
Corporate Governance Declaration in Accor-dance with Section 289f and Section 315d of the German Commercial Code
Declaration Made in Accordance with Section 161 of the German Stock Corporation Act by the Management Board and the Supervisory Board of E.ON SE The Board of Management and the Supervisory Board hereby
declare that E.ON SE will comply in full with the recommen-
dations of the “Government Commission German Corporate
Governance Code,” dated February 7, 2017, published by the
Federal Ministry of Justice and for Consumer Protection in the
official section of the Federal Gazette (Bundesanzeiger).
The Board of Management and the Supervisory Board further-
more declare that E.ON SE has been in compliance in full with
the recommendations of the “Government Commission German
Corporate Governance Code,” dated February 7, 2017, published
by the Federal Ministry of Justice and for Consumer Protection
in the official section of the Federal Gazette (Bundesanzeiger)
since the last declaration on December 18, 2017.
Essen, December 18, 2018
For the Supervisory Board of E.ON SE
Dr. Karl-Ludwig Kley
(Chairman of the Supervisory Board of E.ON SE)
For the Management Board of E.ON SE
Dr. Johannes Teyssen
(Chairman of the Management Board of E.ON SE)
This declaration and those of the previous five years are contin-
uously available to the public on the Company’s Internet page
at www.eon.com.
Relevant Information about Management Practices Corporate Governance E.ON views good corporate governance as a central foundation
of responsible and value-oriented management, efficient
collaboration between the Management Board and the Super-
visory Board, transparent disclosures, and appropriate risk
management.
In the past financial year the Management Board and Super-
visory Board paid close attention to E.ON’s compliance with the
German Corporate Governance Code’s recommendations and
suggestions. They determined that E.ON SE fully complies with
all of the Code’s recommendations and with nearly all of its
suggestions.
Transparent Management Transparency is a high priority of the Management Board and
Supervisory Board. Our shareholders, all capital market partici-
pants, financial analysts, shareholder associations, and the media
regularly receive up-to-date information about the situation of,
and any material changes to, the Company. We primarily use the
Internet to help ensure that all investors have equal access to
comprehensive and timely information about the Company.
E.ON SE issues reports about its situation and earnings by the
following means:
• Half-Year Financial Report and Quarterly Statements
• Annual Report
• Annual press conference
• Press releases
• Telephone conferences held on release of the quarterly and
annual results
• Numerous events for financial analysts in and outside Germany.
A financial calendar lists the dates on which the Company’s
periodic financial reports are released.
The Company issues ad hoc statements when events or
changes occur at E.ON SE that could have a significant impact
on the price of E.ON stock.
The financial calendar and ad hoc statements are available on
the Internet at www.eon.com.
74Corporate Governance Report
age should not be a member of the Management Board. The
Management Board has in place policies and procedures for the
business it conducts and, in consultation with the Supervisory
Board, has assigned task areas to its members.
The Management Board regularly reports to the Supervisory
Board on a timely and comprehensive basis on all relevant issues
of strategy, planning, business development, risk situation, risk
management, and compliance. It also submits the Group’s
investment, finance, and personnel plan for the next financial
year as well as the medium-term plan to the Supervisory Board,
generally at the last meeting of each financial year.
The Chairperson of the Management Board informs, without
undue delay, the Chairperson of the Supervisory Board of import-
ant events that are of fundamental significance in assessing
the Company’s situation, development, and management and
of any defects that have arisen in the Company’s monitoring
systems. Transactions and measures requiring the Supervisory
Board’s approval are also submitted to the Supervisory Board
in a timely manner.
Members of the Management Board are also required to promptly
report conflicts of interest to the Executive Committee of the
Supervisory Board and to inform the other members of the Man-
agement Board. Members of the Management Board may only
assume other corporate positions, particularly appointments
to the supervisory boards of non-Group companies, with the
consent of the Executive Committee of the Supervisory Board.
There were no conflicts of interest involving members of the
E.ON SE Management Board in the year under review. Any mate-
rial transactions between the Company and members of the
Management Board, their relatives, or entities with which they
have close personal ties require the consent of the Executive
Committee of the Supervisory Board. No such transactions took
place in the reporting period.
The Management Board has no board committees but has
established a number of committees that support it in the
fulfillment of its tasks. The members of these committees are
senior representatives of various departments of E.ON SE
whose experience, responsibilities, and expertise make them
particularly suited for their committee’s tasks. Among these
committees are the following:
Managers’ Transactions Persons with executive responsibilities, in particular members
of E.ON SE’s Management Board and Supervisory Board, and
persons closely related to them, must disclose specific dealings
in E.ON stock or bonds, related derivates, or other related finan-
cial instruments pursuant to Article 19 of the EU Market Abuse
Regulation in conjunction with Section 26, Paragraph 2, of the
German Securities Trading Act. Such dealings that took place in
2018 have been disclosed on the Internet at www.eon.com.
Integrity Our actions are grounded in integrity and a respect for the law.
The basis for this is the Code of Conduct established by the Man-
agement Board. It emphasizes that all employees must comply
with laws and regulations and with Company policies. These
relate to dealing with business partners, third parties, and gov-
ernment institutions (particularly with regard to antitrust law),
the granting and accepting of benefits (anti-corruption), and
the selection of suppliers and service providers. Other matters
addressed include human rights and the handling of company
information, property, and resources. The policies and proce-
dures of our compliance organization ensure the investigation,
evaluation, cessation, and punishment of reported violations
by the appropriate Compliance Officers and the E.ON Group’s
Chief Compliance Officer. Violations of the Code of Conduct
can also be reported anonymously (for example, by means of
a whistleblower report). The Code of Conduct is published on
www.eon.com.
Description of the Functioning of the Management Board and Supervisory Board and of the Composition and Functioning of Their CommitteesManagement BoardThe E.ON SE Management Board manages the Company’s
businesses, with all its members bearing joint responsibility for
its decisions. It establishes the Company’s objectives, sets its
fundamental strategic direction, and is responsible for corporate
policy and Group organization.
In 2018 the Management Board consisted of four members
initially and, after the appointment of Thomas König effective
June 1, 2018, of five members. It had one Chairman. No Manage-
ment Board member has more than three supervisory board
memberships in listed non-Group companies or on the super-
visory bodies of non-Group companies that require a similar
commitment. Someone who has reached the general retirement

75CEO Letter
Report of the Supervisory Board
E.ON Stock
Strategy and Objectives
Combined Group Management Report
Combined Non-Financial Report
Consolidated Financial Statements
Further Information
The Management Board has established a Disclosure Committee
and an Ad Hoc Committee for issues relating to financial
disclosures. These committees ensure that such information
is disclosed in a correct and timely fashion.
A Risk Committee ensures the correct application and implemen-
tation of the legal requirements of Section 91 of the German
Stock Corporation Act (known by its German abbreviation, “AktG”).
This committee monitors the E.ON Group’s risk situation and
its risk-bearing capacity and devotes particular attention to the
early-warning system to ensure the early identification of
going-concern risks in order to avoid developments that could
potentially threaten the Group’s continued existence. In this
context, the Risk Committee also deals with risk-mitigation
strategies (including hedging strategies). In collaboration with
relevant departments, the committee ensures and refines the
implementation of, and compliance with, the Company’s report-
ing policies with regard to commodity risks, credit risks, and
enterprise risk management.
Supervisory BoardPursuant to E.ON SE’s then-valid Articles of Association, effective
the conclusion of the 2018 Annual Shareholders Meeting the
Supervisory Board was reduced to 12 members. At the recom-
mendation of the Supervisory Board and Management Board,
the 2018 Annual Shareholders Meeting adopted a resolution to
expand the Supervisory Board to 14 members. After the effective
date of this change to the Articles of Association, the E.ON SE
Supervisory Board has 14 members. Pursuant to E.ON SE’s
Articles of Association, it is composed of an equal number of
shareholder and employee representatives. The shareholder
representatives are elected by the shareholders at the Annual
Shareholders Meeting; the Supervisory Board nominates can-
didates for this purpose. As a rule, the Annual Shareholders
Meeting decides on the elections by individual vote. Pursuant
to the agreement regarding employees’ involvement in E.ON SE,
the other currently seven members of the Supervisory Board
are appointed by the SE Works Council, with the provision that
at least three different countries are represented and one mem-
ber is selected by a trade union that is represented at E.ON SE
or one of its subsidiaries in Germany. Persons are not eligible as
Supervisory Board members if they:
• are already supervisory board members in ten commercial
companies that are required by law to form a supervisory
board,
• are legal representatives of an enterprise controlled by the
Company,
• are legal representatives of another corporation whose
supervisory board includes a member of the Company’s
Management Board, or
• were a member of the Company’s Management Board in the
past two years, unless the person concerned is nominated
by shareholders who hold more than 25 percent of the Com-
pany’s voting rights.
The members of the E.ON SE Supervisory Board fulfill these
requirements. Pursuant to the AktG, at least one member of the
Supervisory Board must have expertise in preparing or auditing
financial statements. The Supervisory Board believes that, in
particular, Andreas Schmitz meets this requirement. The Super-
visory Board believes that its members in their entirety are
familiar with the sector in which the Company operates.
The Supervisory Board oversees the Company’s management
and advises the Management Board on an ongoing basis. The
Management Board requires the Supervisory Board’s prior
approval for significant transactions and measures, such as the
Group’s investment, finance, and personnel plans; the acquisition
or sale of companies, equity interests, or parts of companies
whose fair value or, in the absence of a fair value, whose book
value exceeds €300 million; financing measures that exceed
€1 billion and have not been covered by Supervisory Board
resolutions regarding finance plans; and the conclusion, amend-
ment, or termination of affiliation agreements. The Supervisory
Board examines the Financial Statements of E.ON SE, the Man-
agement Report, and the proposal for profit appropriation and,
on the basis of the Audit and Risk Committee’s preliminary
review, the Consolidated Financial Statements and the separate
Combined Non-Financial Report. The Supervisory Board provides
to the Annual Shareholders Meeting a written report on the
results of this examination.
The Supervisory Board has established policies and procedures
for itself, which are available on the Company’s Internet page.
Itholds at least four regular meetings in each financial year. Its
policies and procedures include mechanisms by which, if neces-
sary, a meeting of the Supervisory Board or one of its committees
can be called at any time by a member or by the Management
Board. Shareholder representatives and employee representatives
can prepare for Supervisory Board meetings separately. In the
event of a tie vote on the Supervisory Board, the Chairperson has
the tie-breaking vote.
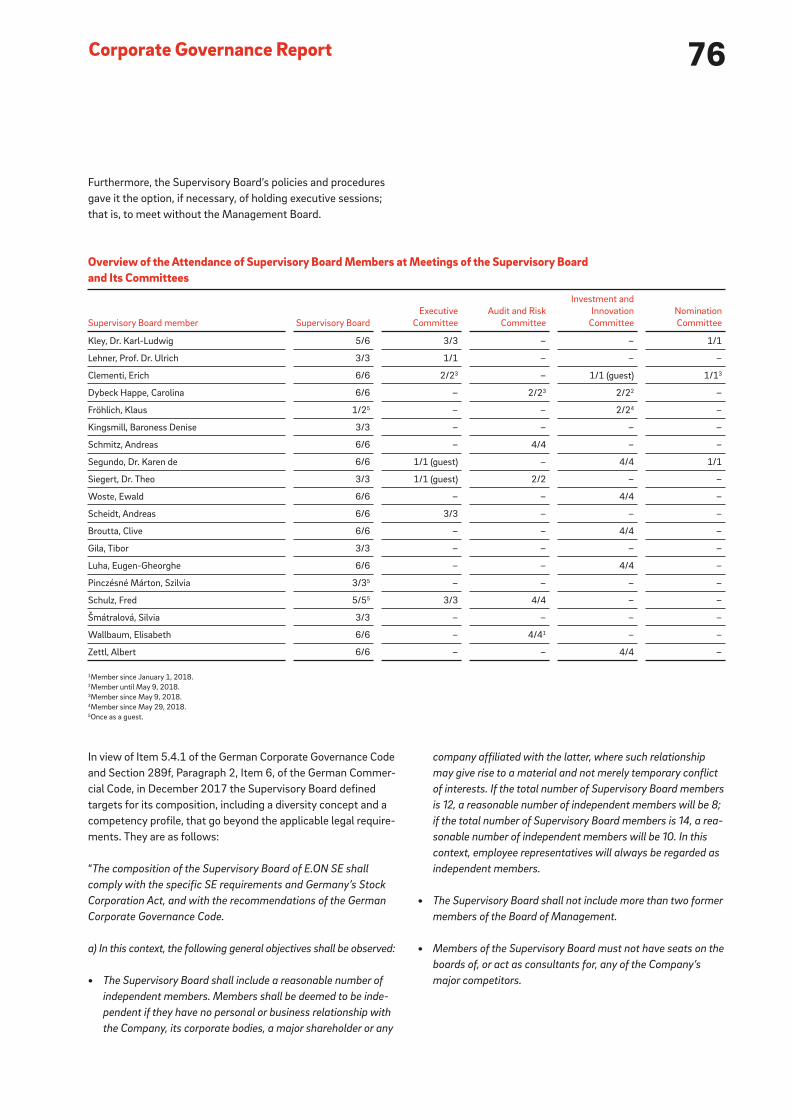
76Corporate Governance Report
Furthermore, the Supervisory Board’s policies and procedures
gave it the option, if necessary, of holding executive sessions;
that is, to meet without the Management Board.
In view of Item 5.4.1 of the German Corporate Governance Code
and Section 289f, Paragraph 2, Item 6, of the German Commer-
cial Code, in December 2017 the Supervisory Board defined
targets for its composition, including a diversity concept and a
competency profile, that go beyond the applicable legal require-
ments. They are as follows:
“The composition of the Supervisory Board of E.ON SE shall
comply with the specific SE requirements and Germany’s Stock
Corporation Act, and with the recommendations of the German
Corporate Governance Code.
a) In this context, the following general objectives shall be observed:
• The Supervisory Board shall include a reasonable number of
independent members. Members shall be deemed to be inde-
pendent if they have no personal or business relationship with
the Company, its corporate bodies, a major shareholder or any
company affiliated with the latter, where such relationship
may give rise to a material and not merely temporary conflict
of interests. If the total number of Supervisory Board members
is 12, a reasonable number of independent members will be 8;
if the total number of Supervisory Board members is 14, a rea-
sonable number of independent members will be 10. In this
context, employee representatives will always be regarded as
independent members.
• The Supervisory Board shall not include more than two former
members of the Board of Management.
• Members of the Supervisory Board must not have seats on the
boards of, or act as consultants for, any of the Company’s
major competitors.
Overview of the Attendance of Supervisory Board Members at Meetings of the Supervisory Board and Its Committees
Supervisory Board member Supervisory Board
Executive
Committee
Audit and Risk
Committee
Investment and
Innovation
Committee
Nomination
Committee
Kley, Dr. Karl-Ludwig 5/6 3/3 – – 1/1
Lehner, Prof. Dr. Ulrich 3/3 1/1 – – –
Clementi, Erich 6/6 2/23 – 1/1 (guest) 1/13
Dybeck Happe, Carolina 6/6 – 2/23 2/22 –
Fröhlich, Klaus 1/25 – – 2/24 –
Kingsmill, Baroness Denise 3/3 – – – –
Schmitz, Andreas 6/6 – 4/4 – –
Segundo, Dr. Karen de 6/6 1/1 (guest) – 4/4 1/1
Siegert, Dr. Theo 3/3 1/1 (guest) 2/2 – –
Woste, Ewald 6/6 – – 4/4 –
Scheidt, Andreas 6/6 3/3 – – –
Broutta, Clive 6/6 – – 4/4 –
Gila, Tibor 3/3 – – – –
Luha, Eugen-Gheorghe 6/6 – – 4/4 –
Pinczésné Márton, Szilvia 3/35 – – – –
Schulz, Fred 5/55 3/3 4/4 – –
Šmátralová, Silvia 3/3 – – – –
Wallbaum, Elisabeth 6/6 – 4/41 – –
Zettl, Albert 6/6 – – 4/4 –
1Member since January 1, 2018.2Member until May 9, 2018.3Member since May 9, 2018.4Member since May 29, 2018.5Once as a guest.

77CEO Letter
Report of the Supervisory Board
E.ON Stock
Strategy and Objectives
Combined Group Management Report
Combined Non-Financial Report
Consolidated Financial Statements
Further Information
• Supervisory Board membership shall usually be limited to no
more than three full terms of office (15 years).
• All Supervisory Board members must have sufficient time
available to perform their duties on the boards of various com-
panies. Persons who are members of the board of manage-
ment of a listed company shall only be eligible as members of
E.ON’s Supervisory Board if they do not have seats on a total
of more than two supervisory boards of listed non-Group com-
panies or of comparable supervisory bodies.
b) In addition, the Supervisory Board has adopted the following
diversity concept so as to ensure a balanced structure of the
Supervisory Board in terms of age, gender, personality, educatio-
nal background and professional experience.
• In the search for qualified Supervisory Board members, due
consideration shall be given to diversity. When preparing nom-
inations for the election of Supervisory Board members, due
consideration shall be given in each case to the question as to
whether complementary academic profiles, professional and
life experience, a balanced age mix, various personalities and
a reasonable gender balance benefit the Supervisory Board’s
work. In this context, care shall be taken to ensure that a gen-
der quota of 30 percent will be achieved; this shall apply to the
Supervisory Board as a whole and to the shareholders’ and
employees’ representatives separately.
• An upper age limit of 75 years shall apply to members of the
Supervisory Board; candidates shall not be older than 72 years
when they are elected.
• Four Supervisory Board members shall have international
experience, i.e. they shall have spent, for instance, many years
of their professional career outside Germany.
c) In addition, the following skills profile shall apply; especially
the Nominations Committee will strive to apply the skills profile
when preparing nominations of candidates for the shareholders’
representatives to be proposed to the Annual General Meeting.
• The shareholders’ representatives should have leadership
experience in companies or other large organizations by the
majority. At least four members shall have experience, as
management or supervisory board members, in the strategic
management or supervision of listed organizations and shall
be familiar with the functioning of capital and financial markets.
• At least two members shall be familiar, in particular, with
innovation, disruption and digitization and the associated new
business models and cultural change.
• At least four members shall have specific expertise in the
businesses and markets that are particularly relevant for
E.ON. This includes in particular the energy sector, the sales
and retail business, regulated industries, new technology as
well as relevant customer sectors.
• At least two independent representatives of the shareholders
shall have expertise in the fields of accounting, risk manage-
ment and auditing of financial statements.
• At least two members shall be familiar with legal and compli-
ance, HR, IT and sustainability.“
Current Compositiona) The Supervisory Board believes that all of its members are
independent. No former Management Board member sits on
the Supervisory Board. Furthermore, no member has a seat on
the boards of, or acts as a consultant for, any of the Company’s
major competitors or has been on the Supervisory Board for
more than three full terms of office (15 years). The Supervisory
Board believes that in the case of no Supervisory Board member
is there specific indications of relevant situations or relationships
that could give rise to a conflict of interests. Only one manage-
ment board member of a listed company, Klaus Fröhlich, a mem-
ber of the Board of Management of Bayerische Motoren Werke
Aktiengesellschaft, sits on the Supervisory Board.
b) In its current composition the Supervisory Board meets the
objectives of its diversity concept. The Supervisory Board’s
composition of women and men complies with the legal require-
ments for minimum percentages; separate compliance with
the statutory gender quota occurred from the 2018 Annual
Shareholders Meeting. The age range of the Supervisory Board
is currently 43 to 72 years, with an average age of 57. At least
four members have international experience.
c) The members bring a wide range of specific knowledge to
committee work and have special expertise in one or more busi-
nesses and markets relevant to the Company.
Current CVs of Supervisory Board members are published on
the Company’s Internet page.

78Corporate Governance Report
Supervisory Board, generally once a year, on the status and
effectiveness of, and possible ways of improving, the Company’s
corporate governance and on new requirements and develop-
ments in this area.
The Audit and Risk Committee consists of four members. The
Supervisory Board believes that, in their entirety, the members
of the Audit and Risk Committee are familiar with the sector in
which the Company operates. According to the AktG, the Audit
and Risk Committee must include one Supervisory Board mem-
ber who has expertise in accounting or auditing. The Super-
visory Board believes that in particular Andreas Schmitz fulfills
this requirement. Pursuant to the recommendations of the Ger-
man Corporate Governance Code, the Chairperson of the Audit
and Risk Committee should have special knowledge and experi-
ence in the application of accounting principles and internal
control processes. In addition, this person should be independent
and should not be a former Management Board member whose
service on the Management Board ended less than two years
ago. The Supervisory Board believes that the Chairman of the
Audit and Risk Committee, Andreas Schmitz, fulfills these require-
ments. In particular, the Audit and Risk Committee deals with
accounting issues (including the accounting process), risk
management, compliance, the necessary independence of the
independent auditor, the issuance of the audit mandate to
the independent auditor, the definition of the audit priorities,
the agreement regarding the independent auditor’s fees, and
any additional services performed by the independent auditor.
The committee’s monitoring of risk management encompasses
reviewing the effectiveness of the internal control system, inter-
nal risk management, and the internal audit system. The com-
mittee also prepares the Supervisory Board’s decision on the
approval of the Financial Statements of E.ON SE and the Consol-
idated Financial Statements. It is responsible for the preliminary
review of the Financial Statements of E.ON SE, the Management
Report, the Consolidated Financial Statements, the Combined
Group Management Report and the proposal for profit appro-
priation of profits as well as—if these are not already part of the
The Management Board and the Supervisory Board intend to
propose to the 2019 Annual Shareholders Meeting that the
number of Supervisory Board members be increased by six per-
sons to make it possible for innogy employee representatives
to join the Supervisory Board of the parent company, E.ON SE,
shortly after the takeover of innogy SE. This would prevent half
the workforce not being represented on the E.ON SE Super-
visory Board after the implementation of the innogy takeover.
The enlargement of the Supervisory Board is to take effect
with the implementation of the innogy takeover. From the 2023
Annual Shareholders Meeting onward, the E.ON SE Supervisory
Board is to have a total of twelve members. In view of continually
changing business requirements, the Supervisory Board will
continue to identify necessary competencies early to ensure that
it has them.
The Supervisory Board has established the following committees
and defined policies and procedures for them:
The Executive Committee consists of four members: the Super-
visory Board Chairperson, his or her two Deputies, and a further
employee representative. It prepares the meetings of the Super-
visory Board and advises the Management Board on matters of
general policy relating to the Company’s strategic development.
In urgent cases (in other words, if waiting for the Supervisory
Board’s prior approval would materially prejudice the Company),
the Executive Committee acts on the full Supervisory Board’s
behalf. In addition, a key task of the Executive Committee is to
prepare the Supervisory Board’s personnel decisions and reso-
lutions for setting the respective total compensation of individual
Management Board members within the meaning of Section 87,
AktG. Furthermore, it is responsible for the conclusion, alteration,
and termination of the service agreements of Management
Board members and for presenting the Supervisory Board with
a proposal for a resolution on the Management Board’s com-
pensation plan and its periodic review. In addition, it prepares
the Supervisory Board’s decision on the Group’s investment,
financial, and personnel plan for the next financial year. It also
deals with corporate-governance matters and reports to the

79CEO Letter
Report of the Supervisory Board
E.ON Stock
Strategy and Objectives
Combined Group Management Report
Combined Non-Financial Report
Consolidated Financial Statements
Further Information
(Combined Group) Management Report—the separate Non-
Financial Report and the separate Combined Non-Financial
Report. It discusses the half-yearly reports and quarterly state-
ments or financial reports with the Management Board prior
to their publication. The effectiveness of the internal control
mechanisms for the accounting process used at E.ON SE and
the Group’s units is tested on a regular basis by our Internal
Audit division; the Audit and Risk Committee regularly monitors
the work done by the Internal Audit division and the definition
of audit priorities. The Audit and Risk Committee may commis-
sion an external review of the contents of the Non-Financial
Statement or the separate Non-Financial Report or the Com-
bined Non-Financial Statement or the separate Combined
Non-Financial Report. In addition, the Audit and Risk Committee
prepares the proposal on the selection of the Company’s inde-
pendent auditor for the Annual Shareholders Meeting. In order
to ensure the auditor’s independence, the Audit and Risk Com-
mittee secures a statement from the proposed auditor detailing
any facts that could lead to the audit firm being excluded for
independence reasons or otherwise conflicted.
In being assigned the audit task, the independent auditor agrees
to:
• promptly inform the Chairperson of the Audit and Risk Com-
mittee should any such facts arise during the course of the
audit unless such facts are resolved in a satisfactory manner
• promptly inform the Supervisory Board of anything it
becomes aware of during the course of the audit that is of
relevance to the Supervisory Board’s duties
• inform the Chairperson of the Audit and Risk Committee,
or to note in the audit report, if the audit has led to findings
that contradict the Declaration of Compliance with the
German Corporate Governance Code by the Management
Board or Supervisory Board.
The Investment and Innovation Committee consists of six
members. It advises the Management Board on all issues of
Group financing and investment planning as well as issues
relating to market developments and innovation. It decides on
behalf of the Supervisory Board on the approval of the acqui-
sition and disposition of companies, equity interests, and parts
of companies whose value exceeds €300 million but does not
exceed €600 million. In addition, it decides on behalf of the
Supervisory Board on the approval of financing measures whose
value exceeds €1 billion but not €2.5 billion if such measures
are not covered by the Supervisory Board’s resolutions regarding
finance plans. If the value of any such transactions or measures
exceeds the aforementioned thresholds, the committee prepares
the Supervisory Board’s decision.
The Nomination Committee consists of three sharehold-
er-representative members. Its Chairperson is the Chairperson
of the Supervisory Board. Its task is to recommend to the Super-
visory Board, taking into consideration the Supervisory Board’s
targets for its composition, suitable candidates for election to
the Supervisory Board by the Annual Shareholders Meeting.
All committees meet at regular intervals and when specific cir-
cumstances require it under their policies and procedures. The
Report of the Supervisory Board (on pages 8 to 9) contains infor-
mation about the activities of the Supervisory Board and its
committees in the year under review. Pages 242 and 243 show
the composition of the Supervisory Board and its committees.
80
Shareholders and Annual Shareholders Meeting E.ON SE shareholders exercise their rights and vote their shares
at the Annual Shareholders Meeting. The convening of the
Annual Shareholders Meeting and the reports and documents
required by law for the Annual Shareholders Meeting, including
the Annual Report, are published on the Company’s Internet
page together with the agenda and the explanation of the con-
ditions of participation, shareholders’ rights, and any counter-
motions and election proposals submitted by shareholders. The
Company’s financial calendar, which is published in the Annual
Report, in the quarterly statements or financial reports, and on
the Internet at www.eon.com, regularly informs shareholders
about important Company dates.
At the Annual Shareholders Meeting, shareholders may vote
their shares themselves, through a proxy of their choice, or
through a Company proxy who is required to follow the share-
holder’s voting instructions.
As stipulated by German law, the Annual Shareholders Meeting
votes to select the Company’s independent auditor.
At the Annual Shareholders Meeting on May 9, 2018, Price-
waterhouseCoopers GmbH, Wirtschaftsprüfungsgesellschaft,
was selected to be E.ON SE’s independent auditor for the 2018
financial year and to audit the Condensed Consolidated Interim
Financial Statements and Interim Group Management Report
for the 2018 financial year and the first quarter of 2019. The
independent auditors with signing authority for the Annual
Financial Statements of E.ON SE and the Consolidated Financial
Statements are Markus Dittmann (since the 2014 financial year)
and Aissata Touré (since the 2015 financial year).
Women and Men in Leadership Positions Pursuant to Section 76, Paragraph 4, and Section 111, Paragraph 5, of the German Stock Corporation Act In the reporting period, the Management Board consisted ini-
tially of four and subsequently of five men. In December 2016
the Supervisory Board set a new target of 20 percent for the
proportion of women on the Management Board and a deadline
of December 31, 2021, for implementation.
In May 2017 the Management Board set targets of 30 percent
for the proportion of women in the first level of management
below the Management Board and a target of 35 percent for the
second level of management below the Management Board.
The deadline for achieving both targets is June 30, 2022. At year-
end 2018, the proportion of women in first and second levels
of management below the Management Board was roughly
24 percent and roughly 18 percent, respectively.
For all other E.ON Group companies concerned, targets and dead-
lines pursuant to the Law for the Equal Participation of Women
and Men in Leadership Positions in the Private Sector and the
Public Sector were set for the proportion of women on these com-
panies’ supervisory board and management board or team of
managing directors as well as in the next two levels of manage-
ment. The deadline for achieving these targets is June 30, 2022.
Corporate Governance Report
81CEO Letter
Report of the Supervisory Board
E.ON Stock
Strategy and Objectives
Combined Group Management Report
Combined Non-Financial Report
Consolidated Financial Statements
Further Information
Diversity Concept for the Management BoardAt its meeting in December 2017 the E.ON SE Supervisory
Board adopted a resolution on the following succession plan-
ning/diversity concept for the Management Board:
In cooperation with the Executive Committee and the Manage-
ment Board, the Supervisory Board is in charge of long-term
succession planning for the Management Board. With regard to
the Management Board’s composition, the Supervisory Board
of E.ON SE has developed a diversity concept that is in line with
the relevant recommendations of the German Corporate Gover-
nance Code.
Appointment Objectives
• When appointing members of the Management Board, the
candidates’ outstanding professional qualifications, long-
term leadership experience and past performance, as well as
value- driven management shall be of paramount importance.
Members shall be capable of taking forward-looking strate-
gic decisions. In particular, they shall be capable of managing
businesses sustainably and of ensuring that they are consis-
tently focused on customer needs.
• The Management Board as a whole must have expertise and
experience in the energy sector as well as in the fields of
finance and digitization.
• The members of the Management Board shall be leaders and
as such shall act as role models for the employees through
their own performance and conduct.
• Attention shall be paid to diversity when appointing mem-
bers of the Management Board. For the Supervisory Board,
diversity means, in particular, different complementary
academic profiles, professional and personal experience,
personalities, as well as internationality and a reasonable age
and gender structure. The Supervisory Board has therefore
adopted a target quota of 20 percent for the share of women
on the Management Board; this target shall be achieved by
December 31, 2021.
• The appointment period of a member of the Management
Board shall generally end at the end of the month on which
the Management Board member reaches the general retire-
ment age but at the close of the subsequent Annual Share-
holders Meeting at the latest.
Achievement of ObjectivesWith the exception of the target quota regarding the share of
women, which is to be achieved by December 31, 2021, the
current composition of the Management Board already meets
the appointment objectives described above.
82Corporate Governance Report
E.ON’s stock price in absolute terms but also on a comparison
with competitors. Share ownership guidelines further strengthen
E.ON’s capital-market orientation and shareholder culture.
The Supervisory Board approves the Executive Committee’s
proposal for the Management Board’s compensation plan. It
reviews the plan and the appropriateness of the Management
Board’s total compensation as well as the individual components
on a regular basis and, if necessary, makes adjustments. It con-
siders the provisions of the German Stock Corporation Act and
follows the German Corporate Governance Code’s recommen-
dations and suggestions. In its review of the compensation plan’s
market conformity and the appropriateness of compensation
levels, the Supervisory Board was supported by an external com-
pensation expert.
The compensation plan that took effect on January 1, 2017,
was presented to the 2016 Annual Shareholders Meeting and
approved by a majority of 91.14 percent.
Compensation Report Pursuant to Section 289a, Paragraph 2, and Section 315a, Paragraph 2 of the German Commercial Code
This compensation report describes the basic features of the
compensation plans for members of the E.ON SE Management
Board and Supervisory Board and provides information about
the compensation granted and paid in 2018. It applies the pro-
visions of accounting standards for capital-market-oriented
companies (the German Commercial Code, German Accounting
Standards, and International Financial Reporting Standards) and
the recommendations of the German Corporate Governance
Code dated February 7, 2017.
Basic Features of the Management Board Compensation PlanThe Management Board compensation plan that took effect on
January 1, 2017, is supposed to create an incentive for success-
ful and sustainable corporate governance and to link the com-
pensation of Management Board members with the Company’s
short-term and long-term performance while also factoring in
their individual performance. The plan’s parameters are there-
fore transparent, performance-based, and aligned with the
Company’s business success; variable compensation is based
predominantly on multi-year metrics. In order to align manage-
ment’s and shareholders’ interests and objectives, long-term
variable compensation is based not only on the development of
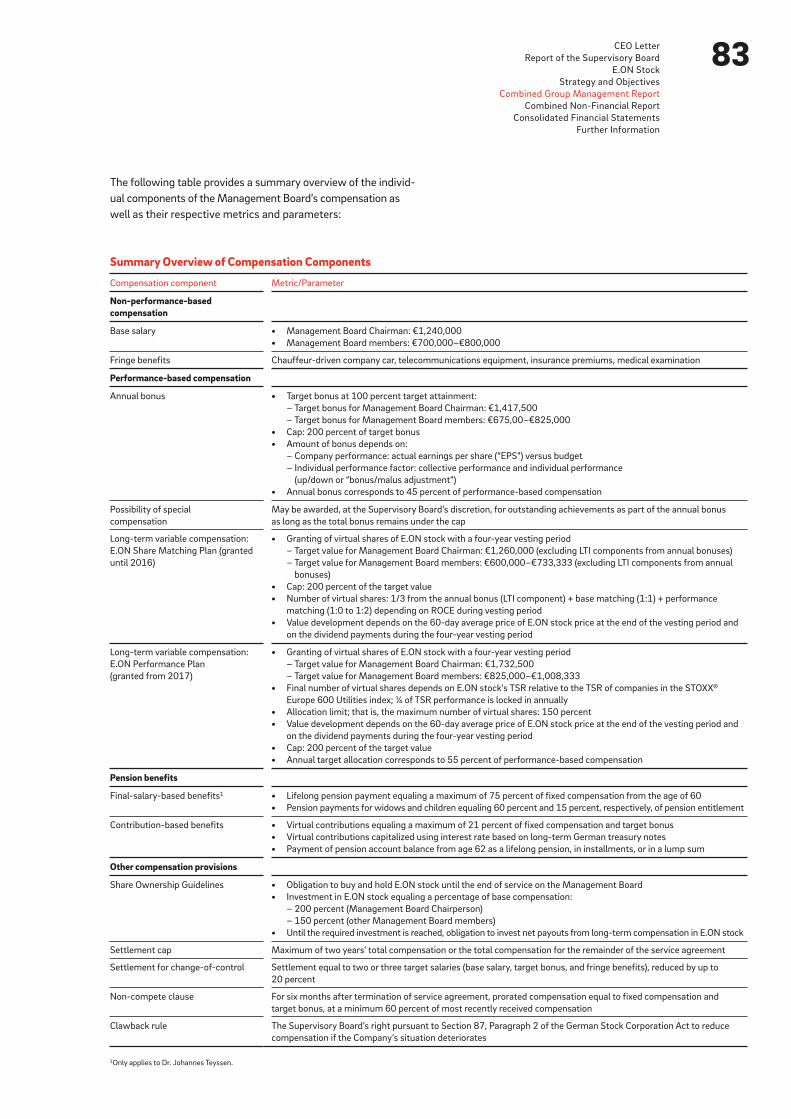
83CEO Letter
Report of the Supervisory Board
E.ON Stock
Strategy and Objectives
Combined Group Management Report
Combined Non-Financial Report
Consolidated Financial Statements
Further Information
The following table provides a summary overview of the individ-
ual components of the Management Board’s compensation as
well as their respective metrics and parameters:
Summary Overview of Compensation Components
Compensation component Metric/Parameter
Non-performance-based compensation
Base salary • Management Board Chairman: €1,240,000
• Management Board members: €700,000–€800,000
Fringe benefits Chauffeur-driven company car, telecommunications equipment, insurance premiums, medical examination
Performance-based compensation
Annual bonus • Target bonus at 100 percent target attainment:
– Target bonus for Management Board Chairman: €1,417,500
– Target bonus for Management Board members: €675,00–€825,000
• Cap: 200 percent of target bonus
• Amount of bonus depends on:
– Company performance: actual earnings per share (“EPS”) versus budget
– Individual performance factor: collective performance and individual performance
(up/down or “bonus/malus adjustment”)
• Annual bonus corresponds to 45 percent of performance-based compensation
Possibility of special
compensation
May be awarded, at the Supervisory Board’s discretion, for outstanding achievements as part of the annual bonus
as long as the total bonus remains under the cap
Long-term variable compensation:
E.ON Share Matching Plan (granted
until 2016)
• Granting of virtual shares of E.ON stock with a four-year vesting period
– Target value for Management Board Chairman: €1,260,000 (excluding LTI components from annual bonuses)
– Target value for Management Board members: €600,000–€733,333 (excluding LTI components from annual
bonuses)
• Cap: 200 percent of the target value
• Number of virtual shares: 1/3 from the annual bonus (LTI component) + base matching (1:1) + performance
matching (1:0 to 1:2) depending on ROCE during vesting period
• Value development depends on the 60-day average price of E.ON stock price at the end of the vesting period and
on the dividend payments during the four-year vesting period
Long-term variable compensation:
E.ON Performance Plan
(granted from 2017)
• Granting of virtual shares of E.ON stock with a four-year vesting period
– Target value for Management Board Chairman: €1,732,500
– Target value for Management Board members: €825,000–€1,008,333
• Final number of virtual shares depends on E.ON stock’s TSR relative to the TSR of companies in the STOXX®
Europe 600 Utilities index; ¼ of TSR performance is locked in annually
• Allocation limit; that is, the maximum number of virtual shares: 150 percent
• Value development depends on the 60-day average price of E.ON stock price at the end of the vesting period and
on the dividend payments during the four-year vesting period
• Cap: 200 percent of the target value
• Annual target allocation corresponds to 55 percent of performance-based compensation
Pension benefits
Final-salary-based benefits1 • Lifelong pension payment equaling a maximum of 75 percent of fixed compensation from the age of 60
• Pension payments for widows and children equaling 60 percent and 15 percent, respectively, of pension entitlement
Contribution-based benefits • Virtual contributions equaling a maximum of 21 percent of fixed compensation and target bonus
• Virtual contributions capitalized using interest rate based on long-term German treasury notes
• Payment of pension account balance from age 62 as a lifelong pension, in installments, or in a lump sum
Other compensation provisions
Share Ownership Guidelines • Obligation to buy and hold E.ON stock until the end of service on the Management Board
• Investment in E.ON stock equaling a percentage of base compensation:
– 200 percent (Management Board Chairperson)
– 150 percent (other Management Board members)
• Until the required investment is reached, obligation to invest net payouts from long-term compensation in E.ON stock
Settlement cap Maximum of two years’ total compensation or the total compensation for the remainder of the service agreement
Settlement for change-of-control Settlement equal to two or three target salaries (base salary, target bonus, and fringe benefits), reduced by up to
20 percent
Non-compete clause For six months after termination of service agreement, prorated compensation equal to fixed compensation and
target bonus, at a minimum 60 percent of most recently received compensation
Clawback rule The Supervisory Board’s right pursuant to Section 87, Paragraph 2 of the German Stock Corporation Act to reduce
compensation if the Company’s situation deteriorates
1Only applies to Dr. Johannes Teyssen.

84Corporate Governance Report
Components and Compensation StructureThe compensation of Management Board members consists
of a fixed base salary, an annual bonus, and long-term variable
compensation. The components account for the following per-
centages of total compensation:1
The following graphic provides an overview of the compensation
plan for Management Board members:
1Not including fringe, other, and pension benefits.
30%Base salary
39%E.ON Performance
Plan (multi-year)
31%Bonus
(annual)
Variable compensation (~ 70%)
Non-performance-based compensation (~ 30%)
E.ON Performance Plan (LTI)—stock-based
Depends on:
TSR performance
relative to
peer companies
Depends on:
Actual EPS
versus budget
individual
performance
Bonus (STI)
Granting
of virtual
shares (with
performance
requirement)
Paid out after
the conclusion
of the fi nancial
year
55%
45%
Base salary
Share Ownership Guidelines
Non-Performance-Based CompensationNo revisions were made to non-performance-based compensa-
tion relative to the previous financial year.
Management Board members receive their fixed compensation
in twelve monthly payments.
Management Board members receive a number of contractual
fringe benefits, including the use of a chauffeur-driven company
car. The Company also provides them with the necessary tele-
communications equipment, covers costs that include those for
a periodic medical examination, and pays the premium for an
accident insurance policy.
Performance-Based CompensationNo revisions were made to performance-based compensation
relative to the previous financial year.
55 percent of performance-based compensation depends on
the achievement of long-term targets, ensuring that the variable
compensation is sustainable under the criteria of Section 87 of
the German Stock Corporation Act.
Annual BonusManagement Board members’ annual bonus (45 percent of the
performance-based compensation) consists of a cash payment
made after the end of the financial year.
The amount of the annual bonus is determined by the degree
to which certain performance targets are attained. The target-
setting mechanism consists of company performance targets
and individual performance targets.
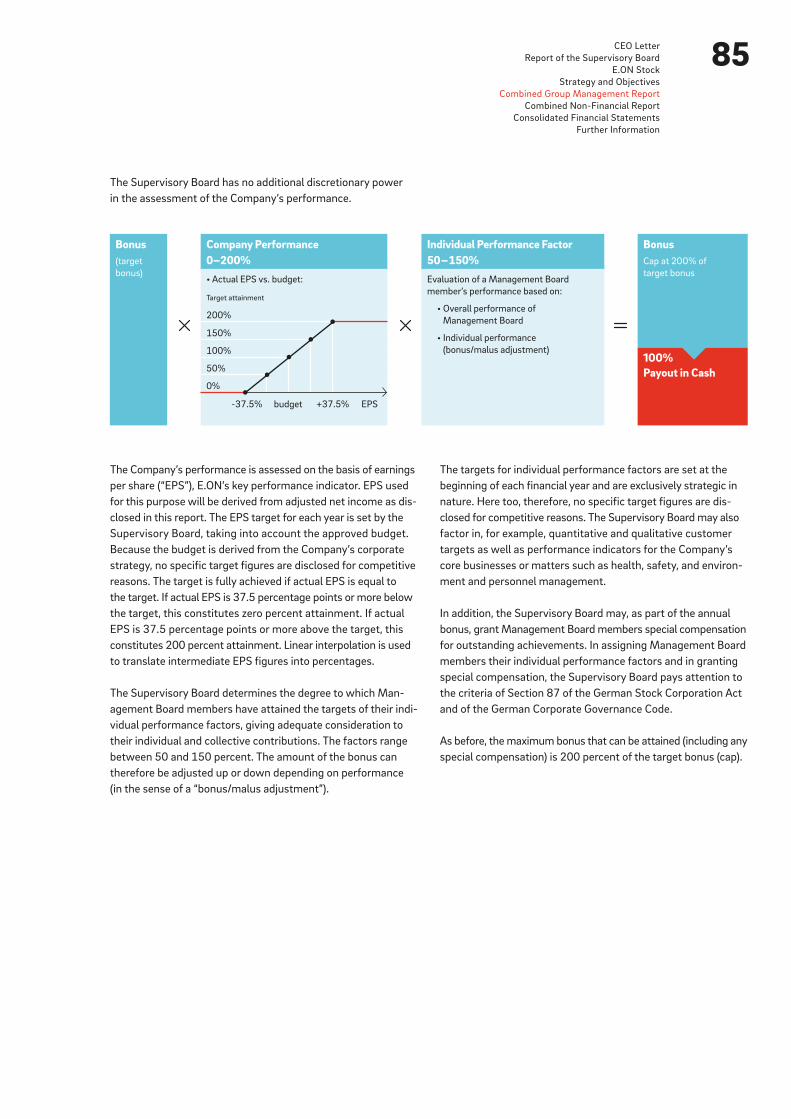
85CEO Letter
Report of the Supervisory Board
E.ON Stock
Strategy and Objectives
Combined Group Management Report
Combined Non-Financial Report
Consolidated Financial Statements
Further Information
The Supervisory Board has no additional discretionary power
in the assessment of the Company’s performance.
The Company’s performance is assessed on the basis of earnings
per share (“EPS”), E.ON’s key performance indicator. EPS used
for this purpose will be derived from adjusted net income as dis-
closed in this report. The EPS target for each year is set by the
Supervisory Board, taking into account the approved budget.
Because the budget is derived from the Company’s corporate
strategy, no specific target figures are disclosed for competitive
reasons. The target is fully achieved if actual EPS is equal to
the target. If actual EPS is 37.5 percentage points or more below
the target, this constitutes zero percent attainment. If actual
EPS is 37.5 percentage points or more above the target, this
constitutes 200 percent attainment. Linear interpolation is used
to translate intermediate EPS figures into percentages.
The Supervisory Board determines the degree to which Man-
agement Board members have attained the targets of their indi-
vidual performance factors, giving adequate consideration to
their individual and collective contributions. The factors range
between 50 and 150 percent. The amount of the bonus can
therefore be adjusted up or down depending on performance
(in the sense of a “bonus/malus adjustment”).
The targets for individual performance factors are set at the
beginning of each financial year and are exclusively strategic in
nature. Here too, therefore, no specific target figures are dis-
closed for competitive reasons. The Supervisory Board may also
factor in, for example, quantitative and qualitative customer
targets as well as performance indicators for the Company’s
core businesses or matters such as health, safety, and environ-
ment and personnel management.
In addition, the Supervisory Board may, as part of the annual
bonus, grant Management Board members special compensation
for outstanding achievements. In assigning Management Board
members their individual performance factors and in granting
special compensation, the Supervisory Board pays attention to
the criteria of Section 87 of the German Stock Corporation Act
and of the German Corporate Governance Code.
As before, the maximum bonus that can be attained (including any
special compensation) is 200 percent of the target bonus (cap).
Company Performance 0–200%• Actual EPS vs. budget:
Target attainment
200%
150%
100%
50%
0%
-37.5% budget +37.5% EPS
Bonus (target
bonus)
100%Payout in Cash
Bonus Cap at 200% of
target bonus
Individual Performance Factor50–150%Evaluation of a Management Board
member’s performance based on:
• Overall performance of
Management Board
• Individual performance
(bonus/malus adjustment)

86Corporate Governance Report
may change in the course of the four-year vesting period
depending on the total shareholder return (“TSR”) of E.ON
stock compared with the TSR of the companies in a peer group
(“relative TSR”).
TSR is the yield of E.ON stock. It takes into account the stock
price, including the assumption that dividends are reinvested,
and is adjusted to exclude changes in capital. The peer group
used for relative TSR will be the companies in E.ON’s peer index,
the STOXX® Europe 600 Utilities.
During a tranche’s vesting period, E.ON’s TSR performance is
measured once a year in comparison with the companies in the
peer group and set for that year. E.ON SE’s TSR performance
in a given year determines the final number of one fourth of the
virtual shares granted at the beginning of the vesting period.
For this purpose, the TSRs of all companies are ranked, and
E.ON SE’s relative position is determined based on the percentile
reached. Target attainment is 100 percent if E.ON SE’s TSR is
equal to the median of the peer group. The lower threshold is the
25th percentile; a TSR performance below this threshold would
reduce the number of virtual shares granted by one quarter. If
E.ON’s performance is at or above the 75th percentile (upper
cap) the quarter of virtual shares granted for that particular year
increases to a maximum of 150 percent. Linear interpolation is
used to translate intermediate figures into percentage.
Long-Term Variable CompensationLong-term variable compensation currently consists of tranches
from several financial years granted under two different plans.
First, tranches of the E.ON Performance Plan—Performance Plan,
first tranche (2017–2020) and second tranche (2018–2021)—
were granted in 2017 and 2018. Second, there are still tranches
of the E.ON Share Matching Plan outstanding. The last tranche
of the E.ON Share Matching Plan—Share Matching Plan, fourth
tranche (2016–2020) and the LTI components of the bonus
from 2016 Share Matching Plan, fifth tranche (2017–2021)—
was granted in 2016.
E.ON Performance Plan (Granted from 2017)Management Board members receive stock-based, long-term
variable compensation under the E.ON Performance Plan, which
replaced the E.ON Share Matching Plan as the Company’s new
long-term compensation plan effective January 1, 2017. Each
tranche of the E.ON Performance Plan has a vesting period
of four years to serve as a long-term incentive for sustainable
business performance. Vesting periods start on January 1.
The Supervisory Board grants virtual shares to each member
of the Management Board in the amount of the contractually
agreed-on target. The conversion into virtual shares is based on
the fair market value on the date when the shares are granted.
The fair market value is determined by applying methods accepted
in financial mathematics, taking into account the expected future
payout, and hence, the volatility and risk associated with the
E.ON Performance Plan. The number of granted virtual shares
Initial Number of Granted Share Units
Share Price+Dividends
Payout Amount Cap at 200%
of target value
TSR Performance Relative to Peer Group
25th percentile
Lower
threshold
50th percentile
(Median)
Target value
75th percentile
Upper
threshold
TSR of the E.ON share compared to the companies
of the STOXX® Europe 600 Utilities index (yearly lock-in)
Target achievement
200%
175%
150%
125%
100%
75%
50%
25%
0%
Percentile
achieved
by E.ON
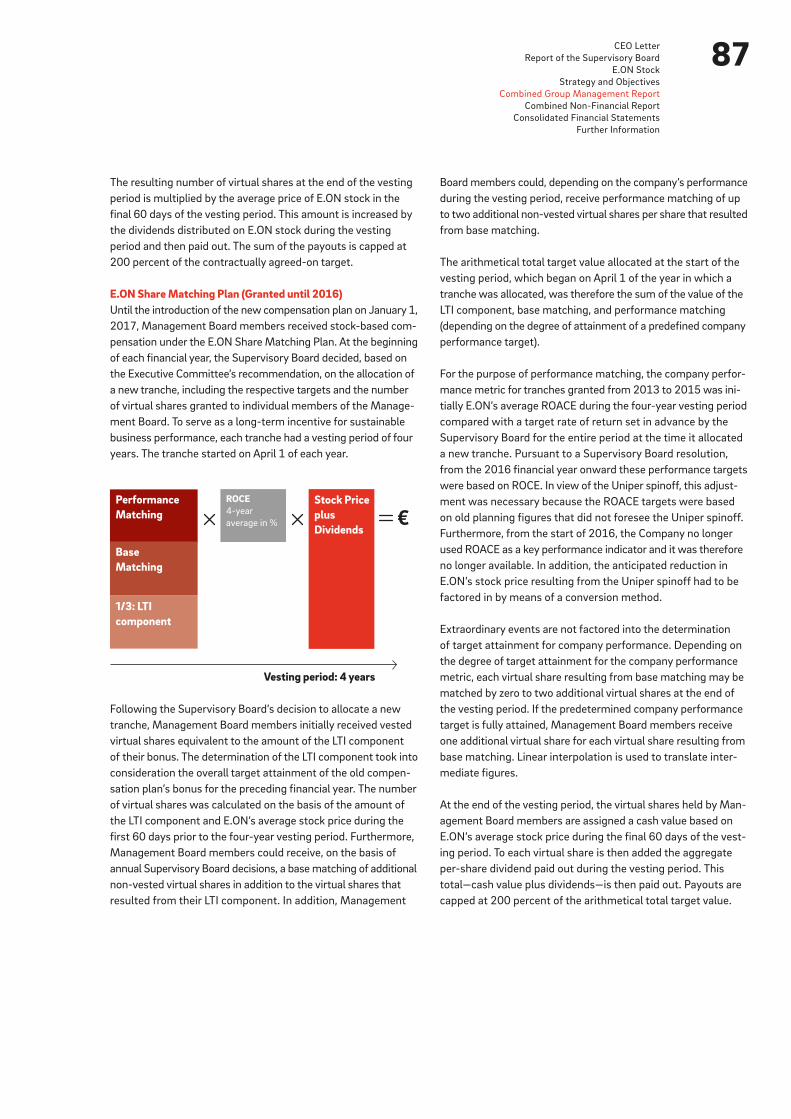
87CEO Letter
Report of the Supervisory Board
E.ON Stock
Strategy and Objectives
Combined Group Management Report
Combined Non-Financial Report
Consolidated Financial Statements
Further Information
The resulting number of virtual shares at the end of the vesting
period is multiplied by the average price of E.ON stock in the
final 60 days of the vesting period. This amount is increased by
the dividends distributed on E.ON stock during the vesting
period and then paid out. The sum of the payouts is capped at
200 percent of the contractually agreed-on target.
E.ON Share Matching Plan (Granted until 2016)Until the introduction of the new compensation plan on January 1,
2017, Management Board members received stock-based com-
pensation under the E.ON Share Matching Plan. At the beginning
of each financial year, the Supervisory Board decided, based on
the Executive Committee’s recommendation, on the allocation of
a new tranche, including the respective targets and the number
of virtual shares granted to individual members of the Manage-
ment Board. To serve as a long-term incentive for sustainable
business performance, each tranche had a vesting period of four
years. The tranche started on April 1 of each year.
Following the Supervisory Board’s decision to allocate a new
tranche, Management Board members initially received vested
virtual shares equivalent to the amount of the LTI component
of their bonus. The determination of the LTI component took into
consideration the overall target attainment of the old compen-
sation plan’s bonus for the preceding financial year. The number
of virtual shares was calculated on the basis of the amount of
the LTI component and E.ON’s average stock price during the
first 60 days prior to the four-year vesting period. Furthermore,
Management Board members could receive, on the basis of
annual Supervisory Board decisions, a base matching of additional
non-vested virtual shares in addition to the virtual shares that
resulted from their LTI component. In addition, Management
ROCE4-year
average in %
PerformanceMatching
BaseMatching
Stock PriceplusDividends
Vesting period: 4 years
1/3: LTIcomponent
€
Board members could, depending on the company’s performance
during the vesting period, receive performance matching of up
to two additional non-vested virtual shares per share that resulted
from base matching.
The arithmetical total target value allocated at the start of the
vesting period, which began on April 1 of the year in which a
tranche was allocated, was therefore the sum of the value of the
LTI component, base matching, and performance matching
(depending on the degree of attainment of a predefined company
performance target).
For the purpose of performance matching, the company perfor-
mance metric for tranches granted from 2013 to 2015 was ini-
tially E.ON’s average ROACE during the four-year vesting period
compared with a target rate of return set in advance by the
Supervisory Board for the entire period at the time it allocated
a new tranche. Pursuant to a Supervisory Board resolution,
from the 2016 financial year onward these performance targets
were based on ROCE. In view of the Uniper spinoff, this adjust-
ment was necessary because the ROACE targets were based
on old planning figures that did not foresee the Uniper spinoff.
Furthermore, from the start of 2016, the Company no longer
used ROACE as a key performance indicator and it was therefore
no longer available. In addition, the anticipated reduction in
E.ON’s stock price resulting from the Uniper spinoff had to be
factored in by means of a conversion method.
Extraordinary events are not factored into the determination
of target attainment for company performance. Depending on
the degree of target attainment for the company performance
metric, each virtual share resulting from base matching may be
matched by zero to two additional virtual shares at the end of
the vesting period. If the predetermined company performance
target is fully attained, Management Board members receive
one additional virtual share for each virtual share resulting from
base matching. Linear interpolation is used to translate inter-
mediate figures.
At the end of the vesting period, the virtual shares held by Man-
agement Board members are assigned a cash value based on
E.ON’s average stock price during the final 60 days of the vest-
ing period. To each virtual share is then added the aggregate
per-share dividend paid out during the vesting period. This
total—cash value plus dividends—is then paid out. Payouts are
capped at 200 percent of the arithmetical total target value.
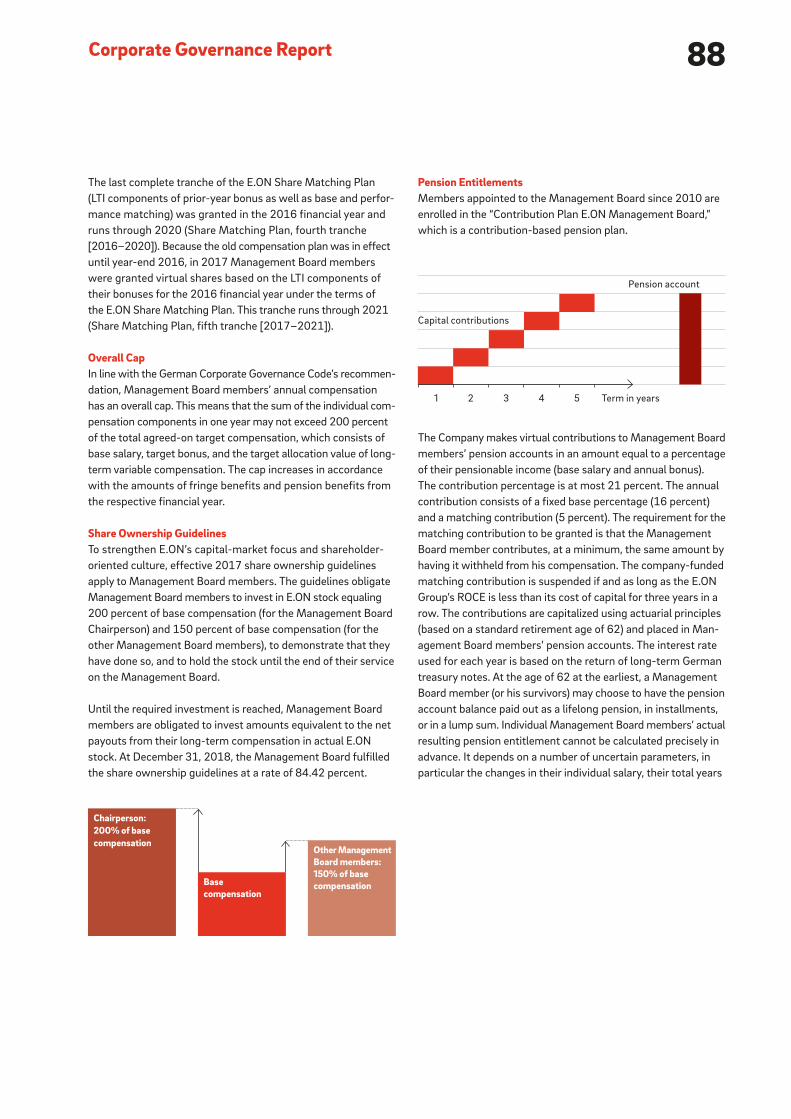
88
Pension EntitlementsMembers appointed to the Management Board since 2010 are
enrolled in the “Contribution Plan E.ON Management Board,”
which is a contribution-based pension plan.
The Company makes virtual contributions to Management Board
members’ pension accounts in an amount equal to a percentage
of their pensionable income (base salary and annual bonus).
The contribution percentage is at most 21 percent. The annual
contribution consists of a fixed base percentage (16 percent)
and a matching contribution (5 percent). The requirement for the
matching contribution to be granted is that the Management
Board member contributes, at a minimum, the same amount by
having it withheld from his compensation. The company-funded
matching contribution is suspended if and as long as the E.ON
Group’s ROCE is less than its cost of capital for three years in a
row. The contributions are capitalized using actuarial principles
(based on a standard retirement age of 62) and placed in Man-
agement Board members’ pension accounts. The interest rate
used for each year is based on the return of long-term German
treasury notes. At the age of 62 at the earliest, a Management
Board member (or his survivors) may choose to have the pension
account balance paid out as a lifelong pension, in installments,
or in a lump sum. Individual Management Board members’ actual
resulting pension entitlement cannot be calculated precisely in
advance. It depends on a number of uncertain parameters, in
particular the changes in their individual salary, their total years
Capital contributions
Pension account
5 Term in years4321
The last complete tranche of the E.ON Share Matching Plan
(LTI components of prior-year bonus as well as base and perfor-
mance matching) was granted in the 2016 financial year and
runs through 2020 (Share Matching Plan, fourth tranche
[2016–2020]). Because the old compensation plan was in effect
until year-end 2016, in 2017 Management Board members
were granted virtual shares based on the LTI components of
their bonuses for the 2016 financial year under the terms of
the E.ON Share Matching Plan. This tranche runs through 2021
(Share Matching Plan, fifth tranche [2017–2021]).
Overall CapIn line with the German Corporate Governance Code’s recommen-
dation, Management Board members’ annual compensation
has an overall cap. This means that the sum of the individual com-
pensation components in one year may not exceed 200 percent
of the total agreed-on target compensation, which consists of
base salary, target bonus, and the target allocation value of long-
term variable compensation. The cap increases in accordance
with the amounts of fringe benefits and pension benefits from
the respective financial year.
Share Ownership Guidelines To strengthen E.ON’s capital-market focus and shareholder-
oriented culture, effective 2017 share ownership guidelines
apply to Management Board members. The guidelines obligate
Management Board members to invest in E.ON stock equaling
200 percent of base compensation (for the Management Board
Chairperson) and 150 percent of base compensation (for the
other Management Board members), to demonstrate that they
have done so, and to hold the stock until the end of their service
on the Management Board.
Until the required investment is reached, Management Board
members are obligated to invest amounts equivalent to the net
payouts from their long-term compensation in actual E.ON
stock. At December 31, 2018, the Management Board fulfilled
the share ownership guidelines at a rate of 84.42 percent.
Chairperson:200% of base compensation
Base compensation
Other Management Board members:150% of base compensation
Corporate Governance Report

89CEO Letter
Report of the Supervisory Board
E.ON Stock
Strategy and Objectives
Combined Group Management Report
Combined Non-Financial Report
Consolidated Financial Statements
Further Information
of service, the attainment of company targets, and interest rates.
For a Management Board member enrolled in the plan at the
age of 50, the company-financed, contribution-based pension
payment is currently estimated to be between 30 and 35 percent
of his or her base salary (without factoring in pension benefits
accrued prior to being appointed to the Management Board).
The Company has agreed to a pension plan based on final salary
for the Management Board member, Dr. Johannes Teyssen, who
was appointed to the Management Board before 2010. Following
the end of his service for the Company, Dr. Johannes Teyssen is
entitled to receive lifelong monthly pension payments in three
cases: reaching the age of 60, permanent incapacitation, and a
so-called third pension situation. The criteria for this situation are
met if the termination or non-extension of Dr. Johannes Teyssen’s
service agreement is not due to his misconduct or rejection
of an offer of extension that is at least on a par with his existing
service agreement. In the third pension situation, Dr. Johannes
Teyssen would receive an early pension during the period between
the end of his service and his reaching 60 years of age (transi-
tional allowance). Dr. Johannes Teyssen’s pension entitlements
provide for annual pension payments equal to 75 percent of his
annual base salary. The full amount of any pension entitlements
from earlier employment is offset against these payments. In
addition, in the case of a Management Board member’s death,
the pension plan includes benefits for the widow and each child
that are equal to 60 percent and 15 percent, respectively, of
the deceased’s pension entitlement. Together, pension payments
to a widow or widower and children may not exceed 100 percent
of the deceased Management Board member’s pension.
Pursuant to the provisions of the German Occupational Pensions
Improvement Act, Management Board members’ pension entitle-
ments are not vested until they have been in effect for five years.
This applies to both contribution-based and final-salary-based
pension plans.
In line with the German Corporate Governance Code’s recommen-
dation, the Supervisory Board reviews, on a regular basis, the
benefits level of Management Board members and the resulting
annual and long-term expense and, if necessary, adjusts the
payments.
Settlement Payments for Termination of Management Board DutiesIn line with the German Corporate Governance Code’s recommen-
dation, the service agreements of Management Board members
include a settlement cap. Under the cap, settlement payments
in conjunction with a termination of Management Board duties
may not exceed the value of two years’ total compensation
or the total compensation for the remainder of the member’s
service agreement.
In the event of a premature loss of a Management Board position
due to a change of control, Management Board members are
entitled to settlement payments. The change-of-control agree-
ments stipulate that a change in control exists in three cases: a
third party acquires at least 30 percent of the Company’s voting
rights, thus triggering the automatic requirement to make an
offer for the Company pursuant to Germany’s Stock Corporation
Takeover Law; the Company, as a dependent entity, concludes
a corporate agreement; the Company is merged with a non-affili-
ated company. Management Board members are entitled to a
settlement payment if, within 12 months of the change of con-
trol, their service agreement is terminated by mutual consent,
expires, or is terminated by them (in the latter case, however, only
if their position on the Management Board is materially affected
by the change in control). Management Board members’ settle-
ment payment consists of their base salary and target bonus
plus fringe benefits for two years. In accordance with the German
Corporate Governance Code, the settlement payments for
Management Board members may not exceed 100 percent
of the above-described settlement cap.
The service agreements of Management Board members
include a non-compete clause. For a period of six months after
the termination of their service agreement, Management Board
members are contractually prohibited from working directly
or indirectly for a company that competes directly or indirectly
with the Company or its affiliates. Management Board mem-
bers receive a compensation payment for the period of the
non-compete restriction. The prorated payment is based on
100 percent of their contractually stipulated annual target
compensation (without long-term variable compensation) but
is, at a minimum, 60 percent of their most recently received
compensation.
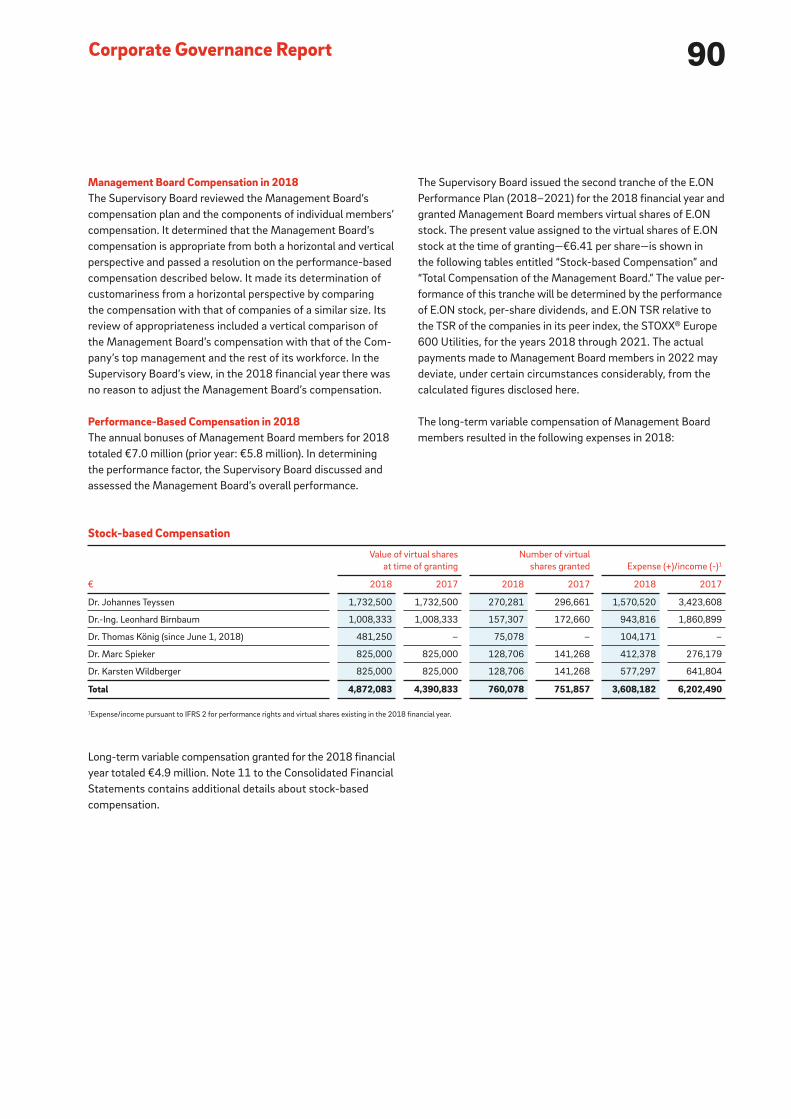
90Corporate Governance Report
The Supervisory Board issued the second tranche of the E.ON
Performance Plan (2018–2021) for the 2018 financial year and
granted Management Board members virtual shares of E.ON
stock. The present value assigned to the virtual shares of E.ON
stock at the time of granting—€6.41 per share—is shown in
the following tables entitled “Stock-based Compensation” and
“Total Compensation of the Management Board.” The value per-
formance of this tranche will be determined by the performance
of E.ON stock, per-share dividends, and E.ON TSR relative to
the TSR of the companies in its peer index, the STOXX® Europe
600 Utilities, for the years 2018 through 2021. The actual
payments made to Management Board members in 2022 may
deviate, under certain circumstances considerably, from the
calculated figures disclosed here.
The long-term variable compensation of Management Board
members resulted in the following expenses in 2018:
Management Board Compensation in 2018The Supervisory Board reviewed the Management Board’s
compensation plan and the components of individual members’
compensation. It determined that the Management Board’s
compensation is appropriate from both a horizontal and vertical
perspective and passed a resolution on the performance-based
compensation described below. It made its determination of
customariness from a horizontal perspective by comparing
the compensation with that of companies of a similar size. Its
review of appropriateness included a vertical comparison of
the Management Board’s compensation with that of the Com-
pany’s top management and the rest of its workforce. In the
Supervisory Board’s view, in the 2018 financial year there was
no reason to adjust the Management Board’s compensation.
Performance-Based Compensation in 2018The annual bonuses of Management Board members for 2018
totaled €7.0 million (prior year: €5.8 million). In determining
the performance factor, the Supervisory Board discussed and
assessed the Management Board’s overall performance.
Long-term variable compensation granted for the 2018 financial
year totaled €4.9 million. Note 11 to the Consolidated Financial
Statements contains additional details about stock-based
compensation.
Stock-based Compensation
€
Value of virtual shares
at time of granting
Number of virtual
shares granted
Expense (+)/income (-)1
2018 2017 2018 2017 2018 2017
Dr. Johannes Teyssen 1,732,500 1,732,500 270,281 296,661 1,570,520 3,423,608
Dr.-Ing. Leonhard Birnbaum 1,008,333 1,008,333 157,307 172,660 943,816 1,860,899
Dr. Thomas König (since June 1, 2018) 481,250 – 75,078 – 104,171 –
Dr. Marc Spieker 825,000 825,000 128,706 141,268 412,378 276,179
Dr. Karsten Wildberger 825,000 825,000 128,706 141,268 577,297 641,804
Total 4,872,083 4,390,833 760,078 751,857 3,608,182 6,202,490
1Expense/income pursuant to IFRS 2 for performance rights and virtual shares existing in the 2018 financial year.

91CEO Letter
Report of the Supervisory Board
E.ON Stock
Strategy and Objectives
Combined Group Management Report
Combined Non-Financial Report
Consolidated Financial Statements
Further Information
Pensions of Management Board Members Pursuant to the German Commercial Code
Current pension entitlement at December 31 Additions to provisions for pensions Cash value at December 31
As a percentage
of annual base
compensation (€) (€)
Thereof interest cost
(€) (€)
2018 2017 2018 2017 2018 2017 2018 2017 2018 2017
Dr. Johannes Teyssen 75 75 930,000 930,000 2,558,564 1,823,372 696,853 686,225 21,494,788 18,936,224
Dr.-Ing. Leonhard Birnbaum1 – – – – 156,636 95,578 40,104 39,868 1,246,423 1,089,787
Dr. Thomas König1, 2
(since June 1, 2018) – – – – 356,229 – 58,302 – 1,940,535 –
Dr. Marc Spieker1 – – – – 66,048 148,005 23,324 19,481 699,857 633,809
Dr. Karsten Wildberger1 – – – – 190,863 188,871 15,278 9,074 606,025 415,162
1Contribution Plan E.ON Management Board.2Dr. König was already employed by the Company in the prior year. Due to his previous years of service, the cash value of his pension entitlement was €1,584,306 at December 31, 2017.
Pensions of Management Board Members Pursuant to IFRS
Current pension entitlement at December 31 Additions to provisions for pensions Cash value at December 31
As a percentage
of annual base
compensation (€) (€)
Thereof interest cost
(€) (€)
2018 2017 2018 2017 2018 2017 2018 2017 2018 2017
Dr. Johannes Teyssen 75 75 930,000 930,000 1,378,642 1,369,019 520,125 504,248 26,250,050 24,767,846
Dr.-Ing. Leonhard Birnbaum1 – – – – 332,609 398,343 27,917 26,775 1,450,521 1,329,403
Dr. Thomas König1, 2
(since June 1, 2018) – – – – 79,088 – 24,281 – 2,234,273 –
Dr. Marc Spieker1 – – – – 237,498 50,303 17,431 16,367 861,135 830,032
Dr. Karsten Wildberger1 – – – – 290,723 356,636 10,881 6,144 719,674 518,162
1Contribution Plan E.ON Management Board.2Dr. König was already employed by the Company in the prior year. Due to his previous years of service, the cash value of his pension entitlement was €1,982,076 at December 31, 2017.
Management Board Pensions in 2018The following table provides an overview of the current pension
obligations to Management Board members, the additions to
provisions for pensions, and the cash value of pension obligations
for the 2018 financial year. The cash value of pension obligations
is calculated pursuant to IFRS and the German Commercial
Code. An actuarial interest rate according to IFRS of 2.0 percent
(prior year: 2.1 percent) was used for discounting; the actuarial
interest rate pursuant to the German Commercial Code was
3.21 percent (prior year: 3.68 percent).
Pursuant to IFRS and the German Commercial Code, the cash
values of Management Board pensions for which provisions
are required increased as of December 31, 2018, relative to year-
end 2017. This resulted in part from increases in the number
of years of service and from the fact that there were five active
members of the Management Board (prior year: four members).
Another reason is that the actuarial interest rate E.ON uses
for discounting was significantly below the prior-year figure.

92Corporate Governance Report
Total Compensation in 2018The total compensation of the members of the Management
Board in the 2018 financial year amounted to €15.9 million,
about 13.6 percent above the prior-year figure of €14.0 million
based on the Management Board’s total compensation disclosed
in the 2017 Annual Report.
The individual members of the Management Board had the
following total compensation.
Total Compensation of the Management Board
€
Fixed annual
compensation Bonus Other compensation
Value of stock-based
compensation granted1 Total
2018 2017 2018 2017 2018 2017 2018 2017 2018 2017
Dr. Johannes Teyssen 1,240,000 1,240,000 2,494,800 2,296,350 41,365 40,845 1,732,500 1,732,500 5,508,665 5,309,695
Dr.-Ing. Leonhard Birnbaum 800,000 800,000 1,452,000 1,336,500 27,212 27,117 1,008,333 1,008,333 3,287,545 3,171,950
Dr. Thomas König
(since June 1, 2018)2 408,333 – 693,000 – 25,776 – 481,250 – 1,608,359 –
Dr. Marc Spieker 700,000 700,000 1,188,000 1,093,500 43,456 35,695 825,000 825,000 2,756,456 2,654,195
Dr. Karsten Wildberger 700,000 700,000 1,188,000 1,093,500 67,442 67,346 825,000 825,000 2,780,442 2,685,846
Total 3,848,333 3,440,000 7,015,800 5,819,850 205,251 171,003 4,872,083 4,390,833 15,941,467 13,821,686
1The present value assigned to the virtual shares of E.ON stock at the time of granting for the second tranche of the E.ON Performance Plan was €6.41 per share.2Prorated compensation because joined Management Board at roughly mid-year.

93CEO Letter
Report of the Supervisory Board
E.ON Stock
Strategy and Objectives
Combined Group Management Report
Combined Non-Financial Report
Consolidated Financial Statements
Further Information
Table of Compensation Granted and Allocated
€
Dr.-Ing. Leonhard Birnbaum (member of the Management Board)
Compensation granted Compensation allocated
2017 2018 2018
(min.)
2018
(max.)1, 2
2017 2018
Fixed compensation 800,000 800,000 800,000 800,000 800,000 800,000
Fringe benefits 27,117 27,212 27,212 27,212 27,117 27,212
Total 827,117 827,212 827,212 827,212 827,117 827,212
One-year variable compensation 825,000 825,000 – 1,650,000 1,336,500 1,452,000
Multi-year variable compensation 1,008,333 1,008,333 – 2,016,666 332,994 939,502 – Share Matching Plan, first tranche (2013–2017) – – – – 332,994 –
– Share Matching Plan, second tranche (2014–2018) – – – – – 939,502
– Performance Plan, first tranche (2017–2020) 1,008,333 – – – – –
– Performance Plan, second tranche (2018–2021) – 1,008,333 – 2,016,666 – –
Total 2,660,450 2,660,545 827,212 4,493,878 2,496,611 3,218,714
Service cost 371,568 304,692 304,692 304,692 371,568 304,692
Total 3,032,018 2,965,237 1,131,904 4,798,570 2,868,179 3,523,406
1, 2See footnotes above.
Table of Compensation Granted and Allocated
€
Dr. Johannes Teyssen (Chairman of the Management Board)
Compensation granted Compensation allocated
2017 2018 2018
(min.)
2018
(max.)1, 2
2017 2018
Fixed compensation 1,240,000 1,240,000 1,240,000 1,240,000 1,240,000 1,240,000
Fringe benefits 40,845 41,365 41,365 41,365 40,845 41,365
Total 1,280,845 1,281,365 1,281,365 1,281,365 1,280,845 1,281,365
One-year variable compensation 1,417,500 1,417,500 – 2,835,000 2,296,350 2,494,800
Multi-year variable compensation 1,732,500 1,732,500 – 3,465,000 1,635,221 2,039,145 – Share Matching Plan, first tranche (2013–2017) – – – – 1,635,221 –
– Share Matching Plan, second tranche (2014–2018) – – – – – 2,039,145
– Performance Plan, first tranche (2017–2020) 1,732,500 – – – – –
– Performance Plan, second tranche (2018–2021) – 1,732,500 – 3,465,000 – –
Total 4,430,845 4,431,365 1,281,365 7,581,365 5,212,416 5,815,310
Service cost 864,771 858,517 858,517 858,517 864,771 858,517
Total 5,295,616 5,289,882 2,139,882 8,439,882 6,077,187 6,673,827
1The maximum amount disclosed under benefits granted represents the sum of the contractual (individual) caps for the various elements of the compensation of Management Board members.2The overall cap on Management Board compensation, which was introduced in the 2013 financial year and is described on page 88, applies as well.
The following table shows the compensation granted and
allocated in 2018 in the format recommended by the German
Corporate Governance Code:

94Corporate Governance Report
Table of Compensation Granted and Allocated
€
Dr. Marc Spieker (member of the Management Board)
Compensation granted Compensation allocated
2017 2018 2018
(min.)
2018
(max.)1, 2
2017 2018
Fixed compensation 700,000 700,000 700,000 700,000 700,000 700,000
Fringe benefits 35,695 43,456 43,456 43,456 35,695 43,456
Total 735,695 743,456 743,456 743,456 735,695 743,456
One-year variable compensation 675,000 675,000 – 1,350,000 1,093,500 1,188,000
Multi-year variable compensation 825,000 825,000 – 1,650,000 – – – Share Matching Plan, first tranche (2013–2017) – – – – – –
– Share Matching Plan, second tranche (2014–2018) – – – – – –
– Performance Plan, first tranche (2017–2020) 825,000 – – – – –
– Performance Plan, second tranche (2018–2021) – 825,000 – 1,650,000 – –
Total 2,235,695 2,243,456 743,456 3,743,456 1,829,195 1,931,456
Service cost 33,936 220,067 220,067 220,067 33,936 220,067
Total 2,269,631 2,463,523 963,523 3,963,523 1,863,131 2,151,523
1, 2See footnotes on page 93.
Table of Compensation Granted and Allocated
€
Dr. Thomas König (member of the Management Board since June 1, 2018)
Compensation granted Compensation allocated
2017 2018 2018
(min.)
2018
(max.)1, 2
2017 2018
Fixed compensation – 408,333 408,333 408,333 – 408,333
Fringe benefits – 25,776 25,776 25,776 – 25,776
Total – 434,109 434,109 434,109 – 434,109
One-year variable compensation – 393,750 – 787,500 – 693,000
Multi-year variable compensation – 481,250 – 962,500 – – – Share Matching Plan, first tranche (2013–2017) – – – – – –
– Share Matching Plan, second tranche (2014–2018) – – – – – –
– Performance Plan, first tranche (2017–2020) – – – – – –
– Performance Plan, second tranche (2018–2021) – 481,250 – 962,500 – –
Total – 1,309,109 434,109 2,184,109 – 1,127,109
Service cost – 54,807 54,807 54,807 – 54,807
Total – 1,363,916 488,916 2,238,916 – 1,181,916
1, 2See footnotes on page 93.
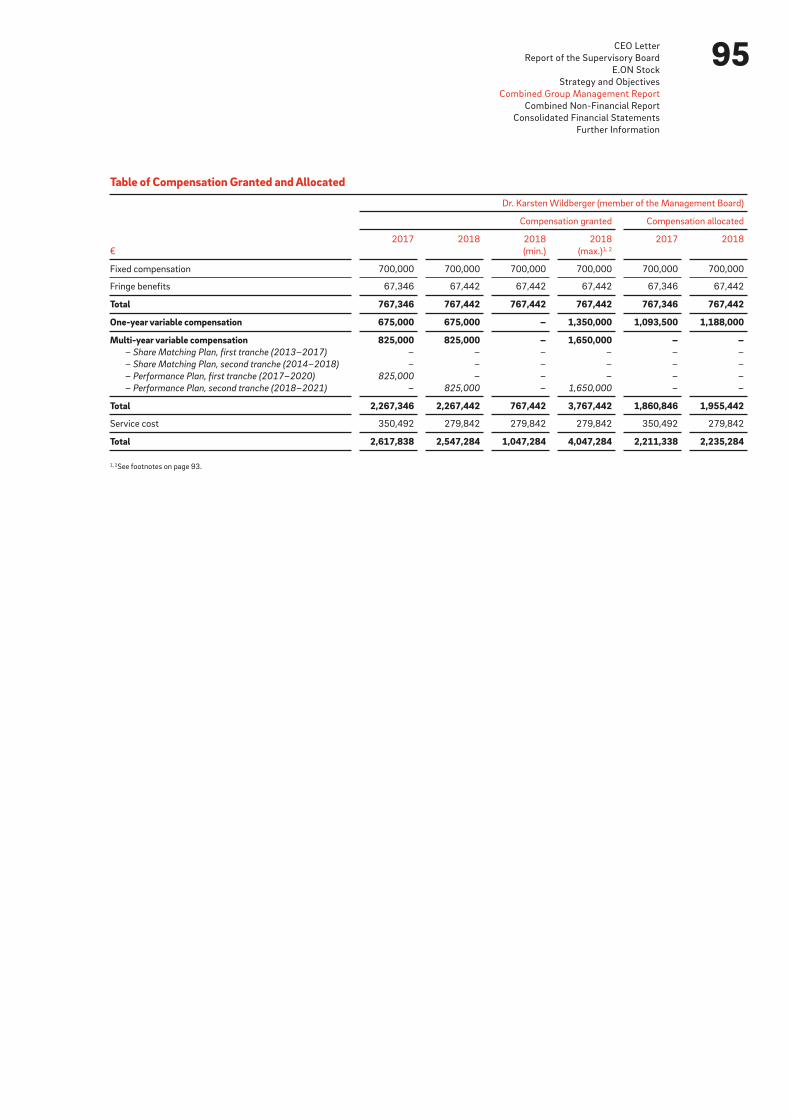
95CEO Letter
Report of the Supervisory Board
E.ON Stock
Strategy and Objectives
Combined Group Management Report
Combined Non-Financial Report
Consolidated Financial Statements
Further Information
Table of Compensation Granted and Allocated
€
Dr. Karsten Wildberger (member of the Management Board)
Compensation granted Compensation allocated
2017 2018 2018
(min.)
2018
(max.)1, 2
2017 2018
Fixed compensation 700,000 700,000 700,000 700,000 700,000 700,000
Fringe benefits 67,346 67,442 67,442 67,442 67,346 67,442
Total 767,346 767,442 767,442 767,442 767,346 767,442
One-year variable compensation 675,000 675,000 – 1,350,000 1,093,500 1,188,000
Multi-year variable compensation 825,000 825,000 – 1,650,000 – – – Share Matching Plan, first tranche (2013–2017) – – – – – –
– Share Matching Plan, second tranche (2014–2018) – – – – – –
– Performance Plan, first tranche (2017–2020) 825,000 – – – – –
– Performance Plan, second tranche (2018–2021) – 825,000 – 1,650,000 – –
Total 2,267,346 2,267,442 767,442 3,767,442 1,860,846 1,955,442
Service cost 350,492 279,842 279,842 279,842 350,492 279,842
Total 2,617,838 2,547,284 1,047,284 4,047,284 2,211,338 2,235,284
1, 2See footnotes on page 93.
96Corporate Governance Report
The Chairman of the Supervisory Board receives fixed compen-
sation of €440,000; the Deputy Chairmen, €320,000. The
other members of the Supervisory Board receive compensation
of €140,000. The Chairman of the Audit and Risk Committee
receives an additional €180,000; the members of the Audit and
Risk Committee, an additional €110,000. Other committee
chairmen receive an additional €140,000; committee members, an
additional €70,000. Members serving on more than one com-
mittee receive the highest applicable committee compensation
only. In contradistinction to the compensation just described,
the Chairman and the Deputy Chairmen of the Supervisory Board
receive no additional compensation for their committee duties.
In addition, Supervisory Board members are paid an attendance
fee of €1,000 per day for meetings of the Supervisory Board
or its committees. Individuals who were members of the Super-
visory Board or any of its committees for less than an entire
financial year receive pro rata compensation.
As in the prior year, E.ON SE and its subsidiaries granted no
loans to, made no advance payments to, nor entered into any
contingencies on behalf of the members of the Management
Board in the 2018 financial year. Page 244 contains additional
information about the members of the Management Board.
Payments Made to Former Members of the Management BoardTotal payments made to former Management Board members
and to their beneficiaries amounted to €12.5 million (prior
year: €12.4 million). Provisions of €155.8 million (prior year:
€159 million)—pursuant to IFRS—have been provided for
pension obligations to former Management Board members
and their beneficiaries.
Compensation Plan for the Supervisory BoardThe compensation of Supervisory Board members is determined
by the Annual Shareholders Meeting and governed by Section 15
of the Company’s Articles of Association. The purpose of the
compensation plan is to enhance the Supervisory Board’s inde-
pendence for its oversight role. Furthermore, there are a num-
ber of duties that Supervisory Board members must perform
irrespective of the Company’s financial performance. Supervisory
Board members—in addition to being reimbursed for their
expenses—therefore receive fixed compensation and compen-
sation for committee duties.
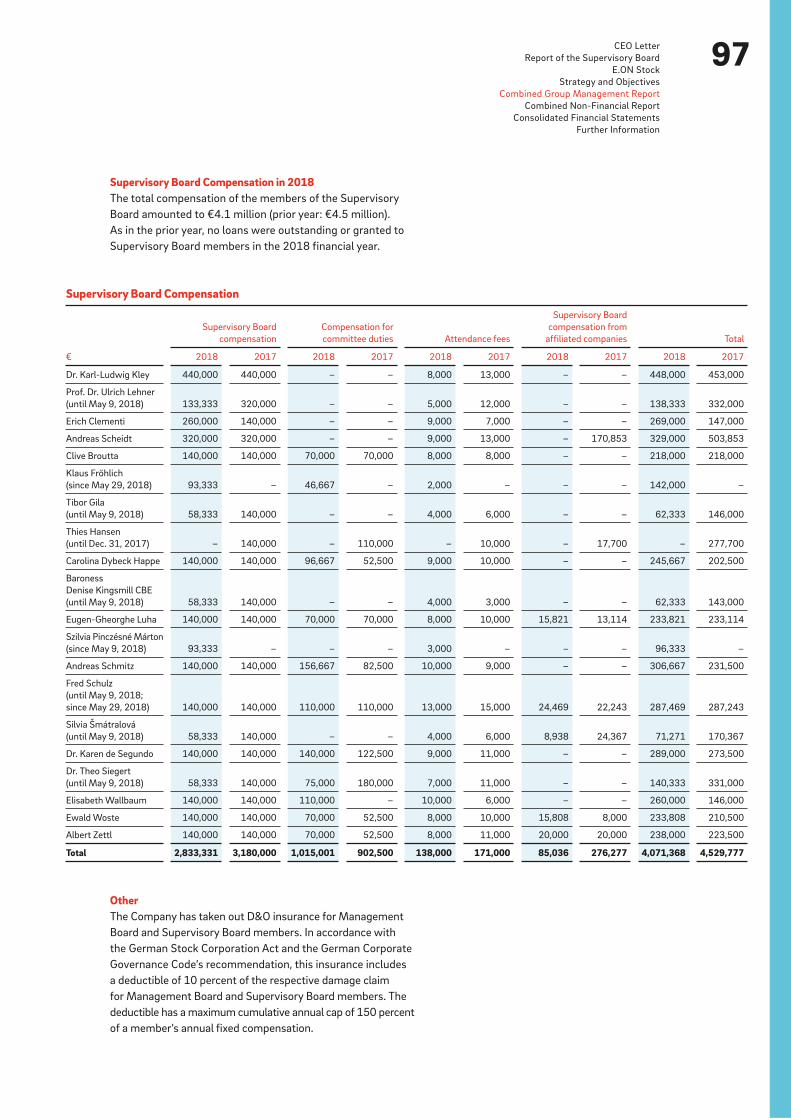
97CEO Letter
Report of the Supervisory Board
E.ON Stock
Strategy and Objectives
Combined Group Management Report
Combined Non-Financial Report
Consolidated Financial Statements
Further Information
Supervisory Board Compensation in 2018 The total compensation of the members of the Supervisory
Board amounted to €4.1 million (prior year: €4.5 million).
As in the prior year, no loans were outstanding or granted to
Supervisory Board members in the 2018 financial year.
OtherThe Company has taken out D&O insurance for Management
Board and Supervisory Board members. In accordance with
the German Stock Corporation Act and the German Corporate
Governance Code’s recommendation, this insurance includes
a deductible of 10 percent of the respective damage claim
for Management Board and Supervisory Board members. The
deductible has a maximum cumulative annual cap of 150 percent
of a member’s annual fixed compensation.
Supervisory Board Compensation
€
Supervisory Board
compensation
Compensation for
committee duties Attendance fees
Supervisory Board
compensation from
affiliated companies Total
2018 2017 2018 2017 2018 2017 2018 2017 2018 2017
Dr. Karl-Ludwig Kley 440,000 440,000 – – 8,000 13,000 – – 448,000 453,000
Prof. Dr. Ulrich Lehner
(until May 9, 2018) 133,333 320,000 – – 5,000 12,000 – – 138,333 332,000
Erich Clementi 260,000 140,000 – – 9,000 7,000 – – 269,000 147,000
Andreas Scheidt 320,000 320,000 – – 9,000 13,000 – 170,853 329,000 503,853
Clive Broutta 140,000 140,000 70,000 70,000 8,000 8,000 – – 218,000 218,000
Klaus Fröhlich
(since May 29, 2018) 93,333 – 46,667 – 2,000 – – – 142,000 –
Tibor Gila
(until May 9, 2018) 58,333 140,000 – – 4,000 6,000 – – 62,333 146,000
Thies Hansen
(until Dec. 31, 2017) – 140,000 – 110,000 – 10,000 – 17,700 – 277,700
Carolina Dybeck Happe 140,000 140,000 96,667 52,500 9,000 10,000 – – 245,667 202,500
Baroness
Denise Kingsmill CBE
(until May 9, 2018) 58,333 140,000 – – 4,000 3,000 – – 62,333 143,000
Eugen-Gheorghe Luha 140,000 140,000 70,000 70,000 8,000 10,000 15,821 13,114 233,821 233,114
Szilvia Pinczésné Márton
(since May 9, 2018) 93,333 – – – 3,000 – – – 96,333 –
Andreas Schmitz 140,000 140,000 156,667 82,500 10,000 9,000 – – 306,667 231,500
Fred Schulz
(until May 9, 2018;
since May 29, 2018) 140,000 140,000 110,000 110,000 13,000 15,000 24,469 22,243 287,469 287,243
Silvia Šmátralová
(until May 9, 2018) 58,333 140,000 – – 4,000 6,000 8,938 24,367 71,271 170,367
Dr. Karen de Segundo 140,000 140,000 140,000 122,500 9,000 11,000 – – 289,000 273,500
Dr. Theo Siegert
(until May 9, 2018) 58,333 140,000 75,000 180,000 7,000 11,000 – – 140,333 331,000
Elisabeth Wallbaum 140,000 140,000 110,000 – 10,000 6,000 – – 260,000 146,000
Ewald Woste 140,000 140,000 70,000 52,500 8,000 10,000 15,808 8,000 233,808 210,500
Albert Zettl 140,000 140,000 70,000 52,500 8,000 11,000 20,000 20,000 238,000 223,500
Total 2,833,331 3,180,000 1,015,001 902,500 138,000 171,000 85,036 276,277 4,071,368 4,529,777


Separate Combined Non-Financial Report
100
General Information
As a responsible company, we monitor all material impacts of
our business operations. We consider not only financial aspects
but also environmental and social issues along our entire value
chain. The systematic consideration of non-financial issues
enables us to identify opportunities and risks for our business
development early. Risks are defined as a potential negative
deviation from a target value of a material non-financial KPI.
In addition to the expectations of investors, E.ON takes into
account the expectations of other key stakeholders like cus-
tomers and employees.
In 2018 we again conducted a materiality assessment to deter-
mine which non-financial issues are essential for understanding
E.ON’s business performance, financial results, and situation and
to evaluate the impact of our business operations. The assess-
ment used a combination of internal and external factors to
decide whether an issue is material. We analyzed the expectations
of our stakeholders on the basis of existing sources and deter-
mined the significance of E.ON’s economic, environmental, and
social impacts on various non-financial issues. The materiality
assessment identified the following non-financial issues as
material for E.ON.
Editorial Note
This separate Combined Non-Financial Report complies with
the reporting requirements of the German CSR Directive Imple-
mentation Act (Sections 315b and 315c as well as Sections
289b to e of the German Commercial Code). It applies to both
the E.ON Group and E.ON SE (hereinafter: E.ON). In addition
to general information, the report contains information on the
five mandatory aspects: the environment, employees, social
matter, human rights, and anti-corruption. This information is for
the reporting period from January 1 to December 31, 2018. The
report encompasses all subsidiaries that are fully consolidated
in E.ON’s Consolidated Financial Statements. Any deviations from
this are indicated.
Business Model
Our three core businesses energy networks, customer solutions,
and renewables promote the sustainable development of the
energy industry. Detailed information about E.ON’s business
model can be found in the Corporate Profile section of the Com-
bined Group Management Report.
Separate Combined Non-Financial Report
E.ON’s material issues subsumed under the five mandatory aspects
Environmental matters • Climate protection
• Environmental management
Employee matters • Occupational health and safety
• Employee development and working conditions
Social matters • Security of supply
• Customer loyalty
• Data protection
Human rights • General significance of human rights
Anti-corruption • General significance of compliance
In the following sections we explain our approach to each issue
and our progress in 2018. E.ON takes a comprehensive approach
to occupational health and safety (Aspect 2: employee matters)
and environmental management (Aspect 1: environmental mat-
ters), which is explained below. Our description of all approaches
is guided by the most recent version (2016) of the Global Report-
ing Initiative’s Sustainability Reporting Standards (“GRI SRS”),
in particular GRI standard 103: Management Approach 2016.
In 2018 we conducted a formalized analysis of our non-financial
risks mapped against the five mandatory aspects. In consulta-
tion with experts from other departments, the Sustainability
function at corporate headquarters identified 26 risks. Then our
Sustainability Council analyzed each risk individually, considering
its likelihood of occurrence, potential impact, and the mitigation
measures we have in place to address it. As a result of our non-
financial risk process in 2018, it can be stated that E.ON has no
overall reportable non-financial net risk exposure. The process
and findings of our non-financial risk analysis were presented to
101
and approved by the E.ON Group Risk Committee. Information
about our financial risks and opportunities can be found in the
Risk and Chances Report in the Combined Group Management
Report.
The policies mentioned below set minimum standards, assign
responsibilities, and define management tools for the various
non-financial issues. They issue instructions and are reviewed on
an ongoing basis. Group policies are binding for all companies
in which E.ON holds a majority stake and for projects and partner-
ships for which E.ON has operational responsibility. Our con-
tractors and suppliers are also required to meet our minimum
standards.
Our sustainability efforts are guided by internationally recognized
standards, which provide orientation and help ensure that we
consider all essential aspects of responsible corporate governance.
We have been committed to the ten principles of the United
Nations Global Compact since 2005. Our sustainability activities
also support the achievement of the United Nations’ Sustainable
Development Goals. In particular, we help give access to afford-
able, reliable, sustainable, and clean energy, support cities and
communities to become sustainable, and help protect the earth’s
climate.
Annual Sustainability Report
We have published a Sustainability Report annually since 2004.
The report, which has been based on GRI standards since 2005,
serves as our annual Communication on Progress to the Global
Compact. It describes the issues that are material to our stake-
holders and to us as a company as well as how we address these
issues. It also reports on topics not included in this Combined
Non-Financial Report for reasons of materiality and contains
information about our sustainability strategy and organization.
Sustainability Ratings and Rankings
Our commitment to transparency includes subjecting our sus-
tainability performance to independent, detailed assessments
by specialized agencies and capital-market analysts. The results
of these assessments provide important guidance to investors
and to us. They help us identify our strengths and weaknesses
and further improve our performance. Our Sustainability Channel
on our corporate website contains a list of current sustainability
ratings and rankings results.
Approach to Health, Safety, and the Environment (HSE)
E.ON’s HSE organization, which has developed over the course of
many years, centrally manages all our activities for the material
issues of climate protection, environmental management, and
occupational health and safety. Our overarching HSE policy and
the Function Policy “Sustainability and HSE” set minimum stan-
dards, assign responsibilities, and define management tools and
reporting pathways. These policies are binding across E.ON.
The E.ON Management Board and the management of our units
are responsible for our HSE performance. They set our strategic
objectives and adopt policies to promote continual improvement.
They are supported and advised by the HSE division at corpo-
rate headquarters, our employee representatives, and the
HSE Council. The council is composed of senior executives and
employee representatives from different business areas and
countries where we operate. It meets at least three times a year
and is chaired by the member of the Management Board respon-
sible for HSE. Our units have HSE committees and expert teams
as well. They draw up framework specifications to ensure that
their unit meets our HSE standards. Our units also design HSE
improvement plans, which contain specific HSE targets for one
or more years.
We expect our HSE standards to be met further up the value chain
as well, for example by our suppliers. New suppliers must first
undergo a qualification process if there is an increased risk that
their business activities could have a negative impact on HSE.
Depending on their size, we sometimes also require them to be
certified to international environmental and occupational health
and safety standards (ISO 14001 or EMAS III; OHSAS 18001
or ISO 45001) or we conduct HSE audits of them.
HSE incidents are reported via our online incident management
system PRISMA (Platform for Reporting on Incident and Sustain-
ability Management and Audits) in five categories of incidents:
They range from 0 (low) to 4 (major). According to our HSE
Standard on Incident Management, units must use PRISMA to
report category 4 incidents to the HSE division at corporate
headquarters within 24 hours. We systematically investigate
and analyze incidents depending on their severity and/or poten-
tial to end up in an actual incident and use the findings to take
preventive action. All E.ON units must adopt and use PRISMA.
CEO Letter
Report of the Supervisory Board
E.ON Stock
Strategy and Objectives
Combined Group Management Report
Combined Non-Financial Report
Consolidated Financial Statements
Further Information
102
energy consumption. We design embedded cogeneration solu-
tions and energy-efficiency plans for commercial customers.
And we develop integrated solutions for cities, district developers,
and housing companies that encompass elements like efficient
heating and cooling, low-carbon generation, and smart energy
management. In addition, we offer e-mobility solutions such
as electric-vehicle charging systems for homes and businesses
as well as public charging infrastructure for cities that help
make transport less dependent on fossil fuels and thus less car-
bon-intensive.
Our Chief Operating Officer – Commercial, who is a member
of the E.ON Management Board, has overall responsibility for
our customer-oriented businesses, including solutions enabling
customers to generate their own climate-friendly energy. Our
regional units’ sales teams implement and market energy and
e-mobility solutions for all classes of customers. Cross-regional
teams at corporate headquarters coordinate these activities in
technical, commercial, and strategical terms. E.ON Connecting
Energies is responsible for the design of technical solutions for
commercial customers in Western and Central Europe, the
United Kingdom, and Scandinavia. The E.ON Management Board
is informed on an ongoing basis about developments at all our
customer-oriented businesses through financial performance
reports as well as presentations at its meetings describing oper-
ational progress using key performance indicators.
Distribution networks like ours are the backbone of the energy
transition. They facilitate low-carbon energy generation and the
deployment of innovative, efficient energy solutions: wind farms,
battery-storage systems, and other climate-friendly technologies
are connected to our distribution grids. Going forward, smart
grids will serve as the transformative platform for the innovative
technologies and business models that are essential to the
energy transition’s success.
The activities of our core businesses reflect the key emerging
energy trends and help protect the earth’s climate. But we also
want to shrink our own carbon footprint. We measure the annual
carbon emissions from our power and heat generation and from
our business activities that are not directly related to energy
generation. We disclose these figures in our sustainability report-
ing. We factor in upstream and downstream emissions as well.
Aspect 1: Environmental Matters
Climate Protection
Climate change and environmental damage caused by it are
serious and affect us all. The generation and use of conventional
energy are accompanied by greenhouse gas (“GHG”) emissions.
Low-carbon energy generation and the efficient use of energy
therefore play key roles in reducing emissions and limiting global
warming. E.ON is an energy company focused entirely on the
new energy world, climate protection is therefore a crucial issue
for us. The transition to a low-carbon economy will require the
concerted efforts of everyone who makes or consumes energy.
It poses challenges for our competitiveness but also creates
opportunities for us to grow our business. Many countries, com-
munities, and companies have already embraced climate-friendly
energy production and energy efficiency to achieve their car-
bon-reduction targets. Our strategic focus on renewables and
energy-efficient customer solutions is fully in line with these
global trends.
Continuing to expand our renewables business helps society
move toward a climate-friendly energy supply. This business is
managed by E.ON Climate & Renewables (“EC&R”). Founded in
2007, EC&R develops, builds, and operates large offshore and
onshore wind farms as well as solar farms and energy-storage
systems. Its Chief Executive Officer reports directly to our Chief
Operating Officer – Integration, a member of the E.ON Manage-
ment Board. She informs him of EC&R’s key financial and techni-
cal performance indicators, which can be found in our Combined
Group Management Report. In 2018 EC&R was active in the
United States, the United Kingdom, Germany, Denmark, Sweden,
Italy, and Poland. In addition to these large-scale projects, we
also deliver solutions that enable medium-sized companies, resi-
dential customers, and public entities to generate their own
climate-friendly energy.
GHG emissions can be reduced not only by low-carbon generation
technologies but also by energy conservation and recovery. Our
energy solutions help our customers use energy more efficiently
and recover energy. We offer individually tailored solutions to
residential, industrial, commercial, and public sector customers.
Our portfolio includes easy-to-use online energy audits and
apps that help residential customers better understand their
Separate Combined Non-Financial Report
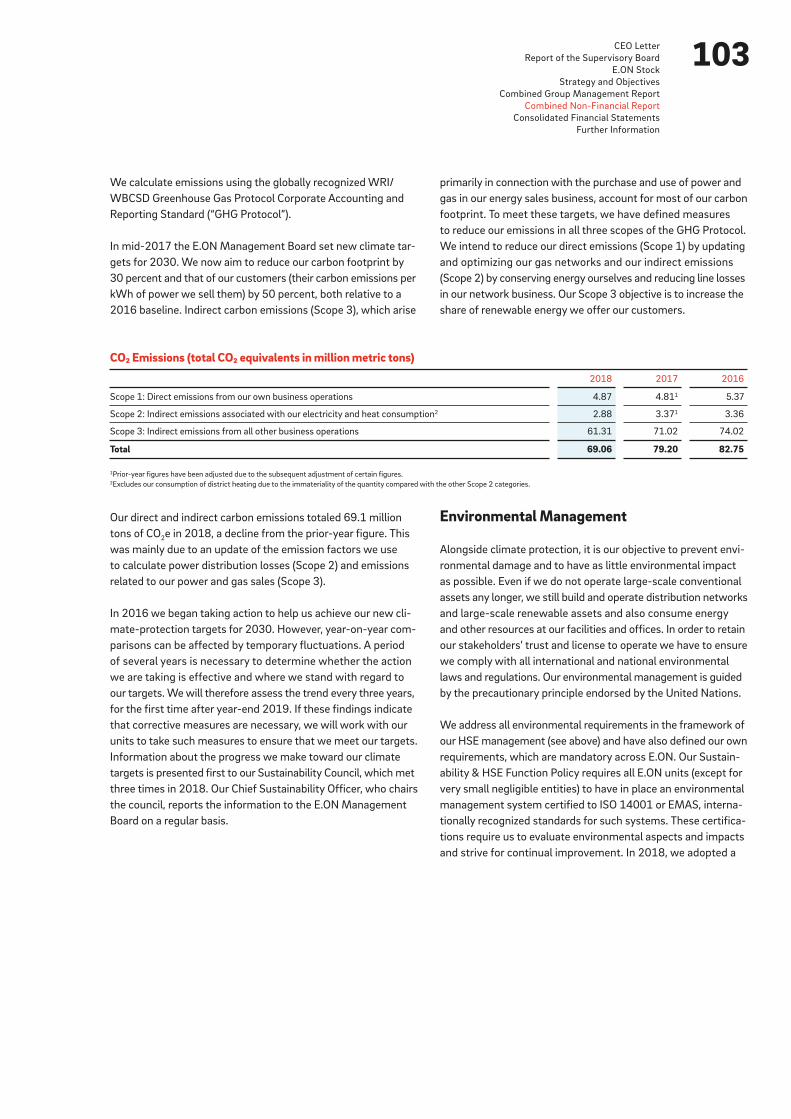
103
We calculate emissions using the globally recognized WRI/
WBCSD Greenhouse Gas Protocol Corporate Accounting and
Reporting Standard (“GHG Protocol”).
In mid-2017 the E.ON Management Board set new climate tar-
gets for 2030. We now aim to reduce our carbon footprint by
30 percent and that of our customers (their carbon emissions per
kWh of power we sell them) by 50 percent, both relative to a
2016 baseline. Indirect carbon emissions (Scope 3), which arise
primarily in connection with the purchase and use of power and
gas in our energy sales business, account for most of our carbon
footprint. To meet these targets, we have defined measures
to reduce our emissions in all three scopes of the GHG Protocol.
We intend to reduce our direct emissions (Scope 1) by updating
and optimizing our gas networks and our indirect emissions
(Scope 2) by conserving energy ourselves and reducing line losses
in our network business. Our Scope 3 objective is to increase the
share of renewable energy we offer our customers.
CEO Letter
Report of the Supervisory Board
E.ON Stock
Strategy and Objectives
Combined Group Management Report
Combined Non-Financial Report
Consolidated Financial Statements
Further Information
CO₂ Emissions (total CO₂ equivalents in million metric tons)
2018 2017 2016
Scope 1: Direct emissions from our own business operations 4.87 4.811 5.37
Scope 2: Indirect emissions associated with our electricity and heat consumption2 2.88 3.371 3.36
Scope 3: Indirect emissions from all other business operations 61.31 71.02 74.02
Total 69.06 79.20 82.75
1Prior-year figures have been adjusted due to the subsequent adjustment of certain figures.2Excludes our consumption of district heating due to the immateriality of the quantity compared with the other Scope 2 categories.
Our direct and indirect carbon emissions totaled 69.1 million
tons of CO2e in 2018, a decline from the prior-year figure. This
was mainly due to an update of the emission factors we use
to calculate power distribution losses (Scope 2) and emissions
related to our power and gas sales (Scope 3).
In 2016 we began taking action to help us achieve our new cli-
mate-protection targets for 2030. However, year-on-year com-
parisons can be affected by temporary fluctuations. A period
of several years is necessary to determine whether the action
we are taking is effective and where we stand with regard to
our targets. We will therefore assess the trend every three years,
for the first time after year-end 2019. If these findings indicate
that corrective measures are necessary, we will work with our
units to take such measures to ensure that we meet our targets.
Information about the progress we make toward our climate
targets is presented first to our Sustainability Council, which met
three times in 2018. Our Chief Sustainability Officer, who chairs
the council, reports the information to the E.ON Management
Board on a regular basis.
Environmental Management
Alongside climate protection, it is our objective to prevent envi-
ronmental damage and to have as little environmental impact
as possible. Even if we do not operate large-scale conventional
assets any longer, we still build and operate distribution networks
and large-scale renewable assets and also consume energy
and other resources at our facilities and offices. In order to retain
our stakeholders’ trust and license to operate we have to ensure
we comply with all international and national environmental
laws and regulations. Our environmental management is guided
by the precautionary principle endorsed by the United Nations.
We address all environmental requirements in the framework of
our HSE management (see above) and have also defined our own
requirements, which are mandatory across E.ON. Our Sustain-
ability & HSE Function Policy requires all E.ON units (except for
very small negligible entities) to have in place an environmental
management system certified to ISO 14001 or EMAS, interna-
tionally recognized standards for such systems. These certifica-
tions require us to evaluate environmental aspects and impacts
and strive for continual improvement. In 2018, we adopted a

104
Aspect 2: Employee Matters
To shape tomorrow’s energy world, remain competitive, and
launch new businesses, we need talented, dedicated people
whose personal and professional skills match our current and
future needs. Yet with demographic change affecting the labor
market, skilled workers are more in demand than ever. We need
to maintain an attractive, supportive, and inclusive work envi-
ronment in which our people can realize their potential. It is the
only way we will be able to attract great employees and retain
those we already have. Doing all this in a rapidly changing busi-
ness environment and amid technological developments and
corporate restructuring poses challenges for our human resources
(“HR”) management.
Information in our strategy and measures concerning employee
development and providing attractive working conditions can
be found in the Employees chapter in our Combined Group
Management Report on pages 44 and 45.
Our 2018 materiality analysis showed that diversity narrowly
missed the threshold for materiality and that other employee
issues currently have a higher priority. Consequently, although
diversity remains an important issue for us, it is no longer mate-
rial for our non-financial reporting. Moreover, diversity is a broad
issue, and the challenges vary by country and sometimes even
by region. Country-specific initiatives and targets are therefore
more impactful than a single uniform approach. In the wake of
our Phoenix reorganization program, we have therefore adopted
a different approach to managing diversity and now delegate it
to our units.
Occupational Health and Safety
Our employees’ health and safety (“H&S”) are essential for their
well-being and thus for our company’s success. Some of our
employees perform potentially risky tasks, such as working on
power distribution networks. Strict safety standards are there-
fore of particular importance to us. First and foremost, accidents
endanger our employees’ health. But accidents may also dam-
age property, cause work stoppages, and harm our reputation.
Demographic change and a rapidly changing work environment
present additional challenges: we need to address the needs
of an aging workforce and maintain our people’s ability to work.
new E.ON Health, Safety, Environment, & Climate Protection
Policy Statement, which supersedes previous statement and is
signed by our Management Board. It articulates our commitment
to comply with all HSE laws and regulations and defines the
appropriate management systems for this. It pledges us to pro-
tect the environment and the earth’s climate, reduce our energy
consumption, conserve resources, operate responsibly, and strive
for continual improvement in our environmental performance.
Energy management – continually looking for ways to reduce
our own energy consumption – plays an important role as part of
our environmental management and helps us to reduce our GHG
emissions. At all sites at which we have implemented energy
efficiency management systems according to ISO 50001, we
measure and analyze the energy consumed by our facilities and
office buildings. The findings help us identify opportunities to
conserve energy and recommend cost-effective energy-efficiency
measures. We’ve already implemented several, such as installing
smart LED lighting in buildings, and other smart building controls.
The E.ON Management Board is informed about serious (cate-
gory 3) environmental incidents by means of monthly reports
from HSE and periodic consultations with the Senior Vice Presi-
dent for Sustainability & HSE. In the case of a major incident
(category 4), the unit at which it occurred report it directly to
the Management Board within 24 hours.
We had one serious environmental incident in 2018. It occurred
at Avacon, a subsidiary in Germany. The depressurization of a
high-pressure gas pipeline resulted in the unintentional release
of oil in aerosol form in the immediate vicinity. This affected our
equipment, an adjacent walking path, and part of a nearby field.
When the oil leak was detected, it was stopped immediately by
closing the blow-out valve.
Our energy consumption in 2018 increased by 38 million giga-
joules year on year to 239 million gigajoules. An extension of
the survey method was responsible for all of the increase. This
will limit the information value of a comparison with the sub-
sequent year’s figures.
Separate Combined Non-Financial Report
105
Our approach to H&S is proactive and preventive, and we have
zero tolerance for accidents. Consequently, our overriding objec-
tive is to prevent accidents from ever happening. By signing the
Düsseldorf Statement on the Seoul Declaration on Safety and
Health at Work and the Luxembourg Declaration on Workplace
Health Promotion in 2009, we pledged to promote a culture of
prevention.
To live up to our commitment to our employees’ H&S, our HSE
management assigns responsibilities clearly and sets minimum
standards (see HSE Management below). These apply not only
to our employees but also to contractor employees who do work
on our behalf. All E.ON operating units are required to have an
H&S management system certified to ISO 45001 (ISO 45001
replaced OHSAS 18001), a globally recognized standard for such
systems. Certification requires an annual management review.
The reviews are conducted by the units themselves and are a
prerequisite for certification to be renewed. If necessary, Corpo-
rate Audit and HSE at our corporate headquarters conduct HSE
audits to determine whether our standards are being met. To
decide whether an audit of a unit is necessary, we analyze its
accidents from the previous year as well as current risk assess-
ments. In addition to audits, performance indicators for lost time,
accidents, and dangerous situations also help us investigate
accident causes and conduct comprehensive risk analyses. The
E.ON Management Board is informed about severe accidents,
developments relating to accidents, and related measures and
programs by means of monthly reports from HSE and periodic
consultations with the Senior Vice President for Sustainability &
HSE. In addition, the member of the E.ON Management Board
responsible for HSE receives a weekly safety update and presents
it at the board meetings. The update contains major incidents
that could have led to the death of employees, contractors, cus-
tomers, or third parties. E.ON investigates all accidents carefully,
learns from them, and takes steps to avoid them in the future.
We place great emphasis on continually providing our senior
managers with training to enable them to live up to their respon-
sibility for H&S and to ensure that the workplaces for which they
are responsible are healthy and safe. The one-day workshop for
senior managers at our operating units, which was developed in
2017, was conducted at our four distribution system operators
and E.ON Connecting Energies in Germany and at our distribu-
tion system operator in Romania in 2018. It trains managers
to recognize safety risks early and to motivate their employees
to work safely and responsibly.
In the first quarter of 2018 all top 100 executives took part in a
mandatory HSE upskilling workshop. The purpose was to expand
or refresh their HSE skills, reinforce their awareness of their
personal responsibility for HSE, and communicate the main ele-
ments of our HSE caring culture.
In several countries where we operate, employees who have
questions or concerns about their physical or mental health
cancontact a free, independent, and strictly confidential health
advisory service (employee assistance program). In Germany,
this service is a central component of the Group Works Health
Agreement, which was concluded between management and
the Group Works Council in 2015.
In 2018 we developed a new campaign called HOW WE CARE
to foster a caring culture. It will be carried out by managers
across E.ON at the start of 2019. It is supported by a safety-walk
app that helps managers dialogue with employees to identify
H&S risks and issues in the workplace. As part of the campaign,
we will issue guidelines for the use of mobile phones in vehicles.
By instructing employees, for example, to avoid calls and refrain
from listening to machine-read email messages while driving,
we aim to reduce the risk of traffic accidents.
The findings of our 2018 audits show that our H&S management
systems are largely effective. In some cases, however, we iden-
tified room for improvement. Examples included a gap in the
effectiveness of how H&S is communicated to engineers, project
managers, and contractors on the operational side of the business
and a failure of some employees to carry out a risk assessment
prior to performing a task or putting on their personal protective
equipment. We initiated training courses for employees and
managers at these units and took steps to eliminate weaknesses
in their processes.
CEO Letter
Report of the Supervisory Board
E.ON Stock
Strategy and Objectives
Combined Group Management Report
Combined Non-Financial Report
Consolidated Financial Statements
Further Information
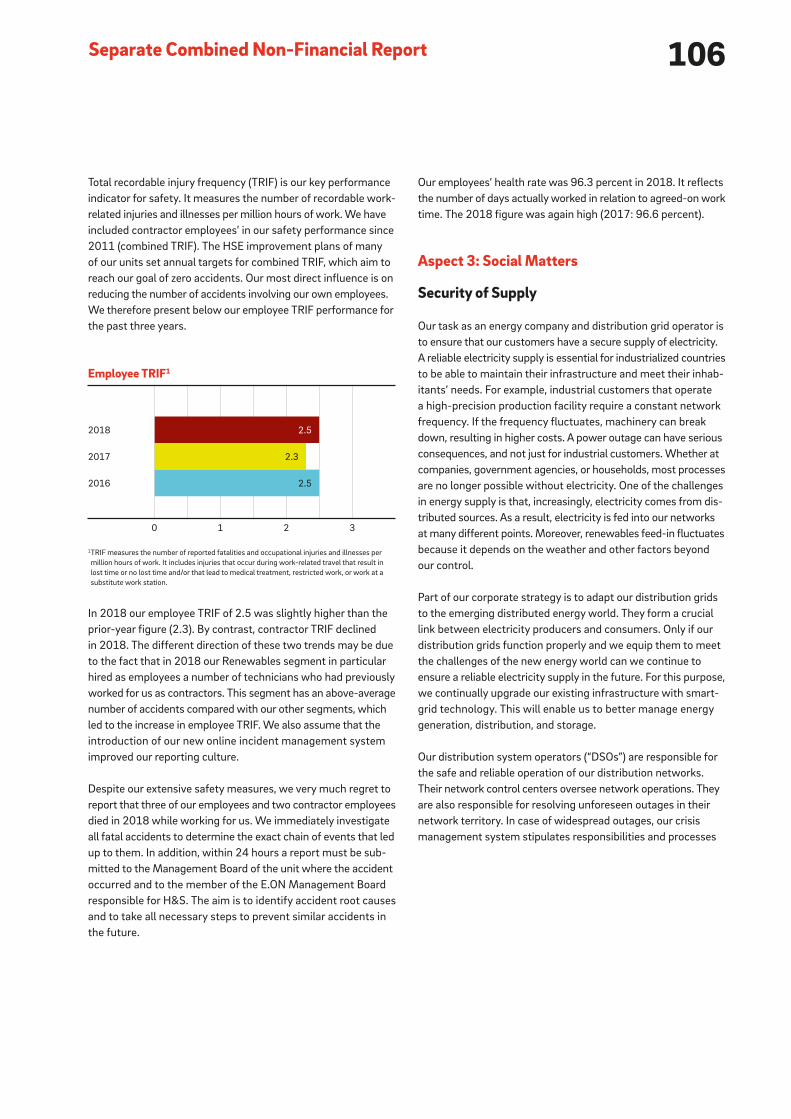
106
Our employees’ health rate was 96.3 percent in 2018. It reflects
the number of days actually worked in relation to agreed-on work
time. The 2018 figure was again high (2017: 96.6 percent).
Aspect 3: Social Matters
Security of Supply
Our task as an energy company and distribution grid operator is
to ensure that our customers have a secure supply of electricity.
A reliable electricity supply is essential for industrialized countries
to be able to maintain their infrastructure and meet their inhab-
itants’ needs. For example, industrial customers that operate
a high-precision production facility require a constant network
frequency. If the frequency fluctuates, machinery can break
down, resulting in higher costs. A power outage can have serious
consequences, and not just for industrial customers. Whether at
companies, government agencies, or households, most processes
are no longer possible without electricity. One of the challenges
in energy supply is that, increasingly, electricity comes from dis-
tributed sources. As a result, electricity is fed into our networks
at many different points. Moreover, renewables feed-in fluctuates
because it depends on the weather and other factors beyond
our control.
Part of our corporate strategy is to adapt our distribution grids
to the emerging distributed energy world. They form a crucial
link between electricity producers and consumers. Only if our
distribution grids function properly and we equip them to meet
the challenges of the new energy world can we continue to
ensure a reliable electricity supply in the future. For this purpose,
we continually upgrade our existing infrastructure with smart-
grid technology. This will enable us to better manage energy
generation, distribution, and storage.
Our distribution system operators (“DSOs”) are responsible for
the safe and reliable operation of our distribution networks.
Their network control centers oversee network operations. They
are also responsible for resolving unforeseen outages in their
network territory. In case of widespread outages, our crisis
management system stipulates responsibilities and processes
Total recordable injury frequency (TRIF) is our key performance
indicator for safety. It measures the number of recordable work-
related injuries and illnesses per million hours of work. We have
included contractor employees’ in our safety performance since
2011 (combined TRIF). The HSE improvement plans of many
of our units set annual targets for combined TRIF, which aim to
reach our goal of zero accidents. Our most direct influence is on
reducing the number of accidents involving our own employees.
We therefore present below our employee TRIF performance for
the past three years.
In 2018 our employee TRIF of 2.5 was slightly higher than the
prior-year figure (2.3). By contrast, contractor TRIF declined
in 2018. The different direction of these two trends may be due
to the fact that in 2018 our Renewables segment in particular
hired as employees a number of technicians who had previously
worked for us as contractors. This segment has an above-average
number of accidents compared with our other segments, which
led to the increase in employee TRIF. We also assume that the
introduction of our new online incident management system
improved our reporting culture.
Despite our extensive safety measures, we very much regret to
report that three of our employees and two contractor employees
died in 2018 while working for us. We immediately investigate
all fatal accidents to determine the exact chain of events that led
up to them. In addition, within 24 hours a report must be sub-
mitted to the Management Board of the unit where the accident
occurred and to the member of the E.ON Management Board
responsible for H&S. The aim is to identify accident root causes
and to take all necessary steps to prevent similar accidents in
the future.
0 1 2 3
2018
2017
2016
2.5
2.3
2.5
Employee TRIF1
1TRIF measures the number of reported fatalities and occupational injuries and illnesses per
million hours of work. It includes injuries that occur during work-related travel that result in
lost time or no lost time and/or that lead to medical treatment, restricted work, or work at a
substitute work station.
Separate Combined Non-Financial Report

107
always focus on efficiency as well as security of supply. We
choose the solutions that make the most technical and economic
sense. This is because grid investments affect the grid fees
included in the electricity price paid by customers.
We record all planned and unplanned outages at our distribution
networks. We use these data to calculate the system average
interruption duration index (“SAIDI”), which measures the aver-
age outage duration per customer per year. Although this figure
is not relevant for management purposes, it provides us with
information on the reliability of our networks. Some countries
where we operate have strict legal thresholds for SAIDI. If we
do not meet these requirements, we may have to pay fines or
compensation. Some of our regional units therefore set their
own SAIDI targets on an annual basis. At regular intervals, the
unit managing directors inform the member of the E.ON Man-
agement Board responsible for network operations about their
achievement of these targets. The SAIDI of all regional units
are included in a quarterly performance report to the E.ON Man-
agement Board.
in accordance with the instructions contained in our Incident and
Crisis Management Policy. A member of the E.ON Management
Board oversees our Energy Networks segment. Under his lead-
ership, two departments at our corporate headquarters actively
manage Energy Networks’ regional units. This includes strategic
development, capital allocation, business controlling, and so forth.
We have in place investment and maintenance plans to maintain
and expand our grids to ensure that all of our network customers
are connected and have a reliable energy supply. Our regional
network companies are responsible for implementing these
plans, which encompass one or more years. The amount of the
investments is approved centrally. Final approval comes from
the E.ON Management Board at the end of the annual medium-
term planning and budgeting process. A portion of the invest-
ment budget goes towards making our grids smarter. The
increasing use of smart-grid technologies makes it possible for
us to avoid or delay costly investments in conventional networks
by, for example, using this technology to maximize the distribu-
tion capacity of existing overhead lines. Investment decisions
CEO Letter
Report of the Supervisory Board
E.ON Stock
Strategy and Objectives
Combined Group Management Report
Combined Non-Financial Report
Consolidated Financial Statements
Further Information
SAIDI power1
Minutes per year
2018 2017 2016
Scheduled
Un-
scheduled Total Scheduled
Un-
scheduled Total Scheduled
Un-
scheduled Total
Germany 14 20 34 14 20 34 13 25 37
Sweden 24 120 144 32 89 120 30 91 121
Hungary 132 60 192 126 63 189 121 57 178
Czech Republic 155 49 203 162 70 232 179 44 223
Romania 339 249 588 262 3202 582 178 426 604
Slovakia3 97 79 176 91 176 267 106 79 185
1Totals may deviate due to rounding.
²In 2018 the Romanian regulatory agency changed the definition of unscheduled outage, which now excludes interruptions caused by natural phenomena like storms. We adjusted prior-year figure
accordingly.3DSO in which we have a 49 percent stake.
In 2018 our SAIDI was comparable to the 2017 figure in most
countries. The only noteworthy change was in the Czech Republic
and Slovakia, where, on average, our customers were less
affected by power outages than in the previous years. In Romania,
scheduled interruptions increased because of temporary shut-
downs that enabled us to invest more in grid renewal and auto-
mation. This resulted in fewer unscheduled interruptions. As in
previous years, our grids in Germany were our most reliable.
Like the reliable operation of our distribution networks, the high
availability of our renewable facilities helps ensure security of
supply. In 2018 Onshore Wind achieved an availability factor of
94.8 percent (2017: 94.6 percent); Offshore Wind, 96.8 percent
(2017: 97.6 percent).
108
We define company-wide targets for strategic NPS and journey
NPS annually and use both at segment level for steering purposes.
Strategic NPS is highly significant for management purposes
because of the information collected about competitors. The
Management Board holds quarterly discussions with the units
to evaluate their NPS and, if necessary, to decide what action
they should take to achieve their NPS target. The variable com-
pensation of senior managers has two components: a company
factor and a factor reflecting a manager’s individual performance.
In 2018 strategic NPS accounted for 20 percent of the company
factor and journey NPS was included in the individual perfor-
mance factor of our senior managers’ compensation. The E.ON
Management Board’s compensation does, nevertheless, not
depend on NPS targets. Furthermore, each unit has a set of
Game-Changing Initiatives in place to systematically improve
its customer experience. They’re sponsored by the unit’s CEOs
and board, who are personally responsible for improving their
unit’s NPS. The initiatives, which are defined annually, may span
multiple years depending on the level of transformation required.
We introduced these initiatives in 2017 and initially called them
CEO-led signature actions.
The Chief Operating Office – Commercial (“COO-C”) at corporate
headquarters coordinates our marketing strategy with the aim
of bringing the E.ON brand to life. COO-C supports our energy-
sales and solutions businesses for all customer divisions, in all
our markets. Our customer experience teams serve as our ambas-
sadors for customer loyalty in their respective unit. They take
the lead on related projects and activities in their sales territory
and share information about successful programs and service
improvements on a monthly basis. We have customer experience
teams in Germany, the United Kingdom, Italy, Romania, Sweden,
the Czech Republic, and Hungary.
The Customer Immersion program brings our senior managers
and employees into direct contact with residential and business
customers. Its purpose is to bring the customer’s voice into our
organization and enhance our employees’ customer orientation.
The program, which has been offered in all our markets since
2015, has been coordinated centrally by COO-C since 2016.
Our average NPS for residential customers increased in 2018
and was slightly above the competitor average at the end of
the year. In six out of seven countries the number of promoters
(customers who speak positively about us and recommend us
Customer Experience
Our ability to acquire new customers and retain our existing
ones is crucial for the success of our business. Global trends
like climate protection and digitization are not only altering the
energy landscape. They are also creating new customer needs.
Only by adapting our products and services to meet these needs
and by continually improving our performance will we remain
successful in the marketplace.
We put our customers at the center of everything we do. This
pledge is an E.ON corporate value and is embedded in our cus-
tomer experience principles, brand personality, and [email protected],
our Group-wide competency framework. Our objective is to con-
tinually enhance customer loyalty and to become a customer-led
business and the energy-solutions leader in our markets.
We measure customer loyalty by means of Net Promoter Score
(“NPS”), which we introduced in 2013. NPS indicates our cus-
tomers’ willingness to recommend us to their family and friends.
It also helps us identify which issues are currently of particular
importance to our customers. This enables us to adapt our activ-
ities to current customer needs. We distinguish between three
types of NPS. Strategic NPS or top-down NPS compares our
performance to that of our competitors and is based on the feed-
back of customers regardless of if they have had an interaction
with us. Bottom-up NPS is based on the feedback of customers
who have had a specific interaction with us, like talking to a call
center agent. Journey NPS measures the loyalty of customers
who have completed a journey with us, such as transferring their
energy service to their new residence when they move. NPS is
used by our units in all our markets. In September 2017 we intro-
duced a new methodology that enables us to measure strategic
NPS consistently across all our markets. It allows us to identify
and resolve cross-market customer issues and also targets areas
where we could provide useful innovations for our customers.
Furthermore, automated reporting eliminates the errors of man-
ual data entry, thereby improving data quality and auditability.
Our internal NPS (“iNPS”) program aims to sensitize employees
who have no contact with customers to the importance of cus-
tomer loyalty. iNPS was rolled out across the Group in 2014.
It has been implemented in IT, human resources, supply chain
management, finance, and other support functions.
Separate Combined Non-Financial Report

109
to friends and family) rose, while the number of detractors
(customers who speak negatively about us) declined. Our average
NPS for small and medium-sized enterprises (“SMEs”) continued
to improve, as did that of our competitors. We need to focus even
more on these businesses in order to not just be slightly ahead
of our competitors. Our top-down NPS for SME customers was
below expectations in five of seven countries. Our strategic NPS
is calculated by weighting E.ON’s top-down NPS in six countries
(Germany, the United Kingdom, Sweden, Czech Republic, Italy,
Romania, and Hungary) equally.
Data Protection
Greater digitization opens a wide range of opportunities for
offering smart solutions and optimizing our business, technical
solutions, and processes. It also potentially poses a risk to the
integrity, confidentiality, and availability of personal data.
“Personal data” means any information relating to an identified
or identifiable natural person. The EU General Data Protection
Regulation (“GDPR”) and Germany’s new Federal Data Protection
Act came into effect in May 2018. The former harmonizes the
rules for the processing of personal data by organizations in the
EU and the wider European Economic Area; the latter establishes
specific regulations for Germany. We have an obligation to
safeguard personal data in order to protect the persons whose
data we process from harm. In addition, data breaches could
damage our reputation and lead to fines.
In 2018 we updated our business directives, policies, guidelines,
and processes to comply with the GDPR. We implemented a
data protection management system (“DPMS”) that provides
guidance on data protection issues and is intended to ensure
that, to the degree possible, we take a structured, coordinated,
and consistent approach to data protection across the Group.
Our latest data protection policy adopted in 2018 defines roles
and responsibilities in a uniform manner E.ON-wide. The mini-
mum standard all units must meet is to implement, where
necessary, an adapted version of our DPMS. We have in place
a comprehensive set of processes, including those to fulfill the
data subject’s rights (for information, deletion, and so forth), to
consider data protection requirements in relation to our suppliers
and other enterprise partners, and to report and handle personal
data breaches. We assess a breach’s severity using a method
developed by the European Union Agency for Data Network
and Information Security. In addition, these processes provide
guidance to our units, which have implemented the necessary
processes in their organizations as well. Our units are responsible
for dealing with all data protection issues related to their business
and with the claims that individuals address to them pursuant
to the individuals’ rights under the GDPR, such as information,
rectification, deletion, and data portability. Where required by
law, the units have appointed Data Protection Officers (“DPOs”).
In Germany, for example, an organization with more than ten
employees handling personal data must have a DPO. However,
the requirements for appointing DPOs vary by country. The
DPOs share information with each other on a regular basis and
report regularly to our Chief DPO at our corporate headquarters
on the following dimensions of data protection: the rights of the
data subject, relations to third parties, company documentation,
and relations to data protection agencies. The Chief DPO’s duties
include coordinating data protection activities across the Group.
The Chief DPO reports periodically to the Information Security
and Data Protection Council, which includes two Management
Board members and, if the need arises, to the entire Management
Board.
Internal stakeholders are regularly informed about relevant
developments in data protection, such as legislation, technology,
decisions issued by regulatory agencies, and so forth. This infor-
mation is disseminated by email or, where appropriate, through
internal communications channels, including Connect, our cor-
porate social media platform. Our employees receive training in
data protection every two to three years. New employees typically
receive such training in their first year. In addition, individual
departments and teams – such as call centers and sales organi-
zations – provide training to meet their special data protection
requirements. In 2018 we rolled out a Group-wide e-learning
module to familiarize our employees with the GDPR’s new rules.
Our DPMS uses the plan-do-check-act (“PDCA”) method, which
helps us to plan, implement, manage, and improve our processes,
which is mandatory under the GDPR. The PDCA cycle includes
continuously monitoring the DPMS’s effectiveness and taking
action if the need for improvement arises. Where necessary we
align changes of the DPMS with the board. We therefore consider
the DPMS to be effective.
CEO Letter
Report of the Supervisory Board
E.ON Stock
Strategy and Objectives
Combined Group Management Report
Combined Non-Financial Report
Consolidated Financial Statements
Further Information

110
assess, among other issues, whether the supplier complies
with our standards for human rights. The procurement team
at our corporate headquarters conducted and supported more
than three times as many supplier audits than in 2017. Between
the tool’s launch in October 2018 and year-end, we invited
289 new suppliers to take part in onboarding and completed
67 onboardings. In addition, we periodically conduct supplier
performance reviews of our key non-fuel suppliers using five key
performance indicators (“KPIs”): quality, cost, delivery, innova-
tion, and CSR; the latter includes the protection of human rights.
We share the results with each supplier during a performance
review meeting. The outcome of the meeting may trigger a
change in a supplier’s status (including disqualification) and/or
result in us requiring a supplier to take specific actions to improve
its performance in one or more of the KPIs if it wants to continue
doing business with us. In 2018 we increased the number of
supplier performance reviews by 46 percent relative to 2017.
Our employees can report potential violations of human rights
through internal reporting channels or a Group-wide external
whistle-blower hotline. Group Compliance forwards the infor-
mation to the relevant department or unit. Depending on the
nature and severity of the potential violation, Group Compliance
may report it immediately to the E.ON Management Board,
notify law enforcement, initiate its own investigation, or take
other appropriate action. In 2018 no violation of human rights
was reported through these channels
Furthermore, in November 2018 we took the first step toward
determining which factors are relevant in the design and imple-
mentation of a human rights due diligence process at E.ON. The
next step will be to define a focus area in which we will deepen
our analysis and, where necessary, develop measures to improve
our performance.
Aspect 5: Anti-corruption
We are committed to combating corruption in all its manifesta-
tions worldwide and support national and international efforts
directed against it. We reject it as a member of the UN Global
Compact as well. Corruption leads to decisions being made for
the wrong reasons. It can thus impede progress and innovation,
distort competition, and do long-term damage to companies.
Employees, managers, and board members guilty of corruption
may be subject to fines and criminal prosecution. To earn our
Aspect 4: Human Rights
We are committed to respecting and protecting human rights
in all our business processes. Failure to respect people’s funda-
mental rights and needs may have serious consequences for
those affected and may damage our reputation. Compliance with
social standards also plays an important role in the business
relationships with our enterprise partners. In addition, there are
increasing regulatory requirements for corporate transparency
and control. For example, the U.K. Modern Slavery Act obliges
us to report on the steps we take to prevent international human
trafficking.
To prevent human rights violations, we adhere to external stan-
dards and define our own principles and policies. Our Code of
Conduct (see “Aspect 5: Anti-corruption”), a revised version of
which took effect at the start of 2018, obliges all our employees
to contribute to a non-discriminatory and safe working environ-
ment and to respect human rights. The revised Code of Conduct
for employees incorporates the standards of our Human Rights
Policy Statement. The standards we are guided by include the
Universal Declaration of Human Rights of the United Nations,
the principles of the UN Global Compact, and the European
Convention for the Protection of Human Rights. Our Chief Sus-
tainability Officer, who is a member of the E.ON Management
Board, is also our Chief Human Rights Officer. The standards
for human rights and ethical business practices we require our
suppliers to meet are defined in our Supplier Code of Conduct,
which is binding for all non-fuel suppliers; in addition, all our
suppliers of uranium and solid biomass are contractually obli-
gated to adhere to these standards. As part of our prequalifi-
cation process (supplier onboarding) and performance reviews,
we systematically assess potential and current suppliers’
potential risks relating to corporate social responsibility (“CSR”),
including human rights aspects.
In 2018 we completely revised our supplier qualification process
and adopted a fully digital supplier onboarding solution, which is
integrated into our enterprise resource planning system. Supplier
onboarding is the step in which we ensure that existing and
new suppliers comply with our minimum requirements. Every
non-fuel supplier whose individual transaction volume exceeds
€25,000 or whose health, safety, and environment risk is
medium or high must complete an online onboarding process.
In some cases, we may take additional steps during the supplier
onboarding process, such as conducting a supplier audit to
Separate Combined Non-Financial Report

111
stakeholders’ lasting trust, we closely monitor compliance with
laws and our own policies. If violations occur, we deal with them
transparently and, if necessary, take disciplinary action.
The Management Board has the ultimate responsibility for
ensuring compliance with applicable laws and for monitoring
compliance risks. The E.ON Group has an effective compliance
management system (“CMS”). The CMS sets uniform Group-
wide minimum standards for certain compliance issues, such
as anti-corruption. Pursuant to a Group-wide policy, the Chief
Compliance Officer (“CCO”), the Group Compliance division,
and the business units’ Compliance Officers are responsible for
refining and optimizing the CMS on a continual basis.
The CCO reports to the E.ON Management Board and the Super-
visory Board’s Audit and Risk Committee on a quarterly basis on
the status of the CMS and current developments and incidents.
In the event of serious incidents, the Management Board and
the Audit and Risk Committee are informed immediately. The
same applies to important new laws. Potential violations are
investigated centrally by Group Audit and Group Compliance.
Our updated Code of Conduct, entered in force on January 1,
2018, is considerably shorter and clearer, concentrating on our
guiding principles (“Doing the right thing”). It is supplemented
by several People Guidelines that lay down specific rules (“Doing
things right”). As a compulsory reference, the code helps our
employees make the right decisions in various professional situ-
ations and remain true to our values. In the preface, the E.ON
Management Board calls on all employees to act in a correct
manner in order to protect themselves and the company. The
introduction explains why a Code of Conduct is needed. The main
body of the Code contains comprehensible guidance on all
issues that are of particular concern to us. These include human
rights, anti-corruption, fair competition, and good relationships
with business partners. The Code also contains an integrity test.
By answering just a few questions, employees can check whether
their assessments are in compliance with E.ON principles and
values. The Code clearly states our prohibition against company
donations to political parties, political candidates, managers of
political offices, or representatives of public agencies.
Managers and employees may be invited to events and restau-
rants, especially by business partners, or receive gifts. The
updated version of our Anti-Corruption People Guideline contains
a decision-making scheme that uses the familiar green, amber,
and red of traffic lights to indicate when accepting or granting
such offers or gifts is permissible, potentially problematic, or
forbidden. Gratuities above a certain threshold, which varies by
country, must receive Compliance Officer approval. Particularly
strict requirements apply to invitations and gifts from public,
elected, or government officials and their representatives.
To determine in which functions the risk for some compliance
violations is particularly high, we conduct compliance risk
assessments on a regular basis. Based on their findings, we
take preventive measures.
If employees suspect misconduct or a violation of laws or
company policies, they are instructed to report it immediately.
If they wish, they may do so anonymously through internal
reporting channels or a Group-wide external whistle-blower
hotline, which we operate with an external law firm. Group
Compliance forwards the information to the relevant depart-
ment or unit.
We want to ensure compliance standards in our supply chain as
well. All non-fuel suppliers and all suppliers of uranium and
solid biomass must therefore sign our Supplier Code of Con-
duct, which contains binding standards for ethical business
practices. In addition, we conduct compliance checks to deter-
mine whether potential suppliers act in accordance with our
values and principles.
The effectiveness of our CMS is the main indicator of our com-
pliance performance for purposes of management control. All
compliance measures, policies, processes, controls, and so forth
are assessed and guided by this criterion. The CMS’s effective-
ness is also monitored by the E.ON Management Board, the
Supervisory Board’s Audit and Risk Committee, and Group Audit.
The latter, an independent entity, is our third line of defense for
monitoring the CMS. The criteria we use for monitoring effective-
ness include assessing whether and how prescribed measures
are implemented across E.ON. The Management Board and the
Audit and Risk Committee are convinced that our CMS was
again effective in 2018. Their assessment was based in part on
audits, surveys of employees, and stakeholders.
CEO Letter
Report of the Supervisory Board
E.ON Stock
Strategy and Objectives
Combined Group Management Report
Combined Non-Financial Report
Consolidated Financial Statements
Further Information

Consolidated Financial
Statements
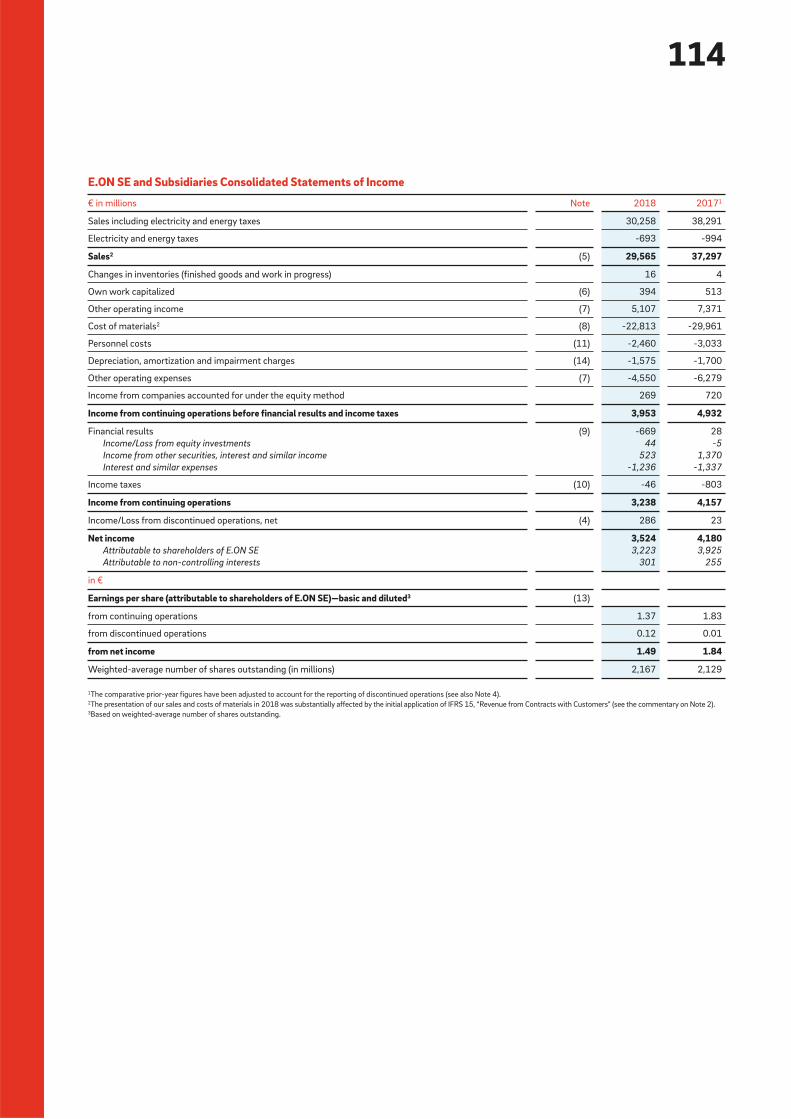
114
E.ON SE and Subsidiaries Consolidated Statements of Income
€ in millions Note 2018 2017 1
Sales including electricity and energy taxes 30,258 38,291
Electricity and energy taxes -693 -994
Sales 2 (5) 29,565 37,297
Changes in inventories (finished goods and work in progress) 16 4
Own work capitalized (6) 394 513
Other operating income (7) 5,107 7,371
Cost of materials 2 (8) -22,813 -29,961
Personnel costs (11) -2,460 -3,033
Depreciation, amortization and impairment charges (14) -1,575 -1,700
Other operating expenses (7) -4,550 -6,279
Income from companies accounted for under the equity method 269 720
Income from continuing operations before financial results and income taxes 3,953 4,932
Financial results (9) -669 28
Income/Loss from equity investments 44 -5
Income from other securities, interest and similar income 523 1,370
Interest and similar expenses -1,236 -1,337
Income taxes (10) -46 -803
Income from continuing operations 3,238 4,157
Income/Loss from discontinued operations, net (4) 286 23
Net income 3,524 4,180Attributable to shareholders of E.ON SE 3,223 3,925
Attributable to non-controlling interests 301 255
in €
Earnings per share (attributable to shareholders of E.ON SE)—basic and diluted 3 (13)
from continuing operations 1.37 1.83
from discontinued operations 0.12 0.01
from net income 1.49 1.84
Weighted-average number of shares outstanding (in millions) 2,167 2,129
1The comparative prior-year figures have been adjusted to account for the reporting of discontinued operations (see also Note 4).2The presentation of our sales and costs of materials in 2018 was substantially affected by the initial application of IFRS 15, “Revenue from Contracts with Customers” (see the commentary on Note 2).3Based on weighted-average number of shares outstanding.
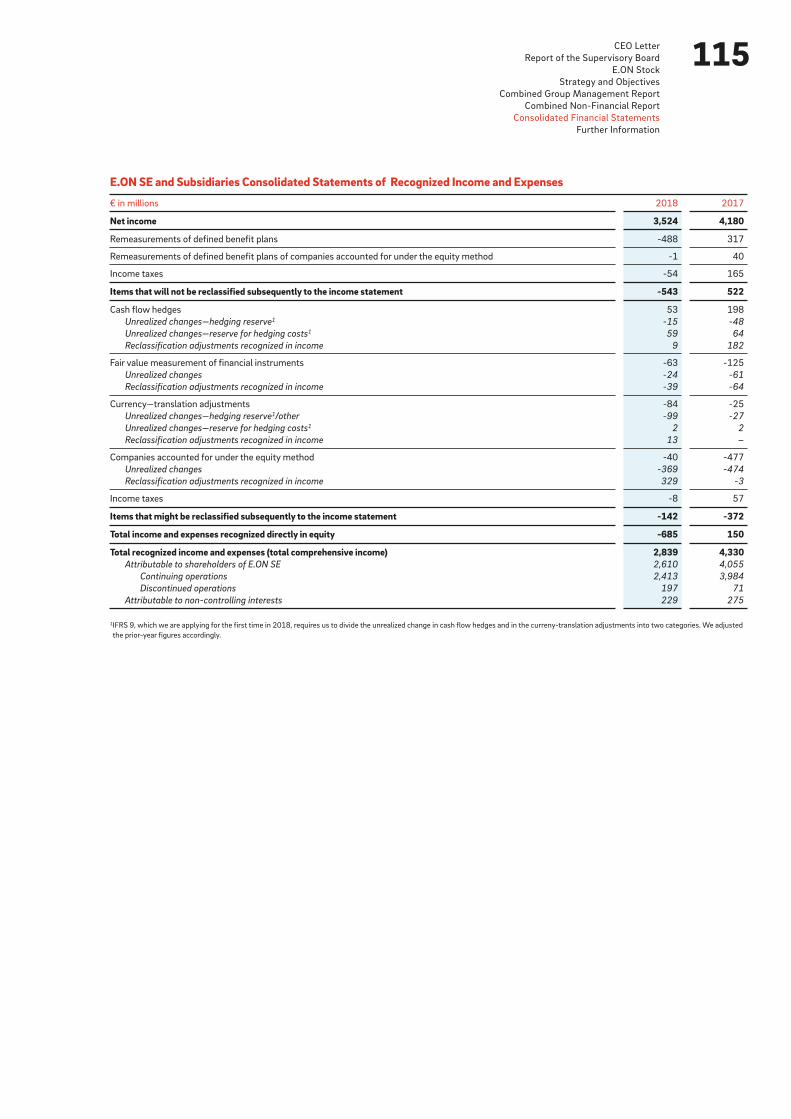
115CEO Letter
Report of the Supervisory Board
E.ON Stock
Strategy and Objectives
Combined Group Management Report
Combined Non-Financial Report
Consolidated Financial Statements
Further Information
E.ON SE and Subsidiaries Consolidated Statements of Recognized Income and Expenses
€ in millions 2018 2017
Net income 3,524 4,180
Remeasurements of defined benefit plans -488 317
Remeasurements of defined benefit plans of companies accounted for under the equity method -1 40
Income taxes -54 165
Items that will not be reclassified subsequently to the income statement -543 522
Cash flow hedges 53 198
Unrealized changes—hedging reserve 1 -15 -48
Unrealized changes—reserve for hedging costs 1 59 64
Reclassification adjustments recognized in income 9 182
Fair value measurement of financial instruments -63 -125
Unrealized changes -24 -61
Reclassification adjustments recognized in income -39 -64
Currency—translation adjustments -84 -25
Unrealized changes—hedging reserve 1/other -99 -27
Unrealized changes—reserve for hedging costs 1 2 2
Reclassification adjustments recognized in income 13 –
Companies accounted for under the equity method -40 -477
Unrealized changes -369 -474
Reclassification adjustments recognized in income 329 -3
Income taxes -8 57
Items that might be reclassified subsequently to the income statement -142 -372
Total income and expenses recognized directly in equity -685 150
Total recognized income and expenses (total comprehensive income) 2,839 4,330Attributable to shareholders of E.ON SE 2,610 4,055
Continuing operations 2,413 3,984
Discontinued operations 197 71
Attributable to non-controlling interests 229 275
1IFRS 9, which we are applying for the first time in 2018, requires us to divide the unrealized change in cash flow hedges and in the curreny-translation adjustments into two categories. We adjusted
the prior-year figures accordingly.

116
E.ON SE and Subsidiaries Balance Sheets—Assets
€ in millions Note
December 31,
2018 2017
Goodwill (14) 2,054 3,337
Intangible assets (14) 2,162 2,243
Property, plant and equipment (14) 18,057 24,766
Companies accounted for under the equity method (15) 2,603 3,547
Other financial assets (15) 2,904 3,541
Equity investments 664 792
Non-current securities 2,240 2,749
Financial receivables and other financial assets (17) 427 452
Operating receivables and other operating assets (17) 1,474 1,371
Deferred tax assets (10) 1,195 907
Income tax assets (10) 7 –
Non-current assets 30,883 40,164
Inventories (16) 684 794
Financial receivables and other financial assets (17) 284 236
Trade receivables and other operating assets (17) 5,445 5,781
Income tax assets (10) 229 514
Liquid funds (18) 5,357 5,160
Securities and fixed-term deposits 774 670
Restricted cash and cash equivalents 659 1,782
Cash and cash equivalents 3.924 2,708
Assets held for sale (4) 11,442 3,301
Current assets 23,441 15,786
Total assets 54,324 55,950
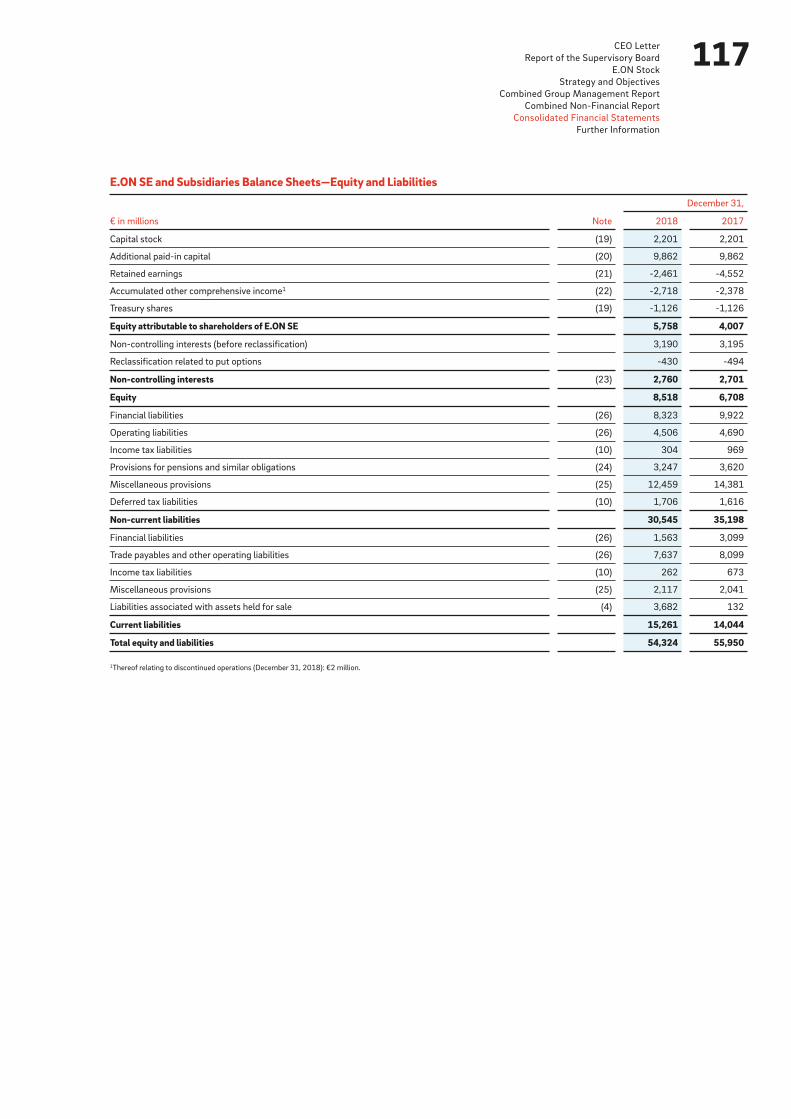
117CEO Letter
Report of the Supervisory Board
E.ON Stock
Strategy and Objectives
Combined Group Management Report
Combined Non-Financial Report
Consolidated Financial Statements
Further Information
E.ON SE and Subsidiaries Balance Sheets—Equity and Liabilities
€ in millions Note
December 31,
2018 2017
Capital stock (19) 2,201 2,201
Additional paid-in capital (20) 9,862 9,862
Retained earnings (21) -2,461 -4,552
Accumulated other comprehensive income 1 (22) -2,718 -2,378
Treasury shares (19) -1,126 -1,126
Equity attributable to shareholders of E.ON SE 5,758 4,007
Non-controlling interests (before reclassification) 3,190 3,195
Reclassification related to put options -430 -494
Non-controlling interests (23) 2,760 2,701
Equity 8,518 6,708
Financial liabilities (26) 8,323 9,922
Operating liabilities (26) 4,506 4,690
Income tax liabilities (10) 304 969
Provisions for pensions and similar obligations (24) 3,247 3,620
Miscellaneous provisions (25) 12,459 14,381
Deferred tax liabilities (10) 1,706 1,616
Non-current liabilities 30,545 35,198
Financial liabilities (26) 1,563 3,099
Trade payables and other operating liabilities (26) 7,637 8,099
Income tax liabilities (10) 262 673
Miscellaneous provisions (25) 2,117 2,041
Liabilities associated with assets held for sale (4) 3,682 132
Current liabilities 15,261 14,044
Total equity and liabilities 54,324 55,950
1Thereof relating to discontinued operations (December 31, 2018): €2 million.

118
E.ON SE and Subsidiaries Consolidated Statements of Cash Flows
€ in millions 2018 2017 1
Net income 3,524 4,180
Income/Loss from discontinued operations, net -286 -23
Depreciation, amortization and impairment of intangible assets and of property, plant and equipment 1,575 1,700
Changes in provisions -397 -526
Changes in deferred taxes 205 73
Other non-cash income and expenses 57 -139
Gain/Loss on disposal of intangible assets and property, plant and equipment, equity investments and securities (> 3 months) -926 -479
Intangible assets and property, plant and equipment -51 -47
Equity investments -795 -176
Securities (> 3 months) -80 -256
Changes in operating assets and liabilities and in income taxes -1,457 1,994
Inventories and carbon allowances 63 -45
Trade receivables -243 119
Other operating receivables and income tax assets -232 979
Trade payables -47 -173
Other operating liabilities and income taxes -998 1,114
Payment to the fund for nuclear-waste management – -10,289
Cash provided by (used for) operating activities of continuing operations 2,295 -3,509
Cash provided by (used for) operating activities of discontinued operations 558 557
Cash provided by (used for) operating activities (operating cash flow) 2,853 -2,952
Proceeds from disposal of 4,306 750
Intangible assets and property, plant and equipment 118 139
Equity investments 4,188 611
Purchases of investments in -2,487 -2,095
Intangible assets and property, plant and equipment -2,280 -2,051
Equity investments -207 -44
Proceeds from disposal of securities (> 3 months) and of financial receivables and fixed-term deposits 2,630 6,354
Purchases of securities (> 3 months) and of financial receivables and fixed-term deposits -3,533 -3,290
Changes in restricted cash and cash equivalents 1,122 -940
Cash provided by (used for) investing activities of continuing operations 2,038 779
Cash provided by (used for) investing activities of discontinued operations -1,027 -1,170
Cash provided by (used for) investing activities 1,011 -391
Payments received/made from changes in capital 2 6 1,361
Cash dividends paid to shareholders of E.ON SE -650 -345
Cash dividends paid to non-controlling interests -233 -205
Proceeds from financial liabilities 1,819 3,844
Repayments of financial liabilities -3,674 -4,966
Cash provided by (used for) financing activities of continuing operations -2,732 -311
Cash provided by (used for) financing activities of discontinued operations 95 851
Cash provided by (used for) financing activities -2,637 540
1The comparative prior-year figures have been adjusted to account for the reporting of discontinued operations (see also Note 4).2No material netting has taken place in either of the years presented here.

119CEO Letter
Report of the Supervisory Board
E.ON Stock
Strategy and Objectives
Combined Group Management Report
Combined Non-Financial Report
Consolidated Financial Statements
Further Information
E.ON SE and Subsidiaries Consolidated Statements of Cash Flows
€ in millions 2018 2017 1
Net increase/decrease in cash and cash equivalents 1,227 -2,803
Effect of foreign exchange rates on cash and cash equivalents – -8
Cash and cash equivalents at the beginning of the year 3 2,763 5,574
Cash and cash equivalents from the deconsolidation of discontinued operations -66 -90
Cash and cash equivalents at the end of the period 4 3,924 2,673
Supplementary information on cash flows from operating activities
Income taxes paid (less refunds) -628 -483
Interest paid -784 -979
Interest received 178 745
Dividends received 331 364
1The comparative prior-year figures have been adjusted to account for the reporting of discontinued operations (see also Note 4).3Cash and cash equivalents at the beginning of the year also includes holdings of €90 million in companies in the Renewables segment (which is reported as a discontinued operation), and €55 million
from Hamburg Netz GmbH, which was deconsolidated in the first quarter of 2018.4Cash and cash equivalents of continuing operations at year-end also include the holdings of €55 million in Hamburg Netz GmbH, which was deconsolidated in the first quarter of 2018.

120
1IFRS 9, which we are applying for the first time in 2018, requires us to divide the unrealized change in cash flow hedges and in net investment hedges into two categories. We adjusted the prior-year
figures accordingly.
Statement of Changes in Equity
€ in millions
Capital
stock
Additional
paid-in
capital
Retained
earnings
Changes in accumulated other comprehensive income
Currency translation
adjustmentsFair value
measure-
ment of
financial
instruments
Cash flow hedges
Hedging
reserve 1/
other
Reserve for
hedging
costs 1Hedging
reserve 1
Reserve for
hedging
costs 1
Balance as of January 1, 2017 2,001 9,201 -8,495 -1,156 6 353 -1,114 -137
Change in scope of consolidation
Treasury shares repurchased/sold -478 -3
Capital increase 200 1,139
Capital decrease
Dividends -452
Share additions/reductions 13
Net additions/disposals from
reclassification related to put
options
Total comprehensive income 4,385 -507 2 -60 171 64
Net income/loss 3,925
Other comprehensive income 460 -507 2 -60 171 64
Remeasurements of defined
benefit plans 460
Changes in accumulated
other comprehensive
income -507 2 -60 171 64
Balance as of December 31, 2017 2,201 9,862 -4,552 -1,663 8 293 -943 -73
IFRS 9, IFRS 15 adjustment – – -9 – – -203 – –
Balance as of January 1, 2018 2,201 9,862 -4,561 -1,663 8 90 -943 -73
Change in scope of consolidation
Treasury shares repurchased/sold
Capital increase
Capital decrease
Dividends -650
Share additions/reductions 3
Net additions/disposals from
reclassification related to put
options
Total comprehensive income 2,747 -112 2 -51 -35 59
Net income/loss 3,223
Other comprehensive income -476 -112 2 -51 -35 59
Remeasurements of defined
benefit plans -476
Changes in accumulated
other comprehensive
income -112 2 -51 -35 59
Balance as of December 31, 2018 2,201 9,862 -2,461 -1,775 10 39 -978 -14
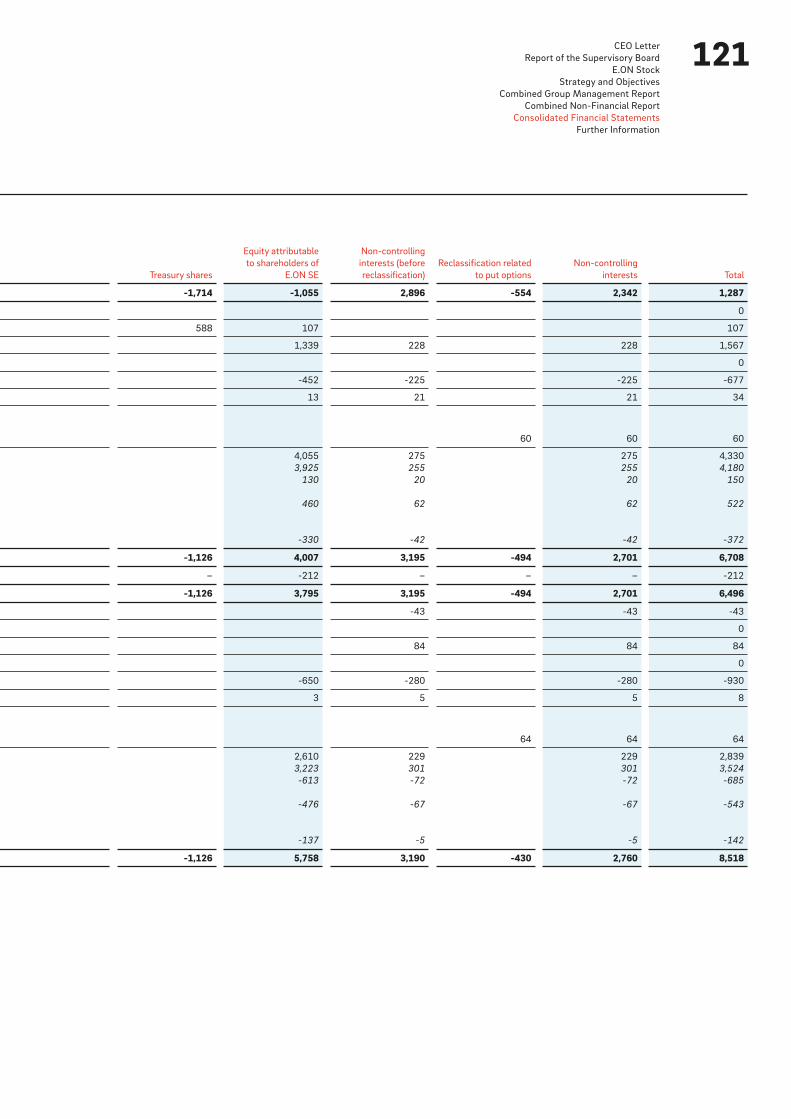
121CEO Letter
Report of the Supervisory Board
E.ON Stock
Strategy and Objectives
Combined Group Management Report
Combined Non-Financial Report
Consolidated Financial Statements
Further Information
Treasury shares
Equity attributable
to shareholders of
E.ON SE
Non-controlling
interests (before
reclassification)
Reclassification related
to put options
Non-controlling
interests Total
-1,714 -1,055 2,896 -554 2,342 1,287
0
588 107 107
1,339 228 228 1,567
0
-452 -225 -225 -677
13 21 21 34
60 60 60
4,055 275 275 4,330
3,925 255 255 4,180
130 20 20 150
460 62 62 522
-330 -42 -42 -372
-1,126 4,007 3,195 -494 2,701 6,708
– -212 – – – -212
-1,126 3,795 3,195 -494 2,701 6,496
-43 -43 -43
0
84 84 84
0
-650 -280 -280 -930
3 5 5 8
64 64 64
2,610 229 229 2,839
3,223 301 301 3,524
-613 -72 -72 -685
-476 -67 -67 -543
-137 -5 -5 -142
-1,126 5,758 3,190 -430 2,760 8,518

122Notes
or significant influence, gains and losses from these dilutive
transactions are included in the income statement under other
operating income or expenses.
Where necessary, adjustments are made to the subsidiaries’
financial statements to bring their accounting policies into line
with those of the Group. Intercompany receivables, liabilities
and results are eliminated in the consolidation process.
Associated CompaniesAn associate is an investee over whose financial and operating
policy decisions E.ON has significant influence and that is not
controlled by E.ON or jointly controlled with E.ON. Significant
influence is presumed if E.ON directly or indirectly holds at least
20 percent, but not more than 50 percent, of an entity’s voting
rights.
Interests in associated companies are accounted for using the
equity method.
Interests in associated companies accounted for using the equity
method are reported on the balance sheet at cost, adjusted for
changes in the Group’s share of the net assets after the date of
acquisition and for any impairment charges. Losses that might
potentially exceed the Group’s interest in an associated company
when attributable long-term loans are taken into consideration
are generally not recognized. Any difference between the cost
of the investment and the pro rata remeasured value of its net
assets is recognized in the Consolidated Financial Statements
as part of the carrying amount.
Unrealized gains and losses arising from transactions with
associated companies accounted for using the equity method
are eliminated within the consolidation process on a pro rata
basis if they are material.
Companies accounted for using the equity method are tested for
impairment by comparing the carrying amount with its recover-
able amount. If the carrying amount exceeds the recoverable
amount, the carrying amount is adjusted for this difference. If the
reasons for previously recognized impairment losses no longer
exist, such impairment losses are reversed accordingly.
(1) Summary of Significant Accounting Policies
Basis of Presentation
The Consolidated Financial Statements of E.ON SE, Essen, reg-
istered in the Commercial Register of Essen District Court under
number HRB 28196, have been prepared in accordance with
Section 315e (1) of the German Commercial Code (“HGB”) and
with those International Financial Reporting Standards (“IFRS”)
and IFRS Interpretations Committee interpretations (“IFRIC”)
that were adopted by the European Commission for use in the
EU as of the end of the fiscal year, and whose application was
mandatory as of December 31, 2018.
Principles
The Consolidated Financial Statements of the E.ON Group (“E.ON”
or the “Group”) are generally prepared at cost, with the exception
of financial assets that are measured at fair value through OCI
(FVOCI) and of financial assets and liabilities (including deriva-
tive financial instruments) that are recognized in income and
measured at fair value through profit or loss (FVPL).
Scope of ConsolidationThe Consolidated Financial Statements incorporate the finan-
cial statements of E.ON SE and entities controlled by E.ON
(“subsidiaries”). Control exists when E.ON as the investor can
direct the activities relevant to the business performance of
the entity, participate in this business performance in the form
of variable returns and influence the performance and the
related variable returns through its involvement. Control is nor-
mally deemed established if E.ON directly or indirectly holds a
majority of the voting rights in the investee. In structured entities,
control can be established by means of contractual arrangements
if control is not demonstrated through possession of a majority
of the voting rights.
The results of the subsidiaries acquired or disposed of during
the year are included in the Consolidated Statement of Income
from the date of acquisition or until the date of their disposal,
respectively.
If a subsidiary or associate sells shares to a third party, leading
to a reduction in E.ON’s ownership interest in these investees
(“dilution”), and consequently to a loss of control, joint control
123CEO Letter
Report of the Supervisory Board
E.ON Stock
Strategy and Objectives
Combined Group Management Report
Combined Non-Financial Report
Consolidated Financial Statements
Further Information
The financial statements of equity interests accounted for using
the equity method are generally prepared using accounting that
is uniform within the Group.
Joint VenturesJoint ventures are also accounted for using the equity method.
Unrealized gains and losses arising from transactions with joint-
venture companies are eliminated within the consolidation
process on a pro rata basis if they are material.
Joint OperationsA joint operation exists when E.ON and other investors directly
control an operation, but unlike a joint venture, they do not have
a claim to the changes in net assets from the operation. Instead,
they have direct rights to individual assets or direct obligations
with respect to individual liabilities in connection with the oper-
ation. E.ON recognizes assets and liabilities as well as revenues
and expenses in a joint operation pro rata according to the rights
and obligations attributable to E.ON.
Business CombinationsBusiness combinations are accounted for using the purchase
method, under which the purchase price is offset against the
proportional share in the acquired company’s net assets. The
values at the acquisition date that corresponds to the date at
which control of the acquired company was attained are used
as a basis. The acquiree’s identifiable assets, liabilities and con-
tingent liabilities are generally recognized at their fair values
irrespective of the extent attributable to non-controlling inter-
ests. The fair values are determined using published exchange or
market prices at the time of acquisition in the case of marketable
securities, for example, and in the case of land, buildings and
major technical equipment, generally using independent expert
reports that have been prepared by third parties. If exchange or
market prices are unavailable for consideration, fair values are
derived from market prices for comparable assets or comparable
transactions. If these values are not directly observable, fair
value is determined using appropriate valuation methods. In such
cases, E.ON determines fair value using the discounted cash
flow method by discounting estimated future cash flows by
a weighted-average cost of capital. Estimated cash flows are
consistent with the internal mid-term planning data for the
next three years, followed by two additional years of cash flow
projections, which are extrapolated through the end of an asset’s
useful life using a growth rate based on industry and internal
projections. In certain justified exceptional cases, a longer detailed
planning period is used as the calculation basis. The discount
rate reflects the specific risks inherent in the acquired activities.
Non-controlling interests can be measured either at cost (partial
goodwill method) or at fair value (full goodwill method). The
choice of method can be made on a case-by-case basis. The
partial goodwill method is generally used within the E.ON Group.
Transactions with holders of non-controlling interests are treated
in the same way as transactions with investors. Should the
acquisition of additional shares in a subsidiary result in a differ-
ence between the cost of purchasing the shares and the carrying
amounts of the non-controlling interests acquired, that difference
must be fully recognized in equity.
Gains and losses from disposals of shares to subsidiaries are
also recognized in equity, provided that such disposals do not
coincide with a loss of control.
Intangible assets must be recognized separately if they are
clearly separable or if their recognition arises from a contractual
or other legal right. Provisions for restructuring measures may
not be recorded in a purchase price allocation. If the purchase
price paid exceeds the proportional share in the net assets at
the time of acquisition, the positive difference is recognized as
goodwill. No goodwill is recognized for positive differences
attributable to non-controlling interests. A negative difference
is recognized in net income.
Foreign Currency TranslationThe Company’s transactions denominated in foreign currency are
translated at the current exchange rate at the date of the trans-
action. At each balance sheet date monetary foreign currency
items are adjusted to the exchange rate on the reporting date;
any gains and losses resulting from fluctuations in the relevant
currencies are recognized in net income and reported as other
operating income and other operating expenses, respectively.
Gains and losses from the translation of non-derivative financial
instruments used in hedges of net investments in foreign
operations are recognized in equity as a component of other
comprehensive income. The ineffective portion of the hedging
instrument is immediately recognized in net income.

124Notes
Recognition of Incomea) RevenuesRevenues are generated primarily from the sale of electricity
and gas to retail customers, industrial and commercial cus-
tomers and wholesale markets. Revenues earned from the dis-
tribution of electricity and gas and from deliveries of steam and
heat are also primarily recognized under revenues.
Due to the changed revision criteria for principal-agent relation-
ships, revenues no longer include the fees for the promotion of
Renewables because under IFRS 15 these revenues are netted
with the corresponding cost of materials (net disclosure). E.ON
acts as an agent if another party is essentially responsible for ful-
filling the contract (in the case of the fee mandated by the German
Renewable Energy Sources Act, E.ON only transmits electricity
generated from renewable energy sources by third parties),
E.ON bears no inventory or default risk, E.ON cannot influence
the pricing, and E.ON receives a commission as remuneration.
Revenues are generally recognized when E.ON fulfills its perfor-
mance obligation by transferring a promised good or service to
a customer. An asset is deemed to be transferred when the cus-
tomer obtains control of the asset. The majority of the E.ON
Group’s performance obligations are fulfilled over time. The rel-
atively subordinate point-in-time revenue recognition occurs
primarily in the “Build & Sell” segment. Revenue is recognized
when control is transferred to the customer, which means that
no significant discretionary decisions are required. For all such
revenues, progress is measured using output-based methods.
The methods used appropriately reflect the pattern of transfer
of goods to customers or provision of services for customers.
Revenues from the sale of goods and services are measured using
the transaction prices allocated to these goods and services.
They reflect the value of the volume supplied, including an
The functional currency as well as the reporting currency of
E.ON SE is the euro. The assets and liabilities of the Company’s
foreign subsidiaries with a functional currency other than the
euro are translated using the exchange rates applicable on the
balance sheet date, while items of the statements of income
are translated using annual average exchange rates. Material
transactions of foreign subsidiaries occurring during the fiscal
year are translated in the financial statements using the exchange
rate at the date of the transaction. Differences arising from
the translation of assets and liabilities compared with the corre-
sponding translation of the prior year, as well as exchange rate
differences between the income statement and the balance
sheet, are reported separately in equity as a component of other
comprehensive income.
Foreign currency translation effects that are attributable to the
cost of monetary financial instruments classified as at fair value
through OCI are recognized in income. In the case of fair-value
adjustments of monetary financial instruments, the foreign cur-
rency translation effects are recognized in equity as a component
of other comprehensive income.
The following table depicts the movements in exchange rates for
the periods indicated for major currencies of countries outside
the European Monetary Union:
Currencies
ISO-
Code
€1, rate at
year-end
€1, annual
average rate
2018 2017 2018 2017
British pound GBP 0.89 0.89 0.88 0.88
Danish krone DKK 7.47 7.44 7.45 7.44
Romanian leu RON 4.66 4.66 4.65 4.57
Swedish krona SEK 10.25 9.84 10.26 9.64
Czech crown CZK 25.72 25.54 25.65 26.33
Turkish lira TRY 6.06 4.55 5.71 4.12
Hungarian forint HUF 320.98 310.33 318.89 309.19
U.S. dollar USD 1.15 1.20 1.18 1.13
125CEO Letter
Report of the Supervisory Board
E.ON Stock
Strategy and Objectives
Combined Group Management Report
Combined Non-Financial Report
Consolidated Financial Statements
Further Information
estimated value of the volume supplied to customers between
the date of the last invoice and the end of the period. Monthly
advance payments for B2C customers are generally determined
on the basis of historical consumption data and peak payments
are settled at the end of the year. In B2B, a bottom-up approach
is used to calculate individual rates. E.ON’s sales transactions
generally are not based on any material finance components.
The average target payment period is between 14 and 45 days.
Refunds to customers are an exception and are only granted
if the customer is disconnected from the power supply for an
extended period of time. Similarly, as a rule, no warranties are
granted in the Core Business. Warranties are only granted in the
“Build & Sell” activities.
b) Interest IncomeInterest income is recognized pro rata using the effective interest
method.
c) Dividend IncomeDividend income is recognized when the right to receive the
distribution payment arises.
Electricity and Energy TaxesElectricity and energy taxes are levied on electricity and natural
gas delivered to retail customers and are calculated on the basis
of a fixed tax rate per kilowatt-hour (“kWh”). This rate varies
between different classes of customers. Electricity and energy
taxes payable are deducted from sales revenues on the face
of the income statement if those taxes are levied upon delivery
of energy to the retail customer.
Earnings per ShareBasic (undiluted) earnings per share is computed by dividing the
consolidated net income attributable to the shareholders of the
parent company by the weighted-average number of ordinary
shares outstanding during the relevant period. At E.ON, the com-
putation of diluted earnings per share is identical to that of basic
earnings per share because E.ON SE has issued no potentially
dilutive ordinary shares.
Goodwill and Intangible AssetsGoodwillGoodwill is not amortized, but rather tested for impairment at
the cash-generating unit level on at least an annual basis. Impair-
ment tests must also be performed between these annual tests
if events or changes in circumstances indicate that the carrying
amount of the respective cash-generating unit might not be
recoverable.
Newly created goodwill is allocated to those cash-generating
units expected to benefit from the respective business combi-
nation. The cash-generating units to which goodwill is allocated
are generally equivalent to the operating segments, since good-
will is reported, and considered in performance metrics for
controlling, only at that level. Goodwill impairment testing is
performed in euro, while the underlying goodwill is always carried
in the functional currency.
In a goodwill impairment test, the recoverable amount of a
cash- generating unit is compared with its carrying amount,
including goodwill. The recoverable amount is the higher of the
cash-generating unit’s fair value less costs to sell and its value
in use. In a first step, E.ON determines the recoverable amount
of a cash-generating unit on the basis of the fair value (less
costs to sell) using generally accepted valuation procedures. This
is based on the medium-term planning data of the respective
cash-generating unit. Valuation is performed using the discounted
cash flow method. In addition, market transactions or valuations
prepared by third parties for com parable assets are used to
the extent available. If needed, a calculation of value in use is
also performed. Unlike fair value, the value in use is calculated
from the viewpoint of management. In accordance with IAS 36,
“Impairment of Assets,” (“IAS 36”) it is further ensured that
restructuring expenses, as well as initial and subsequent capital
investments (where those have not yet commenced), in particu-
lar, are not included in the valuation.
126Notes
reflects an appropriate level of depletion. Technology-based
intangible assets are generally amortized over a useful life of
between 3 and 33 years. This category includes software in
particular. Contract-based intangible assets are amortized in
accordance with the provisions specified in the contracts.
Useful lives and amortization methods are subject to annual
verification. Intangible assets subject to amortization are tested
for impairment whenever events or changes in circumstances
indicate that such assets may be impaired.
Intangible assets not subject to amortization are measured at
cost and tested for impairment annually or more frequently if
events or changes in circumstances indicate that such assets
may be impaired. Moreover, such assets are reviewed annually
to determine whether an assessment of indefinite useful life
remains applicable.
In accordance with IAS 36, the carrying amount of an intangible
asset, whether subject to amortization or not, is tested for
impairment by comparing the carrying value with the asset’s
recoverable amount, which is the higher of its value in use
and its fair value less costs to sell. Should the carrying amount
exceed the corresponding recoverable amount, an impairment
charge equal to the difference between the carrying amount and
the recoverable amount is recognized and reported in income
under “Depreciation, amortization and impairment charges.”
If the reasons for previously recognized impairment losses no
longer exist, such impairment losses are reversed. A reversal
shall not cause the carrying amount of an intangible asset subject
to amortization to exceed the amount that would have been
determined, net of amortization, had no impairment loss been
recognized during the period.
If a recoverable amount cannot be determined for an individual
intangible asset, the recoverable amount for the smallest iden-
tifiable group of assets (cash-generating unit) that the intangible
asset may be assigned to is determined. See Note 14 for addi-
tional information about goodwill and intangible assets.
If the carrying amount exceeds the recoverable amount, the
goodwill allocated to that cash-generating unit is adjusted in
the amount of this difference.
If the impairment thus identified exceeds the goodwill allocated
to the affected cash-generating unit, the remaining assets of
the unit must be written down in proportion to their carrying
amounts. Individual assets may be written down only if their
respective carrying amounts do not fall below the highest of the
following values as a result:
• Fair value less costs to sell
• Value in use, or
• Zero.
Any additional impairment loss that would otherwise have been
allocated to the asset concerned must instead be allocated pro
rata to the remaining assets of the unit.
E.ON has elected to perform the annual testing of goodwill for
impairment at the cash-generating unit level in the fourth quarter
of each fiscal year.
Impairment charges on the goodwill of a cash-generating unit
and reported in the income statement under “Depreciation,
amortization and impairment charges” may not be reversed in
subsequent reporting periods.
Intangible AssetsIAS 38, “Intangible Assets,” (“IAS 38”) requires that intangible
assets be amortized over their expected useful lives unless their
lives are considered to be indefinite. Factors such as typical
product life cycles and legal or similar limits on use are taken
into account in the classification.
Acquired intangible assets subject to amortization are classified
as marketing-related, customer-related, contract-based, and
technology-based. Internally generated intangible assets subject
to amortization are related to software. Intangible assets subject
to amortization are measured at cost and are generally amortized
using the straight-line method over their expected useful lives.
The useful lives of marketing-related intangible assets range
between 5 and 30 years, between 2 and 50 years for customer-
related intangible assets and between 3 and 50 years for con-
tract-based intangible assets, unless depreciation based on use

127CEO Letter
Report of the Supervisory Board
E.ON Stock
Strategy and Objectives
Combined Group Management Report
Combined Non-Financial Report
Consolidated Financial Statements
Further Information
Research and Development CostsUnder IFRS, expen diture on research is expensed as incurred,
while costs incurred during the development phase of new prod-
ucts, services and technologies are to be recognized as assets
when the general criteria for recognition specified in IAS 38 are
present. In the 2017 and 2018 fiscal years, E.ON capitalized
costs for internally generated software and other technologies
in this context.
Emission RightsUnder IFRS, emission rights held under national and international
emission-rights systems for the settlement of obligations are
reported as intangible assets. Because emission rights are not
depleted as part of the production process, they are reported
as intangible assets not subject to amortization. Emission rights
are capitalized at cost at the time of acquisition.
A provision is recognized for emissions produced. The provision is
measured at the carrying amount of the emission rights held or,
in the case of a shortfall, at the current fair value of the emission
rights needed.
Property, Plant and EquipmentProperty, plant and equipment are initially measured at acquisi-
tion or production cost, including decommissioning or resto-
ration cost that must be capitalized, and are depreciated over the
expected useful lives of the components, generally using the
straight-line method, unless a different method of depreciation
is deemed more suitable in certain exceptional cases. The useful
lives of the major asset classes of property, plant and equipment
are presented below:
Property, plant and equipment are tested for impairment when-
ever events or changes in circumstances indicate that an asset
may be impaired. In such a case, property, plant and equipment
are tested for impairment according to the principles prescribed
for intangible assets in IAS 36. If the reasons for previously
recognized impairment losses no longer exist, such impairment
losses are reversed and recognized in income. Such reversal
shall not cause the carrying amount to exceed the amount that
would have resulted had no impairment taken place during the
preceding periods.
Subsequent costs arising, for example, from additional or
replacement capital expenditure are only recognized as part of
the acquisition or production cost of the asset, or else—if rele-
vant—recognized as a separate asset if it is probable that the
Group will receive a future economic benefit and the cost can
be determined reliably.
Repair and maintenance costs that do not constitute significant
replacement capital expenditure are expensed as incurred.
Borrowing CostsBorrowing costs that arise in connection with the acquisition,
construction or production of a qualifying asset from the time of
acquisition or from the beginning of construction or production
until its entry into service are capitalized and subsequently
amortized alongside the related asset. In the case of a specific
financing arrangement, the respective borrowing costs incurred
for that particular arrangement during the period are used.
For non-specific financing arrangements, a financing rate
uniform within the Group of 5.37 percent was applied for 2018
(2017: 5.47 percent). Other borrowing costs are expensed.
Government GrantsGovernment investment subsidies do not reduce the acquisition
and production costs of the respective assets; they are instead
reported on the balance sheet as deferred income. They are rec-
ognized in income on a straight-line basis over the associated
asset’s expected useful life.
Government grants are recognized at fair value if the Group
satisfies the necessary conditions for receipt of the grant and if
it is highly probable that the grant will be issued.
Government grants for costs are posted as income over the
period in which the costs are incurred.
Useful Lives of Property, Plant and Equipment
Buildings 5 to 60 years
Technical equipment, plant and machinery 2 to 50 years
Other equipment, fixtures, furniture and office
equipment 2 to 30 years
128Notes
the minimum lease payments as a receivable. Payments by the
lessee are apportioned between a reduction of the lease receiv-
able and interest income. The income from such arrangements
is recognized over the term of the lease using the effective
interest method.
All other transactions in which E.ON is the lessor are treated as
operating leases. E.ON retains the leased property on its balance
sheet as an asset, and the lease payments are generally recorded
on a straight-line basis as income over the term of the lease.
Financial InstrumentsNon-Derivative Financial InstrumentsNon-derivative financial instruments are measured in accordance
with IFRS 9, “Financial Instruments” (“IFRS 9”). They are recog-
nized at fair value, including transaction costs, on the settlement
date when acquired, provided they are not recognized at fair
value through profit and loss.
E.ON replaced the previous categories under IAS 39 of financial
assets held for trading (HfT), available-for-sale securities (AfS)
and loans and receivables (LaR), which had been valid until
December 31, 2017, with the new categories under IFRS 9 of
financial assets measured at amortized cost (AmC), financial
assets measured at fair value through other comprehensive
income (FVOCI) and financial assets measured at fair value
through profit and loss (FVPL).
The classification of financial assets is based on the business
model and the characteristics of the cash flows.
If a financial asset is held for the purpose of collecting contractual
cash flows and the cash flows of the financial asset represent
exclusively interest and principal payments, then the financial
asset is measured at amortized cost (AmC).
LeasingLeasing transactions are classified according to the lease agree-
ments and to the underlying risks and rewards specified therein
in line with IAS 17, “Leases” (“IAS 17”). In addition, IFRIC 4,
“Determining Whether an Arrangement Contains a Lease,”
(“IFRIC 4”) further defines the criteria as to whether an agreement
that conveys a right to use an asset meets the definition of a
lease. Certain purchase and supply contracts in the electricity and
gas business as well as certain rights of use may be classified as
leases if the cumulative criteria in IFRIC 4 are met. E.ON is party
to some agreements in which it is the lessor and to others in
which it is the lessee.
Leasing transactions in which E.ON is involved as the lessee are
classified either as finance leases or operating leases. If E.ON
bears substantially all of the risks and rewards incident to own-
ership of the leased property, the transaction is classified as a
finance lease. In such case, E.ON recognizes the leased property
and the lease liability on its balance sheet.
The leased property is recognized at the beginning of the lease
term at the lower of fair value or the present value of the mini-
mum lease payments, and the lease liability is recognized as a
liability in an equal amount.
The leased property is depreciated over its useful economic life
or, if it is shorter, the term of the lease. The liability is subsequently
measured using the effective interest method.
All other transactions in which E.ON is the lessee are classified
as operating leases. Payments made under operating leases are
generally expensed over the term of the lease.
Leasing transactions in which E.ON is the lessor and substantially
all the risks and rewards incident to ownership of the leased
property are transferred to the lessee are classified as finance
leases. In this type of lease, E.ON records the present value of

129CEO Letter
Report of the Supervisory Board
E.ON Stock
Strategy and Objectives
Combined Group Management Report
Combined Non-Financial Report
Consolidated Financial Statements
Further Information
A financial asset is measured at fair value through other compre-
hensive income (FVOCI) if it is used both to collect contractual
cash flows and for sales purposes and the cash flows of the
financial asset consist exclusively of interest and principal pay-
ments.
Unrealized gains and losses from financial assets measured at
fair value through other comprehensive income (FVOCI), net of
related deferred taxes, are reported as a component of equity
(other comprehensive income) until realized. Realized gains and
losses are determined by analyzing each transaction individually.
Debt instruments that do not exclusively serve to collect contrac-
tual cash flows or to both generate contractual cash flows and
sales revenue, or whose cash flows do not exclusively consist of
interest and principal payments are measured at fair value
through profit and loss (FVPL). For equity instruments that are
not held for trading purposes, E.ON has uniformly exercised the
option of recognizing changes in fair value through profit or loss
(FVPL).
Under IFRS 9, impairments of financial assets must no longer be
recognized only for losses already incurred, but also for expected
future credit defaults. The amount of the impairment loss calcu-
lated in the determination of expected credit losses is recognized
on the income statement.
The expected future credit loss is calculated by multiplying the
probability of default by the carrying amount of the financial
asset (exposure at default) and the expected loss ratio (loss given
default). For information on the treatment of impairments under
IFRS 9, please see Note 31.
Non-derivative financial liabilities (including trade payables)
within the scope of IFRS 9 are measured at amortized cost, using
the effective interest method. Initial measurement takes place
at fair value, with transaction costs included in the measurement.
In the subsequent measurement, the residual carrying amount
is adjusted by the amortization and accretion of any premium
or discount remaining until maturity. The premium or discount
is recognized in financial results over its term.
If E.ON has already received consideration but the obligation to
deliver a good or service still exists, a contractual liability is rec-
ognized in accordance with IFRS 15.
Derivative Financial Instruments and HedgingDerivative financial instruments and separated embedded
derivatives are measured at fair value as of the balance sheet
date at initial recognition and in subsequent periods. Under
IFRS 9, they are classified as at fair value through profit and
loss (FVPL) as long as they are not a component of a hedge
accounting relationship. Gains and losses from changes in fair
value are immediately recognized in net income.
The instruments primarily used are foreign currency forwards
and cross-currency interest rate swaps, as well as interest rate
swaps. In commodities, the instruments used primarily include
physically and financially settled forwards and options related
to electricity and gas.
As part of fair value measurement in accordance with IFRS 13,
the counterparty risk is also taken into account for derivative
financial instruments. E.ON determines this risk based on a
portfolio valuation in a bilateral approach for both own credit risk
(debt value adjustment) and the credit risk of the corresponding
counterparty (credit value adjustment). The counterparty risks
thus determined are allocated to the individual financial instru-
ments by applying the relative fair value method on a net basis.

130Notes
E.ON currently uses hedges in the framework of cash flow hedges
and hedges of a net investment.
Changes in fair value of derivative instruments that are recog-
nized in income are presented as other operating income or
expenses. Gains and losses from interest-rate derivatives are
netted for each contract and included in interest income.
Unrealized gains and losses resulting from the initial measure-
ment of derivative financial instruments at the inception of the
contract are not recognized in income. They are instead deferred
and recognized in income systematically over the term of the
derivative. An exception to the accrual principle applies if unre-
alized gains and losses from the initial measurement are verified
by quoted market prices, observable prices of other current
market transactions or other observable data supporting the val-
uation technique. In this case the gains and losses are recognized
in income.
Contracts that are entered into for purposes of receiving or deliv-
ering non-financial items in accordance with E.ON’s anticipated
procurement, sale or use requirements, and held as such, can
be classified as own-use contracts. They are not accounted for as
derivative financial instruments at fair value through profit and
loss (FVPL) in accordance with IFRS 9, but as open transactions
subject to the rules of IAS 37.
IFRS 7, “Financial Instruments: Disclosures,” (“IFRS 7”) and
IFRS 13 both require comprehensive quantitative and qualitative
disclosures about the extent of risks arising from financial
instruments. Additional information on financial instruments is
provided in Notes 30 and 31.
Primary and derivative financial instruments are netted on the
balance sheet if under IAS 32 E.ON has both an unconditional
right—even in the event of the counterparty’s insolvency—and
the intention to settle offsetting positions simultaneously and/or
on a net basis.
E.ON has designated some of these derivatives as part of a
hedging relationship. IFRS 9 sets requirements for the admissi-
bility of hedging instruments and the underlyings, the formal
desig nation and documentation of hedging relationships, the
hedging strategy, as well as fulfilling requirements of effective-
ness in order to qualify for hedge accounting. The designated
hedged items and hedging instruments are subject to the same
risk. This economic relationship ensures that the amounts of the
hedged items and hedging instruments are offset against each
other and that the hedging relationships are therefore effective.
The hedge ratio of the hedges is 1:1. Ineffectiveness arises only
if the measurement parameters of the hedged item and the
hedging instrument differ from one another. All components of
derivative gains and losses from the measurement of hedge
ineffectiveness are taken into consideration during recognition.
For qualifying fair value hedges, the change in the fair value of
the derivative and the change in the fair value of the hedged
item that is due to the hedged risk(s) are recognized in income.
If a derivative instrument qualifies as a cash flow hedge under
IFRS 9, the effective portion of the hedging instrument’s change
in fair value is recognized in equity (as a component of other
comprehensive income) and reclassified into income in the period
or periods during which the cash flows of the transaction being
hedged affect income. In accordance with IFRS 9, the currency
basis spread (hedging costs) will from now on be separated from
the hedging instrument and reported separately as an excluded
component in accumulated other comprehensive income in the
reserve for hedging costs as a component of equity.
The hedging result is reclassified into income during the period
in which the cash flows of the hedged asset are recognized in
income. The result is recognized imme diately in income if it
becomes probable that the hedged underlying transaction will
no longer occur. For hedging instruments used to establish
cash flow hedges, the change in fair value of the ineffective
portion is recognized immediately in the income statement to
the extent required.
To hedge the foreign currency risk arising from the Company’s
net investment in foreign operations, derivative as well as non-
derivative financial instruments are used. Gains or losses due
to changes in fair value and from foreign currency trans lation
are recognized within equity, as a component of other compre-
hensive income, under currency translation adjustments.
131CEO Letter
Report of the Supervisory Board
E.ON Stock
Strategy and Objectives
Combined Group Management Report
Combined Non-Financial Report
Consolidated Financial Statements
Further Information
InventoriesInventories are measured at the lower of acquisition or production
cost and net realizable value. The cost of raw materials, finished
products and goods purchased for resale is determined based on
the average cost method. In addition to production materials and
wages, production costs include material and production over-
heads based on normal capacity. The costs of general adminis-
tration are not capitalized. Inventory risks resulting from excess
and obsolescence are provided for using appropriate valuation
allowances, whereby inventories are written down to net real-
izable value.
Receivables, Contract Assets and Other AssetsA receivable is recognized under IFRS 15 when the goods or
services are delivered, provided that the right to consideration
is unconditional, i.e., is only related to the passage of time.
However, if the right to receive the consideration is contingent
upon conditions other than the passage of time, a contract asset
is recognized. An asset is recognized under other assets under
IFRS 15 if the cost of obtaining the contract is expected to be
recovered and the amortization period is longer than one year.
Receivables and other assets are initially measured at fair value,
which generally approximates nominal value. They are subse-
quently measured at amortized cost, using the effective interest
method. Valuation allowances, included in the reported net car-
rying amount, are provided for identifiable individual risks. If the
loss of a certain part of the receivables is probable, valuation
allowances are provided to cover the expected loss. Impairments
must also be recognized for expected future credit losses.
Liquid FundsLiquid funds include current securities, checks, cash on hand and
bank balances. Bank balances and securities with an original
maturity of more than three months are recognized under secu-
rities and fixed-term deposits. Liquid funds with an original
maturity of less than three months are considered to be cash
and cash equivalents, unless they are restricted.
Restricted cash with a remaining maturity in excess of twelve
months is classified as financial receivables and other financial
assets.
Assets Held for Sale and Liabilities Associated with Assets Held for Sale and Discontinued OperationsNon-current assets and any corresponding liabilities held for sale
and any directly attributable liabilities are recognized separately
from other assets and liabilities in the balance sheet in the line
items “Assets held for sale” and “Liabilities associated with assets
held for sale” if they can be disposed of in their current condition
and if there is sufficient probability of their disposal actually
taking place. The reclassification to the separate balance sheet
items is shown under Changes in scope of consolidation.
Discontinued operations are components of an entity that are
either held for sale or have already been sold and can be clearly
distinguished from other corporate operations, both operationally
and for financial reporting purposes. Additionally, the component
classified as a discontinued operation must represent a major
business line or a specific geographic business segment of the
Group.
Non-current assets that are held for sale either individually or
collectively as part of a disposal group, or that belong to a dis-
continued operation, are no longer depreciated. They are instead
accounted for at the lower of the carrying amount and the fair
value less any remaining costs to sell. If this value is less than
the carrying amount, an impairment loss is recognized.
The income and losses resulting from the measurement of
components held for sale as well as the gains and losses arising
from the disposal of discontinued operations, are reported sep-
arately on the face of the income statement under income/loss
from discontinued operations, net, as is the income from the
ordinary operating activities of these divisions. Prior-year income
statement figures are adjusted accordingly. The relevant assets
and liabilities are reported in a separate line on the balance sheet.
The cash flows of discontinued operations are reported sepa-
rately in the cash flow statement, with prior-year figures adjusted
accordingly. However, there is no reclassification of prior-year
balance sheet line items attributable to discon tinued operations.
132Notes
Share-Based PaymentShare-based payment plans issued in the E.ON Group are
accounted for in accordance with IFRS 2, “Share-Based Payment”
(“IFRS 2”). From 2013 to 2016, share-based payments were
based on the E.ON Share Matching Plan. Under this plan, the
number of allocated rights was governed by the development
of the financial measure ROCE (ROACE until 2015).
In 2015 and 2016, virtual shares were granted exclusively to
members of the Management Board of E.ON SE in the frame-
work of base and performance matching in accordance with
the share matching plan. Executives who in previous years had
participated in the share matching plan were granted a multi-
year bonus extending over a term of four years, whose payout
amount depends on the performance of the E.ON share up to
the payment date, instead of base and performance matching.
The members of the Management Board of E.ON SE were
granted virtual shares under the E.ON Share Matching Plan for
the last time in 2017.
In fiscal years 2017 and 2018, virtual shares were granted
to members of the Management Board of E.ON SE and certain
E.ON Group executives under the E.ON Performance Plan.
The E.ON Performance Plan uses a fair value determined by
an external service provider using a Monte Carlo simulation.
In all cases, these are commitments of the Company which pro-
vide for cash compensation based on the share price performance
at the end of the term. The compensation expense is recognized
in the income statement pro rata over the vesting period.
Provisions for Pensions and Similar ObligationsMeasurement of defined benefit obligations in accordance with
IAS 19, “Employee Benefits,” (“IAS 19“) is based on actuarial com-
putations using the projected unit credit method, with actuarial
valuations performed at year-end. The valuation encompasses
both pension obligations and pension entitlements that are
known on the reporting date and economic trend assumptions
such as assumptions on wage and salary growth rates and
pension increase rates, among others, that are made in order
to reflect realistic expectations, as well as variables specific
to reporting dates such as discount rates, for example.
Equity InstrumentsIFRS defines equity as the residual interest in the Group’s assets
after deducting all liabilities. Therefore, equity is the net amount
of all recognized assets and liabilities.
E.ON has entered into purchase commitments to holders of
non-controlling interests in subsidiaries. By means of these
agreements, the non-controlling shareholders have the right to
require E.ON to purchase their shares on specified conditions.
None of the contractual obli gations has led to the transfer of
substantially all of the risk and rewards to E.ON at the time of
entering into the contract. In such a case, IAS 32, “Financial
Instruments: Presentation,” (“IAS 32”) requires that a liability be
recognized at the present value of the probable future exercise
price. This amount is reclassified from a separate component
within non-controlling interests and reported separately as a
liability. The reclassification occurs irrespective of the probability
of exercise. The accretion of the liability is recognized as interest
expense. If a purchase commitment expires unexercised, the
liability reverts to non-controlling interests. Any remaining
difference between liabilities and non-controlling interests is
recognized directly in retained earnings.
Where shareholders of entities own statutory, non-excludable
rights of termination (as in the case of German partnerships, for
example), such termination rights require the reclassification of
non-controlling interests from equity into liabilities under IAS 32.
The liability is recognized at the present value of the expected
settlement amount irrespective of the probability of termination.
Changes in the value of the liability are reported within other
oper ating income. Accretion of the share of the results of the
non-controlling shareholders’ share in net income is recognized
in Net interest income/expense.
If E.ON SE or a Group company buys treasury shares of E.ON SE,
the value of the consideration paid, including directly attributable
additional costs (net after income taxes), is deducted from
E.ON SE’s equity until the shares are retired, distributed or resold.
If such treasury shares are subsequently distributed or sold, the
consideration received, net of any directly attributable additional
transaction costs and associated income taxes, is recognized in
equity.
133CEO Letter
Report of the Supervisory Board
E.ON Stock
Strategy and Objectives
Combined Group Management Report
Combined Non-Financial Report
Consolidated Financial Statements
Further Information
Included in gains and losses from the remeasurements of the
net defined benefit liability or asset are actuarial gains and
losses that may arise especially from differences between esti-
mated and actual variations in under lying assumptions about
demographic and financial variables. Additionally included is the
difference between the actual return on plan assets and the
expected interest income on plan assets included in the net
interest result. Remeasurements effects are recognized in full in
the period in which they occur and are not reported within the
Consolidated Statements of Income, but are instead recognized
within the Statements of Recognized Income and Expenses as
part of equity.
The employer service cost representing the additional benefits
that employees earned under the benefit plan during the fiscal
year is reported under personnel costs; the net interest on the
net liability or asset from defined benefit pension plans deter-
mined based on the discount rate applicable at the start of the
fiscal year is reported under financial results.
Past service cost, as well as gains and losses from settlements,
are fully recognized in the income statement in the period in
which the underlying plan amendment, curtailment or settle-
ment takes place. They are reported under personnel costs.
The amount reported on the balance sheet represents the pres-
ent value of the defined benefit obligations reduced by the fair
value of plan assets. If a net asset position arises from this cal-
culation, the amount is limited to the present value of available
refunds and the reduction in future con tributions and to the
benefit from prepayments of minimum funding requirements.
Such an asset position is recognized as an operating receivable.
Payments for defined contribution pension plans are expensed
as incurred and reported under personnel costs. Contributions
to state pension plans are treated like payments for defined
contribution pension plans to the extent that the obligations
under these pension plans generally correspond to those under
defined contribution pension plans.
Provisions for Asset Retirement Obligations and Other Miscellaneous ProvisionsIn accordance with IAS 37, “Provisions, Contingent Liabilities
and Contingent Assets,” (“IAS 37”) provisions are recognized
when E.ON has a legal or constructive present obligation towards
third parties as a result of a past event, it is probable that E.ON
will be required to settle the obligation, and a reliable estimate
can be made of the amount of the obligation. The provision is
recognized at the expected settlement amount. Long-term obli-
gations are reported as liabilities at the present value of their
expected settlement amounts if the interest rate effect (the differ-
ence between present value and repayment amount) resulting
from discounting is material; future cost increases that are fore-
seeable and likely to occur on the balance sheet date at year-end
must also be included in the measurement. Long-term obligations
are generally discounted at the market interest rate applicable
as of the respective balance sheet date, provided that it is not
negative. The accretion amounts and the effects of changes in
interest rates are generally presented as part of financial results.
A reimbursement related to the provision that is virtually certain
to be collected is capitalized as a separate asset. No offsetting
within provisions is permitted. Advance payments remitted are
deducted from the provisions.
Obligations arising from the decommissioning or dismantling of
property, plant and equipment are recognized during the period
of their occurrence at their discounted settlement amounts, pro-
vided that the obligation can be reliably estimated. The carrying
amounts of the respective property, plant and equipment are
increased by the same amounts. In subsequent periods, capital-
ized asset retirement costs are amortized over the expected
remaining useful lives of the assets, and the provision is accreted
to its present value on an annual basis.
Changes in estimates arise in particular from deviations from
original cost estimates, from changes to the maturity or the
scope of the relevant obligation, and also as a result of the reg-
ular adjustment of the discount rate to current market interest
rates. The adjustment of provisions for the decommissioning
and restoration of property, plant and equipment for changes
to estimates is generally recognized by way of a corresponding
adjustment to these assets, with no effect on income. If the
property, plant and equipment concerned have already been
fully depreciated, changes to estimates are recognized within
the income statement.
134Notes
Income TaxesUnder IAS 12, “Income Taxes,” (“IAS 12”) deferred taxes are rec-
ognized on temporary differences arising between the carrying
amounts of assets and liabilities on the balance sheet and their
tax bases (balance sheet liability method). Deferred tax assets
and liabilities are recognized for temporary differences that will
result in taxable or deductible amounts when taxable income is
calculated for future periods, unless those differences are the
result of the initial recognition of an asset or liability in a trans-
action other than a business combination that, at the time of
the transaction, affects neither accounting nor taxable profit/
loss. Uncertain tax positions are recognized at their most likely
value. IAS 12 further requires that deferred tax assets be recog-
nized for unused tax loss carry forwards and unused tax credits.
Deferred tax assets are recognized to the extent that it is proba-
ble that taxable profit will be available against which the
deductible temporary differences and unused tax losses can be
utilized. Each of the corporate entities is assessed individually
with regard to the probability of a positive tax result in future
years. The planning horizon is basically three to five years in this
context. Any existing history of losses is incorporated in this
assessment. For those tax assets to which these assumptions
do not apply, the value of the deferred tax assets is reduced.
Deferred tax liabilities caused by temporary differences associ-
ated with investments in affiliated and associated companies are
recognized unless the timing of the reversal of such temporary
differences can be controlled within the Group and it is probable
that, owing to this control, the differences will in fact not be
reversed in the foreseeable future.
Deferred tax assets and liabilities are measured using the enacted
or substantively enacted tax rates expected to be applicable for
taxable income in the years in which temporary differences are
expected to be recovered or settled. The effect on deferred tax
assets and liabilities of changes in tax rates and tax law is gener-
ally recognized in net income. Equity is adjusted for deferred
taxes that had previously been recognized directly in equity. The
change is generally recognized in the period in which the material
legislative process is completed.
The estimates for nuclear decommissioning provisions are
derived from studies, cost estimates, legally binding civil agree-
ments and legal information. A material element in the esti-
mates are the real interest rates applied (the applied discount
rate, less the cost increase rate). The impact on consolidated net
income depends on the level of the corresponding adjustment
posted to property, plant and equipment.
No provisions are established for contingent asset retirement
obligations where the type, scope, timing and associated proba-
bilities cannot be determined reliably.
If onerous contracts exist in which the unavoidable costs of
meeting a contractual obligation exceed the economic benefits
expected to be received under the contract, provisions are
established for losses from open transactions. Such provisions
are recognized at the lower of the excess obligation upon per-
formance under the contract and any potential penalties or
compensation arising in the event of non-performance. Obliga-
tions under an open contractual relationship are determined
from a customer perspective.
Contingent liabilities are possible obligations toward third
parties arising from past events that are not wholly within the
control of the entity, or else present obligations toward third
parties arising from past events in which an outflow of resources
embodying economic benefits is not probable or where the
amount of the obligation cannot be measured with sufficient
reliability. Contingent liabilities were not recognized on the
balance sheet.
A more detailed description is not provided for certain contingent
liabilities and contingent receivables, particularly in connection
with pending litigation, as this information could influence
further proceedings.
Where necessary, provisions for restructuring costs are recog-
nized at the present value of the future outflows of resources.
Provisions are recognized once a detailed restructuring plan has
been decided on by management and publicly announced or
communicated to the employees or their representatives. Only
those expenses that are directly attributable to the restructuring
measures are used in measuring the amount of the provision.
Expenses associated with the future operation are not taken
into consideration.
135CEO Letter
Report of the Supervisory Board
E.ON Stock
Strategy and Objectives
Combined Group Management Report
Combined Non-Financial Report
Consolidated Financial Statements
Further Information
Deferred taxes for the E.ON Group’s major German companies
are - unchanged from the previous year - calculated using an
aggregate tax rate of 30 percent. This tax rate includes, in addi-
tion to the 15 percent corporate income tax, the solidarity
surcharge of 5.5 percent on the corporate tax and the average
trade tax rate of 14 percent. Foreign subsidiaries use applicable
national tax rates.
Note 10 shows the major temporary differences so recorded.
Consolidated Statements of Cash FlowsIn accordance with IAS 7, “Cash Flow Statements,” (“IAS 7”) the
Consolidated Statements of Cash Flows are classified in cash
flows from operating, investing and financing activities. Cash
flows from discontinued operations are reported separately in
the Consolidated Statements of Cash Flows. Interest received
and paid, income taxes paid and refunded, as well as dividends
received are classified as operating cash flows, whereas divi-
dends paid are classified as financing cash flows. The purchase
and sale prices respectively paid (received) in acquisitions and
disposals of companies are reported net of any cash and cash
equivalents acquired (disposed of) under investing activities
if the respective acquisition or disposal results in a gain or loss
of control. In the case of acquisitions and disposals that do not,
respectively, result in a gain or loss of control, the corresponding
cash flows are reported under financing activities. The impact on
cash and cash equivalents of valuation changes due to exchange
rate fluctuations is disclosed separately.
Segment InformationIn accordance with the so-called management approach required
by IFRS 8, “Operating Segments,” (“IFRS 8”) the internal report-
ing organization used by management for making decisions on
operating matters is used to identify the Company’s reportable
segments. The internal performance measure used as the seg-
ment result is EBIT adjusted to exclude certain non-operating
effects (see Note 33).
Structure of the Consolidated Balance Sheets and Statements of IncomeIn accordance with IAS 1, “Presentation of Financial Statements,”
(“IAS 1”) the Consolidated Balance Sheets have been prepared
using a classified balance sheet structure. Assets that will be
realized within twelve months of the reporting date, as well as
liabilities that are due to be settled within one year of the report-
ing date are generally classified as current.
The Consolidated Statements of Income are classified using the
nature of expense method, which is also applied for internal
purposes.
Critical Accounting Estimates and Assumptions; Critical Judgments in the Application of Accounting PoliciesThe preparation of the Consolidated Financial Statements
requires management to make estimates and assumptions that
may both influence the application of accounting principles
within the Group and affect the measurement and presentation
of reported figures. Estimates are based on past experience and
on current knowledge obtained on the transactions to be
reported. Actual amounts may differ from these estimates.
The estimates and underlying assumptions are reviewed on an
ongoing basis. Adjustments to accounting estimates are recog-
nized in the period in which the estimate is revised if the change
affects only that period, or in the period of the revision and sub-
sequent periods if both current and future periods are affected.
Estimates are particularly necessary for the measurement of
the value of property, plant and equipment and of intangible
assets, especially in connection with purchase price allocations,
the recognition and measurement of deferred tax assets, the
accounting treatment of provisions for pensions and miscella-
neous provisions, for impairment testing in accordance with
IAS 36, for the determination of the fair value of certain financial
instruments, and in the application of IFRS 15.
The underlying principles used for estimates in each of the
relevant topics are outlined in the respective sections.

136Notes
the transition provisions of IFRS 9, E.ON has applied the standard
retrospectively without changing the prior-year figures, with the
exception of certain aspects of hedge accounting.
IFRS 15 replaces the previous standards and interpretations
IAS 11, “Construction Contracts,” IAS 18, “Revenue,” IFRIC 13
“Customer Loyalty Programmes,” IFRIC 15, “Agreements for
the Construction of Real Estate,” IFRIC 18, “Transfers of Assets
from Customers,” and SIC-31, “Revenue—Barter Transactions
Involving Advertising Services.” The E.ON Group applies IFRS 15
using the modified retrospective method.
The transition effects from the first-time application of IFRS 9
and IFRS 15 were recognized directly in equity. The effects of the
transition on the balance sheet, retained earnings and accumu-
lated other comprehensive income are shown in the following
tables:
(2) New Standards and Interpretations
Significant Standards and Interpretations Applicable in 2018
The International Accounting Standards Board (“IASB”) and the
IFRS Interpretations Committee (“IFRS IC”) have issued the
following standards and interpretations that have been adopted
by the EU into European law and whose application is mandatory
in the reporting period from January 1, 2018, through Decem-
ber 31, 2018.
Since January 1, 2018, E.ON has applied IFRS 9, “Financial
Instruments,” (IFRS 9) and IFRS 15, “Revenue from Contracts
with Customers” (IFRS 15). IFRS 9 replaces the accounting for
financial instruments previously regulated in IAS 39, “Financial
Instruments: Recognition and Measurement.” In accordance with
Reconciliation of the Consolidated Balance Sheet Due to the Effects of IFRS 9 and IFRS 15
€ in millions
Dec. 31,
2017
Effects from
IFRS 9
Effects from
IFRS 15 Jan. 1, 2018
Non-current assets 40,164 -35 88 40,217of which other intangible assets 2,243 – 6 2,249
of which property, plant and equipment 24,766 – -14 24,752
of which equity investments 792 -46 – 746
of which financial receivables and other financial assets 452 -1 8 459
of which operating receivables and other operating assets 1,371 – 39 1,410
of which deferred tax assets 907 12 49 968
Current assets 15,786 -66 31 15,751of which trade receivables and other operating assets 5,781 -66 31 5,746
Total assets 55,950 -101 119 55,968
Equity 6,708 -101 -111 6,496of which retained earnings -4,552 102 -111 -4,561
of which accumulated other comprehensive income -2,378 -203 – -2,581
of which non-controlling interests (before reclassification) 3,195 – – 3,195
Non-current liabilities 35,198 – 199 35,397of which operating liabilities 4,690 – 196 4,886
of which deferred tax liabilities 1,616 – 3 1,619
Current liabilities 14,044 – 31 14,075of which trade payables and other operating liabilities 8,099 – 31 8,130
Total equity and liabilities 55,950 -101 119 55,968
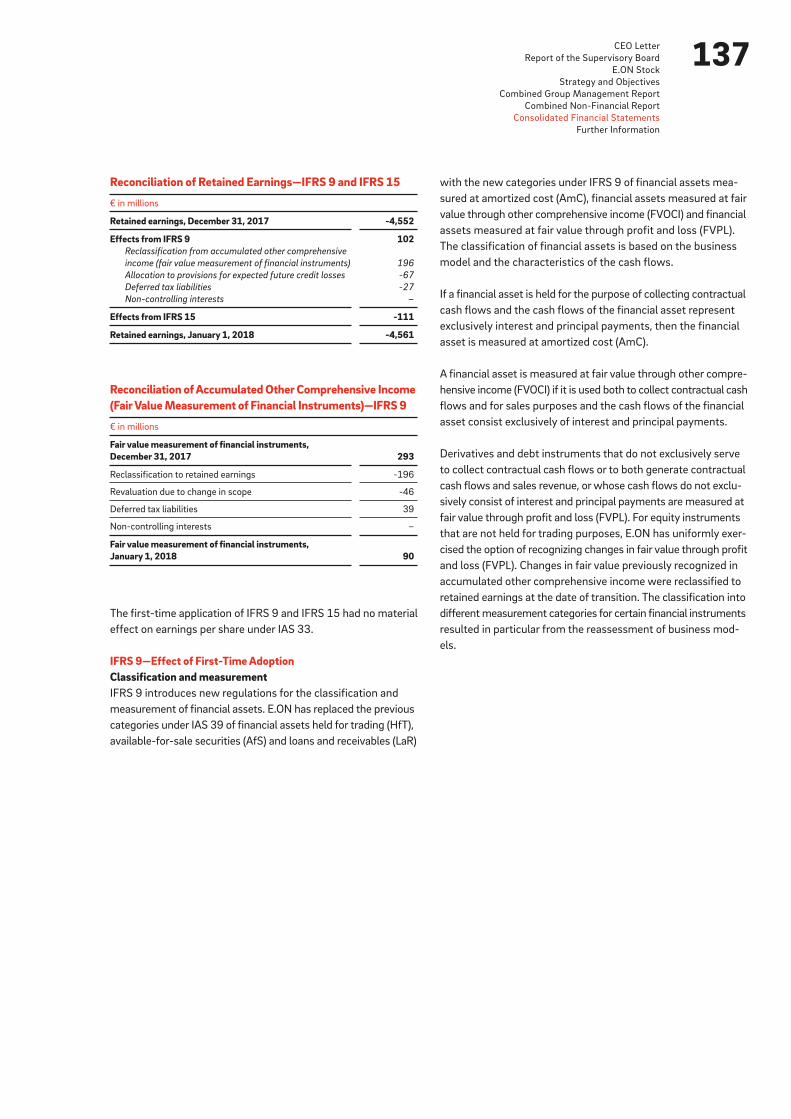
137CEO Letter
Report of the Supervisory Board
E.ON Stock
Strategy and Objectives
Combined Group Management Report
Combined Non-Financial Report
Consolidated Financial Statements
Further Information
The first-time application of IFRS 9 and IFRS 15 had no material
effect on earnings per share under IAS 33.
IFRS 9—Effect of First-Time Adoption Classification and measurementIFRS 9 introduces new regulations for the classification and
measurement of financial assets. E.ON has replaced the previous
categories under IAS 39 of financial assets held for trading (HfT),
available-for-sale securities (AfS) and loans and receivables (LaR)
with the new categories under IFRS 9 of financial assets mea-
sured at amortized cost (AmC), financial assets measured at fair
value through other comprehensive income (FVOCI) and financial
assets measured at fair value through profit and loss (FVPL).
The classification of financial assets is based on the business
model and the characteristics of the cash flows.
If a financial asset is held for the purpose of collecting contractual
cash flows and the cash flows of the financial asset represent
exclusively interest and principal payments, then the financial
asset is measured at amortized cost (AmC).
A financial asset is measured at fair value through other compre-
hensive income (FVOCI) if it is used both to collect contractual cash
flows and for sales purposes and the cash flows of the financial
asset consist exclusively of interest and principal payments.
Derivatives and debt instruments that do not exclusively serve
to collect contractual cash flows or to both generate contractual
cash flows and sales revenue, or whose cash flows do not exclu-
sively consist of interest and principal payments are measured at
fair value through profit and loss (FVPL). For equity instruments
that are not held for trading purposes, E.ON has uniformly exer-
cised the option of recognizing changes in fair value through profit
and loss (FVPL). Changes in fair value previously recognized in
accumulated other comprehensive income were reclassified to
retained earnings at the date of transition. The classification into
different measurement categories for certain financial instruments
resulted in particular from the reassessment of business mod-
els.
Reconciliation of Retained Earnings—IFRS 9 and IFRS 15
€ in millions
Retained earnings, December 31, 2017 -4,552
Effects from IFRS 9 102Reclassification from accumulated other comprehensive
income (fair value measurement of financial instruments) 196
Allocation to provisions for expected future credit losses -67
Deferred tax liabilities -27
Non-controlling interests –
Effects from IFRS 15 -111
Retained earnings, January 1, 2018 -4,561
Reconciliation of Accumulated Other Comprehensive Income (Fair Value Measurement of Financial Instruments)—IFRS 9
€ in millions
Fair value measurement of financial instruments, December 31, 2017 293
Reclassification to retained earnings -196
Revaluation due to change in scope -46
Deferred tax liabilities 39
Non-controlling interests –
Fair value measurement of financial instruments, January 1, 2018 90
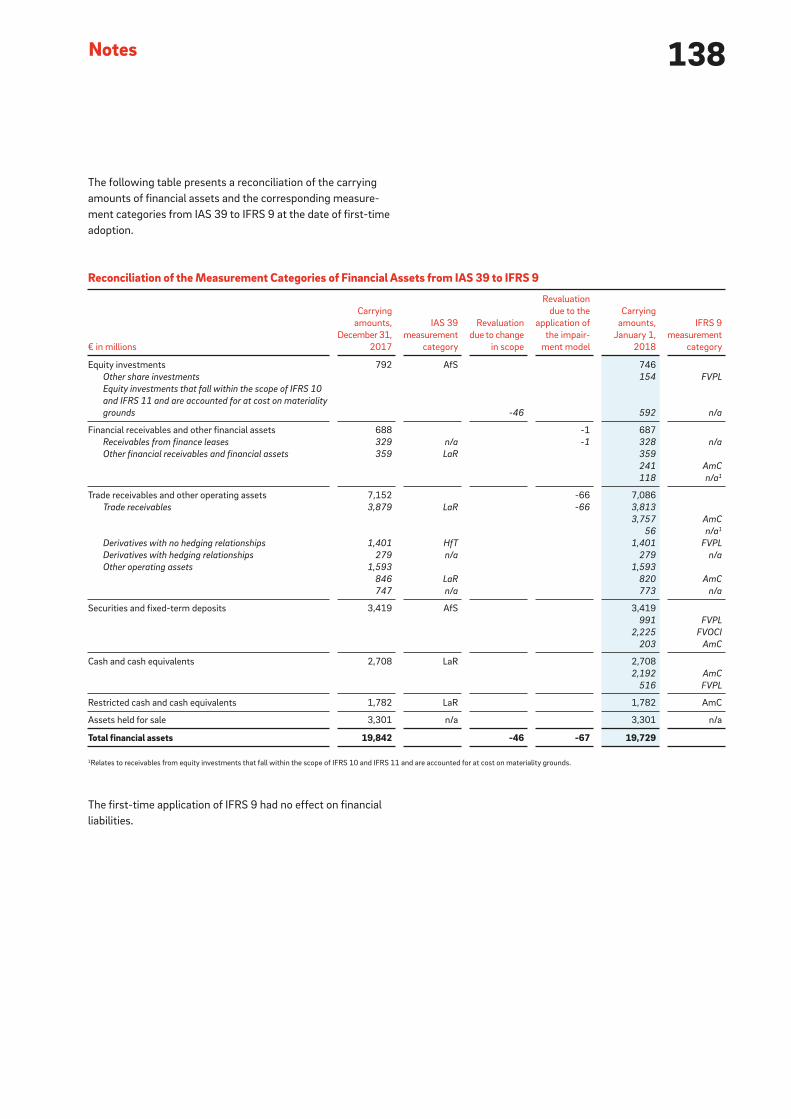
138Notes
The first-time application of IFRS 9 had no effect on financial
liabilities.
The following table presents a reconciliation of the carrying
amounts of financial assets and the corresponding measure-
ment categories from IAS 39 to IFRS 9 at the date of first-time
adoption.
Reconciliation of the Measurement Categories of Financial Assets from IAS 39 to IFRS 9
€ in millions
Carrying
amounts,
December 31,
2017
IAS 39
measurement
category
Revaluation
due to change
in scope
Revaluation
due to the
application of
the impair-
ment model
Carrying
amounts,
January 1,
2018
IFRS 9
measurement
category
Equity investments 792 AfS 746
Other share investments 154 FVPL
Equity investments that fall within the scope of IFRS 10
and IFRS 11 and are accounted for at cost on materiality
grounds -46 592 n/a
Financial receivables and other financial assets 688 -1 687
Receivables from finance leases 329 n/a -1 328 n/a
Other financial receivables and financial assets 359 LaR 359
241 AmC
118 n/a 1
Trade receivables and other operating assets 7,152 -66 7,086
Trade receivables 3,879 LaR -66 3,813
3,757 AmC
56 n/a 1
Derivatives with no hedging relationships 1,401 HfT 1,401 FVPL
Derivatives with hedging relationships 279 n/a 279 n/a
Other operating assets 1,593 1,593
846 LaR 820 AmC
747 n/a 773 n/a
Securities and fixed-term deposits 3,419 AfS 3,419
991 FVPL
2,225 FVOCI
203 AmC
Cash and cash equivalents 2,708 LaR 2,708
2,192 AmC
516 FVPL
Restricted cash and cash equivalents 1,782 LaR 1,782 AmC
Assets held for sale 3,301 n/a 3,301 n/a
Total financial assets 19,842 -46 -67 19,729
1Relates to receivables from equity investments that fall within the scope of IFRS 10 and IFRS 11 and are accounted for at cost on materiality grounds.
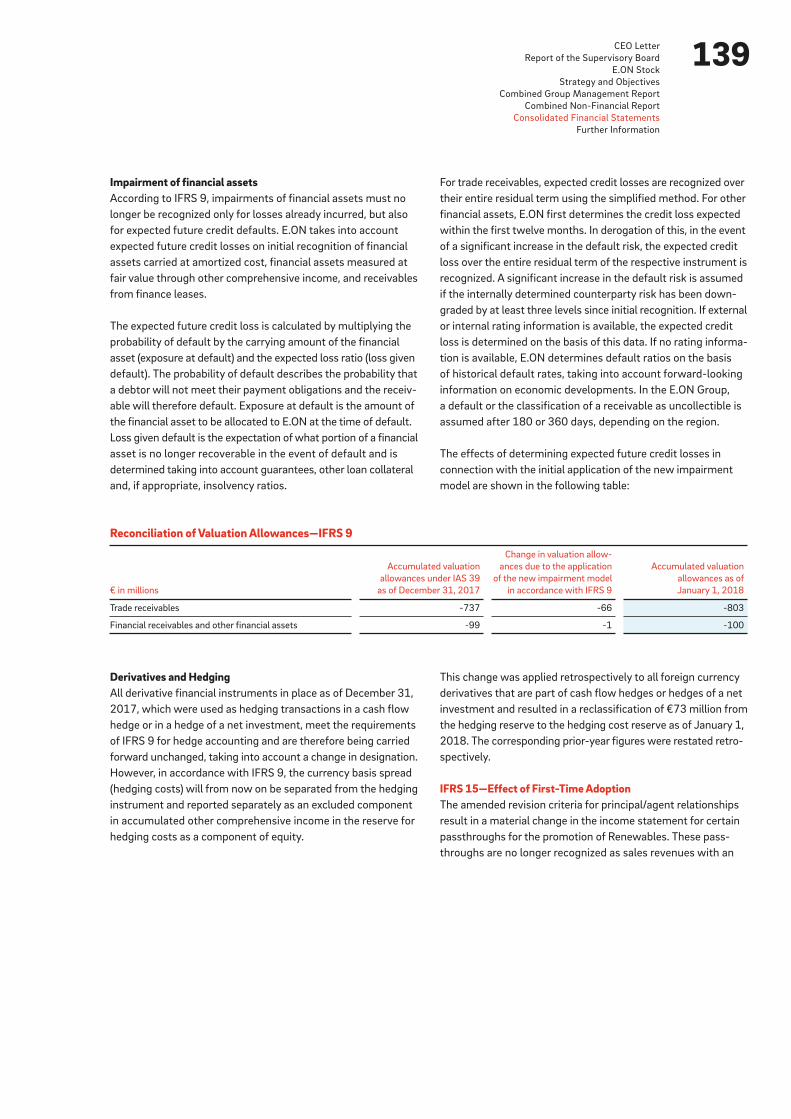
139CEO Letter
Report of the Supervisory Board
E.ON Stock
Strategy and Objectives
Combined Group Management Report
Combined Non-Financial Report
Consolidated Financial Statements
Further Information
For trade receivables, expected credit losses are recognized over
their entire residual term using the simplified method. For other
financial assets, E.ON first determines the credit loss expected
within the first twelve months. In derogation of this, in the event
of a significant increase in the default risk, the expected credit
loss over the entire residual term of the respective instrument is
recognized. A significant increase in the default risk is assumed
if the internally determined counterparty risk has been down-
graded by at least three levels since initial recognition. If external
or internal rating information is available, the expected credit
loss is determined on the basis of this data. If no rating informa-
tion is available, E.ON determines default ratios on the basis
of historical default rates, taking into account forward-looking
information on economic developments. In the E.ON Group,
a default or the classification of a receivable as uncollectible is
assumed after 180 or 360 days, depending on the region.
The effects of determining expected future credit losses in
connection with the initial application of the new impairment
model are shown in the following table:
Impairment of financial assets According to IFRS 9, impairments of financial assets must no
longer be recognized only for losses already incurred, but also
for expected future credit defaults. E.ON takes into account
expected future credit losses on initial recognition of financial
assets carried at amortized cost, financial assets measured at
fair value through other comprehensive income, and receivables
from finance leases.
The expected future credit loss is calculated by multiplying the
probability of default by the carrying amount of the financial
asset (exposure at default) and the expected loss ratio (loss given
default). The probability of default describes the probability that
a debtor will not meet their payment obligations and the receiv-
able will therefore default. Exposure at default is the amount of
the financial asset to be allocated to E.ON at the time of default.
Loss given default is the expectation of what portion of a financial
asset is no longer recoverable in the event of default and is
determined taking into account guarantees, other loan collateral
and, if appropriate, insolvency ratios.
Reconciliation of Valuation Allowances—IFRS 9
€ in millions
Accumulated valuation
allowances under IAS 39
as of December 31, 2017
Change in valuation allow-
ances due to the application
of the new impairment model
in accordance with IFRS 9
Accumulated valuation
allowances as of
January 1, 2018
Trade receivables -737 -66 -803
Financial receivables and other financial assets -99 -1 -100
Derivatives and Hedging All derivative financial instruments in place as of December 31,
2017, which were used as hedging transactions in a cash flow
hedge or in a hedge of a net investment, meet the requirements
of IFRS 9 for hedge accounting and are therefore being carried
forward unchanged, taking into account a change in designation.
However, in accordance with IFRS 9, the currency basis spread
(hedging costs) will from now on be separated from the hedging
instrument and reported separately as an excluded component
in accumulated other comprehensive income in the reserve for
hedging costs as a component of equity.
This change was applied retrospectively to all foreign currency
derivatives that are part of cash flow hedges or hedges of a net
investment and resulted in a reclassification of €73 million from
the hedging reserve to the hedging cost reserve as of January 1,
2018. The corresponding prior-year figures were restated retro-
spectively.
IFRS 15—Effect of First-Time AdoptionThe amended revision criteria for principal/agent relationships
result in a material change in the income statement for certain
passthroughs for the promotion of Renewables. These pass-
throughs are no longer recognized as sales revenues with an

140Notes
offsetting entry in cost of materials, but instead are netted
directly. The netting effects led to a €7.9 billion reduction in the
income statement in 2018; the change has no impact on earn-
ings. Starting from the fourth quarter of 2018, netting was carried
out both for the direct marketing model as well as, for the first
time, the EEG feed-in model (the previous quarters were adjusted
accordingly; €3.1 billion reduction in revenue for 2018 as a
whole). The change has no impact on earnings. Other conversion
effects from IFRS 15 related primarily to the divergence of cash
flows and revenue recognition, which led to the recognition of
contract assets (€9 million) and contract liabilities (€227 million),
as well as the compulsory capitalization of directly attributable
costs of contract acquisition, which are expected to be amortized
over the term of the contract (€61 million). This reduced retained
earnings by €111 million as of January 1, 2018, taking deferred
taxes into account.
The E.ON Group recognizes the majority of its revenue from
contracts with customers over time and not point in time.
Revenue is broken down in detail in the information by segment
(see Note 33) into external and internal revenue per segment,
as well as by material regions and technologies. This overview
also shows how sales are reflected in operating cash flow
before interest and taxes.
Additional Standards and Interpretations Applicable in 2018
In addition to the new standards described in detail above,
other standards and interpretations are to be applied that do
not have a material impact on E.ON’s Consolidated Financial
Statements as of December 31, 2018:
• IFRIC 22, “Foreign Currency Transactions and Advance
Consideration”
• Omnibus Standard to Amend Multiple International Financial
Reporting Standards (2014–2016 Cycle), Application of the
Amendments to IFRS 1 and IAS 28
• Amendments to IFRS 2, “Classification and Measurement of
Share-Based Payment”
• Amendments to IFRS 4, “Applying IFRS 9 with IFRS 4”
• Amendments to IAS 40, “Transfers of Investment Property”
Significant Standards and Interpretations Not Yet Applicable in 2018
The IASB and the IFRS IC have issued the following additional
standards and interpretations. These standards and interpreta-
tions are not yet being applied by E.ON because their application
is not yet mandatory or, in some cases, because adoption by the
EU remains outstanding at this time.
IFRS 16, “Leases”In January 2016, the IASB published the accounting standard
IFRS 16, “Leases,” which replaces the previous standard IAS 17,
“Leases,” and IFRIC 4, “Determining Whether an Arrangement
Contains a Lease.” The application of IFRS 16 is required for fiscal
years beginning on or after January 1, 2019.
E.ON is applying the modified retrospective approach to its
transition to IFRS 16; prior-year figures have not been restated.
Low-value leased assets and short-term leases (less than twelve
months) are accounted for using the options to facilitate appli-
cation. The Group has also decided to apply various simplification
options for the transition. Agreements entered into before
January 1, 2019, and still valid at the date of transition have not
been reviewed to determine whether they qualify as leases under
IFRS 16. E.ON is conducting a Group-wide project for the imple-
mentation of IFRS 16. The analysis of existing agreements, the
drafting of agreements and the impact analysis were largely
completed at the end of 2018.
The effects of the introduction of IFRS 16 on the individual
components of the consolidated financial statements and the
presentation of the financial position and performance of the
Group can be described as follows:
• The first-time application of the standard will lead to an
increase in both property, plant and equipment (accounting
for the rights of use) and financial liabilities (recognition of
the corresponding lease liabilities) in the balance sheet, par-
ticularly taking into account the financial obligations arising
from operating leases reported under Note 27. Taking into
account existing accruals and deferrals, the impact of the
transition on the amount of leasing liabilities and rights of use
for continuing activities at the time of first-time application

141CEO Letter
Report of the Supervisory Board
E.ON Stock
Strategy and Objectives
Combined Group Management Report
Combined Non-Financial Report
Consolidated Financial Statements
Further Information
is expected to be €0.5 to €0.7 billion. As a result of this
change in the balance sheet, the equity ratio of the Group will
decline slightly and net financial debt will increase slightly.
• In the future, instead of other operating expenses, depreciation
on rights of use and interest expenses will be recognized in
the income statement from the accretion of lease liabilities
(unless they relate to expenses from short-term and low-value
leases). This will lead to slightly improved earnings before
interest and taxes (EBIT).
• The revised presentation of lease payments arising from
operating leases will result in improved cash flows from
operating activities and a deterioration in cash flow from
financing activities. Interest payments are presented in cash
flow from operating activities.
Additional Standards and Interpretations Not Yet Applicable
Additional standards and interpretations have been adopted in
addition to the new standards outlined in detail above, but no
material impact on E.ON’s consolidated financial statements
is expected:
• Amendments to IAS 1 and IAS 8, “Definition of Material,”
published in October 2018, not yet transposed into European
law, expected first-time application in fiscal year 2020
• Amendments to IAS 19, “Plan Amendment, Curtailment or
Settlement,” published in February 2018, not yet transposed
into European law, expected first-time application in fiscal
year 2019
• Amendments to IAS 28, “Long-term Interests in Associates
and Joint Ventures,” published in January 2017, transposed
into European law, first-time application in fiscal year 2019
• Amendments to IFRS 3, “Definition of a Business,” published
in October 2018, not yet transposed into European law,
expected first-time application in fiscal year 2020
• Amendments to IFRS 9, “Prepayment Features with Negative
Compensation,” published in October 2017, transposed into
European law, first-time application in fiscal year 2019
• IFRS 17, “Insurance Contracts,” published in May 2017, not
yet transposed into European law, expected first-time appli-
cation in fiscal year 2021
• IFRIC 23, “Uncertainty over Income Tax Treatments,” pub-
lished in June 2017, not yet transposed into European law,
first-time application in fiscal year 2019
• Omnibus Standard to Amend Multiple International Finan-
cial Reporting Standards (2015–2017 Cycle), published
in December 2017, not yet transposed into European law,
expected first-time application in fiscal year 2019
• Amendments to the references to the accounting framework,
published in March 2018, not yet transposed into European
law, expected first-time application in fiscal year 2020
(3) Scope of Consolidation
The number of consolidated companies changed as follows in
2018:
In 2018, a total of 17 domestic and 14 foreign associated
companies were consolidated under the equity method (2017:
18 domestic companies and 12 foreign companies). In 2018,
one domestic company reported as joint operations was pre-
sented pro rata on the consolidated financial statements (2017:
one domestic company).
Scope of Consolidation
Domestic Foreign Total
Consolidated companies as of January 1, 2017 77 149 226
Additions 8 5 13
Disposals/Mergers 1 6 7
Consolidated companies as of December 31, 2017 84 148 232
Additions 5 4 9
Disposals/Mergers 5 4 9
Consolidated companies as of December 31, 2018 84 148 232
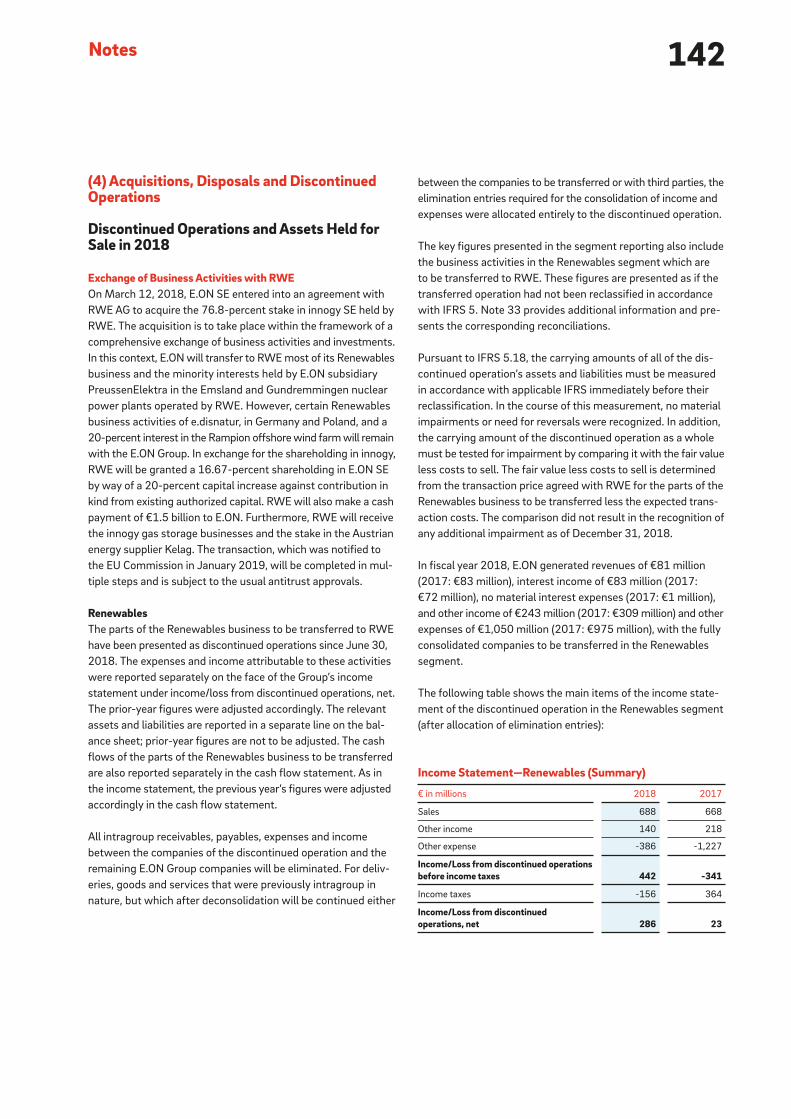
142Notes
between the companies to be transferred or with third parties, the
elimination entries required for the consolidation of income and
expenses were allocated entirely to the discontinued operation.
The key figures presented in the segment reporting also include
the business activities in the Renewables segment which are
to be transferred to RWE. These figures are presented as if the
transferred operation had not been reclassified in accordance
with IFRS 5. Note 33 provides additional information and pre-
sents the corresponding reconciliations.
Pursuant to IFRS 5.18, the carrying amounts of all of the dis-
continued operation’s assets and liabilities must be measured
in accordance with applicable IFRS immediately before their
reclassification. In the course of this measurement, no material
impairments or need for reversals were recognized. In addition,
the carrying amount of the discontinued operation as a whole
must be tested for impairment by comparing it with the fair value
less costs to sell. The fair value less costs to sell is determined
from the transaction price agreed with RWE for the parts of the
Renewables business to be transferred less the expected trans-
action costs. The comparison did not result in the recognition of
any additional impairment as of December 31, 2018.
In fiscal year 2018, E.ON generated revenues of €81 million
(2017: €83 million), interest income of €83 million (2017:
€72 million), no material interest expenses (2017: €1 million),
and other income of €243 million (2017: €309 million) and other
expenses of €1,050 million (2017: €975 million), with the fully
consolidated companies to be transferred in the Renewables
segment.
The following table shows the main items of the income state-
ment of the discontinued operation in the Renewables segment
(after allocation of elimination entries):
(4) Acquisitions, Disposals and Discontinued Operations
Discontinued Operations and Assets Held for Sale in 2018
Exchange of Business Activities with RWEOn March 12, 2018, E.ON SE entered into an agreement with
RWE AG to acquire the 76.8-percent stake in innogy SE held by
RWE. The acquisition is to take place within the framework of a
comprehensive exchange of business activities and investments.
In this context, E.ON will transfer to RWE most of its Renewables
business and the minority interests held by E.ON subsidiary
PreussenElektra in the Emsland and Gundremmingen nuclear
power plants operated by RWE. However, certain Renewables
business activities of e.disnatur, in Germany and Poland, and a
20-percent interest in the Rampion offshore wind farm will remain
with the E.ON Group. In exchange for the shareholding in innogy,
RWE will be granted a 16.67-percent shareholding in E.ON SE
by way of a 20-percent capital increase against contribution in
kind from existing authorized capital. RWE will also make a cash
payment of €1.5 billion to E.ON. Furthermore, RWE will receive
the innogy gas storage businesses and the stake in the Austrian
energy supplier Kelag. The transaction, which was notified to
the EU Commission in January 2019, will be completed in mul-
tiple steps and is subject to the usual antitrust approvals.
RenewablesThe parts of the Renewables business to be transferred to RWE
have been presented as discontinued operations since June 30,
2018. The expenses and income attributable to these activities
were reported separately on the face of the Group’s income
statement under income/loss from discontinued operations, net.
The prior-year figures were adjusted accordingly. The relevant
assets and liabilities are reported in a separate line on the bal-
ance sheet; prior- year figures are not to be adjusted. The cash
flows of the parts of the Renewables business to be transferred
are also reported separately in the cash flow statement. As in
the income statement, the previous year’s figures were adjusted
accordingly in the cash flow statement.
All intragroup receivables, payables, expenses and income
between the companies of the discontinued operation and the
remaining E.ON Group companies will be eliminated. For deliv-
eries, goods and services that were previously intragroup in
nature, but which after deconsolidation will be continued either
Income Statement—Renewables (Summary)
€ in millions 2018 2017
Sales 688 668
Other income 140 218
Other expense -386 -1,227
Income/Loss from discontinued operations before income taxes 442 -341
Income taxes -156 364
Income/Loss from discontinued operations, net 286 23

143CEO Letter
Report of the Supervisory Board
E.ON Stock
Strategy and Objectives
Combined Group Management Report
Combined Non-Financial Report
Consolidated Financial Statements
Further Information
The following table shows major balance sheet line items for
the discontinued operation in the Renewables segment:
The preceding figures do not include receivables from or liabilities
to the E.ON Group.
Minority Interests in Nuclear Power PlantsIn addition to the transfer of the majority of the Renewables
business, under the agreement RWE will acquire the minority
interests held by E.ON in the nuclear power plants operated
by RWE, Kernkraftwerke Lippe-Ems GmbH and Kernkraftwerk
Gundremmingen GmbH. The minority interests included in the
Non-Core Business segment and related liabilities were classified
as a disposal group from June 30, 2018. In total, assets in the
amount of €0.2 billion, provisions in the amount of €0.8 billion
and liabilities in the amount of €0.2 billion were reclassified to
the disposal group.
UniperE.ON and Finnish energy company Fortum Corporation, Espoo,
Finland, entered into an agreement in September 2017 that
enabled E.ON to decide to sell its 46.65-percent stake in Uniper
to Fortum at a total value of €22 per share at the beginning of
2018. In this connection Fortum published a takeover offer for
all of the shares of Uniper on November 7, 2017. In January
2018, E.ON decided to offer its shareholding in Uniper for sale
in the framework of the takeover bid. After all regulatory approv-
als and conditions for the completion of the voluntary public
takeover bid had been met, the sale of the stake in Uniper to
Fortum was completed on June 26, 2018. The purchase price
was €3.8 billion. This includes the dividends paid by Uniper to
E.ON in 2018.
After derecognition of the Uniper shares of approximately
€3.0 billion reported as assets held for sale prior to completion of
the transaction and the recognition in income of effects from the
equity valuation previously recognized in other comprehensive
income, the gain on disposal amounted to €0.6 billion. Upon
completion of the transaction, derivative financial instruments
with a negative fair value of €0.5 billion were also derecognized
through profit and loss. The derivative financial instruments
were related to the reciprocal rights and obligations arising from
the agreement with Fortum. This also resulted in derivative
financial instruments with a market value of -€0.7 billion as of
December 31, 2017. This amount was recognized in the income
statement in 2017. The fair value of the 46.65-percent share-
holding in Uniper totaled €4.4 billion as of December 31, 2017.
E.ON ElektrárneOn July 26, 2018, E.ON sold its interest in E.ON Elektrárne s.r.o.
to Západoslovenská energetika a.s. (ZSE). The parties agreed not
to disclose the sale price. The transaction also resulted in the
repayment of shareholder loans. ZSE is owned by the Slovak state
(51 percent) and the E.ON Group (49 percent). The assets of E.ON
Elektrárne s.r.o. primarily include the Malženice gas and steam
power plant. The transaction was closed on August 15, 2018.
E.ON Gas SverigeOn April 25, 2018, the E.ON Group completed the sale of its
Swedish gas distribution company E.ON Gas Sverige AB, which
is part of the Energy Networks segment. The transaction was
completed with retroactive economic effect to January 1, 2018.
The buyer was the European Diversified Infrastructure Fund II.
The gain on deconsolidation amounted to around €0.1 billion.
Hamburg NetzIn July 2017, the Hamburg Senate approved the exercise of a call
option agreed in 2014 (following a corresponding referendum)
with the Free and Hanseatic City of Hamburg on the previous
E.ON majority stake in Hamburg Netz GmbH (74.9 percent,
HHNG). E.ON held this stake in the Energy Networks segment
through HanseWerk AG (E.ON’s ownership interest: 66.5 percent).
Major Balance Sheet Line Items—Renewables (Summary)
€ in millions
Dec. 31,
2018
Intangible assets and goodwill 1,549
Property, plant and equipment 7,321
Miscellaneous assets 2,408
Assets held for sale 11,278
Liabilities -2,057
Provisions -675
Liabilities associated with assets held for sale -2,732
144Notes
After the exercise of this option on October 20, 2017, the corre-
sponding HHNG shares were transferred to the buyer effective
January 1, 2018. As of December 31, 2017, the balance sheet
items related to HHNG were classified as a disposal group in
accordance with IFRS 5. The cash inflow of €0.3 billion that
occurred in 2017 is recorded in the consolidated cash flow state-
ment for 2017 under disposals and does not have an effect on
economic net debt as of December 31, 2017. HHNG was decon-
solidated in the first quarter of 2018. The gain on deconsolidation
amounted to €154 million.
EnerjisaOn February 8, 2018, a 20-percent stake (10 percent E.ON stake)
in Enerjisa Enerji A.Ş. was floated on the stock exchange. The
issue price was TRY 6.25 per 100 shares. Enerjisa Enerji A.Ş.
continues to retain the status of a joint venture between E.ON
and Sabanci (40 percent each).
Discontinued Operations and Assets Held for Sale in 2017
In addition to the disposals of Uniper and Hamburg Netz
described above, the following significant transactions were
carried out in 2017:
E.ON Värme Lokala Energilösningar On December 19, 2017, E.ON Värme Lokala Energilösningar AB,
including eleven small and medium-sized district heating
networks in nine Swedish municipalities, were sold to Adven
Sweden AB. Adven is a leading supplier of energy solutions and
district heating in Finland, Sweden and Estonia. The parties
agreed not to disclose the purchase price. As the contract was
concluded retroactively to October 1, 2017, all transactions
starting from that date have been transferred to Adven Sweden
AB. E.ON Värme Lokala Energilösningar AB was deconsolidated
in the Customer Solutions Sweden segment in the fourth quar-
ter of 2017. This resulted in the derecognition of approximately
€100 million on the consolidated balance sheet.
Revenues recognized in the current reporting period arising
from performance obligations that have been fully or partially
settled in prior reporting periods amounted to €1.0 billion. The
total amount of benefit obligations already contracted but still
outstanding (excluding expected contract renewals and expected
new contracts) was €9.5 billion as of December 31, 2018.
The majority of these benefit obligations are expected to be
met within the next three years.
Revenues are broken down into intragroup and external revenues
in the segment information (Note 33). They are also broken
down into key regions and technologies. The overview also shows
the effect of revenues on operating cash flow before interest
and taxes.
(5) Revenues
At €30.3 billion, revenues in 2018 were roughly 20 percent lower
than in the previous year. Revenues in the Energy Networks
Germany segment were significantly lower than in the previous
year. The main factors reducing sales were the netting effects in
connection with IFRS 15 (€7.6 billion) and the sale of Hamburg
Netz with effect from January 1, 2018. Revenues also declined
at Customer Solutions Germany. Sales declined primarily due
to the expiration of procurement contracts for certain Uniper
wholesale customers, price adjustments and a decline in electric-
ity sales to residential and smaller business customers. The sale
of E.ON Gas Sverige AB in the second quarter of 2018 also
had a negative impact on sales in Energy Networks Sweden.
By contrast, sales in the UK rose as a result of price increases
and weather-driven volume increases in the gas business.
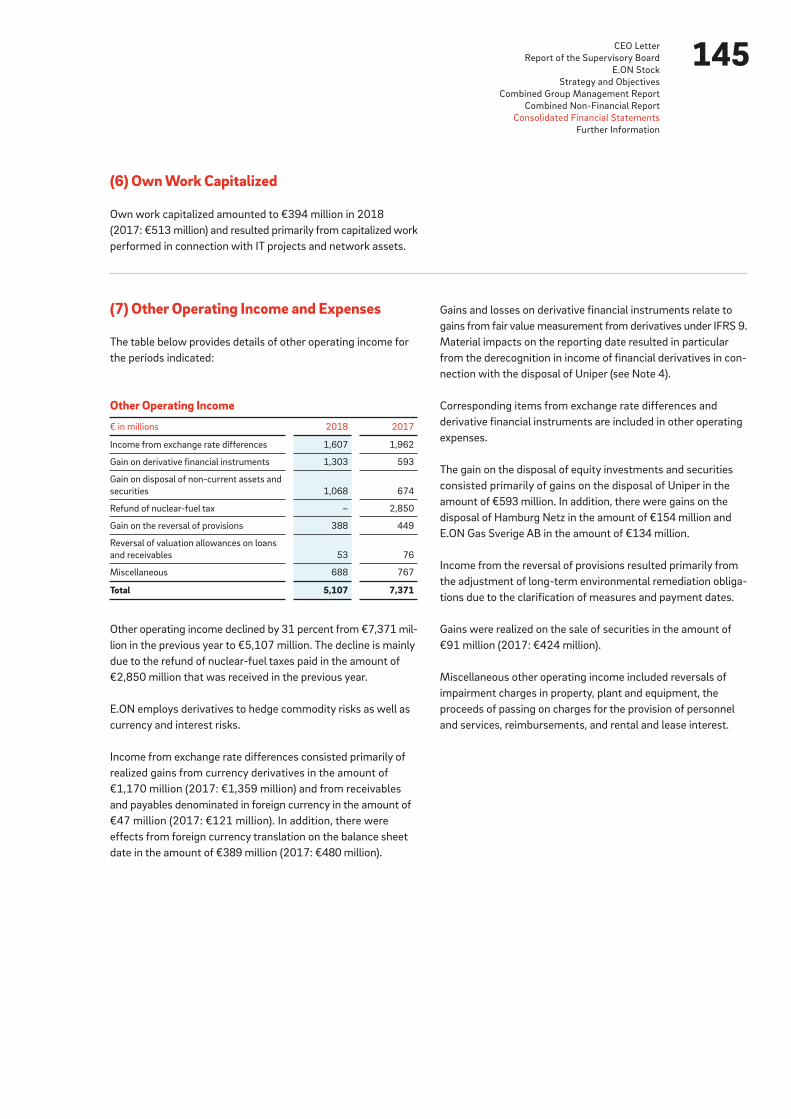
145CEO Letter
Report of the Supervisory Board
E.ON Stock
Strategy and Objectives
Combined Group Management Report
Combined Non-Financial Report
Consolidated Financial Statements
Further Information
(6) Own Work Capitalized
Own work capitalized amounted to €394 million in 2018
(2017: €513 million) and resulted primarily from capitalized work
performed in connection with IT projects and network assets.
(7) Other Operating Income and Expenses
The table below provides details of other operating income for
the periods indicated:
Other operating income declined by 31 percent from €7,371 mil-
lion in the previous year to €5,107 million. The decline is mainly
due to the refund of nuclear-fuel taxes paid in the amount of
€2,850 million that was received in the previous year.
E.ON employs derivatives to hedge commodity risks as well as
currency and interest risks.
Income from exchange rate differences consisted primarily of
realized gains from currency derivatives in the amount of
€1,170 million (2017: €1,359 million) and from receivables
and payables denominated in foreign currency in the amount of
€47 million (2017: €121 million). In addition, there were
effects from foreign currency translation on the balance sheet
date in the amount of €389 million (2017: €480 million).
Gains and losses on derivative financial instruments relate to
gains from fair value measurement from derivatives under IFRS 9.
Material impacts on the reporting date resulted in particular
from the derecognition in income of financial derivatives in con-
nection with the disposal of Uniper (see Note 4).
Corresponding items from exchange rate differences and
derivative financial instruments are included in other operating
expenses.
The gain on the disposal of equity investments and securities
consisted primarily of gains on the disposal of Uniper in the
amount of €593 million. In addition, there were gains on the
disposal of Hamburg Netz in the amount of €154 million and
E.ON Gas Sverige AB in the amount of €134 million.
Income from the reversal of provisions resulted primarily from
the adjustment of long-term environmental remediation obliga-
tions due to the clarification of measures and payment dates.
Gains were realized on the sale of securities in the amount of
€91 million (2017: €424 million).
Miscellaneous other operating income included reversals of
impairment charges in property, plant and equipment, the
proceeds of passing on charges for the provision of personnel
and services, reimbursements, and rental and lease interest.
Other Operating Income
€ in millions 2018 2017
Income from exchange rate differences 1,607 1,962
Gain on derivative financial instruments 1,303 593
Gain on disposal of non-current assets and
securities 1,068 674
Refund of nuclear-fuel tax – 2,850
Gain on the reversal of provisions 388 449
Reversal of valuation allowances on loans
and receivables 53 76
Miscellaneous 688 767
Total 5,107 7,371
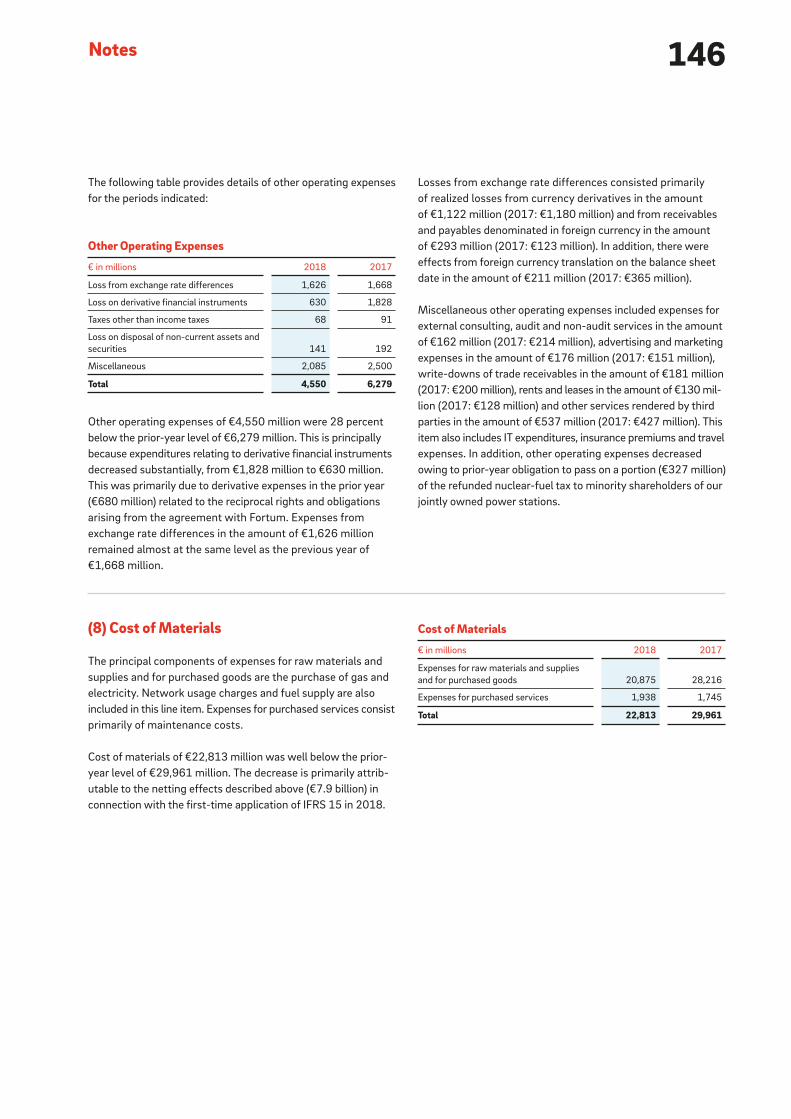
146Notes
The following table provides details of other operating expenses
for the periods indicated:
Other operating expenses of €4,550 million were 28 percent
below the prior-year level of €6,279 million. This is principally
because expenditures relating to derivative financial instruments
decreased substantially, from €1,828 million to €630 million.
This was primarily due to derivative expenses in the prior year
(€680 million) related to the reciprocal rights and obligations
arising from the agreement with Fortum. Expenses from
exchange rate differences in the amount of €1,626 million
remained almost at the same level as the previous year of
€1,668 million.
Losses from exchange rate differences consisted primarily
of realized losses from currency derivatives in the amount
of €1,122 million (2017: €1,180 million) and from receivables
and payables denominated in foreign currency in the amount
of €293 million (2017: €123 million). In addition, there were
effects from foreign currency translation on the balance sheet
date in the amount of €211 million (2017: €365 million).
Miscellaneous other operating expenses included expenses for
external consulting, audit and non-audit services in the amount
of €162 million (2017: €214 million), advertising and marketing
expenses in the amount of €176 million (2017: €151 million),
write-downs of trade receivables in the amount of €181 million
(2017: €200 million), rents and leases in the amount of €130 mil-
lion (2017: €128 million) and other services rendered by third
parties in the amount of €537 million (2017: €427 million). This
item also includes IT expenditures, insurance premiums and travel
expenses. In addition, other operating expenses decreased
owing to prior-year obligation to pass on a portion (€327 million)
of the refunded nuclear-fuel tax to minority shareholders of our
jointly owned power stations.
(8) Cost of Materials
The principal components of expenses for raw materials and
supplies and for purchased goods are the purchase of gas and
electricity. Network usage charges and fuel supply are also
included in this line item. Expenses for purchased services consist
primarily of maintenance costs.
Cost of materials of €22,813 million was well below the prior-
year level of €29,961 million. The decrease is primarily attrib-
utable to the netting effects described above (€7.9 billion) in
connection with the first-time application of IFRS 15 in 2018.
Other Operating Expenses
€ in millions 2018 2017
Loss from exchange rate differences 1,626 1,668
Loss on derivative financial instruments 630 1,828
Taxes other than income taxes 68 91
Loss on disposal of non-current assets and
securities 141 192
Miscellaneous 2,085 2,500
Total 4,550 6,279
Cost of Materials
€ in millions 2018 2017
Expenses for raw materials and supplies
and for purchased goods 20,875 28,216
Expenses for purchased services 1,938 1,745
Total 22,813 29,961

147CEO Letter
Report of the Supervisory Board
E.ON Stock
Strategy and Objectives
Combined Group Management Report
Combined Non-Financial Report
Consolidated Financial Statements
Further Information
Interest expenses also include €3 million (2017: €29 million)
of lower positive earnings effects from non-controlling interests
in fully consolidated partnerships, which are to be recognized
as liabilities in accordance with IAS 32, and with legal structures
that give their shareholders a statutory right of withdrawal com-
bined with an entitlement to a settlement payment.
Interest expense was reduced by capitalized interest on debt
totaling €12 million (2017: €5 million).
Realized gains and losses from interest rate swaps are shown
net on the face of the income statement.
(9) Financial Results
The following table provides details of financial results for the
periods indicated:
The decline in financial results relative to the previous year is
primarily attributable to the discontinuation of the refund of
interest from judicial proceedings in connection with the refund
of the nuclear-fuel tax in the prior year.
Other interest income in the prior year consists primarily of
income from the above-mentioned interest relating to judicial
proceedings. Other interest expenses include the accretion of
provisions for asset retirement obligations in the amount of
€61 million (2017: €55 million). Also contained in this item is
the net interest cost from provisions for pensions in the amount
of €62 million (2017: €82 million).
(10) Income Taxes
The following table provides details of income taxes, including
deferred taxes, for the periods indicated:
Financial Results
€ in millions 2018
Income/Loss from companies in which equity investments
are held 74
Fair value through P&L 59
Other 15
Impairment charges/reversals on other financial assets -30
Income/Loss from equity investments 44
Income/Loss from securities, interest and similar income 523
Amortized cost 109
Fair value through P&L 111
Fair value through OCI 21
Other interest income 282
Interest and similar expenses -1,236
Amortized cost -593
Fair value through P&L -126
Other interest expenses -517
Net interest income/loss -713
Financial results -669
Income Taxes
€ in millions 2018 2017
Domestic income taxes -110 507
Foreign income taxes -49 223
Current taxes -159 730
Domestic 80 -58
Foreign 125 131
Deferred taxes 205 73
Total income taxes 46 803
Financial Results
€ in millions 2017
Income/Loss from companies in which equity investments
are held 59
Impairment charges/reversals on other financial assets -64
Income/Loss from equity investments -5
Income/Loss from securities, interest and similar income 1,370
Available for sale 121
Loans and receivables 99
Held for trading 8
Other interest income 1,142
Interest and similar expenses -1,337
Amortized cost -718
Held for trading -33
Other interest expenses -586
Net interest income/loss 33
Financial results 28

148Notes
The tax expense in 2018 amounted to €46 million (2017: €803
million). In 2018, the tax rate was 1 percent (2017: 16 percent).
In the reporting year, higher tax-free earnings components or
deferred tax liabilities and the reversal of tax provisions for pre-
vious years led to a reduction in the tax rate. Significant changes
in the tax rate compared with the previous year are also due to
the one-off effects in 2017 of the nuclear-fuel tax refund and
the resulting income tax burden in Germany. The nuclear-fuel tax
effects led to the use of tax loss carryforwards and were subject
to the so-called minimum taxation.
Of the amount reported as current taxes, -€570 million is
attributable to previous years (2017: -€43 million).
Deferred taxes resulted from changes in temporary differences,
which totaled €376 million (2017: -€334 million), loss carry-
forwards of -€171 million (2017: €412 million) and tax credits
amounting to €0 million (2017: -€5 million).
Income tax assets amounted to €236 million (previous year:
€514 million), of which €229 million was short-term (previous
year: €514 million), while income tax liabilities amounted to
€566 million (previous year: €1,642 million), of which €262 mil-
lion was short-term (previous year: €673 million). These items
consist primarily of income taxes for the respective current year
and for prior-year periods that have not yet been definitively
examined by the tax authorities.
As of December 31, 2018, €5 million (2017: €5 million) in deferred
tax liabilities were recognized for the differences between net
assets and the tax bases of subsidiaries and associated companies
(outside basis differences). Accordingly, deferred tax liabilities
were not recognized for temporary differences of €259 million
(2017: €717 million) at subsidiaries and associated companies,
as E.ON is able to control the timing of their reversal and the
temporary difference will not reverse in the foreseeable future.
Changes in tax rates resulted in tax income of €46 million in
total (2017: tax expense of €129 million).
Income taxes relating to discontinued operations (see also Note 4)
are reported in the income statement under “Income from dis-
continued operations.” In the fiscal year they amounted to tax
expense of €156 million (2017: tax income of €364 million).
The base income tax rate of 30 percent applicable in Germany,
which is unchanged from the previous year, is composed of
corporate income tax (15 percent), trade tax (14 percent) and
the solidarity surcharge (1 percent). The differences from the
effective tax rate are reconciled as follows:
Reconciliation to Effective Income Taxes/Tax Rate
2018 2017
€ in millions % € in millions %
Income/Loss from continuing operations before taxes 3,284 100.0 4,960 100.0
Expected income taxes 985 30.0 1,488 30.0
Foreign tax rate differentials -129 -3.9 -36 -0.7
Changes in tax rate/tax law -46 -1.4 129 2.6
Tax effects on tax-free income -124 -3.8 -240 -4.8
Tax effects of non-deductible expenses and permanent differences -212 -6.5 411 8.3
Tax effects on income from companies accounted for under the equity method 22 0.7 71 1.4
Tax effects of goodwill impairment and elimination of negative goodwill – – – –
Tax effects of changes in value and non-recognition of deferred taxes 89 2.7 -978 -19.7
Tax effects of other taxes on income 31 1.0 70 1.4
Tax effects of income taxes related to other periods -571 -17.4 -145 -2.9
Other 1 – 33 0.7
Effective income taxes/tax rate 46 1.4 803 16.2
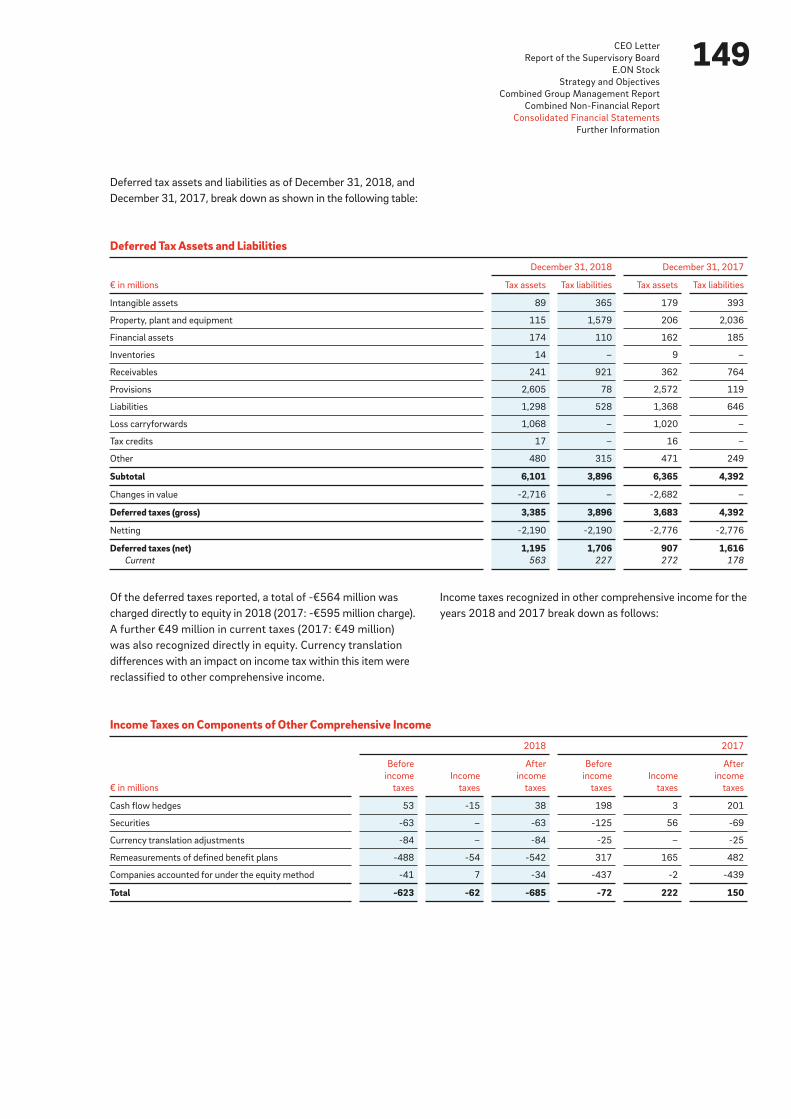
149CEO Letter
Report of the Supervisory Board
E.ON Stock
Strategy and Objectives
Combined Group Management Report
Combined Non-Financial Report
Consolidated Financial Statements
Further Information
Deferred tax assets and liabilities as of December 31, 2018, and
December 31, 2017, break down as shown in the following table:
Income taxes recognized in other comprehensive income for the
years 2018 and 2017 break down as follows:
Of the deferred taxes reported, a total of -€564 million was
charged directly to equity in 2018 (2017: -€595 million charge).
A further €49 million in current taxes (2017: €49 million)
was also recognized directly in equity. Currency translation
differences with an impact on income tax within this item were
reclassified to other comprehensive income.
Deferred Tax Assets and Liabilities
€ in millions
December 31, 2018 December 31, 2017
Tax assets Tax liabilities Tax assets Tax liabilities
Intangible assets 89 365 179 393
Property, plant and equipment 115 1,579 206 2,036
Financial assets 174 110 162 185
Inventories 14 – 9 –
Receivables 241 921 362 764
Provisions 2,605 78 2,572 119
Liabilities 1,298 528 1,368 646
Loss carryforwards 1,068 – 1,020 –
Tax credits 17 – 16 –
Other 480 315 471 249
Subtotal 6,101 3,896 6,365 4,392
Changes in value -2,716 – -2,682 –
Deferred taxes (gross) 3,385 3,896 3,683 4,392
Netting -2,190 -2,190 -2,776 -2,776
Deferred taxes (net) 1,195 1,706 907 1,616Current 563 227 272 178
Income Taxes on Components of Other Comprehensive Income
€ in millions
2018 2017
Before
income
taxes
Income
taxes
After
income
taxes
Before
income
taxes
Income
taxes
After
income
taxes
Cash flow hedges 53 -15 38 198 3 201
Securities -63 – -63 -125 56 -69
Currency translation adjustments -84 – -84 -25 – -25
Remeasurements of defined benefit plans -488 -54 -542 317 165 482
Companies accounted for under the equity method -41 7 -34 -437 -2 -439
Total -623 -62 -685 -72 222 150
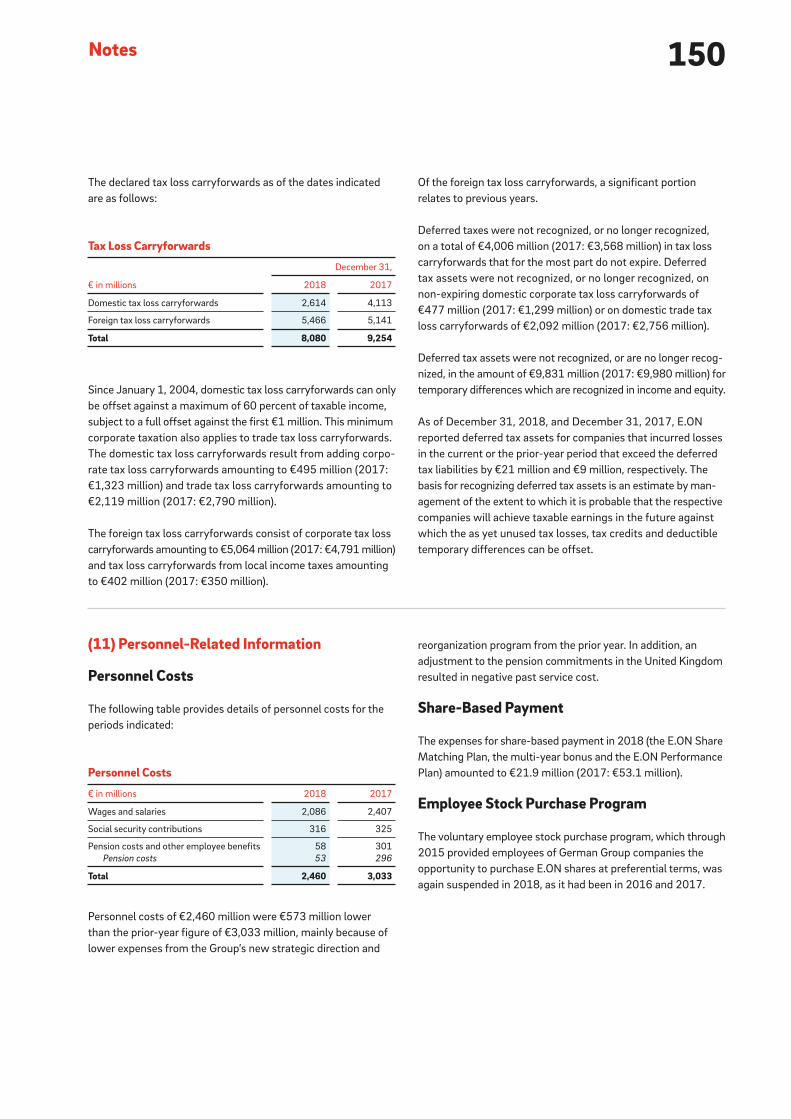
150Notes
The declared tax loss carryforwards as of the dates indicated
are as follows:
Since January 1, 2004, domestic tax loss carryforwards can only
be offset against a maximum of 60 percent of taxable income,
subject to a full offset against the first €1 million. This minimum
corporate taxation also applies to trade tax loss carry forwards.
The domestic tax loss carryforwards result from adding corpo-
rate tax loss carryforwards amounting to €495 million (2017:
€1,323 million) and trade tax loss carryforwards amounting to
€2,119 million (2017: €2,790 million).
The foreign tax loss carryforwards consist of corporate tax loss
carryforwards amounting to €5,064 million (2017: €4,791 million)
and tax loss carryforwards from local income taxes amounting
to €402 million (2017: €350 million).
Of the foreign tax loss carryforwards, a significant portion
relates to previous years.
Deferred taxes were not recognized, or no longer recognized,
on a total of €4,006 million (2017: €3,568 million) in tax loss
carryforwards that for the most part do not expire. Deferred
tax assets were not recognized, or no longer recognized, on
non-expiring domestic corporate tax loss carryforwards of
€477 million (2017: €1,299 million) or on domestic trade tax
loss carryforwards of €2,092 million (2017: €2,756 million).
Deferred tax assets were not recognized, or are no l onger recog-
nized, in the amount of €9,831 million (2017: €9,980 million) for
temporary differences which are recognized in income and equity.
As of December 31, 2018, and December 31, 2017, E.ON
reported deferred tax assets for companies that incurred losses
in the current or the prior-year period that exceed the deferred
tax liabilities by €21 million and €9 million, respectively. The
basis for recognizing deferred tax assets is an estimate by man-
agement of the extent to which it is probable that the respective
companies will achieve taxable earnings in the future against
which the as yet unused tax losses, tax credits and deductible
temporary differences can be offset.
reorganization program from the prior year. In addition, an
adjustment to the pension commitments in the United Kingdom
resulted in negative past service cost.
Share-Based Payment
The expenses for share-based payment in 2018 (the E.ON Share
Matching Plan, the multi-year bonus and the E.ON Performance
Plan) amounted to €21.9 million (2017: €53.1 million).
Employee Stock Purchase Program
The voluntary employee stock purchase program, which through
2015 provided employees of German Group companies the
opportunity to purchase E.ON shares at preferential terms, was
again suspended in 2018, as it had been in 2016 and 2017.
(11) Personnel-Related Information
Personnel Costs
The following table provides details of personnel costs for the
periods indicated:
Personnel costs of €2,460 million were €573 million lower
than the prior-year figure of €3,033 million, mainly because of
lower expenses from the Group’s new strategic direction and
Tax Loss Carryforwards
€ in millions
December 31,
2018 2017
Domestic tax loss carryforwards 2,614 4,113
Foreign tax loss carryforwards 5,466 5,141
Total 8,080 9,254
Personnel Costs
€ in millions 2018 2017
Wages and salaries 2,086 2,407
Social security contributions 316 325
Pension costs and other employee benefits 58 301
Pension costs 53 296
Total 2,460 3,033

151CEO Letter
Report of the Supervisory Board
E.ON Stock
Strategy and Objectives
Combined Group Management Report
Combined Non-Financial Report
Consolidated Financial Statements
Further Information
From fiscal years 2003 to 2017, employees in the United King-
dom had the opportunity to purchase E.ON shares through an
employee stock purchase program and to acquire additional bonus
shares. The program was suspended in 2018. The expense of
issuing these matching shares amounted to €0.5 million in 2017.
Long-Term Variable Compensation
Members of the Management Board of E.ON SE and certain
executives of the E.ON Group receive share-based payment
as part of their voluntary long-term variable compensation. The
purpose of such compensation is to reward their contribution
to E.ON’s growth and to further the long-term success of the
Company. This variable compensation component, comprising
a long-term incentive effect along with a certain element of
risk, provides for a sensible linking of the interests of shareholders
and management.
The following discussion includes reports on the E.ON Share
Matching Plan introduced in 2013, on the multi-year bonus
granted in 2015 and 2016 and on the E.ON Performance Plan
introduced in 2017.
E.ON Share Matching Plan
From 2013 to 2016, E.ON granted virtual shares to members of
the Management Board of E.ON SE and certain executives of
the E.ON Group under the E.ON Share Matching Plan. At the
end of its four-year term, each virtual share is entitled to a cash
payout linked to the final E.ON share price established at that
time. The calculation inputs for this long-term variable compen-
sation package are equity deferral, base matching and perfor-
mance matching.
The equity deferral is determined by multiplying an arithmetic
portion of the beneficiary’s contractually agreed target bonus
by the beneficiary’s total target achievement percentage from
the previous year. The equity deferral is converted into virtual
shares and vests immediately. In the United States, virtual shares
were granted in the amount of the equity deferral for the first
time in 2015. Beneficiaries were additionally granted virtual
shares in the context of base matching and performance match-
ing. For members of the Management Board of E.ON SE, the
proportion of base matching to the equity deferral was deter-
mined at the discretion of the Supervisory Board; for all other
beneficiaries it was 2:1. The performance-matching target
value at allocation was equal to that for base matching in terms
of amount. Performance matching will result in a payout only
on achievement of a minimum performance as specified at
the beginning of the term by the Management Board and the
Supervisory Board.
In 2015 and 2016, virtual shares from the third and fourth tranche
were granted in the context of base matching and performance
matching exclusively to members of the Management Board of
E.ON SE. Executives were granted a multi-year bonus, the terms
of which are described further below, instead of the base and
performance matching.
In 2017 virtual shares were granted for the last time under the
E.ON Share Matching Plan, only to members of the Management
Board of E.ON SE and only to the extent of the “equity deferral.”
The total of these allocations is shown below as the fifth tranche
of the E.ON Share Matching Plan. Additional information can be
found on pages 87 and 88 of the compensation report.
Under the plan’s original structure, the amount paid out under
performance matching was to be equal to the target value
at issuance if the E.ON share price was maintained at the end
of the term and if the average ROACE performance matched
a target value specified by the Management Board and the Super-
visory Board. If the average ROACE during the four-year term
exceeded the target value, the number of virtual shares granted
under performance matching increased up to a maximum of
twice the target value. If the average ROACE had fallen short
of the target value, the number of virtual shares, and thus also
the amount paid out, were to decrease.
In 2016, the plan was changed to the effect that for periods from
2016 onwards, ROCE was used instead of ROACE for measuring
performance. Accordingly, new targets were defined for 2016
and/or subsequent years. At the same time, the previous ROACE
target achievement for the previous years will be included in
the total performance of the respective tranches on a pro-rata
basis. In the event of a defined underperformance, there is no
payout under performance matching.
A payout generally will not take place until after the end of the
four-year term. This is true even if the beneficiary retires before-
hand, or if the beneficiary’s contract is terminated on operational
grounds or expires during the term. A payout before the end of
the term will take place in the event of a change of control or on
the death of the beneficiary. If the service or employment rela-
tionship ends before the end of the term for reasons within the
control of the beneficiary, all virtual shares—except for those that
resulted from the equity deferral—expire.
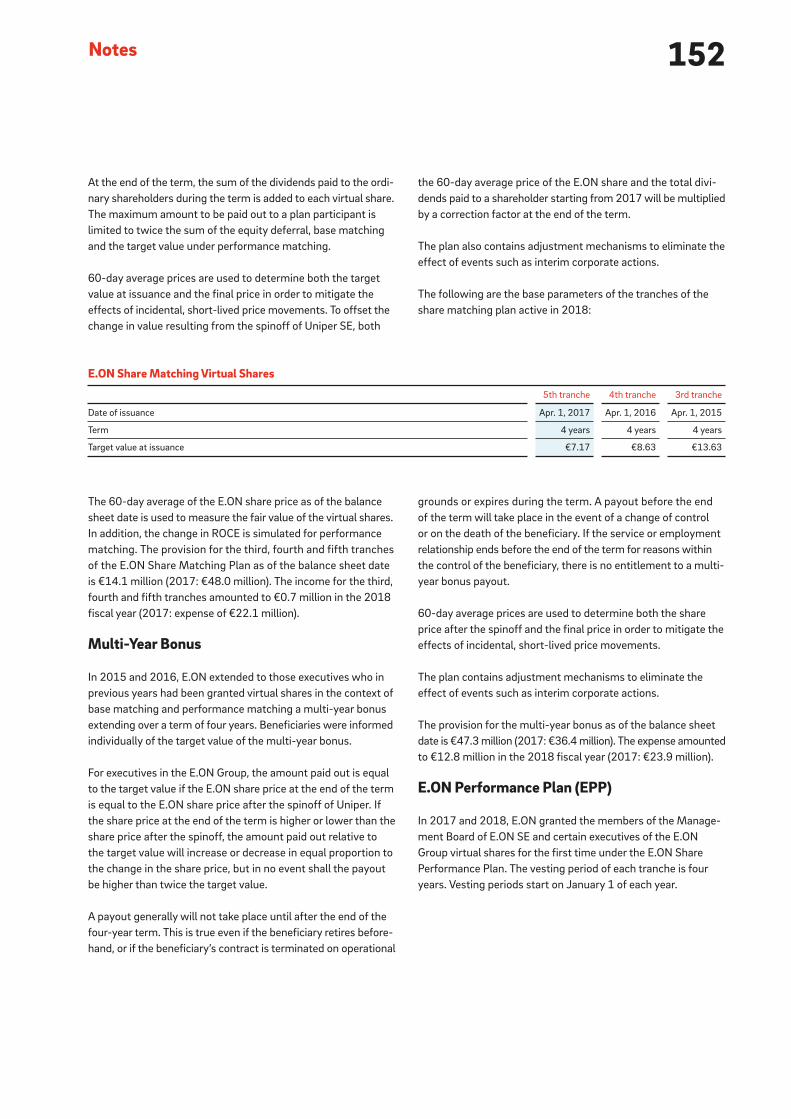
152Notes
At the end of the term, the sum of the dividends paid to the ordi-
nary shareholders during the term is added to each virtual share.
The maximum amount to be paid out to a plan participant is
limited to twice the sum of the equity deferral, base matching
and the target value under performance matching.
60-day average prices are used to determine both the target
value at issuance and the final price in order to mitigate the
effects of incidental, short-lived price movements. To offset the
change in value resulting from the spinoff of Uniper SE, both
The 60-day average of the E.ON share price as of the balance
sheet date is used to measure the fair value of the virtual shares.
In addition, the change in ROCE is simulated for performance
matching. The provision for the third, fourth and fifth tranches
of the E.ON Share Matching Plan as of the balance sheet date
is €14.1 million (2017: €48.0 million). The income for the third,
fourth and fifth tranches amounted to €0.7 million in the 2018
fiscal year (2017: expense of €22.1 million).
Multi-Year Bonus
In 2015 and 2016, E.ON extended to those executives who in
previous years had been granted virtual shares in the context of
base matching and performance matching a multi-year bonus
extending over a term of four years. Beneficiaries were informed
individually of the target value of the multi-year bonus.
For executives in the E.ON Group, the amount paid out is equal
to the target value if the E.ON share price at the end of the term
is equal to the E.ON share price after the spinoff of Uniper. If
the share price at the end of the term is higher or lower than the
share price after the spinoff, the amount paid out relative to
the target value will increase or decrease in equal proportion to
the change in the share price, but in no event shall the payout
be higher than twice the target value.
A payout generally will not take place until after the end of the
four-year term. This is true even if the beneficiary retires before-
hand, or if the beneficiary’s contract is terminated on operational
grounds or expires during the term. A payout before the end
of the term will take place in the event of a change of control
or on the death of the beneficiary. If the service or employment
relationship ends before the end of the term for reasons within
the control of the beneficiary, there is no entitlement to a multi-
year bonus payout.
60-day average prices are used to determine both the share
price after the spinoff and the final price in order to mitigate the
effects of incidental, short-lived price movements.
The plan contains adjustment mechanisms to eliminate the
effect of events such as interim corporate actions.
The provision for the multi-year bonus as of the balance sheet
date is €47.3 million (2017: €36.4 million). The expense amounted
to €12.8 million in the 2018 fiscal year (2017: €23.9 million).
E.ON Performance Plan (EPP)
In 2017 and 2018, E.ON granted the members of the Manage-
ment Board of E.ON SE and certain executives of the E.ON
Group virtual shares for the first time under the E.ON Share
Performance Plan. The vesting period of each tranche is four
years. Vesting periods start on January 1 of each year.
the 60-day average price of the E.ON share and the total divi-
dends paid to a shareholder starting from 2017 will be multiplied
by a correction factor at the end of the term.
The plan also contains adjustment mechanisms to eliminate the
effect of events such as interim corporate actions.
The following are the base parameters of the tranches of the
share matching plan active in 2018:
E.ON Share Matching Virtual Shares
5th tranche 4th tranche 3rd tranche
Date of issuance Apr. 1, 2017 Apr. 1, 2016 Apr. 1, 2015
Term 4 years 4 years 4 years
Target value at issuance €7.17 €8.63 €13.63
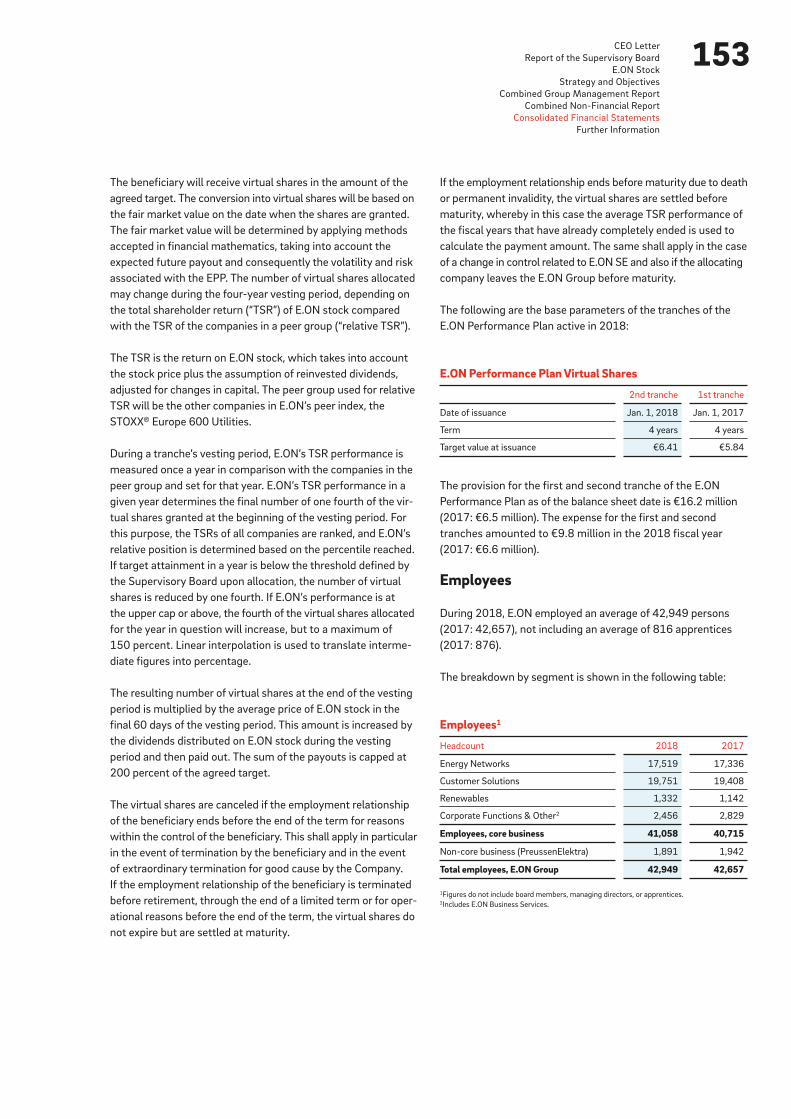
153CEO Letter
Report of the Supervisory Board
E.ON Stock
Strategy and Objectives
Combined Group Management Report
Combined Non-Financial Report
Consolidated Financial Statements
Further Information
The beneficiary will receive virtual shares in the amount of the
agreed target. The conversion into virtual shares will be based on
the fair market value on the date when the shares are granted.
The fair market value will be determined by applying methods
accepted in financial mathematics, taking into account the
expected future payout and consequently the volatility and risk
associated with the EPP. The number of virtual shares allocated
may change during the four-year vesting period, depending on
the total shareholder return (“TSR”) of E.ON stock compared
with the TSR of the companies in a peer group (“relative TSR”).
The TSR is the return on E.ON stock, which takes into account
the stock price plus the assumption of reinvested dividends,
adjusted for changes in capital. The peer group used for relative
TSR will be the other companies in E.ON’s peer index, the
STOXX® Europe 600 Utilities.
During a tranche’s vesting period, E.ON’s TSR performance is
measured once a year in comparison with the companies in the
peer group and set for that year. E.ON’s TSR performance in a
given year determines the final number of one fourth of the vir-
tual shares granted at the beginning of the vesting period. For
this purpose, the TSRs of all companies are ranked, and E.ON’s
relative position is determined based on the percentile reached.
If target attainment in a year is below the threshold defined by
the Supervisory Board upon allocation, the number of virtual
shares is reduced by one fourth. If E.ON’s performance is at
the upper cap or above, the fourth of the virtual shares allocated
for the year in question will increase, but to a maximum of
150 percent. Linear interpolation is used to translate interme-
diate figures into percentage.
The resulting number of virtual shares at the end of the vesting
period is multiplied by the average price of E.ON stock in the
final 60 days of the vesting period. This amount is increased by
the dividends distributed on E.ON stock during the vesting
period and then paid out. The sum of the payouts is capped at
200 percent of the agreed target.
The virtual shares are canceled if the employment relationship
of the beneficiary ends before the end of the term for reasons
within the control of the beneficiary. This shall apply in particular
in the event of termination by the beneficiary and in the event
of extraordinary termination for good cause by the Company.
If the employment relationship of the beneficiary is terminated
before retirement, through the end of a limited term or for oper-
ational reasons before the end of the term, the virtual shares do
not expire but are settled at maturity.
If the employment relationship ends before maturity due to death
or permanent invalidity, the virtual shares are settled before
maturity, whereby in this case the average TSR performance of
the fiscal years that have already completely ended is used to
calculate the payment amount. The same shall apply in the case
of a change in control related to E.ON SE and also if the allocating
company leaves the E.ON Group before maturity.
The following are the base parameters of the tranches of the
E.ON Performance Plan active in 2018:
The provision for the first and second tranche of the E.ON
Performance Plan as of the balance sheet date is €16.2 million
(2017: €6.5 million). The expense for the first and second
tranches amounted to €9.8 million in the 2018 fiscal year
(2017: €6.6 million).
Employees
During 2018, E.ON employed an average of 42,949 persons
(2017: 42,657), not including an average of 816 apprentices
(2017: 876).
The breakdown by segment is shown in the following table:
Employees 1
Headcount 2018 2017
Energy Networks 17,519 17,336
Customer Solutions 19,751 19,408
Renewables 1,332 1,142
Corporate Functions & Other 2 2,456 2,829
Employees, core business 41,058 40,715
Non-core business (PreussenElektra) 1,891 1,942
Total employees, E.ON Group 42,949 42,657
1Figures do not include board members, managing directors, or apprentices.2Includes E.ON Business Services.
E.ON Performance Plan Virtual Shares
2nd tranche 1st tranche
Date of issuance Jan. 1, 2018 Jan. 1, 2017
Term 4 years 4 years
Target value at issuance €6.41 €5.84

154Notes
(12) Other Information
German Corporate Governance Code
On December 18, 2018, the Management Board and the Super-
visory Board of E.ON SE made a declaration of compliance
pursuant to Section 161 of the German Stock Corporation Act
(“AktG”). The declaration has been made permanently and
publicly accessible to stockholders on the Company’s Web site
(www.eon.com).
Fees and Services of the Independent Auditor
During 2018 and 2017, the following fees for services provided
by the independent auditor of the Consolidated Financial State-
ments, Pricewaterhouse Coopers (“PwC”) GmbH, Wirtschafts-
prüfungs gesellschaft, (domestic) and by companies in the inter-
national PwC network were recorded as expenses:
The auditor’s fees relate to the audit of the Consolidated Financial
Statements and the legally mandated financial statements of
E.ON SE and its affiliates. They also include fees for auditing
reviews of the IFRS interim financial statements and other tests
directly required by the audit.
The fees for other auditing services include all attestation ser-
vices that are not auditing services and are not used in connection
with the audit. In 2018, these costs are for the legally required
attestation services (e.g., as a result of the Renewable Energy Act
(EEG), the Act on Combined Heat and Power Generation (KWKG))
and the other half of the costs will be for other voluntary attes-
tation services (primarily in connection with new IT systems).
The fees for tax consulting services mainly relate to services in
the area of tax compliance.
Fees for other services consist primarily of technical support
in connection with the implementation of new requirements in
the areas of IT and accounting issues.
List of Shareholdings
The list of shareholdings pursuant to Section 313 (2) HGB is an
integral part of these Notes to the Financial Statements and is
presented on pages 216 through 229.
Independent Auditor Fees
€ in millions 2018 2017
Financial statement audits 20 19
Domestic 15 14
Other attestation services 3 4
Domestic 2 3
Tax advisory services – 1
Domestic – –
Other services 1 1
Domestic 1 1
Total 24 25Domestic 18 18
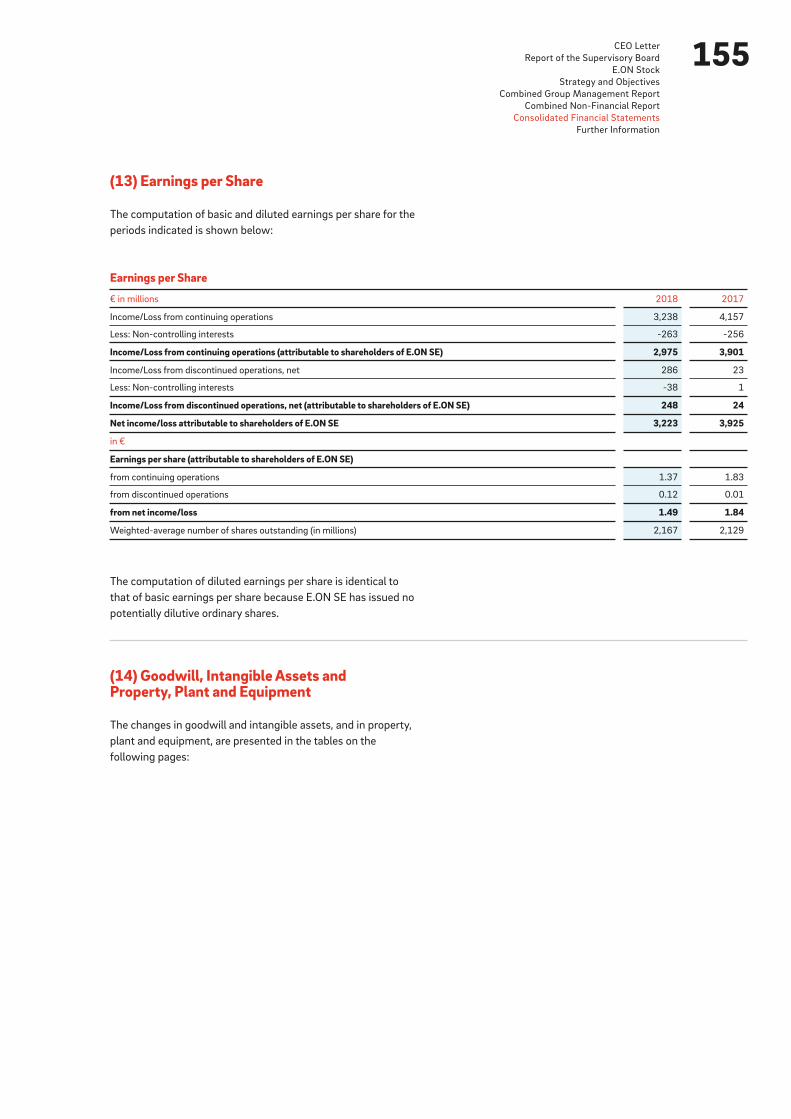
155CEO Letter
Report of the Supervisory Board
E.ON Stock
Strategy and Objectives
Combined Group Management Report
Combined Non-Financial Report
Consolidated Financial Statements
Further Information
(13) Earnings per Share
The computation of basic and diluted earnings per share for the
periods indicated is shown below:
The computation of diluted earnings per share is identical to
that of basic earnings per share because E.ON SE has issued no
potentially dilutive ordinary shares.
Earnings per Share
€ in millions 2018 2017
Income/Loss from continuing operations 3,238 4,157
Less: Non-controlling interests -263 -256
Income/Loss from continuing operations (attributable to shareholders of E.ON SE) 2,975 3,901
Income/Loss from discontinued operations, net 286 23
Less: Non-controlling interests -38 1
Income/Loss from discontinued operations, net (attributable to shareholders of E.ON SE) 248 24
Net income/loss attributable to shareholders of E.ON SE 3,223 3,925
in €
Earnings per share (attributable to shareholders of E.ON SE)
from continuing operations 1.37 1.83
from discontinued operations 0.12 0.01
from net income/loss 1.49 1.84
Weighted-average number of shares outstanding (in millions) 2,167 2,129
(14) Goodwill, Intangible Assets and Property, Plant and Equipment
The changes in goodwill and intangible assets, and in property,
plant and equipment, are presented in the tables on the
following pages:
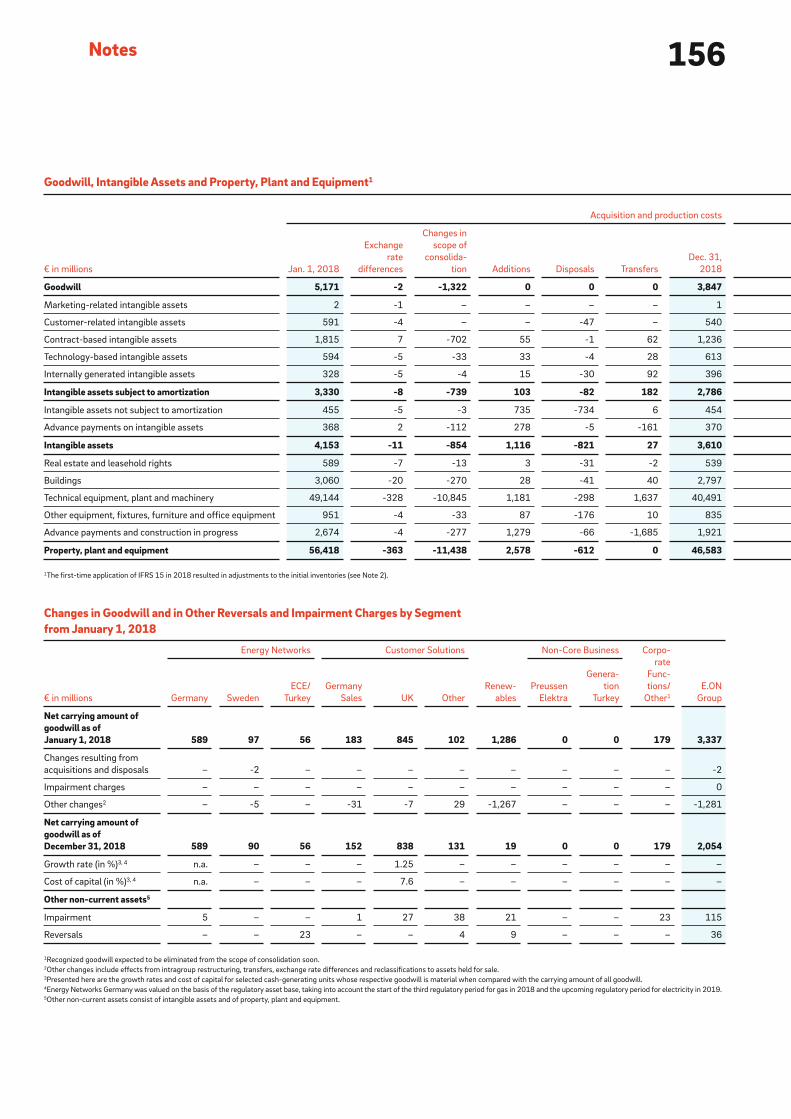
156Notes
Goodwill, Intangible Assets and Property, Plant and Equipment 1
€ in millions
Acquisition and production costs
Jan. 1, 2018
Exchange
rate
differences
Changes in
scope of
consolida-
tion Additions Disposals Transfers
Dec. 31,
2018
Goodwill 5,171 -2 -1,322 0 0 0 3,847
Marketing-related intangible assets 2 -1 – – – – 1
Customer-related intangible assets 591 -4 – – -47 – 540
Contract-based intangible assets 1,815 7 -702 55 -1 62 1,236
Technology-based intangible assets 594 -5 -33 33 -4 28 613
Internally generated intangible assets 328 -5 -4 15 -30 92 396
Intangible assets subject to amortization 3,330 -8 -739 103 -82 182 2,786
Intangible assets not subject to amortization 455 -5 -3 735 -734 6 454
Advance payments on intangible assets 368 2 -112 278 -5 -161 370
Intangible assets 4,153 -11 -854 1,116 -821 27 3,610
Real estate and leasehold rights 589 -7 -13 3 -31 -2 539
Buildings 3,060 -20 -270 28 -41 40 2,797
Technical equipment, plant and machinery 49,144 -328 -10,845 1,181 -298 1,637 40,491
Other equipment, fixtures, furniture and office equipment 951 -4 -33 87 -176 10 835
Advance payments and construction in progress 2,674 -4 -277 1,279 -66 -1,685 1,921
Property, plant and equipment 56,418 -363 -11,438 2,578 -612 0 46,583
1The first-time application of IFRS 15 in 2018 resulted in adjustments to the initial inventories (see Note 2).
Changes in Goodwill and in Other Reversals and Impairment Charges by Segment from January 1, 2018
€ in millions
Energy Networks Customer Solutions
Renew-
ables
Non-Core Business Corpo-
rate
Func-
tions/
Other 1E.ON
GroupGermany Sweden
ECE/
Turkey
Germany
Sales UK Other
Preussen
Elektra
Genera-
tion
Turkey
Net carrying amount of goodwill as of January 1, 2018 589 97 56 183 845 102 1,286 0 0 179 3,337
Changes resulting from
acquisitions and disposals – -2 – – – – – – – – -2
Impairment charges – – – – – – – – – – 0
Other changes 2 – -5 – -31 -7 29 -1,267 – – – -1,281
Net carrying amount of goodwill as of December 31, 2018 589 90 56 152 838 131 19 0 0 179 2,054
Growth rate (in %) 3, 4 n.a. – – – 1.25 – – – – – –
Cost of capital (in %) 3, 4 n.a. – – – 7.6 – – – – – –
Other non-current assets 5
Impairment 5 – – 1 27 38 21 – – 23 115
Reversals – – 23 – – 4 9 – – – 36
1Recognized goodwill expected to be eliminated from the scope of consolidation soon.2Other changes include effects from intragroup restructuring, transfers, exchange rate differences and reclassifications to assets held for sale. 3Presented here are the growth rates and cost of capital for selected cash-generating units whose respective goodwill is material when compared with the carrying amount of all goodwill.4Energy Networks Germany was valued on the basis of the regulatory asset base, taking into account the start of the third regulatory period for gas in 2018 and the upcoming regulatory period for electricity in 2019.5Other non-current assets consist of intangible assets and of property, plant and equipment.

157CEO Letter
Report of the Supervisory Board
E.ON Stock
Strategy and Objectives
Combined Group Management Report
Combined Non-Financial Report
Consolidated Financial Statements
Further Information
Accumulated depreciation
Net carrying
amounts
Jan. 1, 2018
Exchange
rate
differences
Changes in
scope of
consolida-
tion Additions Disposals Transfers Impairment Reversals
Dec. 31,
2018
Dec. 31,
2018
-1,834 2 39 0 0 0 0 0 -1,793 2,054
-2 1 – – – – – – -1 0
-437 4 – -32 47 – -26 – -444 96
-811 -8 549 -33 – – -2 3 -302 934
-485 3 17 -48 2 -1 -4 – -516 97
-114 3 1 -73 30 -1 -30 – -184 212
-1,849 3 567 -186 79 -2 -62 3 -1,447 1,339
-2 -2 2 – – – 1 – -1 453
-53 -2 57 – 2 1 -5 – 0 370
-1,904 -1 626 -186 81 -1 -66 3 -1,448 2,162
-72 3 1 -1 10 – – – -59 480
-1,842 13 166 -73 29 -1 -3 – -1,711 1,086
-29,021 169 3,830 -1,297 203 -20 -15 33 -26,118 14,373
-658 2 19 -81 120 2 – – -596 239
-73 – 9 – 29 24 -31 – -42 1,879
-31,666 187 4,025 -1,452 391 5 -49 33 -28,526 18,057
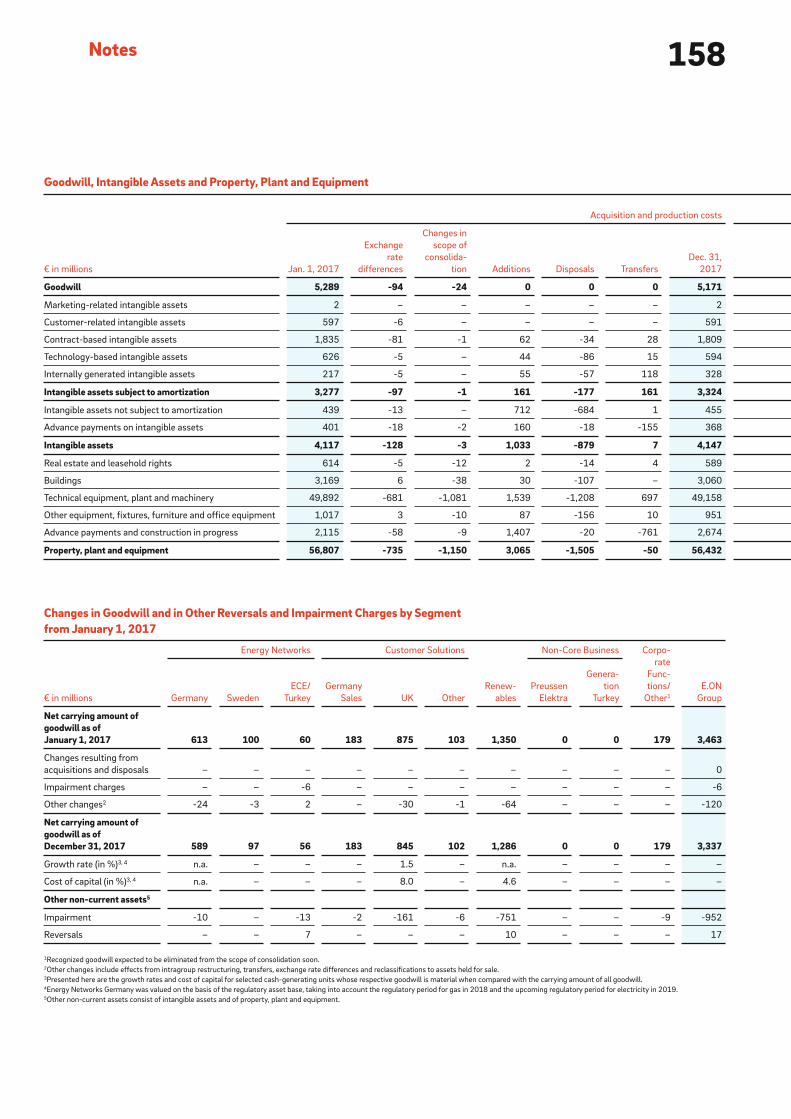
158Notes
Goodwill, Intangible Assets and Property, Plant and Equipment
€ in millions
Acquisition and production costs
Jan. 1, 2017
Exchange
rate
differences
Changes in
scope of
consolida-
tion Additions Disposals Transfers
Dec. 31,
2017
Goodwill 5,289 -94 -24 0 0 0 5,171
Marketing-related intangible assets 2 – – – – – 2
Customer-related intangible assets 597 -6 – – – – 591
Contract-based intangible assets 1,835 -81 -1 62 -34 28 1,809
Technology-based intangible assets 626 -5 – 44 -86 15 594
Internally generated intangible assets 217 -5 – 55 -57 118 328
Intangible assets subject to amortization 3,277 -97 -1 161 -177 161 3,324
Intangible assets not subject to amortization 439 -13 – 712 -684 1 455
Advance payments on intangible assets 401 -18 -2 160 -18 -155 368
Intangible assets 4,117 -128 -3 1,033 -879 7 4,147
Real estate and leasehold rights 614 -5 -12 2 -14 4 589
Buildings 3,169 6 -38 30 -107 – 3,060
Technical equipment, plant and machinery 49,892 -681 -1,081 1,539 -1,208 697 49,158
Other equipment, fixtures, furniture and office equipment 1,017 3 -10 87 -156 10 951
Advance payments and construction in progress 2,115 -58 -9 1,407 -20 -761 2,674
Property, plant and equipment 56,807 -735 -1,150 3,065 -1,505 -50 56,432
Changes in Goodwill and in Other Reversals and Impairment Charges by Segment from January 1, 2017
€ in millions
Energy Networks Customer Solutions
Renew-
ables
Non-Core Business Corpo-
rate
Func-
tions/
Other 1E.ON
GroupGermany Sweden
ECE/
Turkey
Germany
Sales UK Other
Preussen
Elektra
Genera-
tion
Turkey
Net carrying amount of goodwill as of January 1, 2017 613 100 60 183 875 103 1,350 0 0 179 3,463
Changes resulting from
acquisitions and disposals – – – – – – – – – – 0
Impairment charges – – -6 – – – – – – – -6
Other changes 2 -24 -3 2 – -30 -1 -64 – – – -120
Net carrying amount of goodwill as of December 31, 2017 589 97 56 183 845 102 1,286 0 0 179 3,337
Growth rate (in %) 3, 4 n.a. – – – 1.5 – n.a. – – – –
Cost of capital (in %) 3, 4 n.a. – – – 8.0 – 4.6 – – – –
Other non-current assets 5
Impairment -10 – -13 -2 -161 -6 -751 – – -9 -952
Reversals – – 7 – – – 10 – – – 17
1Recognized goodwill expected to be eliminated from the scope of consolidation soon.2Other changes include effects from intragroup restructuring, transfers, exchange rate differences and reclassifications to assets held for sale. 3Presented here are the growth rates and cost of capital for selected cash-generating units whose respective goodwill is material when compared with the carrying amount of all goodwill.4Energy Networks Germany was valued on the basis of the regulatory asset base, taking into account the regulatory period for gas in 2018 and the upcoming regulatory period for electricity in 2019.5Other non-current assets consist of intangible assets and of property, plant and equipment.

159CEO Letter
Report of the Supervisory Board
E.ON Stock
Strategy and Objectives
Combined Group Management Report
Combined Non-Financial Report
Consolidated Financial Statements
Further Information
Accumulated depreciation
Net carrying
amounts
Jan. 1, 2017
Exchange
rate
differences
Changes in
scope of
consolida-
tion Additions Disposals Transfers Impairment Reversals
Dec. 31,
2017
Dec. 31,
2017
-1,826 -2 0 0 0 0 -6 0 -1,834 3,337
-2 – – – – – – – -2 0
-405 4 – -32 – – -4 – -437 154
-741 46 1 -41 34 5 -115 – -811 998
-502 4 – -48 74 -12 -1 – -485 109
-78 2 – -53 44 -29 – -114 214
-1,728 56 1 -174 152 -7 -149 – -1,849 1,475
-2 – – – – – – – -2 453
-58 7 – – 2 – -7 3 -53 315
-1,788 63 1 -174 154 -7 -156 3 -1,904 2,243
-68 1 1 -2 2 – -6 – -72 517
-1,919 -2 28 -76 99 39 -11 – -1,842 1,218
-28,811 256 800 -1,477 955 -6 -751 13 -29,021 20,137
-720 -3 8 -83 143 – -4 1 -658 293
-47 – – – – -2 -24 – -73 2,601
-31,565 252 837 -1,638 1,199 31 -796 14 -31,666 24,766

160Notes
correspond to the inflation rates in each of the currency areas
where the cash-generating units are tested. In 2018, the inflation
rate used for the euro area was 1.25 percent (2017: 1.5 percent).
The interest rates used for discounting cash flows are calculated
using market data for each cash-generating unit, and as of
December 31, 2018, ranged between 3.5 and 8.7 percent after
taxes (2017: 3.5 and 8.7 percent).
The principal assumptions underlying the determination by
management of recoverable amount are the respective forecasts
for commodity market prices, future electricity and gas prices
in the wholesale and retail markets, E.ON’s investment activity,
changes in the regulatory framework, as well as for rates of
growth and the cost of capital. These assumptions are based on
external market data from established providers and on internal
estimates.
The above discussion applies accordingly to the testing for
impairment of intangible assets and of property, plant and
equipment, and of groups of these assets. If the goodwill of a
cash-generating unit is combined with assets or groups of
assets for impairment testing, the assets must be tested first.
The goodwill impairment testing performed in 2018 resulted
in the recognition of no impairment charges. In 2017, there
was an impairment charge of €6 million for the Energy Networks
Romania cash-generating unit on the recoverable amount of
€418 million (after-tax interest rate 5.68 percent).
Goodwill and Non-Current Assets
The changes in goodwill within the segments, as well as the
allocation of impairments and their reversals to each reportable
segment, are presented in the tables on pages 156 through 159.
ImpairmentsIFRS 3 prohibits the amortization of goodwill. Instead, goodwill
is tested for impairment at least annually at the level of the
cash-generating units. Goodwill must also be tested for impair-
ment at the level of individual cash-generating units between
these annual tests if events or changes in circumstances indicate
that the recoverable amount of a par ticular cash-generating
unit might be impaired. Intangible assets subject to amortization
and property, plant and equipment must generally be tested
for impairment whenever there are particular events or external
circumstances indicating the possibility of impairment.
To perform the impairment tests, the Company first determines
the fair values less costs to sell of its cash-generating units.
Because there were no binding sales transactions or market
prices for the respective cash-generating units in 2018, fair val-
ues were calculated based on discounted cash flow methods.
Valuations are based on the medium-term corporate planning
authorized by the Management Board. The calculations for
impairment-testing purposes are generally based on the three
planning years of the medium-term plan plus two additional
detailed planning years. In certain justified exceptional cases, a
longer detailed planning period is used as the calculation basis.
The cash flow assumptions extending beyond the detailed plan-
ning period are determined using growth rates that generally

161CEO Letter
Report of the Supervisory Board
E.ON Stock
Strategy and Objectives
Combined Group Management Report
Combined Non-Financial Report
Consolidated Financial Statements
Further Information
The goodwill of all cash-generating units whose respective
goodwill as of the balance sheet date is material in relation to
the total carrying amount of all goodwill shows a surplus of
recoverable amounts over the respective carrying amounts and,
therefore, based on current assessment of the economic situa-
tion, only a significant change in the material valuation parameters
would necessitate the recognition of goodwill impairment.
In fiscal year 2018, a total of €49 million in impairments
was charged to property, plant and equipment, primarily from
€20 million in impairments in the UK.
Impairments on intangible assets amounted to approximately
€66 million in 2018. Developments in the retail customer busi-
ness at ECT UK (around €26 million) and the impairment of
capitalized IT costs at the holding company (around €16 million)
had the greatest impact.
Reversals of impairments on property, plant and equipment
and intangible assets recognized in previous years amounted to
€36 million in 2018, significantly influenced by developments
in Hungary.
In fiscal year 2017, a total of €796 million in impairments was
charged to property, plant and equipment. Of this amount,
€628 million was attributable to property, plant and equipment
at Renewables. Of this amount, around €40 million related to
the offshore sector. The impairment recognized in the onshore
segment amounted to €589 million. Wind farms in the United
States (€553 million) suffered the greatest impact. Property,
plant and equipment in the Customer Solutions UK segment
was written down by €133 million, mainly due to technological
developments and the significant increase in capital costs.
Impairments on intangible assets amounted to approximately
€156 million in 2017. Of this, around €123 million was attrib-
utable to wind farms in the onshore wind/solar energy segment
in Renewables.
These impairments of property, plant and equipment and of
intangible assets at wind farms in the United States in the prior
year relate to several individual assets with recoverable
amounts totaling €1,186 million. The main reason for this was
significantly lower price expectations, in particular because of
the revised assessment of CO2 reduction efforts in the US.
Reversals of impairments on property, plant and equipment
and intangible assets recognized in previous years amounted to
€17 million in 2017, significantly influenced by developments
in Hungary and in Renewables.
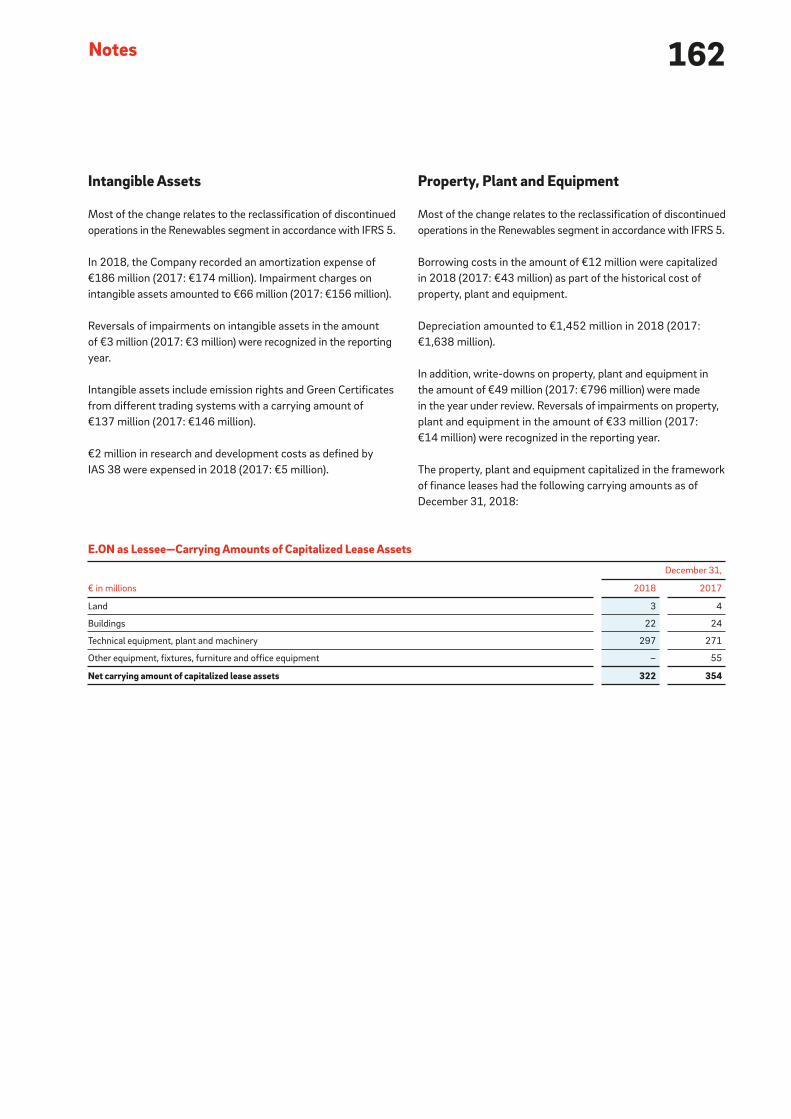
162Notes
Property, Plant and Equipment
Most of the change relates to the reclassification of discontinued
operations in the Renewables segment in accordance with IFRS 5.
Borrowing costs in the amount of €12 million were capitalized
in 2018 (2017: €43 million) as part of the historical cost of
property, plant and equipment.
Depreciation amounted to €1,452 million in 2018 (2017:
€1,638 million).
In addition, write-downs on property, plant and equipment in
the amount of €49 million (2017: €796 million) were made
in the year under review. Reversals of impairments on property,
plant and equipment in the amount of €33 million (2017:
€14 million) were recognized in the reporting year.
The property, plant and equipment capitalized in the framework
of finance leases had the following carrying amounts as of
December 31, 2018:
Intangible Assets
Most of the change relates to the reclassification of discontinued
operations in the Renewables segment in accordance with IFRS 5.
In 2018, the Company recorded an amortization expense of
€186 million (2017: €174 million). Impairment charges on
intangible assets amounted to €66 million (2017: €156 million).
Reversals of impairments on intangible assets in the amount
of €3 million (2017: €3 million) were recognized in the reporting
year.
Intangible assets include emission rights and Green Certificates
from different trading systems with a carrying amount of
€137 million (2017: €146 million).
€2 million in research and development costs as defined by
IAS 38 were expensed in 2018 (2017: €5 million).
E.ON as Lessee—Carrying Amounts of Capitalized Lease Assets
€ in millions
December 31,
2018 2017
Land 3 4
Buildings 22 24
Technical equipment, plant and machinery 297 271
Other equipment, fixtures, furniture and office equipment – 55
Net carrying amount of capitalized lease assets 322 354

163CEO Letter
Report of the Supervisory Board
E.ON Stock
Strategy and Objectives
Combined Group Management Report
Combined Non-Financial Report
Consolidated Financial Statements
Further Information
Some of the leases contain price-adjustment clauses, as well
as extension and purchase options. The corresponding payment
obligations under finance leases are due as shown below:
The present value of the minimum lease obligations is reported
under liabilities from leases.
Regarding future obligations under operating leases where
economic ownership is not transferred to E.ON as the lessee,
see Note 27.
E.ON also functions in the capacity of lessor. Contingent lease pay-
ments received totaled €19 million in 2018 (2017: €13 million).
Future lease installments receivable under operating leases are
due as shown in the table at right: See Note 17 for information on receivables from finance leases.
E.ON as Lessor—Operating Leases
€ in millions 2018 2017
Nominal value of outstanding lease installments
Due within 1 year 39 20
Due in 1 to 5 years 81 45
Due in more than 5 years 22 39
Total 142 104
E.ON as Lessee—Payment Obligations under Finance Leases
€ in millions
Minimum lease payments Covered interest share Present values
2018 2017 2018 2017 2018 2017
Due within 1 year 52 56 20 19 32 37
Due in 1 to 5 years 160 202 62 67 98 135
Due in more than 5 years 255 246 58 61 197 185
Total 467 504 140 147 327 357

164Notes
Shares in Companies Accounted for under the Equity Method
The carrying amounts of the immaterial associates accounted
for under the equity method totaled €363 million (2017:
€458 million), and those of the joint ventures totaled €102 million
(2017: €637 million). The significant decline in the carrying
amounts resulted from the reclassification of the investments
of the Renewables segment to assets held for sale.
Investment income generated from companies accounted for
under the equity method amounted to €235 million in 2018
(2017: €277 million). The prior-year figure includes the Uniper SE
dividend and the shareholdings of the Renewables segment.
The following table summarizes significant line items of the aggre-
gated statements of comprehensive income of the associates and
joint ventures that are accounted for under the equity method:
Companies accounted for under the equity method consist
solely of associates and joint ventures. The decline in joint ven-
tures is primarily due to the ongoing measurement of the Turkish
activities and the reclassification of AWE-Arkona-Windpark
Entwicklungs-GmbH as assets held for sale.
The amount shown for non-current securities relates primarily
to fixed-income securities.
In 2018, impairment charges on companies accounted for under
the equity method amounted to €7 million (2017: €8 million).
Impairments on other financial assets amounted to €30 million
(2017: €63 million). The carrying amount of other financial
assets with impairment losses was €16 million as of the end of
the fiscal year (2017: €133 million).
(15) Companies Accounted for under the Equity Method and Other Financial Assets
The following table shows the structure of the companies
accounted for under the equity method and the other financial
assets as of the dates indicated:
Summarized Financial Information for Individually Non-Material Associates and Joint Ventures Accounted for under the Equity Method
€ in millions
Associates Joint ventures Total
2018 2017 2018 2017 2018 2017
Proportional share of net income from continuing operations 68 77 46 56 114 133
Proportional share of other comprehensive income – -11 -5 -33 -5 -44
Proportional share of total comprehensive income 68 66 41 23 109 89
Companies Accounted for under the Equity Method and Other Financial Assets
€ in millions
December 31, 2018 December 31, 2017
E.ON Group Associates 1Joint
ventures 1 E.ON Group Associates 1Joint
ventures 1
Companies accounted for under the equity method 2,603 1,421 1,182 3,547 1,469 2,078
Equity investments 664 250 20 792 256 5
Non-current securities 2,240 – – 2,749 – –
Total 5,507 1,671 1,202 7,088 1,725 2,083
1The associates and joint ventures presented as equity investments are associated companies and joint ventures accounted for at cost on materiality grounds.

165CEO Letter
Report of the Supervisory Board
E.ON Stock
Strategy and Objectives
Combined Group Management Report
Combined Non-Financial Report
Consolidated Financial Statements
Further Information
The tables below show significant line items of the aggregated
balance sheets and of the aggregated statements of comprehen-
sive income of the material companies accounted for under the
equity method. The material associates in the E.ON Group are
Nord Stream AG, Gasag Berliner Gaswerke AG, Západoslovenská
energetika a.s. and, until the end of September 2017, Uniper SE.
Since the end of September 2017, Uniper SE has been reported
as an investment held for sale and no longer as a company
accounted for at equity, so that income from the equity method
of accounting only accrued in the first nine months of fiscal
year 2017. The tables below present a reconciliation to the pro
rata equity result or the carrying amount of the investment
in Uniper SE on the basis of the data published by Uniper as
of September 30, 2017.
The Group adjustments shown in the table mainly relate to
goodwill determined as part of initial recognition, temporary
differences and effects from the elimination of intragroup profits.
Material Associates—Balance Sheet Data as of December 31
€ in millions
Uniper Group Nord Stream AG
Gasag Berliner
Gaswerke AG
Západoslovenská
energetika a.s.
2018 2017 1 2018 2017 2018 2017 2018 2017
Non-current assets 2 – 18,767 5,775 6,100 1,845 1,761 887 837
Current assets – 18,353 801 696 225 249 241 214
Current liabilities (including provisions) – 16,395 392 374 351 305 233 520
Non-current liabilities (including provisions) – 13,744 3,300 3,705 883 913 793 452
Equity – 6,981 2,884 2,717 836 792 102 79
Non controlling interests – 627 – – 70 67 – –
Ownership interest (in %) – 46.65 15.50 15.50 36.85 36.85 49.00 49.00
Proportional share of equity – 2,964 447 421 282 267 50 39
Consolidation adjustments – -10 10 10 80 81 190 193
Carrying amount of equity investment 0 2,954 457 431 362 348 240 232
1Uniper value as of September 30, 2017. Since end of September 2017, Uniper has been recognized as an investment held for sale and is no longer valued under the equity method.2Undisclosed accruals/provisions from acquisitions are recognized in assets.
Material Associates—Earnings Data
€ in millions
Uniper Group Nord Stream AG
Gasag Berliner
Gaswerke AG
Západoslovenská
energetika a.s.
2018 2017 1 2018 2017 2018 2017 2018 2017
Sales – 52,938 1,074 1,076 1,198 1,105 1,135 1,065
Net income/loss from continuing operations – 1,119 434 426 35 89 92 91
Non-controlling interests in the net income/
loss from continuing operations – 99 – – 7 8 – –
Net income from discontinued operations – – – – – -54 – –
Dividend paid out – 201 334 265 13 8 71 51
Other comprehensive income – -263 82 134 4 15 1 –
Total comprehensive income – 856 516 560 39 50 93 91
Ownership interest (in %) – 46.65 15.50 15.50 36.85 36.85 49.00 49.00
Proportional share of total comprehensive
income after taxes – 370 80 87 14 18 46 45
Proportional share of net income after taxes – 476 67 66 10 9 45 45
Consolidation adjustments – -10 -2 1 – – – 3
Equity-method earnings 0 466 65 67 10 9 45 48
1Uniper value as of September 30, 2017. Since end of September 2017, Uniper has been recognized as an investment held for sale and is no longer valued under the equity method.

166Notes
The material associates and the material joint ventures are active
in diverse areas of the gas and electricity industries. Disclosures
of company names, registered offices and equity interests
as required by IFRS 12 for material joint arrangements and
associates can be found in the list of shareholdings pursuant
to Section 313 (2) HGB (see Note 35).
As of December 31, 2018, the investment in Enerjisa Enerji A.Ş. is
marketable. The pro rata market value amounted to €398 million
as of December 31, 2018. At the end of 2017, no associates
Presented in the tables below are significant line items of the
aggregated balance sheets and of the aggregated income state-
ments of the joint ventures accounted for under the equity
method, Enerjisa Enerji A.Ş. and Enerjisa Üretim Santralleri A.Ş.
Material Joint Ventures—Earnings Data
€ in millions
Enerjisa Enerji A.Ş. Enerjisa Üretim Santralleri A.Ş.
2018 2017 2018 2017
Sales 3,029 2,715 875 915
Net income/loss from continuing operations 111 205 -33 -205
Write-downs -55 -64 -108 -130
Interest income/expense -246 -210 -53 -78
Income taxes -95 -65 65 47
Dividend paid out 65 – – –
Other comprehensive income -355 -438 -486 -188
Total comprehensive income -244 -233 -519 -393
Ownership interest (in %) 40.00 50.00 50.00 50.00
Proportional share of total comprehensive income after taxes -98 -116 -260 -196
Proportional share of net income after taxes 44 103 -17 -102
Consolidation adjustments 8 5 – -11
Equity-method earnings 52 108 -17 -113
Material Joint Ventures—Balance Sheet Data as of December 31
€ in millions
Enerjisa Enerji A.Ş. Enerjisa Üretim Santralleri A.Ş.
2018 2017 2018 2017
Non-current assets 2,820 3,279 2,233 3,076
Current assets 1,056 903 331 194
Current liabilities (including provisions) 1,235 1,063 505 602
Non-current liabilities (including provisions) 1,541 1,732 888 1,314
Cash and cash equivalents 93 38 180 8
Current financial liabilities 563 433 337 455
Non-current financial liabilities 1,015 1,221 879 1,219
Equity 1,100 1,387 1,171 1,354
Ownership interest (in %) 40.00 50.00 50.00 50.00
Proportional share of equity 440 694 586 677
Consolidation adjustments 11 11 43 59
Carrying amount of equity investment 451 705 629 736
were marketable, and a 20-percent shareholding in Enerjisa
Enerji A.Ş. was listed on the stock exchange on February 8, 2018.
Of investments in associates, the shareholding in Nord Stream AG
(carrying amount in 2018: €457 million; 2017: €431 million)
was restricted because it was pledged as collateral for financing
as of the balance sheet date.
There are no further material restrictions apart from those
contained in standard legal and contractual provisions.

167CEO Letter
Report of the Supervisory Board
E.ON Stock
Strategy and Objectives
Combined Group Management Report
Combined Non-Financial Report
Consolidated Financial Statements
Further Information
(16) Inventories
The following table provides a breakdown of inventories as of
the dates indicated:
(17) Receivables and Other Assets
The following table lists receivables and other assets by
remaining time to maturity as of the dates indicated:
Receivables arising from IFRS 15 primarily consist of trade
receivables.
In 2018, there were unguaranteed residual values of €8 million
(2017: €9 million) due to E.ON as lessor under finance leases.
Some of the leases contain price-adjustment clauses, as well
as extension and purchase options.
Write-downs totaled €9 million in 2018 (2017: €8 million).
Reversals of write-downs amounted to €14 million in 2018
(2017: €11 million).
No inventories have been pledged as collateral.
Receivables and Other Assets
€ in millions
December 31, 2018 December 31, 2017
Current Non-current Current Non-current
Receivables from finance leases 38 291 37 292
Other financial receivables and financial assets 246 136 199 160
Financial receivables and other financial assets 284 427 236 452
Trade receivables 3,896 – 3,879 –
Contract assets 324 1,213 452 1,228
Other assets 3 7 – –
Receivables from derivative financial instruments 23 142 – –
Other operating assets 1,199 112 1,450 143
Trade receivables and other operating assets 5,445 1,474 5,781 1,371
Total 5,729 1,901 6,017 1,823
Inventories
€ in millions
December 31,
2018 2017
Raw materials and supplies 511 617
Goods purchased for resale 111 130
Work in progress and finished products 62 47
Total 684 794
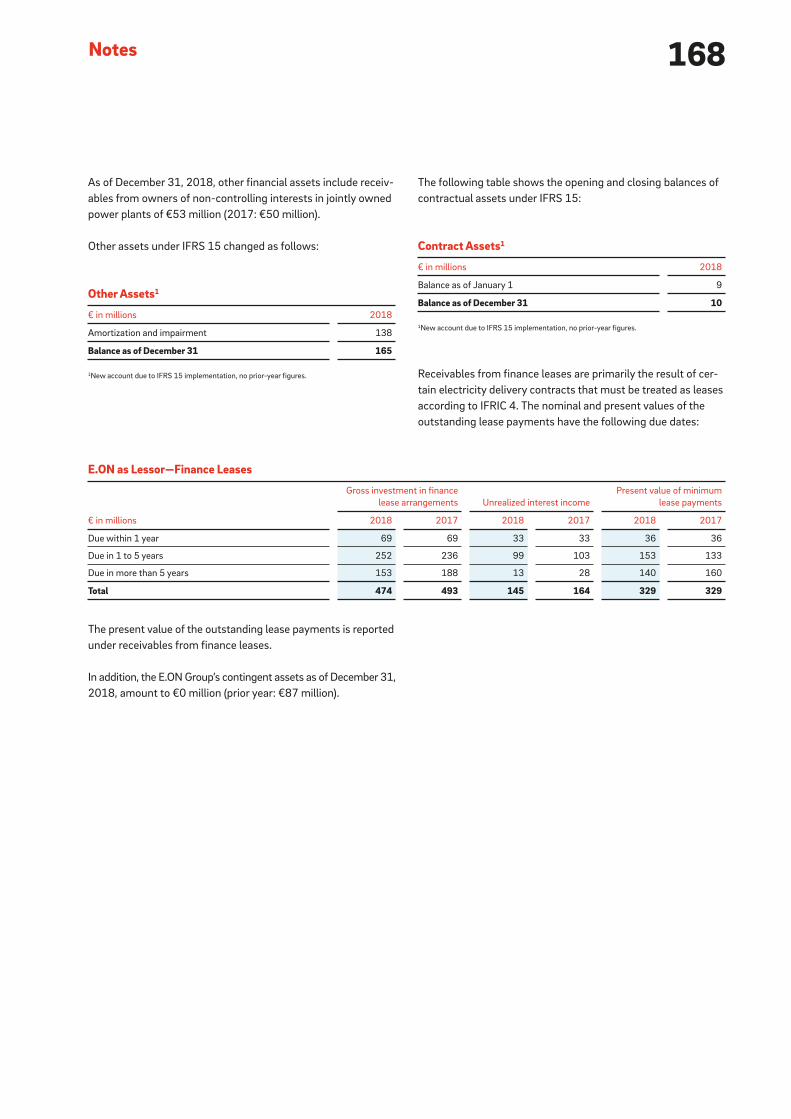
168Notes
The following table shows the opening and closing balances of
contractual assets under IFRS 15:
Receivables from finance leases are primarily the result of cer-
tain electricity delivery contracts that must be treated as leases
according to IFRIC 4. The nominal and present values of the
outstanding lease payments have the following due dates:
As of December 31, 2018, other financial assets include receiv-
ables from owners of non-controlling interests in jointly owned
power plants of €53 million (2017: €50 million).
Other assets under IFRS 15 changed as follows:
The present value of the outstanding lease payments is reported
under receivables from finance leases.
In addition, the E.ON Group’s contingent assets as of December 31,
2018, amount to €0 million (prior year: €87 million).
Other Assets 1
€ in millions 2018
Amortization and impairment 138
Balance as of December 31 165
1New account due to IFRS 15 implementation, no prior-year figures.
Contract Assets 1
€ in millions 2018
Balance as of January 1 9
Balance as of December 31 10
1New account due to IFRS 15 implementation, no prior-year figures.
E.ON as Lessor—Finance Leases
€ in millions
Gross investment in finance
lease arrangements Unrealized interest income
Present value of minimum
lease payments
2018 2017 2018 2017 2018 2017
Due within 1 year 69 69 33 33 36 36
Due in 1 to 5 years 252 236 99 103 153 133
Due in more than 5 years 153 188 13 28 140 160
Total 474 493 145 164 329 329

169CEO Letter
Report of the Supervisory Board
E.ON Stock
Strategy and Objectives
Combined Group Management Report
Combined Non-Financial Report
Consolidated Financial Statements
Further Information
(18) Liquid Funds
The following table provides a breakdown of liquid funds by
original maturity as of the dates indicated:
In 2018, there was €17 million in restricted cash (2017:
€17 million) with a maturity greater than three months.
The reinsurance of domestic pension obligations via VKE i.L.
was terminated in 2017. The cash and cash equivalents held
by VKE i.L. at the end of 2017 were reported as restricted cash.
The transfer of cash and cash equivalents to suitable follow-on
solutions essentially explains the decline in restricted cash in the
2018 reporting year. The shares of VKE i.L.’s assets attributable
to the E.ON Group were mostly transferred to the Contractual
Trust Arrangement (CTA), which created additional plan assets
in accordance with IAS 19 (see Note 24). Non-consolidated
shares of the assets of VKE i.L. were transferred to the respec-
tive follow-on solutions of the member companies concerned
and thus deconsolidated.
Cash and cash equivalents include €2,881 million (2017:
€1,869 million) in checks, cash on hand and balances at financial
institutions with an original maturity of less than three months,
to the extent that they are not restricted.
(19) Capital Stock
The capital stock is subdivided into 2,201,099,000 registered
shares with no par value (no-par-value shares) and amounts to
€2,201,099,000 (2017: €2,201,099,000). The capital stock of
the Company was provided by way of conversion of E.ON AG
into a European Company (SE) and through a capital increase
carried out on March 20, 2017, partially using the Authorized
Capital 2012, which expired on May 2, 2017.
Pursuant to a resolution by the Annual Shareholders Meeting
of May 10, 2017, the Company is authorized to purchase own
shares until May 9, 2022. The shares purchased, combined with
other treasury shares in the possession of the Company, or
attributable to the Company pursuant to Sections 71a et seq.
AktG, may at no time exceed 10 percent of its capital stock. The
Management Board was authorized at the aforementioned
Annual Shareholders Meeting to cancel any shares thus acquired
without requiring a separate shareholder resolution for the can-
cellation or its implementation. The total number of outstanding
shares as of December 31, 2018, was 2,167,149,433 (Decem-
ber 31, 2017: 2,167,149,433). As of December 31, 2018, E.ON SE
held a total of 33,949,567 treasury shares (December 31, 2017:
33,949,567) having a book value of €1,126 million (equivalent
to 1.54 percent or €33,949,567 of the capital stock).
The Company has further been authorized by the Annual Share-
holders Meeting to buy shares using put or call options, or a
combination of both. When derivatives in the form of put or call
options, or a combination of both, are used to acquire shares,
the option transactions must be conducted with a financial insti-
tution or a company operating in accordance with Section 53 (1)
sentence 1 or Section 53b (1) sentence 1 or 7 of the German
Banking Act (KWG) or at market terms on the stock exchange.
No shares were acquired in 2018 using this purchase model.
Neither a scrip dividend nor an employee stock purchase program
was offered in the 2018 fiscal year.
Liquid Funds
€ in millions
December 31,
2018 2017
Securities and fixed-term deposits 774 670
Current securities with an
original maturity greater than 3 months 774 647
Fixed-term deposits with an
original maturity greater than 3 months – 23
Restricted cash and cash equivalents 659 1,782
Cash and cash equivalents 3,924 2,708
Total 5,357 5,160
170Notes
of the capital increase and its entry in the commercial register
of E.ON SE. With the approval of the Supervisory Board, the
Management Board has made use of the option granted to it by
the Annual Shareholders Meeting to exclude subscription rights
in the case of capital increases against contributions in kind.
Conditional Capital
At the Annual Shareholders Meeting of May 10, 2017, share-
holders approved a conditional increase of the capital stock (with
the option to exclude shareholders’ subscription rights) in the
amount of up to €175 million.
The conditional capital increase will be used to grant registered
no-par value shares to the holders of convertible bonds or bonds
with warrants, profit participation rights or income bonds (or
combinations of these instruments), in each case with option
rights, conversion rights, option obligations and/or conversion
obligations, which are issued by the Company or a group com-
pany of the Company as defined by Section 18 of the German
Stock Corporation Act (AktG), under the authorization approved
by the Annual Shareholders Meeting on May 10, 2017, under
agenda item 9, through May 9, 2022. The new shares will be
issued at the conversion or option price to be determined in
accordance with the authorization resolution.
The conditional capital increase will be implemented only to the
extent required to fulfill the obligations arising on the exercise
by holders of option or conversion rights, and those arising from
compliance with the mandatory conversion of bonds with con-
version or option rights, profit participation rights or profit par-
ticipating bonds that have been issued or guaranteed by E.ON SE
or a Group company of E.ON SE as defined by Section 18 AktG
under the authorization approved by the Annual Shareholders
meeting of May 10, 2017, under agenda item 9, and to the
extent that no cash settlement has been granted in lieu of con-
version or exercise of an option.
The Conditional Capital 2017 was not used.
Authorized Capital
By shareholder resolution adopted at the Annual Shareholders
Meeting of May 10, 2017, the Management Board was autho-
rized, subject to the Supervisory Board’s approval, to increase
until May 9, 2022, the Company’s capital stock by a total of up
to €460 million through one or more issuances of new registered
no-par-value shares against contributions in cash and/or in
kind (authorized capital pursuant to Sections 202 et seq. AktG,
Authorized Capital 2017).
Subject to the Supervisory Board’s approval, the Management
Board is authorized to exclude shareholders’ subscription rights.
By the resolution that took effect on March 12, 2018, the Man-
agement Board resolved, with the approval of the Supervisory
Board, to make almost full use of the Authorized Capital 2017
resolved by the Annual Shareholders Meeting of May 10, 2017,
and to increase the share capital of E.ON SE, excluding share-
holder subscription rights, in accordance with Sections 203 (2)
and 186 (3) of the German Stock Corporation Act (AktG), from
€2,201,099,000 by €440,219,800 to €2,641,318,800 through
the issue of 440,219,800 new registered shares with no par
value, against contributions in kind.
Only RWE Downstream Beteiligungs GmbH, with its registered
office in Essen and registered in the commercial register of
Essen District Court under number HRB 26911, was permitted
to subscribe for and acquire the new shares. RWE Downstream
Beteiligungs GmbH is a wholly-owned subsidiary of RWE AG.
The object of the contribution in kind is the contribution of a total
of 100,714,051 no-par value bearer shares (shares without par
value) in innogy SE, Essen, registered in the Commercial Register
of Essen District Court under number HRB 27091, with a pro
rata amount of the share capital of €2.00 each by way of trans-
fer of ownership by RWE Downstream Beteiligungs GmbH to
E.ON SE. Application has not yet been made for registration of
the capital increase and its entry in the commercial register.
Application will be made after the occurrence of certain condi-
tions precedent, in particular the necessary antitrust approvals
of the entire transaction. The capital increase and the issue of
the new shares will only become effective upon implementation

171CEO Letter
Report of the Supervisory Board
E.ON Stock
Strategy and Objectives
Combined Group Management Report
Combined Non-Financial Report
Consolidated Financial Statements
Further Information
(21) Retained Earnings
The following table breaks down the E.ON Group’s retained
earnings as of the dates indicated:
Under German securities law, E.ON SE shareholders may
receive distributions from the balance sheet profit of E.ON SE
reported as available for distribution in accordance with the
German Commercial Code.
As of December 31, 2018, these German-GAAP retained earnings
totaled €2,554 million (2017: €1,884 million). Of this amount,
legal reserves of €45 million (2017: €45 million) are restricted
pursuant to Section 150 (3) and (4) AktG.
The amount of retained earnings available for distribution is
€2,509 million (2017: €1,839 million).
A proposal to distribute a cash dividend for 2018 of €0.43 per
share will be submitted to the Annual Shareholders Meeting. For
2017, shareholders at the May 9, 2018, Annual Shareholders
Meeting voted to distribute a dividend of €0.30 for each dividend-
paying ordinary share. Based on a €0.43 dividend, the total profit
distribution is €932 million (2017: €650 million).
Voting Rights
The following notices pursuant to Section 33 (1) of the German
Securities Trading Act (“WpHG”) concerning changes in voting
rights have been received since the beginning of 2018:
(20) Additional Paid-in Capital
Additional paid-in capital was unchanged during 2018, at
€9,862 million (2017: €9,862 million).
Information on Stockholders of E.ON SE
Reporting entity Date of notice
Threshold
exceeded
Over and
under
Gained voting
rights on Allocation
Voting rights
Percentages Absolute
Norwegian Ministry of Finance,
Oslo, Norway 1 Feb. 9, 2018 3% under Feb. 8, 2018 indirect 2.96 65,045,991
Amundi S.A., Paris, France 2 May 2, 2018 3% under Apr. 27, 2018 indirect 2.93 64,505,533
BlackRock Inc., Wilmington, U.S. Aug. 2, 2018 5% over Jul. 30, 2018 indirect 6.50 143,099,216
Canada Pension Plan Investment
Board, Toronto, Canada Oct. 4, 2018 3% over Sep. 27, 2018 direct/indirect 3.13 68,831,843
Capital Income Builder,
Wilmington, U.S. Nov. 13, 2018 3% over Nov. 8, 2018 direct 3.04 66,805,993
The Capital Group Companies
Inc., Los Angeles, U.S. Jan. 31, 2019 5% over Jan. 28, 2019 indirect 5.01 110,324,229
1The threshold of 3.0 percent was exceeded on February 7, 2018.2The threshold of 3.0 percent was exceeded on April 24, 2018.
Retained Earnings
€ in millions
December 31,
2018 2017
Legal reserves 45 45
Other retained earnings -2,506 -4,597
Total -2,461 -4,552
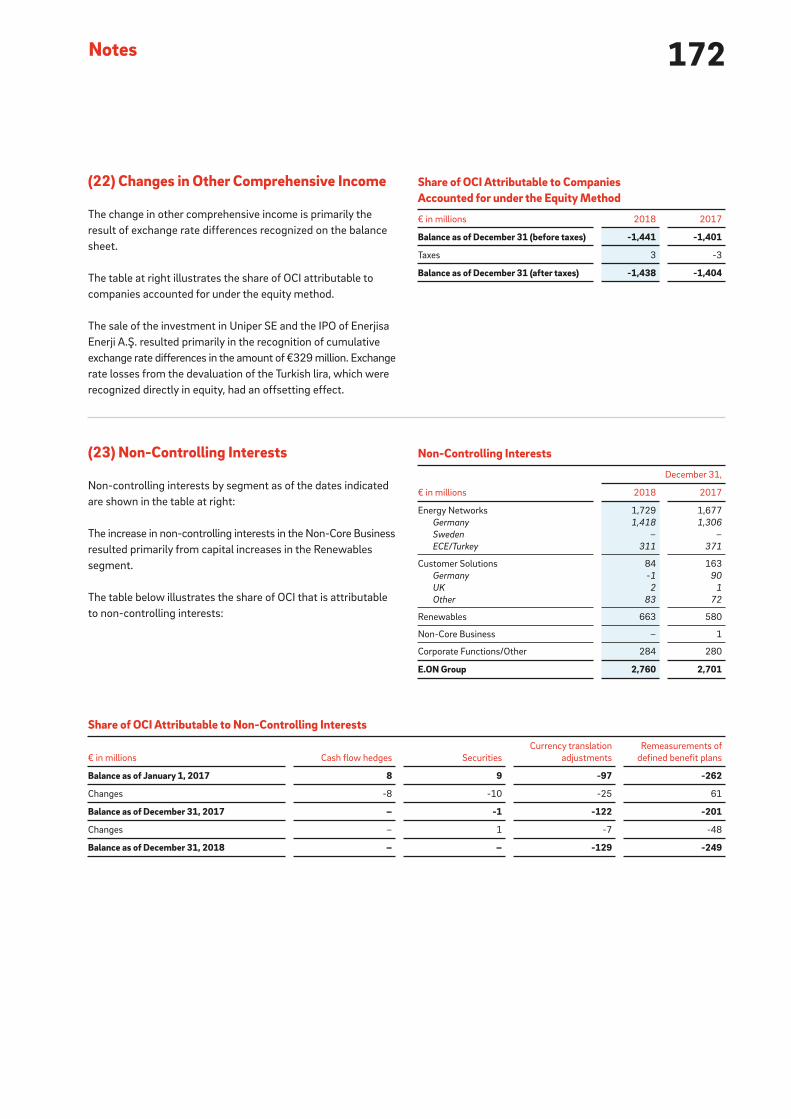
172Notes
(23) Non-Controlling Interests
Non-controlling interests by segment as of the dates indicated
are shown in the table at right:
The increase in non-controlling interests in the Non-Core Business
resulted primarily from capital increases in the Renewables
segment.
The table below illustrates the share of OCI that is attributable
to non-controlling interests:
Non-Controlling Interests
€ in millions
December 31,
2018 2017
Energy Networks 1,729 1,677
Germany 1,418 1,306
Sweden – –
ECE/Turkey 311 371
Customer Solutions 84 163
Germany -1 90
UK 2 1
Other 83 72
Renewables 663 580
Non-Core Business – 1
Corporate Functions/Other 284 280
E.ON Group 2,760 2,701
Share of OCI Attributable to Non-Controlling Interests
€ in millions Cash flow hedges
Securities
Currency translation
adjustments
Remeasurements of
defined benefit plans
Balance as of January 1, 2017 8 9 -97 -262
Changes -8 -10 -25 61
Balance as of December 31, 2017 – -1 -122 -201
Changes – 1 -7 -48
Balance as of December 31, 2018 – – -129 -249
(22) Changes in Other Comprehensive Income
The change in other comprehensive income is primarily the
result of exchange rate differences recognized on the balance
sheet.
The table at right illustrates the share of OCI attributable to
companies accounted for under the equity method.
The sale of the investment in Uniper SE and the IPO of Enerjisa
Enerji A.Ş. resulted primarily in the recognition of cumulative
exchange rate differences in the amount of €329 million. Exchange
rate losses from the devaluation of the Turkish lira, which were
recognized directly in equity, had an offsetting effect.
Share of OCI Attributable to Companies Accounted for under the Equity Method
€ in millions 2018 2017
Balance as of December 31 (before taxes) -1,441 -1,401
Taxes 3 -3
Balance as of December 31 (after taxes) -1,438 -1,404

173CEO Letter
Report of the Supervisory Board
E.ON Stock
Strategy and Objectives
Combined Group Management Report
Combined Non-Financial Report
Consolidated Financial Statements
Further Information
In compliance with IFRS 12, the following tables include sub-
sidiaries with significant non-controlling interests and provide an
overview of significant items on the aggregated balance sheet
and on the aggregated income statement, and significant cash
flow items. The list of shareholdings pursuant to Section 313 (2)
HGB (see Note 35) contains information on the registered office
of the company and disclosures on equity interests.
There are no major restrictions beyond those under customary
corporate or contractual provisions.
Subsidiaries with Material Non-Controlling Interests—Balance Sheet Data as of December 31
€ in millions
Delgaz Grid S.A. E.DIS AG 1 Avacon AG 1Schleswig-Holstein
Netz AG
2018 2017 2018 2017 2018 2017 2018 2017
Non-controlling interests in equity 311 371 517 504 557 568 241 227
Non-controlling interests in equity (in %) 43.5 43.5 33.0 33.0 38.5 38.5 48.5 48.1
Dividends paid out to non-controlling interests 86 31 33 33 58 74 – –
Operating cash flow 104 121 -42 12 -97 -68 228 167
Non-current assets 1,053 986 1,483 1,505 1,621 1,652 1,460 1,414
Current assets 103 118 192 268 236 314 329 326
Non-current liabilities 411 236 9 12 75 107 464 470
Current liabilities 125 111 64 191 257 294 722 683
1Holding Company without operational business.
Subsidiaries with Material Non-Controlling Interests—Earnings Data
€ in millions
Delgaz Grid S.A. E.DIS AG 1 Avacon AG 1Schleswig-Holstein
Netz AG
2018 2017 2018 2017 2018 2017 2018 2017
Share of earnings attributable to
non-controlling interests 26 34 47 56 24 82 33 6
Sales 390 398 2 1 12 12 912 2,540
Net income/loss 61 85 134 158 87 238 66 11
Comprehensive Income 61 63 132 160 84 248 22 22
1Holding Company without operational business.

174Notes
€1.1 billion that did not constitute plan assets under IAS 19 but
which were also primarily intended for the hedging of retirement
benefit obligations at E.ON Group companies in Germany (see
Note 31). In the first quarter of 2018, the assets were transferred
to the Contractual Trust Arrangement (CTA) for the affected
Group companies and thus additional plan assets were created.
The present value of the defined benefit obligations, the fair
value of plan assets and the net defined benefit liability (funded
status) compared to the prior year are presented below:
(24) Provisions for Pensions and Similar Obligations
The retirement benefit obligations toward the active and former
employees of the E.ON Group, which amounted to €15.3 billion,
were covered by plan assets having a fair value of €12.1 billion
as of December 31, 2018. This corresponds to a funded status
of 79 percent.
Until the beginning of the 2018 fiscal year, Versorgungskasse
Energie VVaG i.L. (VKE i.L.), which is included in the Consolidated
Financial Statements, administered a fund holding assets of
Provisions for Pensions and Similar Obligations
€ in millions
December 31,
2018 2017
Present value of all defined benefit obligations
Germany 10,180 9,979
United Kingdom 5,080 5,690
Other countries 41 44
Total 15,301 15,713
Fair value of plan assets
Germany 7,164 6,945
United Kingdom 4,880 5,137
Other countries 10 11
Total 12,054 12,093
Net defined benefit liability/asset (-)
Germany 3,016 3,034
United Kingdom 200 553
Other countries 31 33
Total 3,247 3,620

175CEO Letter
Report of the Supervisory Board
E.ON Stock
Strategy and Objectives
Combined Group Management Report
Combined Non-Financial Report
Consolidated Financial Statements
Further Information
Description of the Benefit Plans
In addition to their entitlements under government retirement
systems and the income from private retirement planning, most
active and former E.ON Group employees are also covered by
occupational benefit plans. Both defined benefit plans and defined
contribution plans are in place at E.ON. Benefits under defined
benefit plans are generally paid upon reaching retirement age,
or in the event of disability or death.
E.ON regularly reviews the pension plans in place within the
Group for financial risks. Typical risk factors for defined benefit
plans are longevity and changes in nominal interest rates, as well
as inflation developments and rising wages and salaries. In order
to avoid exposure to future risks from occupational benefit plans,
newly designed pension plans were introduced at the major
German and foreign E.ON Group companies beginning in 1998.
The existing entitlements under defined benefit plans as of the
balance sheet date cover about 47,000 retirees and their bene-
ficiaries (2017: 48,000), about 14,000 former employees with
vested entitlements (2017: 14,000) and about 28,000 active
employees (2017: 27,000). The corresponding present value of
the defined benefit obligations is attributable to retirees and their
beneficiaries in the amount of €9.2 billion (2017: €9.3 billion),
to former employees with vested entitlements in the amount of
€2.4 billion (2017: €2.5 billion) and to active employees in the
amount of €3.7 billion (2017: €3.9 billion).
The features and risks of defined benefit plans are shaped by
the general legal, tax and regulatory conditions prevailing in
the respective country. The configurations of the major defined
benefit and defined contribution plans within the E.ON Group
are described in the following discussion.
GermanyActive employees at the German Group companies are predom-
inantly covered by cash balance plans. In addition, some final-pay
arrangements, and a small number of fixed-amount arrangements,
still exist under individual contracts.
The majority of the reported benefit obligation toward active
employees is centered on the “BAS Plan,” a pension unit system
launched in 2001, and on a “provision for the future” (“Zukunfts-
sicherung”) plan, a variant of the BAS Plan that emerged from
the harmonization in 2004 of numerous benefit plans granted
in the past. In the “Zukunftssicherung” benefit plan, vested
final-pay entitlements are considered in addition to the defined
contribution pension units when determining the benefit. These
plans are closed to new hires.
The plans described in the preceding paragraph generally provide
for ongoing pension benefits that generally are payable upon
reaching the age threshold, or in the event of disability or death.
The only benefit plan open to new hires is the E.ON IQ contribu-
tion plan (the “IQ Plan”). This plan is a “units of capital” system
that provides for the alternative payout options of a prorated
single payment and payments of installments in addition to the
payment of a regular pension.
The benefit expense for all the cash balance plans mentioned
above is dependent on compensation and is determined at differ-
ent percentage rates based on the ratio between compensation
and the contribution limit in the statutory retirement pension
system in Germany. Through December 31, 2016, the cash
balance plans contained different interest rate assumptions for
the pension and capital units. Since January 1, 2017, a standard-
ized interest rate model has been used for the BAS Plan, the
176Notes
Benefit payments to the beneficiaries of the currently existing
defined benefit pension plans are adjusted for inflation on a lim-
ited basis.
Plan assets in the United Kingdom are administered in a pension
trust. The trustees are selected by the members of the plan or
appointed by the entity. In that capacity, the trustees are partic-
ularly responsible for the investment of the plan assets.
The Pensions Regulator in the United Kingdom requires that
a so-called “technical valuation” of the plan’s funding status be
performed every three years. The actuarial assumptions under-
lying the valuation are agreed upon by the trustees and E.ON
UK plc. They include presumed life expectancy, wage and salary
growth rates, investment returns, inflationary assumptions and
interest rate levels. The most recent completed technical valuation
took place as of March 31, 2015, and resulted in a technical
funding deficit of £967 million. In the framework of the agreed
deficit repair plan, annual payments of £65 million will be made
to the pension trust through 2026. The remeasurement of the
technical funding status was begun on the measurement date
of March 31, 2018, and was not yet completed as of the report-
ing date.
Other CountriesThe remaining pension obligations are spread across various
international activities of the E.ON Group.
However, these benefit plans in Sweden, Romania, the Czech
Republic, Italy and the United States are of minor significance
from a Group perspective.
“Zukunftssicherung” plan and the IQ plan, in which the interest
rate is adjusted to market developments and hedged via mini-
mum interest rates. The pension units for previous years remain
in place unchanged. Based on market developments, an annual
determination is made as to whether the minimum interest rates
or possibly a higher interest rate is used for the formation of
pension or capital units. Future pension increases at a rate of
1 percent are guaranteed for a large number of active employees.
For the remaining eligible individuals, pensions are adjusted mostly
in line with the rate of inflation, usually in a three-year cycle.
To fund the pension plans for the German Group companies,
plan assets were established in the form of Contractual Trust
Arrangements (“CTAs”). The major part of these plan assets is
administered by E.ON Pension Trust e.V. as trustee in accordance
with specified investment principles. Additional domestic plan
assets are managed by smaller German pension funds.
Only at the pension funds and for the assets formerly adminis-
tered by VKE i.L. and now transferred to the CTA do regulatory
provisions, or contractual provisions based on those regulatory
provisions, exist in relation to capital investment or funding
requirements.
United KingdomIn the United Kingdom, there are various pension plans. Until
2005 and 2008, respectively, employees were covered by
defined benefit plans, which for the most part were final-pay
plans and make up the majority of the pension obligations
currently reported for the United Kingdom. These plans were
closed to employees newly hired after these dates. Since then,
new hires are offered a defined contribution plan. Aside from the
payment of contributions, this plan entails no additional actuarial
risks for the employer.
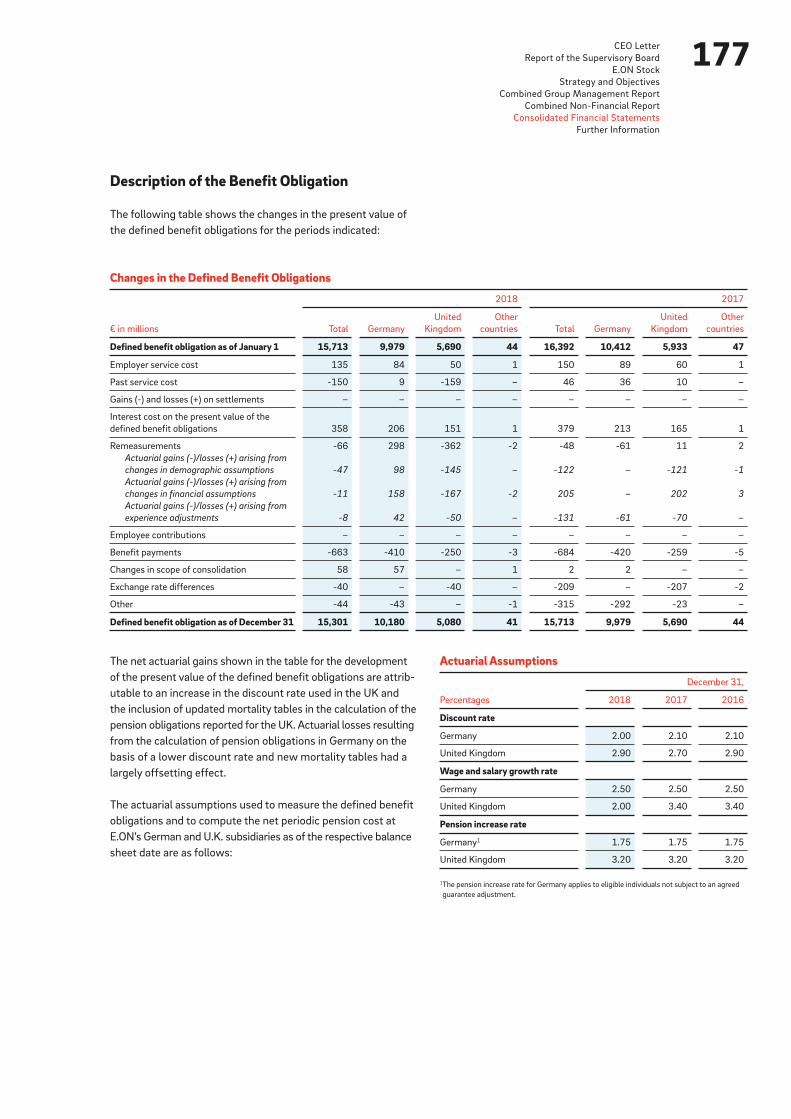
177CEO Letter
Report of the Supervisory Board
E.ON Stock
Strategy and Objectives
Combined Group Management Report
Combined Non-Financial Report
Consolidated Financial Statements
Further Information
Description of the Benefit Obligation
The following table shows the changes in the present value of
the defined benefit obligations for the periods indicated:
The net actuarial gains shown in the table for the development
of the present value of the defined benefit obligations are attrib-
utable to an increase in the discount rate used in the UK and
the inclusion of updated mortality tables in the calculation of the
pension obligations reported for the UK. Actuarial losses resulting
from the calculation of pension obligations in Germany on the
basis of a lower discount rate and new mortality tables had a
largely offsetting effect.
The actuarial assumptions used to measure the defined benefit
obligations and to compute the net periodic pension cost at
E.ON’s German and U.K. subsidiaries as of the respective balance
sheet date are as follows:
Changes in the Defined Benefit Obligations
€ in millions
2018 2017
Total Germany
United
Kingdom
Other
countries Total Germany
United
Kingdom
Other
countries
Defined benefit obligation as of January 1 15,713 9,979 5,690 44 16,392 10,412 5,933 47
Employer service cost 135 84 50 1 150 89 60 1
Past service cost -150 9 -159 – 46 36 10 –
Gains (-) and losses (+) on settlements – – – – – – – –
Interest cost on the present value of the
defined benefit obligations 358 206 151 1 379 213 165 1
Remeasurements -66 298 -362 -2 -48 -61 11 2
Actuarial gains (-)/losses (+) arising from
changes in demographic assumptions -47 98 -145 – -122 – -121 -1
Actuarial gains (-)/losses (+) arising from
changes in financial assumptions -11 158 -167 -2 205 – 202 3
Actuarial gains (-)/losses (+) arising from
experience adjustments -8 42 -50 – -131 -61 -70 –
Employee contributions – – – – – – – –
Benefit payments -663 -410 -250 -3 -684 -420 -259 -5
Changes in scope of consolidation 58 57 – 1 2 2 – –
Exchange rate differences -40 – -40 – -209 – -207 -2
Other -44 -43 – -1 -315 -292 -23 –
Defined benefit obligation as of December 31 15,301 10,180 5,080 41 15,713 9,979 5,690 44
Actuarial Assumptions
Percentages
December 31,
2018 2017 2016
Discount rate
Germany 2.00 2.10 2.10
United Kingdom 2.90 2.70 2.90
Wage and salary growth rate
Germany 2.50 2.50 2.50
United Kingdom 2.00 3.40 3.40
Pension increase rate
Germany 1 1.75 1.75 1.75
United Kingdom 3.20 3.20 3.20
1The pension increase rate for Germany applies to eligible individuals not subject to an agreed
guarantee adjustment.

178Notes
Changes in the actuarial assumptions described previously
would lead to the following changes in the present value of the
defined benefit obligations:
The discount rate assumptions used by E.ON reflect the
currency-specific rates available at the end of the respective
fiscal year for high-quality corporate bonds with a duration cor-
responding to the average period to maturity of the respective
obligation.
To measure the E.ON Group’s occupational pension obligations
for accounting purposes, the Company has employed the
current versions of the biometric tables recognized in each
respective country for the calculation of pension obligations:
A 10-percent decrease in mortality would result in a higher life
expectancy of beneficiaries, depending on the age of each indi-
vidual beneficiary. As of December 31, 2018, the life expectancy
of a 63-year-old male E.ON retiree would increase by approxi-
mately one year if mortality were to decrease by 10 percent.
The sensitivities indicated are computed based on the same
methods and assumptions used to determine the present
value of the defined benefit obligations. If one of the actuarial
assumptions is changed for the purpose of computing the sensi-
tivity of results to changes in that assumption, all other actuarial
assumptions are included in the computation unchanged.
When considering sensitivities, it must be noted that the change
in the present value of the defined benefit obligations resulting
from changing multiple actuarial assumptions simultaneously
is not necessarily equivalent to the cumulative effect of the
individual sensitivities.
Actuarial Assumptions (Mortality Tables)
Germany 2018 G versions of the Heubeck biometric tables
(2018)
United Kingdom “S2” series base mortality tables with the CMI 2017
projection model for future improvements
Sensitivities
Change in the present value of the defined benefit obligations
December 31, 2018 December 31, 2017
Change in the discount rate by (basis points) +50 -50 +50 -50
Change in percent -7.35 8.34 -7.77 8.69
Change in the wage and salary growth rate by (basis points) +25 -25 +25 -25
Change in percent 0.25 -0.24 0.33 -0.32
Change in the pension increase rate by (basis points) +25 -25 +25 -25
Change in percent 1.72 -1.66 1.89 -1.85
Change in mortality by (percent) +10 -10 +10 -10
Change in percent -3.16 3.54 -3.14 3.51
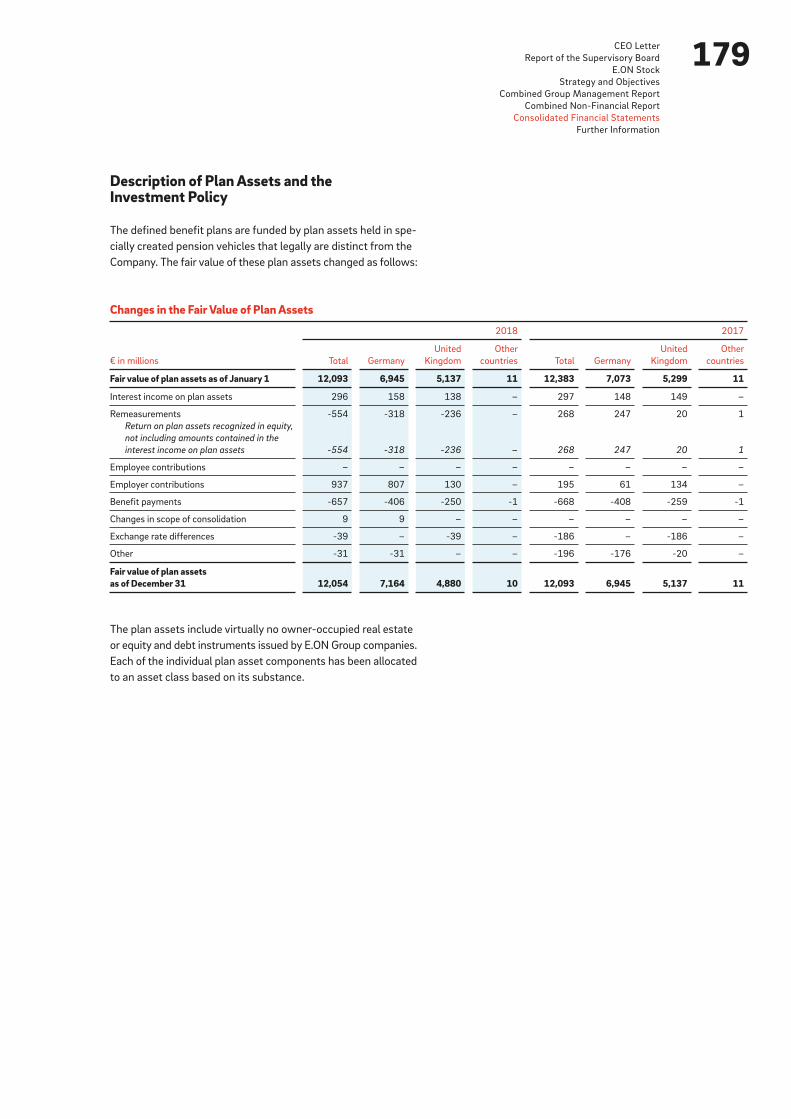
179CEO Letter
Report of the Supervisory Board
E.ON Stock
Strategy and Objectives
Combined Group Management Report
Combined Non-Financial Report
Consolidated Financial Statements
Further Information
Description of Plan Assets and the Investment Policy
The defined benefit plans are funded by plan assets held in spe-
cially created pension vehicles that legally are distinct from the
Company. The fair value of these plan assets changed as follows:
The plan assets include virtually no owner-occupied real estate
or equity and debt instruments issued by E.ON Group companies.
Each of the individual plan asset components has been allocated
to an asset class based on its substance.
Changes in the Fair Value of Plan Assets
€ in millions
2018 2017
Total Germany
United
Kingdom
Other
countries Total Germany
United
Kingdom
Other
countries
Fair value of plan assets as of January 1 12,093 6,945 5,137 11 12,383 7,073 5,299 11
Interest income on plan assets 296 158 138 – 297 148 149 –
Remeasurements -554 -318 -236 – 268 247 20 1
Return on plan assets recognized in equity,
not including amounts contained in the
interest income on plan assets -554 -318 -236 – 268 247 20 1
Employee contributions – – – – – – – –
Employer contributions 937 807 130 – 195 61 134 –
Benefit payments -657 -406 -250 -1 -668 -408 -259 -1
Changes in scope of consolidation 9 9 – – – – – –
Exchange rate differences -39 – -39 – -186 – -186 –
Other -31 -31 – – -196 -176 -20 –
Fair value of plan assets as of December 31 12,054 7,164 4,880 10 12,093 6,945 5,137 11

180Notes
of the defined benefit obligations is identified in these guidelines
as a risk that is controlled as part of a risk-budgeting concept.
E.ON therefore regularly reviews the development of the funded
status in order to monitor this risk.
The fundamental investment objective for the plan assets is
to provide full coverage of benefit obligations at all times for
the payments due under the corresponding benefit plans. This
investment policy stems from the corresponding governance
guidelines of the Group. An increase in the net defined benefit
liability or a deterioration in the funded status following an
unfavorable development in plan assets or in the present value
The plan assets thus classified break down as shown in the
following table:
Classification of Plan Assets
Percentages
December 31, 2018 December 31, 2017
Total Germany
United
Kingdom
Other
countries Total Germany
United
Kingdom
Other
countries
Plan assets listed in an active market
Equity securities (stocks) 17 19 14 – 18 22 13 –
Debt securities 1 46 45 49 – 51 47 55 –
Government bonds 34 26 47 – 35 27 46 –
Corporate bonds 8 12 2 – 11 13 9 –
Other investment funds 18 6 34 – 16 6 30 –
Total listed plan assets 81 70 97 – 85 75 98 –
Plan assets not listed in an active market
Equity securities not traded on an exchange 5 6 3 – 4 6 2 –
Debt securities – – – – 1 2 – –
Real estate 7 11 – – 4 6 – –
Qualifying insurance policies – – – 100 2 4 – 100
Cash and cash equivalents 5 9 – – 2 3 – –
Other 2 4 – – 2 4 – –
Total unlisted plan assets 19 30 3 100 15 25 2 100
Total 100 100 100 100 100 100 100 100
1In Germany, 7 percent (2017: 7 percent) of plan assets are invested in other debt securities, in particular mortgage bonds (“Pfandbriefe”), in addition to government and corporate bonds.
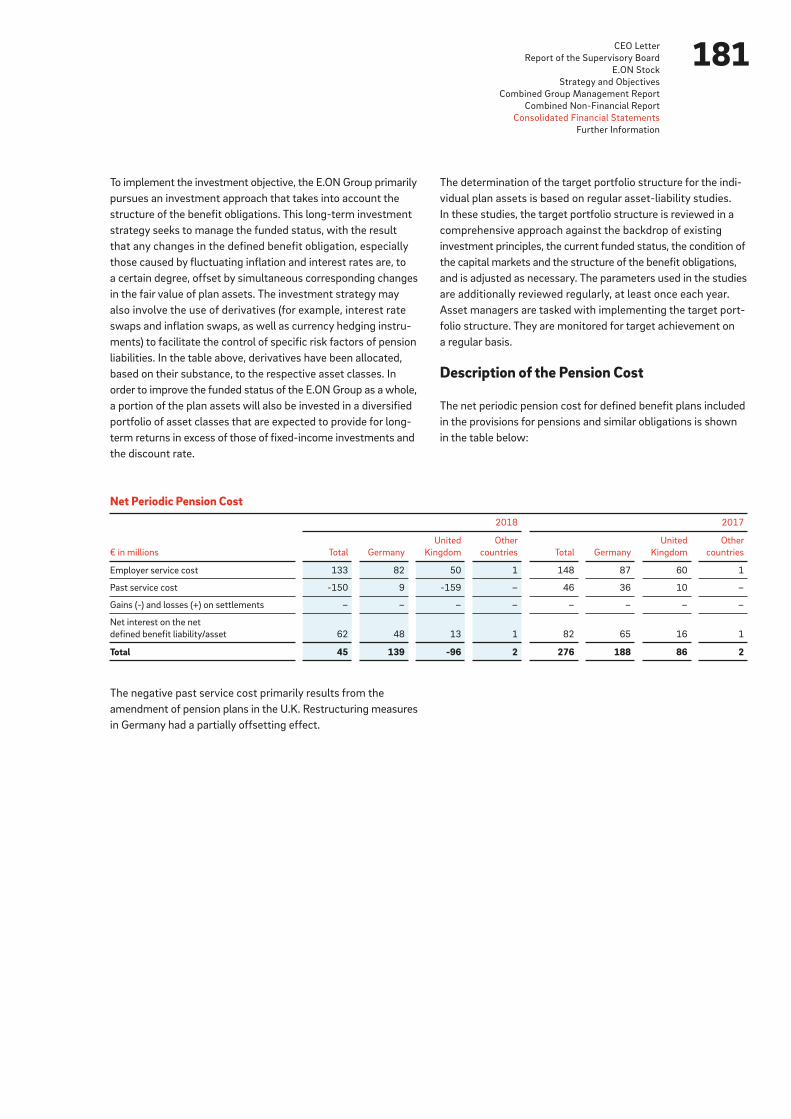
181CEO Letter
Report of the Supervisory Board
E.ON Stock
Strategy and Objectives
Combined Group Management Report
Combined Non-Financial Report
Consolidated Financial Statements
Further Information
To implement the investment objective, the E.ON Group primarily
pursues an investment approach that takes into account the
structure of the benefit obligations. This long-term investment
strategy seeks to manage the funded status, with the result
that any changes in the defined benefit obli gation, especially
those caused by fluctuating inflation and interest rates are, to
a certain degree, offset by simultaneous corresponding changes
in the fair value of plan assets. The investment strategy may
also involve the use of derivatives (for example, interest rate
swaps and inflation swaps, as well as currency hedging instru-
ments) to facilitate the control of specific risk factors of pension
liabilities. In the table above, derivatives have been allocated,
based on their substance, to the respective asset classes. In
order to improve the funded status of the E.ON Group as a whole,
a portion of the plan assets will also be invested in a diversified
portfolio of asset classes that are expected to provide for long-
term returns in excess of those of fixed-income investments and
the discount rate.
The negative past service cost primarily results from the
amendment of pension plans in the U.K. Restructuring measures
in Germany had a partially offsetting effect.
Net Periodic Pension Cost
€ in millions
2018 2017
Total Germany
United
Kingdom
Other
countries Total Germany
United
Kingdom
Other
countries
Employer service cost 133 82 50 1 148 87 60 1
Past service cost -150 9 -159 – 46 36 10 –
Gains (-) and losses (+) on settlements – – – – – – – –
Net interest on the net
defined benefit liability/asset 62 48 13 1 82 65 16 1
Total 45 139 -96 2 276 188 86 2
The determination of the target portfolio structure for the indi-
vidual plan assets is based on regular asset-liability studies.
In these studies, the target portfolio structure is reviewed in a
comprehensive approach against the backdrop of existing
investment principles, the current funded status, the condition of
the capital markets and the structure of the bene fit obligations,
and is adjusted as necessary. The parameters used in the studies
are additionally reviewed regularly, at least once each year.
Asset managers are tasked with implementing the target port-
folio structure. They are monitored for target achievement on
a regular basis.
Description of the Pension Cost
The net periodic pension cost for defined benefit plans included
in the provisions for pensions and similar obligations is shown
in the table below:
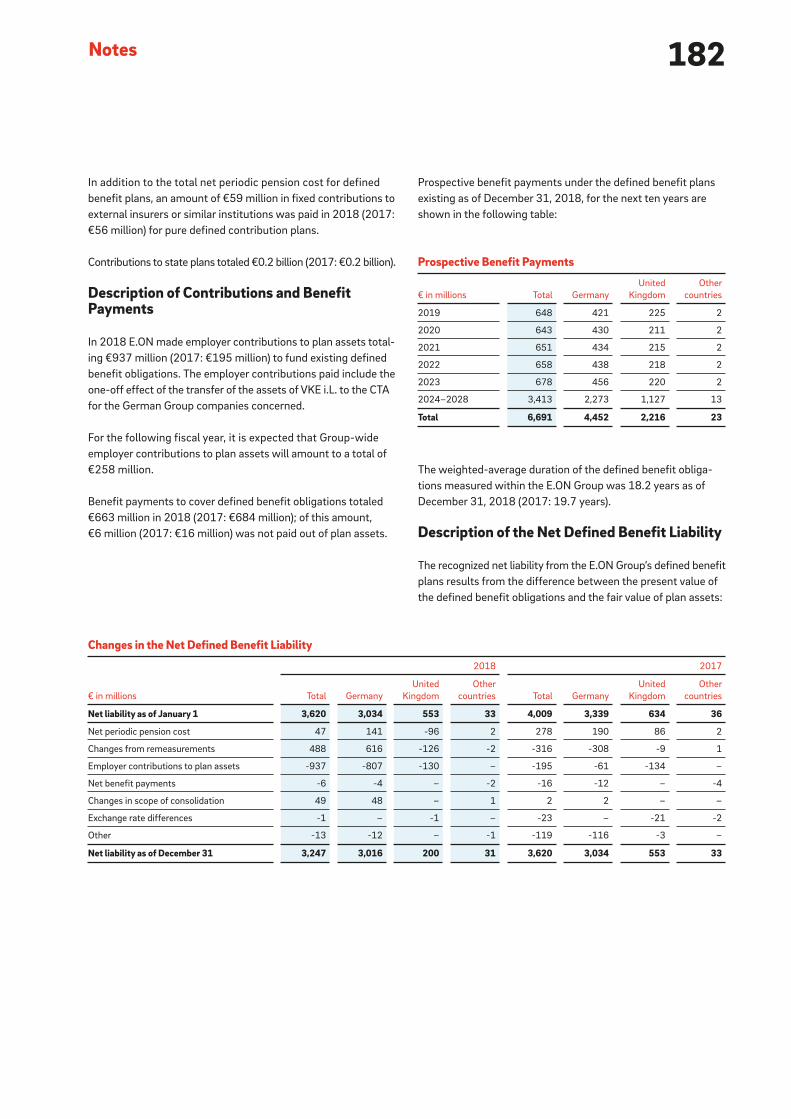
182Notes
In addition to the total net periodic pension cost for defined
benefit plans, an amount of €59 million in fixed contributions to
external insurers or similar institutions was paid in 2018 (2017:
€56 million) for pure defined contribution plans.
Contributions to state plans totaled €0.2 billion (2017: €0.2 billion).
Description of Contributions and Benefit Payments
In 2018 E.ON made employer contributions to plan assets total-
ing €937 million (2017: €195 million) to fund existing defined
benefit obligations. The employer contributions paid include the
one-off effect of the transfer of the assets of VKE i.L. to the CTA
for the German Group companies concerned.
For the following fiscal year, it is expected that Group-wide
employer contributions to plan assets will amount to a total of
€258 million.
Benefit payments to cover defined benefit obligations totaled
€663 million in 2018 (2017: €684 million); of this amount,
€6 million (2017: €16 million) was not paid out of plan assets.
Changes in the Net Defined Benefit Liability
€ in millions
2018 2017
Total Germany
United
Kingdom
Other
countries Total Germany
United
Kingdom
Other
countries
Net liability as of January 1 3,620 3,034 553 33 4,009 3,339 634 36
Net periodic pension cost 47 141 -96 2 278 190 86 2
Changes from remeasurements 488 616 -126 -2 -316 -308 -9 1
Employer contributions to plan assets -937 -807 -130 – -195 -61 -134 –
Net benefit payments -6 -4 – -2 -16 -12 – -4
Changes in scope of consolidation 49 48 – 1 2 2 – –
Exchange rate differences -1 – -1 – -23 – -21 -2
Other -13 -12 – -1 -119 -116 -3 –
Net liability as of December 31 3,247 3,016 200 31 3,620 3,034 553 33
Prospective benefit payments under the defined benefit plans
existing as of December 31, 2018, for the next ten years are
shown in the following table:
The weighted-average duration of the defined benefit obliga-
tions measured within the E.ON Group was 18.2 years as of
December 31, 2018 (2017: 19.7 years).
Description of the Net Defined Benefit Liability
The recognized net liability from the E.ON Group’s defined benefit
plans results from the difference between the present value of
the defined benefit obligations and the fair value of plan assets:
Prospective Benefit Payments
€ in millions Total Germany
United
Kingdom
Other
countries
2019 648 421 225 2
2020 643 430 211 2
2021 651 434 215 2
2022 658 438 218 2
2023 678 456 220 2
2024–2028 3,413 2,273 1,127 13
Total 6,691 4,452 2,216 23
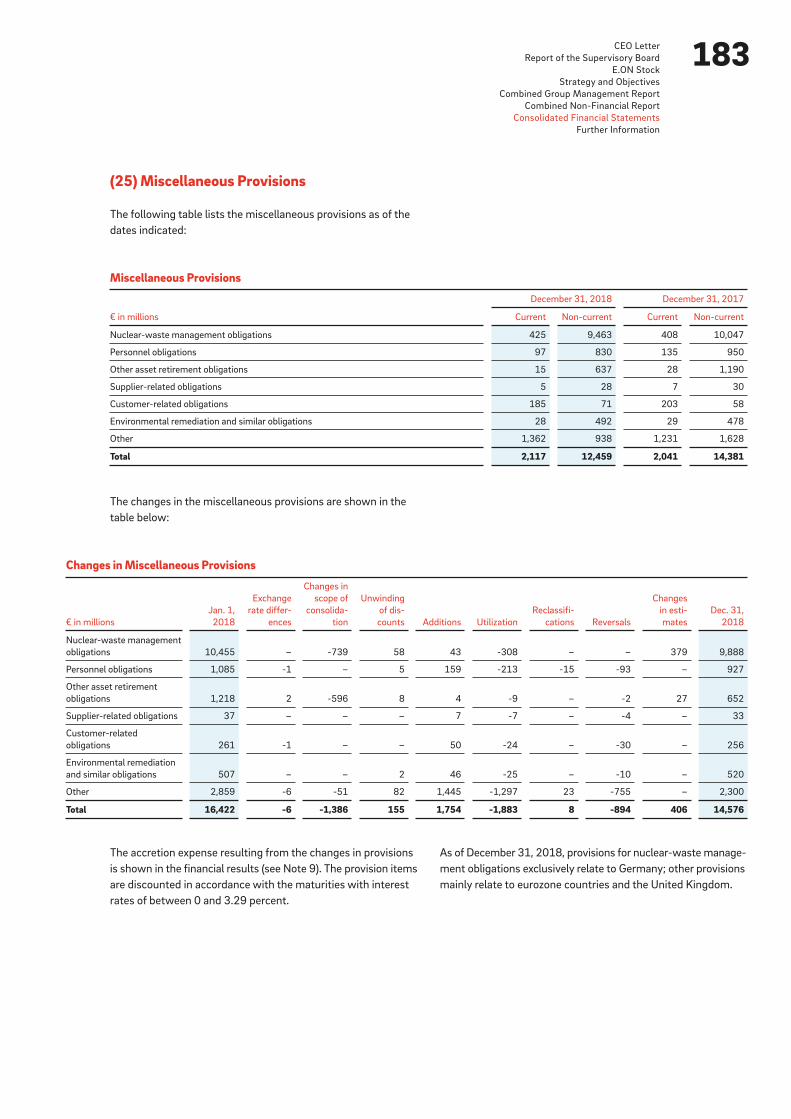
183CEO Letter
Report of the Supervisory Board
E.ON Stock
Strategy and Objectives
Combined Group Management Report
Combined Non-Financial Report
Consolidated Financial Statements
Further Information
(25) Miscellaneous Provisions
The following table lists the miscellaneous provisions as of the
dates indicated:
The changes in the miscellaneous provisions are shown in the
table below:
The accretion expense resulting from the changes in provisions
is shown in the financial results (see Note 9). The provision items
are discounted in accordance with the maturities with interest
rates of between 0 and 3.29 percent.
As of December 31, 2018, provisions for nuclear-waste manage-
ment obligations exclusively relate to Germany; other provisions
mainly relate to eurozone countries and the United Kingdom.
Changes in Miscellaneous Provisions
€ in millions
Jan. 1,
2018
Exchange
rate differ-
ences
Changes in
scope of
consolida-
tion
Unwinding
of dis-
counts Additions Utilization
Reclassifi-
cations Reversals
Changes
in esti-
mates
Dec. 31,
2018
Nuclear-waste management
obligations 10,455 – -739 58 43 -308 – – 379 9,888
Personnel obligations 1,085 -1 – 5 159 -213 -15 -93 – 927
Other asset retirement
obligations 1,218 2 -596 8 4 -9 – -2 27 652
Supplier-related obligations 37 – – – 7 -7 – -4 – 33
Customer-related
obligations 261 -1 – – 50 -24 – -30 – 256
Environmental remediation
and similar obligations 507 – – 2 46 -25 – -10 – 520
Other 2,859 -6 -51 82 1,445 -1,297 23 -755 – 2,300
Total 16,422 -6 -1,386 155 1,754 -1,883 8 -894 406 14,576
Miscellaneous Provisions
€ in millions
December 31, 2018 December 31, 2017
Current Non-current Current Non-current
Nuclear-waste management obligations 425 9,463 408 10,047
Personnel obligations 97 830 135 950
Other asset retirement obligations 15 637 28 1,190
Supplier-related obligations 5 28 7 30
Customer-related obligations 185 71 203 58
Environmental remediation and similar obligations 28 492 29 478
Other 1,362 938 1,231 1,628
Total 2,117 12,459 2,041 14,381
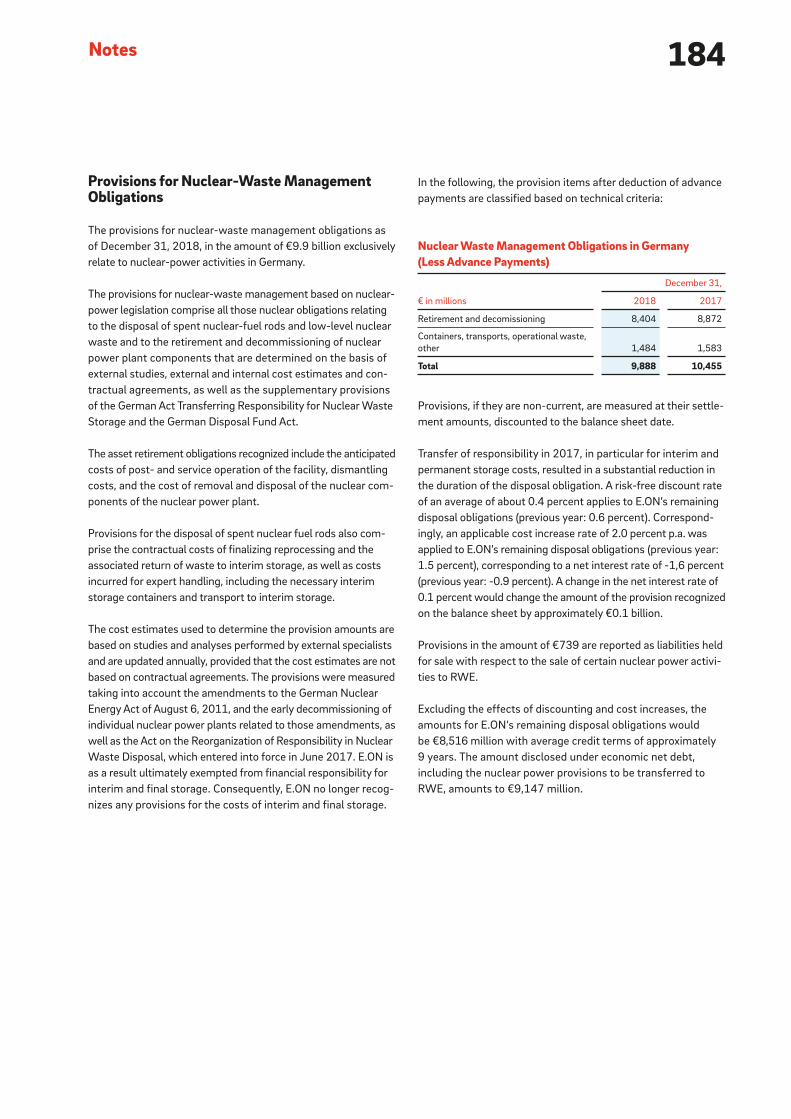
184Notes
Provisions for Nuclear-Waste Management Obligations
The provisions for nuclear-waste management obligations as
of December 31, 2018, in the amount of €9.9 billion exclusively
relate to nuclear-power activities in Germany.
The provisions for nuclear-waste management based on nuclear-
power legislation comprise all those nuclear obligations relating
to the disposal of spent nuclear-fuel rods and low-level nuclear
waste and to the retirement and decommissioning of nuclear
power plant components that are determined on the basis of
external studies, external and internal cost estimates and con-
tractual agreements, as well as the supplementary provisions
of the German Act Transferring Responsibility for Nuclear Waste
Storage and the German Disposal Fund Act.
The asset retirement obligations recognized include the anticipated
costs of post- and service operation of the facility, dismantling
costs, and the cost of removal and disposal of the nuclear com-
ponents of the nuclear power plant.
Provisions for the disposal of spent nuclear fuel rods also com-
prise the contractual costs of finalizing reprocessing and the
associated return of waste to interim storage, as well as costs
incurred for expert handling, including the necessary interim
storage containers and transport to interim storage.
The cost estimates used to determine the provision amounts are
based on studies and analyses performed by external specialists
and are updated annually, provided that the cost estimates are not
based on contractual agreements. The provisions were measured
taking into account the amendments to the German Nuclear
Energy Act of August 6, 2011, and the early decommissioning of
individual nuclear power plants related to those amendments, as
well as the Act on the Reorganization of Responsibility in Nuclear
Waste Disposal, which entered into force in June 2017. E.ON is
as a result ultimately exempted from financial responsibility for
interim and final storage. Consequently, E.ON no longer recog-
nizes any provisions for the costs of interim and final storage.
In the following, the provision items after deduction of advance
payments are classified based on technical criteria:
Provisions, if they are non-current, are measured at their settle-
ment amounts, discounted to the balance sheet date.
Transfer of responsibility in 2017, in particular for interim and
permanent storage costs, resulted in a substantial reduction in
the duration of the disposal obligation. A risk-free discount rate
of an average of about 0.4 percent applies to E.ON’s remaining
disposal obligations (previous year: 0.6 percent). Correspond-
ingly, an applicable cost increase rate of 2.0 percent p.a. was
applied to E.ON’s remaining disposal obligations (previous year:
1.5 percent), corresponding to a net interest rate of -1,6 percent
(previous year: -0.9 percent). A change in the net interest rate of
0.1 percent would change the amount of the provision recognized
on the balance sheet by approximately €0.1 billion.
Provisions in the amount of €739 are reported as liabilities held
for sale with respect to the sale of certain nuclear power activi-
ties to RWE.
Excluding the effects of discounting and cost increases, the
amounts for E.ON’s remaining disposal obligations would
be €8,516 million with average credit terms of approximately
9 years. The amount disclosed under economic net debt,
including the nuclear power provisions to be transferred to
RWE, amounts to €9,147 million.
Nuclear Waste Management Obligations in Germany (Less Advance Payments)
€ in millions
December 31,
2018 2017
Retirement and decomissioning 8,404 8,872
Containers, transports, operational waste,
other 1,484 1,583
Total 9,888 10,455
185CEO Letter
Report of the Supervisory Board
E.ON Stock
Strategy and Objectives
Combined Group Management Report
Combined Non-Financial Report
Consolidated Financial Statements
Further Information
There were changes in estimates for the remaining nuclear
power business in 2018 in the amount of €379 million (2017:
-€603 million). This mainly includes the effects of the imple-
mentation of the increase in the cost increase rate, the reduction
in the discount interest rate, with counteracting effects from
the optimization of decommissioning and disposal of nuclear
power plants. €308 million (2017: €237 million) of this was used,
of which €220 million (2017: €166 million) related to decom-
missioning and non-operating nuclear power plants based on
circumstances for which decommissioning and dismantling costs
were recognized.
Personnel Obligations
Provisions for personnel costs primarily cover provisions for
early retirement benefits, performance-based compensation
components, in-kind obligations, restructuring and other
deferred personnel costs.
Provisions for Other Asset Retirement Obligations
The provisions for other asset retirement obligations consist of
obligations for renewable-energy power plants and infrastructure.
In addition, the provisions for dismantling conventional plant
components in the nuclear power segment, which are based
on legally binding civil agreements and public provisions, in the
amount of €440 million (2017: €437 million) are taken into
account here. Excluding discounting and cost-increase effects, the
amounts for these disposal obligations would be €329 million.
The amount disclosed under economic net debt, including the
nuclear-waste management obligations to be transferred
to RWE, amounts to €352 million. The decrease in other asset
retirement obligations is mainly due to the reclassification of
discontinued operations in the Renewables segment.
The amount of other asset retirement obligations disclosed
under economic net debt, not including the provisions for dis-
mantling conventional plant components in the nuclear power
segment, amounts to €789 million. This amount also includes
provisions for discontinued activities in the Renewables segment.
Supplier-Related Obligations
Provisions for supplier-related obligations consist of provisions
for potential losses on open purchase contracts, among others.
Customer-Related Obligations
Provisions for customer-related obligations consist primarily
of potential losses on rebates and open sales contracts as well
as from pending meter readings.
Environmental Remediation and Similar Obligations
Provisions for environmental remediation refer primarily
to redevelopment protection measures and the rehabilitation
of contaminated sites.
Other
The other miscellaneous provisions consist primarily of provisions
from the electricity and gas business. These include provisions
for Renewables Obligation Certificates (ROCs) in the amount
of €0.3 billion, which represent an important mechanism for
promoting renewable energies in the Customer Solutions UK
segment. The ROCs represent a fixed share of renewable ener-
gies in power sales and can be acquired either from renewable
sources or on the market. During a twelve-month ROC period,
the obligations accrued for this purpose are offset against the
acquired certificates and used. Further included here are provi-
sions for potential obligations arising from certain environmental
remediation obligations of predecessor companies (€0.3 billion)
as well as tax-related interest expenses and from taxes other
than income taxes.
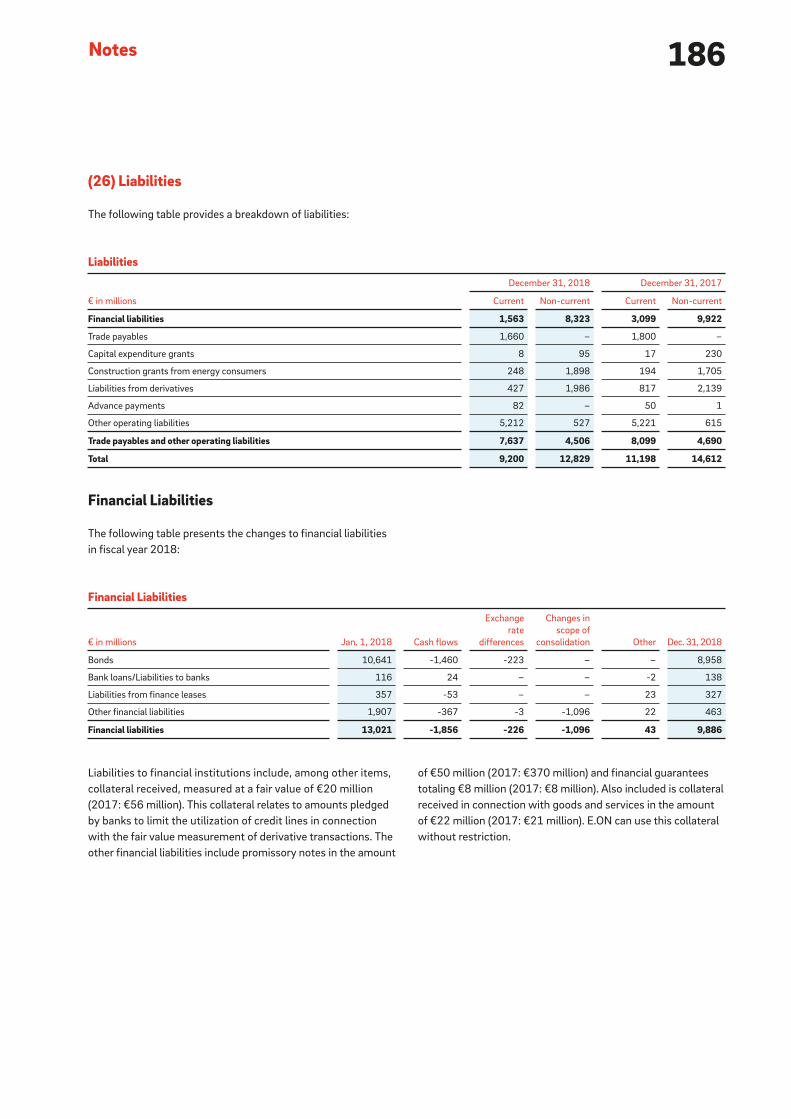
186Notes
Liabilities to financial institutions include, among other items,
collateral received, measured at a fair value of €20 million
(2017: €56 million). This collateral relates to amounts pledged
by banks to limit the utilization of credit lines in connection
with the fair value measurement of derivative trans actions. The
other financial liabilities include promissory notes in the amount
Financial Liabilities
The following table presents the changes to financial liabilities
in fiscal year 2018:
(26) Liabilities
The following table provides a breakdown of liabilities:
Liabilities
€ in millions
December 31, 2018 December 31, 2017
Current Non-current Current Non-current
Financial liabilities 1,563 8,323 3,099 9,922
Trade payables 1,660 – 1,800 –
Capital expenditure grants 8 95 17 230
Construction grants from energy consumers 248 1,898 194 1,705
Liabilities from derivatives 427 1,986 817 2,139
Advance payments 82 – 50 1
Other operating liabilities 5,212 527 5,221 615
Trade payables and other operating liabilities 7,637 4,506 8,099 4,690
Total 9,200 12,829 11,198 14,612
Financial Liabilities
€ in millions Jan. 1, 2018 Cash flows
Exchange
rate
differences
Changes in
scope of
consolidation Other Dec. 31, 2018
Bonds 10,641 -1,460 -223 – – 8,958
Bank loans/Liabilities to banks 116 24 – – -2 138
Liabilities from finance leases 357 -53 – – 23 327
Other financial liabilities 1,907 -367 -3 -1,096 22 463
Financial liabilities 13,021 -1,856 -226 -1,096 43 9,886
of €50 million (2017: €370 million) and financial guarantees
totaling €8 million (2017: €8 million). Also included is collateral
received in connection with goods and services in the amount
of €22 million (2017: €21 million). E.ON can use this collateral
without restriction.

187CEO Letter
Report of the Supervisory Board
E.ON Stock
Strategy and Objectives
Combined Group Management Report
Combined Non-Financial Report
Consolidated Financial Statements
Further Information
The following is a description of the E.ON Group’s significant
credit arrangements and debt issuance programs. Included
under “Bonds” are the bonds currently outstanding, including
those issued under the Debt Issuance Program.
Corporate HeadquartersCovenantsThe financing activities involve the use of covenants (contractual
obligations) consisting primarily of change-of-control clauses
(right of cancellation upon change of ownership), negative
pledges, pari-passu clauses and cross-default clauses, each
Additionally outstanding as of December 31, 2018, were private
placements with a total volume of approximately €0.9 billion
(2017: €0.9 billion), as well as promissory notes with a total
volume of approximately €0.1 billion (2017: €0.4 billion).
€2.75 Billion Syndicated Revolving Credit FacilityEffective November 13, 2017, E.ON arranged a syndicated
revolving credit facility in the amount of €2.75 billion over an
original term of five years, with two renewal options for one
year each. The first option to renew the credit facility for an
additional year was exercised in November 2018. The facility
was granted by 18 banks, which make up E.ON’s core banking
group. The facility has not been drawn; rather, it serves as
the Group’s reliable, long-term liquidity reserve, one purpose of
which is to function as a backup facility for the commercial paper
programs.
Major Bond Issues of E.ON SE and E.ON International Finance B.V.1
Volume in the
respective currency Initial term Repayment Coupon
GBP 850 million3 12 years Oct 2019 6.000%
EUR 1,400 million4 12 years May 2020 5.750%
EUR 750 million 4 years Aug 2021 0.375%
EUR 500 million 7 years May 2024 0.875%
EUR 750 million 12 years May 2029 1.625%
GBP 975 million5 30 years Jun 2032 6.375%
GBP 900 million 30 years Oct 2037 5.875%
USD 1,000 million2 30 years Apr 2038 6.650%
GBP 700 million 30 years Jan 2039 6.750%
1Listing: All bonds are listed in Luxembourg with the exception of the Rule 144A/Regulation S USD bond, which is unlisted.2Rule 144A/Regulation S bond.3The volume of this issue was raised from originally GBP 600 million to GBP 850 million.4The volume of this issue was raised from originally EUR 1,000 million to EUR 1,400 million.5The volume of this issue was raised from originally GBP 850 million to GBP 975 million.
referring to a restricted set of significant circumstances. Financial
covenants (that is, covenants linked to financial ratios) are not
employed.
€35 Billion Debt Issuance ProgramA Debt Issuance Program simplifies the issuance from time to
time of debt instruments through public and private placements
to investors. The Debt Issuance Program of E.ON SE was most
recently renewed in April 2018, with a total amount of €35 billion.
E.ON SE plans to renew the program in 2019.
At year-end 2018, the following E.ON SE and EIF bonds were
outstanding:
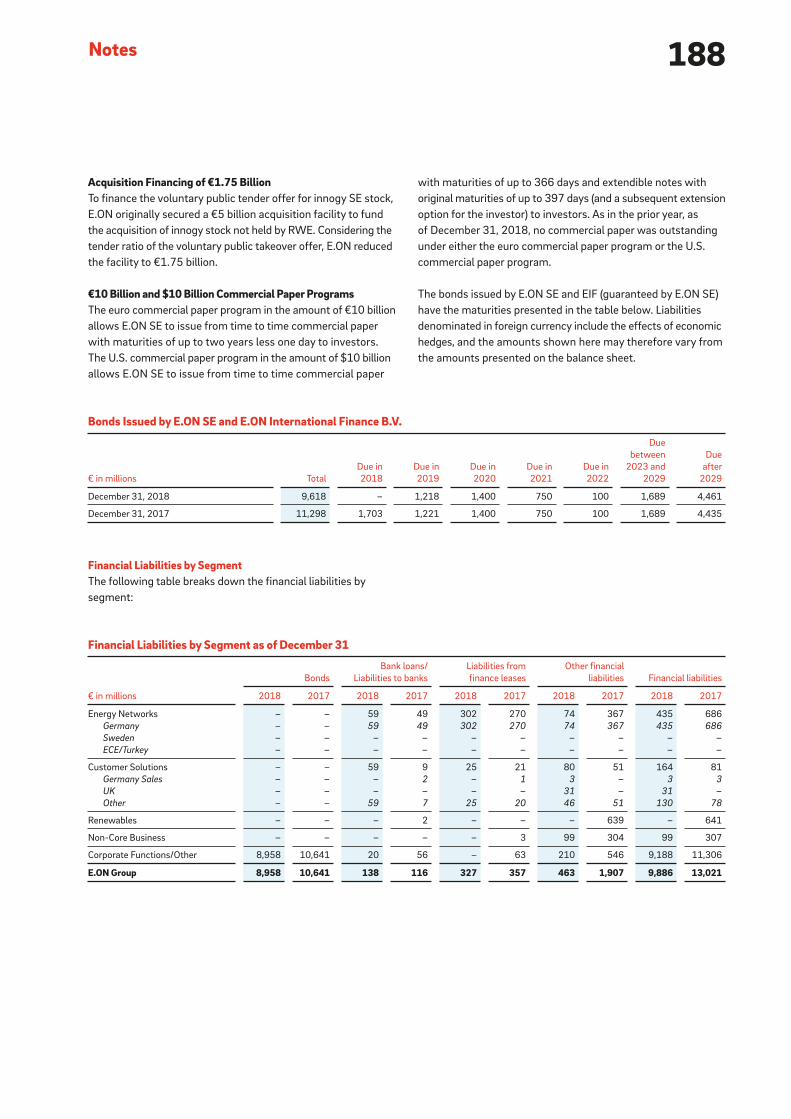
188Notes
Financial Liabilities by SegmentThe following table breaks down the financial liabilities by
segment:
Acquisition Financing of €1.75 BillionTo finance the voluntary public tender offer for innogy SE stock,
E.ON originally secured a €5 billion acquisition facility to fund
the acquisition of innogy stock not held by RWE. Considering the
tender ratio of the voluntary public takeover offer, E.ON reduced
the facility to €1.75 billion.
€10 Billion and $10 Billion Commercial Paper ProgramsThe euro commercial paper program in the amount of €10 billion
allows E.ON SE to issue from time to time commercial paper
with maturities of up to two years less one day to investors.
The U.S. commercial paper program in the amount of $10 billion
allows E.ON SE to issue from time to time commercial paper
Bonds Issued by E.ON SE and E.ON International Finance B.V.
€ in millions Total
Due in
2018
Due in
2019
Due in
2020
Due in
2021
Due in
2022
Due
between
2023 and
2029
Due
after
2029
December 31, 2018 9,618 – 1,218 1,400 750 100 1,689 4,461
December 31, 2017 11,298 1,703 1,221 1,400 750 100 1,689 4,435
Financial Liabilities by Segment as of December 31
€ in millions
Bonds
Bank loans/
Liabilities to banks
Liabilities from
finance leases
Other financial
liabilities Financial liabilities
2018 2017 2018 2017 2018 2017 2018 2017 2018 2017
Energy Networks – – 59 49 302 270 74 367 435 686
Germany – – 59 49 302 270 74 367 435 686
Sweden – – – – – – – – – –
ECE/Turkey – – – – – – – – – –
Customer Solutions – – 59 9 25 21 80 51 164 81
Germany Sales – – – 2 – 1 3 – 3 3
UK – – – – – – 31 – 31 –
Other – – 59 7 25 20 46 51 130 78
Renewables – – – 2 – – – 639 – 641
Non-Core Business – – – – – 3 99 304 99 307
Corporate Functions/Other 8,958 10,641 20 56 – 63 210 546 9,188 11,306
E.ON Group 8,958 10,641 138 116 327 357 463 1,907 9,886 13,021
with maturities of up to 366 days and extendible notes with
original maturities of up to 397 days (and a subsequent extension
option for the investor) to investors. As in the prior year, as
of December 31, 2018, no commercial paper was outstanding
under either the euro commercial paper program or the U.S.
commercial paper program.
The bonds issued by E.ON SE and EIF (guaranteed by E.ON SE)
have the maturities presented in the table below. Liabilities
denominated in foreign currency include the effects of economic
hedges, and the amounts shown here may therefore vary from
the amounts presented on the balance sheet.

189CEO Letter
Report of the Supervisory Board
E.ON Stock
Strategy and Objectives
Combined Group Management Report
Combined Non-Financial Report
Consolidated Financial Statements
Further Information
In addition, E.ON has entered into indemnification agreements,
which as a rule are incorporated in agreements concerning the
disposal of shareholdings and, above all, affect the customary
representations and warranties with relation to liability risks for
environmental damage and contingent tax risks. In some cases,
obligations are covered in the first instance by provisions of the
disposed companies before E.ON itself is required to make any
payments. Guarantees issued by companies that were later sold
by E.ON SE or its legal predecessors are usually included in the
respective final sales contracts in the form of indemnities.
Moreover, E.ON has commitments under which it assumes
joint and several liability arising from its interests in civil-law
companies (“GbR”), non-corporate commercial partnerships
and consortia in which it participates.
The guarantees of E.ON also include items related to the opera-
tion of nuclear power plants. With the entry into force of the
German Nuclear Energy Act (“Atomgesetz” or “AtG”), as amended,
and of the ordinance regulating the provision for coverage under
the Atomgesetz (“Atomrecht liche Deckungsvorsorge-Verordnung”
or “AtDeckV”) of April 27, 2002, as amended, German nuclear
power plant operators are required to provide nuclear accident
liability coverage of up to €2.5 billion per incident.
(27) Contingent Liabilities and Other Financial Obligations
As part of its business activities, E.ON is subject to contingent
liabilities and other financial obligations involving a variety of
underlying matters. These primarily include guarantees, obliga-
tions from litigation and claims (as discussed in more detail in
Note 28), short- and long-term contractual, legal and other
obligations and commitments.
Contingent Liabilities
The fair value of the E.ON Group’s contingent liabilities was
€0.54 billion as of December 31, 2018, and primarily includes
contingent liabilities in connection with contingencies and
potential long-term environmental remediation measures.
E.ON has issued direct and indirect guarantees to third parties,
which may trigger payment obligations based on the occurrence
of certain events. These consist primarily of financial guarantees
and warranties.
Trade Payables and Other Operating Liabilities
Trade payables totaled €1,660 million as of December 31, 2018
(2017: €1,800 million).
Capital expenditure grants of €103 million (2017: €247 million)
have not yet been recognized as revenue. The E.ON Group
retains ownership of the assets. The grants are non-refundable
and are recognized in other operating income over the period of
the depreciable lives of the related assets.
Construction grants of €2,146 million (2017: €1,899 million)
were paid by customers for the cost of new gas and electricity
connections in accordance with the generally binding terms
governing such new connections and represent contractual
liabilities under IFRS 15. This includes €200 million in grid
connection fees, which were recognized as contract liabilities
for the first time upon implementation of IFRS 15 due to their
realization over a specific period of time. These grants are cus-
tomary in the industry, generally non-refundable and recognized
as revenue in the amount of €262 million according to the useful
lives of the related assets.
Other operating liabilities consist primarily of accruals in the
amount of €3,700 million (2017: €3,444 million) and interest
payable in the amount of €360 million (2017: €451 million).
Also included in other operating liabilities are carryforwards of
counterparty obligations to acquire additional shares in already
consolidated subsidiaries as well as non-controlling interests
in fully consolidated partnerships with legal structures that give
their shareholders a statutory right of withdrawal combined with
a compensation claim, in the amount of €289 million (2017:
€360 million).

190Notes
The coverage requirement is satisfied in part by a standardized
insurance facility in the amount of €255.6 million. The institution
Nuklear Haftpflicht Gesellschaft bürgerlichen Rechts (“Nuklear
Haftpflicht GbR”) now only covers costs between €0.5 million
and €15 million for claims related to officially ordered evacuation
measures. Group companies have agreed to place their sub-
sidiaries operating nuclear power plants in a position to maintain
a level of liquidity that will enable them at all times to meet their
obligations as members of the Nuklear Haftpflicht GbR, in pro-
portion to their shareholdings in nuclear power plants.
To provide liability coverage for the additional €2,244.4 million
per incident required by the above-mentioned amendments,
E.ON Energie AG (“E.ON Energie”) and the other parent compa-
nies of German nuclear power plant operators reached a Soli-
darity Agreement (“Solidarvereinbarung”) on July 11, July 27,
August 21, and August 28, 2001, extended by agreement
dated March 25, April 18, April 28, and June 1, 2011. If an
accident occurs, the Solidarity Agreement calls for the nuclear
power plant operator liable for the damages to receive—after
the operator’s own resources and those of its parent companies
are exhausted— financing sufficient for the operator to meet
its financial obligations. Under the Solidarity Agreement, E. ON
Energie’s share of the liability coverage on December 31, 2018,
was 44.6 percent (prior year: 42.0 percent) and 46.8 percent
from January 1, 2019, plus an additional 5.0 percent charge
for the administrative costs of processing damage claims. Suffi-
cient liquidity has been provided for and is included within the
liquidity plan.
As of December 31, 2018, E.ON SE also issues collateral in the
amount of €1.8 billion for former Group companies, which will
be repaid or to a great extent assumed by the companies of the
Uniper Group in the future. The largest payment guarantee on
a pro rata basis is Uniper Energy Storage GmbH in the amount
of €0.9 billion. This also includes guarantees in connection with
Swedish nuclear power activities. These guarantees and obliga-
tions will be transferred from E.ON to Uniper in the first quarter
of 2019.
Other Financial Obligations
In addition to provisions and liabilities carried on the balance
sheet and to reported contingent liabilities, there also are other
mostly long-term financial obligations arising mainly from
contracts entered into with third parties, or on the basis of legal
requirements.
As of December 31, 2018, purchase commitments for invest-
ments in intangible assets and in property, plant and equipment
amounted to €0.8 billion (2017: €1.1 billion). Of these com-
mitments, €0.6 billion are due within one year. The purchase
commitment mainly includes financial obligations for as yet
outstanding investments, in particular in the Energy Networks
Germany and Sweden segments. On December 31, 2018, these
obligations totaled €0.7 billion.
Additional long-term contractual obligations in place at the
E.ON Group as of December 31, 2018, relate primarily to the
purchase of electricity and natural gas. Financial obligations
under the electricity purchase contracts amount to approximately
€4.0 billion on December 31, 2018 (€2.8 billion due within
one year). Financial obligations under the gas purchase contracts
amount to approximately €2.9 billion on December 31, 2018
(€1.4 billion due within one year). Additional purchase commit-
ments as of December 31, 2018, amounted to approximately
€0.6 billion (€0.1 billion due within one year). They include long-
term contractual commitments to purchase heat and alterna-
tive fuels.
Additional financial obligations arose from rental and tenancy
agreements and from operating leases. The corresponding min-
imum lease payments are due as broken down in the table below:
The expenses reported in the income statement for these leasing
agreements amounted to €125 million (2017: €115 million).
They include contingent rents.
In addition, further financial obligations in place as of December 31,
2018, totaled approximately €3.3 billion (€2.6 billion due within
one year). This item also includes financial obligations from ser-
vices to be procured, capital obligations from joint ventures and
obligations concerning the acquisition of real estate funds held
as financial assets, as well as corporate actions. Also included
is the financial obligation from the voluntary public takeover bid
for the shares of innogy SE in the amount of €1.9 billion, which
is an open transaction.
E.ON as Lessee—Operating Leases
€ in millions
Minimum lease payments
2018 2017
Due within 1 year 109 107
Due in 1 to 5 years 295 262
Due in more than 5 years 181 81
Total 585 450
191CEO Letter
Report of the Supervisory Board
E.ON Stock
Strategy and Objectives
Combined Group Management Report
Combined Non-Financial Report
Consolidated Financial Statements
Further Information
(28) Litigation and Claims
A number of different court actions, governmental investigations
and proceedings, and other claims are currently pending or may
be instituted or asserted in the future against companies of the
E.ON Group. This in particular includes legal actions and proceed-
ings on contract amendments and price adjustments initiated
in response to market upheavals and the changed economic sit-
uation in the electricity and gas sectors (also as a consequence
of the energy transition) and concerning price increases and
anticompetitive practices.
In the Energy Networks segment, Group companies are involved
in proceedings for the award of concessions, the insolvency of
energy suppliers and in connection with grid connections and
the calculation of the grid fee. Official regulations and changes
in regulatory practice have given rise to legal disputes. The
national regulatory regimes within Europe are also subject to
significant changes. The changes to the legal and regulatory
framework can in some cases significantly impact subsidies and
remuneration practices, which in turn are the object of regulatory
or court proceedings.
Lawsuits are also pending in connection with the construction
and operation of plants for generating electricity from renewable
energy sources.
On April 13, 2017, the Federal Constitutional Court declared
the Nuclear Fuel Tax Act to be incompatible with the Basic Law
and invalid. The nuclear-fuel tax plus interest paid by E.ON was
refunded. Nuclear operators use two models for the calculation
of interest with the German customs authorities, one of which
is used by PreussenElektra. With the 16th amendment to the
German Nuclear Energy Act, the German Federal Government
has implemented the ruling of the German Federal Constitutional
Court on the phase-out of nuclear energy. This amendment
regulated compensation claims for certain investments and
residual volumes of electricity, and created an obligation to offer
these residual volumes at reasonable terms and conditions.
PreussenElektra sued Krümmel GmbH & Co. OHG and Vattenfall
Nuclear GmbH with the aim of transferring, without compen-
sation, the residual volumes of electricity from the Krümmel
nuclear power plant corresponding to the ownership interest.
This was offset by lower net cash inflows from the sale of secu-
rities and changes in financial receivables (-€1.9 billion) and an
increase in cash investments (-€0.2 billion).
At -€2.6 billion, cash provided by financing activities from
continuing and discontinued operations was €3.1 billion less
than the prior-year figure of +€0.5 billion. This was due in par-
ticular to the €2.0 billion bond issued in the first half of 2017
and the €1.35 billion capital increase carried out in 2017. In
addition, E.ON SE’s dividend payment in 2018 was approximately
€0.3 billion higher than in the prior year. This was offset by lower
payouts on the redemption of bonds.
In fiscal year 2018, tax liabilities were reduced by €143 million
(2017: €228 million) through the transfer of tax credits (accel-
erated depreciation, so-called “MACRS” and production tax
credits, “PTCs”) to tax equity investors. These non-cash trans-
actions had no impact on the consolidated cash flow statement.
(29) Supplemental Cash Flow Disclosures
The total consideration received by E.ON in 2018 on the disposal
of consolidated equity interests and activities generated cash
inflows of €239 million (2017: €517 million). Cash and cash equiv-
alents sold amounted to €20 million (2017: €0 million). The sale
of the consolidated activities led to reductions of €167 million
(2017: €134 million) in assets and €62 million (2017: €34 million)
in provisions and liabilities.
At €4.1 billion, cash provided by operating activities before
interest and taxes from continuing and discontinued operations
was €6.3 billion higher than in the prior-year period. A material
factor in this increase was the July 2017 payment of around
€10.3 billion into Germany’s public fund for financing nuclear-
waste disposal. The €2.85 billion nuclear-fuel tax refunded in
June 2017 and positive effects on working capital in the previous
year had an offsetting effect. Cash provided by operating activi-
ties from continuing and discontinued operations also declined
due to higher interest and tax payments.
Cash provided by investing activities from continuing and dis-
continued operations amounted to roughly +€1.0 billion in
2018 (2017: -€0.4 billion). The disposal of the shareholding in
Uniper SE (+€3.8 billion) had a particular impact in this regard.

192Notes
(30) Derivative Financial Instruments and Hedging Transactions
Strategy and Objectives
The Company’s policy generally permits the use of derivatives if
they are associated with underlying assets or liabilities, planned
transactions, or legally binding rights or obligations.
At the E.ON Group, hedge accounting in accordance with IFRS 9
is employed primarily in connection with hedging long-term
liabilities and bonds to be issued in the future via interest-rate
derivatives and for hedging long-term foreign currency receiv-
ables and payables and foreign investments via currency deriv-
atives. E.ON also hedges net investments in foreign operations.
In commodities, potentially volatile future cash flows resulting
primarily from planned purchases and sales of electricity
within and outside of the Group are hedged.
To hedge currency risk, E.ON entered into hedging transactions in
the reporting year in pounds sterling at an average hedging rate
of GBP 0.84/EUR (2017: GBP 0.84/EUR) and in U.S. dollars at an
average hedging rate of USD 1.22/EUR (2017: USD 1.26/EUR).
Hedging transactions were concluded at an average interest
rate of 3.53 percent (2017: 3.53 percent) to hedge the interest
rate risk in the euro zone. The average hedging price for hedging
commodity price change risks amounted to €52.63/MWh in
the year under review (2017: €0/MWh).
Fair Value Hedges
Fair value hedges are used to protect against the risk from
changes in market values. Gains and losses on these hedges are
generally reported in that line item of the income statement
which also includes the respective hedged items.
Cash Flow Hedges
Cash flow hedges are used to protect against the risk arising
from variable cash flows. Interest rate swaps and cross-currency
interest rate swaps are the principal instruments used to limit
interest rate and currency risks. The purpose of these swaps is to
maintain the level of payments arising from long-term interest-
bearing receivables and liabilities and from capital investments
denominated in foreign currency and euro by using cash flow
hedge accounting in the functional currency of the respective
E.ON company.
In order to reduce future cash flow fluctuations arising from
electricity transactions effected at variable spot prices, futures
contracts are concluded and also accounted for using cash flow
hedge accounting.

193CEO Letter
Report of the Supervisory Board
E.ON Stock
Strategy and Objectives
Combined Group Management Report
Combined Non-Financial Report
Consolidated Financial Statements
Further Information
The following table presents the carrying amounts of the
hedging instruments and the changes in the fair values of the
hedging instruments and hedged items by hedged risk type:
The amount of ineffectiveness for cash flow hedges recorded
for the year ended December 31, 2018, produced an expense
of €4 million (2017: €5 million gain). Of this amount, €3 million
relates to hedging of interest-rate risk (2017: €0 million).
Gains and losses from the ineffective portions of cash flow hedges
are classified as other operating income or other operating
Carrying Amounts of Hedging Instruments and Changes in Fair Value of Hedging Instruments and Hedged Items in Connection with Cash Flow Hedges
€ in millions
Carrying amount
Change in the fair value
of the designated portion
of hedging instruments
Change in the fair value
of hedged items
Receivables from
derivative financial
instruments
Liabilities from
derivatives
2018 2017 2018 2017 2018 2017 2018 2017
Currency risk 135 205 257 298 23 -293 -24 289
Interest-rate risk 29 – 911 836 -67 -9 64 9
Commodity price change risk 2 – 3 – – – – –
Changes in OCI Arising from Cash Flow Hedges
€ in millions Total Currency risk
Interest-rate
risk
Balance as of January 1, 2017 -1,243
Unrealized changes—hedging reserve -48 -222 174
Unrealized changes—reserve for hedging costs 64 64 –
Reclassification adjustments recognized in income 182 149 33
Companies accounted for under the equity method 3
Income taxes 26
Balance as of December 31, 2017 1 -1,016
Balance as of January 1, 2018 -1,016
Unrealized changes—hedging reserve -15 -2 -13
Unrealized changes—reserve for hedging costs 59 59 –
Reclassification adjustments recognized in income 9 -45 54
Companies accounted for under the equity method -15
Income taxes -14
Balance as of December 31, 2018 1 -992
1As of December 31, 2018, includes -€249 million (2017: -€304 million) from terminated cash flow hedges.
expenses. Interest cash flow hedges are reported under other
interest income or expenses.
The development of OCI arising from cash flow hedges, broken
down by hedged risk type, is as follows:
The balance of the OCI arising from cash flow hedges as of
December 31, 2018, contains €0.8 billion relating to hedging of
interest-rate risk (2017: €0.8 billion).
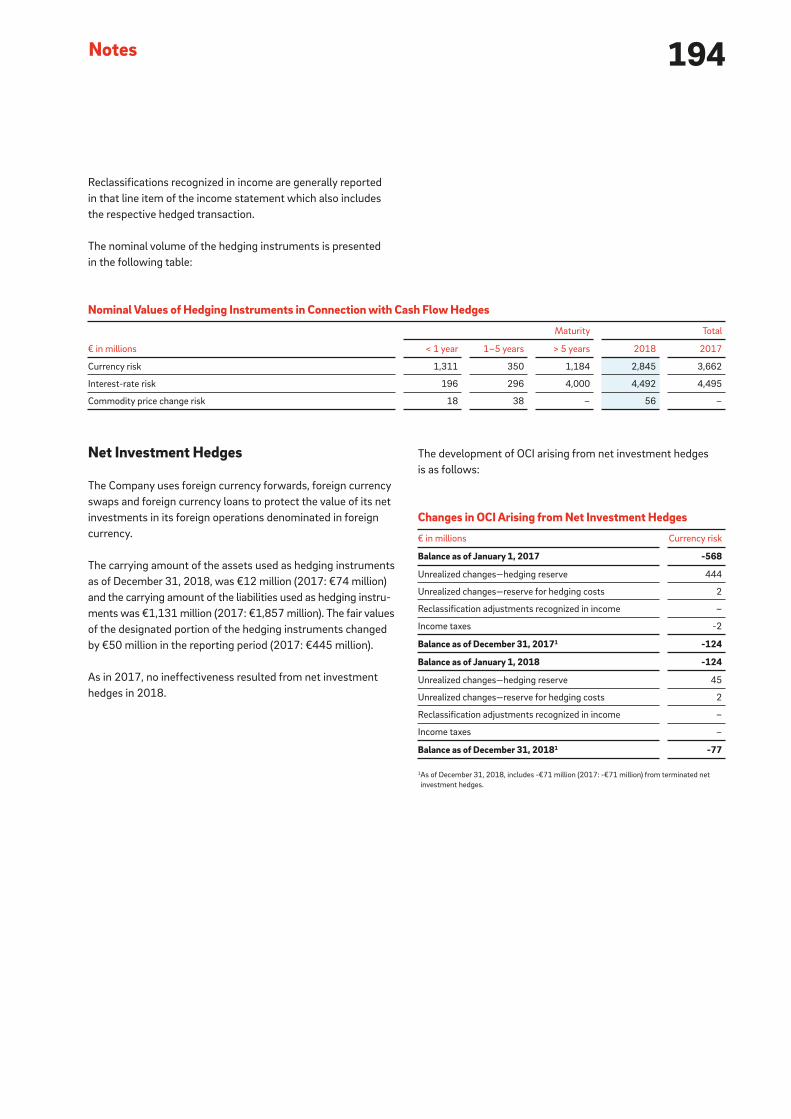
194Notes
Nominal Values of Hedging Instruments in Connection with Cash Flow Hedges
€ in millions
Maturity Total
< 1 year 1–5 years > 5 years 2018 2017
Currency risk 1,311 350 1,184 2,845 3,662
Interest-rate risk 196 296 4,000 4,492 4,495
Commodity price change risk 18 38 – 56 –
Reclassifications recognized in income are generally reported
in that line item of the income statement which also includes
the respective hedged transaction.
The nominal volume of the hedging instruments is presented
in the following table:
Net Investment Hedges
The Company uses foreign currency forwards, foreign currency
swaps and foreign currency loans to protect the value of its net
investments in its foreign operations denominated in foreign
currency.
The carrying amount of the assets used as hedging instruments
as of December 31, 2018, was €12 million (2017: €74 million)
and the carrying amount of the liabilities used as hedging instru-
ments was €1,131 million (2017: €1,857 million). The fair values
of the designated portion of the hedging instruments changed
by €50 million in the reporting period (2017: €445 million).
As in 2017, no ineffectiveness resulted from net investment
hedges in 2018.
The development of OCI arising from net investment hedges
is as follows:
Changes in OCI Arising from Net Investment Hedges
€ in millions Currency risk
Balance as of January 1, 2017 -568
Unrealized changes—hedging reserve 444
Unrealized changes—reserve for hedging costs 2
Reclassification adjustments recognized in income –
Income taxes -2
Balance as of December 31, 2017 1 -124
Balance as of January 1, 2018 -124
Unrealized changes—hedging reserve 45
Unrealized changes—reserve for hedging costs 2
Reclassification adjustments recognized in income –
Income taxes –
Balance as of December 31, 2018 1 -77
1As of December 31, 2018, includes -€71 million (2017: -€71 million) from terminated net
investment hedges.
195CEO Letter
Report of the Supervisory Board
E.ON Stock
Strategy and Objectives
Combined Group Management Report
Combined Non-Financial Report
Consolidated Financial Statements
Further Information
As a rule, reclassifications recognized in income are reported
under other operating income and expenses. The nominal vol-
ume of hedging instruments in net investment hedges
amounted to €7,122 million as of December 31, 2018 (2017:
€8,038 million). Since the currency risk of net investment
hedges is hedged through the ongoing rollover of the hedging
instruments, the majority are concluded with a remaining term
of less than one year.
Valuation of Derivative Instruments
The fair value of derivative financial instruments is sensitive to
movements in underlying market rates and other relevant vari-
ables. The Company assesses and monitors the fair value of
deri vative instruments on a periodic basis. The fair value to be
determined for each derivative instrument is the price that
would be received to sell an asset or paid to transfer a liability
in an orderly transaction between market participants on the
measurement date (exit price). E.ON also takes into account the
counterparty credit risk for both own credit risk (debt value
adjustment) and the risk of the corresponding counterparty
(credit value adjustment) when determining fair value. The fair
values of derivative instruments are calculated using common
market valuation methods with reference to available market
data on the measurement date.
The following is a summary of the methods and assumptions
for the valuation of utilized derivative financial instruments in
the Consolidated Financial Statements.
• Currency, electricity, gas and oil forward contracts, swaps,
and emissions-related derivatives are valued sep arately at
their forward rates and prices as of the balance sheet date.
Whenever possible, forward rates and prices are based on
market quotations, with any applicable forward premiums
and discounts taken into consideration.
• Market prices for electricity options are valued using stan-
dard option pricing models commonly used in the market.
• The fair values of existing instruments to hedge interest risk
are determined by discounting future cash flows using market
interest rates over the remaining term of the instrument.
Discounted cash values are determined for interest rate, cross-
currency and cross-currency interest rate swaps for each
individual transaction as of the balance sheet date. Interest
income and expenses are recognized in income at the date of
payment or accrual.
• Equity forwards are valued on the basis of the stock prices of
the underlying equities, taking into consideration any timing
components.
• Exchange-traded futures and option contracts are valued
individually at daily settlement prices determined on the
futures markets that are published by their respective clear-
ing houses. Paid initial margins are disclosed under other
assets. Variation margins received or paid during the term of
such contracts are stated under other liabilities or other
assets, respectively.
• Certain long-term energy contracts are valued with the
aid of valuation models that use internal data if market
prices are not available. A hypothetical 10-percent increase
or decrease in these internal valuation parameters as of the
balance sheet date would lead to a theo retical decrease
in market values of €2 million or an increase of €2 million,
respectively.
At the beginning of 2018, a net loss of €68 million from the initial
measurement of derivatives was deferred. Deferred expenses
decreased to €0 million in the reporting year. The reduction is
primarily due to the recognition of the Renewables business as
a discontinued operation.
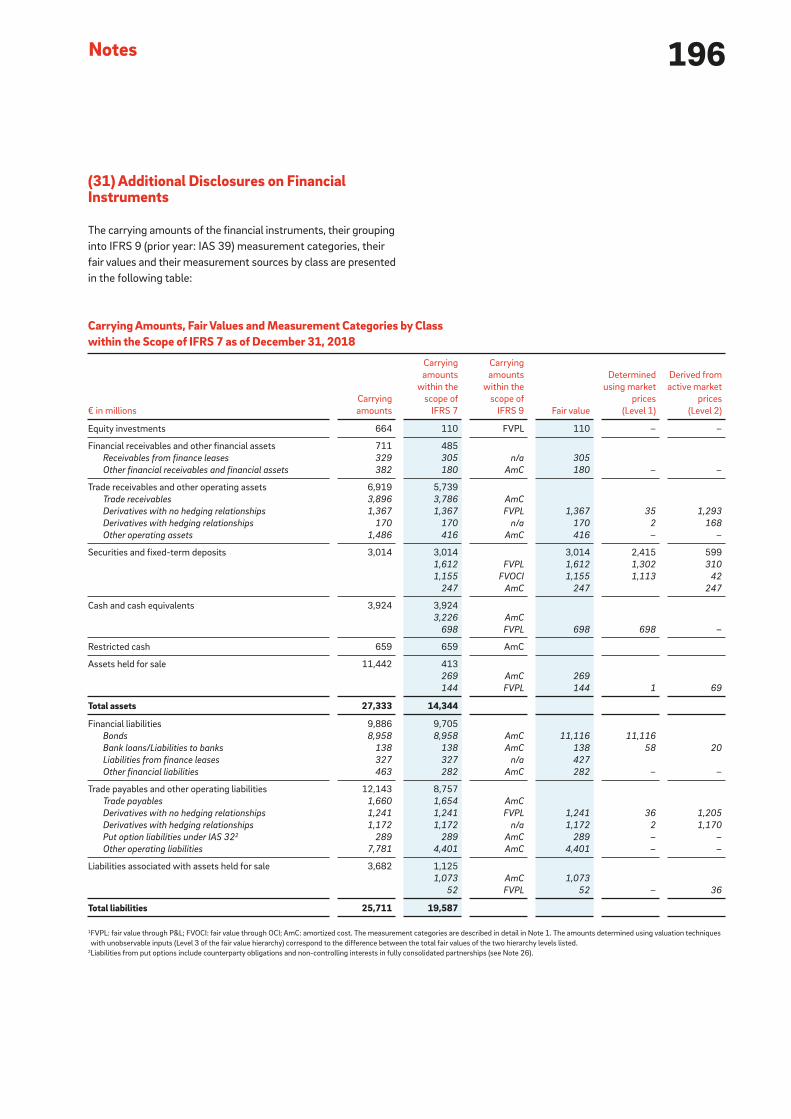
196Notes
(31) Additional Disclosures on Financial Instruments
The carrying amounts of the financial instruments, their grouping
into IFRS 9 (prior year: IAS 39) measurement categories, their
fair values and their measurement sources by class are presented
in the following table:
Carrying Amounts, Fair Values and Measurement Categories by Class within the Scope of IFRS 7 as of December 31, 2018
€ in millions
Carrying
amounts
Carrying
amounts
within the
scope of
IFRS 7
Carrying
amounts
within the
scope of
IFRS 9 Fair value
Determined
using market
prices
(Level 1)
Derived from
active market
prices
(Level 2)
Equity investments 664 110 FVPL 110 – –
Financial receivables and other financial assets 711 485
Receivables from finance leases 329 305 n/a 305
Other financial receivables and financial assets 382 180 AmC 180 – –
Trade receivables and other operating assets 6,919 5,739
Trade receivables 3,896 3,786 AmC
Derivatives with no hedging relationships 1,367 1,367 FVPL 1,367 35 1,293
Derivatives with hedging relationships 170 170 n/a 170 2 168
Other operating assets 1,486 416 AmC 416 – –
Securities and fixed-term deposits 3,014 3,014 3,014 2,415 599
1,612 FVPL 1,612 1,302 310
1,155 FVOCI 1,155 1,113 42
247 AmC 247 247
Cash and cash equivalents 3,924 3,924
3,226 AmC
698 FVPL 698 698 –
Restricted cash 659 659 AmC
Assets held for sale 11,442 413
269 AmC 269
144 FVPL 144 1 69
Total assets 27,333 14,344
Financial liabilities 9,886 9,705
Bonds 8,958 8,958 AmC 11,116 11,116
Bank loans/Liabilities to banks 138 138 AmC 138 58 20
Liabilities from finance leases 327 327 n/a 427
Other financial liabilities 463 282 AmC 282 – –
Trade payables and other operating liabilities 12,143 8,757
Trade payables 1,660 1,654 AmC
Derivatives with no hedging relationships 1,241 1,241 FVPL 1,241 36 1,205
Derivatives with hedging relationships 1,172 1,172 n/a 1,172 2 1,170
Put option liabilities under IAS 32 2 289 289 AmC 289 – –
Other operating liabilities 7,781 4,401 AmC 4,401 – –
Liabilities associated with assets held for sale 3,682 1,125
1,073 AmC 1,073
52 FVPL 52 – 36
Total liabilities 25,711 19,587
1FVPL: fair value through P&L; FVOCI: fair value through OCI; AmC: amortized cost. The measurement categories are described in detail in Note 1. The amounts determined using valuation techniques
with unobservable inputs (Level 3 of the fair value hierarchy) correspond to the difference between the total fair values of the two hierarchy levels listed.2Liabilities from put options include counterparty obligations and non-controlling interests in fully consolidated partnerships (see Note 26).

197CEO Letter
Report of the Supervisory Board
E.ON Stock
Strategy and Objectives
Combined Group Management Report
Combined Non-Financial Report
Consolidated Financial Statements
Further Information
The carrying amounts of cash and cash equivalents and of trade
receivables and trade payables are considered reasonable esti-
mates of their fair values because of their short maturity.
The fair value of shareholdings in unlisted companies and of
debt instruments that are not actively traded, such as loans
received, loans granted and financial liabilities, is determined by
discounting future cash flows. Any necessary discounting takes
place using current market interest rates over the remaining
terms of the financial instruments.
The determination of the fair value of derivative financial instru-
ments is discussed in Note 30.
Where the value of a financial instrument can be derived from
an active market without the need for an adjustment, that value
is used as the fair value. This applies in particular to equities held
and to bonds held and issued.
Carrying Amounts, Fair Values and Measurement Categories by Class within the Scope of IFRS 7 as of December 31, 2017
€ in millions
Carrying
amounts
Carrying
amounts
within the
scope of
IFRS 7
IAS 39
measure-
ment
category 1 Fair value
Determined
using market
prices
(Level 1)
Derived from
active market
prices
(Level 2)
Equity investments 792 792 AfS 792 6 259
Financial receivables and other financial assets 688 688
Receivables from finance leases 329 329 n/a 329
Other financial receivables and financial assets 359 359 LaR 359 – –
Trade receivables and other operating assets 7,152 6,405
Trade receivables 3,879 3,879 LaR
Derivatives with no hedging relationships 1,401 1,401 HfT 1,401 29 1,240
Derivatives with hedging relationships 279 279 n/a 279 – 279
Other operating assets 1,593 846 LaR 846 – –
Securities and fixed-term deposits 3,419 3,419 AfS 3,419 2,888 531
Cash and cash equivalents 2,708 2,708 LaR
Restricted cash 1,782 1,782 LaR
Assets held for sale 3,301 – AfS – – –
Total assets 19,842 15,794
Financial liabilities 13,021 12,080
Bonds 10,641 10,641 AmC 13,280 13,280 –
Bank loans/Liabilities to banks 116 116 AmC 116 55 8
Liabilities from finance leases 357 357 n/a 467
Other financial liabilities 1,907 966 AmC 982 – 564
Trade payables and other operating liabilities 12,789 9,226
Trade payables 1,800 1,800 AmC
Derivatives with no hedging relationships 1,797 1,797 HfT 1,797 14 1,756
Derivatives with hedging relationships 1,159 1,159 n/a 1,159 – 1,159
Put option liabilities under IAS 32 2 360 360 AmC 360 – –
Other operating liabilities 7,673 4,110 AmC 4,110 – –
Total liabilities 25,810 21,306
1AfS: Available for sale; LaR: Loans and receivables; HfT: Held for trading; AmC: Amortized cost. The measurement categories are described in detail in Note 1. The amounts determined using valuation
techniques with unobservable inputs (Level 3 of the fair value hierarchy) correspond to the difference between the total fair values of the two hierarchy levels listed.2Liabilities from put options include counterparty obligations and non-controlling interests in fully consolidated partnerships (see Note 26).

198Notes
also Note 1). A hypothetical 10-percent increase or decrease in
these key internal valuation parameters as of the balance sheet
date would lead to a theoretical decrease in market values of
€13 million or an increase of €14 million, respectively.
The fair values determined using valuation techniques for financial
instruments carried at fair value are reconciled as shown in the
following table:
In 2018, there were no material reclassifications between
Levels 1 and 2 of the fair value hierarchy. At the end of each
reporting period, E.ON assesses whether there might be grounds
for reclassification between hierarchy levels.
The input parameters of Level 3 of the fair value hierarchy for
equity investments are specified taking into account economic
developments and available industry and corporate data (see
The sales (including disposals) exclusively relate to the minority
shareholdings in nuclear power plants reclassified to the dis-
posal group and the derivative financial instruments of the dis-
continued operation in the Renewables segment.
Fair Value Hierarchy Level 3 Reconciliation
€ in millions
Dec. 31,
2017
Effects
from
IFRS 9
Jan. 1,
2018
Pur-
chases
(including
additions)
Sales
(including
dispos-
als)
Settle-
ments
Gains/
Losses in
income
state-
ment
Transfers
Gains/
Losses in
OCI
Dec. 31,
2018
into
Level 3
out of
Level 3
Equity investments 527 -380 147 10 -52 – -1 6 – – 110
Derivative financial
instruments 105 – 105 – 12 – -78 – – – 39
Total 632 -380 252 10 -40 0 -79 6 0 0 149
Netting Agreements for Financial Assets and Liabilities as of December 31, 2018
€ in millions
Gross
amount
Amount
offset
Carrying
amount
Conditional
netting
amount
(netting
agreements)
Financial
collateral
received/
pledged Net value
Financial assets
Trade receivables 3,786 – 3,786 – – 3,786
Interest-rate and currency derivatives 1,203 – 1,203 – 20 1,183
Commodity derivatives 449 115 334 206 – 128
Total 5,438 115 5,323 206 20 5,097
Financial liabilities
Trade payables 1,654 – 1,654 – – 1,654
Interest-rate and currency derivatives 2,207 – 2,207 – 580 1,627
Commodity derivatives 321 115 206 206 – –
Total 4.182 115 4,067 206 580 3,281
The extent to which the offsetting of financial assets is covered
by netting agreements is presented in the following table:
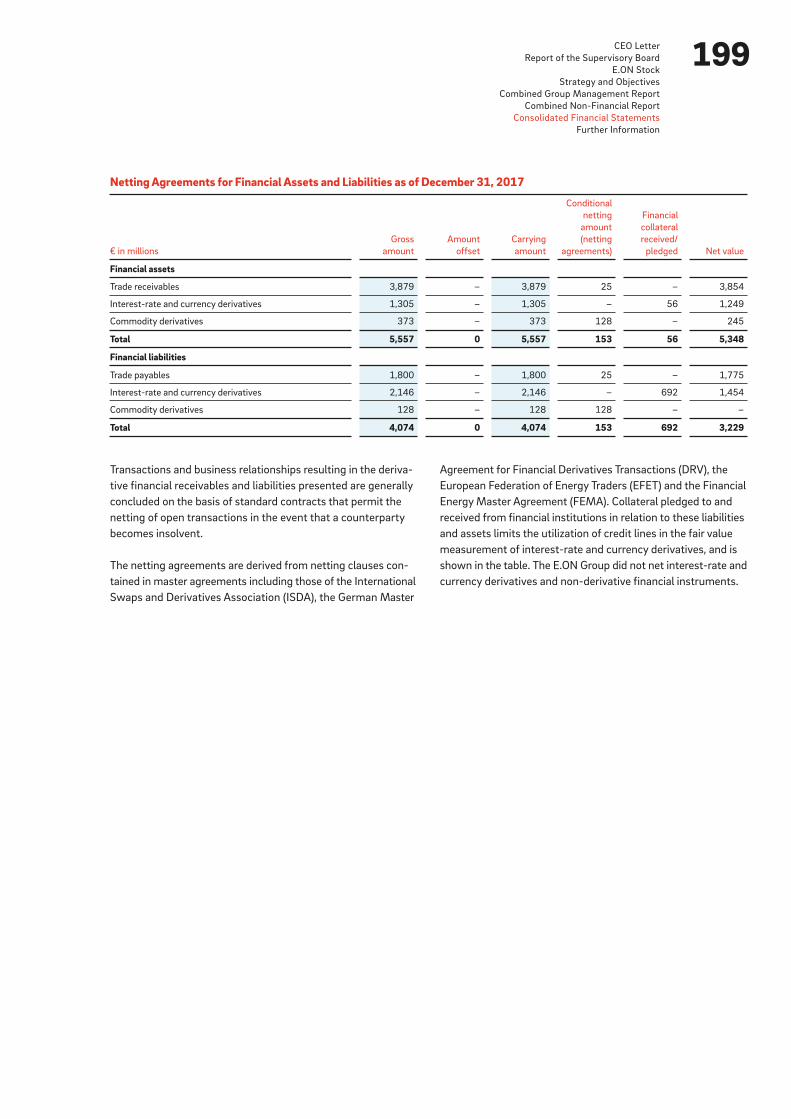
199CEO Letter
Report of the Supervisory Board
E.ON Stock
Strategy and Objectives
Combined Group Management Report
Combined Non-Financial Report
Consolidated Financial Statements
Further Information
Transactions and business relationships resulting in the deriva-
tive financial receivables and liabilities presented are generally
concluded on the basis of standard contracts that permit the
netting of open transactions in the event that a counterparty
becomes insolvent.
The netting agreements are derived from netting clauses con-
tained in master agreements including those of the International
Swaps and Derivatives Asso ciation (ISDA), the German Master
Agreement for Financial Derivatives Trans actions (DRV), the
European Federation of Energy Traders (EFET) and the Financial
Energy Master Agreement (FEMA). Collateral pledged to and
received from financial institutions in relation to these liabilities
and assets limits the utilization of credit lines in the fair value
measurement of interest-rate and currency derivatives, and is
shown in the table. The E.ON Group did not net interest-rate and
currency derivatives and non-derivative financial instruments.
Netting Agreements for Financial Assets and Liabilities as of December 31, 2017
€ in millions
Gross
amount
Amount
offset
Carrying
amount
Conditional
netting
amount
(netting
agreements)
Financial
collateral
received/
pledged Net value
Financial assets
Trade receivables 3,879 – 3,879 25 – 3,854
Interest-rate and currency derivatives 1,305 – 1,305 – 56 1,249
Commodity derivatives 373 – 373 128 – 245
Total 5,557 0 5,557 153 56 5,348
Financial liabilities
Trade payables 1,800 – 1,800 25 – 1,775
Interest-rate and currency derivatives 2,146 – 2,146 – 692 1,454
Commodity derivatives 128 – 128 128 – –
Total 4,074 0 4,074 153 692 3,229
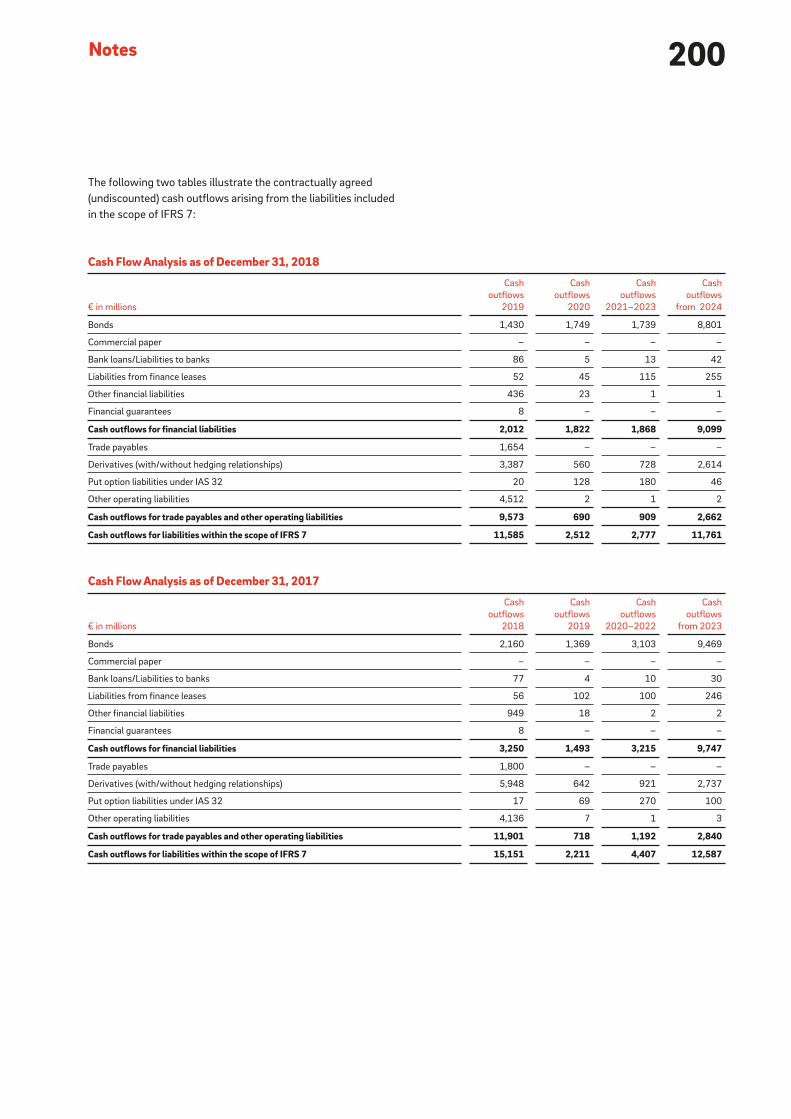
200Notes
The following two tables illustrate the contractually agreed
(undiscounted) cash outflows arising from the liabilities included
in the scope of IFRS 7:
Cash Flow Analysis as of December 31, 2018
€ in millions
Cash
outflows
2019
Cash
outflows
2020
Cash
outflows
2021–2023
Cash
outflows
from 2024
Bonds 1,430 1,749 1,739 8,801
Commercial paper – – – –
Bank loans/Liabilities to banks 86 5 13 42
Liabilities from finance leases 52 45 115 255
Other financial liabilities 436 23 1 1
Financial guarantees 8 – – –
Cash outflows for financial liabilities 2,012 1,822 1,868 9,099
Trade payables 1,654 – – –
Derivatives (with/without hedging relationships) 3,387 560 728 2,614
Put option liabilities under IAS 32 20 128 180 46
Other operating liabilities 4,512 2 1 2
Cash outflows for trade payables and other operating liabilities 9,573 690 909 2,662
Cash outflows for liabilities within the scope of IFRS 7 11,585 2,512 2,777 11,761
Cash Flow Analysis as of December 31, 2017
€ in millions
Cash
outflows
2018
Cash
outflows
2019
Cash
outflows
2020–2022
Cash
outflows
from 2023
Bonds 2,160 1,369 3,103 9,469
Commercial paper – – – –
Bank loans/Liabilities to banks 77 4 10 30
Liabilities from finance leases 56 102 100 246
Other financial liabilities 949 18 2 2
Financial guarantees 8 – – –
Cash outflows for financial liabilities 3,250 1,493 3,215 9,747
Trade payables 1,800 – – –
Derivatives (with/without hedging relationships) 5,948 642 921 2,737
Put option liabilities under IAS 32 17 69 270 100
Other operating liabilities 4,136 7 1 3
Cash outflows for trade payables and other operating liabilities 11,901 718 1,192 2,840
Cash outflows for liabilities within the scope of IFRS 7 15,151 2,211 4,407 12,587

201CEO Letter
Report of the Supervisory Board
E.ON Stock
Strategy and Objectives
Combined Group Management Report
Combined Non-Financial Report
Consolidated Financial Statements
Further Information
Financial guarantees with a total nominal volume of €8 million
(2017: €8 million) were issued to companies outside of the
Group. This amount is the maximum amount that E.ON would
have to pay in the event of claims on the guarantees. E.ON has
recognized a liability for this in the amount of €8 million (2017:
€8 million).
For financial liabilities that bear floating interest rates, the rates
that were fixed on the balance sheet date are used to calculate
future interest payments for subsequent periods as well. Finan-
cial liabilities that can be terminated at any time are assigned
to the earliest maturity band in the same way as put options that
are exercisable at any time. All covenants were complied with
during 2018.
In gross-settled derivatives (usually currency derivatives and
commodity derivatives), outflows are accompanied by related
inflows of funds or commodities.
The net gains and losses from financial instruments by IFRS 9
(prior year: by IAS 39) category are shown in the following
table:
The net result of the category fair value through OCI results in
particular from interest income and proceeds from the sale of
fair value through OCI securities.
In addition to impairments of financial assets, net gains and
losses in the amortized cost category are due primarily to interest
income from financial assets and liabilities and effects from the
currency translation of financial liabilities.
The net gains and losses in the fair value through profit or loss
measurement category encompass both the changes in fair value
of equity instruments, from derivative financial instruments and
gains and losses on realiza tion. The changes in market value in
2018 were primarily influenced by the derecognition in income
of derivative financial instruments related to the sale of Uniper
(see Note 4).
Impairments of Financial Assets
Impairment losses on financial assets must be recognized not
only for losses already incurred but also for expected future
credit losses. E.ON takes into account expected future credit
losses of financial assets carried at amortized cost, financial
assets measured at fair value through other comprehensive
income, and receivables from finance leases.
For trade receivables, expected credit losses are recognized over
their entire residual term using the simplified method (lifetime
ECL trade receivables). For other financial assets, E.ON first deter-
mines the credit loss expected within the first twelve months
(stage 1—12 month ECL). In derogation of this, in the event of
a significant increase in the default risk, the expected credit loss
over the entire residual term of the respective instrument is
recognized (stage 2—lifetime ECL). A significant increase in the
default risk is assumed if the internally determined counterparty
risk has been downgraded by at least three levels since initial
recognition. If there are objective indications of an actual default,
an individual impairment loss must be recognized on the income
statement (stage 3—losses already incurred).Net Gains and Losses by Category
€ in millions 2017
Loans and receivables -64
Available for sale 334
Held for trading -1,084
Amortized cost -517
Total -1,331
Net Gains and Losses by Category
€ in millions 2018
Financial assets amortized cost -25
Financial liabilities amortized cost -659
Fair value through P&L 711
Fair value through OCI 65
Total 92
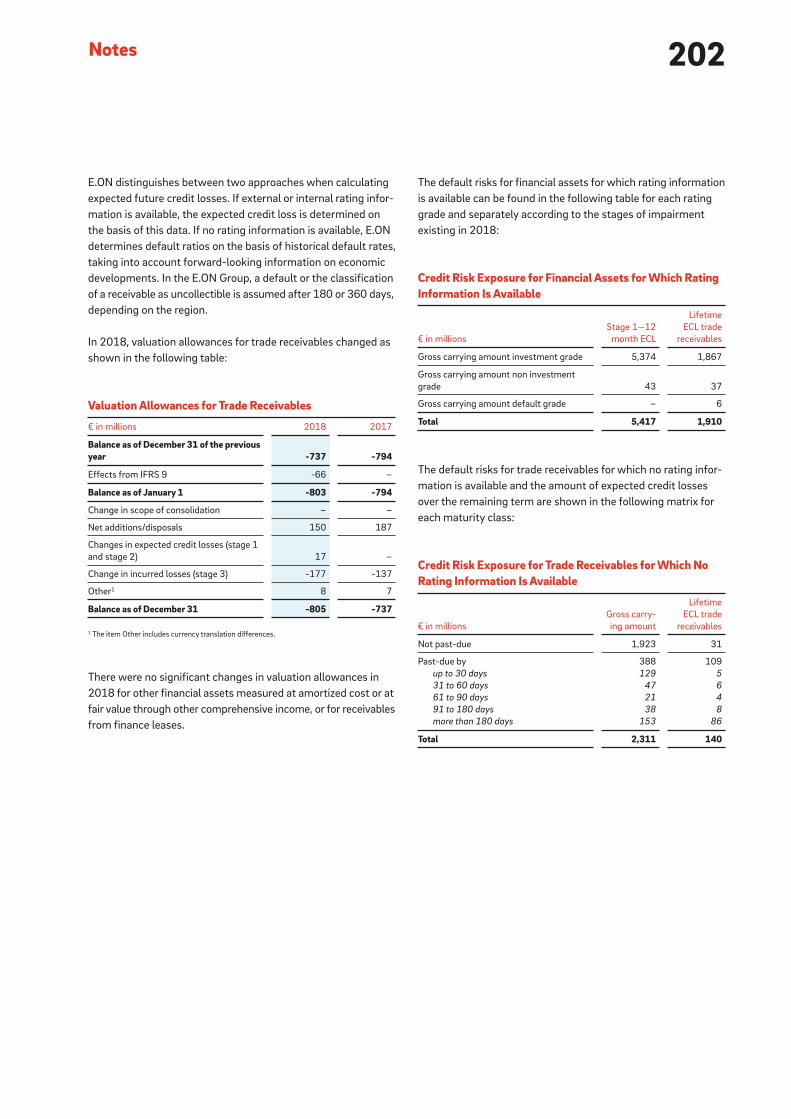
202Notes
The default risks for financial assets for which rating information
is available can be found in the following table for each rating
grade and separately according to the stages of impairment
existing in 2018:
The default risks for trade receivables for which no rating infor-
mation is available and the amount of expected credit losses
over the remaining term are shown in the following matrix for
each maturity class:
E.ON distinguishes between two approaches when calculating
expected future credit losses. If external or internal rating infor-
mation is available, the expected credit loss is determined on
the basis of this data. If no rating information is available, E.ON
determines default ratios on the basis of historical default rates,
taking into account forward-looking information on economic
developments. In the E.ON Group, a default or the classification
of a receivable as uncollectible is assumed after 180 or 360 days,
depending on the region.
In 2018, valuation allowances for trade receivables changed as
shown in the following table:
There were no significant changes in valuation allowances in
2018 for other financial assets measured at amortized cost or at
fair value through other comprehensive income, or for receivables
from finance leases.
Valuation Allowances for Trade Receivables
€ in millions 2018 2017
Balance as of December 31 of the previous year -737 -794
Effects from IFRS 9 -66 –
Balance as of January 1 -803 -794
Change in scope of consolidation – –
Net additions/disposals 150 187
Changes in expected credit losses (stage 1
and stage 2) 17 –
Change in incurred losses (stage 3) -177 -137
Other 1 8 7
Balance as of December 31 -805 -737
1 The item Other includes currency translation differences.
Credit Risk Exposure for Financial Assets for Which Rating Information Is Available
€ in millions
Stage 1—12
month ECL
Lifetime
ECL trade
receivables
Gross carrying amount investment grade 5,374 1,867
Gross carrying amount non investment
grade 43 37
Gross carrying amount default grade – 6
Total 5,417 1,910
Credit Risk Exposure for Trade Receivables for Which No Rating Information Is Available
€ in millions
Gross carry-
ing amount
Lifetime
ECL trade
receivables
Not past-due 1,923 31
Past-due by 388 109
up to 30 days 129 5
31 to 60 days 47 6
61 to 90 days 21 4
91 to 180 days 38 8
more than 180 days 153 86
Total 2,311 140

203CEO Letter
Report of the Supervisory Board
E.ON Stock
Strategy and Objectives
Combined Group Management Report
Combined Non-Financial Report
Consolidated Financial Statements
Further Information
Risk Management
PrinciplesThe prescribed processes, responsibilities and actions concerning
financial and risk management are described in detail in internal
risk management guidelines applicable throughout the Group. The
units have developed additional guidelines of their own within
the confines of the Group’s overall guidelines. To ensure efficient
risk management at the E.ON Group, the Trading (Front Office),
Financial Controlling (Middle Office) and Financial Settlement
(Back Office) departments are organized as strictly separate units.
Risk controlling and reporting in the areas of interest rates,
currencies and credit area for banks and liquidity management
is performed by the Financial Controlling department, while risk
controlling and reporting in the area of commodities and in the
credit area for industrial enterprises is performed at Group level
by a separate department.
E.ON uses a Group-wide treasury, risk management and report-
ing system. This system is a standard information technology
solution that is fully integrated and is continuously updated.
The system is designed to provide for the analysis and monitor-
ing of the E.ON Group’s exposure to liquidity, foreign exchange
and interest risks. On a Group-wide basis, Financial Controlling
monitors and controls credit risks for banks, and Risk Manage-
ment monitors and controls industrial enterprises. These activ-
ities are carried out using a uniform standard software package.
Separate Risk Committees are responsible for the maintenance
and further development of the strategy set by the Management
Board of E.ON SE with regard to commodity, treasury and credit
risk management policies.
1. Liquidity ManagementThe primary objectives of liquidity management at E.ON consist
of ensuring ability to pay at all times, the timely satisfaction of
contractual payment obligations and the optimization of costs
within the E.ON Group.
Cash pooling and external financing are largely centralized at
E.ON SE and certain financing companies. Funds are provided
to the other Group companies as needed on the basis of an
“in-house banking” solution.
E.ON SE determines the Group’s financing requirements on the
basis of short- and medium-term liquidity planning. The financing
of the Group is controlled and implemented on a forward-looking
basis in accordance with the planned liquidity requirement or
surplus. Relevant planning factors taken into consideration include
operating cash flow, capital expenditures, divestments, margin
payments and the maturity of bonds and commercial paper.
2. Price RisksIn the normal course of business, the E.ON Group is exposed to
risks arising from price changes in foreign exchange, interest
rates, commodities and asset management. These risks create
volatility in earnings, equity, debt and cash flows from period
to period. E.ON has developed a variety of strategies to limit or
eliminate these risks, including the use of derivative financial
instruments, among others.

204Notes
In addition, derivative and primary financial instruments are
employed as needed. The hedges qualify for hedge accounting
under IFRS as hedges of net investments in foreign operations.
The Group’s translation risks are reviewed at regular intervals
and the level of hedging is adjusted whenever necessary. The
respective debt factor, net assets and the enterprise value
denominated in the foreign currency are the principal criteria
governing the level of hedging.
The E.ON Group is also exposed to operating and financial trans-
action risks attributable to foreign currency transactions. The
subsidiaries are respon sible for controlling their operating cur-
rency risks. E.ON SE coordinates hedging throughout the Group
and makes use of external derivatives as needed.
Financial transaction risks result from payments originating
from financial receivables and payables. They are generated both
by external financing in a variety of foreign currencies, and by
shareholder loans from within the Group denominated in foreign
currency. Financial transaction risks are generally fully hedged.
The one-day value-at-risk (99 percent confidence) from the
translation of deposits and borrowings denominated in foreign
currency, plus foreign-exchange derivatives, was €67 million
as of December 31, 2018 (2017: €100 million) and resulted
primarily from the positions in British pounds, US dollars and
Swedish kronor.
3. Credit RisksE.ON is exposed to credit risk in its operating activities and
through the use of financial instruments. Uniform credit risk
management procedures are in place throughout the Group to
identify, measure and control credit risks.
The following discussion of E.ON’s risk management activities
and the estimated amounts generated from profit-at-risk (“PaR”),
value-at-risk (“VaR”) and sensitivity analyses are “forward-
looking statements” that involve risks and uncertainties. Actual
results could differ materially from those projected due to
actual, unforeseeable developments in the global financial mar-
kets. The methods used by the Company to analyze risks should
not be considered forecasts of future events or losses. For
example, E.ON faces certain risks that are either non-financial
or non-quantifiable. Such risks principally include country risk,
oper ational risk, regulatory risk and legal risk, which are not
represented in the following analyses.
Foreign Exchange Risk ManagementE.ON SE is responsible for controlling the currency risks to
which the E.ON Group is exposed.
Because it holds interests in businesses outside of the euro area,
currency translation risks arise within the E.ON Group. Fluctua-
tions in exchange rates produce accounting effects attributable
to the translation of the balance sheet and income statement
items of the foreign consolidated Group companies included in
the Consolidated Financial Statements. Translation risks are
hedged through borrowing in the corresponding local currency,
which may also include shareholder loans in foreign currency.

205CEO Letter
Report of the Supervisory Board
E.ON Stock
Strategy and Objectives
Combined Group Management Report
Combined Non-Financial Report
Consolidated Financial Statements
Further Information
Interest Risk ManagementE.ON is exposed to profit risks arising from floating-rate financial
liabilities. Positions based on fixed interest rates, on the other
hand, are subject to changes in fair value resulting from the
volatility of market rates. E.ON seeks a specific mix of fixed-
interest and floating-rate debt over time. This is influenced,
among other factors, by the type of business model, existing
liabilities as well as the regulatory framework in which E.ON
operates. To manage the interest rate position, several instru-
ments, including derivatives, are deployed.
With interest rate derivatives included, the share of financial
liabilities with floating interest rates was 0 percent as of Decem-
ber 31, 2018 (2017: 0 percent). Under otherwise unchanged
circumstances, the volume of financial liabilities with fixed inter-
est rates, which amounted to €8.6 billion at year-end 2018,
would decline to €7.2 billion in 2019 and €7.2 billion in 2020.
The effective interest rate duration of the financial liabilities,
including interest rate deriv atives, was 13.5 years as of Decem-
ber 31, 2018 (2017: 12.0 years). The volume-weighted average
interest rate of the financial liabilities, including interest rate
deriv atives, was 5.3 percent as of December 31, 2018 (2017:
5.4 percent).
As of December 31, 2018, the E.ON Group held interest rate
derivatives with a nominal value of €4,495 million (2017:
€4,533 million).
A sensitivity analysis was performed on the Group’s short-term
floating-rate borrowings, including hedges of both foreign
exchange risk and interest risk. This measure is used for internal
risk controlling and reflects the economic position of the E.ON
Group. A one-percentage-point upward or downward change in
interest rates (across all currencies) would raise or lower interest
charges by ±€8.0 million (2017: ±€0 million) in the subsequent
fiscal year.
Commodity Price Risk ManagementThe E.ON portfolio of physical assets, long-term contracts
and end-customer sales is exposed to substantial risks from
fluc tuations in commodity prices. The principal commodity
prices to which E.ON is exposed relate to electricity, gas and
emission certificates.
The objective of commodity risk management is to transact
through physical and financial contracts to optimize the value
of the portfolio while reducing the potential negative deviation
from target EBIT.
Since the spinoff of Uniper, E.ON has established procurement
capabilities for its sales business and thus ensured market access
for E.ON’s remaining energy production. In the normal course
of business of the underlying energy production and retail sales
activities, E.ON’s individual management units are exposed to
uncertain commodity market prices, which impacts operating
gains and costs. All external trading on commodity markets
must be related to reducing open commodity positions and be
undertaken in strict accordance with approved commodity
hedging strategies.
Due to the decentralized governance approach and the primary
focus on procurement and purely hedging transactions, the
allocation of risk capital is no longer necessary. The processes
and operational management models within the trading system
are monitored by the local market risk teams and centrally
managed by the Risk Management department. At the end of
2018, the open position from the procurement on the markets
in Germany, the U.K., the Czech Republic, Sweden, Romania
and Hungary for the reporting period from 2019 to 2021 was
not more than 2,400 GWh per commodity in each case. The
biggest drivers primarily relate to the special market conditions
in Romania, where hedging activities are carried out within the
approved commodity hedging strategy.
206Notes
As of December 31, 2018, the E.ON Group primarily held elec-
tricity and gas derivatives with a nominal value of €4,076 million
(2017: €3,958 million).
A key foundation of the commodity risk management system is
the Group-wide Commodity Risk Policy and the corresponding
internal policies of the units. These specify the control principles
for commodity risk management, minimum required standards
and clear management and operational responsibilities.
The risk policy was updated at the beginning of 2017 with a focus
on the Renewables and PreussenElektra electricity generation
business and the regional distribution business. The central
market-oriented business approach was replaced by decentral-
ized commodity risk management with regional market access.
Commodity exposures and risks are reported across the Group
on a monthly basis to the members of the Risk Committee.
Credit Risk ManagementIn order to minimize credit risk arising from operating activities
and from the use of financial instruments, the Company enters
into transactions only with counterparties that satisfy the Com-
pany’s internally established minimum requirements. Maxi-
mum credit risk limits are set on the basis of internal and (where
available) external credit ratings. The setting and monitoring of
credit limits is subject to certain minimum requirements, which
are based on Group-wide credit risk management guidelines.
Long-term operating contracts and asset management trans-
actions are not comprehensively included in this process. They
are monitored separately at the level of the responsible units.
In principle, each Group company is responsible for managing
credit risk in its operating activities. Depending on the nature of
the operating activities and the credit risk, additional credit risk
monitoring and controls are performed both by the units and
by Corporate Headquarters. Monthly reports on credit limits,
including their utilization, are submitted to the Risk Committee.
Intensive, standardized monitoring of quantitative and qualita-
tive early- warning indicators, as well as close monitoring of
the credit quality of counterparties, enable E.ON to act early in
order to minimize risk.
To the extent possible, pledges of collateral are negotiated with
counterparties for the purpose of reducing credit risk. Accepted
as collateral are guarantees issued by the respective parent
companies or evidence of profit and loss pooling agreements in
combination with letters of awareness. To a lesser extent, the
Company also requires bank guarantees and deposits of cash and
securities as collateral to reduce credit risk. Risk-management
collateral was accepted in the amount of €1,301 million.

207CEO Letter
Report of the Supervisory Board
E.ON Stock
Strategy and Objectives
Combined Group Management Report
Combined Non-Financial Report
Consolidated Financial Statements
Further Information
The levels and details of financial assets received as collateral
are described in more detail in Notes 18 and 26.
Derivative transactions are generally executed on the basis of
standard agreements that allow for the netting of all open
transactions with individual counterparties. To further reduce
credit risk, bilateral margining agreements are entered into
with selected counterparties. Limits are imposed on the credit
and liquidity risk resulting from bilateral margining agreements.
There is no credit risk with respect to the exchange-traded for-
ward and option contracts with an aggregate nominal value of
€630 million as of December 31, 2018 (2017: €189 million).
For the remaining financial instruments, the maximum risk of
default is equal to their carrying amounts.
At E.ON, liquid funds are normally invested at banks with good
credit ratings, in money market funds with first-class ratings
or in short-term securities (for example, commercial paper) of
issuers with strong credit ratings. Bonds of public and private
issuers are also selected for investment. Group companies that
for legal reasons are not included in the cash pool invest money
at leading local banks. Standardized credit assessment and
limit-setting is complemented by daily monitoring of CDS levels
at the banks and at other significant counterparties.
Asset Management
For the purpose of financing long-term payment obligations,
including those relating to asset retirement obligations (see
Note 25) and cash investments, financial investments totaling
€1.4 billion (2017: €3.3 billion) were held predominantly by
German E.ON Group companies as of December 31, 2018.
These financial assets are invested on the basis of an accumula-
tion strategy (total-return approach), with investments broadly
diversified across the various asset classes, for example the
money market, bond and equity asset classes, as well as alter-
native asset classes like real estate. The majority of the assets are
held in investment funds managed by external fund managers.
Corporate Asset Management at E.ON SE, which is part of the
Company’s Finance Department, is responsible for continuous
monitoring of overall risks and those concerning individual fund
managers. The three-month VaR with a 98-percent confidence
interval for these financial assets was €54 million (2017:
€38 million).
In addition, the mutual insurance fund Versorgungskasse Energie
VVaG i.L. (“VKE i.L.”), which is currently in liquidation, still man-
ages financial assets totaling €78.8 million at year-end 2018
(2017: €1.1 billion). The shares of VKE i.L.’s guarantee fund
assets attributable to the E.ON Group were transferred to the
CTA (see Note 24) as an equivalent follow-on solution in the first
half of 2018. Non-consolidated shares of VKE i.L.’s guarantee
fund assets were correspondingly transferred to the respective
follow-on solutions of the member companies of VKE i.L. con-
cerned and thus deconsolidated.
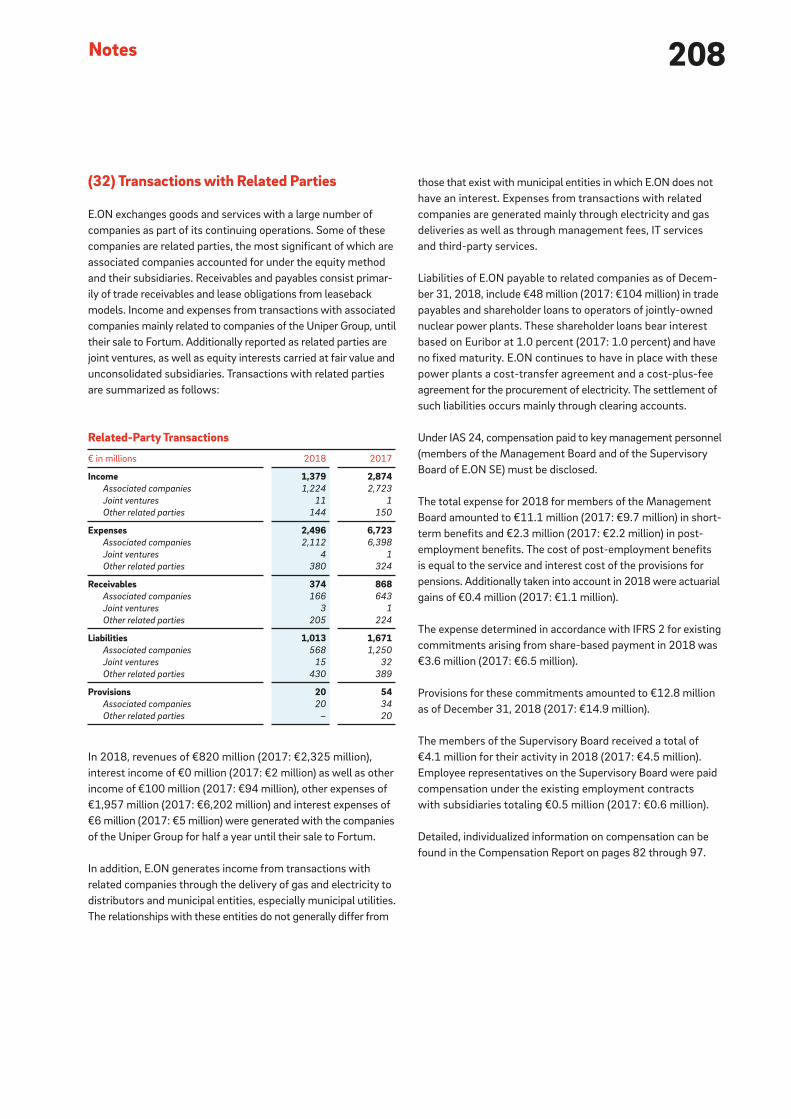
208Notes
those that exist with municipal entities in which E.ON does not
have an interest. Expenses from transactions with related
companies are generated mainly through electricity and gas
deliveries as well as through management fees, IT services
and third-party services.
Liabilities of E.ON payable to related companies as of Decem-
ber 31, 2018, include €48 million (2017: €104 million) in trade
payables and shareholder loans to operators of jointly-owned
nuclear power plants. These shareholder loans bear interest
based on Euribor at 1.0 percent (2017: 1.0 percent) and have
no fixed maturity. E.ON continues to have in place with these
power plants a cost-transfer agreement and a cost-plus-fee
agreement for the procurement of electricity. The settlement of
such liabilities occurs mainly through clearing accounts.
Under IAS 24, compensation paid to key management personnel
(members of the Management Board and of the Super visory
Board of E.ON SE) must be disclosed.
The total expense for 2018 for members of the Management
Board amounted to €11.1 million (2017: €9.7 million) in short-
term benefits and €2.3 million (2017: €2.2 million) in post-
employment benefits. The cost of post-employment benefits
is equal to the service and interest cost of the provisions for
pensions. Additionally taken into account in 2018 were actuarial
gains of €0.4 million (2017: €1.1 million).
The expense determined in accordance with IFRS 2 for existing
commitments arising from share-based payment in 2018 was
€3.6 million (2017: €6.5 million).
Provisions for these commitments amounted to €12.8 million
as of December 31, 2018 (2017: €14.9 million).
The members of the Supervisory Board received a total of
€4.1 million for their activity in 2018 (2017: €4.5 million).
Employee representatives on the Supervisory Board were paid
compensation under the existing employment contracts
with subsidiaries totaling €0.5 million (2017: €0.6 million).
Detailed, individualized information on compensation can be
found in the Compensation Report on pages 82 through 97.
(32) Transactions with Related Parties
E.ON exchanges goods and services with a large number of
companies as part of its continuing operations. Some of these
companies are related parties, the most significant of which are
associated companies accounted for under the equity method
and their subsidiaries. Receivables and payables consist primar-
ily of trade receivables and lease obligations from leaseback
models. Income and expenses from transactions with associated
companies mainly related to companies of the Uniper Group, until
their sale to Fortum. Additionally reported as related parties are
joint ventures, as well as equity interests carried at fair value and
unconsolidated subsidiaries. Transactions with related parties
are summarized as follows:
In 2018, revenues of €820 million (2017: €2,325 million),
interest income of €0 million (2017: €2 million) as well as other
income of €100 million (2017: €94 million), other expenses of
€1,957 million (2017: €6,202 million) and interest expenses of
€6 million (2017: €5 million) were generated with the companies
of the Uniper Group for half a year until their sale to Fortum.
In addition, E.ON generates income from transactions with
related companies through the delivery of gas and electricity to
distrib utors and municipal entities, especially municipal utilities.
The relationships with these entities do not generally differ from
Related-Party Transactions
€ in millions 2018 2017
Income 1,379 2,874Associated companies 1,224 2,723
Joint ventures 11 1
Other related parties 144 150
Expenses 2,496 6,723Associated companies 2,112 6,398
Joint ventures 4 1
Other related parties 380 324
Receivables 374 868Associated companies 166 643
Joint ventures 3 1
Other related parties 205 224
Liabilities 1,013 1,671Associated companies 568 1,250
Joint ventures 15 32
Other related parties 430 389
Provisions 20 54Associated companies 20 34
Other related parties – 20

209CEO Letter
Report of the Supervisory Board
E.ON Stock
Strategy and Objectives
Combined Group Management Report
Combined Non-Financial Report
Consolidated Financial Statements
Further Information
(33) Segment Reporting
Segment Information
Led by its Corporate Headquarters in Essen, Germany, the E.ON
Group comprises the seven reporting segments described below,
and the Non-Core Business and Corporate Functions/Other, all
of which are reported here in accordance with IFRS 8. The com-
bined segments, which are not separately reportable, in the
East-Central Europe/Turkey Energy Networks unit and the Cus-
tomer Solutions Other unit are of subordinate importance and
have similar economic characteristics with respect to customer
structure, products and distribution channels.
In addition, changes were made to segment reporting in 2018.
The generation business in Turkey is now reported in Non-Core
Business. Within the Customer Solutions unit, the German heating
business is no longer reported under Germany, but under Other.
In addition, costs for the further development of the business with
new digital products and services as well as innovative projects
that were previously included under Corporate Functions/Other
are allocated to the operating units in the Customer Solutions
unit. The prior-year figures were adjusted accordingly.
Energy NetworksGermanyThis segment combines the electricity and gas distribution
networks and all related activities in Germany.
SwedenThis segment comprises the electricity networks businesses in
Sweden.
East-Central Europe/TurkeyThis segment combines the distribution network activities in
the Czech Republic, Hungary, Romania, Slovakia and Turkey.
Customer SolutionsGermanyThis segment consists of activities that supply our customers in
Germany with electricity and gas and the distribution of specific
products and services in areas for improving energy efficiency
and energy independence.
United KingdomThe segment comprises sales activities and customer solutions
in the U.K.
OtherThis segment combines sales activities and the corresponding
Customer Solutions in Sweden, Italy, the Czech Republic, Hungary
and Romania and E.ON Connecting Energies as well as the
heating business in Germany.
RenewablesThe Renewables segment combines the Group’s activities for
the production of wind power plants (onshore and offshore) as
well as solar farms.
On March 12, 2018, E.ON SE entered into an agreement with
RWE AG to acquire the 76.8-percent stake in innogy SE held by
RWE. The acquisition is to take place within the framework of a
comprehensive exchange of business activities and investments.
In this context, E.ON will transfer the majority of its Renewables
business to RWE. Since June 30, 2018, the transferred business
has been reported as a discontinued operation in E.ON’s consoli-
dated financial statements in accordance with IFRS 5 (see Note 4
for further information).
However, until the final transfer to RWE, the activities in the
Renewables business will continue unchanged. For internal
management purposes, these activities will therefore continue
to be fully included in the relevant key performance indicators.
The presentation of key performance indicators in segment
reporting therefore also includes the components attributable to
discontinued operations in the Renewables business. Recon-
ciliations of these figures to the information in the E.ON Group’s
consolidated income statement and consolidated statement of
cash flows are provided on pages 210, 211 and 213.
Non-Core BusinessNon-Core Business comprises the non-strategic activities of the
E.ON Group. This includes the operation of the German nuclear
power plants, which are managed by the PreussenElektra oper-
ating unit, and the electricity generation business in Turkey.
Corporate Functions/OtherCorporate Functions/Other contains E.ON SE itself and the
interests held directly by E.ON SE. Until June 26, 2018, the
Uniper Group, which was accounted for in the consolidated
financial statements using the equity method, was also allo-
cated to this segment. Uniper’s earnings were reported under
non-operating earnings. Additional information regarding the
Uniper Group is provided in Note 4.

210Notes
The following table shows the reconciliation in segment report-
ing of operating cash flow before interest and taxes to operating
cash flow:
1Because of the changes in our reporting, the prior-year figure was adjusted accordingly.2The presentation of our sales in 2018 was substantially affected by the initial application of IFRS 15, “Revenue from Contracts with Customers” (see the commentary in Note 2). 3Adjusted for non-operating effects.4Under IFRS, impairment charges on companies accounted for using the equity method and impairment charges on other financial assets (and any reversals of such charges) are included in
income/loss from companies accounted for using the equity method and financial results, respectively. These income effects are not part of adjusted EBIT.5Operating business including the divisions in the Renewables segment reclassified as discontinued operations in accordance with IFRS 5.
Financial Information by Business Segment 1
€ in millions
Energy Networks Customer Solutions
Germany Sweden ECE/Turkey Germany Sales United Kingdom Other
2018 2017 2018 2017 2018 2017 2018 2017 2018 2017 2018 2017
External sales 4,819 12,536 978 1,038 598 742 6,648 6,986 7,699 7,147 7,289 7,038
Intersegment sales 1,424 1,663 11 34 939 977 120 28 59 58 312 319
Sales 2 6,243 14,199 989 1,072 1,537 1,719 6,768 7,014 7,758 7,205 7,601 7,357
Depreciation and amortization 3 -593 -591 -150 -158 -232 -237 -33 -30 -95 -103 -183 -183
Adjusted EBIT 895 1,030 498 474 451 530 160 102 142 248 111 129Equity-method earnings 4 69 74 – – 97 157 – – – – 10 14
Operating cash flow before interest and taxes 1,559 2,429 771 640 652 605 273 284 92 401 211 237
Investments 802 703 341 345 454 371 35 25 207 211 395 360
Reconciliation of Sales
€ in millions
E.ON Group
Reclassified businesses
at Renewables
E.ON Group
(continuing operations)
2018 2017 2018 2017 2018 2017
Sales 30,253 37,965 -688 -668 29,565 37,297

211CEO Letter
Report of the Supervisory Board
E.ON Stock
Strategy and Objectives
Combined Group Management Report
Combined Non-Financial Report
Consolidated Financial Statements
Further Information
The following table shows the reconciliation of operating cash
flow before interest and taxes to operating cash flow from
continuing operations:
The following table shows the reconciliation in segment reporting
of the investments shown in segment reporting to the investments
of continuing operations. The latter correspond to payments for
investments reported in the Consolidated Statements of Cash
Flows.
The equity result in the Renewables segment, which is reported
in the segment information, is fully attributable to discontinued
operations.
Renewables 5
Non-Core BusinessCorporate Functions/
Other Consolidation E.ON Group 5PreussenElektra Generation Turkey
2018 2017 2018 2017 2018 2017 2018 2017 2018 2017 2018 2017
784 767 1,399 1,585 – – 38 125 1 1 30,253 37,965
970 837 – – – – 606 671 -4,441 -4,587 0 0
1,754 1,604 1,399 1,585 – – 644 796 -4,440 -4,586 30,253 37,965
-340 -331 -157 -148 – – -72 -100 4 – -1,851 -1,881
521 454 399 506 -17 -113 -153 -275 -18 -11 2,989 3,074 44 24 53 55 -17 -113 65 67 -1 -1 320 277
657 601 199 -7,357 – – -328 -81 1 6 4,087 -2,235
1,037 1,225 15 14 154 – 86 53 -3 1 3,523 3,308
Reconciliation of Operating Cash Flow
€ in millions 2018 2017
Operating cash flow before interest and taxes 4,087 -2,235
Interest payments -606 -234
Tax payments -628 -483
Operating cash flow 2,853 -2,952
Reclassified businesses at Renewables -558 -557
Operating cash flow from continuing operations 2,295 -3,509
Reconciliation of Investments
€ in millions 2018 2017
Investments 3,523 3,308
Reclassified businesses at Renewables -1,036 -1,212
Investments from continuing operations 2,487 2,096

212Notes
In addition, earnings from discontinued operations in the Renew-
ables segment, adjusted for non-operating effects, are also
included in adjusted EBIT. Pursuant to IFRS 5, equity carried
forward from investments in discontinued operations is to be
terminated. However, this will be continued within the frame-
work of internal management and will then also be included in
adjusted EBIT. As with the treatment of the effects of the equity
carried forward, depreciation in discontinued operations, which
is generally to be deferred in accordance with IFRS 5, is continued
and carried forward in adjusted EBIT.
Net book gains in 2018 were significantly above the prior-year
level. The increase resulted primarily from the disposal of our
Uniper shareholding, Hamburg Netz, and E.ON Gas Sverige. By
contrast, the IPO of Enerjisa Enerji in Turkey resulted in an over-
all loss. The prior-year figure also included income from the
sale of an interest in Customer Solutions in Sweden. In addition,
income from the disposal of securities was significantly lower
than in the prior year.
Restructuring expenditures decreased substantially year on year.
Among other factors, the decline is attributable to significantly
lower expenses in connection with Group-wide cost reduction
programs. In contrast, expenses in connection with the planned
acquisition of innogy were included for the first time in 2018.
Marking to market of derivatives used to protect our operating
business from price fluctuations, as well as other derivatives,
resulted in a positive effect of €610 million as of December 31,
2018 (previous year: -€954 million). The positive value in 2018
is mainly attributable to the derecognition of derivative financial
Adjusted EBIT
Adjusted EBIT, a measure of earnings before interest and taxes
(“EBIT”) adjusted to exclude non-operating effects, is used at
E.ON for purposes of internal management control and as the
most important indicator of a business’s sustainable earnings
power.
The E.ON Management Board is convinced that adjusted EBIT is
the most suitable key figure for assessing operating performance
because it presents a business’s operating earnings independently
of non-operating factors, interest, and taxes.
Unadjusted EBIT represents the Group’s income/loss reported
in accordance with IFRS before financial results and income
taxes, taking into account the net income/expense from equity
investments. To improve its meaningfulness as an indicator of
the sustainable earnings power of the E.ON Group’s business,
unadjusted EBIT is adjusted for certain non-operating effects.
Operating earnings also include income from investment subsi-
dies for which liabilities are recognized.
The non-operating earnings effects for which EBIT is adjusted
include, in particular, non-operating interest expense/income,
income and expenses from the marking to market of derivative
financial instruments used for hedging and, where material,
book gains/losses, certain restructuring expenses, impairment
charges and reversals recognized in the context of impairment
tests on non-current assets, on equity investments in affiliated or
associated companies and on goodwill, and other contributions
to non-operating earnings. The refund of the nuclear-fuel tax
was also reported in non-operating earnings in the prior year.
In addition, since the 2017 fiscal year, effects from the valuation
of certain provisions on the balance sheet date are disclosed
in non-operating earnings. The change in recognition results in
improved presentation of sustainable earnings power.

213CEO Letter
Report of the Supervisory Board
E.ON Stock
Strategy and Objectives
Combined Group Management Report
Combined Non-Financial Report
Consolidated Financial Statements
Further Information
instruments in connection with contractual rights and obligations
from the sale of the Uniper shares in the second quarter. As in
the previous year, other effects arose from hedging price fluctu-
ations, particularly in Customer Solutions.
In the 2018 reporting period, impairments were recognized
in particular in the areas of Customer Solutions in the United
Kingdom and E.ON Connecting Energies. In the prior year,
impairments were incurred primarily in the UK Customer Solu-
tions segment.
Reconciliation of Income before Financial Results and Income Taxes
€ in millions 2018 2017
Income/Loss from continuing operations before financial results and income taxes 3,953 4,932
Income/Loss from equity investments 44 -5
EBIT 3,997 4,927
Non-operating adjustments -1,521 -2,293Net book gains/losses -857 -375
Restructuring/cost-management expenses 64 539
Market valuation derivatives -610 954
Impairments (+)/Reversals (-) 61 171
Other non-operating earnings -179 -3,582
Reclassified businesses of Renewables (scheduled depreciation) 513 440
Adjusted EBIT 2,989 3,074
Impairments (+)/Reversals (-) 45 72
Scheduled depreciation and amortization 1,475 1,488
Reclassified businesses of Renewables (scheduled depreciation and amortization, impairments and reversals) 331 321
Adjusted EBITDA 4,840 4,955
Pages 32 and 33 of the Combined Group Management Report
provide a more detailed explanation of the reconciliation of
adjusted EBIT to the net income/loss reported in the Consolidated
Financial Statements.
The significant decrease in other non-operating earnings is pri-
marily attributable to the refund of the nuclear-fuel tax included
in the previous year. The equity earnings contribution of Uniper
is also included in 2017. Effective the end of September 2017,
we classify Uniper as an asset held for sale. The equity method
has not been used since then.
The following table shows the reconciliation of earnings before
interest and taxes to adjusted EBIT or adjusted EBITDA:
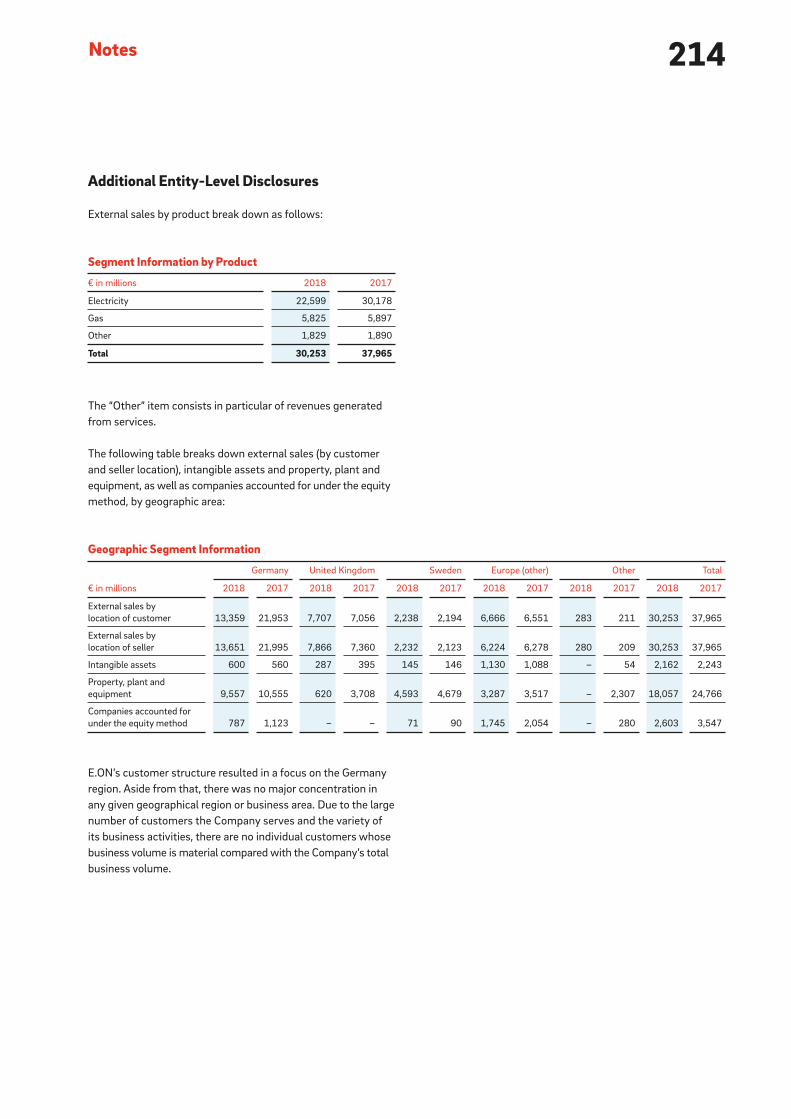
214Notes
E.ON’s customer structure resulted in a focus on the Germany
region. Aside from that, there was no major concentration in
any given geographical region or business area. Due to the large
number of customers the Company serves and the variety of
its business activities, there are no indi vidual customers whose
business volume is material compared with the Company’s total
business volume.
Geographic Segment Information
€ in millions
Germany United Kingdom Sweden Europe (other) Other Total
2018 2017 2018 2017 2018 2017 2018 2017 2018 2017 2018 2017
External sales by
location of customer 13,359 21,953 7,707 7,056 2,238 2,194 6,666 6,551 283 211 30,253 37,965
External sales by
location of seller 13,651 21,995 7,866 7,360 2,232 2,123 6,224 6,278 280 209 30,253 37,965
Intangible assets 600 560 287 395 145 146 1,130 1,088 – 54 2,162 2,243
Property, plant and
equipment 9,557 10,555 620 3,708 4,593 4,679 3,287 3,517 – 2,307 18,057 24,766
Companies accounted for
under the equity method 787 1,123 – – 71 90 1,745 2,054 – 280 2,603 3,547
Additional Entity-Level Disclosures
External sales by product break down as follows:
The “Other” item consists in particular of revenues generated
from services.
The following table breaks down external sales (by customer
and seller location), intangible assets and property, plant and
equipment, as well as companies accounted for under the equity
method, by geographic area:
Segment Information by Product
€ in millions 2018 2017
Electricity 22,599 30,178
Gas 5,825 5,897
Other 1,829 1,890
Total 30,253 37,965
215CEO Letter
Report of the Supervisory Board
E.ON Stock
Strategy and Objectives
Combined Group Management Report
Combined Non-Financial Report
Consolidated Financial Statements
Further Information
(34) Compensation of Supervisory Board and Management Board
Supervisory Board
Total remuneration to members of the Supervisory Board in
2018 amounted to €4.1 million (2017: €4.5 million).
As in 2017 there were no loans to members of the Supervisory
Board in 2018.
The Supervisory Board’s compensation structure and the
amounts for each member of the Supervisory Board are
presented on page 96 and 97 in the Compensation Report.
Additional information about the members of the Supervisory
Board is provided on pages 242 and 243.
Management Board
Total compensation of the Management Board in 2018 amounted
to €15.9 million (2017: €14 million). This consisted of base
salary, bonuses, other compensation elements and share-based
payments.
In 2018, the members of the Management Board were granted
second-tranche virtual shares under the E.ON Performance
Plan (2017: first tranche of the E.ON Performance Plan) with
a value of €4.9 million (2017: €4.4 million) and a total number
of shares of 760,078 (2017: 751,857).
Total payments to former members of the Management Board
and their beneficiaries amounted to €12.5 million (2017:
€12.4 million). Provisions of €155.8 million (2017: €159 million)
have been established for the pension obligations to former
members of the Management Board and their beneficiaries.
As in 2017, there were no loans to members of the Management
Board in 2018.
The Management Board’s compensation structure and the indi-
vidual amounts for each member of the Management Board as
well as additional disclosures on the amounts are presented on
pages 82 through 95 in the Compensation Report.
Additional information about the members of the Management
Board is provided on page 244.
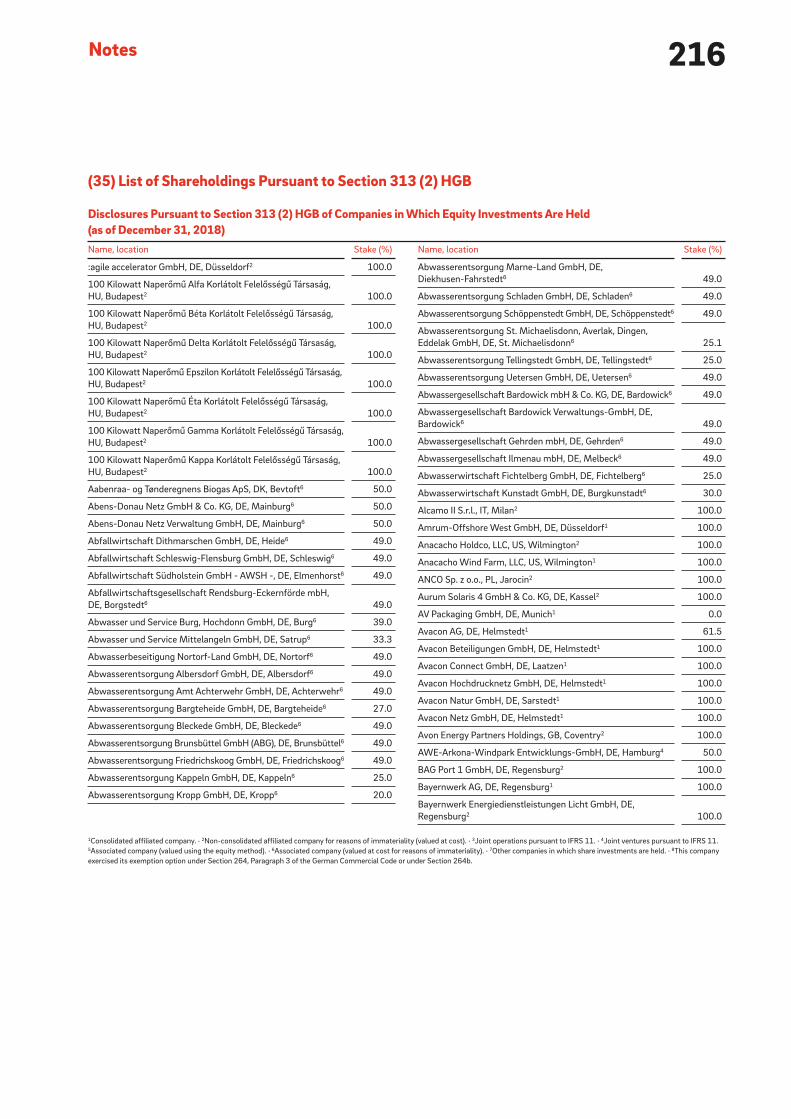
216Notes
(35) List of Shareholdings Pursuant to Section 313 (2) HGB
Disclosures Pursuant to Section 313 (2) HGB of Companies in Which Equity Investments Are Held (as of December 31, 2018)
1Consolidated affiliated company. · 2Non-consolidated affiliated company for reasons of immateriality (valued at cost). · 3Joint operations pursuant to IFRS 11. · 4Joint ventures pursuant to IFRS 11.5Associated company (valued using the equity method). · 6Associated company (valued at cost for reasons of immateriality). · 7Other companies in which share investments are held. · 8This company
exercised its exemption option under Section 264, Paragraph 3 of the German Commercial Code or under Section 264b.
Name, location Stake (%)
Abwasserentsorgung Marne-Land GmbH, DE,
Diekhusen-Fahrstedt 6 49.0
Abwasserentsorgung Schladen GmbH, DE, Schladen 6 49.0
Abwasserentsorgung Schöppenstedt GmbH, DE, Schöppenstedt 6 49.0
Abwasserentsorgung St. Michaelisdonn, Averlak, Dingen,
Eddelak GmbH, DE, St. Michaelisdonn 6 25.1
Abwasserentsorgung Tellingstedt GmbH, DE, Tellingstedt 6 25.0
Abwasserentsorgung Uetersen GmbH, DE, Uetersen 6 49.0
Abwassergesellschaft Bardowick mbH & Co. KG, DE, Bardowick 6 49.0
Abwassergesellschaft Bardowick Verwaltungs-GmbH, DE,
Bardowick 6 49.0
Abwassergesellschaft Gehrden mbH, DE, Gehrden 6 49.0
Abwassergesellschaft Ilmenau mbH, DE, Melbeck 6 49.0
Abwasserwirtschaft Fichtelberg GmbH, DE, Fichtelberg 6 25.0
Abwasserwirtschaft Kunstadt GmbH, DE, Burgkunstadt 6 30.0
Alcamo II S.r.l., IT, Milan 2 100.0
Amrum-Offshore West GmbH, DE, Düsseldorf 1 100.0
Anacacho Holdco, LLC, US, Wilmington 2 100.0
Anacacho Wind Farm, LLC, US, Wilmington 1 100.0
ANCO Sp. z o.o., PL, Jarocin 2 100.0
Aurum Solaris 4 GmbH & Co. KG, DE, Kassel 2 100.0
AV Packaging GmbH, DE, Munich 1 0.0
Avacon AG, DE, Helmstedt 1 61.5
Avacon Beteiligungen GmbH, DE, Helmstedt 1 100.0
Avacon Connect GmbH, DE, Laatzen 1 100.0
Avacon Hochdrucknetz GmbH, DE, Helmstedt 1 100.0
Avacon Natur GmbH, DE, Sarstedt 1 100.0
Avacon Netz GmbH, DE, Helmstedt 1 100.0
Avon Energy Partners Holdings, GB, Coventry 2 100.0
AWE-Arkona-Windpark Entwicklungs-GmbH, DE, Hamburg 4 50.0
BAG Port 1 GmbH, DE, Regensburg 2 100.0
Bayernwerk AG, DE, Regensburg 1 100.0
Bayernwerk Energiedienstleistungen Licht GmbH, DE,
Regensburg 2 100.0
Name, location Stake (%)
:agile accelerator GmbH, DE, Düsseldorf 2 100.0
100 Kilowatt Naperőmű Alfa Korlátolt Felelősségű Társaság,
HU, Budapest 2 100.0
100 Kilowatt Naperőmű Béta Korlátolt Felelősségű Társaság,
HU, Budapest 2 100.0
100 Kilowatt Naperőmű Delta Korlátolt Felelősségű Társaság,
HU, Budapest 2 100.0
100 Kilowatt Naperőmű Epszilon Korlátolt Felelősségű Társaság,
HU, Budapest 2 100.0
100 Kilowatt Naperőmű Éta Korlátolt Felelősségű Társaság,
HU, Budapest 2 100.0
100 Kilowatt Naperőmű Gamma Korlátolt Felelősségű Társaság,
HU, Budapest 2 100.0
100 Kilowatt Naperőmű Kappa Korlátolt Felelősségű Társaság,
HU, Budapest 2 100.0
Aabenraa- og Tønderegnens Biogas ApS, DK, Bevtoft 6 50.0
Abens-Donau Netz GmbH & Co. KG, DE, Mainburg 6 50.0
Abens-Donau Netz Verwaltung GmbH, DE, Mainburg 6 50.0
Abfallwirtschaft Dithmarschen GmbH, DE, Heide 6 49.0
Abfallwirtschaft Schleswig-Flensburg GmbH, DE, Schleswig 6 49.0
Abfallwirtschaft Südholstein GmbH - AWSH -, DE, Elmenhorst 6 49.0
Abfallwirtschaftsgesellschaft Rendsburg-Eckernförde mbH,
DE, Borgstedt 6 49.0
Abwasser und Service Burg, Hochdonn GmbH, DE, Burg 6 39.0
Abwasser und Service Mittelangeln GmbH, DE, Satrup 6 33.3
Abwasserbeseitigung Nortorf-Land GmbH, DE, Nortorf 6 49.0
Abwasserentsorgung Albersdorf GmbH, DE, Albersdorf 6 49.0
Abwasserentsorgung Amt Achterwehr GmbH, DE, Achterwehr 6 49.0
Abwasserentsorgung Bargteheide GmbH, DE, Bargteheide 6 27.0
Abwasserentsorgung Bleckede GmbH, DE, Bleckede 6 49.0
Abwasserentsorgung Brunsbüttel GmbH (ABG), DE, Brunsbüttel 6 49.0
Abwasserentsorgung Friedrichskoog GmbH, DE, Friedrichskoog 6 49.0
Abwasserentsorgung Kappeln GmbH, DE, Kappeln 6 25.0
Abwasserentsorgung Kropp GmbH, DE, Kropp 6 20.0

217CEO Letter
Report of the Supervisory Board
E.ON Stock
Strategy and Objectives
Combined Group Management Report
Combined Non-Financial Report
Consolidated Financial Statements
Further Information
Disclosures Pursuant to Section 313 (2) HGB of Companies in Which Equity Investments Are Held (as of December 31, 2018)
Name, location Stake (%)
Bayernwerk Energietechnik GmbH, DE, Regensburg 2 100.0
Bayernwerk Natur 1. Beteiligungs-GmbH, DE, Regensburg 2 100.0
Bayernwerk Natur GmbH, DE, Unterschleißheim 1 100.0
Bayernwerk Netz GmbH, DE, Regensburg 1 100.0
Bayernwerk Portfolio GmbH & Co. KG, DE, Regensburg 2 100.0
Bayernwerk Portfolio Verwaltungs GmbH, DE, Regensburg 1 100.0
Bayernwerk Regio Energie GmbH, DE, Regensburg 2 100.0
Beteiligung H1 GmbH, DE, Helmstedt 2 100.0
Beteiligung H2 GmbH, DE, Helmstedt 2 100.0
Beteiligung N1 GmbH, DE, Helmstedt 2 100.0
Beteiligung N2 GmbH, DE, Helmstedt 2 100.0
Beteiligungsgesellschaft der Energieversorgungsunternehmen
an der Kerntechnische Hilfsdienst GmbH GbR, DE,
Eggenstein-Leopoldshofen 6 46.3
Beteiligungsgesellschaft e.disnatur mbH, DE, Potsdam 2 100.0
BHL Biomasse Heizanlage Lichtenfels GmbH, DE, Lichtenfels 6 25.1
BHO Biomasse Heizanlage Obernsees GmbH, DE, Hollfeld 6 40.7
BHP Biomasse Heizwerk Pegnitz GmbH, DE, Pegnitz 6 46.5
Bioenergie Merzig GmbH, DE, Merzig 2 51.0
Bioerdgas Hallertau GmbH, DE, Wolnzach 2 90.0
Bioerdgas Schwandorf GmbH, DE, Schwandorf 2 100.0
Biogas Ducherow GmbH, DE, Ducherow 2 80.0
Biogas Steyerberg GmbH, DE, Steyerberg 2 100.0
Biomasseverwertung Straubing GmbH, DE, Straubing 2 100.0
Bio-Wärme Gräfelfing GmbH, DE, Gräfelfing 6 40.0
Blackbeard Solar, LLC, US, Wilmington 2 100.0
Blackbriar Battery, LLC, US, Wilmington 2 100.0
Blackjack Creek Wind Farm, LLC, US, Wilmington 2 100.0
BMV Energie Beteiligungs GmbH, DE, Fürstenwalde/Spree 2 100.0
BMV Energie GmbH & Co. KG, DE, Fürstenwalde/Spree 6 25.6
BO Baltic Offshore GmbH, DE, Hamburg 2 98.0
Boiling Springs Wind Farm, LLC, US, Wilmington 2 100.0
Broken Spoke Solar, LLC, US, Wilmington 2 100.0
Bruenning's Breeze Holdco, LLC, US, Wilmington 2 100.0
Bruenning's Breeze Wind Farm, LLC, US, Wilmington 1 100.0
Name, location Stake (%)
Brunnshög Energi AB, SE, Malmö 2 100.0
BTB Bayreuther Thermalbad GmbH, DE, Bayreuth 6 33.3
Bursjöliden Vind AB, SE, Malmö 2 100.0
Bützower Wärme GmbH, DE, Bützow 6 20.0
Cameleon B.V., NL, Rotterdam 2 100.0
Camellia Solar LLC, US, Wilmington 2 100.0
Camellia Solar Member LLC, US, Wilmington 2 100.0
Cardinal Wind Farm, LLC, US, Wilmington 2 100.0
Cattleman Wind Farm, LLC, US, Wilmington 2 100.0
Cattleman Wind Farm II, LLC, US, Wilmington 2 100.0
Celle-Uelzen Netz GmbH, DE, Celle 1 97.5
Celsium Serwis Sp. z o.o., PL, Skarżysko-Kamienna 2 100.0
Celsium Sp. z o.o., PL, Skarżysko-Kamienna 2 87.8
Champion WF Holdco, LLC, US, Wilmington 1 100.0
Champion Wind Farm, LLC, US, Wilmington 1 100.0
Charge-ON GmbH, DE, Essen 1 100.0
CHN Contractors Limited, GB, Coventry 2 100.0
CHN Electrical Services Limited, GB, Coventry 2 100.0
CHN Group Ltd, GB, Coventry 2 100.0
CHN Special Projects Limited, GB, Coventry 2 100.0
Citigen (London) Limited, GB, Coventry 1 100.0
Clinton Wind, LLC, US, Wilmington 2 100.0
Colbeck’s Corner, LLC, US, Wilmington 1 100.0
Colbeck's Corner Holdco, LLC, US, Wilmington 2 100.0
Colonia-Cluj-Napoca-Energie S.R.L., RO, Cluj-Napoca 6 33.3
Cordova Wind Farm, LLC, US, Wilmington 2 100.0
Cranell Holdco, LLC, US, Wilmington 1 100.0
Cranell Wind Farm, LLC, US, Wilmington 1 100.0
Cremlinger Energie GmbH, DE, Cremlingen 6 49.0
Cuculus GmbH, DE, Ilmenau 6 20.4
Dampfversorgung Ostsee-Molkerei GmbH, DE, Wismar 6 50.0
DD Turkey Holdings S.à r.l., LU, Luxembourg 1 100.0
Delgaz Grid S.A., RO, Târgu Mureş 1 56.5
1Consolidated affiliated company. · 2Non-consolidated affiliated company for reasons of immateriality (valued at cost). · 3Joint operations pursuant to IFRS 11. · 4Joint ventures pursuant to IFRS 11.5Associated company (valued using the equity method). · 6Associated company (valued at cost for reasons of immateriality). · 7Other companies in which share investments are held. · 8This company
exercised its exemption option under Section 264, Paragraph 3 of the German Commercial Code or under Section 264b.

218Notes
Disclosures Pursuant to Section 313 (2) HGB of Companies in Which Equity Investments Are Held (as of December 31, 2018)
Name, location Stake (%)
E.ON Business Services Iași S.A., RO, Iași 2 100.0
E.ON Business Services Regensburg GmbH, DE, Regensburg 1, 8 100.0
E.ON Business Services Sverige AB, SE, Malmö 2 100.0
E.ON Carbon Sourcing North America LLC, US, Wilmington 2 100.0
E.ON CDNE. S.p.A., IT, Milan 2 81.1
E.ON Česká republika, s.r.o., CZ, České Budějovice 1 100.0
E.ON Climate & Renewables Canada Ltd., CA, Saint John 1 100.0
E.ON Climate & Renewables France, FR, Levallois-Perret 2 100.0
E.ON Climate & Renewables GmbH, DE, Essen 1 100.0
E.ON Climate & Renewables Italia S.r.l., IT, Milan 1 100.0
E.ON Climate & Renewables North America, LLC, US, Wilmington 1 100.0
E.ON Climate & Renewables Services GmbH, DE, Essen 2 100.0
E.ON Climate & Renewables UK Biomass Limited, GB, Coventry 1 100.0
E.ON Climate & Renewables UK Blyth Limited, GB, Coventry 1 100.0
E.ON Climate & Renewables UK Developments Limited, GB,
Coventry 1 100.0
E.ON Climate & Renewables UK Humber Wind Limited, GB,
Coventry 1 100.0
E.ON Climate & Renewables UK Limited, GB, Coventry 1 100.0
E.ON Climate & Renewables UK London Array Limited, GB,
Coventry 1 100.0
E.ON Climate & Renewables UK Offshore Wind Limited, GB,
Coventry 1 100.0
E.ON Climate & Renewables UK Operations Limited, GB, Coventry 1 100.0
E.ON Climate & Renewables UK Robin Rigg East Limited, GB,
Coventry 1 100.0
E.ON Climate & Renewables UK Robin Rigg West Limited, GB,
Coventry 1 100.0
E.ON Climate & Renewables UK Wind Limited, GB, Coventry 1 100.0
E.ON Climate & Renewables UK Zone Six Limited, GB, Coventry 1 100.0
E.ON Climate & Renewables Windparks Deutschland GmbH,
DE, Essen 2 100.0
E.ON Connecting Energies GmbH, DE, Essen 1 100.0
E.ON Connecting Energies Italia S.r.l., IT, Milan 1 100.0
E.ON Connecting Energies Limited, GB, Coventry 1 100.0
E.ON Connecting Energies SAS, FR, Levallois-Perret 2 100.0
Name, location Stake (%)
Deutsche Gesellschaft für Wiederaufarbeitung von
Kernbrennstoffen AG & Co. oHG, DE, Gorleben 6 42.5
DOTI Deutsche Offshore-Testfeld- und Infrastruktur-GmbH &
Co. KG, DE, Oldenburg 5 26.3
DOTI Management GmbH, DE, Oldenburg 6 26.3
DOTTO MORCONE S.r.l., IT, Milan 2 100.0
Drivango GmbH, DE, Düsseldorf 2 100.0
Dutchdelta Finance S.à r.l., LU, Luxembourg 1 100.0
E WIE EINFACH GmbH, DE, Cologne 1 100.0
e.dialog Netz GmbH, DE, Potsdam 2 100.0
E.DIS AG, DE, Fürstenwalde/Spree 1 67.0
E.DIS Bau- und Energieservice GmbH, DE, Fürstenwalde/Spree 2 100.0
E.DIS Netz GmbH, DE, Fürstenwalde/Spree 1 100.0
e.discom Telekommunikation GmbH, DE, Rostock 2 100.0
e.disnatur Erneuerbare Energien GmbH, DE, Potsdam 1 100.0
e.distherm Wärmedienstleistungen GmbH, DE, Potsdam 1 100.0
e.kundenservice Netz GmbH, DE, Hamburg 1 100.0
E.ON (Cross-Border) Pension Trustees Limited, GB, Coventry 2 100.0
E.ON 6. Verwaltungs GmbH, DE, Essen 2 100.0
E.ON 7. Verwaltungs GmbH, DE, Essen 2 100.0
E.ON 8. Verwaltungs GmbH, DE, Essen 2 100.0
E.ON 9. Verwaltungs GmbH, DE, Essen 2 100.0
E.ON 11. Verwaltungs GmbH, DE, Essen 2 100.0
E.ON 12. Verwaltungs GmbH, DE, Essen 2 100.0
E.ON Agile Nordic AB, SE, Malmö 2 100.0
E.ON Asset Management GmbH & Co. EEA KG, DE, Grünwald 1, 8 100.0
E.ON Bayern Verwaltungs AG, DE, Essen 2 100.0
E.ON Beteiligungen GmbH, DE, Düsseldorf 1, 8 100.0
E.ON Bioerdgas GmbH, DE, Essen 1 100.0
E.ON Biofor Sverige AB, SE, Malmö 1 100.0
E.ON Business Services Cluj S.R.L., RO, Cluj-Napoca 1 100.0
E.ON Business Services Czech Republic s.r.o., CZ,
České Budějovice 2 100.0
E.ON Business Services GmbH, DE, Hanover 1 100.0
E.ON Business Services Hungary Kft., HU, Budapest 2 100.0
1Consolidated affiliated company. · 2Non-consolidated affiliated company for reasons of immateriality (valued at cost). · 3Joint operations pursuant to IFRS 11. · 4Joint ventures pursuant to IFRS 11.5Associated company (valued using the equity method). · 6Associated company (valued at cost for reasons of immateriality). · 7Other companies in which share investments are held. · 8This company
exercised its exemption option under Section 264, Paragraph 3 of the German Commercial Code or under Section 264b.

219CEO Letter
Report of the Supervisory Board
E.ON Stock
Strategy and Objectives
Combined Group Management Report
Combined Non-Financial Report
Consolidated Financial Statements
Further Information
Name, location Stake (%)
E.ON Control Solutions Limited, GB, Coventry 1 100.0
E.ON Country Hub Germany GmbH, DE, Berlin 1, 8 100.0
E.ON Danmark A/S, DK, Frederiksberg 1 100.0
E.ON Dél-dunántúli Áramhálózati Zrt., HU, Pécs 1 100.0
E.ON Dél-dunántúli Gázhálózati Zrt., HU, Pécs 1 100.0
E.ON Dialog S.R.L., RO, Șelimbăr 2 100.0
E.ON Distribuce, a.s., CZ, České Budějovice 1 100.0
E.ON Drive Infrastructure GmbH, DE, Essen 1, 8 100.0
E.ON Drive Infrastructure UK Limited, GB, Coventry 2 100.0
E.ON edis Contracting GmbH, DE, Fürstenwalde/Spree 2 100.0
E.ON edis energia Sp. z o.o., PL, Warsaw 1 100.0
E.ON Elnät Stockholm AB, SE, Malmö 1 100.0
E.ON Energetikai Tanácsadó Kft., HU, Budapest 2 100.0
E.ON Energia S.p.A., IT, Milan 1 100.0
E.ON Energiakereskedelmi Kft., HU, Budapest 1 100.0
E.ON Energiatermelő Kft., HU, Budapest 1 100.0
E.ON Energidistribution AB, SE, Malmö 1 100.0
E.ON Energie 25. Beteiligungs-GmbH, DE, Munich 2 100.0
E.ON Energie 38. Beteiligungs-GmbH, DE, Munich 2 100.0
E.ON Energie AG, DE, Düsseldorf 1, 8 100.0
E.ON Energie Deutschland GmbH, DE, Munich 1 100.0
E.ON Energie Deutschland Holding GmbH, DE, Munich 1 99.8
E.ON Energie Dialog GmbH, DE, Potsdam 2 100.0
E.ON Energie Odnawialne Sp. z o.o., PL, Szczecin 1 100.0
E.ON Energie Real Estate Investment GmbH, DE, Munich 2 100.0
E.ON Energie România S.A., RO, Târgu Mureş 1 68.2
E.ON Energie, a.s., CZ, České Budějovice 1 100.0
E.ON Energihandel Nordic AB, SE, Malmö 1 100.0
E.ON Energilösningar AB, SE, Malmö 1 100.0
E.ON Energy Gas (Eastern) Limited, GB, Coventry 2 100.0
E.ON Energy Gas (Northwest) Limited, GB, Coventry 2 100.0
E.ON Energy Installation Services Limited, GB, Coventry 1 100.0
E.ON Energy Projects GmbH, DE, Munich 1 100.0
E.ON Energy Services, LLC, US, Wilmington 1 100.0
Name, location Stake (%)
E.ON Energy Solutions GmbH, DE, Unterschleißheim 2 100.0
E.ON Energy Solutions Limited, GB, Coventry 1 100.0
E.ON Észak-dunántúli Áramhálózati Zrt., HU, Győr 1 100.0
E.ON Fastigheter 1 AB, SE, Malmö 2 100.0
E.ON Fastigheter 2 AB, SE, Malmö 2 100.0
E.ON Fastigheter Sverige AB, SE, Malmö 1 100.0
E.ON Finanzanlagen GmbH, DE, Düsseldorf 1, 8 100.0
E.ON Finanzholding Beteiligungs-GmbH, DE, Berlin 2 100.0
E.ON Finanzholding SE & Co. KG, DE, Essen 1, 8 100.0
E.ON First Future Energy Holding B.V., NL, Rotterdam 2 100.0
E.ON Flash S.R.L., RO, Târgu Mureş 2 100.0
E.ON Fünfundzwanzigste Verwaltungs GmbH, DE, Düsseldorf 1, 8 100.0
E.ON Gas Mobil GmbH, DE, Essen 2 100.0
E.ON Gashandel Sverige AB, SE, Malmö 1 100.0
E.ON Gasol Sverige AB, SE, Malmö 1 100.0
E.ON Gaz Furnizare S.A., RO, Târgu Mureş 1 68.2
E.ON Gazdasági Szolgáltató Kft., HU, Győr 1 100.0
E.ON Gruga Geschäftsführungsgesellschaft mbH, DE,
Düsseldorf 1, 8 100.0
E.ON Gruga Objektgesellschaft mbH & Co. KG, DE, Essen 1, 8 100.0
E.ON Human Resources International GmbH, DE, Hanover 1, 8 100.0
E.ON Hungária Energetikai Zártkörűen Működő Részvénytársaság,
HU, Budapest 1 100.0
E.ON Iberia Holding GmbH, DE, Düsseldorf 1, 8 100.0
E.ON Inhouse Consulting GmbH, DE, Essen 2 100.0
E.ON Innovation Co-Investments Inc., US, Wilmington 1 100.0
E.ON Innovation Hub S.A., RO, Târgu Mureş 2 100.0
E.ON Insurance Services GmbH, DE, Essen 2 100.0
E.ON INTERNATIONAL FINANCE B.V., NL, Amsterdam 1 100.0
E.ON Invest GmbH, DE, Grünwald 2 100.0
E.ON IT UK Limited, GB, Coventry 2 100.0
E.ON Italia S.p.A., IT, Milan 1 100.0
E.ON Közép-dunántúli Gázhálózati Zrt., HU, Nagykanizsa 1 99.9
E.ON Kundsupport Sverige AB, SE, Malmö 1 100.0
E.ON Mälarkraft Värme AB, SE, Håbo kommun 1 99.8
Disclosures Pursuant to Section 313 (2) HGB of Companies in Which Equity Investments Are Held (as of December 31, 2018)
1Consolidated affiliated company. · 2Non-consolidated affiliated company for reasons of immateriality (valued at cost). · 3Joint operations pursuant to IFRS 11. · 4Joint ventures pursuant to IFRS 11.5Associated company (valued using the equity method). · 6Associated company (valued at cost for reasons of immateriality). · 7Other companies in which share investments are held. · 8This company
exercised its exemption option under Section 264, Paragraph 3 of the German Commercial Code or under Section 264b.

220Notes
Name, location Stake (%)
E.ON Ügyfélszolgálati Kft., HU, Budapest 1 100.0
E.ON UK CHP Limited, GB, Coventry 1 100.0
E.ON UK CoGeneration Limited, GB, Coventry 1 100.0
E.ON UK Directors Limited, GB, Coventry 2 100.0
E.ON UK Energy Markets Limited, GB, Coventry 1 100.0
E.ON UK Energy Services Limited, GB, Coventry 2 100.0
E.ON UK Heat Limited, GB, Coventry 2 100.0
E.ON UK Holding Company Limited, GB, Coventry 1 100.0
E.ON UK Industrial Shipping Limited, GB, Coventry 2 100.0
E.ON UK Pension Trustees Limited, GB, Coventry 2 100.0
E.ON UK plc, GB, Coventry 1 100.0
E.ON UK Property Services Limited, GB, Coventry 2 100.0
E.ON UK PS Limited, GB, Coventry 2 100.0
E.ON UK Secretaries Limited, GB, Coventry 2 100.0
E.ON UK Steven’s Croft Limited, GB, Coventry 2 100.0
E.ON UK Trustees Limited, GB, Coventry 2 100.0
E.ON US Corporation, US, Wilmington 1 100.0
E.ON US Energy LLC, US, Wilmington 1 100.0
E.ON US Holding GmbH, DE, Düsseldorf 1, 8 100.0
E.ON Varme Danmark ApS, DK, Frederiksberg 1 100.0
E.ON Värme Sverige AB, SE, Malmö 1 100.0
E.ON Verwaltungs AG Nr. 1, DE, Munich 2 100.0
E.ON Verwaltungs SE, DE, Düsseldorf 1, 8 100.0
E.ON Wind Denmark AB, SE, Malmö 2 100.0
E.ON Wind Denmark 2 AB, SE, Malmö 2 100.0
E.ON Wind Kårehamn AB, SE, Malmö 1 100.0
E.ON Wind Norway AB, SE, Malmö 2 100.0
E.ON Wind Service GmbH, DE, Neubukow 2 100.0
E.ON WIND SERVICE ITALIA S.r.l., IT, Milan 2 100.0
E.ON Wind Services A/S, DK, Rødby 1 100.0
E.ON Wind Sweden AB, SE, Malmö 1 100.0
E.ON Zweiundzwanzigste Verwaltungs GmbH, DE, Düsseldorf 1, 8 100.0
E3 Haustechnik GmbH, DE, Magdeburg 2 100.0
East Midlands Electricity Distribution Holdings, GB, Coventry 2 100.0
Name, location Stake (%)
E.ON Metering GmbH, DE, Munich 2 100.0
E.ON NA Capital LLC, US, Wilmington 1 100.0
E.ON Nord Sverige AB, SE, Malmö 1 100.0
E.ON Nordic AB, SE, Malmö 1 100.0
E.ON Norge AS, NO, Stavanger 2 100.0
E.ON North America Finance, LLC, US, Wilmington 1 100.0
E.ON Nutzenergie GmbH i. Gr., DE, Essen 2 100.0
E.ON Off Grid Solutions GmbH, DE, Düsseldorf 2 100.0
E.ON Perspekt GmbH, DE, Düsseldorf 2 70.0
E.ON Power Plants Belgium BVBA, BE, Mechelen 1 100.0
E.ON Produktion Danmark A/S, DK, Frederiksberg 1 100.0
E.ON Produzione S.p.A., IT, Milan 1 100.0
E.ON Project Earth Limited, GB, Coventry 1 100.0
E.ON RAG Beteiligungsgesellschaft mbH, DE, Düsseldorf 1 100.0
E.ON RE Investments LLC, US, Wilmington 1 100.0
E.ON Real Estate GmbH, DE, Essen 2 100.0
E.ON Rhein-Ruhr Ausbildungs-GmbH, DE, Essen 2 100.0
E.ON Rhein-Ruhr Werke GmbH, DE, Essen 2 100.0
E.ON România S.R.L., RO, Târgu Mureş 1 100.0
E.ON Ruhrgas GPA GmbH, DE, Essen 1, 8 100.0
E.ON Ruhrgas Portfolio GmbH, DE, Essen 1, 8 100.0
E.ON Sechzehnte Verwaltungs GmbH, DE, Düsseldorf 1, 8 100.0
E.ON Service GmbH, DE, Essen 2 100.0
E.ON Servicii Clienţi S.R.L., RO, Târgu Mureş 1 100.0
E.ON Servicii S.R.L., RO, Târgu Mureş 1 100.0
E.ON Servicii Tehnice S.R.L., RO, Târgu Mureş 1 100.0
E.ON Servisní, s.r.o., CZ, České Budějovice 1 100.0
E.ON Slovensko, a.s., SK, Bratislava 1 100.0
E.ON Software Development SRL, RO, Târgu Mureş 2 100.0
E.ON Solar GmbH, DE, Essen 2 100.0
E.ON Solutions GmbH, DE, Essen 1, 8 100.0
E.ON Sverige AB, SE, Malmö 1 100.0
E.ON Telco, s.r.o., CZ, České Budějovice 2 100.0
E.ON Tiszántúli Áramhálózati Zrt., HU, Debrecen 1 100.0
Disclosures Pursuant to Section 313 (2) HGB of Companies in Which Equity Investments Are Held (as of December 31, 2018)
1Consolidated affiliated company. · 2Non-consolidated affiliated company for reasons of immateriality (valued at cost). · 3Joint operations pursuant to IFRS 11. · 4Joint ventures pursuant to IFRS 11.5Associated company (valued using the equity method). · 6Associated company (valued at cost for reasons of immateriality). · 7Other companies in which share investments are held. · 8This company
exercised its exemption option under Section 264, Paragraph 3 of the German Commercial Code or under Section 264b.

221CEO Letter
Report of the Supervisory Board
E.ON Stock
Strategy and Objectives
Combined Group Management Report
Combined Non-Financial Report
Consolidated Financial Statements
Further Information
Name, location Stake (%)
East Midlands Electricity Share Scheme Trustees Limited, GB,
Coventry 2 100.0
EBERnetz GmbH & Co. KG, DE, Ebersberg 6 49.0
EBY Immobilien GmbH & Co KG, DE, Regensburg 2 100.0
EBY Port 1 GmbH, DE, Munich 1, 8 100.0
EBY Port 3 GmbH, DE, Regensburg 1 100.0
EC&R Asset Management, LLC, US, Wilmington 1 100.0
EC&R Canada Ltd., CA, Saint John 1 100.0
EC&R Development, LLC, US, Wilmington 1 100.0
EC&R Energy Marketing, LLC, US, Wilmington 1 100.0
EC&R Ft. Huachuca Solar, LLC, US, Wilmington 2 100.0
EC&R Grandview Holdco, LLC, US, Wilmington 2 100.0
EC&R Investco EPC Mgmt, LLC, US, Wilmington 1 100.0
EC&R Investco Mgmt, LLC, US, Wilmington 1 100.0
EC&R Investco Mgmt II, LLC, US, Wilmington 1 100.0
EC&R Magicat Holdco, LLC, US, Wilmington 1 100.0
EC&R NA Solar PV, LLC, US, Wilmington 1 100.0
EC&R O&M, LLC, US, Wilmington 1 100.0
EC&R Panther Creek Wind Farm III, LLC, US, Wilmington 1 100.0
EC&R QSE, LLC, US, Wilmington 1 100.0
EC&R Services, LLC, US, Wilmington 1 100.0
EC&R Sherman, LLC, US, Wilmington 2 100.0
EC&R Solar Development, LLC, US, Wilmington 1 100.0
Economy Power Limited, GB, Coventry 1 100.0
EDT Energie Werder GmbH, DE, Werder (Havel) 2 100.0
EEP 2. Beteiligungsgesellschaft mbH, DE, Munich 2 100.0
EFG Erdgas Forchheim GmbH, DE, Forchheim 6 24.9
EFR Europäische Funk-Rundsteuerung GmbH, DE, Munich 6 39.9
El Algodon Alto Wind Farm, LLC, US, Wilmington 2 100.0
ElbEnergie GmbH, DE, Quickborn 2 100.0
Elektrizitätsnetzgesellschaft Grünwald mbH & Co. KG, DE,
Grünwald 6 49.0
Elektrizitätswerk Schwandorf GmbH, DE, Schwandorf 2 100.0
Elevate Wind Holdco, LLC, US, Wilmington 4 50.0
Elmregia GmbH, DE, Schöningen 6 49.0
Name, location Stake (%)
EMSZET Első Magyar Szélerőmű Korlátolt Felelősségű Társaság,
HU, Kulcs 2 74.7
Energetyka Cieplna Opolszczyzny S.A., PL, Opole 5 46.7
Energie und Wasser Potsdam GmbH, DE, Potsdam 5 35.0
Energie und Wasser Wahlstedt/Bad Segeberg GmbH & Co. KG
(ews), DE, Bad Segeberg 6 50.1
Energie Vorpommern GmbH, DE, Trassenheide 6 49.0
Energie-Agentur Weyhe GmbH, DE, Weyhe 6 50.0
energielösung GmbH, DE, Regensburg 2 100.0
Energienetz Neufahrn/Eching GmbH & Co. KG, DE,
Neufahrn bei Freising 6 49.0
Energienetze Bayern GmbH, DE, Regensburg 1 100.0
Energienetze Schaafheim GmbH, DE, Regensburg 2 100.0
Energie-Pensions-Management GmbH, DE, Hanover 2 70.0
Energieversorgung Alzenau GmbH (EVA), DE, Alzenau 6 69.5
Energieversorgung Buching-Trauchgau (EBT) Gesellschaft mit
beschränkter Haftung, DE, Halblech 6 50.0
Energieversorgung Putzbrunn GmbH & Co. KG, DE, Putzbrunn 6 50.0
Energieversorgung Putzbrunn Verwaltungs GmbH, DE,
Putzbrunn 6 50.0
Energieversorgung Sehnde GmbH, DE, Sehnde 6 30.0
Energieversorgung Vechelde GmbH & Co. KG, DE, Vechelde 6 49.0
Energie-Wende-Garching GmbH & Co. KG, DE, Garching 6 50.0
Energie-Wende-Garching Verwaltungs-GmbH, DE, Garching 6 50.0
Energiewerke Isernhagen GmbH, DE, Isernhagen 6 49.0
Energiewerke Osterburg GmbH, DE, Osterburg (Altmark) 6 49.0
Energy Collection Services Limited, GB, Coventry 2 100.0
Enerjisa Enerji A.Ş., TR, Istanbul 4 40.0
Enerjisa Üretim Santralleri A.Ş., TR, Istanbul 4 50.0
EPS Polska Holding Sp. z o.o., PL, Warsaw 1 100.0
Ergon Energia S.r.l. in liquidazione, IT, Brescia 6 50.0
Ergon Overseas Holdings Limited, GB, Coventry 1 100.0
ErwärmBAR GmbH, DE, Eberswalde 6 50.0
ESN EnergieSystemeNord GmbH, DE, Schwentinental 2 55.0
ESN Sicherheit und Zertifizierung GmbH, DE, Schwentinental 2 100.0
etatherm GmbH, DE, Potsdam 6 20.4
Disclosures Pursuant to Section 313 (2) HGB of Companies in Which Equity Investments Are Held (as of December 31, 2018)
1Consolidated affiliated company. · 2Non-consolidated affiliated company for reasons of immateriality (valued at cost). · 3Joint operations pursuant to IFRS 11. · 4Joint ventures pursuant to IFRS 11.5Associated company (valued using the equity method). · 6Associated company (valued at cost for reasons of immateriality). · 7Other companies in which share investments are held. · 8This company
exercised its exemption option under Section 264, Paragraph 3 of the German Commercial Code or under Section 264b.
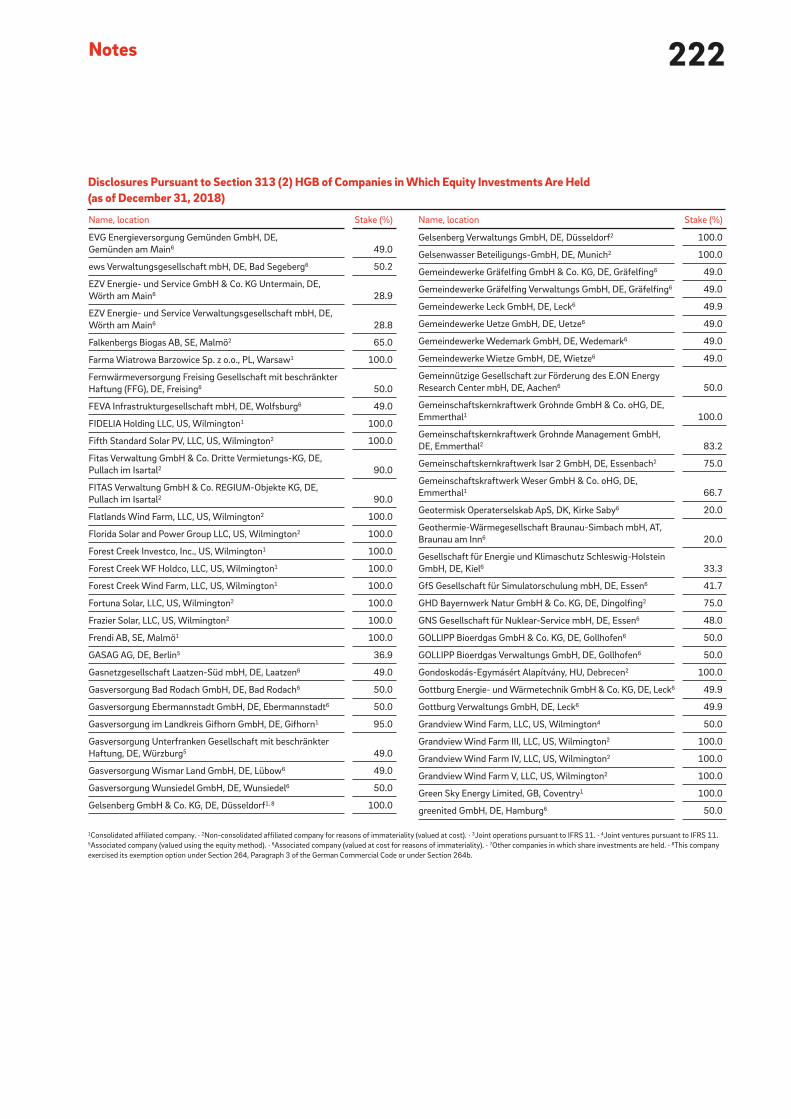
222Notes
Name, location Stake (%)
Gelsenberg Verwaltungs GmbH, DE, Düsseldorf 2 100.0
Gelsenwasser Beteiligungs-GmbH, DE, Munich 2 100.0
Gemeindewerke Gräfelfing GmbH & Co. KG, DE, Gräfelfing 6 49.0
Gemeindewerke Gräfelfing Verwaltungs GmbH, DE, Gräfelfing 6 49.0
Gemeindewerke Leck GmbH, DE, Leck 6 49.9
Gemeindewerke Uetze GmbH, DE, Uetze 6 49.0
Gemeindewerke Wedemark GmbH, DE, Wedemark 6 49.0
Gemeindewerke Wietze GmbH, DE, Wietze 6 49.0
Gemeinnützige Gesellschaft zur Förderung des E.ON Energy
Research Center mbH, DE, Aachen 6 50.0
Gemeinschaftskernkraftwerk Grohnde GmbH & Co. oHG, DE,
Emmerthal 1 100.0
Gemeinschaftskernkraftwerk Grohnde Management GmbH,
DE, Emmerthal 2 83.2
Gemeinschaftskernkraftwerk Isar 2 GmbH, DE, Essenbach 2 75.0
Gemeinschaftskraftwerk Weser GmbH & Co. oHG, DE,
Emmerthal 1 66.7
Geotermisk Operaterselskab ApS, DK, Kirke Saby 6 20.0
Geothermie-Wärmegesellschaft Braunau-Simbach mbH, AT,
Braunau am Inn 6 20.0
Gesellschaft für Energie und Klimaschutz Schleswig-Holstein
GmbH, DE, Kiel 6 33.3
GfS Gesellschaft für Simulatorschulung mbH, DE, Essen 6 41.7
GHD Bayernwerk Natur GmbH & Co. KG, DE, Dingolfing 2 75.0
GNS Gesellschaft für Nuklear-Service mbH, DE, Essen 6 48.0
GOLLIPP Bioerdgas GmbH & Co. KG, DE, Gollhofen 6 50.0
GOLLIPP Bioerdgas Verwaltungs GmbH, DE, Gollhofen 6 50.0
Gondoskodás-Egymásért Alapítvány, HU, Debrecen 2 100.0
Gottburg Energie- und Wärmetechnik GmbH & Co. KG, DE, Leck 6 49.9
Gottburg Verwaltungs GmbH, DE, Leck 6 49.9
Grandview Wind Farm, LLC, US, Wilmington 4 50.0
Grandview Wind Farm III, LLC, US, Wilmington 2 100.0
Grandview Wind Farm IV, LLC, US, Wilmington 2 100.0
Grandview Wind Farm V, LLC, US, Wilmington 2 100.0
Green Sky Energy Limited, GB, Coventry 1 100.0
greenited GmbH, DE, Hamburg 6 50.0
Name, location Stake (%)
EVG Energieversorgung Gemünden GmbH, DE,
Gemünden am Main 6 49.0
ews Verwaltungsgesellschaft mbH, DE, Bad Segeberg 6 50.2
EZV Energie- und Service GmbH & Co. KG Untermain, DE,
Wörth am Main 6 28.9
EZV Energie- und Service Verwaltungsgesellschaft mbH, DE,
Wörth am Main 6 28.8
Falkenbergs Biogas AB, SE, Malmö 2 65.0
Farma Wiatrowa Barzowice Sp. z o.o., PL, Warsaw 1 100.0
Fernwärmeversorgung Freising Gesellschaft mit beschränkter
Haftung (FFG), DE, Freising 6 50.0
FEVA Infrastrukturgesellschaft mbH, DE, Wolfsburg 6 49.0
FIDELIA Holding LLC, US, Wilmington 1 100.0
Fifth Standard Solar PV, LLC, US, Wilmington 2 100.0
Fitas Verwaltung GmbH & Co. Dritte Vermietungs-KG, DE,
Pullach im Isartal 2 90.0
FITAS Verwaltung GmbH & Co. REGIUM-Objekte KG, DE,
Pullach im Isartal 2 90.0
Flatlands Wind Farm, LLC, US, Wilmington 2 100.0
Florida Solar and Power Group LLC, US, Wilmington 2 100.0
Forest Creek Investco, Inc., US, Wilmington 1 100.0
Forest Creek WF Holdco, LLC, US, Wilmington 1 100.0
Forest Creek Wind Farm, LLC, US, Wilmington 1 100.0
Fortuna Solar, LLC, US, Wilmington 2 100.0
Frazier Solar, LLC, US, Wilmington 2 100.0
Frendi AB, SE, Malmö 1 100.0
GASAG AG, DE, Berlin 5 36.9
Gasnetzgesellschaft Laatzen-Süd mbH, DE, Laatzen 6 49.0
Gasversorgung Bad Rodach GmbH, DE, Bad Rodach 6 50.0
Gasversorgung Ebermannstadt GmbH, DE, Ebermannstadt 6 50.0
Gasversorgung im Landkreis Gifhorn GmbH, DE, Gifhorn 1 95.0
Gasversorgung Unterfranken Gesellschaft mit beschränkter
Haftung, DE, Würzburg 5 49.0
Gasversorgung Wismar Land GmbH, DE, Lübow 6 49.0
Gasversorgung Wunsiedel GmbH, DE, Wunsiedel 6 50.0
Gelsenberg GmbH & Co. KG, DE, Düsseldorf 1, 8 100.0
Disclosures Pursuant to Section 313 (2) HGB of Companies in Which Equity Investments Are Held (as of December 31, 2018)
1Consolidated affiliated company. · 2Non-consolidated affiliated company for reasons of immateriality (valued at cost). · 3Joint operations pursuant to IFRS 11. · 4Joint ventures pursuant to IFRS 11.5Associated company (valued using the equity method). · 6Associated company (valued at cost for reasons of immateriality). · 7Other companies in which share investments are held. · 8This company
exercised its exemption option under Section 264, Paragraph 3 of the German Commercial Code or under Section 264b.

223CEO Letter
Report of the Supervisory Board
E.ON Stock
Strategy and Objectives
Combined Group Management Report
Combined Non-Financial Report
Consolidated Financial Statements
Further Information
Name, location Stake (%)
greenXmoney.com GmbH i. L., DE, Neu-Ulm 2 100.0
GrönGas Partner A/S, DK, Hirtshals 6 50.0
Hams Hall Management Company Limited, GB, Coventry 6 44.8
HanseGas GmbH, DE, Quickborn 1 100.0
HanseWerk AG, DE, Quickborn 1 66.5
HanseWerk Natur GmbH, DE, Hamburg 1 100.0
Harzwasserwerke GmbH, DE, Hildesheim 5 20.8
Havelstrom Zehdenick GmbH, DE, Zehdenick 6 49.0
Heizwerk Holzverwertungsgenossenschaft Stiftland eG & Co.
oHG, DE, Neualbenreuth 6 50.0
HGC Hamburg Gas Consult GmbH, DE, Hamburg 2 100.0
HOCHTEMPERATUR-KERNKRAFTWERK GmbH (HKG).
Gemeinsames europäisches Unternehmen, DE, Hamm 6 26.0
Holsteiner Wasser GmbH, DE, Neumünster 6 50.0
Home.ON GmbH, DE, Aachen 6 45.0
iamsmart GmbH, DE, Essen 2 100.0
Improbed AB, SE, Malmö 2 100.0
Inadale Wind Farm, LLC, US, Wilmington 1 100.0
Induboden GmbH, DE, Düsseldorf 2 100.0
Induboden GmbH & Co. Grundstücksgesellschaft oHG, DE, Essen 2 100.0
Industriekraftwerk Greifswald GmbH, DE, Kassel 6 49.0
Industry Development Services Limited, GB, Coventry 2 100.0
InfraServ - Bayernwerk Gendorf GmbH, DE, Burgkirchen a. d. Alz 6 50.0
Infrastrukturgesellschaft Stadt Nienburg/Weser mbH, DE,
Nienburg/Weser 6 49.9
Intelligent Maintenance Systems Limited, GB, Milton Keynes 6 25.0
IPP ESN Power Engineering GmbH, DE, Kiel 2 51.0
Iron Horse Battery Storage, LLC, US, Wilmington 2 100.0
Jihočeská plynárenská, a.s., CZ, České Budějovice 2 100.0
Kalmar Energi Försäljning AB, SE, Kalmar 6 40.0
Kalmar Energi Holding AB, SE, Kalmar 4 50.0
Kasson Manteca Solar, LLC, US, Wilmington 2 100.0
Kemsley CHP Limited, GB, Coventry 1 100.0
Kernkraftwerk Brokdorf GmbH & Co. oHG, DE, Hamburg 1 80.0
Kernkraftwerk Brunsbüttel GmbH & Co. oHG, DE, Hamburg 5 33.3
Name, location Stake (%)
Kernkraftwerk Gundremmingen GmbH, DE, Gundremmingen 5 25.0
Kernkraftwerk Krümmel GmbH & Co. oHG, DE, Hamburg 3 50.0
Kernkraftwerk Stade GmbH & Co. oHG, DE, Hamburg 1 66.7
Kernkraftwerke Isar Verwaltungs GmbH, DE, Essenbach 1 100.0
KGW - Kraftwerk Grenzach-Wyhlen GmbH, DE, Munich 1 100.0
Kite Power Systems Limited, GB, Chelmsford 6 20.0
Komáromi Kogenerációs Erőmű Kft., HU, Budapest 2 100.0
KommEnergie Erzeugungs GmbH, DE, Eichenau 6 100.0
KommEnergie GmbH, DE, Eichenau 6 61.0
Kommunale Energieversorgung GmbH Eisenhüttenstadt, DE,
Eisenhüttenstadt 6 49.0
Kommunale Klimaschutzgesellschaft Landkreis Celle
gemeinnützige GmbH, DE, Celle 6 25.0
Kommunale Klimaschutzgesellschaft Landkreis Uelzen
gemeinnützige GmbH, DE, Celle 6 25.0
Kraftwerk Burghausen GmbH, DE, Munich 1 100.0
Kraftwerk Hattorf GmbH, DE, Munich 1 100.0
Kraftwerk Marl GmbH, DE, Munich 1 100.0
Kraftwerk Plattling GmbH, DE, Munich 1 100.0
KSG Kraftwerks-Simulator-Gesellschaft mbH, DE, Essen 6 41.7
Kurgan Grundstücks-Verwaltungsgesellschaft mbH & Co. oHG,
DE, Grünwald 1 90.0
Lake Fork Wind Farm, LLC, US, Wilmington 2 100.0
LandE GmbH, DE, Wolfsburg 1 69.6
Landwehr Wassertechnik GmbH, DE, Schöppenstedt 2 100.0
Lighting for Staffordshire Holdings Limited, GB, Coventry 1 60.0
Lighting for Staffordshire Limited, GB, Coventry 1 100.0
Liikennevirta Oy, FI, Helsinki 6 34.9
Lillo Energy NV, BE, Brussels 6 50.0
Limfjordens Bioenergi ApS, DK, Frederiksberg 2 78.0
Local Energies, a. s., CZ, Zlín - Malenovice 2 100.0
London Array Limited, GB, Tunbridge Wells 6 30.0
LSW Energie Verwaltungs-GmbH, DE, Wolfsburg 6 57.0
LSW Holding GmbH & Co. KG, DE, Wolfsburg 5 57.0
LSW Holding Verwaltungs-GmbH, DE, Wolfsburg 6 57.0
Disclosures Pursuant to Section 313 (2) HGB of Companies in Which Equity Investments Are Held (as of December 31, 2018)
1Consolidated affiliated company. · 2Non-consolidated affiliated company for reasons of immateriality (valued at cost). · 3Joint operations pursuant to IFRS 11. · 4Joint ventures pursuant to IFRS 11.5Associated company (valued using the equity method). · 6Associated company (valued at cost for reasons of immateriality). · 7Other companies in which share investments are held. · 8This company
exercised its exemption option under Section 264, Paragraph 3 of the German Commercial Code or under Section 264b.

224Notes
Name, location Stake (%)
Netzgesellschaft Hohen Neuendorf Strom GmbH & Co. KG, DE,
Hohen Neuendorf 6 49.0
Netzgesellschaft Ronnenberg GmbH & Co. KG, DE, Ronnenberg 6 49.0
Netzgesellschaft Schwerin mbH (NGS), DE, Schwerin 6 40.0
Netzgesellschaft Stuhr/Weyhe mbH i. L., DE, Helmstedt 2 100.0
Netzgesellschaft Syke GmbH, DE, Syke 6 49.0
Neumünster Netz Beteiligungs-GmbH, DE, Neumünster 1 50.1
New Cogen Sp. z o.o., PL, Warsaw 2 100.0
NIS Norddeutsche Informations-Systeme Gesellschaft mbH,
DE, Schwentinental 2 100.0
Nord Stream AG, CH, Zug 5 15.5
NORD-direkt GmbH, DE, Neumünster 2 100.0
NordNetz GmbH, DE, Quickborn 2 100.0
Northern Orchard Solar PV, LLC, US, Wilmington 2 100.0
Northern Orchard Solar PV 2, LLC, US, Wilmington 2 100.0
Northern Orchard Solar PV 3, LLC, US, Wilmington 2 100.0
Novo Innovations Limited, GB, Coventry 2 100.0
Nysäter Wind AB, SE, Malmö 5 20.0
Oberland Stromnetz GmbH & Co. KG, DE, Murnau a. Staffelsee 6 33.9
ocean5 Digital Service GmbH, DE, Kiel 6 50.0
Oebisfelder Wasser und Abwasser GmbH, DE, Oebisfelde 6 49.0
Offshore-Windpark Delta Nordsee GmbH, DE, Hamburg 2 100.0
OMNI Energy Kft., HU, Kiskunhalas 6 50.0
OOO E.ON Connecting Energies, RU, Moscow 4 50.0
OOO E.ON IT, RU, Moscow 2 100.0
Oskarshamn Energi AB, SE, Oskarshamn 4 50.0
OurGreenCar Sweden AB, SE, Malmö 6 30.0
Owen Prairie Wind Farm, LLC, US, Wilmington 2 100.0
PannonWatt Energetikai Megoldások Zrt., HU, Győr 6 49.9
Panther Creek I&II Retrofit, LLC, US, Wilmington 2 100.0
Panther Creek Solar, LLC, US, Wilmington 2 100.0
Panther Creek Wind Farm I&II, LLC, US, Wilmington 1 100.0
Paradise Cut Battery, LLC, US, Wilmington 2 100.0
Pawnee Spirit Wind Farm, LLC, US, Wilmington 2 100.0
Name, location Stake (%)
LSW Netz Verwaltungs-GmbH, DE, Wolfsburg 6 57.0
Luna Lüneburg GmbH, DE, Lüneburg 6 49.0
Magicat Holdco, LLC, US, Wilmington 5 20.0
Major Wind Farm, LLC, US, Wilmington 2 100.0
March Road Solar, LLC, US, Wilmington 2 100.0
Maricopa East Solar PV, LLC, US, Wilmington 2 100.0
Maricopa East Solar PV 2, LLC, US, Wilmington 2 100.0
Maricopa Land Holding, LLC, US, Wilmington 2 100.0
Maricopa West Solar PV 2, LLC, US, Wilmington 2 100.0
Matrix Control Solutions Limited, GB, Coventry 1 100.0
MEON Pensions GmbH & Co. KG, DE, Grünwald 1, 8 100.0
MEON Verwaltungs GmbH, DE, Grünwald 2 100.0
MFG Flughafen-Grundstücksverwaltungsgesellschaft mbH &
Co. Gamma oHG i.L., DE, Grünwald 2 90.0
Midlands Electricity Limited, GB, Coventry 2 100.0
MINUS 181 GmbH, DE, Parchim 6 25.1
Mosoni-Duna Menti Szélerőmű Kft., HU, Budapest 2 100.0
Munnsville Investco, LLC, US, Wilmington 1 100.0
Munnsville WF Holdco, LLC, US, Wilmington 1 100.0
Munnsville Wind Farm, LLC, US, Wilmington 1 100.0
Nahwärme Ascha GmbH, DE, Ascha 2 90.0
Naranjo Battery, LLC, US, Wilmington 2 100.0
Netz- und Wartungsservice (NWS) GmbH, DE, Schwerin 2 100.0
Netzanschluss Mürow Oberdorf GbR, DE, Bremerhaven 6 34.8
Netzgesellschaft Bad Münder GmbH & Co. KG, DE, Bad Münder 6 49.0
Netzgesellschaft Barsinghausen GmbH & Co. KG, DE,
Barsinghausen 6 49.0
Netzgesellschaft Gehrden mbH, DE, Gehrden 6 49.0
Netzgesellschaft Hemmingen mbH, DE, Hemmingen 6 49.0
Netzgesellschaft Hennigsdorf Strom mbH, DE, Hennigsdorf 6 50.0
Netzgesellschaft Hildesheimer Land GmbH & Co. KG, DE, Giesen 6 49.0
Netzgesellschaft Hildesheimer Land Verwaltung GmbH, DE,
Giesen 6 49.0
Disclosures Pursuant to Section 313 (2) HGB of Companies in Which Equity Investments Are Held (as of December 31, 2018)
1Consolidated affiliated company. · 2Non-consolidated affiliated company for reasons of immateriality (valued at cost). · 3Joint operations pursuant to IFRS 11. · 4Joint ventures pursuant to IFRS 11.5Associated company (valued using the equity method). · 6Associated company (valued at cost for reasons of immateriality). · 7Other companies in which share investments are held. · 8This company
exercised its exemption option under Section 264, Paragraph 3 of the German Commercial Code or under Section 264b.
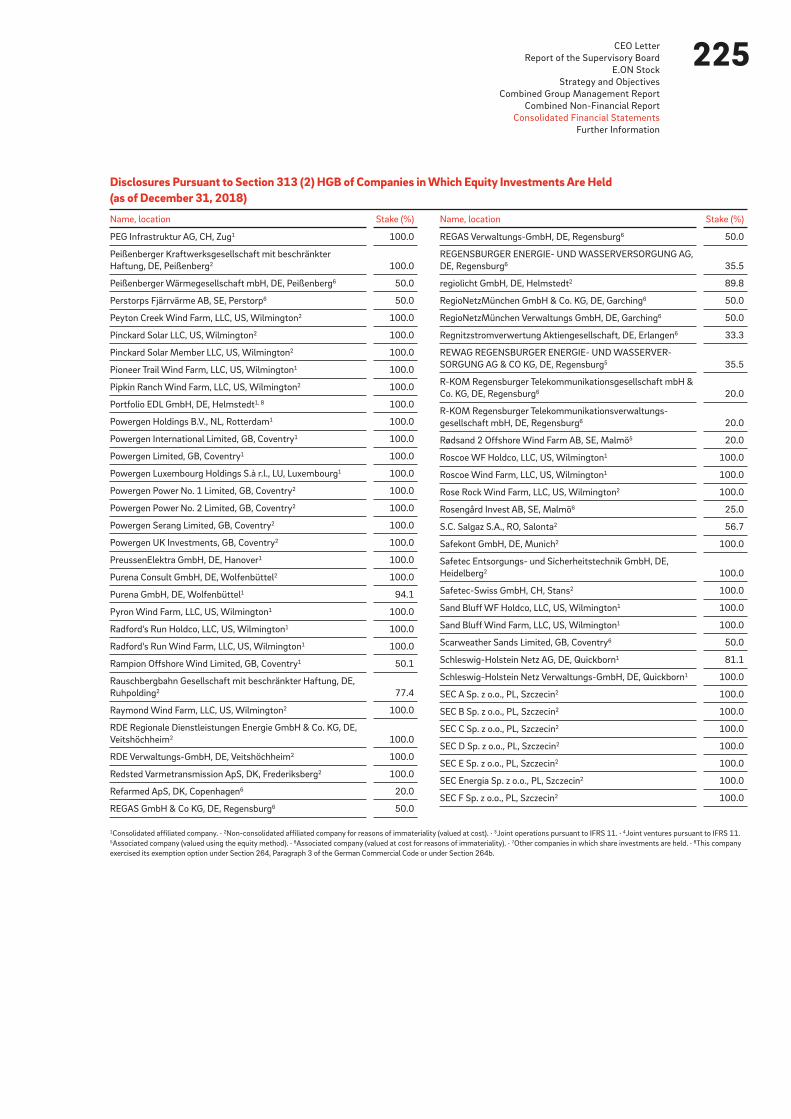
225CEO Letter
Report of the Supervisory Board
E.ON Stock
Strategy and Objectives
Combined Group Management Report
Combined Non-Financial Report
Consolidated Financial Statements
Further Information
Name, location Stake (%)
PEG Infrastruktur AG, CH, Zug 1 100.0
Peißenberger Kraftwerksgesellschaft mit beschränkter
Haftung, DE, Peißenberg 2 100.0
Peißenberger Wärmegesellschaft mbH, DE, Peißenberg 6 50.0
Perstorps Fjärrvärme AB, SE, Perstorp 6 50.0
Peyton Creek Wind Farm, LLC, US, Wilmington 2 100.0
Pinckard Solar LLC, US, Wilmington 2 100.0
Pinckard Solar Member LLC, US, Wilmington 2 100.0
Pioneer Trail Wind Farm, LLC, US, Wilmington 1 100.0
Pipkin Ranch Wind Farm, LLC, US, Wilmington 2 100.0
Portfolio EDL GmbH, DE, Helmstedt 1, 8 100.0
Powergen Holdings B.V., NL, Rotterdam 1 100.0
Powergen International Limited, GB, Coventry 1 100.0
Powergen Limited, GB, Coventry 1 100.0
Powergen Luxembourg Holdings S.à r.l., LU, Luxembourg 1 100.0
Powergen Power No. 1 Limited, GB, Coventry 2 100.0
Powergen Power No. 2 Limited, GB, Coventry 2 100.0
Powergen Serang Limited, GB, Coventry 2 100.0
Powergen UK Investments, GB, Coventry 2 100.0
PreussenElektra GmbH, DE, Hanover 1 100.0
Purena Consult GmbH, DE, Wolfenbüttel 2 100.0
Purena GmbH, DE, Wolfenbüttel 1 94.1
Pyron Wind Farm, LLC, US, Wilmington 1 100.0
Radford's Run Holdco, LLC, US, Wilmington 1 100.0
Radford's Run Wind Farm, LLC, US, Wilmington 1 100.0
Rampion Offshore Wind Limited, GB, Coventry 1 50.1
Rauschbergbahn Gesellschaft mit beschränkter Haftung, DE,
Ruhpolding 2 77.4
Raymond Wind Farm, LLC, US, Wilmington 2 100.0
RDE Regionale Dienstleistungen Energie GmbH & Co. KG, DE,
Veitshöchheim 2 100.0
RDE Verwaltungs-GmbH, DE, Veitshöchheim 2 100.0
Redsted Varmetransmission ApS, DK, Frederiksberg 2 100.0
Refarmed ApS, DK, Copenhagen 6 20.0
REGAS GmbH & Co KG, DE, Regensburg 6 50.0
Name, location Stake (%)
REGAS Verwaltungs-GmbH, DE, Regensburg 6 50.0
REGENSBURGER ENERGIE- UND WASSERVERSORGUNG AG,
DE, Regensburg 6 35.5
regiolicht GmbH, DE, Helmstedt 2 89.8
RegioNetzMünchen GmbH & Co. KG, DE, Garching 6 50.0
RegioNetzMünchen Verwaltungs GmbH, DE, Garching 6 50.0
Regnitzstromverwertung Aktiengesellschaft, DE, Erlangen 6 33.3
REWAG REGENSBURGER ENERGIE- UND WASSERVER-
SORGUNG AG & CO KG, DE, Regensburg 5 35.5
R-KOM Regensburger Telekommunikationsgesellschaft mbH &
Co. KG, DE, Regensburg 6 20.0
R-KOM Regensburger Telekommunikationsverwaltungs-
gesellschaft mbH, DE, Regensburg 6 20.0
Rødsand 2 Offshore Wind Farm AB, SE, Malmö 5 20.0
Roscoe WF Holdco, LLC, US, Wilmington 1 100.0
Roscoe Wind Farm, LLC, US, Wilmington 1 100.0
Rose Rock Wind Farm, LLC, US, Wilmington 2 100.0
Rosengård Invest AB, SE, Malmö 6 25.0
S.C. Salgaz S.A., RO, Salonta 2 56.7
Safekont GmbH, DE, Munich 2 100.0
Safetec Entsorgungs- und Sicherheitstechnik GmbH, DE,
Heidelberg 2 100.0
Safetec-Swiss GmbH, CH, Stans 2 100.0
Sand Bluff WF Holdco, LLC, US, Wilmington 1 100.0
Sand Bluff Wind Farm, LLC, US, Wilmington 1 100.0
Scarweather Sands Limited, GB, Coventry 6 50.0
Schleswig-Holstein Netz AG, DE, Quickborn 1 81.1
Schleswig-Holstein Netz Verwaltungs-GmbH, DE, Quickborn 1 100.0
SEC A Sp. z o.o., PL, Szczecin 2 100.0
SEC B Sp. z o.o., PL, Szczecin 2 100.0
SEC C Sp. z o.o., PL, Szczecin 2 100.0
SEC D Sp. z o.o., PL, Szczecin 2 100.0
SEC E Sp. z o.o., PL, Szczecin 2 100.0
SEC Energia Sp. z o.o., PL, Szczecin 2 100.0
SEC F Sp. z o.o., PL, Szczecin 2 100.0
Disclosures Pursuant to Section 313 (2) HGB of Companies in Which Equity Investments Are Held (as of December 31, 2018)
1Consolidated affiliated company. · 2Non-consolidated affiliated company for reasons of immateriality (valued at cost). · 3Joint operations pursuant to IFRS 11. · 4Joint ventures pursuant to IFRS 11.5Associated company (valued using the equity method). · 6Associated company (valued at cost for reasons of immateriality). · 7Other companies in which share investments are held. · 8This company
exercised its exemption option under Section 264, Paragraph 3 of the German Commercial Code or under Section 264b.

226Notes
Name, location Stake (%)
SEC G Sp. z o.o., PL, Szczecin 2 100.0
SEC H Sp. z o.o., PL, Szczecin 2 100.0
SEC HR Sp. z o.o., PL, Szczecin 2 100.0
SEC I Sp. z o.o., PL, Szczecin 2 100.0
SEC J Sp. z o.o., PL, Szczecin 2 100.0
SEC K Sp. z o.o., PL, Szczecin 2 100.0
SEC Myślibórz Sp. z o.o., PL, Myślibórz 2 89.9
SEC Region Sp. z o.o., PL, Barlinek 2 100.0
SEC Serwis Sp. z o.o., PL, Szczecin 2 100.0
SERVICE plus GmbH, DE, Neumünster 2 100.0
Service Plus Recycling GmbH, DE, Neumünster 2 100.0
Servicii Energetice pentru Acasa - SEA Complet S.A., RO,
Târgu Mureş 2 96.0
Settlers Trail Wind Farm, LLC, US, Wilmington 1 100.0
Skive GreenLab Biogas ApS, DK, Frederiksberg 2 100.0
ŠKO ENERGO, s.r.o., CZ, Mladá Boleslav 6 21.0
ŠKO-ENERGO FIN, s.r.o., CZ, Mladá Boleslav 5 42.5
SmartSim GmbH, DE, Essen 6 24.0
Snow Shoe Wind Farm, LLC, US, Wilmington 2 100.0
Söderåsens Bioenergi AB, SE, Malmö 2 63.3
Solar Supply Sweden AB, SE, Karlshamn 2 100.0
Sønderjysk Biogas Bevtoft A/S, DK, Vojens 6 50.0
Sparta North, LLC, US, Wilmington 2 100.0
Sparta South, LLC, US, Wilmington 2 100.0
SPIE Energy Solutions Harburg GmbH, DE, Hamburg 6 35.0
Städtische Betriebswerke Luckenwalde GmbH, DE, Luckenwalde 6 29.0
Städtische Werke Magdeburg GmbH & Co. KG, DE, Magdeburg 5 26.7
Städtische Werke Magdeburg Verwaltungs-GmbH, DE,
Magdeburg 6 26.7
Stadtnetze Neustadt a. Rbge. GmbH & Co. KG, DE,
Neustadt a. Rbge. 6 24.9
Stadtnetze Neustadt a. Rbge. Verwaltungs-GmbH, DE,
Neustadt a. Rbge. 6 24.9
Stadtversorgung Pattensen GmbH & Co. KG, DE, Pattensen 6 49.0
Stadtversorgung Pattensen Verwaltung GmbH, DE, Pattensen 6 49.0
Name, location Stake (%)
Stadtwerke Bad Bramstedt GmbH, DE, Bad Bramstedt 6 36.0
Stadtwerke Barth GmbH, DE, Barth 6 49.0
Stadtwerke Bayreuth Energie und Wasser GmbH, DE, Bayreuth 5 24.9
Stadtwerke Bergen GmbH, DE, Bergen 6 49.0
Stadtwerke Blankenburg GmbH, DE, Blankenburg 6 30.0
Stadtwerke Bogen GmbH, DE, Bogen 6 41.0
Stadtwerke Bredstedt GmbH, DE, Bredstedt 6 49.9
Stadtwerke Burgdorf GmbH, DE, Burgdorf 6 49.0
Stadtwerke Ebermannstadt Versorgungsbetriebe GmbH, DE,
Ebermannstadt 6 25.0
Stadtwerke Eggenfelden GmbH, DE, Eggenfelden 6 49.0
Stadtwerke Frankfurt (Oder) GmbH, DE, Frankfurt (Oder) 5 39.0
Stadtwerke Garbsen GmbH, DE, Garbsen 6 24.9
Stadtwerke Geesthacht GmbH, DE, Geesthacht 6 24.9
Stadtwerke Husum GmbH, DE, Husum 6 49.9
Stadtwerke Lübz GmbH, DE, Lübz 6 25.0
Stadtwerke Ludwigsfelde GmbH, DE, Ludwigsfelde 6 29.0
Stadtwerke Neunburg vorm Wald Strom GmbH, DE,
Neunburg vorm Wald 6 24.9
Stadtwerke Niebüll GmbH, DE, Niebüll 6 49.9
Stadtwerke Olching Stromnetz GmbH & Co. KG, DE, Olching 6 49.0
Stadtwerke Olching Stromnetz Verwaltungs GmbH, DE, Olching 6 49.0
Stadtwerke Parchim GmbH, DE, Parchim 6 25.2
Stadtwerke Premnitz GmbH, DE, Premnitz 6 35.0
Stadtwerke Pritzwalk GmbH, DE, Pritzwalk 6 49.0
Stadtwerke Ribnitz-Damgarten GmbH, DE, Ribnitz-Damgarten 6 39.0
Stadtwerke Schwedt GmbH, DE, Schwedt/Oder 6 37.8
Stadtwerke Tornesch GmbH, DE, Tornesch 6 49.0
Stadtwerke Vilshofen GmbH, DE, Vilshofen 6 41.0
Stadtwerke Wismar GmbH, DE, Wismar 5 49.0
Stadtwerke Wittenberge GmbH, DE, Wittenberge 6 22.7
Stadtwerke Wolfenbüttel GmbH, DE, Wolfenbüttel 6 26.0
Stadtwerke Wolmirstedt GmbH, DE, Wolmirstedt 6 49.4
Stella Holdco, LLC, US, Wilmington 2 100.0
Disclosures Pursuant to Section 313 (2) HGB of Companies in Which Equity Investments Are Held (as of December 31, 2018)
1Consolidated affiliated company. · 2Non-consolidated affiliated company for reasons of immateriality (valued at cost). · 3Joint operations pursuant to IFRS 11. · 4Joint ventures pursuant to IFRS 11.5Associated company (valued using the equity method). · 6Associated company (valued at cost for reasons of immateriality). · 7Other companies in which share investments are held. · 8This company
exercised its exemption option under Section 264, Paragraph 3 of the German Commercial Code or under Section 264b.

227CEO Letter
Report of the Supervisory Board
E.ON Stock
Strategy and Objectives
Combined Group Management Report
Combined Non-Financial Report
Consolidated Financial Statements
Further Information
Name, location Stake (%)
Stella Wind Farm, LLC, US, Wilmington 1 100.0
Stillwater Energy Storage, LLC, US, Wilmington 2 100.0
Stockton Solar I, LLC, US, Wilmington 2 100.0
Stockton Solar II, LLC, US, Wilmington 2 100.0
Strom Germering GmbH, DE, Germering 2 90.0
Stromnetz Kulmbach GmbH & Co. KG, DE, Kulmbach 6 49.0
Stromnetz Kulmbach Verwaltungs GmbH, DE, Kulmbach 6 49.0
Stromnetz Pullach GmbH, DE, Pullach im Isartal 2 100.0
Stromnetz Weiden i.d.OPf. GmbH & Co. KG, DE, Weiden i. d. OPf. 6 49.0
Stromnetz Würmtal GmbH & Co. KG, DE, Planegg 2 74.5
Stromnetz Würmtal Verwaltungs GmbH, DE, Planegg 2 100.0
Stromnetze Peiner Land GmbH, DE, Ilsede 6 49.0
Stromnetzgesellschaft Bad Salzdetfurth - Diekholzen mbH &
Co. KG, DE, Bad Salzdetfurth 6 49.0
Stromnetzgesellschaft Barsinghausen GmbH & Co. KG, DE,
Barsinghausen 6 49.0
Stromnetzgesellschaft Wunstorf GmbH & Co. KG, DE, Wunstorf 6 49.0
Stromversorgung Angermünde GmbH, DE, Angermünde 6 49.0
Stromversorgung Penzberg GmbH & Co. KG, DE, Penzberg 6 49.0
Stromversorgung Pfaffenhofen a. d. Ilm GmbH & Co. KG, DE,
Pfaffenhofen 6 49.0
Stromversorgung Pfaffenhofen a. d. Ilm Verwaltungs GmbH,
DE, Pfaffenhofen 6 49.0
Stromversorgung Ruhpolding Gesellschaft mit beschränkter
Haftung, DE, Ruhpolding 2 100.0
Stromversorgung Unterschleißheim GmbH & Co. KG, DE,
Unterschleißheim 6 49.0
Stromversorgung Unterschleißheim Verwaltungs GmbH, DE,
Unterschleißheim 6 49.0
strotög GmbH Strom für Töging, DE, Töging am Inn 6 50.0
StWB Stadtwerke Brandenburg an der Havel GmbH & Co. KG,
DE, Brandenburg an der Havel 5 36.8
StWB Verwaltungs GmbH, DE, Brandenburg an der Havel 6 36.8
SüdWasser GmbH, DE, Erlangen 2 100.0
SVH Stromversorgung Haar GmbH, DE, Haar 6 50.0
SVI-Stromversorgung Ismaning GmbH, DE, Ismaning 6 25.1
Name, location Stake (%)
SVO Holding GmbH, DE, Celle 1 50.1
SVO Vertrieb GmbH, DE, Celle 1 100.0
SWG Glasfaser Netz GmbH, DE, Geesthacht 6 33.4
SWN Stadtwerke Neustadt GmbH, DE, Neustadt bei Coburg 6 25.1
SWS Energie GmbH, DE, Stralsund 5 49.0
Szczecińska Energetyka Cieplna Sp. z o.o., PL, Szczecin 1 66.5
Szombathelyi Erőmű Zrt., HU, Budapest 2 55.0
Szombathelyi Távhőszolgáltató Kft., HU, Szombathely 6 25.0
Tech Park Solar, LLC, US, Wilmington 1 100.0
The Power Generation Company Limited, GB, Coventry 2 100.0
Three Rocks Solar, LLC, US, Wilmington 2 100.0
Tierra Blanca Wind Farm, LLC, US, Wilmington 2 100.0
Tipton Wind, LLC, US, Wilmington 2 100.0
TPG Wind Limited, GB, Coventry 6 50.0
Triangeln 10 i Norrköping Fastighets AB, SE, Sundsvall 1 100.0
Triangeln 15 i Norrköping Fastighets AB, SE, Malmö 2 100.0
Trocknungsanlage Zolling GmbH & Co. KG, DE, Zolling 6 33.3
Trocknungsanlage Zolling Verwaltungs GmbH, DE, Zolling 6 33.3
Turkey Run, LLC, US, Wilmington 2 100.0
Überlandwerk Leinetal GmbH, DE, Gronau 6 48.0
Ultra-Fast Charging Joint Venture Scandinavia ApS, DK,
Copenhagen 6 50.0
Umspannwerk Miltzow-Mannhagen GbR, DE, Sundhagen 6 22.2
Union Grid s.r.o., CZ, Prague 6 34.0
Uranit GmbH, DE, Jülich 4 50.0
Utility Debt Services Limited, GB, Coventry 2 100.0
Valencia Solar, LLC, US, Tucson 1 100.0
Valverde Wind Farm, LLC, US, Wilmington 2 100.0
VDE Komplementär GmbH, DE, Kassel 2 100.0
VDE Projects GmbH, DE, Kassel 2 100.0
VEBA Electronics LLC, US, Wilmington 1 100.0
VEBACOM Holdings LLC, US, Wilmington 2 100.0
Venado Wind Farm, LLC, US, Wilmington 2 100.0
Disclosures Pursuant to Section 313 (2) HGB of Companies in Which Equity Investments Are Held (as of December 31, 2018)
1Consolidated affiliated company. · 2Non-consolidated affiliated company for reasons of immateriality (valued at cost). · 3Joint operations pursuant to IFRS 11. · 4Joint ventures pursuant to IFRS 11.5Associated company (valued using the equity method). · 6Associated company (valued at cost for reasons of immateriality). · 7Other companies in which share investments are held. · 8This company
exercised its exemption option under Section 264, Paragraph 3 of the German Commercial Code or under Section 264b.
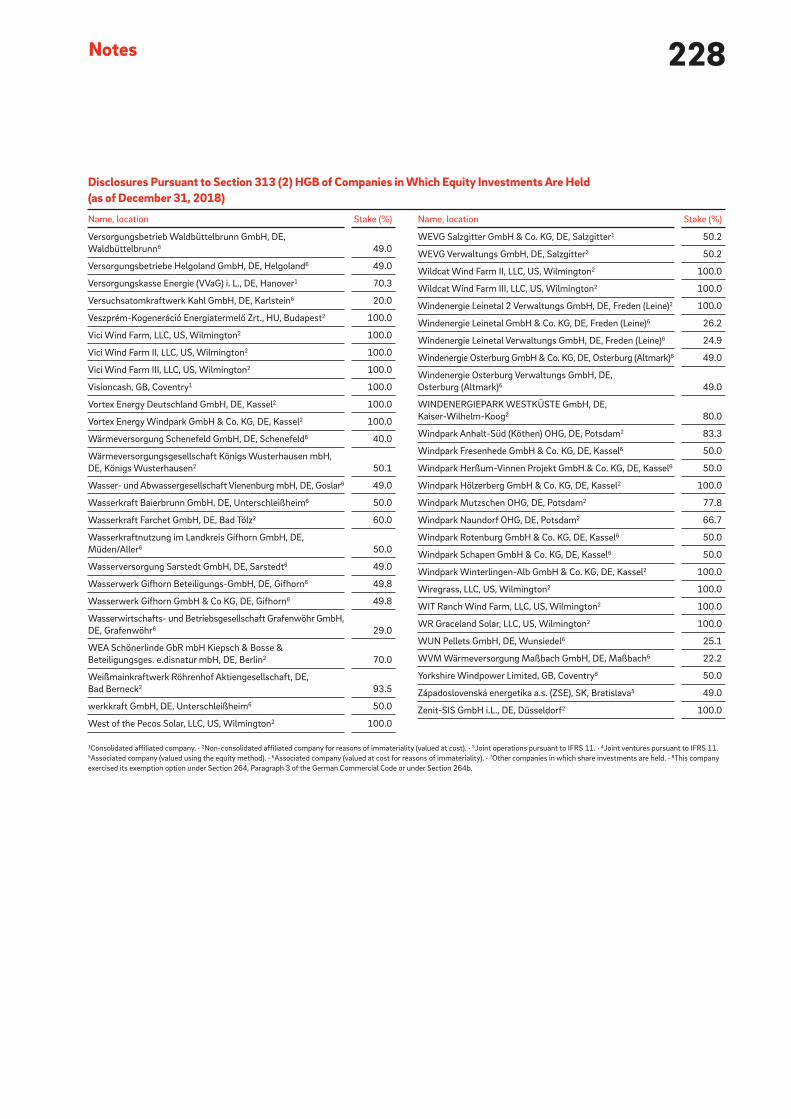
228Notes
Name, location Stake (%)
Versorgungsbetrieb Waldbüttelbrunn GmbH, DE,
Waldbüttelbrunn 6 49.0
Versorgungsbetriebe Helgoland GmbH, DE, Helgoland 6 49.0
Versorgungskasse Energie (VVaG) i. L., DE, Hanover 1 70.3
Versuchsatomkraftwerk Kahl GmbH, DE, Karlstein 6 20.0
Veszprém-Kogeneráció Energiatermelő Zrt., HU, Budapest 2 100.0
Vici Wind Farm, LLC, US, Wilmington 2 100.0
Vici Wind Farm II, LLC, US, Wilmington 2 100.0
Vici Wind Farm III, LLC, US, Wilmington 2 100.0
Visioncash, GB, Coventry 1 100.0
Vortex Energy Deutschland GmbH, DE, Kassel 2 100.0
Vortex Energy Windpark GmbH & Co. KG, DE, Kassel 2 100.0
Wärmeversorgung Schenefeld GmbH, DE, Schenefeld 6 40.0
Wärmeversorgungsgesellschaft Königs Wusterhausen mbH,
DE, Königs Wusterhausen 2 50.1
Wasser- und Abwassergesellschaft Vienenburg mbH, DE, Goslar 6 49.0
Wasserkraft Baierbrunn GmbH, DE, Unterschleißheim 6 50.0
Wasserkraft Farchet GmbH, DE, Bad Tölz 2 60.0
Wasserkraftnutzung im Landkreis Gifhorn GmbH, DE,
Müden/Aller 6 50.0
Wasserversorgung Sarstedt GmbH, DE, Sarstedt 6 49.0
Wasserwerk Gifhorn Beteiligungs-GmbH, DE, Gifhorn 6 49.8
Wasserwerk Gifhorn GmbH & Co KG, DE, Gifhorn 6 49.8
Wasserwirtschafts- und Betriebsgesellschaft Grafenwöhr GmbH,
DE, Grafenwöhr 6 29.0
WEA Schönerlinde GbR mbH Kiepsch & Bosse &
Beteiligungsges. e.disnatur mbH, DE, Berlin 2 70.0
Weißmainkraftwerk Röhrenhof Aktiengesellschaft, DE,
Bad Berneck 2 93.5
werkkraft GmbH, DE, Unterschleißheim 6 50.0
West of the Pecos Solar, LLC, US, Wilmington 2 100.0
Name, location Stake (%)
WEVG Salzgitter GmbH & Co. KG, DE, Salzgitter 1 50.2
WEVG Verwaltungs GmbH, DE, Salzgitter 2 50.2
Wildcat Wind Farm II, LLC, US, Wilmington 2 100.0
Wildcat Wind Farm III, LLC, US, Wilmington 2 100.0
Windenergie Leinetal 2 Verwaltungs GmbH, DE, Freden (Leine) 2 100.0
Windenergie Leinetal GmbH & Co. KG, DE, Freden (Leine) 6 26.2
Windenergie Leinetal Verwaltungs GmbH, DE, Freden (Leine) 6 24.9
Windenergie Osterburg GmbH & Co. KG, DE, Osterburg (Altmark) 6 49.0
Windenergie Osterburg Verwaltungs GmbH, DE,
Osterburg (Altmark) 6 49.0
WINDENERGIEPARK WESTKÜSTE GmbH, DE,
Kaiser-Wilhelm-Koog 2 80.0
Windpark Anhalt-Süd (Köthen) OHG, DE, Potsdam 2 83.3
Windpark Fresenhede GmbH & Co. KG, DE, Kassel 6 50.0
Windpark Herßum-Vinnen Projekt GmbH & Co. KG, DE, Kassel 6 50.0
Windpark Hölzerberg GmbH & Co. KG, DE, Kassel 2 100.0
Windpark Mutzschen OHG, DE, Potsdam 2 77.8
Windpark Naundorf OHG, DE, Potsdam 2 66.7
Windpark Rotenburg GmbH & Co. KG, DE, Kassel 6 50.0
Windpark Schapen GmbH & Co. KG, DE, Kassel 6 50.0
Windpark Winterlingen-Alb GmbH & Co. KG, DE, Kassel 2 100.0
Wiregrass, LLC, US, Wilmington 2 100.0
WIT Ranch Wind Farm, LLC, US, Wilmington 2 100.0
WR Graceland Solar, LLC, US, Wilmington 2 100.0
WUN Pellets GmbH, DE, Wunsiedel 6 25.1
WVM Wärmeversorgung Maßbach GmbH, DE, Maßbach 6 22.2
Yorkshire Windpower Limited, GB, Coventry 6 50.0
Západoslovenská energetika a.s. (ZSE), SK, Bratislava 5 49.0
Zenit-SIS GmbH i.L., DE, Düsseldorf 2 100.0
1Consolidated affiliated company. · 2Non-consolidated affiliated company for reasons of immateriality (valued at cost). · 3Joint operations pursuant to IFRS 11. · 4Joint ventures pursuant to IFRS 11.5Associated company (valued using the equity method). · 6Associated company (valued at cost for reasons of immateriality). · 7Other companies in which share investments are held. · 8This company
exercised its exemption option under Section 264, Paragraph 3 of the German Commercial Code or under Section 264b.
Disclosures Pursuant to Section 313 (2) HGB of Companies in Which Equity Investments Are Held (as of December 31, 2018)
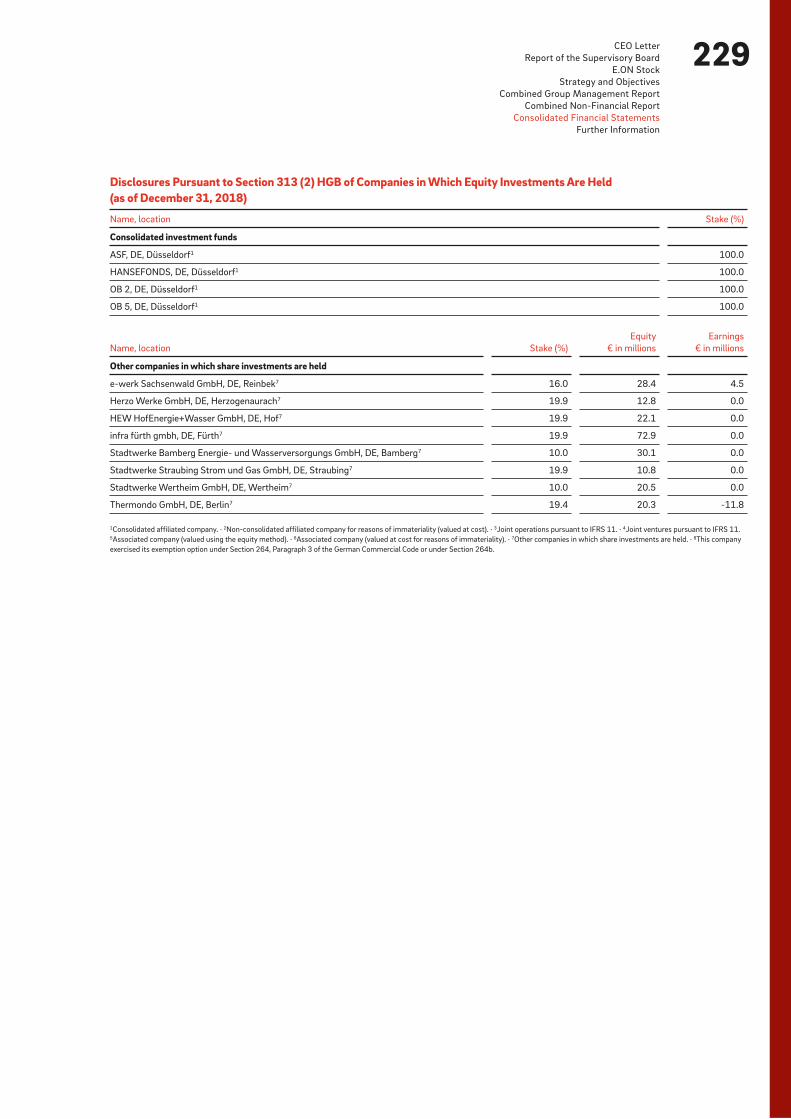
229CEO Letter
Report of the Supervisory Board
E.ON Stock
Strategy and Objectives
Combined Group Management Report
Combined Non-Financial Report
Consolidated Financial Statements
Further Information
Disclosures Pursuant to Section 313 (2) HGB of Companies in Which Equity Investments Are Held (as of December 31, 2018)
Name, location Stake (%)
Consolidated investment funds
ASF, DE, Düsseldorf 1 100.0
HANSEFONDS, DE, Düsseldorf 1 100.0
OB 2, DE, Düsseldorf 1 100.0
OB 5, DE, Düsseldorf 1 100.0
Name, location Stake (%)
Equity
€ in millions
Earnings
€ in millions
Other companies in which share investments are held
e-werk Sachsenwald GmbH, DE, Reinbek 7 16.0 28.4 4.5
Herzo Werke GmbH, DE, Herzogenaurach 7 19.9 12.8 0.0
HEW HofEnergie+Wasser GmbH, DE, Hof 7 19.9 22.1 0.0
infra fürth gmbh, DE, Fürth 7 19.9 72.9 0.0
Stadtwerke Bamberg Energie- und Wasserversorgungs GmbH, DE, Bamberg 7 10.0 30.1 0.0
Stadtwerke Straubing Strom und Gas GmbH, DE, Straubing 7 19.9 10.8 0.0
Stadtwerke Wertheim GmbH, DE, Wertheim 7 10.0 20.5 0.0
Thermondo GmbH, DE, Berlin 7 19.4 20.3 -11.8
1Consolidated affiliated company. · 2Non-consolidated affiliated company for reasons of immateriality (valued at cost). · 3Joint operations pursuant to IFRS 11. · 4Joint ventures pursuant to IFRS 11.5Associated company (valued using the equity method). · 6Associated company (valued at cost for reasons of immateriality). · 7Other companies in which share investments are held. · 8This company
exercised its exemption option under Section 264, Paragraph 3 of the German Commercial Code or under Section 264b.


FurtherInformation
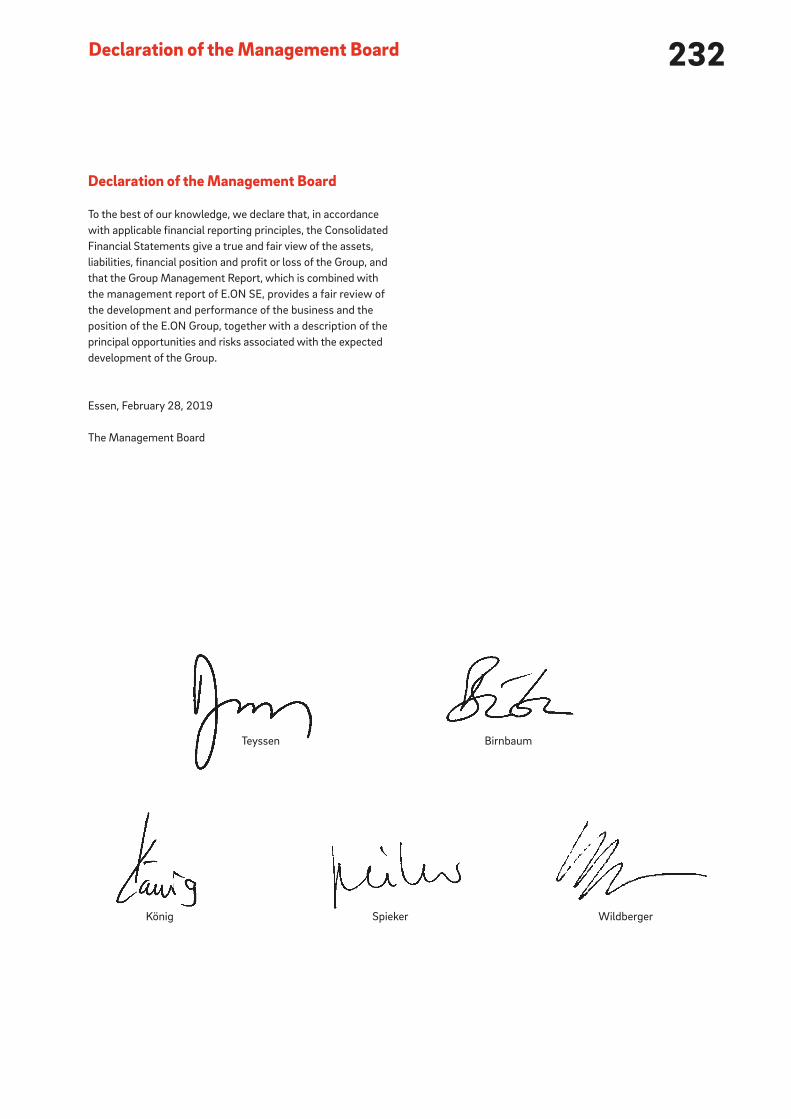
232Declaration of the Management Board
Teyssen
Wildberger
Birnbaum
SpiekerKönig
Declaration of the Management Board
To the best of our knowledge, we declare that, in accordance
with applicable financial reporting principles, the Consolidated
Financial Statements give a true and fair view of the assets,
liabilities, financial position and profit or loss of the Group, and
that the Group Management Report, which is combined with
the management report of E.ON SE, provides a fair review of
the development and performance of the business and the
position of the E.ON Group, together with a description of the
principal opportunities and risks associated with the expected
development of the Group.
Essen, February 28, 2019
The Management Board
233CEO Letter
Report of the Supervisory Board
E.ON Stock
Strategy and Objectives
Combined Group Management Report
Combined Non-Financial Report
Consolidated Financial Statements
Further Information
Independent Auditor’s Report
Pursuant to § 322 Abs. 3 Satz [sentence] 1 HGB, we declare
that our audit has not led to any reservations relating to the
legal compliance of the consolidated financial statements and
of the group management report.
Basis for the Audit Opinions
We conducted our audit of the consolidated financial state-
ments and of the group management report in accordance with
§ 317 HGB and the EU Audit Regulation (No. 537/2014, referred
to subsequently as “EU Audit Regulation”) in compliance with
German Generally Accepted Standards for Financial Statement
Audits promulgated by the Institut der Wirtschaftsprüfer [Insti-
tute of Public Auditors in Germany] (IDW). We performed the
audit of the consolidated financial statements in supplementary
compliance with the International Standards on Auditing (ISAs).
Our responsibilities under those requirements, principles and
standards are further described in the “Auditor’s Responsibilities
for the Audit of the Consolidated Financial Statements and of
the Group Management Report” section of our auditor’s report.
We are independent of the group entities in accordance with
the requirements of European law and German commercial and
professional law, and we have fulfilled our other German pro-
fessional responsibilities in accordance with these requirements.
In addition, in accordance with Article 10 (2) point (f) of the EU
Audit Regulation, we declare that we have not provided non-audit
services prohibited under Article 5 (1) of the EU Audit Regulation.
We believe that the audit evidence we have obtained is sufficient
and appropriate to provide a basis for our audit opinions on the
consolidated financial statements and on the group management
report.
Key Audit Matters in the Audit of the Consolidated Financial Statements
Key audit matters are those matters that, in our professional
judgment, were of most significance in our audit of the consoli-
dated financial statements for the financial year from January 1,
to December 31, 2018. These matters were addressed in the
context of our audit of the consolidated financial statements as
a whole, and in forming our audit opinion thereon; we do not
provide a separate audit opinion on these matters.
To E.ON SE, Essen
Report on the Audit of the Consolidated Financial Statements and of the Group Management Report
Audit Opinions
We have audited the consolidated financial statements of
E.ON SE, Essen, and its subsidiaries (the Group), which comprise
the consolidated balance sheet as at December 31, 2018, and
the consolidated statement of income, consolidated statement
of recognized income and expenses, consolidated statement
of changes in equity and consolidated statement of cash flows
for the financial year from January 1 to December 31, 2018,
and notes to the consolidated financial statements, including
a summary of significant accounting policies. In addition, we
have audited the group management report of E.ON SE, which
is combined with the Company’s management report, for the
financial year from January 1 to December 31, 2018. In accor-
dance with the German legal requirements, we have not audited
the content of the statement on corporate governance pursuant
to § [Article] 289f HGB [Handelsgesetzbuch: German Commer-
cial Code] and § 315d HGB.
In our opinion, on the basis of the knowledge obtained in the audit,
• the accompanying consolidated financial statements comply,
in all material respects, with the IFRSs as adopted by the
EU, and the additional requirements of German commercial
law pursuant to § 315e Abs. [paragraph] 1 HGB and, in com-
pliance with these requirements, give a true and fair view of
the assets, liabilities, and financial position of the Group as
at December 31, 2018, and of its financial performance for
the financial year from January 1 to December 31, 2018, and
• the accompanying group management report as a whole
provides an appropriate view of the Group’s position. In all
material respects, this group management report is consis-
tent with the consolidated financial statements, complies
with German legal requirements and appropriately presents
the opportunities and risks of future development. Our audit
opinion on the group management report does not cover the
content of the statement on corporate governance referred
to above.
234Independent Auditor’s Report
In our view, the matters of most significance in our audit were
as follows:
1. Exchange of business activities with RWE
2. Recoverability of goodwill
3. Non-current provisions
Our presentation of these key audit matters has been structured
in each case as follows:
a. Matter and issue
b. Audit approach and findings
c. Reference to further information
Hereinafter we present the key audit matters:
1. Exchange of business activities with RWEa. In the consolidated financial statements of E.ON SE as of
December 31, 2018, an amount of EUR 11.4 billion is recog-
nized under the “Assets held for sale” balance sheet item,
and an amount of EUR 3.7 billion is recognized under the
“Liabilities associated with assets held for sale” balance sheet
item. Of these, EUR 11.3 billion and EUR 2.7 billion, respec-
tively, relate in particular to the renewables business and
EUR 0.2 billion and EUR 1.0 billion, respectively, to two minor-
ity stocks in the Emsland and Gundremmingen nuclear power
plants operated by RWE AG, Essen (RWE) as well as further
assets connected with operating and decommissioning those
power plants, including the associated decommissioning
obligations (nuclear power equity interests).
On March 12, 2018, E.ON and RWE entered into an agree-
ment on a comprehensive exchange of business activities.
The agreement is subject to conditions precedent, in par-
ticular approval from antitrust authorities. In accordance
with the agreement, E.ON acquires RWE’s 76.8% interest
in innogy SE, Essen (innogy), and receives a cash payment
of EUR 1.5 billion. In return, E.ON will transfer substantially
all of its current renewables business, the nuclear power
minority stocks and (following closing of the innogy takeover)
innogy’s complete renewables and gas storage businesses
as well as its equity interests in KELAG-Kärntner Elektri-
zitäts-Aktiengesellschaft to RWE. In addition, RWE obtains
440,219,800 new shares of E.ON SE created from the latter’s
authorized capital, corresponding to an approx. 16.67%
interest in E.ON’s share capital.
On April 27, 2018, E.ON made a voluntary public takeover
offer to acquire all shares of innogy SE for EUR 36.76 per
share. If the transaction closes before the date of innogy’s
annual general meeting resolving on the appropriation of net
profit for financial year 2018, the consideration will increase
by EUR 1.64 per innogy share. The closing of the transaction
and the public takeover offer are subject to conditions prece-
dent and require approval from antitrust authorities. 9.4%
of the shares have been tendered under the takeover offer.
E.ON’s obligation arising from the takeover offer is reported
under other financial obligations in the notes to the consoli-
dated financial statements.
Based on the assessment by the Company’s executive direc-
tors that the overall transaction is highly probable to close,
the renewables business subject to transfer is presented as
a discontinued operation and the nuclear power minority
stocks as a disposal group effective June 30, 2018, in accor-
dance with IFRS 5. Since E.ON will manage the renewables
business until the disposal takes effect, the activities will
continue to be fully included in the relevant key performance
indicators and the segment reporting. In connection with the
mandatory impairment testing of the two disposal groups’
assets prior to reclassification, no material impairment losses
or reversals were identified. The subsequent impairment test
on the renewables business as a whole did not identify any
further impairment. Due to the highly complex nature of the
overall transaction and the accounting treatment of the
agreement with RWE as well as the underlying assumptions
and estimates the presentation as a discontinued operation/
disposal group, the associated impairment testing, and E.ON’s
reporting of the public takeover offer in its consolidated
financial statements were of particular significance in the
context of our audit.
b. As part of our audit, we assessed in particular the presenta-
tion of the renewables business as a discontinued operation
and the nuclear power minority stocks as a disposal group.
We assessed whether the classification as a discontinued
235CEO Letter
Report of the Supervisory Board
E.ON Stock
Strategy and Objectives
Combined Group Management Report
Combined Non-Financial Report
Consolidated Financial Statements
Further Information
c. The Company’s disclosures on the planned disposal of the
renewables business and the minority stocks are contained in
notes 4, 27 and 33 to the consolidated financial statements.
2. Recoverability of goodwilla. Following reclassification of the EUR 1.3 billion in goodwill
attributable to renewables to “Assets held for sale”, a remain-
ing amount of EUR 2.1 billion is reported under the “Goodwill”
balance sheet item in the consolidated financial statements
of E.ON SE as of December 31, 2018. In financial year 2018,
no impairment loss was to be recognized. The Company
allocates goodwill to cash-generating units or groups of
cash-generating units that are primarily equivalent to the
E.ON Group’s operating segments. These are subject to
impairment tests on a regular basis in the fourth quarter
of a given financial year or whenever there are indications
of impairment. The carrying amount of the relevant cash-
generating units, including goodwill, is compared with the
corresponding recoverable amount in the context of the
impairment test. The present value of the future cash flows
from the respective cash-generating unit serves as the basis
of valuation in the context of an impairment test. The cash
flows are based on the E.ON Group’s medium-term planning
for the years 2019 to 2021. For the purposes of assessing
the recoverability of goodwill, the three-year detailed plan-
ning period is generally extended by another two years – or
more, if required – and is then extrapolated on the basis of
assumptions about long-term growth rates in perpetual
annuity. The discount rate used is the weighted average cost
of capital for the relevant cash-generating unit in each case.
The result of this measurement depends to a large extent on
the executive directors’ estimates of the amount of future
cash flows, the discount rate applied and the growth rate.
The assumptions about the long-term development of the
underlying prices and the relevant regulatory influencing
factors are also of particular importance. Due to the com-
plexity of the measurement and the considerable uncertainties
relating to the underlying assumptions this matter was of
particular significance in the context of our audit.
operation/disposal group as of June 30, 2018 was appropriate
and whether the presentation in the balance sheet, income
statement and statement of cash flows complied with the
relevant standards and the generally accepted professional
interpretations. For this purpose we first of all obtained an
understanding of the underlying contractual agreements and
evaluated their impact on the presentation of the renewables
business and the nuclear power equity interests, and on the
accounting treatment.
In evaluating the estimate that the transaction was highly
probably to close, we took into particular consideration the
public takeover offer made by E.ON to innogy’s minority
shareholders, the cooperation agreement between innogy,
RWE and E.ON, and the executive directors’ assessments
with respect to approval from the antitrust authorities.
A subsequent focal point for our audit was the measurement
of the assets and liabilities of both disposal groups, as well
as the impairment testing on the renewables business.
We assessed the measurement models and the underlying
assumptions, as well as the specific calculation. We also
evaluated how the transaction was reported in the notes,
in particular the disclosures on the discontinued operation
within the segment reporting. We were able to satisfy our-
selves that the renewables business and the minority equity
interests were properly presented, that the assumptions
and parameters underlying the measurement were suffi-
ciently documented and substantiated overall, and that the
disclosures on the discontinued operation within the seg-
ment information were appropriate.
We also focused on the reporting of the public takeover offer
and E.ON’s resulting obligation in the consolidated financial
statements. For this purpose, we looked in particular at the
legal basis for such a takeover offer in the context of the
overall transaction, which is aimed at acquiring control. In
addition, we assessed the value of the offer and its com-
position against the background of innogy’s current market
value. We were able to satisfy ourselves that there was no
need to recognize the public takeover offer or E.ON’s resulting
obligation in the balance sheet, but that the obligation was
correctly disclosed as an “other financial obligation” in the
notes to the consolidated financial statements.

236
3. Non-current provisionsa. In the consolidated financial statements of E.ON SE as of
December 31, 2018, an amount of EUR 12.5 billion is
reported under the “Other provisions” balance sheet item.
EUR 9.5 billion of this amount is attributable to provisions
for the decommissioning of nuclear plants. Both the recog-
nition and the subsequent measurement of provisions, like
the determination of the underlying assumptions used in this
regard, including the rates of cost increases and discount rate
used, are highly dependent on estimates and assumptions
by the executive directors. We therefore consider this matter
to be of particular significance for our audit.
b. With the knowledge that the measurement of provisions is
primarily based on the executive directors’ assessments
and that these have a significant effect on consolidated net
income, in particular we assessed the reliability of the informa-
tion used as well as the appropriateness of the assumptions
underlying the measurement. As part of our assessment of
the provisions for the decommissioning of nuclear plants,
we looked, among other things, at the external expert opinions
on which the measurement was based. We focused on the
evaluation of the technical decommissioning concepts and
the underlying cost assumptions, particularly with regard to
HR costs. Furthermore, we evaluated whether the rates
of cost increases and the interest rates with matching terms
were properly derived from market data.
We assessed the entire calculations (including discounting)
for the respective provisions using the applicable measure-
ment parameters and scrutinized the planned timetable for
utilizing the provisions. We were able to satisfy ourselves
that the assessments and assumptions made by the execu-
tive directors were sufficiently substantiated to justify the
recognition and measurement of the non-current provisions.
We consider the measurement parameters and assumptions
used by the executive directors to be reproducible as a whole,
and we were able to satisfy ourselves that they were properly
included in the calculation of the provisions.
c. The Company’s disclosures relating to the non-current pro-
visions are contained in note 25 to the consolidated financial
statements.
b. As part of our audit, we assessed, among other things,
whether the measurement model for performing impairment
tests properly reflects the conceptual requirements of the
relevant standards and whether the calculations in the mod-
els were correctly performed. The critical assessment of
the key assumptions underlying the measurements was the
focal point of our audit. We evaluated the appropriateness
of the future cash flows used for the measurement by recon-
ciling this data against general and sector-specific market
expectations and by comparing it with the current budgets
in the Group investment, finance and HR plan for 2019 pre-
pared by the executive directors and approved by the super-
visory board on December 18, 2018 as well as the planning
for the years 2020 and 2021 prepared by the executive direc-
tors and acknowledged by the supervisory board. Among
other things, we assessed how the long-term growth rates
used for perpetual annuities were derived from the observable
market data and market expectations. We also assessed the
parameters used to determine the discount rate applied, and
evaluated the measurement model. In addition, we compared
the assumptions about long-term price development and
the relevant regulatory influencing factors against sector-
specific expectations. Within the context of our assessment
of the recoverability of goodwill, we also evaluated whether
the costs for corporate overheads were properly ascertained,
allocated, and included in the impairment tests of the
respective cash-generating units. Finally, we assessed the
calculation of the carrying amounts of the cash-generating
units, which were compared against the corresponding
recoverable amount, as well as the mathematical comparison.
Overall, we consider the measurement inputs and assump-
tions used by the executive directors to be in line with our
expectations. We were able to verify the inclusion in the
measurement models and the calculation of the impairment
losses that had been identified.
c. The Company’s disclosures relating to the recoverability of
goodwill are contained in note 14 to the consolidated financial
statements.
Independent Auditor’s Report

237CEO Letter
Report of the Supervisory Board
E.ON Stock
Strategy and Objectives
Combined Group Management Report
Combined Non-Financial Report
Consolidated Financial Statements
Further Information
of the assets, liabilities, financial position, and financial perfor-
mance of the Group. In addition the executive directors are
responsible for such internal control as they have determined
necessary to enable the preparation of consolidated financial
statements that are free from material misstatement, whether
due to fraud or error.
In preparing the consolidated financial statements, the execu-
tive directors are responsible for assessing the Group’s ability
to continue as a going concern. They also have the responsibility
for disclosing, as applicable, matters related to going concern.
In addition, they are responsible for financial reporting based on
the going concern basis of accounting unless there is an inten-
tion to liquidate the Group or to cease operations, or there is no
realistic alternative but to do so.
Furthermore, the executive directors are responsible for the
preparation of the group management report that, as a whole,
provides an appropriate view of the Group’s position and is, in
all material respects, consistent with the consolidated financial
statements, complies with German legal requirements, and
appropriately presents the opportunities and risks of future
development. In addition, the executive directors are responsible
for such arrangements and measures (systems) as they have
considered necessary to enable the preparation of a group man-
agement report that is in accordance with the applicable Ger-
man legal requirements, and to be able to provide sufficient
appropriate evidence for the assertions in the group manage-
ment report.
The supervisory board is responsible for overseeing the Group’s
financial reporting process for the preparation of the consolidated
financial statements and of the group management report.
Other Information
The executive directors are responsible for the other information.
The other information comprises the statement on corporate
governance pursuant to § 289f HGB and § 315d HGB.
The other information comprises further the remaining parts
of the annual report – excluding cross-references to external
information – with the exception of the audited consolidated
financial statements, the audited group management report
and our auditor’s report, and the separate non-financial report
pursuant to § 289b Abs. 3 HGB and § 315b Abs. 3 HGB.
Our audit opinions on the consolidated financial statements and
on the group management report do not cover the other infor-
mation, and consequently we do not express an audit opinion
or any other form of assurance conclusion thereon.
In connection with our audit, our responsibility is to read the
other information and, in so doing, to consider whether the other
information
• is materially inconsistent with the consolidated financial
statements, with the group management report or our
knowledge obtained in the audit, or
• otherwise appears to be materially misstated.
If, based on the work we have performed, we conclude that
there is a material misstatement of this other information,
we are required to report that fact. We have nothing to report
in this regard.
Responsibilities of the Executive Directors and the Supervisory Board for the Consolidated Financial Statements and the Group Management ReportThe executive directors are responsible for the preparation of
the consolidated financial statements that comply, in all material
respects, with IFRSs as adopted by the EU and the additional
requirements of German commercial law pursuant to § 315e
Abs. 1 HGB and that the consolidated financial statements, in
compliance with these requirements, give a true and fair view
238
• Obtain an understanding of internal control relevant to the
audit of the consolidated financial statements and of
arrangements and measures (systems) relevant to the audit
of the group management report in order to design audit
procedures that are appropriate in the circumstances, but
not for the purpose of expressing an audit opinion on the
effectiveness of these systems.
• Evaluate the appropriateness of accounting policies used by
the executive directors and the reasonableness of estimates
made by the executive directors and related disclosures.
• Conclude on the appropriateness of the executive directors’
use of the going concern basis of accounting and, based on
the audit evidence obtained, whether a material uncertainty
exists related to events or conditions that may cast signifi-
cant doubt on the Group’s ability to continue as a going con-
cern. If we conclude that a material uncertainty exists, we
are required to draw attention in the auditor’s report to the
related disclosures in the consolidated financial statements
and in the group management report or, if such disclosures
are inadequate, to modify our respective audit opinions. Our
conclusions are based on the audit evidence obtained up
to the date of our auditor’s report. However, future events
or conditions may cause the Group to cease to be able to
continue as a going concern.
• Evaluate the overall presentation, structure and content of
the consolidated financial statements, including the disclo-
sures, and whether the consolidated financial statements
present the underlying transactions and events in a manner
that the consolidated financial statements give a true and
fair view of the assets, liabilities, financial position and finan-
cial performance of the Group in compliance with IFRSs
as adopted by the EU and the additional requirements of
German commercial law pursuant to § 315e Abs. 1 HGB.
Auditor’s Responsibilities for the Audit of the Consolidated Financial Statements and of the Group Management Report Our objectives are to obtain reasonable assurance about
whether the consolidated financial statements as a whole are
free from material misstatement, whether due to fraud or error,
and whether the group management report as a whole provides
an appropriate view of the Group’s position and, in all material
respects, is consistent with the consolidated financial state-
ments and the knowledge obtained in the audit, complies with
the German legal requirements and appropriately presents the
opportunities and risks of future development, as well as to
issue an auditor’s report that includes our audit opinions on the
consolidated financial statements and on the group manage-
ment report.
Reasonable assurance is a high level of assurance, but is not a
guarantee that an audit conducted in accordance with § 317 HGB
and the EU Audit Regulation and in compliance with German
Generally Accepted Standards for Financial Statement Audits
promulgated by the Institut der Wirtschaftsprüfer (IDW) and
supplementary compliance with the ISAs will always detect a
material misstatement. Misstatements can arise from fraud or
error and are considered material if, individually or in the aggre-
gate, they could reasonably be expected to influence the eco-
nomic decisions of users taken on the basis of these consolidated
financial statements and this group management report.
We exercise professional judgment and maintain professional
skepticism throughout the audit. We also:
• Identify and assess the risks of material misstatement of the
consolidated financial statements and of the group manage-
ment report, whether due to fraud or error, design and per-
form audit procedures responsive to those risks, and obtain
audit evidence that is sufficient and appropriate to provide a
basis for our audit opinions. The risk of not detecting a mate-
rial misstatement resulting from fraud is higher than for one
resulting from error, as fraud may involve collusion, forgery,
intentional omissions, misrepresentations, or the override of
internal control.
Independent Auditor’s Report

239CEO Letter
Report of the Supervisory Board
E.ON Stock
Strategy and Objectives
Combined Group Management Report
Combined Non-Financial Report
Consolidated Financial Statements
Further Information
Other Legal and Regulatory Requirements
Further Information pursuant to Article 10 of the EU Audit Regulation
We were elected as group auditor by the annual general meeting
on May 9, 2018. We were engaged by the supervisory board on
June 25, 2018. We have been the group auditor of the E.ON SE,
Essen, without interruption since the Company first met the
requirements as a public-interest entity within the meaning of
§ 319a Abs. 1 Satz 1 HGB in the financial year 1965.
We declare that the audit opinions expressed in this auditor’s
report are consistent with the additional report to the audit
committee pursuant to Article 11 of the EU Audit Regulation
(long-form audit report).
German Public Auditor Responsible for the Engagement
The German Public Auditor responsible for the engagement is
Aissata Touré.
Düsseldorf, March 5, 2019
PricewaterhouseCoopers GmbH
Wirtschaftsprüfungsgesellschaft
(Markus Dittmann) (Aissata Touré)
Wirtschaftsprüfer Wirtschaftsprüferin
(German Public Auditor) (German Public Auditor)
• Obtain sufficient appropriate audit evidence regarding the
financial information of the entities or business activities
within the Group to express audit opinions on the consolidated
financial statements and on the group management report.
We are responsible for the direction, supervision and perfor-
mance of the group audit. We remain solely responsible for
our audit opinions.
• Evaluate the consistency of the group management report
with the consolidated financial statements, its conformity with
German law, and the view of the Group’s position it provides.
• Perform audit procedures on the prospective information
presented by the executive directors in the group manage-
ment report. On the basis of sufficient appropriate audit evi-
dence we evaluate, in particular, the significant assumptions
used by the executive directors as a basis for the prospective
information, and evaluate the proper derivation of the pro-
spective information from these assumptions. We do not
express a separate audit opinion on the prospective infor-
mation and on the assumptions used as a basis. There is
a substantial unavoidable risk that future events will differ
materially from the prospective information.
We communicate with those charged with governance regard-
ing, among other matters, the planned scope and timing of the
audit and significant audit findings, including any significant
deficiencies in internal control that we identify during our audit.
We also provide those charged with governance with a state-
ment that we have complied with the relevant independence
requirements, and communicate with them all relationships and
other matters that may reasonably be thought to bear on our
independence, and where applicable, the related safe-guards.
From the matters communicated with those charged with gov-
ernance, we determine those matters that were of most signifi-
cance in the audit of the consolidated financial statements of
the current period and are therefore the key audit matters. We
describe these matters in our auditor’s report unless law or reg-
ulation precludes public disclosure about the matter.
240Independent Practitioner’s Report on Non-financial Reporting
Independent Practitioner’s Report on a Limited Assurance Engagement on Non-financial Reporting
To E.ON SE, Essen
We have performed a limited assurance engagement on the
combined separate non-financial report pursuant to §§ (Arti-
cles) 289b Abs. (paragraph) 3 and 315b Abs. 3 HGB (“Handels-
gesetzbuch”: “German Commercial Code”) of E.ON SE, Essen
(hereinafter the “Company”) for the period from 1st January to
31st December 2018 (hereinafter the “Non-financial Report”).
Responsibilities of the Executive Directors
The executive directors of the Company are responsible for
the preparation of the Non-financial Report in accordance with
§§ 315b and 315c in conjunction with 289b to 289e HGB.
This responsibility of Company’s executive directors includes
the selection and application of appropriate methods of non-
financial reporting as well as making assumptions and estimates
related to individual non-financial disclosures which are reason-
able in the circumstances. Furthermore, the executive directors
are responsible for such internal control as they have considered
necessary to enable the preparation of a Non-financial Report
that is free from material misstatement whether due to fraud
or error.
Independence and Quality Control of the Audit Firm
We have complied with the German professional provisions
regarding independence as well as other ethical requirements.
Our audit firm applies the national legal requirements and
professional standards – in particular the Professional Code
for German Public Auditors and German Chartered Auditors
(“Berufssatzung für Wirtschaftsprüfer und vereidigte Buch-
prüfer“: “BS WP/vBP”) as well as the Standard on Quality Con-
trol 1 published by the Institut der Wirtschaftsprüfer (Institute
of Public Auditors in Germany; IDW): Requirements to quality
control for audit firms (IDW Qualitätssicherungsstandard 1:
Anforderungen an die Qualitätssicherung in der Wirtschafts-
prüferpraxis - IDW QS 1) – and accordingly maintains a compre-
hensive system of quality control including documented policies
and procedures regarding compliance with ethical requirements,
professional standards and applicable legal and regulatory
requirements.
Practitioner’s Responsibility
Our responsibility is to express a limited assurance conclusion
on the Non-financial Report based on the assurance engagement
we have performed.
Within the scope of our engagement we did not perform an
audit on external sources of information or expert opinions,
referred to in the Non-financial Report.
We conducted our assurance engagement in accordance with
the International Standard on Assurance Engagements (ISAE)
3000 (Revised): Assurance Engagements other than Audits or
Reviews of Historical Financial Information, issued by the IAASB.
This Standard requires that we plan and perform the assurance
engagement to allow us to conclude with limited assurance
that nothing has come to our attention that causes us to believe
that the Company’s Non-financial Report for the period from
1st January to 31st December 2018 has not been prepared, in
all material aspects, in accordance with §§ 315b and 315c in
conjunction with 289b to 289e HGB.
241CEO Letter
Report of the Supervisory Board
E.ON Stock
Strategy and Objectives
Combined Group Management Report
Combined Non-Financial Report
Consolidated Financial Statements
Further Information
In a limited assurance engagement the assurance procedures
are less in extent than for a reasonable assurance engagement,
and therefore a substantially lower level of assurance is obtained.
The assurance procedures selected depend on the practitioner’s
judgment.
Within the scope of our assurance engagement, we performed
amongst others the following assurance procedures and further
activities:
• Obtaining an understanding of the structure of the sustain-
ability organization and of the stakeholder engagement,
• Inquiries of personnel involved in the preparation of the
Non-financial Report regarding the preparation process, the
internal control system relating to this process and selected
disclosures in the Non-financial Report,
• Identification of the likely risks of material misstatement of
the Non-financial Report,
• Analytical evaluation of selected disclosures in the Non-
financial Report,
• Survey regarding local data gathering and approval of GHG
emissions FY18 in order to obtain an understanding of how
the data has been gathered in the first place and how poten-
tial sources of error have been dealt with (e.g. incomplete or
wrong data),
• Comparison of selected disclosures with corresponding data
in the consolidated financial statements and in the group
management report, and
• Evaluation of the presentation of the non-financial information.
Assurance Conclusion
Based on the assurance procedures performed and assurance
evidence obtained, nothing has come to our attention that
causes us to believe that the Company’s Non-financial Report
for the period from 1st January to 31st December 2018 has
not been prepared, in all material aspects, in accordance with
§§ 315b and 315c in conjunction with 289b to 289e HGB.
Intended Use of the Assurance Report
We issue this report on the basis of the engagement agreed with
the Company. The assurance engagement has been performed
for purposes of the Company and the report is solely intended
to inform the Company about the results of the limited assurance
engagement. The report is not intended for any third parties to
base any (financial) decision thereon. Our responsibility lies only
with the Company. We do not assume any responsibility
towards third parties.
Essen, 5 March 2019
PricewaterhouseCoopers GmbH
Wirtschaftsprüfungsgesellschaft
Markus Dittmann Hendrik Fink
Wirtschaftsprüfer Wirtschaftsprüfer
(German Public Auditor) (German Public Auditor)
242
Carolina Dybeck Happe Chief Financial Officer of ASSA ABLOY AB
ASSA ABLOY Asia Holding AB (Chairperson)
ASSA ABLOY East Europe AB (Chairperson)
ASSA ABLOY Entrance Systems AB (Chairperson)
ASSA ABLOY Financial Services AB (Chairperson)
ASSA ABLOY Finans AB (Chairperson)
ASSA ABLOY IP AB (Chairperson)
ASSA ABLOY Kredit AB (Chairperson)
ASSA ABLOY Mobile Services AB (Chairperson)
Baroness Denise Kingsmill CBE (until May 9, 2018)Attorney at the Supreme Court
Member of the House of Lords
Monzo Bank Ltd. (Chairperson, until May 30, 2018)
Inditex S.A.
Eugen-Gheorghe LuhaChairman of Romanian Federation of Gas Unions at Gaz România
Chairman of Romanian employee representatives
Szilvia Pinczésné Márton (since May 9, 2018)Chairperson of the Works Council of E.ON Dél-dunántúli
Áramhálózati Zrt.
Andreas Schmitz Attorney and bank clerk
HSBC Trinkaus & Burkhardt AG (Chairman)
Scheidt & Bachmann GmbH (Chairman)
Andersch AG (Chairman, since April 23, 2018)
Fred Schulz (until May 9, 2018, since May 29, 2018)Chairman of the SE Works Council of E.ON SE
Deputy Chairman of the E.ON Group Works Council
Chairman of the General Works Council of E.DIS AG
Chairman of the Works Council of E.DIS Netz GmbH-Region East
E.DIS AG
Szczecińska Energetyka Cieplna Sp. z o.o.
Dr. Karl-Ludwig Kley Chairman of the E.ON SE Supervisory Board
BMW AG
Deutsche Lufthansa AG (Chairman)
Verizon Communications Inc. (until May 3, 2018)
Prof. Dr. Ulrich Lehner (until May 9, 2018)Deputy Chairman of the E.ON SE Supervisory Board
(until May 9, 2018)
Member of the Shareholders’ Committee of
Henkel AG & Co. KGaA
Deutsche Telekom AG (Chairman)
ThyssenKrupp AG (Chairman, until July 31, 2018)
Porsche Automobil Holding SE
Henkel AG & Co. KGaA
Erich Clementi Deputy Chairman of the E.ON SE Supervisory Board
(since May 9, 2018)
Senior Vice President, Global Integrated Accounts and
Chairman, IBM Europe
Andreas ScheidtDeputy Chairman of the E.ON SE Supervisory Board
Member of National Board, Unified Service Sector Union, ver.di,
Director of Utility/Waste Management Section
Clive Broutta Full-time Representative of the General, Municipal,
Boilermakers, and Allied Trade Union (GMB)
Klaus Fröhlich (since May 29, 2018)Member of the Board of Management of
Bayerische Motoren Werke AG
Here BV (until February 28, 2018)
Tibor Gila (until May 9, 2018)Chairman of the Combined Works Council of E.ON Hungária Zrt.
Deputy Chairman of the SE Works Council of E.ON SE
Chairman of the Works Council of E.ON Észak-dunántúli
Áramhálózati Zrt.
E.ON Észak-dunántúli Áramhálózati Zrt.
Supervisory Board (and Information on Other Directorships)
Unless otherwise indicated, information is as of December 31, 2018, or as of the date on which membership in the E.ON SE Supervisory Board ended.
Directorships/supervisory board memberships within the meaning of Section 100, Paragraph 2 of the German Stock Corporation Act.
Directorships/memberships in comparable domestic and foreign supervisory bodies of commercial enterprises.
Boards
243CEO Letter
Report of the Supervisory Board
E.ON Stock
Strategy and Objectives
Combined Group Management Report
Combined Non-Financial Report
Consolidated Financial Statements
Further Information
Unless otherwise indicated, information is as of December 31, 2018, or as of the date on which membership in the E.ON SE Supervisory Board ended.
Directorships/supervisory board memberships within the meaning of Section 100, Paragraph 2 of the German Stock Corporation Act.
Directorships/memberships in comparable domestic and foreign supervisory bodies of commercial enterprises.
Silvia Šmátralová (until May 9, 2018)Chairperson of the Works Council of Západoslovenská
energetika a.s. (ZSE)
Member of the SE Works Council of E.ON SE
Západoslovenská distribučná a.s.
Západoslovenská energetika a.s.
Dr. Karen de Segundo Attorney
Dr. Theo Siegert (until May 9, 2018)Managing Partner, de Haen-Carstanjen & Söhne
Henkel AG & Co. KGaA
Merck KGaA
DKSH Holding Ltd.
E. Merck KG
Elisabeth WallbaumExpert, SE Works Council of E.ON SE and
E.ON Group Works Council
Ewald Woste Management Consultant
TEAG Thüringer Energie AG (Chairman, until June 20, 2018)
GASAG AG
Bayernwerk AG (since June 25, 2018)
GreenCom Networks AG
Deutsche Energie-Agentur GmbH (dena)
Energie Steiermark AG
TEN Thüringer Energienetze GmbH & Co. KG
(until June 20, 2018)
Albert Zettl Deputy Chairman of the SE Works Council of E.ON SE
Chairman of the E.ON Group Works Council
Chairman of the Division Works Council of Bayernwerk AG
Chairman of the Eastern Bavaria Works Council of Bayernwerk
Netz GmbH
Bayernwerk AG
Versorgungskasse Energie VVaG i.L.
Supervisory Board Committees
Executive CommitteeDr. Karl-Ludwig Kley, Chairman
Andreas Scheidt, Deputy Chairman
Erich Clementi (since May 9, 2018)
Prof. Dr. Ulrich Lehner (until May 9, 2018)
Fred Schulz (until May 9, 2018, since May 29, 2018)
Audit and Risk CommitteeAndreas Schmitz, Chairman since May 9, 2018
Dr. Theo Siegert, Chairman (until May 9, 2018)
Fred Schulz, Deputy Chairman
(until May 9, 2018, since May 29, 2018)
Caroline Dybeck Happe (since May 9, 2018)
Elisabeth Wallbaum (since January 1, 2018)
Investment and Innovation Committee Dr. Karen de Segundo, Chairperson
Albert Zettl, Deputy Chairman
Clive Broutta
Carolina Dybeck Happe (until May 9, 2018)
Klaus Fröhlich (since May 29, 2018)
Eugen-Gheorghe Luha
Ewald Woste
Nomination CommitteeDr. Karl-Ludwig Kley, Chairman
Erich Clementi, Deputy Chairman (since May 9, 2018)
Prof. Dr. Ulrich Lehner, Deputy Chairman (until May 9, 2018)
Dr. Karen de Segundo
244Boards
Dr. Marc SpiekerBorn in 1975 in Essen, Germany
Member of the Management Board since 2017
Finance, Mergers and Acquisitions and Investment Management,
Risk Management, Accounting and Controlling, Investor
Relations, Tax
Uniper SE (until July 16, 2018)
E.ON Verwaltungs SE (since March 8, 2018)
Nord Stream AG
Dr. Karsten WildbergerBorn in 1969 in Gießen, Germany
Member of the Management Board since 2016
Regional Sales and Customer Solutions, Distributed Generation,
Energy Management, Marketing, Digital Transformation,
Innovation, IT
E.ON Business Services GmbH1 (Chairman)
E.ON Sverige AB2
E.ON Energie A.S.2 (Chairman)
Dr. Johannes TeyssenBorn in 1959 in Hildesheim, Germany
Chairman of the Management Board and CEO since 2010
Member of the Management Board since 2004
Strategy and Corporate Development, Turkey, HR,
Political Affairs and Communications, Legal and Compliance,
Corporate Audit
Deutsche Bank AG (until May 24, 2018)
Nord Stream AG
Dr.-Ing. Leonhard BirnbaumBorn in 1967 in Ludwigshafen, Germany
Member of the Management Board since 2013
innogy integration project, Renewables, Health/Safety and
Environment, Sustainability, PreussenElektra
E.ON Czech Holding AG1 (Chairman, until July 10 ,2018)
Georgsmarienhütte Holding GmbH
E.ON Sverige AB2 (Chairman, until August 21, 2018)
E.ON Hungária Zrt.2 (Chairman, until August 2, 2018)
E.ON Česká republika s.r.o.2
(Chairman, until September 30, 2018)
E.ON Distribuce, a.s.2 (Chairman, until August 31, 2018)
Dr. Thomas König Born in 1965 in Finnentrop, Germany
Member of the Management Board since June 1, 2018
Regional Energy Networks, Procurement, Consulting
Avacon AG1 (Chairman)
Bayernwerk AG1 (Chairman)
E.DIS AG1 (Chairman)
Hansewerk AG1 (Chairman)
E.ON Dialog Netz GmbH1 (Chairman, until October 31, 2018)
e.kundenservice Netz GmbH1
(Chairman, until October 31, 2018)
GASAG AG (until September 28, 2018)
E.ON Sverige AB2 (Chairman, since August 21, 2018)
E.ON Hungária Zrt.2 (Chairman, since August 2, 2018)
E.ON Česká republika s.r.o.2
(since October 1, 2018, Chairman since October 11, 2018)
E.ON Distribuce, a.s.2 (Chairman, since September 11, 2018)
Management Board (and Information on Other Directorships)
Unless otherwise indicated, information is as of December 31, 2018, or as of the date on which membership in the E.ON Management Board ended.
Directorships/supervisory board memberships within the meaning of Section 100, Paragraph 2 of the German Stock Corporation Act.
Directorships/memberships in comparable domestic and foreign supervisory bodies of commercial enterprises.1Exempted E.ON Group directorship within the meaning of Section 100, Paragraph 2, Sentence 2 of the German Stock Corporation Act.
2Other E.ON Group directorship.
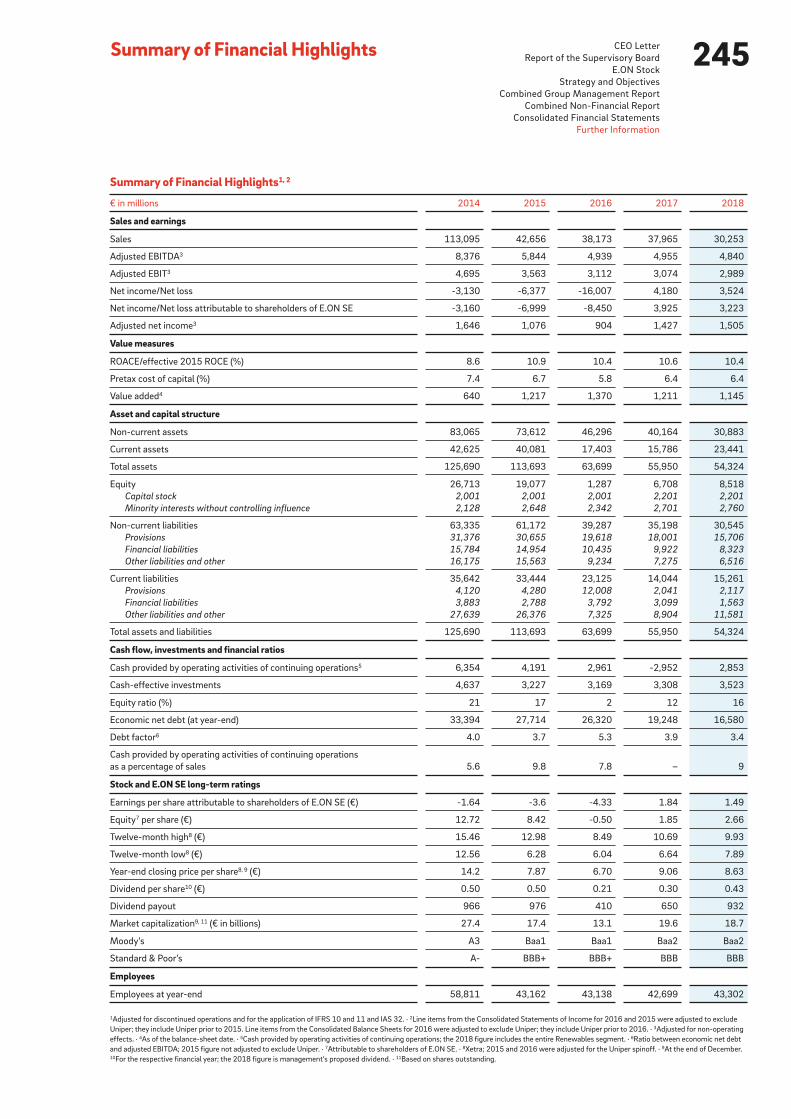
245CEO Letter
Report of the Supervisory Board
E.ON Stock
Strategy and Objectives
Combined Group Management Report
Combined Non-Financial Report
Consolidated Financial Statements
Further Information
Summary of Financial Highlights
Summary of Financial Highlights1, 2
€ in millions 2014 2015 2016 2017 2018
Sales and earnings
Sales 113,095 42,656 38,173 37,965 30,253
Adjusted EBITDA3 8,376 5,844 4,939 4,955 4,840
Adjusted EBIT3 4,695 3,563 3,112 3,074 2,989
Net income/Net loss -3,130 -6,377 -16,007 4,180 3,524
Net income/Net loss attributable to shareholders of E.ON SE -3,160 -6,999 -8,450 3,925 3,223
Adjusted net income3 1,646 1,076 904 1,427 1,505
Value measures
ROACE/effective 2015 ROCE (%) 8.6 10.9 10.4 10.6 10.4
Pretax cost of capital (%) 7.4 6.7 5.8 6.4 6.4
Value added4 640 1,217 1,370 1,211 1,145
Asset and capital structure
Non-current assets 83,065 73,612 46,296 40,164 30,883
Current assets 42,625 40,081 17,403 15,786 23,441
Total assets 125,690 113,693 63,699 55,950 54,324
Equity 26,713 19,077 1,287 6,708 8,518
Capital stock 2,001 2,001 2,001 2,201 2,201
Minority interests without controlling influence 2,128 2,648 2,342 2,701 2,760
Non-current liabilities 63,335 61,172 39,287 35,198 30,545
Provisions 31,376 30,655 19,618 18,001 15,706
Financial liabilities 15,784 14,954 10,435 9,922 8,323
Other liabilities and other 16,175 15,563 9,234 7,275 6,516
Current liabilities 35,642 33,444 23,125 14,044 15,261
Provisions 4,120 4,280 12,008 2,041 2,117
Financial liabilities 3,883 2,788 3,792 3,099 1,563
Other liabilities and other 27,639 26,376 7,325 8,904 11,581
Total assets and liabilities 125,690 113,693 63,699 55,950 54,324
Cash flow, investments and financial ratios
Cash provided by operating activities of continuing operations5 6,354 4,191 2,961 -2,952 2,853
Cash-effective investments 4,637 3,227 3,169 3,308 3,523
Equity ratio (%) 21 17 2 12 16
Economic net debt (at year-end) 33,394 27,714 26,320 19,248 16,580
Debt factor6 4.0 3.7 5.3 3.9 3.4
Cash provided by operating activities of continuing operations
as a percentage of sales 5.6 9.8 7.8 – 9
Stock and E.ON SE long-term ratings
Earnings per share attributable to shareholders of E.ON SE (€) -1.64 -3.6 -4.33 1.84 1.49
Equity7 per share (€) 12.72 8.42 -0.50 1.85 2.66
Twelve-month high8 (€) 15.46 12.98 8.49 10.69 9.93
Twelve-month low8 (€) 12.56 6.28 6.04 6.64 7.89
Year-end closing price per share8, 9 (€) 14.2 7.87 6.70 9.06 8.63
Dividend per share10 (€) 0.50 0.50 0.21 0.30 0.43
Dividend payout 966 976 410 650 932
Market capitalization9, 11 (€ in billions) 27.4 17.4 13.1 19.6 18.7
Moody’s A3 Baa1 Baa1 Baa2 Baa2
Standard & Poor’s A- BBB+ BBB+ BBB BBB
Employees
Employees at year-end 58,811 43,162 43,138 42,699 43,302
1Adjusted for discontinued operations and for the application of IFRS 10 and 11 and IAS 32. · 2Line items from the Consolidated Statements of Income for 2016 and 2015 were adjusted to exclude
Uniper; they include Uniper prior to 2015. Line items from the Consolidated Balance Sheets for 2016 were adjusted to exclude Uniper; they include Uniper prior to 2016. · 3Adjusted for non-operating
effects. · 4As of the balance-sheet date. · 5Cash provided by operating activities of continuing operations; the 2018 figure includes the entire Renewables segment. · 6Ratio between economic net debt
and adjusted EBITDA; 2015 figure not adjusted to exclude Uniper. · 7Attributable to shareholders of E.ON SE. · 8Xetra; 2015 and 2016 were adjusted for the Uniper spinoff. · 9At the end of December. 10For the respective financial year; the 2018 figure is management’s proposed dividend. · 11Based on shares outstanding.

246Glossary of Financial Terms
Actuarial gains and lossesThe actuarial calculation of provisions for pensions is based on projections of a number of
variables, such as projected future salaries and pensions. An actuarial gain or loss is recorded
when the actual numbers turn out to be different from the projections.
Adjusted EBIT1
Adjusted earnings before interest and taxes is our most important earnings figure for the
purpose of internal management control and as an indicator of our businesses’ long-term
earnings power. Adjusted EBIT used by E.ON is adjusted to exclude material non-operating
income and expenses (see Non-operating effects).
Adjusted EBITDA1
Earnings before interest, taxes, depreciation, and amortization. It is adjusted to exclude
material non-operating income and expenses (see Non-operating effects).
Adjusted net income1
An earnings figure after interest income, income taxes, and minority interests that has
been adjusted to exclude non-operating effects.
Beta factor Indicator of a stock’s relative risk. A beta coefficient of more than one indicates that a stock
has a higher risk than the overall market; a beta coefficient of less than one indicates that
it has a lower risk.
Bond Debt instrument that gives the holder the right to repayment of the bond’s face value plus
an interest payment. Bonds are issued by public entities, credit institutions, and companies
and are sold through banks. They are a form of medium- and long-term debt financing.
1For the purpose of internal management control, it includes the E.ON Group’s continuing operations as well as the discontinued operations in the Renewables segment.
247CEO Letter
Report of the Supervisory Board
E.ON Stock
Strategy and Objectives
Combined Group Management Report
Combined Non-Financial Report
Consolidated Financial Statements
Further Information
Capital employed1
Represents the interest-bearing capital tied up in the E.ON Group. It is equal to a segment’s
non-current and current operating assets less the amount of non-interest-bearing available
capital. Other equity interests are included at their acquisition cost, not their fair value.
Capital stock The aggregate face value of all shares of stock issued by a company; entered as a liability
in the company’s balance sheet.
Cash-conversion rate1 Operating cash flow before interest and taxes divided by adjusted EBITDA. It indicates
whether our operating earnings are generating enough liquidity.
Cash flow statement Calculation and presentation of the cash a company has generated or consumed during
a reporting period as a result of its operating, investing, and financing activities.
Cash provided by operating activitiesCash provided by, or used for, operating activities of continuing and discontinued operations.
Commercial paper (“CP”)Unsecured, short-term debt instruments issued by commercial firms and financial institutions.
CP is usually quoted on a discounted basis, with repayment at par value.
ConsolidationAccounting approach in which a parent company and its affiliates are presented as if they
formed a single legal entity. All intracompany income and expenses, intracompany accounts
payable and receivable, and other intracompany transactions are offset against each other.
Share investments in affiliates are offset against their capital stock, as are all intracompany
credits and debts, since such rights and obligations do not exist within a single legal entity.
The adding together and consolidation of the remaining items in the annual financial state-
ments yields the consolidated balance sheets and the consolidated statements of income.
Contractual trust arrangement (“CTA”) Model for financing pension obligations under which company assets are converted to
assets of a pension plan administered by an independent trust that is legally separate from
the company.
1For the purpose of internal management control, it includes the E.ON Group’s continuing operations as well as the discontinued operations in the Renewables segment.

248Glossary of Financial Terms
Cost of capital Weighted average of the costs of debt and equity financing (weighted-average cost of
capital: “WACC”). The cost of equity is the return expected by an investor in a given stock.
The cost of debt is based on the cost of corporate debt and bonds. The interest on corporate
debt is tax-deductible (referred to as the tax shield on corporate debt).
Credit default swap (“CDS”) A credit derivative used to hedge the default risk on loans, bonds, and other debt instruments.
Debt factor1 Ratio between economic net debt and EBITDA. Serves as a metric for managing E.ON’s
capital structure.
Debt issuance program Contractual framework and standard documentation for the issuance of bonds.
Discontinued operationsBusinesses or parts of a business that are planned for divestment or have already been
divested. They are subject to special disclosure rules.
Economic net debt1
Key figure that supplements net financial position with pension obligations as well as
asset-retirement and dismantling obligations. In the case of material provisions affected
by negative real interest rates, we use the actual amount of the obligation instead of the
balance-sheet figure to calculate our economic net debt.
Equity methodMethod for valuing shareholdings in associated companies whose assets and liabilities are
not fully consolidated. The proportional share of the company’s annual net income (or loss)
is reflected in the shareholding’s book value. This change is usually shown in the owning
company’s income statement.
1 For the purpose of internal management control, it includes the E.ON Group’s continuing operations as well as the discontinued operations in the Renewables segment as well as the waste-disposal
and dismantling obligations associated with our stakes in Emsland and Gundremmingen nuclear power stations, which are classified as a disposal group at PreussenElektra.
249CEO Letter
Report of the Supervisory Board
E.ON Stock
Strategy and Objectives
Combined Group Management Report
Combined Non-Financial Report
Consolidated Financial Statements
Further Information
Fair valueThe price at which assets, debts, and derivatives pass from a willing seller to a willing buyer,
each having access to all the relevant facts and acting freely.
Financial derivative Contractual agreement based on an underlying value (reference interest rate, securities
prices, commodity prices) and a nominal amount (foreign currency amount, a certain number
of stock shares).
Goodwill The value of a subsidiary as disclosed in the parent company’s consolidated financial state-
ments resulting from the consolidation of capital (after the elimination of hidden reserves
and liabilities). It is calculated by offsetting the carrying amount of the parent company’s
investment in the subsidiary against the parent company’s portion of the subsidiary’s equity.
Impairment test Periodic comparison of an asset’s book value with its fair value (its net sales value or value
in use, whichever is higher). A company must record an impairment charge if it determines
that an asset’s fair value has fallen below its book value. This is particularly relevant for
goodwill, which is tested for impairment on at least an annual basis.
International Financial Reporting Standards (“IFRS”) Under regulations passed by the European Parliament and European Council, capital-
market- oriented companies in the EU must apply IFRS.
Investments1 Cash-effective investments shown in the Consolidated Statements of Cash Flows.
1For the purpose of internal management control, it includes the E.ON Group’s continuing operations as well as the discontinued operations in the Renewables segment.
250Glossary of Financial Terms
Net financial position1
Difference between total financial assets (cash and non-current securities) and total financial
liabilities (debts to financial institutions, third parties, and associated companies, including
effects from currency translation).
Non-operating effects In particular, income and expenses from the marking to market of derivatives used for
hedging, as well as any material book gains and book losses on disposals, certain restructuring
expenses, impairment charges and/or reversals on fixed assets, on share investments in
affiliated and associated companies, and on goodwill in the context of an impairment test,
and other non-operating income and expenses.
Option The right, not the obligation, to buy or sell an underlying asset (such as a security or currency)
at a specific date at a predetermined price from or to a counterparty or seller. Buy options
are referred to as calls, sell options as puts.
Profit at Risk (“PaR”) Risk measure that indicates, with a certain degree of confidence (for example, 95 percent),
that changes in market prices will not cause a profit margin to fall below expectations
during the holding period, depending on market liquidity. For E.ON’s business, the main
market prices are those for power, gas, and carbon.
Purchase price allocation In a business combination accounted for as a purchase, the values at which the acquired
company’s assets and liabilities are recorded in the acquiring company’s balance sheet.
Rating Standardized performance categories for an issuer’s short- and long-term debt instruments
based on the probability of interest payment and full repayment. Ratings provide investors
and creditors with the transparency they need to compare the default risk of various financial
investments.
Return on equity The return earned on an equity investment (in this case, E.ON stock), calculated after
corporate taxes but before an investor’s individual income taxes.
ROACE Acronym for return on average capital employed. A key indicator for periodically monitoring
the performance of E.ON’s operating business, ROACE is the ratio between adjusted EBIT
and average capital employed. Capital employed is equal to the E.ON Group’s total assets at
half their historical acquisition or production cost.
1For the purpose of internal management control, it includes the E.ON Group’s continuing operations as well as the discontinued operations in the Renewables segment.

251CEO Letter
Report of the Supervisory Board
E.ON Stock
Strategy and Objectives
Combined Group Management Report
Combined Non-Financial Report
Consolidated Financial Statements
Further Information
ROCE1 Acronym for return on capital employed. A key indicator for periodically monitoring the
performance of E.ON’s operating business, ROCE is the ratio between adjusted EBIT and
average capital employed. Capital employed is equal to the book value of the E.ON Group’s
total assets.
Syndicated line of credit Credit facility extended by two or more banks that is good for a stated period of time.
Value added Key measure of E.ON’s financial performance based on residual wealth calculated by
deducting the cost of capital (debt and equity) from operating profit. It is equivalent
to the return spread (ROCE minus the cost of capital) multiplied by capital employed,
which represents the average interest-bearing capital tied up in the E.ON Group.
Value at Risk (“VaR”) Risk measure that indicates the potential loss that a portfolio of investments will not exceed
with a certain degree of probability (for example, 99 percent) over a certain period of time
(for example, one day). Due to the correlation of individual transactions, the risk faced by a
portfolio is lower than the sum of the risks of the individual investments it contains.
Working capital The difference between a company’s current operating assets and current operating liabilities.
1For the purpose of internal management control, it includes the E.ON Group’s continuing operations as well as the discontinued operations in the Renewables segment.
252
Contact
Production & Typesetting Jung Produktion, Düsseldorf
Printing G. Peschke Druckerei, Parsdorf
E.ON SE
Brüsseler Platz 1
45131 Essen
Germany
T +49 201-184-00
eon.com
Journalists
T +49 201-184-4236
eon.com/en/about-us/media.html
Analysts and shareholders
T +49 201-184-2806
Bond investors
T +49 201-184-7230
Only the German version of this Annual Report is legally binding.
This Annual Report was printed on paper produced from fiber that comes from
a responsibly managed forest certified by the Forest Stewardship Council.
Financial Calendar
May 13, 2019 Quarterly Statement: January – March 2019
May 14, 2019 2019 Annual Shareholders Meeting
August 7, 2019 Half-Year Financial Report: January – June 2019
November 13, 2019 Quarterly Statement: January – September 2019
March 25, 2020 Release of the 2019 Annual Report
May 12, 2020 Quarterly Statement: January – March 2020
May 13, 2020 2020 Annual Shareholders Meeting
August 12, 2020 Half-Year Financial Report: January – June 2020
November 11, 2020 Quarterly Statement: January – September 2020
This Annual Report was published on March 13, 2019.
This Annual Report contains certain forward-looking statements based on E.ON management’s current assumptions and
forecasts and other currently available information. Various known and unknown risks, uncertainties, and other factors
could lead to material differences between E.ON’s actual future results, financial situation, development, or performance
and the estimates given here. E.ON assumes no liability whatsoever to update these forward-looking statements or to
conform them to future events or developments.