2010 state injury indicator instructions
TRANSCRIPT


State Injury Indicators Report: Instructions for Preparing 2010 Data
U.S. Department of Health and Human Services
Centers for Disease Control and Prevention National Center for Injury Prevention and Control
Division of Injury Response
Atlanta, GeorgiaMay 2012
State Injury Indicators Report: Instructions for Preparing 2010 Data is a publication of the National Center for Injury Prevention and Control, Centers for Disease Control and Prevention.
Centers for Disease Control and PreventionThomas R. Frieden, MD, MPH
Director
National Center for Injury Prevention and ControlLinda Degutis, DrPH, MSN
Director
Division of Injury ResponseRichard C. Hunt, MD, FACEP
Director
Suggested citation:Thomas KE, Johnson RL. State injury indicators report: instructions for preparing 2010 data. Atlanta (GA): Centers for Disease Control and Prevention, National Center for Injury Prevention and Control; 2012.

EditorsKaren E. Thomas, MPH
Division of Injury ResponseNational Center for Injury Prevention and Control
Renee L. Johnson, RPT, MSPH Division of Injury Response
National Center for Injury Prevention and Control
Acknowledgements
The editors thank the Safe States Alliance, the Council of State and Territorial Epidemiologists, and their respective members. These partnerships have facilitated the ongoing advancement and success of the development of the injury indicators. The editors also thank Kevin Webb and Bob Thomas, Office of Statistics and Programming, and Angela Marr and Kelly Sarmiento, Division of Injury Response, all with the National Center for Injury Prevention and Control, for their consultation and guidance.

iv | State Injury Indicators: Instructions for Preparing 2010 Data
FOREWORD AND UPDATES
The Centers for Disease Control and Prevention’s (CDC) National Center for Injury Prevention and Control (NCIPC) is pleased to provide this document to guide you in preparing the 2010 state injury indicators.
Under CDC Program Announcement 05027, 28 states have been funded to collect and submit state injury indicator data; however, all states and U.S. territories are eligible to voluntarily submit data for inclusion in the multistate State Injury Indicators Report. As more states and U.S. territories voluntarily participate in this surveillance effort, a broader picture of the burden of injuries can be presented and priorities for prevention can be targeted. During the 2009 data collection cycle, 42 states participated by submitting data for inclusion in the multistate report. We look forward to continuing our work together to advance and improve injury surveillance.
The methods outlined in this document are consistent with those used in previous cycles of injury indicator data collection. These methods are based on recommendations presented in the “Consensus Recommendations for Using Hospital Discharge Data for Injury Surveillance” and in the National Public Health Surveillance System (NPHSS) indicators developed by the State and Territorial Injury Prevention Directors Association (STIPDA; now known as the Safe States Alliance) and the Council of State and Territorial Epidemiologists (CSTE). With partner feedback, CDC continuously modifies and updates the instructions and methodologies outlined in this document.
Changes for the 2010 data collection cycles include:
▪ Instructions are provided for dealing with the new external-cause-of-injury codes that capture status (E000) and activity (E001–E030) (pages 7 and 9).
▪ Clarification has been added on date of records to be included (pages 5, 6, and 8).
▪ Instructions have been added to EXCLUDE hospital admissions from the emergency department visit indicators (page 8).
▪ For the fatal traumatic brain injury indicator, instructions have been provided to limit these deaths to only cases with an injury underlying cause of death (V01–Y36, Y85–Y87, Y89, *U01–*U03) and a TBI code in one of the multiple cause of death fields (page 49).
▪ The Healthy People objectives were updated for the 2020 version.

State Injury Indicators: Instructions for Preparing 2010 Data | v
ABBREVIATIONS
BAC Blood alcohol concentration
BRFSS Behavioral Risk Factor Surveillance System
CDC Centers for Disease Control and Prevention
CSTE Council of State and Territorial Epidemiologists
FARS Fatality Analysis Reporting System
HDD Hospital discharge data
ICD-10 International Classification of Diseases– Tenth Revision
ICD-9-CM International Classification of Diseases– Ninth Revision– Clinical Modification
MVC Motor vehicle crash
NCCDPHP National Center for Chronic Disease Prevention and Health Promotion
NCHS National Center for Health Statistics
NCIPC National Center for Injury Prevention and Control
NHTSA National Highway Traffic Safety Administration
NPHSS National Public Health Surveillance System
OSELS Office of Surveillance, Epidemiology, and Laboratory Services
SAVIR Society for Advancement of Violence and Injury Research
STIPDA State and Territorial Injury Prevention Directors Association (currently Safe States Alliance)
TBI Traumatic brain injury
VA Veterans Affairs
WHO World Health Organization
WISQARS Web-based Injury Statistics Query and Reporting System
YRBS Youth Risk Behavior Survey


State Injury Indicators: Instructions for Preparing 2010 Data | vii
CONTENTS
Foreword and Updates . . . . . . . . . . . . . . . . . . . . . . . . . . . . . . . . . . . . . . . .ivAbbreviations . . . . . . . . . . . . . . . . . . . . . . . . . . . . . . . . . . . . . . . . . . . . . vIntroduction . . . . . . . . . . . . . . . . . . . . . . . . . . . . . . . . . . . . . . . . . . . . . . 1Background and Purpose . . . . . . . . . . . . . . . . . . . . . . . . . . . . . . . . . . . . . . 3Preparing the Data Sets . . . . . . . . . . . . . . . . . . . . . . . . . . . . . . . . . . . . . . . 5Additional Resources . . . . . . . . . . . . . . . . . . . . . . . . . . . . . . . . . . . . . . . 11Injury Indicators . . . . . . . . . . . . . . . . . . . . . . . . . . . . . . . . . . . . . . . . . . 13
All-Injury Indicator 1: Injury Fatalities . . . . . . . . . . . . . . . . . . . . . . . . . . . . . . . . . . . . .15
All-Injury Indicator 2: Hospitalizations for All Injuries . . . . . . . . . . . . . . . . . . . . . . . . . . . . .16
All-Injury Indicator 3: Emergency Department Visits for All Injuries . . . . . . . . . . . . . . . . . . . . . .17
Drowning Indicator 1: Unintentional Drowning Fatalities . . . . . . . . . . . . . . . . . . . . . . . . . . .18
Drowning Indicator 2: Drowning-Related Hospitalizations . . . . . . . . . . . . . . . . . . . . . . . . . .19
Drowning Indicator 3: Drowning-Related Emergency Department Visits . . . . . . . . . . . . . . . . . . .20
Fall Indicator 1: Unintentional Fall-Related Fatalities . . . . . . . . . . . . . . . . . . . . . . . . . . . . .21
Fall Indicator 2: Unintentional Fall-Related Hospitalizations . . . . . . . . . . . . . . . . . . . . . . . . .22
Fall Indicator 3: Unintentional Fall-Related Emergency Department Visits . . . . . . . . . . . . . . . . . .23
Fall Indicator 4: Hip Fracture Hospitalizations in Persons Aged 65 Years and Older . . . . . . . . . . . . .24
Fall Indicator 5: Hip Fracture Emergency Department Visits in Persons Aged 65 Years and Older . . . . .25
Fall Indicator 6: Falls in Adults Aged 45 Years or Older . . . . . . . . . . . . . . . . . . . . . . . . . . .26
Fall Indicator 7: Falls in Adults Aged 45 Years or Older that Caused an Injury . . . . . . . . . . . . . . . .27
Fire-Related Indicator 1: Unintentional Fire-Related Fatalities . . . . . . . . . . . . . . . . . . . . . . . .28
Fire-Related Indicator 2: Unintentional Fire-Related Hospitalizations. . . . . . . . . . . . . . . . . . . . .29
Fire-Related Indicator 3: Unintentional Fire-Related Emergency Department Visits . . . . . . . . . . . . .30
Firearm-Related Indicator 1: Firearm-Related Fatalities . . . . . . . . . . . . . . . . . . . . . . . . . . .31
Firearm-Related Indicator 2: Firearm-Related Hospitalizations . . . . . . . . . . . . . . . . . . . . . . . .32
Firearm-Related Indicator 3: Firearm-Related Emergency Department Visits . . . . . . . . . . . . . . . .33
Homicide/Assault Indicator 1: Homicides . . . . . . . . . . . . . . . . . . . . . . . . . . . . . . . . . . .34
Homicide/Assault Indicator 2: Assault-Related Hospitalizations . . . . . . . . . . . . . . . . . . . . . . .35
Homicide/Assault Indicator 3: Assault-Related Emergency Department Visits . . . . . . . . . . . . . . . .36
Motor Vehicle Indicator 1: Motor Vehicle Traffic Fatalities. . . . . . . . . . . . . . . . . . . . . . . . . . .37
Motor Vehicle Indicator 2: Motor Vehicle Traffic Hospitalizations . . . . . . . . . . . . . . . . . . . . . . .38
Motor Vehicle Indicator 3: Motor Vehicle Traffic Emergency Department Visits . . . . . . . . . . . . . . .39
Motor Vehicle Indicator 4: Seat Belt Use . . . . . . . . . . . . . . . . . . . . . . . . . . . . . . . . . . .40
Motor Vehicle Indicator 5: Drinking and Driving . . . . . . . . . . . . . . . . . . . . . . . . . . . . . . . .41
Motor Vehicle Indicator 6: Alcohol-Related Crash Deaths . . . . . . . . . . . . . . . . . . . . . . . . . .42
Poisoning Indicator 1: Poisoning Fatalities . . . . . . . . . . . . . . . . . . . . . . . . . . . . . . . . . .43
Poisoning Indicator 2: Poisoning Hospitalizations. . . . . . . . . . . . . . . . . . . . . . . . . . . . . . .44
Poisoning Indicator 3: Poisoning Emergency Department Visits . . . . . . . . . . . . . . . . . . . . . . .45
Suicide/Suicide Attempt Indicator 1: Suicides . . . . . . . . . . . . . . . . . . . . . . . . . . . . . . . . .46
Suicide/Suicide Attempt Indicator 2: Suicide Attempt Hospitalizations . . . . . . . . . . . . . . . . . . . .47
Suicide/Suicide Attempt Indicator 3: Suicide Attempt Emergency Department Visits . . . . . . . . . . . . .48
Traumatic Brain Injury Indicator 1: Traumatic Brain Injury Fatalities . . . . . . . . . . . . . . . . . . . . .49
Traumatic Brain Injury Indicator 2: Traumatic Brain Injury Hospitalizations . . . . . . . . . . . . . . . . . .50
Traumatic Brain Injury Indicator 3: Traumatic Brain Injury Emergency Department Visits . . . . . . . . . .51
Calculating and Submitting Rates . . . . . . . . . . . . . . . . . . . . . . . . . . . . . . . . . 53References . . . . . . . . . . . . . . . . . . . . . . . . . . . . . . . . . . . . . . . . . . . . . 55

State Injury Indicators: Instructions for Preparing 2010 Data | 1
What is an Injury Indicator?An injury indicator describes a health outcome of an injury, such as hospitalization or death, or a factor known to be associated with an injury, such as a risk or protective factor among a specified population.
INTRODUCTION
Injury surveillance is one of the most important and basic elements of injury prevention and control. It helps determine the magnitude of injury morbidity and mortality, the leading causes of injury, and the population groups and behaviors associated with the greatest risk of injury. Surveillance data are also fundamental to determining program and prevention priorities. Furthermore, these data are crucial for evaluating the effectiveness of program activities and for identifying problems that need further investigation.
Injury continues to be the leading cause of death and disability among children and young adults.1 In 2009, more than 177,000 people died from injuries in the U.S. Among them: 21% died from suicide; 19% died from motor-vehicle crashes; and 9% died from homicide.1 Additionally, in 2009, more than 29 million people were treated for injuries in U.S. emergency departments.1 The economic cost of injuries is also significant. The total cost of the 50 million medically treated injuries sustained in 2000 is estimated to be $406 billion in medical expenses and productivity losses.2
The mission of public health includes prevention, mitigation, assurance that the injured have access to treatment, and the reduction of injury-related disability and death.3 The scope of public health encompasses injuries involving any mechanism (e.g., firearm, motor vehicle, or burn) and includes both violence and unintentional injuries. An important part of the public health mission is to emphasize that injuries are preventable and to dispel the misconception that injuries are unavoidable.
Recognizing the need for more comprehensive injury surveillance data, the State and Territorial Injury Prevention Directors Association (STIPDA) produced Consensus Recommendations for Injury Surveillance in State Health Departments in 1999.4 These recommendations were developed by a working group representing STIPDA; the Council of State and Territorial Epidemiologists (CSTE); the Centers for Disease Control and Prevention (CDC) and its National Center for Injury Prevention and Control (NCIPC); the Society for Advancement of Violence and Injury Research (SAVIR); and individual state partners. While these recommendations were updated in 2007,5 they remain a foundational building block for injury surveillance.
The State Health Department Consensus Recommendations identifies specific injuries and injury risk factors to be placed under surveillance by all states and data sets to monitor these injuries and risk factors. The goal is to improve state-based injury surveillance to better support injury prevention programs and policies. By enhancing and standardizing injury surveillance at the state level, its integration with overall public health surveillance as part of the National Public Health Surveillance System (NPHSS) will be much easier.6 In tandem with the State Health Department Consensus Recommendations, CSTE and STIPDA developed injury indicators that were formally adopted for inclusion in NPHSS.7,8 The NPHSS injury indicators add to other indicators developed by CSTE for chronic diseases and other areas.7

2 | State Injury Indicators: Instructions for Preparing 2010 Data
The Consensus Recommendations for Using Hospital Discharge Data for Injury Surveillance, published in 2003, provides clear and specific recommendations about the evaluation and use of hospital discharge data.9 It presents important considerations for the evaluation of data quality and outlines the methodology for developing an injury hospitalization data set.
Collection and dissemination of injury indicators is built upon the foundation laid by the publication of these Safe States Alliance (formerly known as STIPDA) and CSTE documents.

State Injury Indicators: Instructions for Preparing 2010 Data | 3
BACKGROUND AND PURPOSE
This manual was created to guide states and U.S. territories in collecting, preparing, and submitting injury surveillance data. All states and U.S. territories are eligible to voluntarily submit data for this report.
Information obtained from participants will be reviewed and assembled for inclusion in the State Injury Indicators Report. This process provides state and U.S. territory injury programs with a standardized method for evaluating injury data and for producing an injury indicator data product that is comparable across states and U.S. territories.
This manual provides straightforward information to encourage participation of all states and U.S. territories regardless of their epidemiologic infrastructure and capabilities. Participation in this report should not be seen as limiting by states of higher capacity, but rather as a place of commonality and a starting point for developing more sophisticated analysis.
The process of preparing indicators is simplified in that it doesn’t include the merging and unduplicating of cases found in multiple data sets. It is important to keep in mind that the quality of the injury indicators is dependent on the completeness and accuracy of external-cause-of-injury coding found within individual state and U.S. territory data sets.
Centralized electronic vital statistics, hospital discharge, and emergency department data are used to calculate the indicators prepared and submitted by states and U.S. territories. Injuries resulting in or occurring from the following are currently included in the State Injury Indicators: all injury, drowning, fall-related injury, fire-related injury, firearm-related injury, homicide/assault, motor vehicle-related injury, poisoning, suicide/suicide attempt, and traumatic brain injury (TBI). Overlap exists among these indicators. For example, a firearm-related homicide would be included in both the firearm-related death indicator and the homicide indicator.

State Injury Indicators: Instructions for Preparing 2010 Data | 5
PREPARING THE DATA SETS
Background on State Vital Records
Death registration is the responsibility of individual states. The funeral director and the physician who certify the cause of death are usually responsible for the personal and medical information recorded on the death certificate. The cause-of-death section on the certificate is generally the same in all states and is organized according to World Health Organization (WHO) guidelines and coded with ICD-10.10 Local registrars assure that deaths in their jurisdictions are registered and that required information is on death certificates before submitting to the state registrar. State registrars number and file the death certificates; certificates of nonresidents are sent to their states of residence. All states send death certificate data to the National Vital Statistics System, managed by CDC’s National Center for Health Statistics (NCHS).11
Data are limited to information reported on death certificates. The degree of detail in reporting varies among jurisdictions. In general, death certificate data provide limited information about circumstances of injury incidents or contributing factors. The number and type of cause-of-death fields to which states have access also vary, and deaths associated with some injuries, especially suicide, may be underreported. States without access to multiple contributing cause-of-death fields cannot calculate fatality rates for TBI because the diagnostic codes that make up that case definition reside in the contributing cause-of-death fields.
Instructions for Using Vital Statistics Data
Vital statistics data do not require specific preparation for analysis. Include all records with a date of death between January 1, 2010 and December 31, 2010. With the exception of the fatal TBI indicator, all fatal indicators should be calculated by searching the underlying-cause-of-death field only. For the fatal TBI indicator, first limit the dataset to only deaths with an injury underlying cause of death (V01–Y36, Y85–Y87, Y89, *U01–*U03), and then search all fields in the multiple cause of death file. Specific code ranges are identified in the individual indicator pages (see pages 15–51).
Background on State Hospital Discharge Data
At least 90% of all states maintain electronic databases of hospital discharge records for nonfederal, acute care hospitals located within their borders.12 The information collected varies from state to state. Many states use the standard uniform billing form (UB-04) as the basis for their hospital discharge database. Others use only a subset of variables from the UB-04 for their databases, and a few collect additional variables.
The UB-04, developed by the National Uniform Billing Committee, includes the following data elements:13
▪ patient’s age,
▪ sex,
▪ zip code,
▪ admission date,
▪ length of stay,
▪ total charges,
6 | State Injury Indicators: Instructions for Preparing 2010 Data
▪ principal diagnosis, and
▪ up to seventeen additional diagnoses.
For diagnoses resulting from injuries, an external cause of injury is also coded. External-cause-of-injury codes, listed in ICD-9-CM, describe several aspects of an injury: intentionality; mechanism; location of occurrence; external cause status (e.g., civilian activity done for pay, military activity); and activity.14 Completeness of external-cause-of-injury coding varies by state.
Instructions for Creating and Using the Injury Hospitalizations Subset of a State Hospital Discharge Data Set
To calculate Injury Hospitalization Indicators, first you need to create an injury subset of hospital discharge records. Create this subset using the following specifications:
▪ Include only nonfederal, acute care, or inpatient facilities in your hospital discharge data (HDD) injury subset. This excludes Veterans Affairs (VA) and other federal hospitals, rehabilitation centers, and psychiatric hospitals.
▪ Include readmissions, transfers, and deaths occurring in the hospital.
▪ Include hospitalizations of state residents only.
▪ If the data are available, out-of-state hospitalizations of state residents should be included.
▪ Include records that have a date of discharge between January 1, 2010 and December 31, 2010.
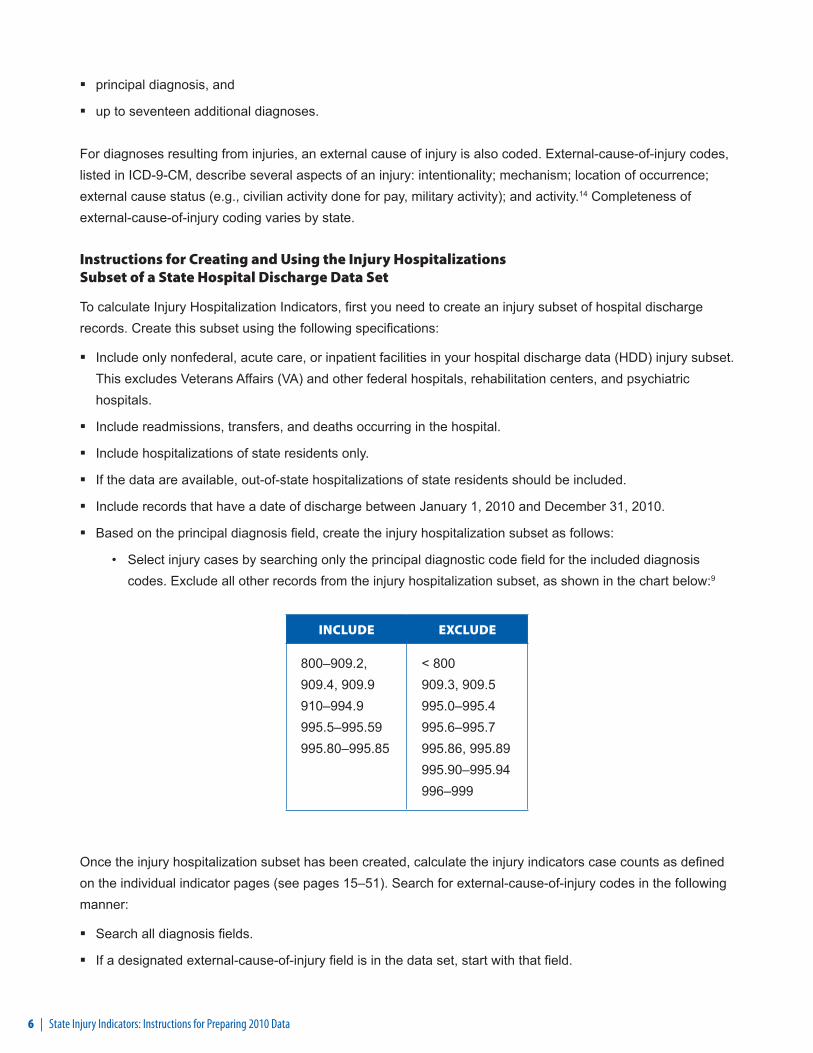
▪ Based on the principal diagnosis field, create the injury hospitalization subset as follows:
• Select injury cases by searching only the principal diagnostic code field for the included diagnosis codes. Exclude all other records from the injury hospitalization subset, as shown in the chart below:9
INCLUDE EXCLUDE
800–909.2, 909.4, 909.9 910–994.9 995.5–995.59 995.80–995.85
< 800 909.3, 909.5 995.0–995.4 995.6–995.7 995.86, 995.89 995.90–995.94 996–999
Once the injury hospitalization subset has been created, calculate the injury indicators case counts as defined on the individual indicator pages (see pages 15–51). Search for external-cause-of-injury codes in the following manner:
▪ Search all diagnosis fields.
▪ If a designated external-cause-of-injury field is in the data set, start with that field.

State Injury Indicators: Instructions for Preparing 2010 Data | 7
▪ Count the first-listed external-cause-of-injury code, unless it is E000-E030, E849, E967, E869.4, E870–E879, or E930–E949; in which case, search additional external-cause-of-injury fields and all diagnostic fields and use the next listed valid external-cause-of-injury code. If a case has multiple valid external-cause-of-injury codes, then only the first one should be used in the analysis. If no other external-cause-of-injury code is present, report E967, E869.4, E870-E879, or E930-E949, but not E000-E030 or E849.
▪ Hospitalizations (except for hip fracture hospitalizations in persons aged 65 years and older) should be age-adjusted to the 2000 standard using the NCHS population distribution (Table 1, page 54).
Assess the completeness and quality measures of the HDD for the following components:
▪ Percentage of HDD injury records with external-cause-of-injury coding (Figure 1, below).
▪ Completeness of hospitals participating in the HDD system.
▪ Inclusion of readmissions and transfers within the data set used for analysis.
▪ A subjective assessment by health department staff if a substantial proportion of state residents injured in-state are actually hospitalized in a neighboring state.
FIGURE 1
All Hospital Discharge
Records withInjury PrincipalDiagnosis and
AssociatedExternal-Cause-of-
Injury codePercentage ofHDD Injury
Hospitalizationswith External-
Cause-of-Injury Coding
Number of hospital discharge records identifi ed using the criteria in the previous table that have a valid external-cause-of-injury code other than E000-E030, E849, E967, E869.4, E870-E879, or E930-E949
Number of hospital discharge records identifi ed using the criteria in the previous chart
= ________ x 100
All HospitalDischarge
Records with an Injury Principal
Diagnosis
Background on State Emergency Department Data
The availability of statewide emergency department (ED) datasets is increasing. In 2009 about 45% of the states reported having access to ED data.15 Many of these datasets are standardized around administrative or billing data. Since many injuries are seen only in the emergency department this is a dataset of emerging importance for injury surveillance.
The Injury Surveillance Workgroup 5 convened by STIPDA recommended that the ICD-9-CM code-based definition to be used with administrative ED data to identify an injury visit be broadened from the definition that is used to identify cases from HDD. For ED data, the injury subset should include any initial visit where the first-
8 | State Injury Indicators: Instructions for Preparing 2010 Data
listed diagnosis reflects an injury based on the Barell matrix definition of an injury,16 regardless of any mention of an external-cause-of-injury code, or any initial visit with a valid external-cause-of-injury code based on the recommended framework for external causes of injury.17 Similar to the current HDD methodology, complications of care and adverse effects should be excluded from both the diagnosis and external-cause-of-injury codes. For the rationale behind this recommendation, please refer to pages 23–4 of the ISW5 Report.5
Instructions for Creating and Using the Injury Subset of a State Emergency Department Data Set
To calculate State Emergency Department Indicators, first you need to create an injury subset of emergency department records. The creation of this subset varies from the creation of the HD subset in that ED injury cases may be identified not only by an injury primary diagnosis code but also by the presence of a valid external-cause-of-injury code. Create the ED subset using the following specifications:
▪ Include only data from nonfederal, acute care-affiliated facilities in your ED injury subset. This excludes Veterans Affairs (VA) and other federal hospitals, rehabilitation centers, and psychiatric hospitals.
▪ Include ED visits for state residents only.
▪ If the data are available, out-of-state ED visits of state residents should be included.
▪ Include records that have a date of visit between January 1, 2010 and December 31, 2010.
▪ If necessary, exclude records of patients that are seen in the ED and then admitted to the hospital. For most states, these records are not included in their ED data.
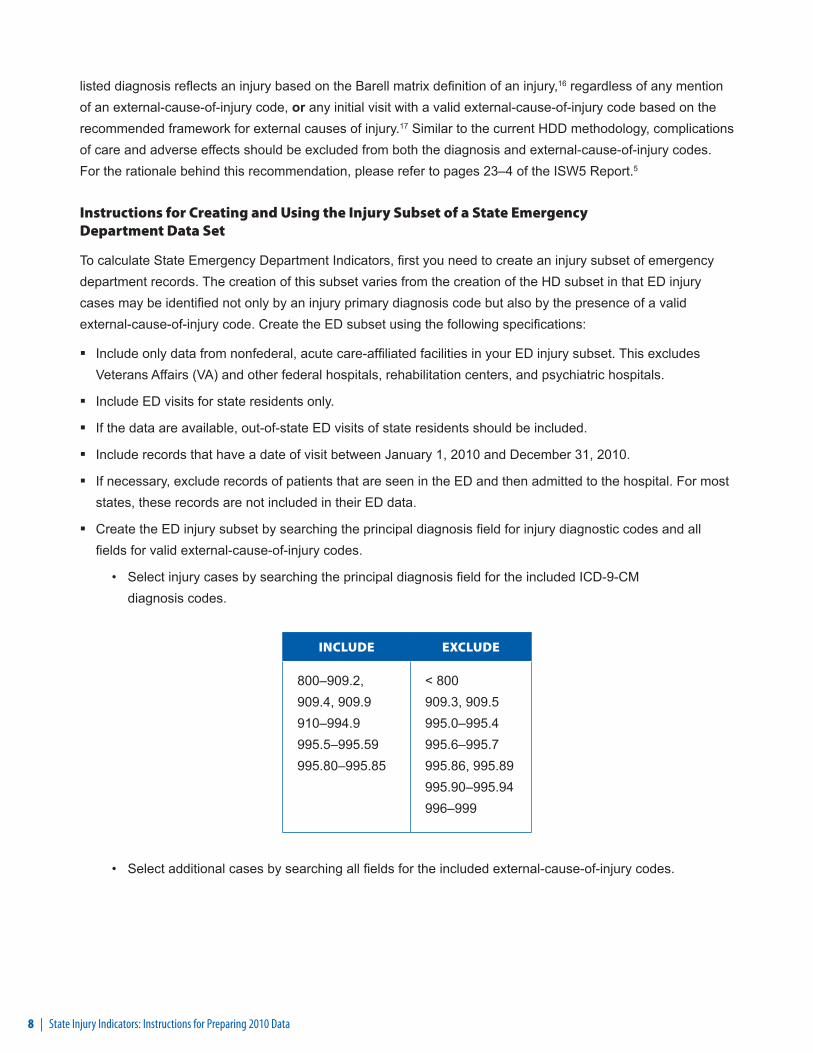
▪ Create the ED injury subset by searching the principal diagnosis field for injury diagnostic codes and all fields for valid external-cause-of-injury codes.
• Select injury cases by searching the principal diagnosis field for the included ICD-9-CM diagnosis codes.
INCLUDE EXCLUDE
800–909.2, 909.4, 909.9 910–994.9 995.5–995.59 995.80–995.85
< 800 909.3, 909.5 995.0–995.4 995.6–995.7 995.86, 995.89 995.90–995.94 996–999
• Select additional cases by searching all fields for the included external-cause-of-injury codes.

State Injury Indicators: Instructions for Preparing 2010 Data | 9
INCLUDE E-CODES
EXCLUDE E-CODES
E800-E869
E880-E929
E950-E999
E870-E879
E930-E949
• Exclude all other records from the injury ED subset.
Once the injury ED subset has been created, calculate the injury indicators case counts as defined on the individual indicator pages. Search for external-cause-of-injury codes in the following manner:
▪ Search all diagnosis fields.
▪ If a designated external-cause-of-injury field is in the data set, start with that field.
▪ Count the first-listed external-cause-of-injury code, unless it is E000-E030, E849, E967, E869.4, E870–E879, or E930–E949; in which case, search additional external-cause-of-injury fields and all diagnostic fields and use the next listed valid external-cause-of-injury code. If a case has multiple valid external-cause-of-injury codes, then only the first one should be used in the analysis. If no other external-cause-of-injury code is present, report E967, E869.4, E870-E879, or E930-E949, but not E000-E030 or E849.
▪ ED visits (except for hip fracture ED visits in persons aged 65 years and older) should be age-adjusted to the 2000 standard using the NCHS population distribution (Table 1, page 54).
Assess the completeness and quality measures of the ED data for the following components:
▪ Percentage of ED injury records with external-cause-of-injury coding (Figure 2, below).
▪ Completeness of hospitals participating in the ED system.
▪ Inclusion of follow up visits and transfers from other EDs
▪ A subjective assessment by health department staff if a substantial proportion of state residents injured in-state are actually treated in EDs in a neighboring state.
FIGURE 2
All ED Injury Visit Records with a Valid External-Cause-of-Injury code
Percentage of ED Injury Visits With External Cause Coding
Number of ED visit records identifi ed using the criteria in the previous tables that have a valid external-cause-of-injury code other than E000-E030, E849, E967, E869.4, E870-E879, or E930-E949
Number of ED visit records identifi ed using the criteria in the previous tables
= ________ x 100
All ED Records with an Injury Principal Diagnosis or a Valid Injury External-
Cause-of-Injury code

State Injury Indicators: Instructions for Preparing 2010 Data | 11
ADDITIONAL RESOURCES
Other Recommended Data Systems
Indicators based on the Behavioral Risk Factor Surveillance System (BRFSS), the Youth Risk Behavior Survey (YRBS), and the Fatality Analysis Reporting System (FARS) will be calculated at CDC. The data available from YRBS and BRFSS will be examined annually to determine which survey questions should be included.
Behavioral Risk Factor Surveillance System (BRFSS)
CDC’s Office of Surveillance, Epidemiology, and Laboratory Services (OSELS) currently manages the BRFSS. (It was previously housed in the National Center for Chronic Disease Prevention and Health Promotion.) This is a broad ongoing survey that is a state-based, random-digit-dialed telephone survey of the noninstitutionalized U.S. population over age 17. BRFSS monitors risk behaviors associated with the leading causes of disease, injury, and death.18
Because BRFSS is telephone-based, population subgroups less likely to have telephones, such as persons of low socioeconomic status, may be underrepresented. Also, in 2010, BRFSS did not include cell phones in their regular sample, therefore excluding cell phone only households. However, BRFSS appears to be moving towards the inclusion of cell phones as pilot studies have been conducted in most states and territories using cell phone only interviews.18 Additionally, data are self-reported and may be biased. For risk-reduction factors such as self-reported use or testing of smoke alarms, these data may not uniformly represent safe and effective use.18
Not all BRFSS questions are asked every year. Questions asked during the year for which a current Injury Indicator Report is being prepared will be reviewed and appropriate questions included in the report. Results will be reported as a percentage of respondents. For 2010, there are four injury-related BRFSS questions that will be reported.
Youth Risk Behavior Survey (YRBS)
The Youth Risk Behavior Survey (YRBS) is managed by the National Center for Chronic Disease Prevention and Health Promotion (NCCDPHP) at CDC. The YRBS monitors risk behaviors associated with the leading causes of injury and death among teenagers.19 State and local departments of education and health conduct the survey biennially in many locations throughout the country. The school-based survey is administered to 9th through 12th graders and the data is analyzed by CDC. YRBS data apply only to youth who attend school. The extent of underreporting or overreporting of behaviors cannot be determined, although the survey questions demonstrate good test–retest reliability. Interstate comparisons must be interpreted cautiously because the methods used to collect YRBS data may vary.19
In 2009, 42 states conducted YRBS with overall participation rates of at least 60%.20 CDC requires a minimum overall participation rate of 60% to generalize the results to the state’s population. States with YRBS data meeting this criterion will be included. Results will be reported as a percentage of respondents. No age adjustment will be applied. The YRBS was not administered in 2010.

12 | State Injury Indicators: Instructions for Preparing 2010 Data
Fatality Analysis Reporting System (FARS)
FARS, coordinated by the National Highway Traffic Safety Administration (NHTSA), contains data on all fatal traffic crashes that occur in the 50 states, the District of Columbia, and Puerto Rico. For inclusion in FARS, a crash must involve a motor vehicle traveling on a public roadway and result in the death of a person (either a vehicle occupant or a non-motorist) within 30 days of the crash. The FARS file contains a description of each fatal crash reported. More than 100 coded data elements characterize each crash, the vehicles, and the people involved.21
FARS does not include non-traffic crashes such as those occurring on driveways and other private property. It also does not include deaths occurring more than 30 days after the motor vehicle crash.21

INJURY INDICATORS
The following pages contain specific case definitions for each of the individual injury indicators. These case definitions should be applied when determining case counts. Once the case counts are determined, they should be entered into the provided spreadsheets for rate calculation and submission to CDC.


State Injury Indicators: Instructions for Preparing 2010 Data | 15
ALL-INJURY INDICATOR 1: Injury Fatalities
DEMOGRAPHIC GROUP All residents.
NUMERATOR Deaths with any of the following ICD-10 codes as an underlying cause of death.
Injury Fatality ICD-10 Codes
V01–Y36, Y85–Y87, Y89, *U01–*U03 Injury and poisoning
DENOMINATOR Midyear population for the calendar year under surveillance. To obtain population estimates by age and sex for your state, use U.S. Census Bureau population tables titled “State Single Year of Age and Sex Population Estimates: April 1, 2000 to July 1, 2010— RESIDENT” (see instructions on page 53).
MEASURES OF FREQUENCY
Annual number of deaths. Annual mortality rate— crude and age-adjusted (standardized by the direct method to the year 2000 standard U.S. population).22 Rates should be calculated for age and sex.
DATA RESOURCES Death certificate data from vital statistics agencies (numerator) and population estimates from the U.S. Census Bureau or suitable alternative (denominator).
PERIOD FOR CASE DEFINITION
Calendar year based on date of death.
BACKGROUND Injuries are the leading cause of death for people 1 to 44 years of age and the third leading cause of death overall.1 Over 177,000 people died from injuries in 2009.1
LIMITATIONS OF INDICATOR
Injuries severe enough to result in death represent only a small proportion of the overall burden of injury. An evaluation of only these injuries may not present an accurate picture of the causes of less-severe injuries.
LIMITATIONS OF DATA RESOURCES
The accuracy of indicators based on codes found in vital statistics data is limited by the completeness and quality of coding. The overall completeness of external cause coding on death data is uniformly high. Coding criteria specify that all cases of injury death must contain an injury code in the underlying-cause-of-death field.
HEALTHY PEOPLE 2020 OBJECTIVES
IVP-1.1: Reduce fatal injuries IVP-11: Reduce unintentional injury deaths
16 | State Injury Indicators: Instructions for Preparing 2010 Data
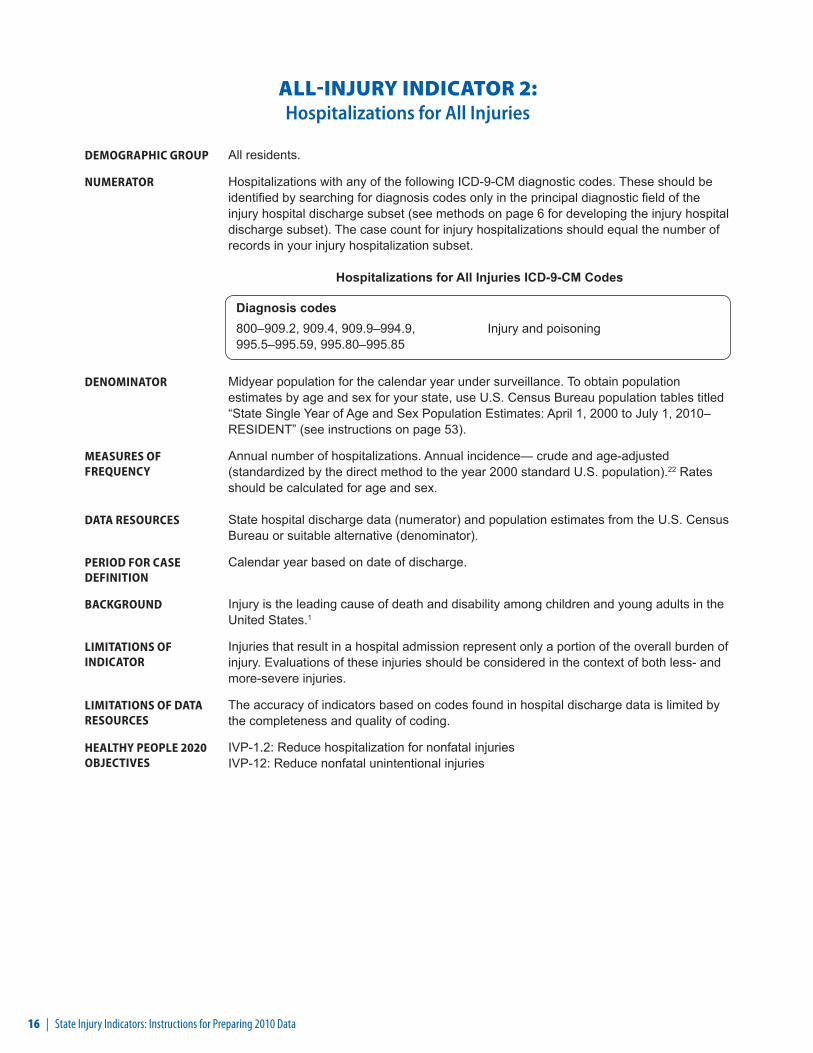
ALL-INJURY INDICATOR 2: Hospitalizations for All Injuries
DEMOGRAPHIC GROUP All residents.
NUMERATOR Hospitalizations with any of the following ICD-9-CM diagnostic codes. These should be identified by searching for diagnosis codes only in the principal diagnostic field of the injury hospital discharge subset (see methods on page 6 for developing the injury hospital discharge subset). The case count for injury hospitalizations should equal the number of records in your injury hospitalization subset.
Hospitalizations for All Injuries ICD-9-CM Codes
Diagnosis codes800–909.2, 909.4, 909.9–994.9, 995.5–995.59, 995.80–995.85
Injury and poisoning
DENOMINATOR Midyear population for the calendar year under surveillance. To obtain population estimates by age and sex for your state, use U.S. Census Bureau population tables titled “State Single Year of Age and Sex Population Estimates: April 1, 2000 to July 1, 2010– RESIDENT” (see instructions on page 53).
MEASURES OF FREQUENCY
Annual number of hospitalizations. Annual incidence— crude and age-adjusted (standardized by the direct method to the year 2000 standard U.S. population).22 Rates should be calculated for age and sex.
DATA RESOURCES State hospital discharge data (numerator) and population estimates from the U.S. Census Bureau or suitable alternative (denominator).
PERIOD FOR CASE DEFINITION
Calendar year based on date of discharge.
BACKGROUND Injury is the leading cause of death and disability among children and young adults in the United States.1
LIMITATIONS OF INDICATOR
Injuries that result in a hospital admission represent only a portion of the overall burden of injury. Evaluations of these injuries should be considered in the context of both less- and more-severe injuries.
LIMITATIONS OF DATA RESOURCES
The accuracy of indicators based on codes found in hospital discharge data is limited by the completeness and quality of coding.
HEALTHY PEOPLE 2020 OBJECTIVES
IVP-1.2: Reduce hospitalization for nonfatal injuries IVP-12: Reduce nonfatal unintentional injuries
State Injury Indicators: Instructions for Preparing 2010 Data | 17
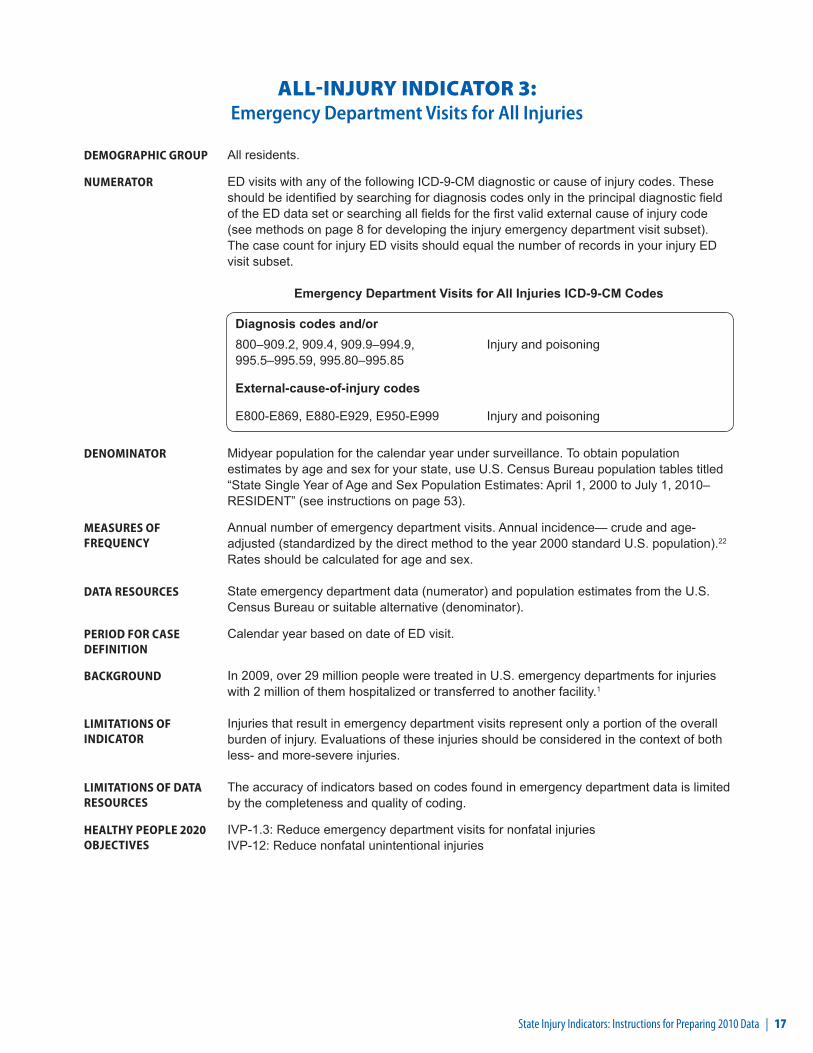
ALL-INJURY INDICATOR 3: Emergency Department Visits for All Injuries
DEMOGRAPHIC GROUP All residents.
NUMERATOR ED visits with any of the following ICD-9-CM diagnostic or cause of injury codes. These should be identified by searching for diagnosis codes only in the principal diagnostic field of the ED data set or searching all fields for the first valid external cause of injury code (see methods on page 8 for developing the injury emergency department visit subset). The case count for injury ED visits should equal the number of records in your injury ED visit subset.
Emergency Department Visits for All Injuries ICD-9-CM Codes
Diagnosis codes and/or800–909.2, 909.4, 909.9–994.9, 995.5–995.59, 995.80–995.85
Injury and poisoning
External-cause-of-injury codes
E800-E869, E880-E929, E950-E999 Injury and poisoning
DENOMINATOR Midyear population for the calendar year under surveillance. To obtain population estimates by age and sex for your state, use U.S. Census Bureau population tables titled “State Single Year of Age and Sex Population Estimates: April 1, 2000 to July 1, 2010– RESIDENT” (see instructions on page 53).
MEASURES OF FREQUENCY
Annual number of emergency department visits. Annual incidence— crude and age-adjusted (standardized by the direct method to the year 2000 standard U.S. population).22 Rates should be calculated for age and sex.
DATA RESOURCES State emergency department data (numerator) and population estimates from the U.S. Census Bureau or suitable alternative (denominator).
PERIOD FOR CASE DEFINITION
Calendar year based on date of ED visit.
BACKGROUND In 2009, over 29 million people were treated in U.S. emergency departments for injuries with 2 million of them hospitalized or transferred to another facility.1
LIMITATIONS OF INDICATOR
Injuries that result in emergency department visits represent only a portion of the overall burden of injury. Evaluations of these injuries should be considered in the context of both less- and more-severe injuries.
LIMITATIONS OF DATA RESOURCES
The accuracy of indicators based on codes found in emergency department data is limited by the completeness and quality of coding.
HEALTHY PEOPLE 2020 OBJECTIVES
IVP-1.3: Reduce emergency department visits for nonfatal injuries IVP-12: Reduce nonfatal unintentional injuries
18 | State Injury Indicators: Instructions for Preparing 2010 Data
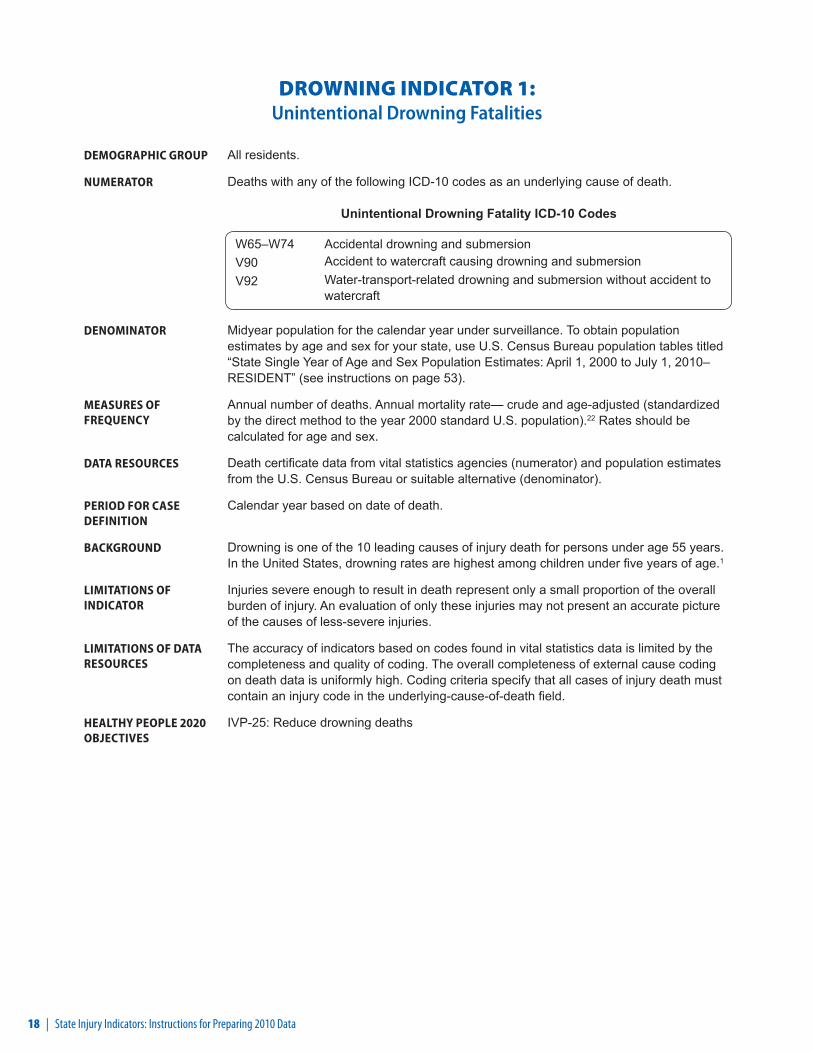
DROWNING INDICATOR 1: Unintentional Drowning Fatalities
DEMOGRAPHIC GROUP All residents.
NUMERATOR Deaths with any of the following ICD-10 codes as an underlying cause of death.
Unintentional Drowning Fatality ICD-10 Codes
W65–W74 Accidental drowning and submersion V90 Accident to watercraft causing drowning and submersionV92 Water-transport-related drowning and submersion without accident to
watercraft
DENOMINATOR Midyear population for the calendar year under surveillance. To obtain population estimates by age and sex for your state, use U.S. Census Bureau population tables titled “State Single Year of Age and Sex Population Estimates: April 1, 2000 to July 1, 2010– RESIDENT” (see instructions on page 53).
MEASURES OF FREQUENCY
Annual number of deaths. Annual mortality rate— crude and age-adjusted (standardized by the direct method to the year 2000 standard U.S. population).22 Rates should be calculated for age and sex.
DATA RESOURCES Death certificate data from vital statistics agencies (numerator) and population estimates from the U.S. Census Bureau or suitable alternative (denominator).
PERIOD FOR CASE DEFINITION
Calendar year based on date of death.
BACKGROUND Drowning is one of the 10 leading causes of injury death for persons under age 55 years. In the United States, drowning rates are highest among children under five years of age.1
LIMITATIONS OF INDICATOR
Injuries severe enough to result in death represent only a small proportion of the overall burden of injury. An evaluation of only these injuries may not present an accurate picture of the causes of less-severe injuries.
LIMITATIONS OF DATA RESOURCES
The accuracy of indicators based on codes found in vital statistics data is limited by the completeness and quality of coding. The overall completeness of external cause coding on death data is uniformly high. Coding criteria specify that all cases of injury death must contain an injury code in the underlying-cause-of-death field.
HEALTHY PEOPLE 2020 OBJECTIVES
IVP-25: Reduce drowning deaths
State Injury Indicators: Instructions for Preparing 2010 Data | 19
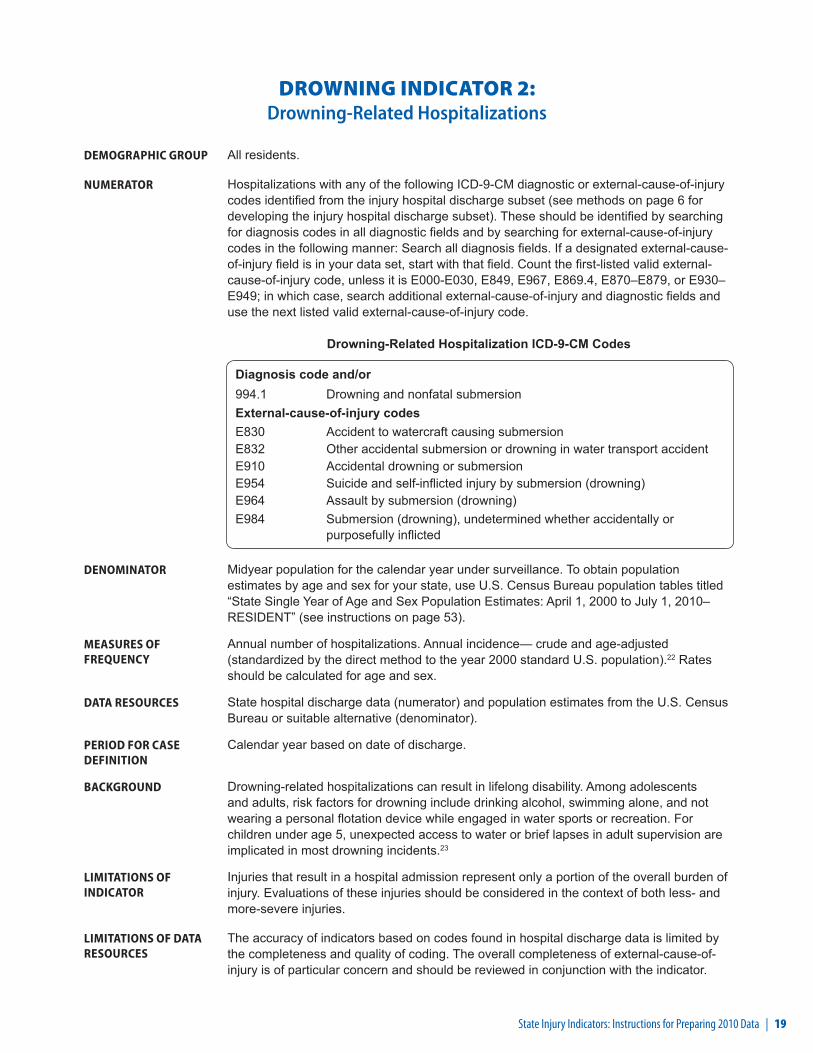
DROWNING INDICATOR 2: Drowning-Related Hospitalizations
DEMOGRAPHIC GROUP All residents.
NUMERATOR Hospitalizations with any of the following ICD-9-CM diagnostic or external-cause-of-injury codes identified from the injury hospital discharge subset (see methods on page 6 for developing the injury hospital discharge subset). These should be identified by searching for diagnosis codes in all diagnostic fields and by searching for external-cause-of-injury codes in the following manner: Search all diagnosis fields. If a designated external-cause-of-injury field is in your data set, start with that field. Count the first-listed valid external-cause-of-injury code, unless it is E000-E030, E849, E967, E869.4, E870–E879, or E930–E949; in which case, search additional external-cause-of-injury and diagnostic fields and use the next listed valid external-cause-of-injury code.
Drowning-Related Hospitalization ICD-9-CM Codes
Diagnosis code and/or994.1 Drowning and nonfatal submersionExternal-cause-of-injury codesE830 Accident to watercraft causing submersionE832 Other accidental submersion or drowning in water transport accidentE910 Accidental drowning or submersionE954 Suicide and self-inflicted injury by submersion (drowning)E964 Assault by submersion (drowning) E984 Submersion (drowning), undetermined whether accidentally or
purposefully inflicted
DENOMINATOR Midyear population for the calendar year under surveillance. To obtain population estimates by age and sex for your state, use U.S. Census Bureau population tables titled “State Single Year of Age and Sex Population Estimates: April 1, 2000 to July 1, 2010– RESIDENT” (see instructions on page 53).
MEASURES OF FREQUENCY
Annual number of hospitalizations. Annual incidence— crude and age-adjusted (standardized by the direct method to the year 2000 standard U.S. population).22 Rates should be calculated for age and sex.
DATA RESOURCES State hospital discharge data (numerator) and population estimates from the U.S. Census Bureau or suitable alternative (denominator).
PERIOD FOR CASE DEFINITION
Calendar year based on date of discharge.
BACKGROUND Drowning-related hospitalizations can result in lifelong disability. Among adolescents and adults, risk factors for drowning include drinking alcohol, swimming alone, and not wearing a personal flotation device while engaged in water sports or recreation. For children under age 5, unexpected access to water or brief lapses in adult supervision are implicated in most drowning incidents.23
LIMITATIONS OF INDICATOR
Injuries that result in a hospital admission represent only a portion of the overall burden of injury. Evaluations of these injuries should be considered in the context of both less- and more-severe injuries.
LIMITATIONS OF DATA RESOURCES
The accuracy of indicators based on codes found in hospital discharge data is limited by the completeness and quality of coding. The overall completeness of external-cause-of-injury is of particular concern and should be reviewed in conjunction with the indicator.

20 | State Injury Indicators: Instructions for Preparing 2010 Data
DROWNING INDICATOR 3: Drowning-Related Emergency Department Visits
DEMOGRAPHIC GROUP All residents.
NUMERATOR Emergency department visits with any of the following ICD-9-CM diagnostic or external-cause-of-injury codes identified from the injury emergency department visit subset (see methods on page 8 for developing the injury emergency department visit subset). These should be identified by searching for diagnosis codes in all diagnostic fields and by searching for external-cause-of-injury codes in the following manner: Search all diagnosis fields. If a designated external-cause-of-injury field is in your data set, start with that field. Count the first-listed valid external-cause-of-injury code, unless it is E000-E030, E849, E967, E869.4, E870–E879, or E930–E949; in which case, search additional external-cause-of-injury and diagnostic fields and use the next listed valid external-cause-of-injury code.
Drowning-Related Emergency Department Visit ICD-9-CM Codes
Diagnosis code and/or994.1 Drowning and nonfatal submersion External-cause-of-injury codesE830 Accident to watercraft causing submersionE832 Other accidental submersion or drowning in water transport accidentE910 Accidental drowning or submersionE954 Suicide and self-inflicted injury by submersion (drowning)E964 Assault by submersion (drowning) E984 Submersion (drowning), undetermined whether accidentally or
purposefully inflicted
DENOMINATOR Midyear population for the calendar year under surveillance. To obtain population estimates by age and sex for your state, use U.S. Census Bureau population tables titled “State Single Year of Age and Sex Population Estimates: April 1, 2000 to July 1, 2010– RESIDENT” (see instructions on page 53).
MEASURES OF FREQUENCY
Annual number of emergency department visits. Annual incidence— crude and age-adjusted (standardized by the direct method to the year 2000 standard U.S. population).22 Rates should be calculated for age and sex.
DATA RESOURCES State emergency department data (numerator) and population estimates from the U.S. Census Bureau or suitable alternative (denominator).
PERIOD FOR CASE DEFINITION
Calendar year based on date of ED visit.
BACKGROUND In 2009, there were an estimated 6,200 emergency department visits for unintentional nonfatal drowning-related injuries1
LIMITATIONS OF INDICATOR
Injuries that result in emergency department visits represent only a portion of the overall burden of injury. Evaluations of these injuries should be considered in the context of both less- and more-severe injuries.
LIMITATIONS OF DATA RESOURCES
The accuracy of indicators based on codes found in emergency department data is limited by the completeness and quality of coding. The overall completeness of external-cause-of-injury coding is of particular concern and should be reviewed in conjunction with the indicator.
State Injury Indicators: Instructions for Preparing 2010 Data | 21
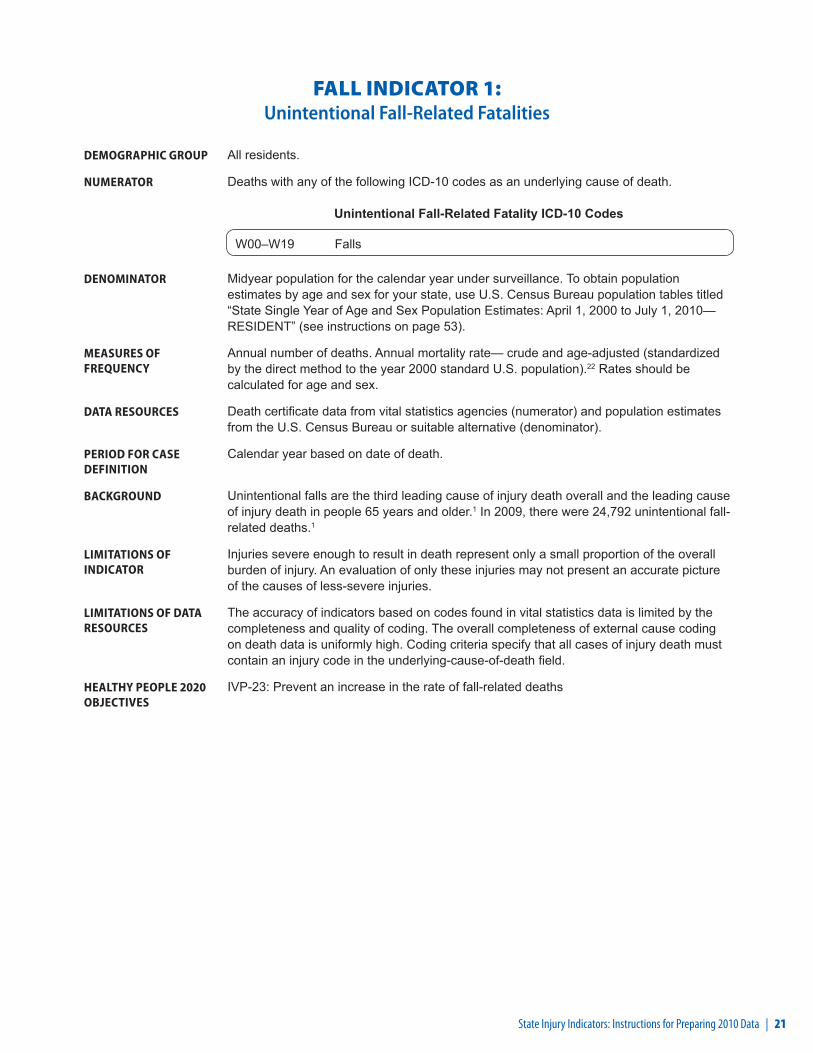
FALL INDICATOR 1: Unintentional Fall-Related Fatalities
DEMOGRAPHIC GROUP All residents.
NUMERATOR Deaths with any of the following ICD-10 codes as an underlying cause of death.
Unintentional Fall-Related Fatality ICD-10 Codes
W00–W19 Falls
DENOMINATOR Midyear population for the calendar year under surveillance. To obtain population estimates by age and sex for your state, use U.S. Census Bureau population tables titled “State Single Year of Age and Sex Population Estimates: April 1, 2000 to July 1, 2010— RESIDENT” (see instructions on page 53).
MEASURES OF FREQUENCY
Annual number of deaths. Annual mortality rate— crude and age-adjusted (standardized by the direct method to the year 2000 standard U.S. population).22 Rates should be calculated for age and sex.
DATA RESOURCES Death certificate data from vital statistics agencies (numerator) and population estimates from the U.S. Census Bureau or suitable alternative (denominator).
PERIOD FOR CASE DEFINITION
Calendar year based on date of death.
BACKGROUND Unintentional falls are the third leading cause of injury death overall and the leading cause of injury death in people 65 years and older.1 In 2009, there were 24,792 unintentional fall-related deaths.1
LIMITATIONS OF INDICATOR
Injuries severe enough to result in death represent only a small proportion of the overall burden of injury. An evaluation of only these injuries may not present an accurate picture of the causes of less-severe injuries.
LIMITATIONS OF DATA RESOURCES
The accuracy of indicators based on codes found in vital statistics data is limited by the completeness and quality of coding. The overall completeness of external cause coding on death data is uniformly high. Coding criteria specify that all cases of injury death must contain an injury code in the underlying-cause-of-death field.
HEALTHY PEOPLE 2020 OBJECTIVES
IVP-23: Prevent an increase in the rate of fall-related deaths
22 | State Injury Indicators: Instructions for Preparing 2010 Data
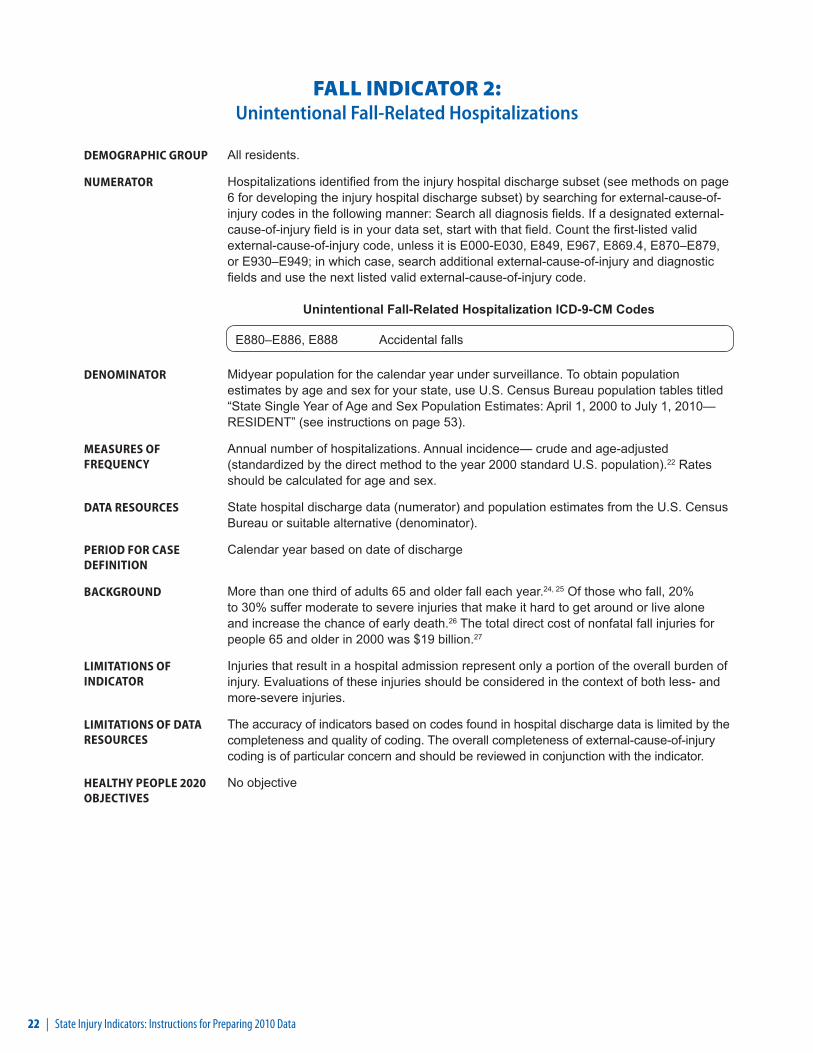
FALL INDICATOR 2: Unintentional Fall-Related Hospitalizations
DEMOGRAPHIC GROUP All residents.
NUMERATOR Hospitalizations identified from the injury hospital discharge subset (see methods on page 6 for developing the injury hospital discharge subset) by searching for external-cause-of-injury codes in the following manner: Search all diagnosis fields. If a designated external-cause-of-injury field is in your data set, start with that field. Count the first-listed valid external-cause-of-injury code, unless it is E000-E030, E849, E967, E869.4, E870–E879, or E930–E949; in which case, search additional external-cause-of-injury and diagnostic fields and use the next listed valid external-cause-of-injury code.
Unintentional Fall-Related Hospitalization ICD-9-CM Codes
E880–E886, E888 Accidental falls
DENOMINATOR Midyear population for the calendar year under surveillance. To obtain population estimates by age and sex for your state, use U.S. Census Bureau population tables titled “State Single Year of Age and Sex Population Estimates: April 1, 2000 to July 1, 2010— RESIDENT” (see instructions on page 53).
MEASURES OF FREQUENCY
Annual number of hospitalizations. Annual incidence— crude and age-adjusted (standardized by the direct method to the year 2000 standard U.S. population).22 Rates should be calculated for age and sex.
DATA RESOURCES State hospital discharge data (numerator) and population estimates from the U.S. Census Bureau or suitable alternative (denominator).
PERIOD FOR CASE DEFINITION
Calendar year based on date of discharge
BACKGROUND More than one third of adults 65 and older fall each year.24, 25 Of those who fall, 20% to 30% suffer moderate to severe injuries that make it hard to get around or live alone and increase the chance of early death.26 The total direct cost of nonfatal fall injuries for people 65 and older in 2000 was $19 billion.27
LIMITATIONS OF INDICATOR
Injuries that result in a hospital admission represent only a portion of the overall burden of injury. Evaluations of these injuries should be considered in the context of both less- and more-severe injuries.
LIMITATIONS OF DATA RESOURCES
The accuracy of indicators based on codes found in hospital discharge data is limited by the completeness and quality of coding. The overall completeness of external-cause-of-injury coding is of particular concern and should be reviewed in conjunction with the indicator.
HEALTHY PEOPLE 2020 OBJECTIVES
No objective
State Injury Indicators: Instructions for Preparing 2010 Data | 23
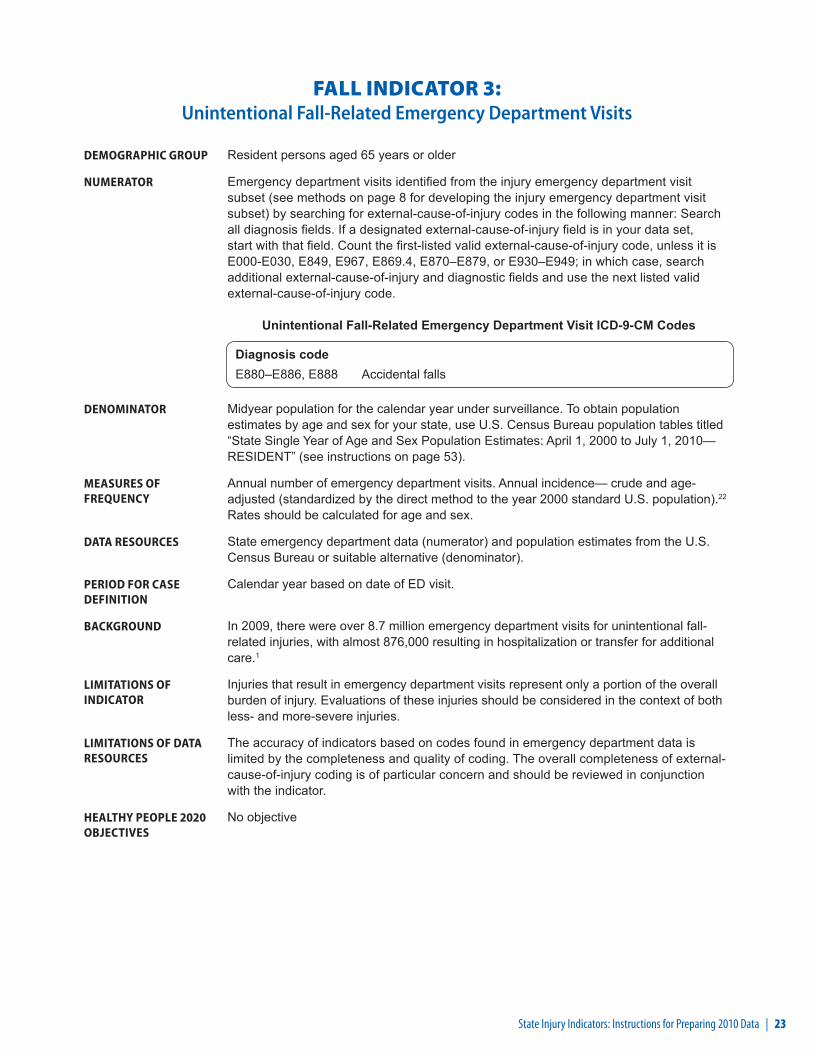
FALL INDICATOR 3: Unintentional Fall-Related Emergency Department Visits
DEMOGRAPHIC GROUP Resident persons aged 65 years or older
NUMERATOR Emergency department visits identified from the injury emergency department visit subset (see methods on page 8 for developing the injury emergency department visit subset) by searching for external-cause-of-injury codes in the following manner: Search all diagnosis fields. If a designated external-cause-of-injury field is in your data set, start with that field. Count the first-listed valid external-cause-of-injury code, unless it is E000-E030, E849, E967, E869.4, E870–E879, or E930–E949; in which case, search additional external-cause-of-injury and diagnostic fields and use the next listed valid external-cause-of-injury code.
Unintentional Fall-Related Emergency Department Visit ICD-9-CM Codes
Diagnosis code E880–E886, E888 Accidental falls
DENOMINATOR Midyear population for the calendar year under surveillance. To obtain population estimates by age and sex for your state, use U.S. Census Bureau population tables titled “State Single Year of Age and Sex Population Estimates: April 1, 2000 to July 1, 2010— RESIDENT” (see instructions on page 53).
MEASURES OF FREQUENCY
Annual number of emergency department visits. Annual incidence— crude and age-adjusted (standardized by the direct method to the year 2000 standard U.S. population).22 Rates should be calculated for age and sex.
DATA RESOURCES State emergency department data (numerator) and population estimates from the U.S. Census Bureau or suitable alternative (denominator).
PERIOD FOR CASE DEFINITION
Calendar year based on date of ED visit.
BACKGROUND In 2009, there were over 8.7 million emergency department visits for unintentional fall-related injuries, with almost 876,000 resulting in hospitalization or transfer for additional care.1
LIMITATIONS OF INDICATOR
Injuries that result in emergency department visits represent only a portion of the overall burden of injury. Evaluations of these injuries should be considered in the context of both less- and more-severe injuries.
LIMITATIONS OF DATA RESOURCES
The accuracy of indicators based on codes found in emergency department data is limited by the completeness and quality of coding. The overall completeness of external-cause-of-injury coding is of particular concern and should be reviewed in conjunction with the indicator.
HEALTHY PEOPLE 2020 OBJECTIVES
No objective
24 | State Injury Indicators: Instructions for Preparing 2010 Data
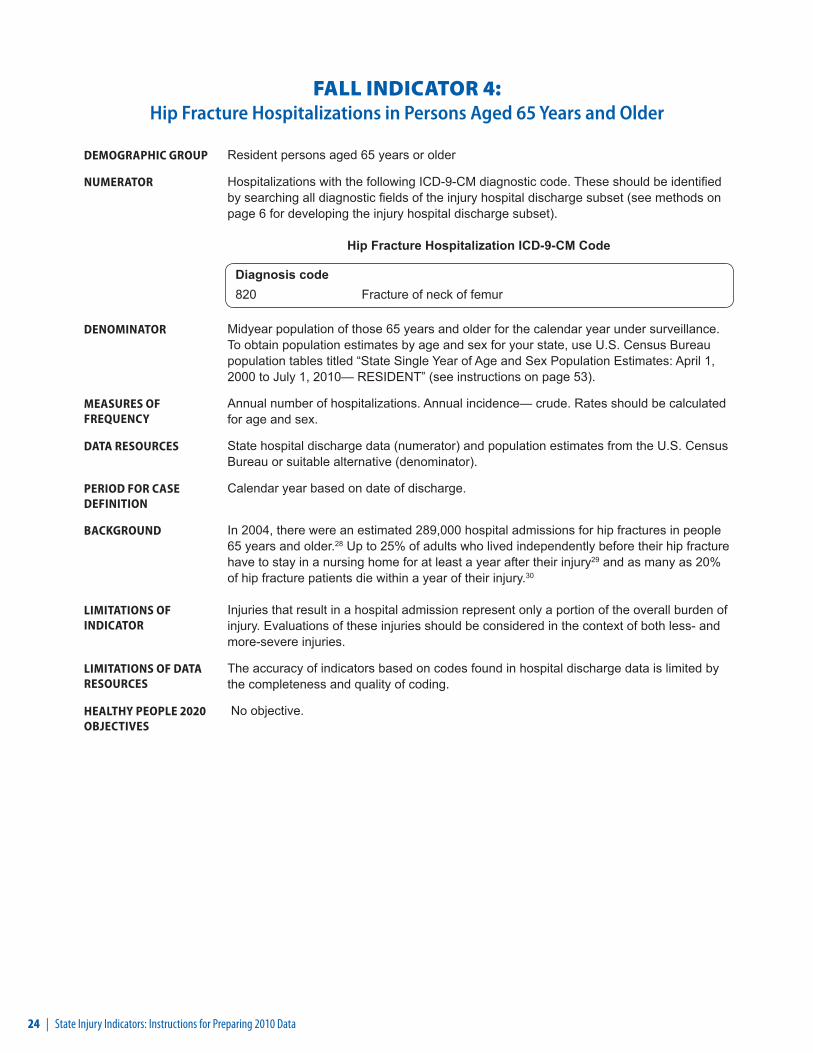
FALL INDICATOR 4: Hip Fracture Hospitalizations in Persons Aged 65 Years and Older
DEMOGRAPHIC GROUP Resident persons aged 65 years or older
NUMERATOR Hospitalizations with the following ICD-9-CM diagnostic code. These should be identified by searching all diagnostic fields of the injury hospital discharge subset (see methods on page 6 for developing the injury hospital discharge subset).
Hip Fracture Hospitalization ICD-9-CM Code
Diagnosis code 820 Fracture of neck of femur
DENOMINATOR Midyear population of those 65 years and older for the calendar year under surveillance. To obtain population estimates by age and sex for your state, use U.S. Census Bureau population tables titled “State Single Year of Age and Sex Population Estimates: April 1, 2000 to July 1, 2010— RESIDENT” (see instructions on page 53).
MEASURES OF FREQUENCY
Annual number of hospitalizations. Annual incidence— crude. Rates should be calculated for age and sex.
DATA RESOURCES State hospital discharge data (numerator) and population estimates from the U.S. Census Bureau or suitable alternative (denominator).
PERIOD FOR CASE DEFINITION
Calendar year based on date of discharge.
BACKGROUND In 2004, there were an estimated 289,000 hospital admissions for hip fractures in people 65 years and older.28 Up to 25% of adults who lived independently before their hip fracture have to stay in a nursing home for at least a year after their injury29 and as many as 20% of hip fracture patients die within a year of their injury.30
LIMITATIONS OF INDICATOR
Injuries that result in a hospital admission represent only a portion of the overall burden of injury. Evaluations of these injuries should be considered in the context of both less- and more-severe injuries.
LIMITATIONS OF DATA RESOURCES
The accuracy of indicators based on codes found in hospital discharge data is limited by the completeness and quality of coding.
HEALTHY PEOPLE 2020 OBJECTIVES
No objective.
State Injury Indicators: Instructions for Preparing 2010 Data | 25
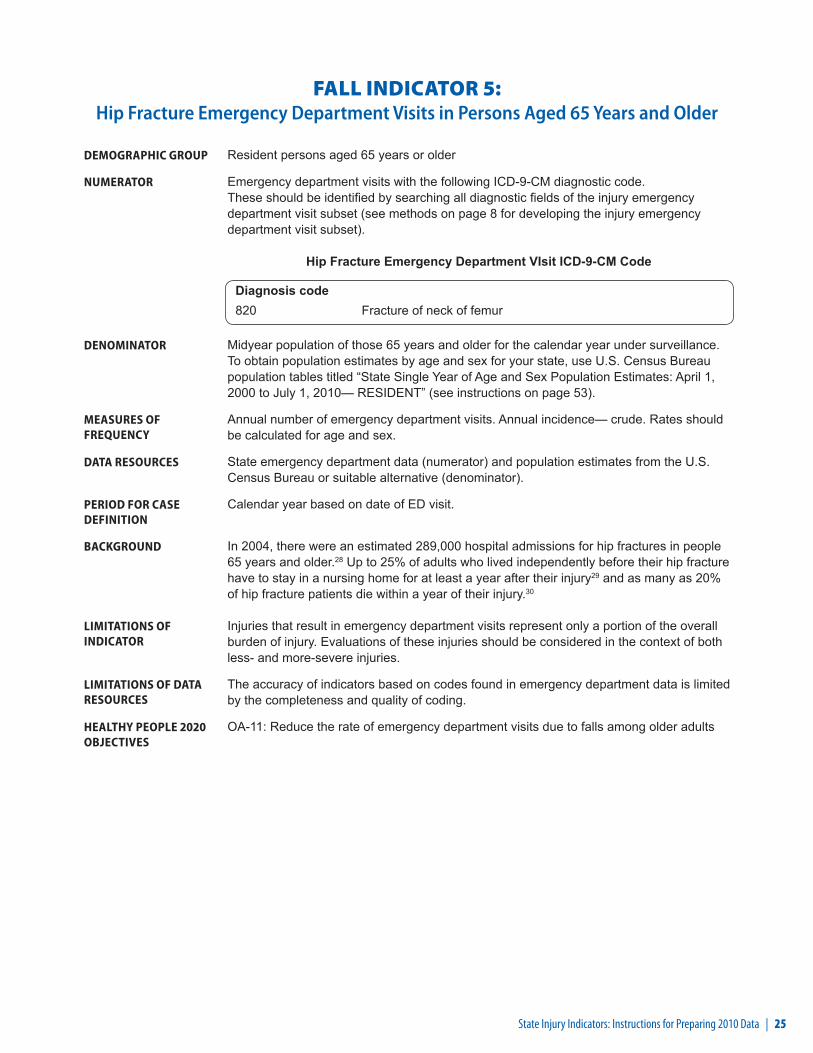
FALL INDICATOR 5: Hip Fracture Emergency Department Visits in Persons Aged 65 Years and Older
DEMOGRAPHIC GROUP Resident persons aged 65 years or older
NUMERATOR Emergency department visits with the following ICD-9-CM diagnostic code. These should be identified by searching all diagnostic fields of the injury emergency department visit subset (see methods on page 8 for developing the injury emergency department visit subset).
Hip Fracture Emergency Department VIsit ICD-9-CM Code
Diagnosis code 820 Fracture of neck of femur
DENOMINATOR Midyear population of those 65 years and older for the calendar year under surveillance. To obtain population estimates by age and sex for your state, use U.S. Census Bureau population tables titled “State Single Year of Age and Sex Population Estimates: April 1, 2000 to July 1, 2010— RESIDENT” (see instructions on page 53).
MEASURES OF FREQUENCY
Annual number of emergency department visits. Annual incidence— crude. Rates should be calculated for age and sex.
DATA RESOURCES State emergency department data (numerator) and population estimates from the U.S. Census Bureau or suitable alternative (denominator).
PERIOD FOR CASE DEFINITION
Calendar year based on date of ED visit.
BACKGROUND In 2004, there were an estimated 289,000 hospital admissions for hip fractures in people 65 years and older.28 Up to 25% of adults who lived independently before their hip fracture have to stay in a nursing home for at least a year after their injury29 and as many as 20% of hip fracture patients die within a year of their injury.30
LIMITATIONS OF INDICATOR
Injuries that result in emergency department visits represent only a portion of the overall burden of injury. Evaluations of these injuries should be considered in the context of both less- and more-severe injuries.
LIMITATIONS OF DATA RESOURCES
The accuracy of indicators based on codes found in emergency department data is limited by the completeness and quality of coding.
HEALTHY PEOPLE 2020 OBJECTIVES
OA-11: Reduce the rate of emergency department visits due to falls among older adults

26 | State Injury Indicators: Instructions for Preparing 2010 Data
FALL INDICATOR 6: Falls in Adults Aged 45 Years or Older
This indicator will be calculated at CDC.
DEMOGRAPHIC GROUP Resident persons aged 45 years or older.
NUMERATOR Those respondents who experienced a fall.
DENOMINATOR Respondents aged 45 years or older.
MEASURES OF FREQUENCY
Annual prevalence— crude.
DATA RESOURCES Data from the Behavioral Risk Factor Surveillance System (BRFSS).18
PERIOD FOR CASE DEFINITION
Past 3 months.
BACKGROUND More than one third of adults aged 65 years or older fall each year in the United States.24, 25 Many people who fall, even those who are not injured, develop a fear of falling. This fear may cause them to limit their activities, leading to reduced mobility and physical fitness and increasing their actual risk of falling.31
LIMITATIONS OF INDICATOR
Self-reported data only represent a small portion of the overall burden of injury. An evaluation of only these injuries may not present an accurate picture of all injuries.
LIMITATIONS OF DATA RESOURCES
As with all self-reported sample surveys, BRFSS data might be subject to systematic error resulting from noncoverage (e.g., lower telephone coverage among populations of low socioeconomic status), nonresponse (e.g., refusal to participate in the survey or to answer specific questions), or measurement (e.g., social desirability or recall bias).
HEALTHY PEOPLE 2020 OBJECTIVES
No objective
State Injury Indicators: Instructions for Preparing 2010 Data | 27
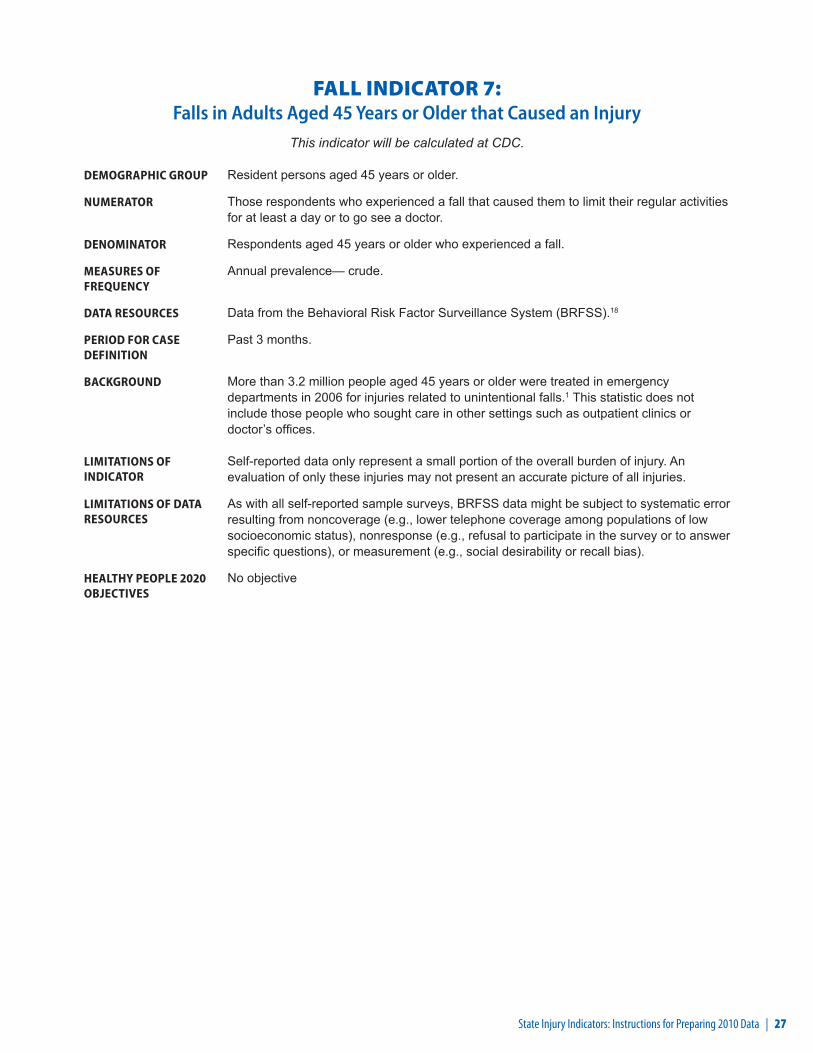
FALL INDICATOR 7: Falls in Adults Aged 45 Years or Older that Caused an Injury
This indicator will be calculated at CDC.
DEMOGRAPHIC GROUP Resident persons aged 45 years or older.
NUMERATOR Those respondents who experienced a fall that caused them to limit their regular activities for at least a day or to go see a doctor.
DENOMINATOR Respondents aged 45 years or older who experienced a fall.
MEASURES OF FREQUENCY
Annual prevalence— crude.
DATA RESOURCES Data from the Behavioral Risk Factor Surveillance System (BRFSS).18
PERIOD FOR CASE DEFINITION
Past 3 months.
BACKGROUND More than 3.2 million people aged 45 years or older were treated in emergency departments in 2006 for injuries related to unintentional falls.1 This statistic does not include those people who sought care in other settings such as outpatient clinics or doctor’s offices.
LIMITATIONS OF INDICATOR
Self-reported data only represent a small portion of the overall burden of injury. An evaluation of only these injuries may not present an accurate picture of all injuries.
LIMITATIONS OF DATA RESOURCES
As with all self-reported sample surveys, BRFSS data might be subject to systematic error resulting from noncoverage (e.g., lower telephone coverage among populations of low socioeconomic status), nonresponse (e.g., refusal to participate in the survey or to answer specific questions), or measurement (e.g., social desirability or recall bias).
HEALTHY PEOPLE 2020 OBJECTIVES
No objective
28 | State Injury Indicators: Instructions for Preparing 2010 Data
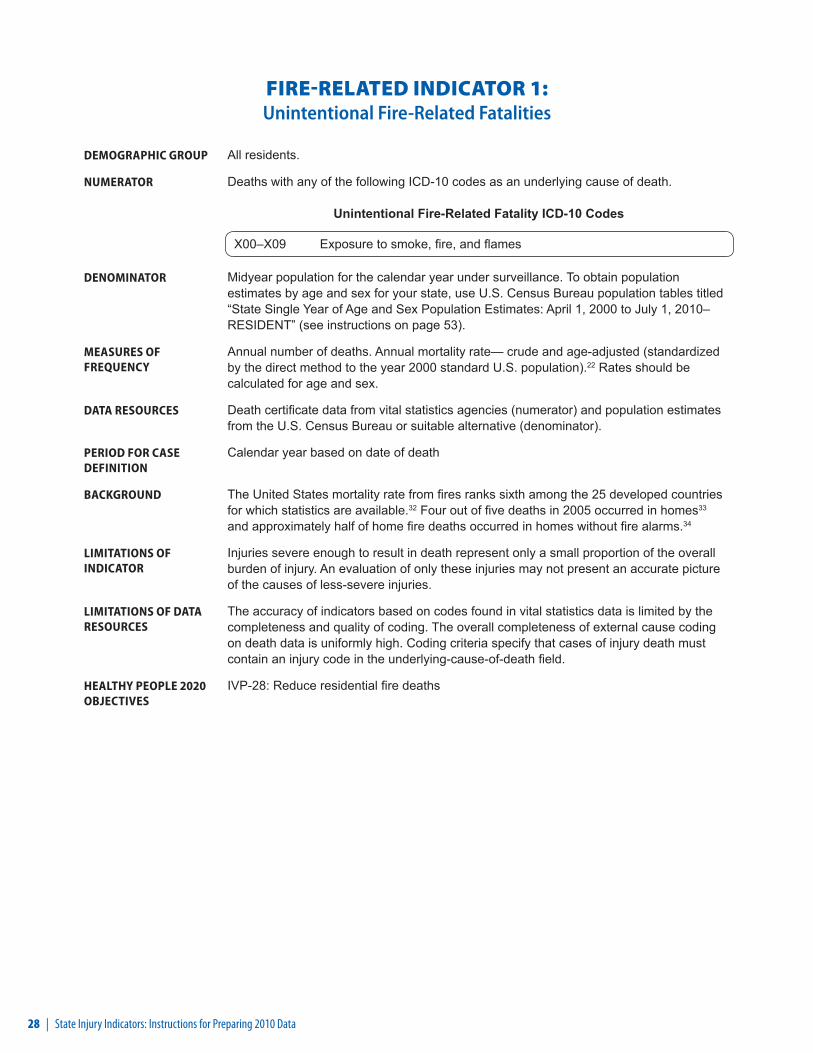
FIRE-RELATED INDICATOR 1: Unintentional Fire-Related Fatalities
DEMOGRAPHIC GROUP All residents.
NUMERATOR Deaths with any of the following ICD-10 codes as an underlying cause of death.
Unintentional Fire-Related Fatality ICD-10 Codes
X00–X09 Exposure to smoke, fire, and flames
DENOMINATOR Midyear population for the calendar year under surveillance. To obtain population estimates by age and sex for your state, use U.S. Census Bureau population tables titled “State Single Year of Age and Sex Population Estimates: April 1, 2000 to July 1, 2010– RESIDENT” (see instructions on page 53).
MEASURES OF FREQUENCY
Annual number of deaths. Annual mortality rate— crude and age-adjusted (standardized by the direct method to the year 2000 standard U.S. population).22 Rates should be calculated for age and sex.
DATA RESOURCES Death certificate data from vital statistics agencies (numerator) and population estimates from the U.S. Census Bureau or suitable alternative (denominator).
PERIOD FOR CASE DEFINITION
Calendar year based on date of death
BACKGROUND The United States mortality rate from fires ranks sixth among the 25 developed countries for which statistics are available.32 Four out of five deaths in 2005 occurred in homes33 and approximately half of home fire deaths occurred in homes without fire alarms.34
LIMITATIONS OF INDICATOR
Injuries severe enough to result in death represent only a small proportion of the overall burden of injury. An evaluation of only these injuries may not present an accurate picture of the causes of less-severe injuries.
LIMITATIONS OF DATA RESOURCES
The accuracy of indicators based on codes found in vital statistics data is limited by the completeness and quality of coding. The overall completeness of external cause coding on death data is uniformly high. Coding criteria specify that cases of injury death must contain an injury code in the underlying-cause-of-death field.
HEALTHY PEOPLE 2020 OBJECTIVES
IVP-28: Reduce residential fire deaths

State Injury Indicators: Instructions for Preparing 2010 Data | 29
FIRE-RELATED INDICATOR 2: Unintentional Fire-Related Hospitalizations
DEMOGRAPHIC GROUP All residents.
NUMERATOR Hospitalizations identified from the injury hospital discharge subset (see methods on page 6 for developing the injury hospital discharge subset) by searching for external-cause-of-injury codes in the following manner: Search all diagnosis fields. If a designated external-cause-of-injury field is in your data set, start with that field. Count the first-listed valid external-cause-of-injury code, unless it is E000-E030, E849, E967, E869.4, E870–E879, or E930–E949; in which case, search additional external-cause-of-injury and diagnostic fields and use the next listed valid external-cause-of-injury code.
Unintentional Fire-Related Hospitalization ICD-9-CM Codes
E890–E899 Accident caused by fire and flames
DENOMINATOR Midyear population for the calendar year under surveillance. To obtain population estimates by age and sex for your state, use U.S. Census Bureau population tables titled “State Single Year of Age and Sex Population Estimates: April 1, 2000 to July 1, 2010– RESIDENT” (see instructions on page 53).
MEASURES OF FREQUENCY
Annual number of hospitalizations. Annual incidence— crude and age-adjusted (standardized by the direct method to the year 2000 standard U.S. population).22 Rates should be calculated for age and sex.
DATA RESOURCES State hospital discharge data (numerator) and population estimates from the U.S. Census Bureau or suitable alternative (denominator).
PERIOD FOR CASE DEFINITION
Calendar year based on date of discharge.
BACKGROUND In 2005, fire departments responded to 396,000 home fires in the U.S., which claimed the lives of 3,030 people (not including firefighters) and injured another 13,825 (not including firefighters).33 Residential fires disproportionately affect young children, older adults, African Americans, and Native Americans.35 Working smoke alarms reduce the chance of dying in a house fire by 40% to 50%; however, about 25% of U.S. households lack working smoke alarms.36, 37
LIMITATIONS OF INDICATOR
Injuries that result in a hospital admission represent only a portion of the overall burden of injury. Evaluations of these injuries should be considered in the context of both less- and more-severe injuries.
LIMITATIONS OF DATA RESOURCES
The accuracy of indicators based on codes found in hospital discharge data is limited by the completeness and quality of coding. The overall completeness of external-cause-of-injury coding is of particular concern and should be reviewed in conjunction with the indicator.
HEALTHY PEOPLE 2020 OBJECTIVES
No objective

30 | State Injury Indicators: Instructions for Preparing 2010 Data
FIRE-RELATED INDICATOR 3: Unintentional Fire-Related Emergency Department Visits
DEMOGRAPHIC GROUP All residents.
NUMERATOR Emergency department visits identified from the injury emergency department visit subset (see methods on page 8 for developing the injury emergency department visit subset) by searching for external-cause-of-injury codes in the following manner: Search all diagnosis fields. If a designated external-cause-of-injuryfield is in your data set, start with that field. Count the first-listed valid external-cause-of-injury code, unless it is E000-E030, E849, E967, E869.4, E870–E879, or E930–E949; in which case, search additional external-cause-of-injury and diagnostic fields and use the next listed valid external-cause-of-injury code.
Unintentional Fire-Related Emergency Department Visit ICD-9-CM Codes
E890–E899 Accident caused by fire and flames
DENOMINATOR Midyear population for the calendar year under surveillance. To obtain population estimates by age and sex for your state, use U.S. Census Bureau population tables titled “State Single Year of Age and Sex Population Estimates: April 1, 2000 to July 1, 2010– RESIDENT” (see instructions on page 53).
MEASURES OF FREQUENCY
Annual number of emergency department visits. Annual incidence— crude and age-adjusted (standardized by the direct method to the year 2000 standard U.S. population).22 Rates should be calculated for age and sex.
DATA RESOURCES State emergency department data (numerator) and population estimates from the U.S. Census Bureau or suitable alternative (denominator).
PERIOD FOR CASE DEFINITION
Calendar year based on date of ED visit.
BACKGROUND In 2009, there were over 371,000 emergency department visits for unintentional fire-related injuries, with 19,400 resulting in hospitalization or transfer for additional care1
LIMITATIONS OF INDICATOR
Injuries that result in emergency department visits represent only a portion of the overall burden of injury. Evaluations of these injuries should be considered in the context of both less- and more-severe injuries.
LIMITATIONS OF DATA RESOURCES
The accuracy of indicators based on codes found in emergency department data is limited by the completeness and quality of coding. The overall completeness of external-cause-of-injury coding is of particular concern and should be reviewed in conjunction with the indicator.
HEALTHY PEOPLE 2020 OBJECTIVES
No objective
State Injury Indicators: Instructions for Preparing 2010 Data | 31
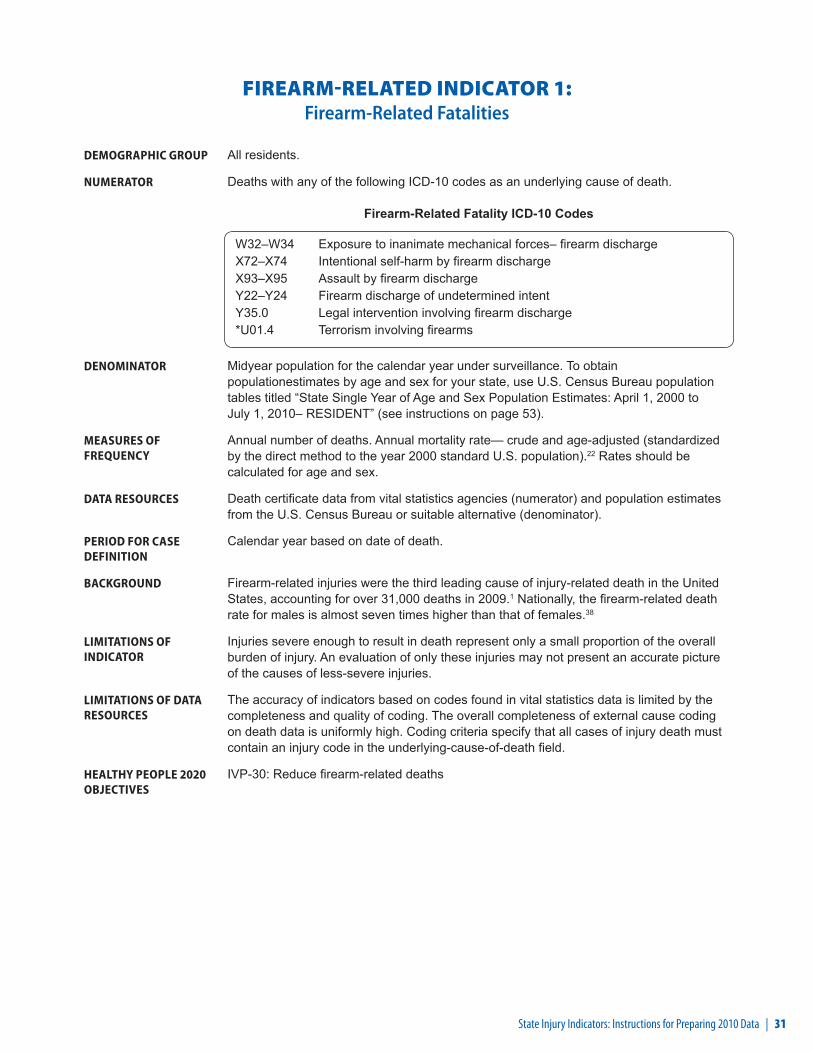
FIREARM-RELATED INDICATOR 1: Firearm-Related Fatalities
DEMOGRAPHIC GROUP All residents.
NUMERATOR Deaths with any of the following ICD-10 codes as an underlying cause of death.
Firearm-Related Fatality ICD-10 Codes
W32–W34 Exposure to inanimate mechanical forces– firearm dischargeX72–X74 Intentional self-harm by firearm dischargeX93–X95 Assault by firearm dischargeY22–Y24 Firearm discharge of undetermined intentY35.0 Legal intervention involving firearm discharge*U01.4 Terrorism involving firearms
DENOMINATOR Midyear population for the calendar year under surveillance. To obtain populationestimates by age and sex for your state, use U.S. Census Bureau population tables titled “State Single Year of Age and Sex Population Estimates: April 1, 2000 to July 1, 2010– RESIDENT” (see instructions on page 53).
MEASURES OF FREQUENCY
Annual number of deaths. Annual mortality rate— crude and age-adjusted (standardized by the direct method to the year 2000 standard U.S. population).22 Rates should be calculated for age and sex.
DATA RESOURCES Death certificate data from vital statistics agencies (numerator) and population estimates from the U.S. Census Bureau or suitable alternative (denominator).
PERIOD FOR CASE DEFINITION
Calendar year based on date of death.
BACKGROUND Firearm-related injuries were the third leading cause of injury-related death in the United States, accounting for over 31,000 deaths in 2009.1 Nationally, the firearm-related death rate for males is almost seven times higher than that of females.38
LIMITATIONS OF INDICATOR
Injuries severe enough to result in death represent only a small proportion of the overall burden of injury. An evaluation of only these injuries may not present an accurate picture of the causes of less-severe injuries.
LIMITATIONS OF DATA RESOURCES
The accuracy of indicators based on codes found in vital statistics data is limited by the completeness and quality of coding. The overall completeness of external cause coding on death data is uniformly high. Coding criteria specify that all cases of injury death must contain an injury code in the underlying-cause-of-death field.
HEALTHY PEOPLE 2020 OBJECTIVES
IVP-30: Reduce firearm-related deaths

32 | State Injury Indicators: Instructions for Preparing 2010 Data
FIREARM-RELATED INDICATOR 2: Firearm-Related Hospitalizations
DEMOGRAPHIC GROUP All residents.
NUMERATOR Hospitalizations identified from the injury hospital discharge subset (see methods on page 6 for developing the injury hospital discharge subset) by searching for external-cause-of-injury codes in the following manner: Search all diagnosis fields. If a designated external-cause-of-injury field is in your data set, start with that field. Count the first-listed valid external-cause-of-injury code, unless it is E000-E030, E849, E967, E869.4, E870–E879, or E930–E949, in which case, search additional external-cause-of-injury and diagnostic fields and use the next listed valid external-cause-of-injury code.
Firearm-Related Hospitalization ICD-9-CM Codes
E922.0–E922.3, E922.8, E922.9 Accident caused by firearm missile E955.0–E955.4 Suicide and self-inflicted injury by firearms E965.0–E965.4 Assault by firearms E985.0–E985.4 Injury by firearms, undetermined whether
accidentally, or purposely inflicted E970 Injury due to legal intervention by firearms E979.4 Terrorism involving firearms
DENOMINATOR Midyear population for the calendar year under surveillance. To obtain population estimates by age and sex for your state, use U.S. Census Bureau population tables titled “State Single Year of Age and Sex Population Estimates: April 1, 2000 to July 1, 2010– RESIDENT” (see instructions on page 53).
MEASURES OF FREQUENCY
Annual number of hospitalizations. Annual incidence rate— crude and age-adjusted (standardized by the direct method to the year 2000 standard U.S. population).22 Rates should be calculated for age and sex.
DATA RESOURCES State hospital discharge data (numerator) and population estimates from the U.S. Census Bureau or suitable alternative (denominator).
PERIOD FOR CASE DEFINITION
Calendar year based on date of discharge.
BACKGROUND Nonfatal firearm-related injury rates are highest among persons ages 15 to 24 years. About one fifth of nonfatal firearm-related injuries treated in U.S. hospital emergency departments are unintentional.38
LIMITATIONS OF INDICATOR
Injuries that result in a hospital admission represent only a portion of the overall burden of injury. Evaluations of these injuries should be considered in the context of both less- and more-severe injuries.
LIMITATIONS OF DATA RESOURCES
The accuracy of indicators based on codes found in hospital discharge data is limited by the completeness and quality of coding. The overall completeness of external-cause-of-injury coding is of particular concern and should be reviewed in conjunction with the indicator.
HEALTHY PEOPLE 2020 OBJECTIVES
IVP-31: Reduce nonfatal firearm-related injuries
State Injury Indicators: Instructions for Preparing 2010 Data | 33
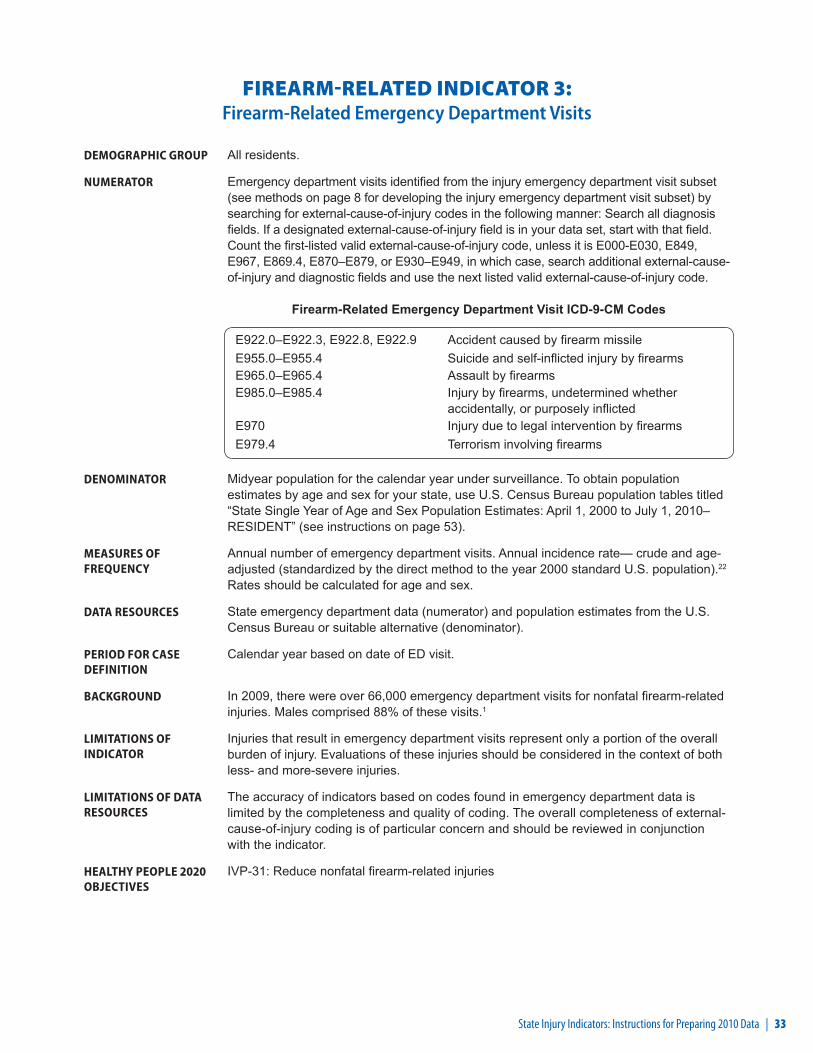
FIREARM-RELATED INDICATOR 3: Firearm-Related Emergency Department Visits
DEMOGRAPHIC GROUP All residents.
NUMERATOR Emergency department visits identified from the injury emergency department visit subset (see methods on page 8 for developing the injury emergency department visit subset) by searching for external-cause-of-injury codes in the following manner: Search all diagnosis fields. If a designated external-cause-of-injury field is in your data set, start with that field. Count the first-listed valid external-cause-of-injury code, unless it is E000-E030, E849, E967, E869.4, E870–E879, or E930–E949, in which case, search additional external-cause-of-injury and diagnostic fields and use the next listed valid external-cause-of-injury code.
Firearm-Related Emergency Department Visit ICD-9-CM Codes
E922.0–E922.3, E922.8, E922.9 Accident caused by firearm missile E955.0–E955.4 Suicide and self-inflicted injury by firearms E965.0–E965.4 Assault by firearms E985.0–E985.4 Injury by firearms, undetermined whether
accidentally, or purposely inflicted E970 Injury due to legal intervention by firearms E979.4 Terrorism involving firearms
DENOMINATOR Midyear population for the calendar year under surveillance. To obtain population estimates by age and sex for your state, use U.S. Census Bureau population tables titled “State Single Year of Age and Sex Population Estimates: April 1, 2000 to July 1, 2010– RESIDENT” (see instructions on page 53).
MEASURES OF FREQUENCY
Annual number of emergency department visits. Annual incidence rate— crude and age-adjusted (standardized by the direct method to the year 2000 standard U.S. population).22 Rates should be calculated for age and sex.
DATA RESOURCES State emergency department data (numerator) and population estimates from the U.S. Census Bureau or suitable alternative (denominator).
PERIOD FOR CASE DEFINITION
Calendar year based on date of ED visit.
BACKGROUND In 2009, there were over 66,000 emergency department visits for nonfatal firearm-related injuries. Males comprised 88% of these visits.1
LIMITATIONS OF INDICATOR
Injuries that result in emergency department visits represent only a portion of the overall burden of injury. Evaluations of these injuries should be considered in the context of both less- and more-severe injuries.
LIMITATIONS OF DATA RESOURCES
The accuracy of indicators based on codes found in emergency department data is limited by the completeness and quality of coding. The overall completeness of external-cause-of-injury coding is of particular concern and should be reviewed in conjunction with the indicator.
HEALTHY PEOPLE 2020 OBJECTIVES
IVP-31: Reduce nonfatal firearm-related injuries

34 | State Injury Indicators: Instructions for Preparing 2010 Data
HOMICIDE/ASSAULT INDICATOR 1: Homicides
DEMOGRAPHIC GROUP All residents.
NUMERATOR Deaths with any of the following ICD-10 codes as an underlying cause of death.
Homicide ICD-10 Codes
X85–Y09 AssaultY87.1 Sequelae of assault*U01 Terrorism-assault*U02 Sequelae of terrorism-assault
DENOMINATOR Midyear population for the calendar year under surveillance. To obtain population estimates by age and sex for your state, use U.S. Census Bureau population tables titled “State Single Year of Age and Sex Population Estimates: April 1, 2000 to July 1, 2010– RESIDENT” (see instructions on page 53).
MEASURES OF FREQUENCY
Annual number of deaths. Annual mortality rate— crude and age-adjusted (standardized by the direct method to the year 2000 standard U.S. population).22 Rates should be calculated for age and sex.
DATA RESOURCES Death certificate data from vital statistics agencies (numerator) and population estimates from the U.S. Census Bureau or suitable alternative (denominator).
PERIOD FOR CASE DEFINITION
Calendar year based on date of death.
BACKGROUND Homicide is the fifteenth leading cause of death in the United States; it is the second most common cause of death among persons ages 15 to 24 years.1
LIMITATIONS OF INDICATOR
Injuries severe enough to result in death represent only a small proportion of the overall burden of injury. An evaluation of only these injuries may not present an accurate picture of the causes of less-severe injuries.
LIMITATIONS OF DATA RESOURCES
The accuracy of indicators based on codes found in vital statistics data is limited by the completeness and quality of coding. The overall completeness of external cause coding on death data is uniformly high. Coding criteria specify that all cases of injury death must contain an injury code in the underlying-cause-of-death field.
HEALTHY PEOPLE 2020 OBJECTIVES
IVP-29: Reduce homicides

State Injury Indicators: Instructions for Preparing 2010 Data | 35
HOMICIDE/ASSAULT INDICATOR 2: Assault-Related Hospitalizations
DEMOGRAPHIC GROUP All residents.
NUMERATOR Hospitalizations identified from the injury hospital discharge subset (see methods on page 6 for developing the injury hospital discharge subset) by searching for external-cause-of-injury codes in the following manner: Search all diagnosis fields. If a designated external-cause-of-injury field is in your data set, start that field. Count the first-listed valid external-cause-of-injury code, unless it is E000-E030, E849, E967, E869.4, E870–E879, or E930–E949; in which case, search additional external-cause-of-injury and diagnostic fields and use the next listed valid external-cause-of-injury code.
Assault-Related Hospitalization ICD-9-CM Codes
E960–E969 Injury purposely inflicted by other persons E979 Terrorism E999.1 Late effect of injury due to terrorism
DENOMINATOR Midyear population for the calendar year under surveillance. To obtain population estimates by age and sex for your state, use U.S. Census Bureau population tables titled “State Single Year of Age and Sex Population Estimates: April 1, 2000 to July 1, 2010— RESIDENT” (see instructions on page 53).
MEASURES OF FREQUENCY
Annual number of persons hospitalized. Annual incidence— crude and age-adjusted (standardized by the direct method to the year 2000 standard U.S. population).16 Rates should be calculated for age and sex.
DATA RESOURCES State hospital discharge data (numerator) and population estimates from the U.S. Census Bureau or suitable alternative (denominator).
PERIOD FOR CASE DEFINITION
Calendar year based on date of discharge.
BACKGROUND In 2009, over 1.5 million people were treated in U.S. emergency departments for assault-related injuries with over 111,000 of them hospitalized or transferred for additional care.1
LIMITATIONS OF INDICATOR
Injuries that result in a hospital admission represent only a portion of the overall burden of injury. Evaluations of these injuries should be considered in the context of both less- and more-severe injuries.
LIMITATIONS OF DATA RESOURCES
The accuracy of indicators based on codes found in hospital discharge data is limited by the completeness and quality of coding. The overall completeness of external-cause-of-injury coding is of particular concern and should be reviewed in conjunction with the indicator.
HEALTHY PEOPLE 2020 OBJECTIVES
IVP-32: Reduce nonfatal physical assault injuries
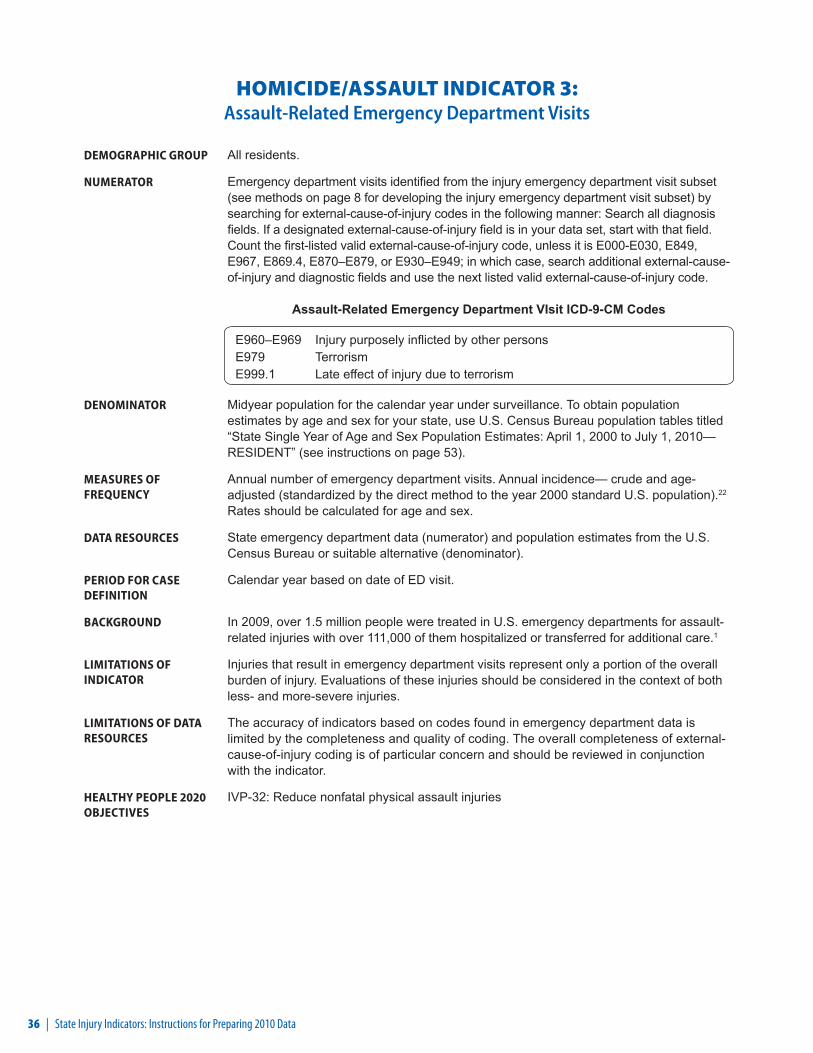
36 | State Injury Indicators: Instructions for Preparing 2010 Data
HOMICIDE/ASSAULT INDICATOR 3: Assault-Related Emergency Department Visits
DEMOGRAPHIC GROUP All residents.
NUMERATOR Emergency department visits identified from the injury emergency department visit subset (see methods on page 8 for developing the injury emergency department visit subset) by searching for external-cause-of-injury codes in the following manner: Search all diagnosis fields. If a designated external-cause-of-injury field is in your data set, start with that field. Count the first-listed valid external-cause-of-injury code, unless it is E000-E030, E849, E967, E869.4, E870–E879, or E930–E949; in which case, search additional external-cause-of-injury and diagnostic fields and use the next listed valid external-cause-of-injury code.
Assault-Related Emergency Department VIsit ICD-9-CM Codes
E960–E969 Injury purposely inflicted by other persons E979 Terrorism E999.1 Late effect of injury due to terrorism
DENOMINATOR Midyear population for the calendar year under surveillance. To obtain population estimates by age and sex for your state, use U.S. Census Bureau population tables titled “State Single Year of Age and Sex Population Estimates: April 1, 2000 to July 1, 2010— RESIDENT” (see instructions on page 53).
MEASURES OF FREQUENCY
Annual number of emergency department visits. Annual incidence— crude and age-adjusted (standardized by the direct method to the year 2000 standard U.S. population).22 Rates should be calculated for age and sex.
DATA RESOURCES State emergency department data (numerator) and population estimates from the U.S. Census Bureau or suitable alternative (denominator).
PERIOD FOR CASE DEFINITION
Calendar year based on date of ED visit.
BACKGROUND In 2009, over 1.5 million people were treated in U.S. emergency departments for assault-related injuries with over 111,000 of them hospitalized or transferred for additional care.1
LIMITATIONS OF INDICATOR
Injuries that result in emergency department visits represent only a portion of the overall burden of injury. Evaluations of these injuries should be considered in the context of both less- and more-severe injuries.
LIMITATIONS OF DATA RESOURCES
The accuracy of indicators based on codes found in emergency department data is limited by the completeness and quality of coding. The overall completeness of external-cause-of-injury coding is of particular concern and should be reviewed in conjunction with the indicator.
HEALTHY PEOPLE 2020 OBJECTIVES
IVP-32: Reduce nonfatal physical assault injuries
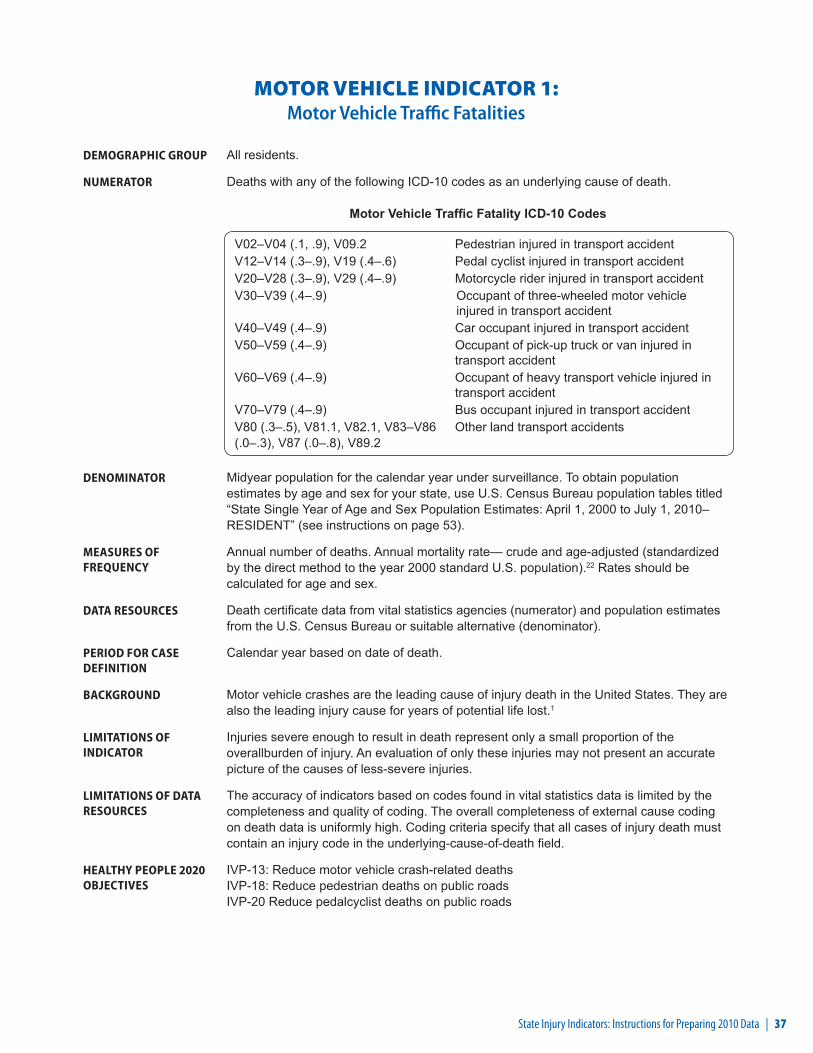
State Injury Indicators: Instructions for Preparing 2010 Data | 37
MOTOR VEHICLE INDICATOR 1: Motor Vehicle Traffic Fatalities
DEMOGRAPHIC GROUP All residents.
NUMERATOR Deaths with any of the following ICD-10 codes as an underlying cause of death.
Motor Vehicle Traffic Fatality ICD-10 Codes
V02–V04 (.1, .9), V09.2 Pedestrian injured in transport accidentV12–V14 (.3–.9), V19 (.4–.6) Pedal cyclist injured in transport accidentV20–V28 (.3–.9), V29 (.4–.9) Motorcycle rider injured in transport accidentV30–V39 (.4–.9) Occupant of three-wheeled motor vehicle
injured in transport accidentV40–V49 (.4–.9) Car occupant injured in transport accidentV50–V59 (.4–.9) Occupant of pick-up truck or van injured in
transport accidentV60–V69 (.4–.9) Occupant of heavy transport vehicle injured in
transport accidentV70–V79 (.4–.9) Bus occupant injured in transport accidentV80 (.3–.5), V81.1, V82.1, V83–V86 (.0–.3), V87 (.0–.8), V89.2
Other land transport accidents
DENOMINATOR Midyear population for the calendar year under surveillance. To obtain population estimates by age and sex for your state, use U.S. Census Bureau population tables titled “State Single Year of Age and Sex Population Estimates: April 1, 2000 to July 1, 2010– RESIDENT” (see instructions on page 53).
MEASURES OF FREQUENCY
Annual number of deaths. Annual mortality rate— crude and age-adjusted (standardized by the direct method to the year 2000 standard U.S. population).22 Rates should be calculated for age and sex.
DATA RESOURCES Death certificate data from vital statistics agencies (numerator) and population estimates from the U.S. Census Bureau or suitable alternative (denominator).
PERIOD FOR CASE DEFINITION
Calendar year based on date of death.
BACKGROUND Motor vehicle crashes are the leading cause of injury death in the United States. They are also the leading injury cause for years of potential life lost.1
LIMITATIONS OF INDICATOR
Injuries severe enough to result in death represent only a small proportion of the overallburden of injury. An evaluation of only these injuries may not present an accurate picture of the causes of less-severe injuries.
LIMITATIONS OF DATA RESOURCES
The accuracy of indicators based on codes found in vital statistics data is limited by the completeness and quality of coding. The overall completeness of external cause coding on death data is uniformly high. Coding criteria specify that all cases of injury death must contain an injury code in the underlying-cause-of-death field.
HEALTHY PEOPLE 2020 OBJECTIVES
IVP-13: Reduce motor vehicle crash-related deaths IVP-18: Reduce pedestrian deaths on public roads IVP-20 Reduce pedalcyclist deaths on public roads
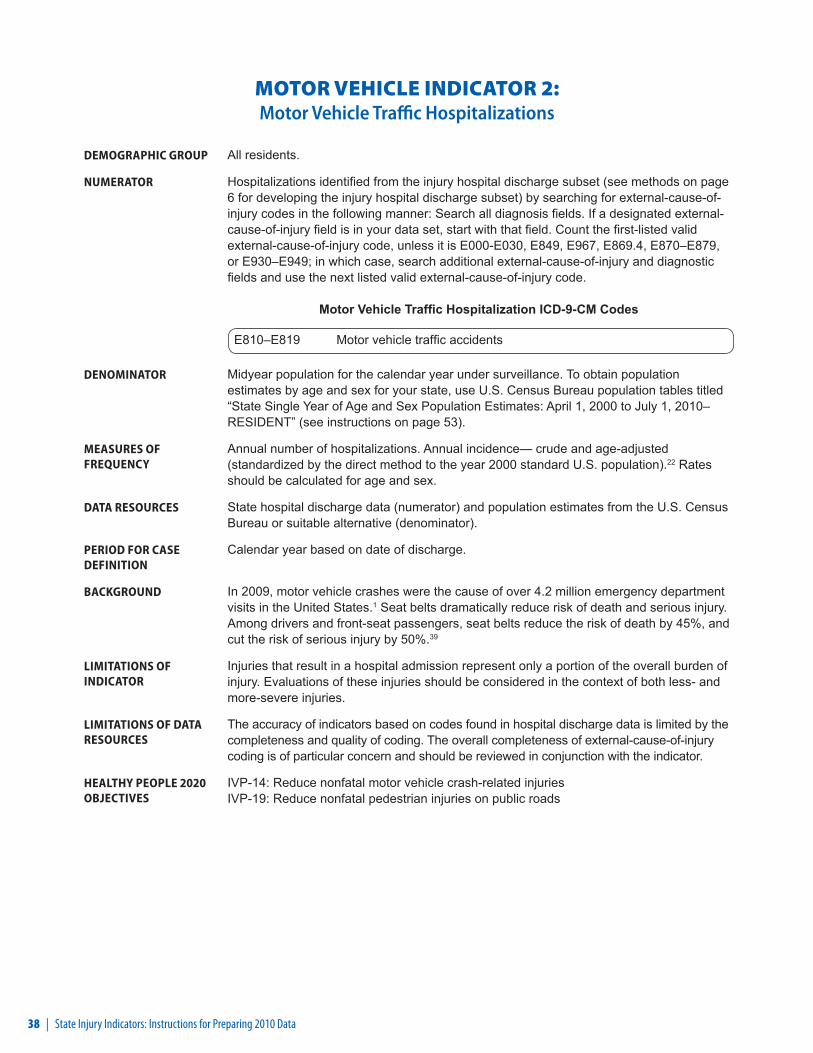
38 | State Injury Indicators: Instructions for Preparing 2010 Data
MOTOR VEHICLE INDICATOR 2: Motor Vehicle Traffic Hospitalizations
DEMOGRAPHIC GROUP All residents.
NUMERATOR Hospitalizations identified from the injury hospital discharge subset (see methods on page 6 for developing the injury hospital discharge subset) by searching for external-cause-of-injury codes in the following manner: Search all diagnosis fields. If a designated external-cause-of-injury field is in your data set, start with that field. Count the first-listed valid external-cause-of-injury code, unless it is E000-E030, E849, E967, E869.4, E870–E879, or E930–E949; in which case, search additional external-cause-of-injury and diagnostic fields and use the next listed valid external-cause-of-injury code.
Motor Vehicle Traffic Hospitalization ICD-9-CM Codes
E810–E819 Motor vehicle traffic accidents
DENOMINATOR Midyear population for the calendar year under surveillance. To obtain population estimates by age and sex for your state, use U.S. Census Bureau population tables titled “State Single Year of Age and Sex Population Estimates: April 1, 2000 to July 1, 2010– RESIDENT” (see instructions on page 53).
MEASURES OF FREQUENCY
Annual number of hospitalizations. Annual incidence— crude and age-adjusted (standardized by the direct method to the year 2000 standard U.S. population).22 Rates should be calculated for age and sex.
DATA RESOURCES State hospital discharge data (numerator) and population estimates from the U.S. Census Bureau or suitable alternative (denominator).
PERIOD FOR CASE DEFINITION
Calendar year based on date of discharge.
BACKGROUND In 2009, motor vehicle crashes were the cause of over 4.2 million emergency department visits in the United States.1 Seat belts dramatically reduce risk of death and serious injury. Among drivers and front-seat passengers, seat belts reduce the risk of death by 45%, and cut the risk of serious injury by 50%.39
LIMITATIONS OF INDICATOR
Injuries that result in a hospital admission represent only a portion of the overall burden of injury. Evaluations of these injuries should be considered in the context of both less- and more-severe injuries.
LIMITATIONS OF DATA RESOURCES
The accuracy of indicators based on codes found in hospital discharge data is limited by the completeness and quality of coding. The overall completeness of external-cause-of-injury coding is of particular concern and should be reviewed in conjunction with the indicator.
HEALTHY PEOPLE 2020 OBJECTIVES
IVP-14: Reduce nonfatal motor vehicle crash-related injuries IVP-19: Reduce nonfatal pedestrian injuries on public roads

State Injury Indicators: Instructions for Preparing 2010 Data | 39
MOTOR VEHICLE INDICATOR 3: Motor Vehicle Traffic Emergency Department Visits
DEMOGRAPHIC GROUP All residents.
NUMERATOR Emergency department visits identified from the injury emergency department visit subset (see methods on page 8 for developing the injury emergency department visit subset) by searching for external-cause-of-injury codes in the following manner: Search all diagnosis fields. If a designated external-cause-of-injury field is in your data set, start with that field. Count the first-listed valid external-cause-of-injury code, unless it is E000-E030, E849, E967, E869.4, E870–E879, or E930–E949; in which case, search additional external-cause-of-injury and diagnostic fields and use the next listed valid external-cause-of-injury code.
Motor Vehicle Traffic Emergency Department Visit ICD-9-CM Codes
E810–E819 Motor vehicle traffic accidents
DENOMINATOR Midyear population for the calendar year under surveillance. To obtain population estimates by age and sex for your state, use U.S. Census Bureau population tables titled “State Single Year of Age and Sex Population Estimates: April 1, 2000 to July 1, 2010– RESIDENT” (see instructions on page 53).
MEASURES OF FREQUENCY
Annual number of emergency department visits. Annual incidence— crude and age-adjusted (standardized by the direct method to the year 2000 standard U.S. population).22 Rates should be calculated for age and sex.
DATA RESOURCES State emergency department data (numerator) and population estimates from the U.S. Census Bureau or suitable alternative (denominator).
PERIOD FOR CASE DEFINITION
Calendar year based on date of ED visit.
BACKGROUND In 2009, motor vehicle crashes were the cause of over 4.2 million emergency department visits in the United States.1 Seat belts dramatically reduce risk of death and serious injury. Among drivers and front-seat passengers, seat belts reduce the risk of death by 45%, and cut the risk of serious injury by 50%.39
LIMITATIONS OF INDICATOR
Injuries that result in emergency department visits represent only a portion of the overall burden of injury. Evaluations of these injuries should be considered in the context of both less- and more-severe injuries.
LIMITATIONS OF DATA RESOURCES
The accuracy of indicators based on codes found in emergency department data is limited by the completeness and quality of coding. The overall completeness of external-cause-of-injury coding is of particular concern and should be reviewed in conjunction with the indicator.
HEALTHY PEOPLE 2020 OBJECTIVES
IVP-14: Reduce nonfatal motor vehicle crash-related injuries IVP-19: Reduce nonfatal pedestrian injuries on public roads

40 | State Injury Indicators: Instructions for Preparing 2010 Data
MOTOR VEHICLE INDICATOR 4: Seat Belt Use
This indicator will be calculated at CDC.
DEMOGRAPHIC GROUP Resident persons aged 18 years or older.
NUMERATOR Those respondents reporting wearing their seatbelt “always” or “almost always” when driving or riding in a car.
DENOMINATOR Respondents aged 18 years or older.
MEASURES OF FREQUENCY
Annual prevalence— crude.
DATA RESOURCES Data from the Behavioral Risk Factor Surveillance System (BRFSS).18
PERIOD FOR CASE DEFINITION
No time frame.
BACKGROUND Seat belts dramatically reduce risk of death and serious injury. Among drivers and front-seat passengers, seat belts reduce the risk of death by 45%, and cut the risk of serious injury by 50%.39
LIMITATIONS OF INDICATOR
Self-reported data only represent a small portion of the overall burden of injury. An evaluation of only these injuries may not present an accurate picture of all injuries.
LIMITATIONS OF DATA RESOURCES
As with all self-reported sample surveys, BRFSS data might be subject to systematic error resulting from noncoverage (e.g., lower telephone coverage among populations of low socioeconomic status), nonresponse (e.g., refusal to participate in the survey or to answer specific questions), or measurement (e.g., social desirability or recall bias).
HEALTHY PEOPLE 2020 OBJECTIVES
IVP-15: Increase use of safety belts
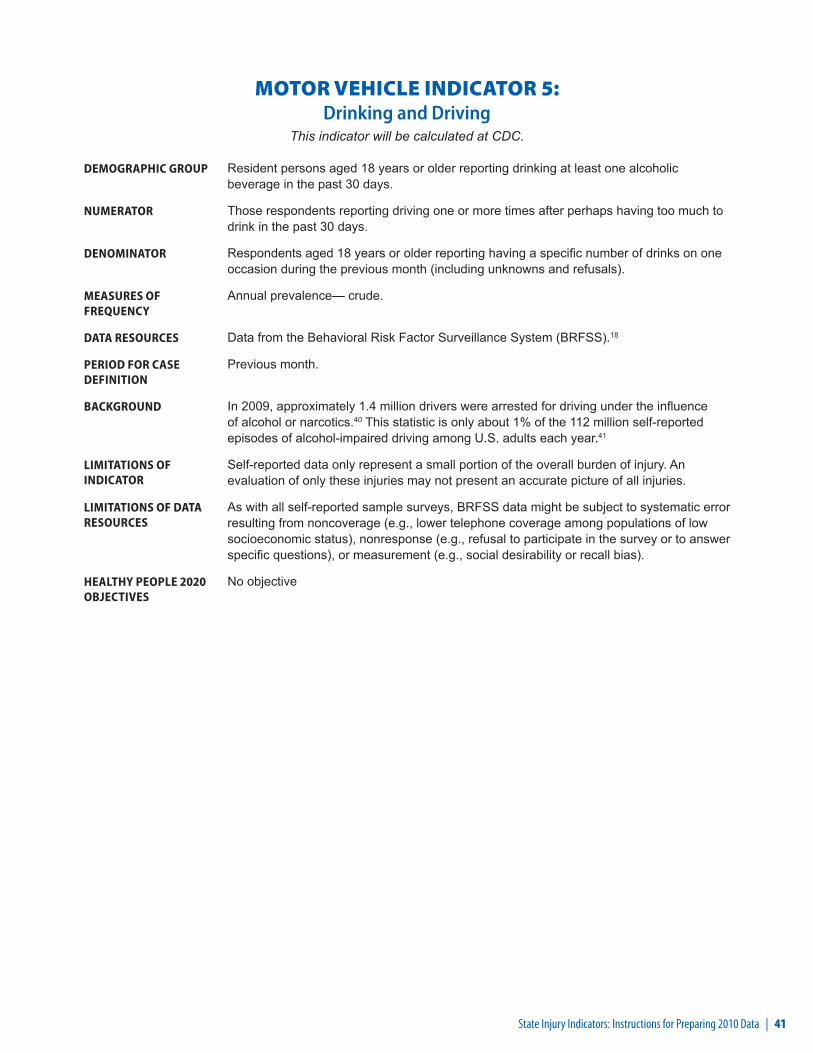
State Injury Indicators: Instructions for Preparing 2010 Data | 41
MOTOR VEHICLE INDICATOR 5: Drinking and Driving
This indicator will be calculated at CDC.
DEMOGRAPHIC GROUP Resident persons aged 18 years or older reporting drinking at least one alcoholic beverage in the past 30 days.
NUMERATOR Those respondents reporting driving one or more times after perhaps having too much to drink in the past 30 days.
DENOMINATOR Respondents aged 18 years or older reporting having a specific number of drinks on one occasion during the previous month (including unknowns and refusals).
MEASURES OF FREQUENCY
Annual prevalence— crude.
DATA RESOURCES Data from the Behavioral Risk Factor Surveillance System (BRFSS).18
PERIOD FOR CASE DEFINITION
Previous month.
BACKGROUND In 2009, approximately 1.4 million drivers were arrested for driving under the influence of alcohol or narcotics.40 This statistic is only about 1% of the 112 million self-reported episodes of alcohol-impaired driving among U.S. adults each year.41
LIMITATIONS OF INDICATOR
Self-reported data only represent a small portion of the overall burden of injury. An evaluation of only these injuries may not present an accurate picture of all injuries.
LIMITATIONS OF DATA RESOURCES
As with all self-reported sample surveys, BRFSS data might be subject to systematic error resulting from noncoverage (e.g., lower telephone coverage among populations of low socioeconomic status), nonresponse (e.g., refusal to participate in the survey or to answer specific questions), or measurement (e.g., social desirability or recall bias).
HEALTHY PEOPLE 2020 OBJECTIVES
No objective
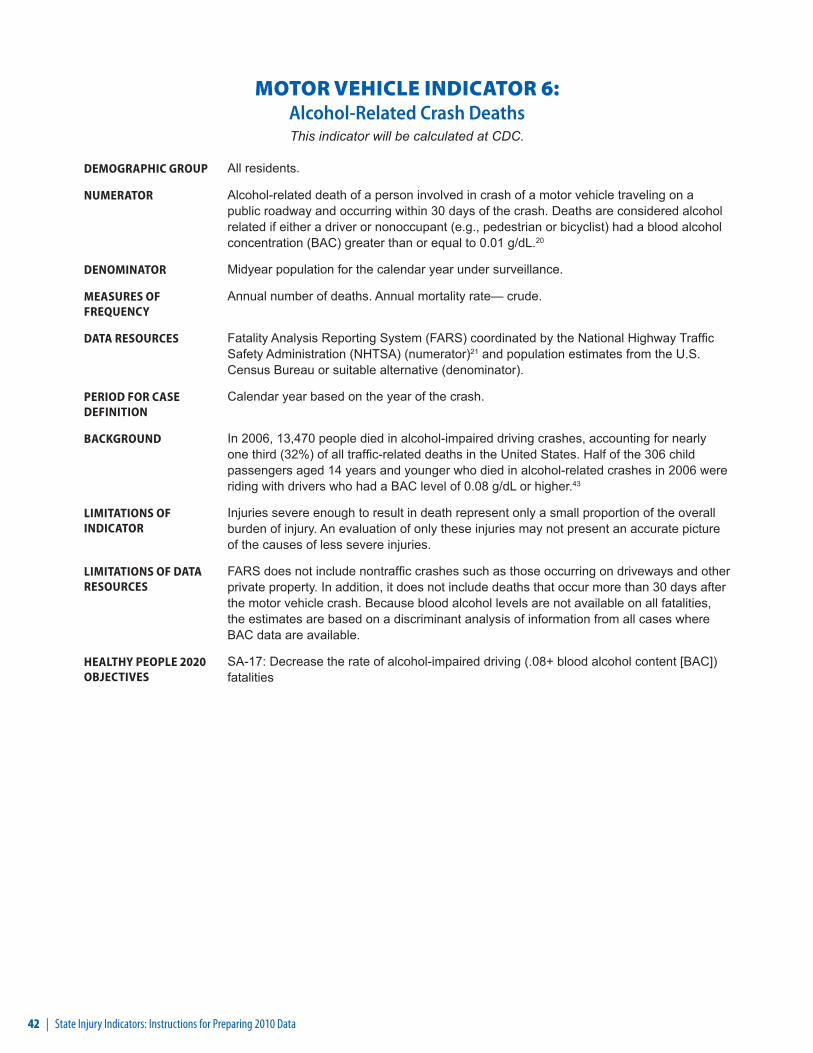
42 | State Injury Indicators: Instructions for Preparing 2010 Data
MOTOR VEHICLE INDICATOR 6: Alcohol-Related Crash DeathsThis indicator will be calculated at CDC.
DEMOGRAPHIC GROUP All residents.
NUMERATOR Alcohol-related death of a person involved in crash of a motor vehicle traveling on a public roadway and occurring within 30 days of the crash. Deaths are considered alcohol related if either a driver or nonoccupant (e.g., pedestrian or bicyclist) had a blood alcohol concentration (BAC) greater than or equal to 0.01 g/dL.20
DENOMINATOR Midyear population for the calendar year under surveillance.
MEASURES OF FREQUENCY
Annual number of deaths. Annual mortality rate— crude.
DATA RESOURCES Fatality Analysis Reporting System (FARS) coordinated by the National Highway Traffic Safety Administration (NHTSA) (numerator)21 and population estimates from the U.S. Census Bureau or suitable alternative (denominator).
PERIOD FOR CASE DEFINITION
Calendar year based on the year of the crash.
BACKGROUND In 2006, 13,470 people died in alcohol-impaired driving crashes, accounting for nearly one third (32%) of all traffic-related deaths in the United States. Half of the 306 child passengers aged 14 years and younger who died in alcohol-related crashes in 2006 were riding with drivers who had a BAC level of 0.08 g/dL or higher.43
LIMITATIONS OF INDICATOR
Injuries severe enough to result in death represent only a small proportion of the overall burden of injury. An evaluation of only these injuries may not present an accurate picture of the causes of less severe injuries.
LIMITATIONS OF DATA RESOURCES
FARS does not include nontraffic crashes such as those occurring on driveways and other private property. In addition, it does not include deaths that occur more than 30 days after the motor vehicle crash. Because blood alcohol levels are not available on all fatalities, the estimates are based on a discriminant analysis of information from all cases where BAC data are available.
HEALTHY PEOPLE 2020 OBJECTIVES
SA-17: Decrease the rate of alcohol-impaired driving (.08+ blood alcohol content [BAC]) fatalities
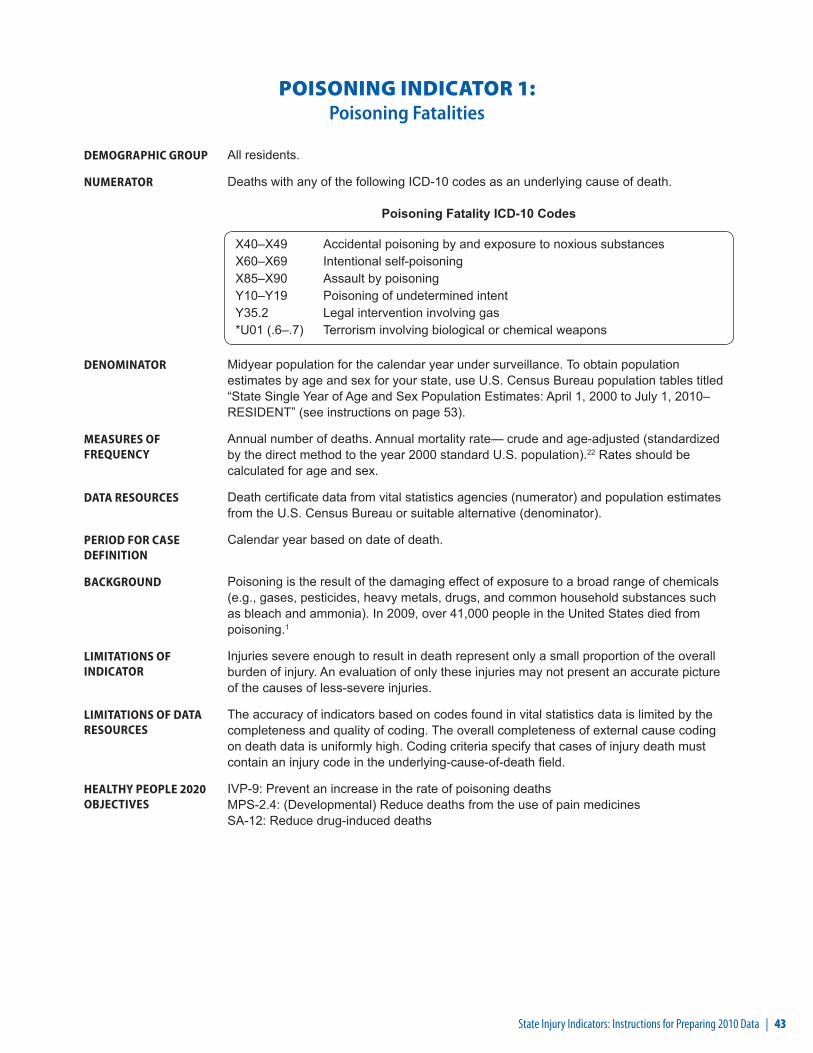
State Injury Indicators: Instructions for Preparing 2010 Data | 43
POISONING INDICATOR 1: Poisoning Fatalities
DEMOGRAPHIC GROUP All residents.
NUMERATOR Deaths with any of the following ICD-10 codes as an underlying cause of death.
Poisoning Fatality ICD-10 Codes
X40–X49 Accidental poisoning by and exposure to noxious substancesX60–X69 Intentional self-poisoningX85–X90 Assault by poisoningY10–Y19 Poisoning of undetermined intentY35.2 Legal intervention involving gas*U01 (.6–.7) Terrorism involving biological or chemical weapons
DENOMINATOR Midyear population for the calendar year under surveillance. To obtain population estimates by age and sex for your state, use U.S. Census Bureau population tables titled “State Single Year of Age and Sex Population Estimates: April 1, 2000 to July 1, 2010– RESIDENT” (see instructions on page 53).
MEASURES OF FREQUENCY
Annual number of deaths. Annual mortality rate— crude and age-adjusted (standardized by the direct method to the year 2000 standard U.S. population).22 Rates should be calculated for age and sex.
DATA RESOURCES Death certificate data from vital statistics agencies (numerator) and population estimates from the U.S. Census Bureau or suitable alternative (denominator).
PERIOD FOR CASE DEFINITION
Calendar year based on date of death.
BACKGROUND Poisoning is the result of the damaging effect of exposure to a broad range of chemicals (e.g., gases, pesticides, heavy metals, drugs, and common household substances such as bleach and ammonia). In 2009, over 41,000 people in the United States died from poisoning.1
LIMITATIONS OF INDICATOR
Injuries severe enough to result in death represent only a small proportion of the overall burden of injury. An evaluation of only these injuries may not present an accurate picture of the causes of less-severe injuries.
LIMITATIONS OF DATA RESOURCES
The accuracy of indicators based on codes found in vital statistics data is limited by the completeness and quality of coding. The overall completeness of external cause coding on death data is uniformly high. Coding criteria specify that cases of injury death must contain an injury code in the underlying-cause-of-death field.
HEALTHY PEOPLE 2020 OBJECTIVES
IVP-9: Prevent an increase in the rate of poisoning deaths MPS-2.4: (Developmental) Reduce deaths from the use of pain medicines SA-12: Reduce drug-induced deaths

44 | State Injury Indicators: Instructions for Preparing 2010 Data
POISONING INDICATOR 2: Poisoning Hospitalizations
DEMOGRAPHIC GROUP All residents.
NUMERATOR Hospitalizations identified from the injury hospital discharge subset (see methods on page 6 for developing the injury hospital discharge subset) by searching for external-cause-of-injury codes in the following manner: Search all diagnosis fields. If a designated external-cause-of-injury field is in your data set, start with that field. Count the first-listed valid external-cause-of-injury code, unless it is E000-E030. E849, E967, E869.4, E870–E879, or E930–E949; in which case, search additional external-cause-of-injury and diagnostic fields and use the next listed valid external-cause-of-injury code.
Poisoning Hospitalization ICD-9-CM Codes
E850–E858 Accidental poisoning by drugs, medicinal substances, and biologicals E860–E869 Accidental poisonings by other solid and liquid substances, gases,
and vapors E950–E952 Suicide and self-inflicted poisoning E962 Assault by poisoning E972 Injury due to legal intervention by gas E980–E982 Poisoning undetermined whether accidentally or purposefully inflicted E979 (.6–.7) Terrorism involving biological or chemical weapons
DENOMINATOR Midyear population for the calendar year under surveillance. To obtain population estimates by age and sex for your state, use U.S. Census Bureau population tables titled “State Single Year of Age and Sex Population Estimates: April 1, 2000 to July 1, 2010– RESIDENT” (see instructions on page 53).
MEASURES OF FREQUENCY
Annual number of hospitalizations. Annual incidence— crude and age-adjusted (standardized by the direct method to the year 2000 standard U.S. population).22 Rates should be calculated for age and sex.
DATA RESOURCES State hospital discharge data (numerator) and population estimates from the U.S. Census Bureau or suitable alternative (denominator).
PERIOD FOR CASE DEFINITION
Calendar year based on date of discharge.
BACKGROUND In 1999, 21 states reported that hospitalization rates were 4 to 15 times higher than death rates for poisoning-related injuries.43
LIMITATIONS OF INDICATOR
Injuries that result in a hospital admission represent only a portion of the overall burden of injury. Evaluations of these injuries should be considered in the context of both less- and more-severe injuries.
LIMITATIONS OF DATA RESOURCES
The accuracy of indicators based on codes found in hospital discharge data is limited by the completeness and quality of coding. The overall completeness of e-coding is of particular concern and should be reviewed in conjunction with the indicator.
HEALTHY PEOPLE 2020 OBJECTIVES
IVP-10: Prevent an increase in the rate of nonfatal poisonings MPS-2.3: (Developmental) Reduce serious injuries from the use of pain medicines
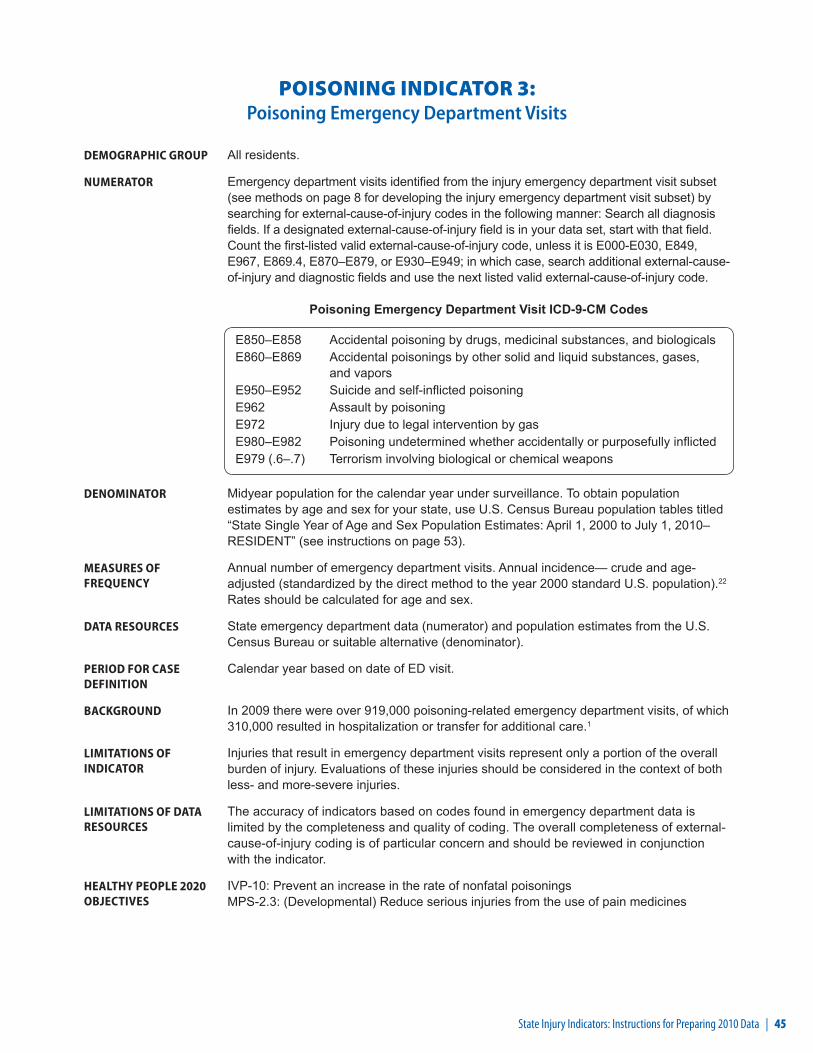
State Injury Indicators: Instructions for Preparing 2010 Data | 45
POISONING INDICATOR 3: Poisoning Emergency Department Visits
DEMOGRAPHIC GROUP All residents.
NUMERATOR Emergency department visits identified from the injury emergency department visit subset (see methods on page 8 for developing the injury emergency department visit subset) by searching for external-cause-of-injury codes in the following manner: Search all diagnosis fields. If a designated external-cause-of-injury field is in your data set, start with that field. Count the first-listed valid external-cause-of-injury code, unless it is E000-E030, E849, E967, E869.4, E870–E879, or E930–E949; in which case, search additional external-cause-of-injury and diagnostic fields and use the next listed valid external-cause-of-injury code.
Poisoning Emergency Department Visit ICD-9-CM Codes
E850–E858 Accidental poisoning by drugs, medicinal substances, and biologicals E860–E869 Accidental poisonings by other solid and liquid substances, gases,
and vapors E950–E952 Suicide and self-inflicted poisoning E962 Assault by poisoning E972 Injury due to legal intervention by gas E980–E982 Poisoning undetermined whether accidentally or purposefully inflicted E979 (.6–.7) Terrorism involving biological or chemical weapons
DENOMINATOR Midyear population for the calendar year under surveillance. To obtain population estimates by age and sex for your state, use U.S. Census Bureau population tables titled “State Single Year of Age and Sex Population Estimates: April 1, 2000 to July 1, 2010– RESIDENT” (see instructions on page 53).
MEASURES OF FREQUENCY
Annual number of emergency department visits. Annual incidence— crude and age-adjusted (standardized by the direct method to the year 2000 standard U.S. population).22 Rates should be calculated for age and sex.
DATA RESOURCES State emergency department data (numerator) and population estimates from the U.S. Census Bureau or suitable alternative (denominator).
PERIOD FOR CASE DEFINITION
Calendar year based on date of ED visit.
BACKGROUND In 2009 there were over 919,000 poisoning-related emergency department visits, of which 310,000 resulted in hospitalization or transfer for additional care.1
LIMITATIONS OF INDICATOR
Injuries that result in emergency department visits represent only a portion of the overall burden of injury. Evaluations of these injuries should be considered in the context of both less- and more-severe injuries.
LIMITATIONS OF DATA RESOURCES
The accuracy of indicators based on codes found in emergency department data is limited by the completeness and quality of coding. The overall completeness of external-cause-of-injury coding is of particular concern and should be reviewed in conjunction with the indicator.
HEALTHY PEOPLE 2020 OBJECTIVES
IVP-10: Prevent an increase in the rate of nonfatal poisoningsMPS-2.3: (Developmental) Reduce serious injuries from the use of pain medicines

46 | State Injury Indicators: Instructions for Preparing 2010 Data
SUICIDE/SUICIDE ATTEMPT INDICATOR 1: Suicides
DEMOGRAPHIC GROUP All residents.
NUMERATOR Deaths with any of the following ICD-10 codes as an underlying cause of death.
Suicide ICD-10 Codes
X60–X84 Intentional self-harmY87.0 Sequelae of intentional self-harm*U03 Terrorism-intentional self-harm
DENOMINATOR Midyear population for the calendar year under surveillance. To obtain population estimates by age and sex for your state, use U.S. Census Bureau population tables titled “State Single Year of Age and Sex Population Estimates: April 1, 2000 to July 1, 2010– RESIDENT” (see instructions on page 53).
MEASURES OF FREQUENCY
Annual number of deaths. Annual mortality rate— crude and age-adjusted (standardized by the direct method to the year 2000 standard U.S. population).22 Rates should be calculated for age and sex.
DATA RESOURCES Death certificate data from vital statistics agencies (numerator) and population estimates from the U.S. Census Bureau or suitable alternative (denominator).
PERIOD FOR CASE DEFINITION
Calendar year based on date of death.
BACKGROUND In 2006, suicide was the second leading cause of death among adults ages 25 to 34 years and the third leading cause of death for adolescents and young adults ages 15 to 24 years.1
LIMITATIONS OF INDICATOR
Injuries severe enough to result in death represent only a small proportion of the overall burden of injury. An evaluation of only these injuries may not present an accurate picture of the causes of less-severe injuries.
LIMITATIONS OF DATA RESOURCES
The accuracy of indicators based on codes found in vital statistics data is limited by the completeness and quality of coding. The overall completeness of external cause coding on death data is uniformly high. Coding criteria specify that cases of injury death must contain an injury code in the underlying-cause-of-death field.
HEALTHY PEOPLE 2020 OBJECTIVES
MHMD-1: Reduce the suicide rate
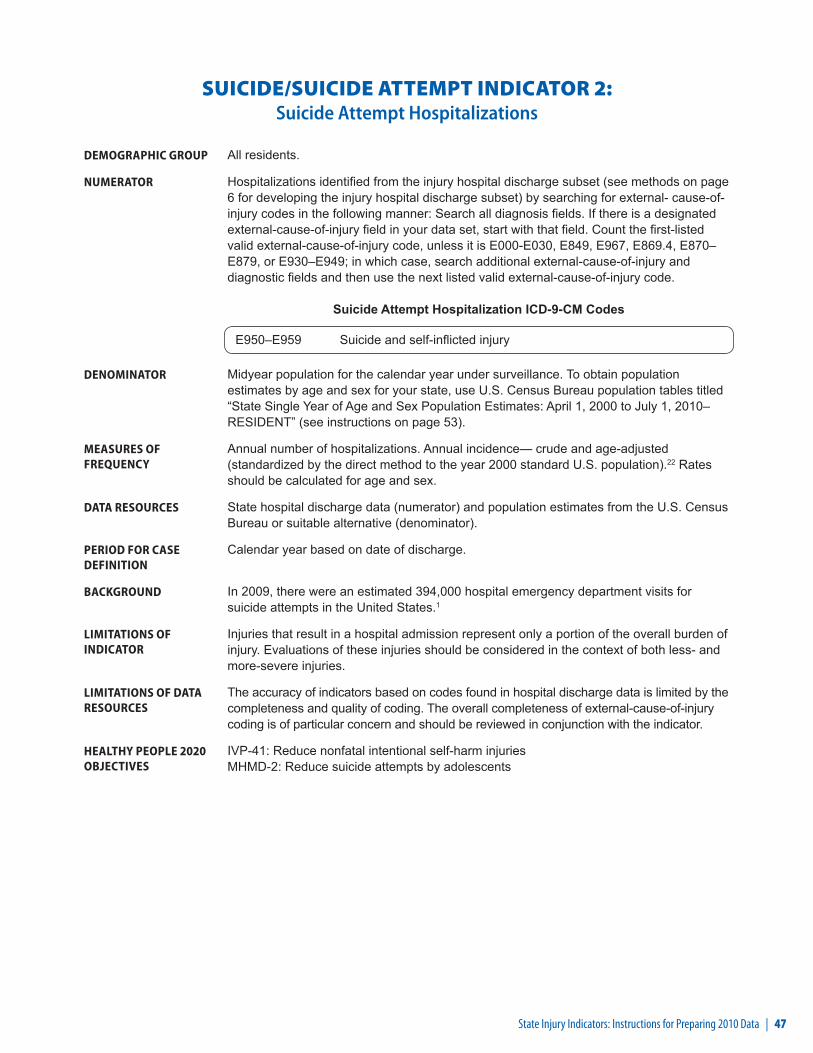
State Injury Indicators: Instructions for Preparing 2010 Data | 47
SUICIDE/SUICIDE ATTEMPT INDICATOR 2: Suicide Attempt Hospitalizations
DEMOGRAPHIC GROUP All residents.
NUMERATOR Hospitalizations identified from the injury hospital discharge subset (see methods on page 6 for developing the injury hospital discharge subset) by searching for external- cause-of-injury codes in the following manner: Search all diagnosis fields. If there is a designated external-cause-of-injury field in your data set, start with that field. Count the first-listed valid external-cause-of-injury code, unless it is E000-E030, E849, E967, E869.4, E870–E879, or E930–E949; in which case, search additional external-cause-of-injury and diagnostic fields and then use the next listed valid external-cause-of-injury code.
Suicide Attempt Hospitalization ICD-9-CM Codes
E950–E959 Suicide and self-inflicted injury
DENOMINATOR Midyear population for the calendar year under surveillance. To obtain population estimates by age and sex for your state, use U.S. Census Bureau population tables titled “State Single Year of Age and Sex Population Estimates: April 1, 2000 to July 1, 2010– RESIDENT” (see instructions on page 53).
MEASURES OF FREQUENCY
Annual number of hospitalizations. Annual incidence— crude and age-adjusted (standardized by the direct method to the year 2000 standard U.S. population).22 Rates should be calculated for age and sex.
DATA RESOURCES State hospital discharge data (numerator) and population estimates from the U.S. Census Bureau or suitable alternative (denominator).
PERIOD FOR CASE DEFINITION
Calendar year based on date of discharge.
BACKGROUND In 2009, there were an estimated 394,000 hospital emergency department visits for suicide attempts in the United States.1
LIMITATIONS OF INDICATOR
Injuries that result in a hospital admission represent only a portion of the overall burden of injury. Evaluations of these injuries should be considered in the context of both less- and more-severe injuries.
LIMITATIONS OF DATA RESOURCES
The accuracy of indicators based on codes found in hospital discharge data is limited by the completeness and quality of coding. The overall completeness of external-cause-of-injury coding is of particular concern and should be reviewed in conjunction with the indicator.
HEALTHY PEOPLE 2020 OBJECTIVES
IVP-41: Reduce nonfatal intentional self-harm injuries MHMD-2: Reduce suicide attempts by adolescents
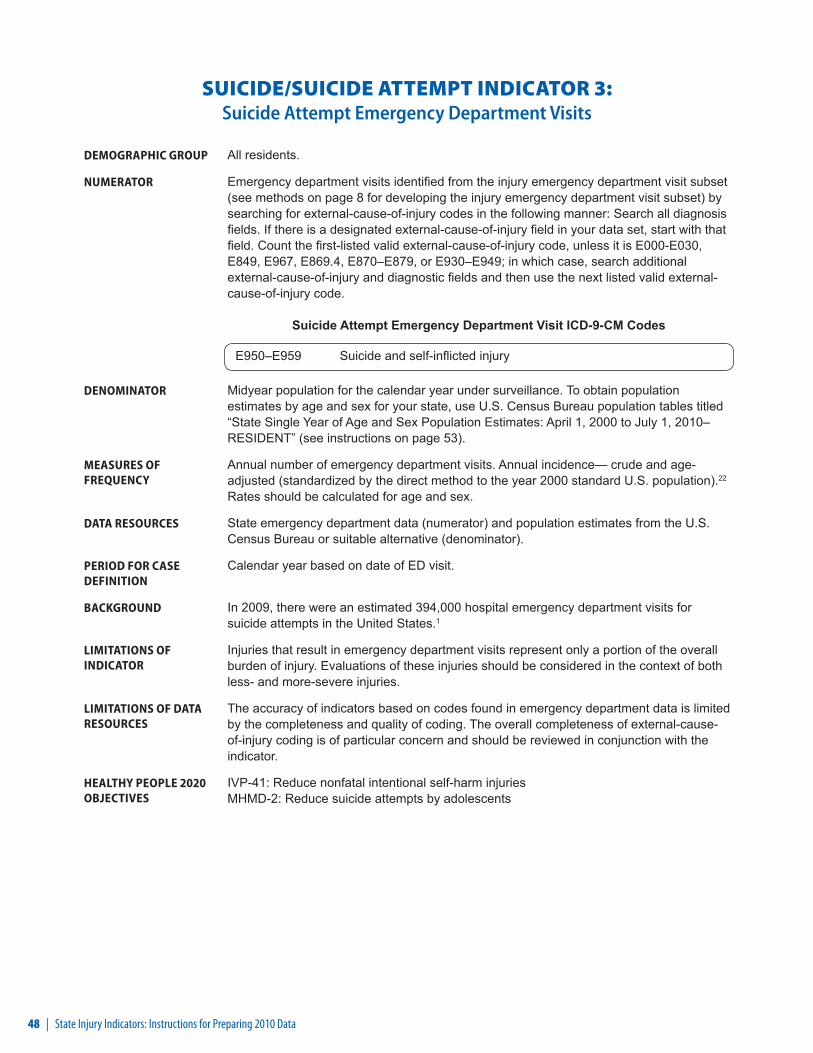
48 | State Injury Indicators: Instructions for Preparing 2010 Data
SUICIDE/SUICIDE ATTEMPT INDICATOR 3: Suicide Attempt Emergency Department Visits
DEMOGRAPHIC GROUP All residents.
NUMERATOR Emergency department visits identified from the injury emergency department visit subset (see methods on page 8 for developing the injury emergency department visit subset) by searching for external-cause-of-injury codes in the following manner: Search all diagnosis fields. If there is a designated external-cause-of-injury field in your data set, start with that field. Count the first-listed valid external-cause-of-injury code, unless it is E000-E030, E849, E967, E869.4, E870–E879, or E930–E949; in which case, search additional external-cause-of-injury and diagnostic fields and then use the next listed valid external-cause-of-injury code.
Suicide Attempt Emergency Department Visit ICD-9-CM Codes
E950–E959 Suicide and self-inflicted injury
DENOMINATOR Midyear population for the calendar year under surveillance. To obtain population estimates by age and sex for your state, use U.S. Census Bureau population tables titled “State Single Year of Age and Sex Population Estimates: April 1, 2000 to July 1, 2010– RESIDENT” (see instructions on page 53).
MEASURES OF FREQUENCY
Annual number of emergency department visits. Annual incidence— crude and age-adjusted (standardized by the direct method to the year 2000 standard U.S. population).22 Rates should be calculated for age and sex.
DATA RESOURCES State emergency department data (numerator) and population estimates from the U.S. Census Bureau or suitable alternative (denominator).
PERIOD FOR CASE DEFINITION
Calendar year based on date of ED visit.
BACKGROUND In 2009, there were an estimated 394,000 hospital emergency department visits for suicide attempts in the United States.1
LIMITATIONS OF INDICATOR
Injuries that result in emergency department visits represent only a portion of the overall burden of injury. Evaluations of these injuries should be considered in the context of both less- and more-severe injuries.
LIMITATIONS OF DATA RESOURCES
The accuracy of indicators based on codes found in emergency department data is limited by the completeness and quality of coding. The overall completeness of external-cause-of-injury coding is of particular concern and should be reviewed in conjunction with the indicator.
HEALTHY PEOPLE 2020 OBJECTIVES
IVP-41: Reduce nonfatal intentional self-harm injuriesMHMD-2: Reduce suicide attempts by adolescents

State Injury Indicators: Instructions for Preparing 2010 Data | 49
TRAUMATIC BRAIN INJURY INDICATOR 1: Traumatic Brain Injury Fatalities
DEMOGRAPHIC GROUP All residents.
NUMERATOR First, limit deaths to those with an injury underlying cause of death (V01–Y36, Y85–Y87, Y89, *U01–*U03). Then select deaths with any of the following ICD-10 codes in any field of the multiple cause of death file.
Traumatic Brain Injury Fatality ICD-10 Codes
S01.0–S01.9 Open wound of headS02.0, S02.1, S02.3, S02.7–S02.9 Fracture of skull and facial bonesS04.0 Injury of optic nerve and pathwaysS06.0–S06.9 Intracranial injuryS07.0, S07.1, S07.8, S07.9 Crushing injury of headS09.7–S09.9 Other and unspecified injuries of headT01.0* Open wounds involving head with neck T02.0* Fractures involving head with neckT04.0* Crushing injuries involving head with neckT06.0* Injuries of brain and cranial nerves with injuries
of nerves and spinal cord at neck levelT90.1, T90.2, T90.4, T90.5, T90.8, T90.9
Sequelae of injuries of head
* These codes are not considered valid in the U.S.
DENOMINATOR Midyear population for the calendar year under surveillance. To obtain population estimates by age and sex for your state, use U.S. Census Bureau population tables titled “State Single Year of Age and Sex Population Estimates: April 1, 2000 to July 1, 2010– RESIDENT” (see instructions on page 53).
MEASURES OF FREQUENCY
Annual number of deaths. Annual mortality rate— crude and age-adjusted (standardized by the direct method to the year 2000 standard U.S. population).22 Rates should be calculated for age and sex.
DATA RESOURCES Death certificate data from vital statistics agencies (numerator) and population estimates from the U.S. Census Bureau or suitable alternative (denominator).
PERIOD FOR CASE DEFINITION
Calendar year based on date of death.
BACKGROUND Of the approximately 1.7 million people who sustained a TBI in the United States each year, an estimated 52,000 died; 275,000 were hospitalized; and 1.365 million were treated and released from an emergency department.44
LIMITATIONS OF INDICATOR
Injuries severe enough to result in death represent only a small proportion of the overall burden of injury. An evaluation of only these injuries may not present an accurate picture of the causes of less-severe injuries.
LIMITATIONS OF DATA RESOURCES
The accuracy of indicators based on codes found in vital statistics data is limited by the completeness and quality of coding.
HEALTHY PEOPLE 2020 OBJECTIVES
IVP-2.1 Reduce fatal traumatic brain injuries

50 | State Injury Indicators: Instructions for Preparing 2010 Data
TRAUMATIC BRAIN INJURY INDICATOR 2: Traumatic Brain Injury Hospitalizations
DEMOGRAPHIC GROUP All residents.
NUMERATOR Hospitalizations with any of the following ICD-9-CM diagnostic codes. These should be identified by searching all diagnostic fields of the injury hospital discharge subset (see methods on page 6 for developing the injury hospital discharge subset).
Traumatic Brain Injury Hospitalization ICD-9-CM Codes
Diagnosis codes 800.00–801.99 Fracture of the vault or base of the skull 803.00–804.99 Other and unqualified or multiple fractures of the skull 850.0–850.9 Concussion 851.00–854.19 Intracranial injury, including contusion, laceration, and hemorrhage 950.1–950.3 Injury to the optic chiasm, optic pathways, or visual cortex 959.01 Head injury, unspecified 995.55 Shaken infant syndrome
DENOMINATOR Midyear population for the calendar year under surveillance. To obtain population estimates by age and sex for your state, use U.S. Census Bureau population tables titled “State Single Year of Age and Sex Population Estimates: April 1, 2000 to July 1, 2010– RESIDENT” (see instructions on page 53).
MEASURES OF FREQUENCY
Annual number of hospitalizations. Annual incidence— crude and age-adjusted (standardized by the direct method to the year 2000 standard U.S. population).22 Rates should be calculated for age and sex.
DATA RESOURCES State hospital discharge data (numerator) and population estimates from the U.S. Census Bureau or suitable alternative (denominator).
PERIOD FOR CASE DEFINITION
Calendar year based on date of discharge.
BACKGROUND An estimated 5.3 million Americans live with a TBI-related disability. According to one study, about 40% of those hospitalized with a TBI had at least one unmet need for services one year after their injury.45, 46
LIMITATIONS OF INDICATOR
Injuries that result in a hospital admission represent only a portion of the overall burden of injury. Evaluations of these injuries should be considered in the context of both less- and more-severe injuries.
LIMITATIONS OF DATA RESOURCES
The accuracy of indicators based on codes found in hospital discharge data is limited by the completeness and quality of coding.
HEALTHY PEOPLE 2020 OBJECTIVES
IVP-2.2 Reduce hospitalization for nonfatal traumatic brain injuries
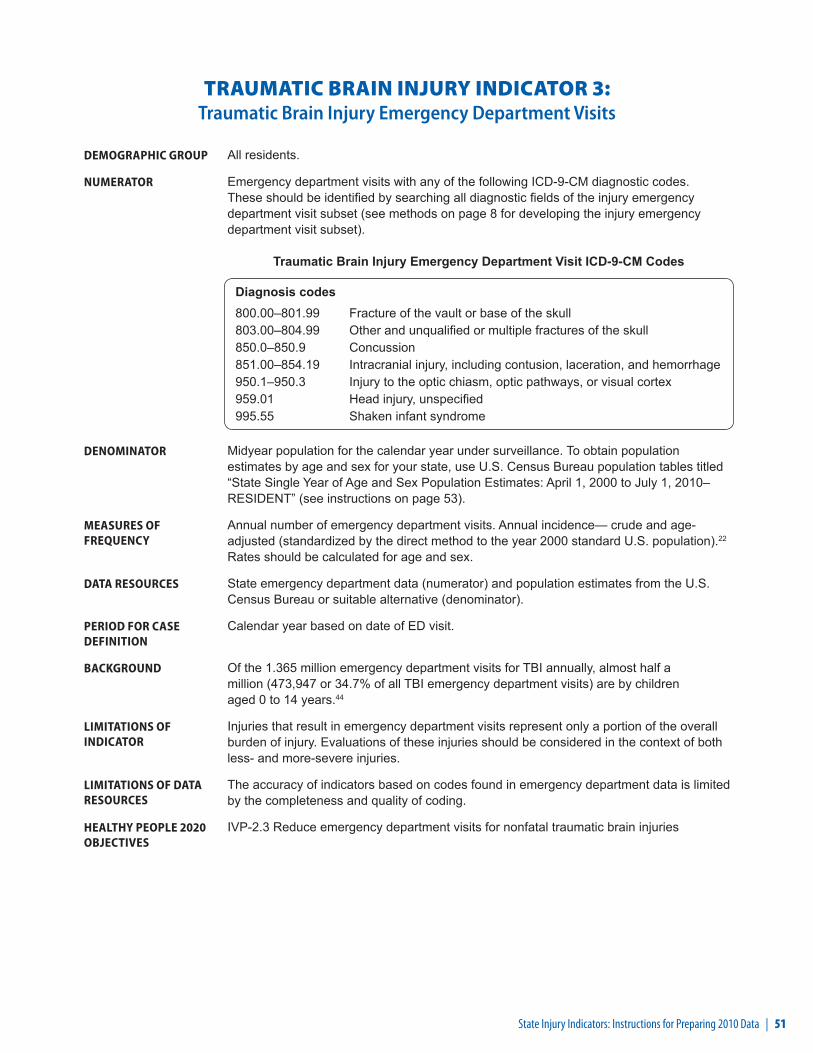
State Injury Indicators: Instructions for Preparing 2010 Data | 51
TRAUMATIC BRAIN INJURY INDICATOR 3: Traumatic Brain Injury Emergency Department Visits
DEMOGRAPHIC GROUP All residents.
NUMERATOR Emergency department visits with any of the following ICD-9-CM diagnostic codes. These should be identified by searching all diagnostic fields of the injury emergency department visit subset (see methods on page 8 for developing the injury emergency department visit subset).
Traumatic Brain Injury Emergency Department Visit ICD-9-CM Codes
Diagnosis codes 800.00–801.99 Fracture of the vault or base of the skull 803.00–804.99 Other and unqualified or multiple fractures of the skull 850.0–850.9 Concussion 851.00–854.19 Intracranial injury, including contusion, laceration, and hemorrhage 950.1–950.3 Injury to the optic chiasm, optic pathways, or visual cortex 959.01 Head injury, unspecified 995.55 Shaken infant syndrome
DENOMINATOR Midyear population for the calendar year under surveillance. To obtain population estimates by age and sex for your state, use U.S. Census Bureau population tables titled “State Single Year of Age and Sex Population Estimates: April 1, 2000 to July 1, 2010– RESIDENT” (see instructions on page 53).
MEASURES OF FREQUENCY
Annual number of emergency department visits. Annual incidence— crude and age-adjusted (standardized by the direct method to the year 2000 standard U.S. population).22 Rates should be calculated for age and sex.
DATA RESOURCES State emergency department data (numerator) and population estimates from the U.S. Census Bureau or suitable alternative (denominator).
PERIOD FOR CASE DEFINITION
Calendar year based on date of ED visit.
BACKGROUND Of the 1.365 million emergency department visits for TBI annually, almost half a million (473,947 or 34.7% of all TBI emergency department visits) are by children aged 0 to 14 years.44
LIMITATIONS OF INDICATOR
Injuries that result in emergency department visits represent only a portion of the overall burden of injury. Evaluations of these injuries should be considered in the context of both less- and more-severe injuries.
LIMITATIONS OF DATA RESOURCES
The accuracy of indicators based on codes found in emergency department data is limited by the completeness and quality of coding.
HEALTHY PEOPLE 2020 OBJECTIVES
IVP-2.3 Reduce emergency department visits for nonfatal traumatic brain injuries

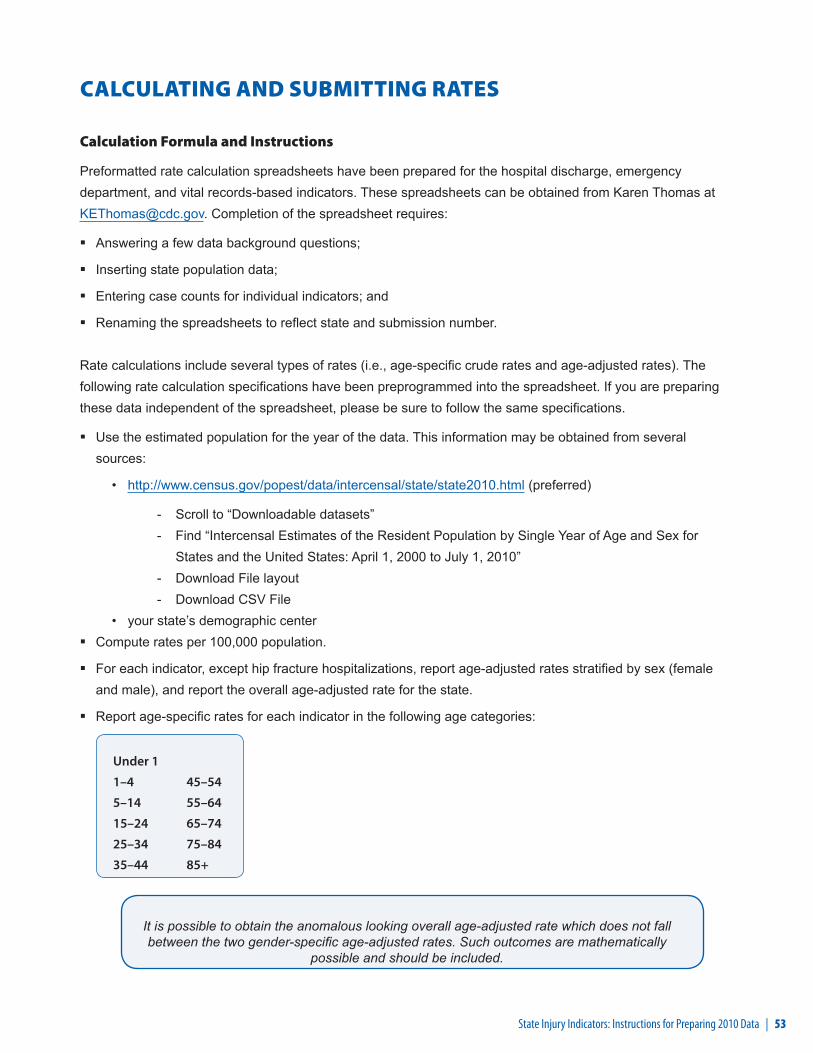
State Injury Indicators: Instructions for Preparing 2010 Data | 53
CALCULATING AND SUBMITTING RATES
Calculation Formula and Instructions
Preformatted rate calculation spreadsheets have been prepared for the hospital discharge, emergency department, and vital records-based indicators. These spreadsheets can be obtained from Karen Thomas at [email protected]. Completion of the spreadsheet requires:
▪ Answering a few data background questions;
▪ Inserting state population data;
▪ Entering case counts for individual indicators; and
▪ Renaming the spreadsheets to reflect state and submission number.
Rate calculations include several types of rates (i.e., age-specific crude rates and age-adjusted rates). The following rate calculation specifications have been preprogrammed into the spreadsheet. If you are preparing these data independent of the spreadsheet, please be sure to follow the same specifications.
▪ Use the estimated population for the year of the data. This information may be obtained from several sources:
• http://www.census.gov/popest/data/intercensal/state/state2010.html (preferred)
- Scroll to “Downloadable datasets” - Find “Intercensal Estimates of the Resident Population by Single Year of Age and Sex for
States and the United States: April 1, 2000 to July 1, 2010” - Download File layout - Download CSV File
• your state’s demographic center ▪ Compute rates per 100,000 population.
▪ For each indicator, except hip fracture hospitalizations, report age-adjusted rates stratified by sex (female and male), and report the overall age-adjusted rate for the state.
▪ Report age-specific rates for each indicator in the following age categories:
Under 1
1–4 45–54
5–14 55–64
15–24 65–74
25–34 75–84
35–44 85+
It is possible to obtain the anomalous looking overall age-adjusted rate which does not fall between the two gender-specific age-adjusted rates. Such outcomes are mathematically
possible and should be included.
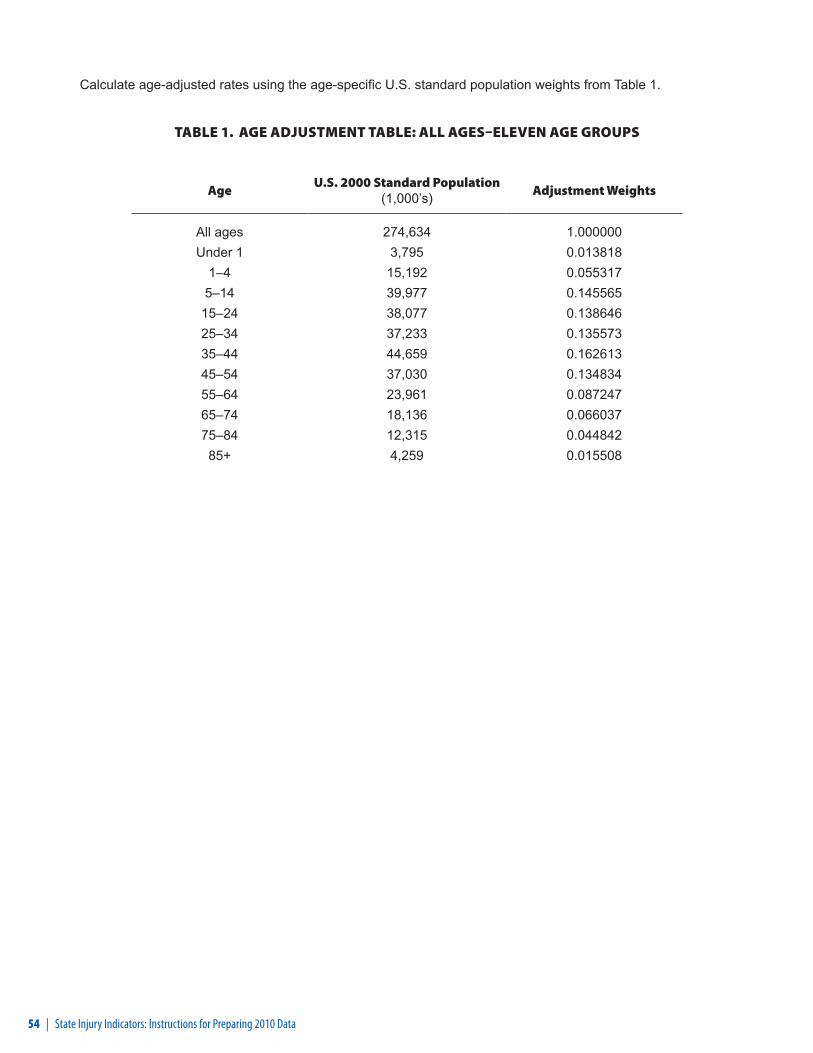
54 | State Injury Indicators: Instructions for Preparing 2010 Data
Calculate age-adjusted rates using the age-specific U.S. standard population weights from Table 1.
TABLE 1. AGE ADJUSTMENT TABLE: ALL AGES–ELEVEN AGE GROUPS
AgeU.S. 2000 Standard Population
(1,000’s) Adjustment Weights
All ages 274,634 1.000000 Under 1 3,795 0.013818
1–4 15,192 0.0553175–14 39,977 0.145565
15–24 38,077 0.13864625–34 37,233 0.13557335–44 44,659 0.16261345–54 37,030 0.13483455–64 23,961 0.08724765–74 18,136 0.06603775–84 12,315 0.04484285+ 4,259 0.015508

State Injury Indicators: Instructions for Preparing 2010 Data | 55
REFERENCES 1. Centers for Disease Control and Prevention, National Center for Injury Prevention and Control. Web-based
Injury Statistics Query and Reporting System (WISQARS) [online]. (2005) [cited 2012 Jan 27]. Available from URL: www.cdc.gov/injury/wisqars/index.html.
2. Finkelstein EA, Corso PS, Miller TR, Associates. Incidence and Economic Burden of Injuries in the United States. New York: Oxford University Press; 2006.
3. Institute of Medicine (US). Reducing the Burden of Injury, Advancing Prevention and Treatment. Washington (DC): National Academy Press; 1999.
4. Injury Surveillance Workgroup. Consensus recommendations for injury surveillance in state health departments. State and Territorial Injury Prevention Directors Association: Atlanta (GA); 1999.
5. Injury Surveillance Workgroup 5. Consensus recommendations for injury surveillance in state health departments. State and Territorial Injury Prevention Directors Association: Atlanta (GA); 2007.
6. Meriwether RA. Blueprint for a national public health surveillance system for the 21st century. J Public Health Manag Pract 1996;216–23.
7. Council of State and Territorial Epidemiologists. Injury Control and Prevention Position Statements. [cited 2012 Jan 27]. Available from URL: http://www.cste.org/dnn/AnnualConference/PositionStatements/tabid/191/Default.aspx
8. Safe States Alliance. Injury Surveillance Workgroup. [cited 2012 Jan 27]. Available from URL: http://www.safestates.org/displaycommon.cfm?an=1&subarticlenbr=10.
9. Injury surveillance workgroup 3. Consensus Recommendations for Using Hospital Discharge Data for Injury Surveillance. State and Territorial Injury Prevention Directors Association: Marietta (GA); 2003.
10. 10. International Classification of Diseases 10th Revision [online]. [cited 2012 Jan 27]. Available from URL: http://www.who.int/classifications/icd/en/.
11. Centers for Disease Control and Prevention. Mortality Data from the National Vital Statistics System. [cited 2012 Jan 27]. Available from URL: http://www.cdc.gov/nchs/deaths.htm.
12. Abellera J, Annest JL, Conn JM, Kohn M. How states are collecting and using cause of injury data: 2004 update of the 1997 report. A survey by CSTE, APHA-ICEHS, and STIPDA [online]. [cited 2012 Jan 27]. Available from URL: http://www.cste.org/pdffiles/newpdffiles/ECodeFinal3705.pdf.
13. Centers for Medicare and Medicaid Services. UB-04 Overview [online]. [cited 2012 Jan 27]. Available from URL: www.cms.gov/MLNProducts/downloads/ub04_fact_sheet.pdf.
14. International Classification of Diseases 9th Revision Clinical Modification [online]. [cited 2012 Jan 27]. Available from URL: www.cdc.gov/nchs/icd/icd9cm.htm.
15. State of the States: 2009 Report. Atlanta (GA): Safe States Alliance; 2011.
16. Centers for Disease Control and Prevention. What is the Barell Matrix (ICD–9–CM)? [cited 2011 Dec 2]. Available from URL: http://www.cdc.gov/nchs/injury/injury_matrices.htm#barell.
17. Centers for Disease Control and Prevention. Matrix of E-code groupings. [cited 2001 Dec 2]. Available from URL: http://www.cdc.gov/injury/wisqars/ecode_matrix.html.
18. Centers for Disease Control and Prevention. Behavioral Risk Factor Surveillance System [online]. [cited 2012 Jan 27]. Available from URL: www.cdc.gov/brfss.
19. Centers for Disease Control and Prevention. Youth Risk Behaviors Surveillance System [online]. [cited 2012 Jan 27]. Available from URL: www.cdc.gov/nccdphp/dash/yrbs/index.htm.
20. Centers for Disease Control and Prevention. Youth Risk Behavior Surveillance—United States, 2009. In: CDC surveillance summaries; 2010 Jun 4. MMWR 2010;59 (No. SS-5).

56 | State Injury Indicators: Instructions for Preparing 2010 Data
21. National Highway Traffic Safety Administration. Fatality Analysis System. [cited 2012 Jan 27]. Available from URL: http://www.nhtsa.gov/FARS.
22. Klein RJ, Schoenborn CA. Age adjustment using the 2000 projected U.S. population. Hyattsville (MD): U.S. Department of Health and Human Services, Centers for Disease Control and Prevention, National Center for Health Statistics, 2001. Healthy People 2010 statistical notes, No. 20.
23. Fletemeyer JR, Freas SJ, editors. Drowning: new perspectives on intervention and prevention. Boca Raton (FL): CRC Press; 1998.
24. Hornbrook MC, Stevens VJ, Wingfield DJ, Hollis JF, Greenlick MR, Ory MG. Preventing falls among community-dwelling older persons: results from a randomized trial. The Gerontologist 1994;34(1):16–23.
25. Hausdorff JM, Rios DA, Edelber HK. Gait variability and fall risk in community-living older adults: a 1-year prospective study. Archives of Physical Medicine and Rehabilitation 2001;82(8):1050–6.
26. Alexander BH, Rivara FP, Wolf ME. The cost and frequency of hospitalization for fall-related injuries in older adults. American Journal of Public Health 1992;82(7):1020–3.
27. Stevens JA, Corso PS, Finkelstein EA, Miller TR. The costs of fatal and nonfatal falls among older adults. Injury Prevention 2006;12:290–5.
28. Kozak LJ, DeFrances CJ, Hall MJ. National Hospital Discharge Survey: 2004 annual summary with detailed diagnosis and procedure data. National Center for Health Statistics. Vital Health Stat 13(162). 2006.
29. Magaziner J, Hawkes W, Hebel JR, Zimerman SI, Fox KM, Dolan M, et al. Recovery from hip fracture in eight areas of function. Journal of Gerontology: Medical Sciences 2000;55A(9):M498–507.
30. Leibson CL, Toteson ANA, Gabriel SE, Ransom JE, Melton JL III. Mortality, disability, and nursing home use for persons with and without hip fracture: a population-based study. Journal of the American Geriatrics Society 2002;50:1644–50.
31. Vellas BJ, Wayne SJ, Romero LJ, Baumgartner RN, Garry PJ. Fear of falling and restriction of mobility in elderly fallers. Age Ageing. 1997;26:189–93.
32. International Association for the Study of Insurance Economics. World fire statistics: information bulletin of the world fire statistics. Geneva (Switzerland): The Geneva Association; 2003.
33. Karter MJ. Fire loss in the United States during 2005, Abridged report. Quincy (MA): National Fire Protection Association, Fire Analysis and Research Division; 2006.
34. Ahrens M. U.S. experience with smoke alarms and other fire alarms. Quincy (MA): National Fire Protection Association; 2004.
35. Mallonee S, Istre G, Rosenberg M, Reddish-Douglas M, Jordan F, Silverstein P, et al. Surveillance and prevention of residential-fire injuries. N Eng J Med 1996;335:27–31.
36. Ahrens M. U.S. experience with smoke alarms and other fire alarms. Quincy (MA): National Fire Protection Association; 2001.
37. Smith CL. Smoke detector operability survey-report findings. Bethesda (MD): U.S. Consumer Product Safety Commission; 1993 Nov.
38. Gotsch KE, Annest JL, Mercy JA, Ryan GW. Surveillance for fatal and nonfatal firearm-related injuries-United States, 1993–1998. In: CDC surveillance summaries; 2001 Apr 13. MMWR 2001;50 (No. SS-2).
39. Dept of Transportation (US), National Highway Traffic Safety Administration (NHTSA). Traffic Safety Facts: Children. Washington (DC): NHTSA; 2010. Available at URL: http://www-nrd.nhtsa.dot.gov/Pubs/811387.pdf
40. Crime in the United States 2009: uniform crime reports--arrests [database on the Internet]. Washington (DC): US Department of Justice, Federal Bureau of Investigation. 2009 - [cited 2012 Feb 3]. Available from: http://www2.fbi.gov/ucr/cius2009/arrests/index.html.
41. Centers for Disease Control and Prevention. Vital Signs: Alcohol-Impaired Driving Among Adults— United States, 2010. MMWR 2011; 60(39);1351-1356.

State Injury Indicators: Instructions for Preparing 2010 Data | 57
42. US Department of Transportation, National Highway Traffic Safety Administration (NHTSA). Traffic safety facts 2006: alcohol-impaired driving [monograph on the Internet]. Washington (DC): NHTSA; 2008 [cited 2012 Jan 27]. Available from: http://www-nrd.nhtsa.dot.gov/Pubs/810801.PDF.
43. Thomas C, Butler J, Davies M, Johnson R. State Injury Indicators Report, second edition—1999 data. Atlanta (GA): Centers for Disease Control and Prevention, National Center for Injury Prevention and Control; 2004.
44. Faul M, Xu L, Wald MM, Coronado VG. Traumatic Brain Injury in the United States: Emergency Department Visits, Hospitalizations and Deaths 2002–2006. Atlanta (GA): Centers for Disease Control and Prevention, National Center for Injury Prevention and Control; 2010.
45. Thurman D, Alverson C, Dunn K, Guerrero J, Sniezek J. Traumatic brain injury in the United States: A public health perspective. J Head Trauma Rehabil 1999;14(6):602–15.
46. Corrigan JD, Whiteneck G, Mellick D. Perceived needs following traumatic brain injury. J Head Trauma Rehabil 2004;19(3):205–16.


CS231388