2010 tomato journeys from farm to fruit shop: greenhouse ... · tomato journeys from farm to fruit...
TRANSCRIPT

University of WollongongResearch Online
University of Wollongong Thesis Collection University of Wollongong Thesis Collections
2010
Tomato journeys from farm to fruit shop:greenhouse gas emissions and cultural analysisKatherine RoggeveenUniversity of Wollongong
Research Online is the open access institutional repository for theUniversity of Wollongong. For further information contact the UOWLibrary: [email protected]
Recommended CitationRoggeveen, Katherine, Tomato journeys from farm to fruit shop: greenhouse gas emissions and cultural analysis, Master of Science –Research thesis, School of Earth and Environmental Sciences, University of Wollongong, 2010. http://ro.uow.edu.au/theses/3325


TOMATO JOURNEYS FROM FARM TO FRUIT SHOP:
GREENHOUSE GAS EMISSIONS AND CULTURAL ANALYSIS
A thesis submitted in fulfilment of the
requirements for the award of the degree
MASTER OF SCIENCE – RESEARCH
from
UNIVERSITY OF WOLLONGONG
by
KATHERINE ROGGEVEEN, BA/BSc
SCHOOL OF EARTH AND ENVIRONMENTAL SCIENCES
2010

i
ABSTRACT
This study ‘follows’ greenhouse-grown tomatoes from farms to Sydney fruit shops to
investigate some of the practicalities around accounting for greenhouse gas (GHG)
emissions in fresh food. These issues affect the feasibility and reach of campaigns such as
‘food miles’, which aim for consumer-led supply chain emission reductions. I do so by
deploying two seemingly contrasting approaches: one based on a quantitative accounting
of energy, water and waste, the other based on ‘following’ the food in a cultural research
framework. Data was collected from semi-structured interviews of farmers, wholesalers at
Sydney Markets and Sydney fruit shop owners. The study estimates GHG emissions by
applying quantitative methodologies including the National Greenhouse Account Factors.
Water and waste issues are considered. The study also qualitatively analyses stakeholder
views and knowledge by identifying and discussing themes throughout the interview texts.
The study starts from the consumer standpoint where people concerned about climate
change might seek to purchase the most GHG-efficient tomatoes, and from there looks
back into the supply chain to examine how well this information can be provided to the
consumer. The study concludes that on its own, food miles is not a suitable indicator for
comparing GHG emissions from different chains of one product. Transport fuel was found
to be a substantial source of GHG emissions from a particular chain only in some cases.
Other factors, particularly stationary energy use, can have a greater impact on a business’s
GHG emission profile. On-farm GHG emissions appear far greater than emissions from fuel
used for transport to market, per unit of tomatoes sold or carried. They also appear much
greater, per unit of tomatoes, than GHG emissions at wholesalers or retailers.
Further, across-the-board life cycle assessment (LCA) or even food mile labelling would
probably not be practical for accurate appraisal of actual daily journeys of fresh fruit and
vegetables going through the central market. Variance of business practices can result in
substantial differences in the GHG emissions associated with two versions of the final
product (in this case 1kg of tomatoes) sitting side-by-side in a fruit shop. Different business
practices and use of resources also complicates development of standard methods to
collect and communicate accurate information down the chain.
Costs and availability of lower GHG-emitting practices are assessed as the key factors for
potential change among higher emitting participants. There does not appear to be great

ii
prospect for reducing GHG emissions in this tomato chain via cooperation between actors
along the chain. Increasing their knowledge of climate change and the connection to their
business would be beneficial. Their knowledge about the weather could be built on in this
context. At the same time, several participants displayed a lack of quantitative knowledge
about their business’s resource inputs. Further research into the reasons behind this could
lead to better ways to reduce water use and waste, as well as GHG emissions.
Even without carbon labelling or food mile labelling as an ultimate aim, following Australian
fresh food chains through contrasting epistemologies and methods could help reduce GHG
emissions, by identifying particular areas along the chain to target reduction efforts.

iii
ACKNOWLEDGEMENTS
My first thank you goes to Professor Lesley Head for welcoming me through her open door
nearly three years ago, and for her ongoing supervision and guidance. In particular, Lesley’s
encouragement to let the project unfold, together with her confidence and general
calmness, helped me no end.
Thank you also to Professor Chris Gibson, especially for his insightful comments on the final
draft. Also to Dr Jenny Atchison, for her advice on interview technique and for sharing many
useful references.
Dr Sophie Parks and Jeremy Badgery-Parker from the NSW Department of Industry and
Investment introduced me to greenhouse horticulture and the NSW fresh tomato industry,
including several research participants. I also acknowledge the Department’s sponsorship
to attend the 2009 Australian Hydroponic and Greenhouse Association conference.
Many thanks go to the research participants for their time and willingness to share
information for this project. In addition, Gerard McEvilly of Horticulture Supply Chain
Services provided useful insights into the fresh vegetable supply chain and introduced me
to other business people in the sector. Andrew Conway and Tom Rafferty helped me with
advice on growing media and freight logistics respectively.
Thank you to the staff and students from the Australian Centre for Cultural Environmental
Research and the School of Earth and Environmental Sciences. Thank you to the academics
who encouraged me. My conference posters benefited from Penny Williamson’s patience
with Powerpoint, and I appreciated Wendy Weeks’ and Denise Alsop’s administrative
support. Thank you to the students with whom I’ve shared study spaces, especially
Christine Eriksen and Andrew Warren this year, and of course Pat Macquarie for sharing her
desk. Positive outlooks and the sound of fast typing spurred me on.
I thank my family and friends for their interest, encouragement and support during the past
three years. Jill Bell has been both a great listener and a source of practical help. My
daughter Eleanor has been remarkably understanding of my study demands. My greatest
thanks go to Sam for always encouraging, and never pressuring, me in this endeavour, and
for his patient reviewing of drafts.
iv
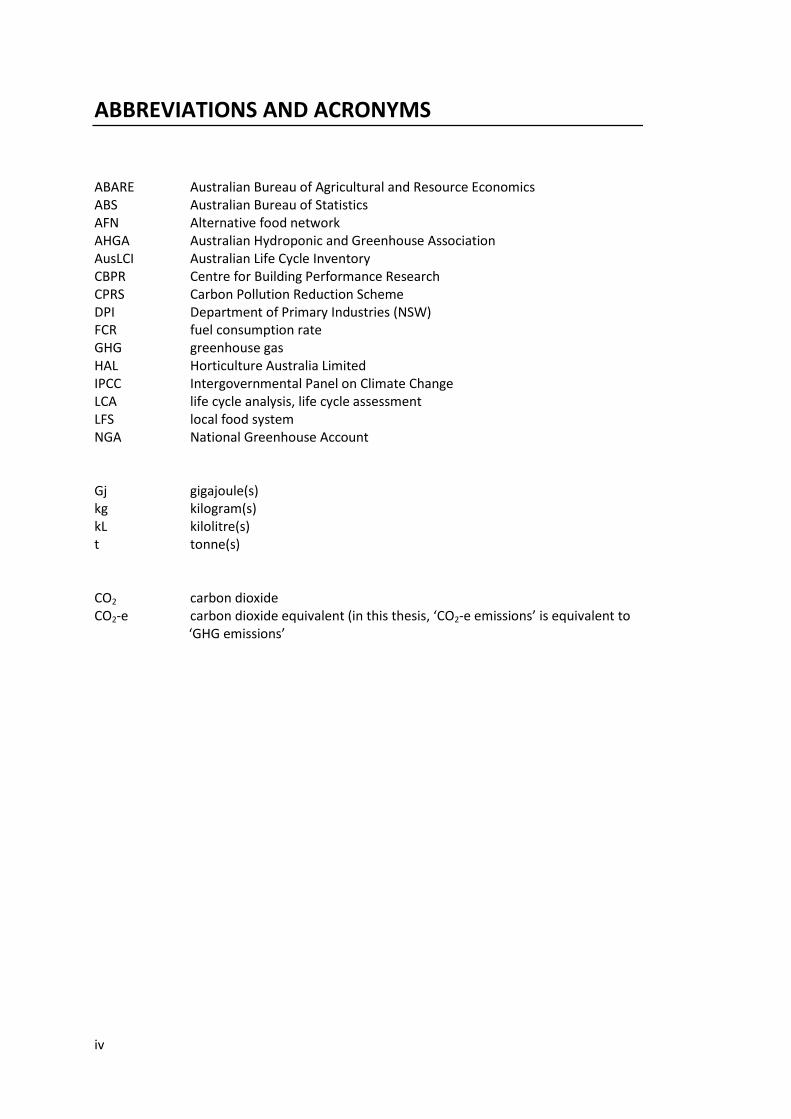
ABBREVIATIONS AND ACRONYMS
ABARE Australian Bureau of Agricultural and Resource Economics ABS Australian Bureau of Statistics AFN Alternative food network AHGA Australian Hydroponic and Greenhouse Association AusLCI Australian Life Cycle Inventory CBPR Centre for Building Performance Research CPRS Carbon Pollution Reduction Scheme DPI Department of Primary Industries (NSW) FCR fuel consumption rate GHG greenhouse gas HAL Horticulture Australia Limited IPCC Intergovernmental Panel on Climate Change LCA life cycle analysis, life cycle assessment LFS local food system NGA National Greenhouse Account Gj gigajoule(s) kg kilogram(s) kL kilolitre(s) t tonne(s) CO2 carbon dioxide CO2-e carbon dioxide equivalent (in this thesis, ‘CO2-e emissions’ is equivalent to
‘GHG emissions’

v
TABLE OF CONTENTS
ABSTRACT ....................................................................................................................... i
ACKNOWLEDGEMENTS .................................................................................................. iii
ABBREVIATIONS AND ACRONYMS ..................................................................................iv
TABLE OF CONTENTS ...................................................................................................... v
LIST OF FIGURES ........................................................................................................... viii
LIST OF TABLES ............................................................................................................... ix
1 INTRODUCTION ........................................................................................................... 1 1.1 Climate change and food choices ........................................................................... 1
1.1.1 Local food, food miles, and carbon labelling ..................................................... 2 1.1.2 Food choices – scale and reach .......................................................................... 3
1.2 Approaching ‘tomato journeys’ .............................................................................. 4 1.3 Aims ........................................................................................................................ 6 1.4 Thesis structure ...................................................................................................... 6
2 FRAMING THE AUSTRALIAN TOMATO .......................................................................... 8 2.1 Climate change and the agri-food chain ................................................................ 8 2.2 Geographies of food ............................................................................................. 10
2.2.1 Following .......................................................................................................... 11 2.3 Political economy commodity chain approaches ................................................. 13 2.4 Culture, consumers and the food chain ............................................................... 15
2.4.1 Popular literature ............................................................................................. 17 2.5 Local food ............................................................................................................. 18 2.6 Food miles, LCA, embodied energy and GHG emissions ...................................... 20
2.6.1 Food miles in Australia ..................................................................................... 21 2.6.2 Life Cycle Assessment (LCA) and carbon labelling ........................................... 22 2.6.3 Embodied energy and GHG emissions ............................................................. 25 2.6.4 What the Australian vegetable industry and supply chain is doing on carbon footprinting ................................................................................................................... 26
2.7 The tomato ........................................................................................................... 28 2.7.1 Greenhouse-grown tomatoes and an industry overview ................................ 32 2.7.2 Protected cropping / greenhouse-grown vegetables and tomatoes ............... 34
2.8 The gaps: where this project fits .......................................................................... 35
3 METHODOLOGY ........................................................................................................ 37 3.1 General approach to tomato case study .............................................................. 37 3.2 Industry familiarisation and participant recruitment ........................................... 38 3.3 Ethics..................................................................................................................... 48 3.4 Interviews ............................................................................................................. 48 3.5 Quantitative methods .......................................................................................... 49 3.6 Some notes on sources in Table 5 and methods used ......................................... 54
3.6.1 Land clearing .................................................................................................... 54 3.6.2 Fuel consumption rates (FCRs) for articulated and rigid trucks ....................... 54 3.6.3 Fertilisers .......................................................................................................... 54 3.6.4 Buildings ........................................................................................................... 55 3.6.5 Allocation ......................................................................................................... 57
3.7 Qualitative methods ............................................................................................. 58

vi
4 TOMATO JOURNEYS AND THEIR GHG EMISSIONS ....................................................... 63 4.1 Evaluation of overall results – GHG emissions ..................................................... 63
4.1.1 Farms ................................................................................................................ 69 4.1.2 Wholesalers ...................................................................................................... 73 4.1.3 Retailers ............................................................................................................ 74 4.1.4 Comparing farms to wholesalers to retailers ................................................... 75 4.1.5 Comparing farms to transport .......................................................................... 77
4.2 Deeper analysis of farm embodied energy and associated GHG emissions ......... 80 4.2.1 Vehicles and machinery .................................................................................... 80 4.2.2 Deeper analysis for Farm D .............................................................................. 81 4.2.3 Deeper analysis for Farm A ............................................................................... 82
4.3 Evaluation of overall results – waste .................................................................... 84 4.4 Evaluation of overall results – water .................................................................... 85 4.5 CONCLUSIONS ....................................................................................................... 86
5 STAKEHOLDER VIEWS AND KNOWLEDGE .................................................................... 87 5.1 Introduction .......................................................................................................... 89 5.2 Connecting with tomatoes .................................................................................... 90
5.2.1 Participant-tomato connections and interactions ........................................... 90 5.2.2 A tomato is a tomato… right? Tomato terms, brands and confusion .............. 91
5.3 Climate, weather and the environment ............................................................... 95 5.3.1 The weather and seasons ................................................................................. 95 5.3.2 Climate change ................................................................................................. 99 5.3.3 Water .............................................................................................................. 101 5.3.4 Waste .............................................................................................................. 102
5.4 Control and reliance ............................................................................................ 104 5.4.1 Climate control (through technology) ............................................................ 105 5.4.2 Energy availability and security ...................................................................... 105 5.4.3 Reducing energy use ....................................................................................... 106 5.4.4 People and expertise ...................................................................................... 106 5.4.5 Business control (and reliance) ...................................................................... 108 5.4.6 Weather .......................................................................................................... 110 5.4.7 Reliance on others in the supply chain ........................................................... 111 5.4.8 Other types of control and reliance ............................................................... 112
5.5 Relationships ....................................................................................................... 113 5.6 Potential to change ............................................................................................. 116
5.6.1 High-end GHG emitters – the figures versus the participants’ focus ............. 116 5.6.2 Indicators of drivers and willingness to change ............................................. 117
5.7 Conclusions ......................................................................................................... 119
6 DISCUSSION ............................................................................................................ 122 6.1 Bringing together stakeholder views and knowledge with tomato journeys and their GHG emissions ......................................................................................................... 122
6.1.1 Knowledge and views affect journeys ............................................................ 123 6.1.2 Knowledge and views affect accounting of GHG emissions (ie. methods) .... 124
6.2 Tradeoffs between water, waste and GHG emissions ........................................ 124 6.3 The ‘following’ approach .................................................................................... 125 6.4 Quantitative methods ......................................................................................... 126
6.4.1 Allocation ........................................................................................................ 126 6.4.2 Available methodologies ................................................................................ 127 6.4.3 Application of quantitative methodologies .................................................... 130 6.4.4 Participants ..................................................................................................... 130

vii
6.5 Policy relevance – bringing together the results and the methods ................... 130 6.5.1 Usefulness of obtainable transport information (food miles) ....................... 130 6.5.2 Usefulness of GHG emission data from the business level – using stationary energy as an example .................................................................................................. 131 6.5.3 Effort (and investment) required by actors not conducive to positive change 132 6.5.4 Accuracy and currency of information to consumers .................................... 134 6.5.5 Many chains in one economy – implications of methods for policy .............. 135 6.5.6 Economic price signals and interactions through the supply chain ............... 135 6.5.7 Considering another option – picking hotspots ............................................. 137 6.5.8 Something more strategic... but a challenge to achieve ................................ 138 6.5.9 Linking back to national GHG emissions reporting ........................................ 139
6.6 Individual examples from the study that could be pursued .............................. 140 6.6.1 Farms .............................................................................................................. 140 6.6.2 Wholesalers .................................................................................................... 141 6.6.3 Refrigeration .................................................................................................. 141
6.7 Reflection on my own position in relation to the study ..................................... 141 6.7.1 Personal background ...................................................................................... 141 6.7.2 Interpretive judgements ................................................................................ 142 6.7.3 Story choices .................................................................................................. 142
6.8 Suggestions for future research, limitations of this study ................................. 143
7 CONCLUSION ............................................................................................................ 145
Bibliography ............................................................................................................... 150
APPENDIX A – Participant Information Sheet
APPENDIX B – Consent Form
APPENDIX C – Interview Questions
APPENDIX D – Data Recording Form
APPENDIX E – GHG Emissions from transport scenarios between farms and Sydney Markets, and Sydney Markets and retailers
APPENDIX F – GHG calculations for each participant
APPENDIX G – Additional analysis of Farm D
APPENDIX H – Additional analysis of Farm A
APPENDIX I – Raw results

viii
LIST OF FIGURES
Figure 1. Project framework. .................................................................................................... 4
Figure 2. Newspaper advertisement for American Express, The Sydney Morning Herald, 29 June 2010. ............................................................................................................ 29
Figure 3. Case study scope. .................................................................................................... 40
Figure 4. Medium-tech growing: plants in bags, gutter at floor-level. .................................. 41
Figure 5. Medium-tech growing: blow heater rather than floor heating. ............................. 41
Figure 6. High-tech growing: raised gutter, heating pipes on floor. ...................................... 42
Figure 7. High-tech growing: Greenhouse roof that opens, circulation fans. ........................ 42
Figure 8. Very high-tech growing: glasshouse. ....................................................................... 43
Figure 9. Very high-tech growing: additional heating pipe, ability to supply CO2 to plants, white equipment to reflect light. ......................................................................... 43
Figure 10. Web of themes centred around control and reliance concepts. .......................... 62
Figure 11. Coal-fired water heater is located in shed behind front-end loader. ................... 72
Figure 12. Some of the fresh produce stored by Wholesaler B. ............................................ 74
Figure 13. Schematic diagram of relative CO2-e emissions for stationary energy use, fuel and solid waste, per tonne of tomatoes by businesses/sections of tomato journey. 76
Figure 14. Two potential tomato journeys and associated Scope 1 and 3 CO2-e emissions for stationary energy use, fuel and solid waste. ....................................................... 77
Figure 15. Pallet loads of mixed produce waiting at Sydney Markets to be transported to different retail stores. .......................................................................................... 80
Figure 16.Tomatoes at Steve’s fruit shop. .............................................................................. 89

ix
LIST OF TABLES
Table 1. Tomato production 2008-2009, by type and state. ................................................. 31
Table 2. Value of tomatoes produced, Australia, 2007-2009. ............................................... 31
Table 3. Vegetable selling methods 2007-2008, percentage of farms. ................................. 34
Table 4. Participant pseudonyms and characteristics. .......................................................... 44
Table 5. Methods and data sources. ...................................................................................... 52
Table 6. Steps undertaken in qualitative analysis. ................................................................. 59
Table 7. Applying NGA factors to raw data for energy use.................................................... 64
Table 8. Applying NGA factors to raw data for waste. ........................................................... 66
Table 9. Total CO2-e emissions (t) per tonne of tomatoes, by participant. ........................... 67
Table 10. Water and waste per tonne of tomatoes, by participant. ..................................... 68
Table 11. Fuel combusted for stationary energy purposes. .................................................. 70
Table 12. Transport from farms to Sydney Markets and from Sydney Markets to retailers. 78
Table 13. Energy coefficients of vehicles and implements. ................................................... 81
Table 14. Business and personal connections to tomatoes. .................................................. 91
Table 15. Tomato terms. ........................................................................................................ 94
Table 16. Views on the weather ............................................................................................ 97
Table 17. Comments on seasons. .......................................................................................... 98
Table 18. Views on reducing GHG emissions or energy use. ............................................... 100
Table 19. Farmers’ views on reliance on people. ................................................................ 106
Table 20. Farmer expertise and control over the plant and its environment. .................... 107
Table 21. Business control. .................................................................................................. 109
Table 22. Participant views on reliance and control within the supply chain. .................... 111
Table 23. Elements of suspicion or scepticism about others in supply chain. ..................... 115
Table 24. More farmer-wholesaler relationship aspects. .................................................... 116


1
1 INTRODUCTION
Governments ask citizens to play a role in combating climate change by making
environmentally ‘responsible’ decisions in their everyday lives and via purchasing decisions.
The first item on the homepage of the Australian Government’s Department of Climate
Change and Efficiency (as at 6 June 2010) stated:
Climate change: get involved: Your actions count! You can take direct action to make yourself and your home more environmentally friendly. Check out what you can do, and how the Government can help (Commonwealth of Australia 2007-2010 (a)).
Readers can go to another webpage that explains how they can make a difference as
individuals, including by reducing their carbon footprint:
Everyday choices can make a difference: from how you travel, to saving energy, to your shopping choices.
This thesis takes this assumption to task through a desire to explore just how easy or difficult it
is as consumers to make decisions about purchasing commodities. It does so by focusing on
one simple commodity – the fresh tomato – and tracing its greenhouse gas (GHG) ‘journey’.
1.1 Climate change and food choices
The Foreword to the Climate Change 2007: Synthesis Report said in straightforward terms,
‘…climate change is occurring now, mostly as a result of human activities…’ (Intergovernmental
Panel on Climate Change 2008, piii). Garnaut (2008, pxvii) stated up front in his Climate
Change Review that ‘the outsider to climate science has no rational choice but to accept that,
on a balance of probabilities, the mainstream science is right in pointing to high risks from
unmitigated climate change’. The Australian Government is ‘strongly committed to reducing
Australia's carbon pollution’ (Commonwealth of Australia 2007-2010 (b)).
International negotiations on how to deal with this global challenge continue but at a slow
pace, given the huge task and predicted timeframes for irreversible damage to the
environment. Domestically too, vested interests, politics and scepticism about climate change
have to date quashed passage of legislation to install a national emissions trading scheme. On
27 April 2010, the Australian Prime Minister announced that the Government would not
introduce the Carbon Pollution Reduction Scheme until at least the end of 2012, and then only

2
when there is greater clarity on the actions of other major economies (Commonwealth of
Australia 2007 - 2010 (c)).
While government cannot agree on international or overarching domestic frameworks to drive
practical mitigation actions, it still urges citizens to do their bit. Large-scale political inaction
might even trigger concerned citizens to act, perhaps focusing on their own immediate sphere
of influence. The citizen is encouraged by a plethora of books, media items and websites about
how to make a difference within their own households and daily lives. Initiatives range from
improving household insulation and installing solar panels, to buying more energy efficient
whitegoods and catching public transport.
1.1.1 Local food, food miles, and carbon labelling
One common recommendation is to buy local food or food with reduced ‘food miles’(Sydney
Food Fairness Alliance 2006, p3), although increasingly consumers are advised to weigh this up
with elements of food production other than transport, such as seasonality (Galvin 2008, p22;
United Nations Environment Management Group & United Nations Environment
Programme/GRID Arendal 2008,p 106; Hickman 2010). Surely food is an area where almost
anyone can make a difference? Everyone has to eat. Food purchases have to be the most
common and frequent shopping conducted by the vast majority of households – why not make
the fresh food sector as efficient as possible?
‘Food miles’ is one angle of the local food concept (itself a debatable concept – what is
‘local’?), though was not coined specifically to support it. Formed in the 1990s in the UK, ‘food
miles’ refers to the distance travelled by food articles between where they are grown and
where they are consumed (Smith et al. 2005, p2). However, when used in its most basic form –
‘buy local’ or promotion of labelling based solely on distance travelled – ‘food miles’ puts
prime focus on the transport leg of the supply chain, and may not even consider the type of
fuel or mode of transport used.
Food miles is a relatively new concept in Australia and published literature and studies here
are few. With our significant geographical national scale, studying domestic food travel in an
Australian context could supplement international literature, much of which is focused on
European examples (though Northern American studies and attention are greater than
Australian).

3
But for genuine climate change mitigation at the consumer choice level, more than food miles
needs to be studied. More comprehensive information regarding a product’s embodied GHGs
is required. ‘Carbon labelling’ is a term often used to indicate product labelling based on more
comprehensive accounting of GHGs from a product’s production and/or supply chain (Hogan &
Thorpe 2009, p2).
1.1.2 Food choices – scale and reach
So I begin this project with the consumer in mind, considering what concerned people can do
to help reduce GHG emissions through their everyday food shopping. People base food
purchase decisions on a range of factors (see, for example, Scheibehenne et al. 2007), only one
of which might be concern about climate change. While some consumers might join
alternative food networks such as community supported agriculture, or fruit and vegetable box
delivery schemes, many would not. For consumers who shop in conventional food shops but
who would buy one item of food over another based on lower embodied GHG emissions,
information is needed to make the right choice. It is within these contexts that I investigate the
fresh food supply chain (including on-farm through wholesalers to retailers) to see if a rule-of-
thumb concept like ‘food miles’ or ‘local food’, or more comprehensive GHG emission
labelling, is worthwhile for Australian consumers, as a practical method to reduce significantly
the nation’s GHG emissions. In other words, can concepts that might work in an alternative
food network be scaled up to the conventional food economy to make a substantial national
contribution to climate change mitigation?
For such ‘scaling up’ to work, information-flow is required between industry and shoppers.
This thesis is concerned with the question of how feasible it is to collect such information and
provide it to consumers in an effective manner. Figure 1 summarises the key contexts and
focus of this project, which emphasise sub-national supply chains and the moment of
consumer choice as a site of action in response to climate change. This focus is not to suggest
that other scales are unimportant, nor that the sub-national scale has any ontological ‘reality’
separate from national and global scales. Rather, because the supply chains ‘followed’ in this
thesis unfurled at a scale connecting Sydney with other parts of Australia, in this thesis a
boundary was drawn around Australia’s domestic fresh tomato industry.

4
Figure 1. Project framework.
As well as those concerned with mitigating climate change, there are many other voices
focusing on intersections between food supply and people and how these warrant
consideration of justice, ecology and ethics. As discussed by Pollan (2010), the ‘food
movement’ or ‘movements’ include(s) people concerned with food access for various groups
of people; public health; food safety; animal welfare; genetically modified organisms; ‘food
sovereignty’; land use; and more. At times, combinations of voices concerned with modern
food agree on strategies and actions, at other times they contradict (Pollan 2010). This project
approaches the fresh food supply chain through the lens of climate change mitigation, while
acknowledging the broader social justice context of food.
1.2 Approaching ‘tomato journeys’
This project can be seen as one of ‘colliding epistemologies’ (Brown & Knopp 2008, p41) as I
draw on both the relational ‘following’ approaches of authors such as Cook et al (2006) and
Barndt (2008), and life cycle analysis (LCA)-type quantitative methods. I am interested in what
these seemingly contrasting epistemologies might offer in terms of making more transparent
the GHG impacts of food production.
Global - climate change
- international mitigation ef forts
- international supply chains and consumers
National
- greenhouse gas emissions
- mitigation efforts, broader policies
and regulation
Industry (or industries)
•Conventional food supply chains
Shoppers
•Conventional food market
Change via
consumer
demand requires
product
information
OVERALL THESIS
CONCEPT: Can
consumer demand for
‘greener’ f resh food
substantially reduce
national emissions?
Governments ask
citizens to change
shopping behaviours
PROJECT FOCUS: How
feasible is it to collect &
distribute accurate
information?

5
I investigate the conventional supply chain of fresh, greenhouse-grown tomatoes sold in
Sydney fruit and vegetable shops. Specifically, I focus on greenhouse-grown tomatoes farmed
within the Sydney basin, regional NSW and interstate; supply chains with differing transport
components. Transport and farms, wholesalers at the central market and retailers are
considered in a LCA-type study. As well as energy and fuel use, water use and waste are
investigated, in part for their contribution to GHG emissions, but also as individually significant
environmental issues for the horticulture sector. Using data provided by participants during
semi-structured interviews and subsequent communications, I estimate minimum GHG
emissions per kilogram of tomatoes sold or transported.
In addition, drawing on qualitative geographical research methods, I examine participants’
connections to the tomatoes they grow, transport or trade, and their views on the potential to
reduce GHG emissions from the supply chain. Using both types of data and analysis enables
discussion about the potential for the supply chain to reduce GHG emissions from one food
type. Although the project does not extend to interviewing consumers, the project has them
firmly in mind, as the purpose of food labelling would be consumer information. There is a
substantial literature on consumer decision-making, as discussed in Chapter 2.
The unprocessed tomato appears a simple, nutritious fresh vegetable – seemingly a good food
candidate to prioritise for production and GHG efficiency. It is almost a staple and is significant
to many cuisines and cultures. In Australia its consumption grew steadily in the last quarter of
the 20th century (Australian Government Department of Agriculture Fisheries and Forestry
2009, p67). The tomato also symbolises industrial agriculture. It is a major horticultural
commodity, both fresh and processed. Tomatoes and potatoes are the major vegetable crops
grown in Australia (Crooks 2009, p4). As a crop, tomatoes have long been researched and
developed in terms of new varieties, including genetic modification. It is with these factors in
mind, particularly their wide-spread consumption, that I chose tomatoes as the food to follow
in this study.

6
1.3 Aims
1. To pursue two different ways of tracing fresh tomato journeys, one based on a cluster
of quantitative GHG accounting methods and the other based on a relational cultural
geographical approach.
2. To analyse the fresh food supply chain for one commodity – fresh tomatoes – sold in
Sydney fruit shops, including to estimate GHG emissions where possible, and to assess the
availability of accurate information about a food’s GHG emissions;
3. To examine the feasibility of collecting food chain GHG emission information and
communicating it to shoppers, when the purpose for such an effort is to substantially reduce
the community’s GHG emissions through consumer demand;
4. Based on contrasting quantitative accounting and qualitative ‘following’ methods:
identify other ways the conventional fresh food supply chain could become more GHG
efficient; and examine trade-offs between climate change mitigation and other environmental
concerns, specifically water use and waste.
1.4 Thesis structure
The thesis consists of seven chapters. Following this introduction, the literature review draws
together key writings from the international and Australian academic and grey literatures on
food miles, food geography, consumer choice, horticulture and tomatoes, GHG emissions and
embodied energy and accounting methods. The literature review provides a rationale for the
project.
The third chapter outlines the quantitative and qualitative methods. I provide further context
and scope to the case study, and explain practical boundaries and limitations of available
methods.
Chapter 4 contains results from the quantitative analysis, with estimates of GHG emissions,
water use and waste from participants at farming, wholesale and retail levels of the tomato
supply chain. Combined with estimates of GHG emissions from fuel use in transport legs
between these three stages, I present various plausible tomato journeys, as well as
comparisons between different actors and stages of the chain.

7
The fifth chapter provides qualitative analysis of stakeholder views and knowledge about their
tomatoes, weather, climate change and ability to reduce GHG emissions from their supply
chain, business priorities, energy, water use and waste. I also present an analysis of the
interview texts as seen through a language of control and reliance. This, together with analysis
of relationships in the chain, enables further insight into the industry’s potential to contribute
to mitigation of climate change.
Chapter 6 draws together both sets of results and brings them back to two scales: the
community as a whole (that is, potential for impact on reducing GHG emissions) and the
consumer. I do this by reflecting on the results and the literature review to look at the
practicalities of providing food miles or more comprehensive life cycle information to
consumers. I also reflect on my approach to the study and potential influences on results. The
final chapter draws together specific and broader conclusions from the project.

8
2 FRAMING THE AUSTRALIAN TOMATO
This is an interdisciplinary project, because to address the project aims, I needed to investigate
climate change mitigation, horticulture, food geography, supply chains, consumer choices, and
methods such as LCA and embodied energy. Coverage crosses international and Australian
research, and academic, gray and popular literature. Reviewing this literature is important
both to the ‘why’ and ‘how’ questions of this project; showing not only relevance but the
background to my research methods. It shows the breadth of the concepts involved in food
sustainability, and the complexity of seemingly simple climate change mitigation actions (like
the prospect of a concerned consumer choosing one tomato over another).
I begin this chapter by situating the Australian fresh agri-food sector within the climate change
context. I then draw on several overlapping fields of research, including food geographies,
political-economic commodity and consumer research. While there has been much discussion
about reconnections between producers and consumers, and between different research
areas, calls remain for focus on different approaches and parts of the chain. Local food, food
miles and then the more comprehensive concepts of LCA and embodied energy and emissions
are reviewed. I then explore what the Australian vegetable industry is considering in relation to
measuring GHG emissions, and provide an overview of the fresh tomato industry in Australia.
Finally, I tie these areas together to provide the rationale for this project.
2.1 Climate change and the agri-food chain
Lockie and Pritchard’s edited book following the 1998 conference of the Agri-Food Research
Network aimed ‘to point out that the social and environmental impacts of food production and
consumption are among the most fundamental issues facing contemporary human societies’
(2001a, p1). They referred to newspaper headlines about mad cow disease, genetically
modified foods, labelling and animal welfare, and stated that ‘concerns about environmental
sustainability and food safety have moved into the mainstream of contemporary politics’
(2001b, p1). A decade on and one has to add concerns about climate change to this list.
The Intergovernmental Panel on Climate Change (IPCC) not only sets out the key climate
change science, but analyses costs, policies and technologies intended to limit the extent of
climate changes yet to come (Intergovernmental Panel on Climate Change 2008, piii). A range
of non-climate-related factors drive the consumption patterns and human activity that causes
anthropogenic GHG emissions (Barker et al. 2007, p669). The IPCC review of the literature

9
found that most climate change mitigation has been ‘an outgrowth of efforts driven by
economic, security, or local environmental concerns’ (Barker et al. 2007, p669). It concludes
that ‘the most promising policy approaches, then, will be those that capitalize on natural
synergies between climate protection and development priorities to advance both
simultaneously’ (Barker et al. 2007, p669).
Putting into practice major climate change mitigation policies is not simple. Competing
interests, particularly economic, are evident in failures to reach agreement at the international
level (witness the United Nations Climate Change Conference, Copenhagen 2009) and in
Australia. The Rudd Government’s proposed Carbon Pollution Reduction Scheme did not
include agriculture; instead government worked with the sector to consider other ways that
agriculture could contribute to national GHG emission reductions. While agriculture produces
approximately 16 per cent of Australia’s emissions (Department of Climate Change and Energy
Efficiency 2010b, p190), they are complicated to measure from large numbers of farms with
different forms of farming, soil and climatic conditions. The agri-food system will be affected
by both climate change (Garnaut 2008, p535; Department of Climate Change and Energy
Efficiency 2010a) and by mitigation measures such as an emissions trading scheme. Farmers
should also anticipate higher prices for farm inputs and services. Other elements of the agri-
food chain, such as transport and retail, would be affected even if agriculture was technically
excluded from such a scheme.
Horticulture is estimated to contribute less than two per cent of Australia’s agricultural GHG
emissions (calculated from Garnaut 2008, p168, Table 7.2), but can be expected to have
relatively high GHG emissions per unit area (Australian Greenhouse Office 2002, p28;
O'Halloran et al. 2008, p18). This is due particularly to high application rates of nitrogen
fertiliser (O'Halloran et al. 2008, p18). Yet the relatively high level of control over horticultural
systems provides opportunities to reduce GHG emissions (Australian Greenhouse Office 2002,
p28; Deurer et al. 2008, p11). So studying a common horticultural product such as tomatoes, in
terms of their embodied GHG emissions and the supply chain’s ability to reduce those
emissions, is warranted.

10
2.2 Geographies of food
Connections and reconnections between food production and consumption have been a key
theme in the food geography literature of the past 10-15 years. Some studies come from the
production end of the agri-food chain, while others start at the consumption end. They
investigate part or all of the chain, and some do so by ‘following’ food as the non-human
object. Others explore particular food systems, such as alternative food networks. Among the
literature are debates about geographic concepts such as ‘place’ and ‘local’, and
methodological and theoretical debates about how to make these reconnections.
Many scholars across the disciplines have noted the changing nature of research into agri-food
production-consumption in the latter years of the twentieth century and into the beginning of
the twenty-first century. Examples include Hartwick (1998, p424-425), Lockie and Kitto (2000,
pp3-4), Whatmore (2002, p123), Fold and Pritchard (2005, p13) and Fagan (2006, p34).
Hartwick proposed more direct links between the geographies and politics of consumption, so
that consumers could use ‘geoknowledge’ to change consumption practices and act politically
in everyday consumption (Hartwick 1998, pp 423, 434).
Cook (reviewing others who were doing the same) considered what the changing research
focus meant for research methods, as food geographers grappled with how to bridge the
divide between ‘an agricultural geography/agro-food studies literature dominated by political
economy and quantitative methods, and a cultural studies of food literature dominated by
poststructuralism and qualitative research’ (Cook 2006, p657). Among the mix is whether to
take a postdisciplinary approach of ‘following the food’ and addressing the connections and
ideas that are identified, regardless of which discipline they happen to fall into (Cook 2006,
p657). My project fits more closely with the ‘attempt to bridge the divide’ category, because
from the outset I seek to assess the feasibility of a potential policy approach.
In his reviews of trends in (mainly European) food geography literature, Winter (2003b; 2004;
2005) identified four overlapping reconnections: between farming and food, food and politics,
food and nature and farmers and agency. More global markets, as well as the alternative food
networks (AFNs) which some see as a response to them, have led farmers to reconnect with
the food market (Winter 2003b, p506). Winter concluded that these two forces led to the
politicization of food, with food politics becoming mainstream (Winter 2004, p664). They,

11
farmers and social aspects of farming, have been subjects of significant academic study
(Winter 2003b, pp509-10; 2004; 2005, p614), including through ethnographic studies.
Winter discussed debates about how to deal with nature within agro-food research (and the
broader social sciences (Winter 2005, p609)), especially between actor network theory
proponents and more variable hybrid geographies (Winter 2003b, p509; Winter 2005, pp609-
613). He emphasized how Whatmore’s work moved the literature from more distinct agri-food
and cultural studies separating production and consumption, to a more hybrid geography, by
focusing on the non-human actor moving through the food chain, and thereby drawing out the
complex networks involved (Winter 2005, pp609-610).
Winter also pointed to the linking of foods and certain natures through ‘reterritorialization’
and noted that it has not been geography but a broadened agricultural systems approach that
has investigated marketing links between food and nature (Winter 2005, p611). He also
referred to debate over whether marketing of sustainably-produced products helps internalise
negative externalities. Some researchers are positive but others are more pessimistic about
the ‘conventionalisation’ of, for example, organics, once agribusiness is involved (Winter 2005,
p612); see for example Lyons et al (2004), Lockie et al (2006), and Eden et al (2008, pp1045-
1046).
2.2.1 Following
Whatmore’s 2002 book Hybrid Geographies was seminal (Winter 2005, p609). Her account of
two aspects of the genetically modified soybean – becoming an industrialized crop and a
‘Frankenstein’ food – shed light on the range of actors and dynamics between and in-between
producers and consumers. Her approach was to fill in the ‘blank figure’ of many commodity-
chain and consumer culture studies, and investigate the geographies of the network via
studying what happened to the soybean itself (Whatmore 2002, pp141-142).
Cook (2006) focused on the strengthening of Whatmore’s and others’ ‘following’ literature and
the stories ‘told’ by different food items. Cook focused on the people in the food chain (rather
than, say, GHG emissions) but did refer to ‘reduc*ing+ wasteful practices’. He recognised
scholars who doubted that food-following network research would help or change consumer
behaviour, and argued against them. He called for more ethnographic research as essential to
gaining an empathetic understanding of the people involved in the food chain. Cook (with
others) went further to advocate an autoethnographic narrative of agro-food research

12
practices. He also noted that many food-following studies stopped before the consumer, but
seemed to assume an audience of the food’s consumer, rather than academia. Cook concluded
that, to make a difference, perhaps academic geographers should engage their research with
different publics (Cook 2006,pp 659-662). Finally, Cook et al (2010) illustrate a vibrant ongoing
debate between academics about food geographies, including purposes of research and
engagement with others.
Particularly relevant to this project is Barndt’s (2002; 2008) following of the tomato from
Mexico to Canada. To her, 'tomatoes are much more than fruits of the earth but are codes for
broader social processes and debates' (2008, p50). She detailed the complex production-
consumption chain, and traced a narrative of industrial development, globalisation and genetic
modification in agriculture. Barndt aimed to combine commodity chain and political economic
approaches with cultural studies (2008, p70). Of interest is that the production-consumption
chain of the North American tomato ‘has become so long, complex, and tangled that no one
knows exactly where the tomato goes’ (Barndt 2008, p262).
As Barndt’s example shows, following-type studies lend themselves to complex food chains.
They can also be applied to non-human objects that are only sometimes foods. Atchison et al
explored both food and other industrial product chains in their following of wheat as both a
food and industrial substance (Atchison et al. 2010). While not a ‘following’ study, Lyons et al’s
study of corporate organics noted difficulties in generalizing about institutions’ abilities to
embrace sustainable development principles, with variance between companies, sectors and
countries (2004, pp96-97). They took a case study approach to avoid these problems and to
appraise each example of ‘corporate greening’ on its merits. There is a similarity here between
case study and following the product – an inherent recognition that each example studied is
different.
Embodiment and the practical experience of consumption is emerging as an extension of
‘following’ within the agri-food literature (for example in Roe 2006; Atchison et al. 2010). I
agree with Roe that studying what people do with food things rather than what they say they
are concerned about (in focus groups for example) offers new insights into bio-political
debates around food (Roe 2006, p118). Rather than focusing almost only on the influence of
the consumer over the production and retail system (Roe 2006, p117), I suggest that a
relational approach can also be applied to the other people along the food chain.

13
Although embodiment is not the focus of my study, and nor is it an objective study of the chain
taken from the tomato standpoint (like Whatmore’s soybean), I ask supply chain actors about
their connections to the tomatoes they handle. By doing this, my project goes some way to
revealing attitudes to the ‘thing’ – crop, commodity or food – as found among people
intimately linked to its production and distribution.
2.3 Political economy commodity chain approaches
Many commodity chain following approaches remain in a more traditional political economy
vein. Jackson et al (2006, p140) concluded that although networks, assemblages and circuits
were becoming more intellectually favoured, commodity chains remained academically
legitimate not least because of their currency among state and other agencies (Jackson et al.
2006, pp138-140).
Friedland (2005) advocated for more commodity studies as an intermediate scale of analysis
between ‘studies focusing on the macro-scale dynamics of globalisation or the micro-scale
dynamics of place’(Friedland 2005, p36) He made clear that he did not fetishise the commodity
but used it as an accessible scale for empirical analysis of globalisation (Friedland 2005, pp 25,
36). In doing so he called for a standardising of conceptual language around commodity
analysis. He suggested labels: filieres (a commodity in its total global configuration);
commodity systems (a production-distribution-consumption network that is a component of a
filiere); commodity chain (a singular network of commodity production, distribution and
consumption) and segment (a particular aspect of activity, such as culture, science,
distribution, consumption). His example of a commodity chain was Barndt’s tomato chain
study (first published in 2002), because despite her claim of studying a ‘global commodity
chain’ it is not truly global (Friedland 2005, pp31-33) as it focuses on Mexico, Canada and the
US. Although Friedland saw virtue in the range of study types, I see his definitions as a
reinforcement of political-economic-geographic following focus, where the hierarchy is based
on distance and movements, and the interactions between people are at the ‘segment’ end.
This contrasts with human geography approaches emphasising reconnections, such as those
discussed by Winter and advocated by Cook, and with Barndt’s interdisciplinary aim (Barndt
2008, pp69-70). My aim is not to fetishise the tomato but to recognise its importance as a
consumer commodity, as well as the industry and people geared toward producing and trading
it, while also tracing tomato journeys specifically to measure GHG emissions.

14
Lawrence and Burch (2007), using Jackson et al (2006) and others, described the advantages of
commodity chains approaches – they take into account global/local issues of scale, identify
differential power relations, how the elements of the chain fit together, and positive and
negative outcomes of the system. Economic geography also includes research into social
processes such as cooperation between supply chain actors, for example Penny’s study of
cooperation in the New Zealand dairy and sheep meat industries (2005). Penny points out
though, that in supply chain, business management and economic geography literature, ‘the
development and specific nature of cooperation at various sites in supply chains is rarely
examined at the micro-scale, much less in an agricultural context’ (2005, p98).
Although supermarkets lie outside the scope of this project, there is a substantial body of
research on the mass-market supply chain involving supermarkets and the latter’s impact on
them, including on wholesale markets (see for example the collection edited by Burch &
Lawrence 2007). An understanding of the political economy and power relations of supply
chains is critical if policy requires them to change.
Two further political-economic studies are particularly relevant to this project, because they
show clear economic benefits of studying food chains and systems. First, Pritchard and Burch
(2003) used the processing tomato industry to explore transnational agri-food restructuring.
Using a ‘critical agrarian political economic’ approach (critical of narrow market accounts of
globalisation), they investigated different scales of processes and determined that there is not
a single global marketplace. Their approach took in local, regional and global factors and
enabled them to identify different parts of the industry and chain as more vulnerable than
others, including to change (Pritchard & Burch 2003, pxii, pp247-248).
Second, Blay-Palmer and Donald (2006) situated their investigation of a ‘new food economy’ in
Toronto within economic geography. They sought to ‘relocate the “agri-food” literature away
from a traditional rural setting to a dynamic city-region context’ that emphasized consumption
(Blay-Palmer & Donald 2006, p383). They argued that this also allowed for investigation of the
food sector contribution to city-region economies of developed countries, as well as the
importance of everyday purchases such as food to urban economies (Blay-Palmer & Donald
2006, pp383-384, pp396-397). I consider ‘relocate’ a strong phrase. There is much value in
studying rural aspects of the food system. But investigating everyday food purchases (and by
extension choices) is an important part of the sustainable food debate, including what role

15
information and economic instruments such as labelling can play in policies to reduce GHG
emissions.
2.4 Culture, consumers and the food chain
In discussing constraints on the globalisation of the food sector, Morgan et al (2006, p8)
considered that:
food production requires the transformation of natural entities into edible form, while the act of eating itself is a profoundly cultural exercise, with diets and eating habits varying in line with broader cultural formations...food chains never fully escape ecology and culture.
Food and culture was a core theme of Cook’s 2008 food geography review (Cook 2008).
Consumption studies often take more account of culture than traditional production chain
studies. This is not exclusive, though, for example the Canadian Journal of Agricultural
Economics published a special edition on food economics in 2006. Cranfield’s introduction
recounted a personal experience (one might say a reconnection) that led him to believe that
North Americans had lost the cultural importance of food; yet that this was changing among
consumers and therefore business. Economists therefore needed to (and were beginning to)
develop their research agenda to be timely to the real-world uptake of ideas such as food
miles (Cranfield 2006, p439).
Ten years after Hartwick proposed more provision of ‘geoknowledge’ to consumers, and much
research into following production chains to reconnect producers/chains and consumers,
there is some criticism that research still focuses too heavily on the production side of
production-consumption. Eden et al (2008, 1044-1047) claimed research relied on
presumptions: (1) about consumer values on concepts such as localness, authenticity,
traceability and quality; and (2) that a ‘re-education’ of consumers, or ‘knowledge-fix’ would
result in desired policy results. Blake et al (2010) also concluded that knowledge fixes such as
labelling were insufficient to increase local-food purchases. They contrasted their work to the
‘following the thing’ food research and argued for a broader understanding of ‘place’ as
considered by consumers, which can affect how they value individual items in the same place
(Blake et al. 2010, pp423-424). In 2004 Goodman was already pointing to neglect of the
consumer in the literature, but was more positive about the range of scholars aiming to rectify
this (Goodman 2004, pp5, 13).

16
Many factors influence food purchases and eating choices, for example perceptions of
convenience, cost, authenticity and the ability to weigh up different factors (Lockie 2002,
pp285-7; Lockie et al. 2002). Further discussion of food choices and consumer practice around
food include Valentine (1999), Scheibehenne et al (2007, p579), Sirieix et al (2008, p512),
Weber and Matthews (2008, p3513) and Blake et al (2010, pp411-414).
Eden et al (2008, p1055) found that information provision, while leading to questioning about
food, did not necessarily translate to consumption knowledge or practices. The Australian
Food and Grocery Council has produced research claiming that consumers do not necessarily
‘buy green’ at the supermarket, despite professing knowledge of environmental reputations of
manufacturers (Australian Food and Grocery Council & Net Balance 2010). Consumers also
need to trust a labelling scheme as well as understand it (Eden et al. 2008, pp1046, 1052,
1054). A French study has further shown that consumers might even avoid ‘food miles’
information if it is provided, preferring to remain ignorant and therefore avoid making what
might otherwise be an undesirable choice (Sirieix et al. 2008, pp512-514).
So one cannot assume that providing information to consumers will result in desired policy
outcomes. Further, simple policies should not presume to either reconnect consumers to
particular ethical or environmental elements of production or change their behaviour on a
large scale. Nevertheless, there is potential. For people who want to make personal moves
towards greater sustainability, food might be the place to start. Weber and Matthews claimed
that, compared to home energy and transport:
...food represents a unique opportunity for consumers to lower their personal impacts due to its high impact, high degree of personal choice, and a lack of long-term ‘lock-in’ effects which limit consumers’ day-to-day choices (2008, p3508).
Also, Cook’s calls for more ethnographic and autoethnographic research in following the food
was about providing (to both researchers and their readers) a greater knowledge, and
empathy, towards those along the chain (Cook 2006, p660). So was his call to academics to
engage with publics other than readers of academic journals (Cook 2006, p662). I think these
approaches can improve the ‘knowledge-fix’ and broaden opportunities for changing
consumer behaviour, even if the consumer is not included as a subject in every agri-food
research project.

17
2.4.1 Popular literature
There is an extensive popular literature focused at people as consumers, encouraging them to
reflect and act on information about where their food (and other products) comes from, for a
range of reasons such as helping the environment (including climate change), fair trade,
supporting local economies, and animal welfare. Books include those by Pollan (2006),
Kingsolver et al (2007), Smith and MacKinnon (2007) and Murray (2007). The authors of these
types of books appear to be just the type of concerned consumers who would make an effort
to buy sustainable food. They have found time to act on their curiosities or concerns, trace
their food or other consumables, and turn it into a book project. There are also many general
‘sustainable living’ books that include sections on eating, and numerous magazine and
newspaper articles search for more environmentally-friendly food options. Examples include
Cloud (2007), Darlin (2010), Cubby (2010), Mitchell (2010). The whole of edition 27 of Griffith
Review looks at the multitude of issues around the food chain. An advertisement for a seed
and plant seller in a popular gardening magazine claimed that ‘growing heirlooms *tomatoes+
at home rather than buying rock hard hybrids that are shipped thousands of miles cuts
Greenhouse emissions by 30%’ (The Digger's Club 2010) but provided no evidence for this
figure. Many blogs look at the topic as well, for example Borrell (2009). Television programs or
films include Slow Food Revolution (2004), The Future of Food (2004) and Food Miles (2008).
It is partly because these items appear so frequently that triggered this research to test how
easy it might be to know how to make informed decisions. Are the claims balanced? If these
authors can trace their food, or make (sometimes) seemingly simple recommendations about
which food is more sustainable, why can it not be done at a larger or more official scale?
Consumers of these articles are entitled to independent verification. My focus is everyone
concerned but who does not have the time or inclination to undertake such a project: would
information about ecological impact via labelling or other food chain policies be feasible? This
thesis seeks to explore this possibility in relation to the journeys food commodities travel, and
whether documentation of associated GHG emissions is able to be accurately achieved.

18
2.5 Local food
One imperative to emerge recently has been to eat more local food in an effort to be more
sustainable. But, definitions of ‘local food’ vary and food that appears local may not be (Lang
2007, p127-8). Even genuine local food may not be of higher quality or more environmentally
sustainable than other food (Winter 2003a, p30; Smith & MacKinnon 2007, pp66-67; Spencer
& Kneebone 2007, p49; Van Hauwermeiren et al. 2007, p39; Dalmeny 2008, p1; Eden et al.
2008, p1046, references Ilbery & Maye, 2006). Fagan (2008, pp3-4) put it simply:
...‘local’ is not a fixed or given geographical scale. What constitutes ‘localising’ a food provision system will vary in complex ways from place to place and commodity to commodity.
In addition, reterritorialization and links to nature at the production end of the chain (see
Winter 2005), and broader food origin labelling, requires boundaries and definitions of ‘local’
or ‘region’ that may not be local to the consumer (see for example, Feagan 2007, pp26-27;
Blake et al. 2010, p410). Retailers draw on positive ideas of ‘local’ in their marketing, making
for a confusing concept for the consumer (Blake et al. 2010, p410). Ultimately, ‘local is a
relative concept produced by both consumers and producers’ (Blake et al. 2010, p422).
Feagan (2007) discussed the contemporary debate in geography and sociology about the
meanings of ‘local’, ‘community’ and ‘place’ in the context of local food systems. The goals or
hopes of such systems are driven by a range of ‘real and significant concerns’ (Feagan 2007,
p24), not only reduction of GHG emissions. People who buy local do so for various reasons,
such as social or environmental concerns, food safety, freshness, ideas of quality, animal
welfare and supporting small farmers and communities (see, for example, Van Hauwermeiren
et al. 2007, p32; Sirieix et al. 2008). ‘Relocalisation’, such as via shortening of food chains, is
seen by many advocates as a positive reaction to perceived negatives of longer and more
complex food chains (Feagan 2007, p25). Re-establishing relationships between consumers
and producers, re-embedding food transactions in community and place, and ideas around
quality including trust, tradition and place (Feagan 2007, p28) seem key to local food systems.
Cameron (2008) provides an Australian example of workshop discussion between community
enterprises in the alternative (sometimes local) food sector, and shows the range of non-
economic values with which they associate. Sometimes, however, local means more to
consumers when it is divorced from a specific distance, for example when they choose to
support a green-grocer instead of a national supermarket chain (Blake et al. 2010, p422).

19
While authors vary in their views on the potential for alternative food systems, there is a
cautionary tone towards AFNs or local systems present in some of the literature. Some are
concerned about equity of access to quality food (see, for example Goodman 2004, p13; Blake
et al. 2010, p423); although others see possibilities to address social inequalities through
alternative food initiatives (Kneafsey et al. 2008, pp159-160). Local or alternative food systems
need to beware of becoming defensive (Winter 2003a) and even anti-democratic (Feagan
2007, pp36, 39), or losing track of the ethical or sustainable production desired (Eden et al.
2008, p1046). Regardless of their scale, they rely on people, businesses, trust and
relationships; being local does not make them automatically ‘better’ (Goodman 2004, p5; Hess
2008).
Having said this, being local does not automatically make them worse either. It can be difficult
to avoid the local/conventional or local/global food system binaries. DuPuis and Goodman
(2005, p368) urge agro-food studies to take account of human geography debates on the ‘new
politics of scale’. They call for:
an inclusive and reflexive politics in place [that] would understand local food systems not as local ‘resistance’ against a global capitalist ‘logic’ but as a mutually constitutive, imperfect, political process in which the local and the global make each other on an everyday basis (DuPuis & Goodman 2005, p369) .
Hess (2008, p635) concluded that for local systems to address environmental and social justice
concerns, they needed to link to broader movements and policy reforms at national and
international levels. He advocated a ‘global localism’ approach such as ‘buy local first’
campaigns, where if appropriate local products were not available, a hierarchy of other
concerns such as fair trade could be followed (Hess 2008, p633). Feagan (2007, p39) concluded
that ‘how we determine the local in LFS will have to be contingent on the place – the social,
ecological, and political circumstances which circumscribe it…while also cognizant that any
localism is dialectically and relationally tied to the global in diverse ways’. Hence, while a
broad policy (such as local food labels) might be considered desirable by some, national
implementation based on what must be an arbitrary definition of ‘the local’ would be
challenging.

20
2.6 Food miles, LCA, embodied energy and GHG emissions
A common example of advocacy for local food is use of the ‘food miles’ concept, which refers
to the distance travelled by food items between where they are grown and where they are
consumed. The concept was formed in the 1990s by Lang and expanded by SAFE Alliance, now
Sustain (Lang & Barling 2007, p200). ‘Food miles’ highlights that it is not only how food is
grown or produced, but how far it travels, that can contribute to negative environmental and
socio-economic impacts (Smith et al. 2005, p2). However, when used in its most basic form –
‘buy local’ or labelling based solely on distance – the concept only accounts for energy inputs
from transporting the food. It neglects inputs such as fuel type and may not even consider
transport mode. As with ‘local’ and ‘commodity chain’, ‘food miles’ can be used by different
organisations for their own ends (Jackson et al. 2006).
Internationally, the food miles literature has grown steadily over the past decade, especially in
the UK, US, Canada, Europe and New Zealand. Simplistic food miles claims have been
challenged, and the field is identifying many areas that require further study. Pretty et al
(2005) combined analysis of on-farm environmental impacts with those from transporting
foodstuffs to retailers, consumers’ homes, and waste disposal, to determine the full cost of the
UK weekly food basket. One conclusion was that the potential for business and governments
to reduce farm and food mile externalities appeared considerable; but that localisation of food
systems would require behaviour changes throughout the supply chain as well as different
land use patterns to support local markets (Pretty et al. 2005 p16).
Smith et al (2005) investigated the validity of food miles as an indicator of sustainable
development. Although they concluded that ‘a single indicator based on total food kilometres
is an inadequate indicator of sustainability’, and that there is not a clear case to move to either
a higher or lower food miles system, they argued that measurement of food miles was
essential if ‘the complex trade-offs between different social, environmental and economic
costs and benefits’ of different food supply chains are to be evaluated (Smith et al. 2005, ppii-
vi). Saunders et al (2006) found that some foods produced in New Zealand and shipped to the
UK could be more energy efficient than the same food produced and bought in the UK. Mila I
Canals et al (2007) later found that it could depend on seasonality and storage options. Others
have also identified potential trade-offs between food (or flower) miles and international
development (for example see Holt & Watson 2008); and between different environmental
impacts of food production (for example, Gerbens-Leenes et al. 2003). In a comparison

21
between local and mainstream food supply systems, Van Hauwermeiren et al (2007, p45)
found that transport and storage were important (and that local food systems almost always
were less energy and GHG emission-efficient than mainstream food systems). However, they
found that in their simulation, other factors, including consumer purchasing behaviour,
whether food was grown in heated greenhouses or outdoors or if food was imported, had
greater impact on the efficiencies of the food product.
Food miles is a threatening concept to food exporters in countries such as Australia and New
Zealand (Stancu & Smith 2006, pp5-6; Packaging Council of Australia 2007; AAP 2008; Hogan &
Thorpe 2009) and this is likely to influence any (at least national) government position on food
miles initiatives. Counter-emphasis can be placed on more complete LCAs (see for example
Smith et al. 2006). At least some in the vegetable industry appear to want to have it both ways:
for example, Deurer et al (2008, pp17, 21) considered food miles to be an ‘erroneous notion’
and that greenhouse footprinting at a product level in the vegetable industry would be useful
‘to rebut food-miles claims in export markets, and to enhance locavore advertising in domestic
markets’.
2.6.1 Food miles in Australia
The term ‘food miles’ has only gained attention in Australia in the past five years or so and
there is little research in the area. Relevant studies are a ‘preliminary study of Melbourne’
(Gaballa et al. 2007) and a broader literature review on sustainable and secure food systems
for Victoria (Larsen et al. 2008). The latter recommends that future research include an update
of analysis of the energy and emissions of the full food chain; and full LCA (particularly on GHG
emissions) on a range of essential foods.
ABARE (Hogan & Thorpe 2009) concluded that food miles was an unreliable indicator of a food
product’s carbon footprint, but that other forms of carbon labelling (closer to life cycle
footprinting analysis) could be effective if they passed further cost-benefit analysis and
complemented other climate change policies (p30). However, Hogan and Thorpe saw carbon
emissions from the food supply as a negative international externality (or market failure) and
therefore something requiring an internationally-coordinated response (p18).
Fagan (2008) provided an overview of food miles and other food provision options from a
Sydney perspective. He noted that while a useful concept for getting people to think about
where their food came from, there were a range of sustainability and access issues/trade-offs

22
around food that needed to be taken into account (Fagan 2008, p3-4). Consumer magazine
CHOICE also concluded that, while a poor indicator of the overall environmental impact of
food products, at least the concept started people talking about bigger impacts of food supply
and the environment (No author 2008).
2.6.2 Life Cycle Assessment (LCA) and carbon labelling
It is clear that we require more complete LCAs of food products if we are going to be able to
determine their energy efficiency and sustainability. Numerous works have pointed to the
scarcity of research in the broader field of food sustainability and the need for full LCAs and
standardised methodologies. Edwards-Jones et al (2008) concluded that:
food miles are a poor indicator of the environmental and ethical impacts of food production. Only through combining spatially explicit life cycle assessment with analysis of social issues can the benefits of local food be assessed. This type of analysis is currently lacking for nearly all food chains (p265).
Weber and Matthews (2008, p3508) stated that most food LCAs ‘have been limited to detailed
case studies of either a single food item or a limited set of items, though usually to a higher
level of detail than is possible for large groups of products.’ They claimed that because many
studies use life-cycle energy use as the measure of sustainability, they have not accounted for
non-CO2 GHG emissions associated with agriculture. They also pointed out that few studies
have analysed transport upstream of the farm.
Weber and Matthews’ input-output LCA of the GHG emissions associated with the production,
transportation and distribution of food consumed by American households, concluded that 83
per cent of the GHG emissions from food came from the production phase, and that the large
range of GHG intensity between different food groups meant that dietary shift could be more
effective than buying locally-sourced food (2008, p3508). They found that the average
American household could only achieve about 4-5% reduction in GHG emissions from their
food by buying food locally. They claimed that the same effect could be achieved by shifting
less than one day per week’s consumption of red meat and/or dairy to other protein sources
or a vegetable-based diet (p3512).
Despite the various calls for more complete product LCAs, instead of just food miles, LCAs
remain complicated, and to date are relatively few in Australia. The International Standards
ISO14040 series covers LCA. There are significant international developments to produce
standard methodologies for the corporate sector to measure product carbon footprints. The

23
first of these is the British PAS2050 (BSI 2008). The UK Carbon Trust, involved in the
development of the PAS2050, has a program for certifying carbon footprint figures for
products. In Australia, Planet Ark and the UK Carbon Trust have launched a carbon reduction
label based ultimately on the PAS2050. The program is designed for businesses that want to
label their products. Approved consultants undertake the measurement for companies, which
is then certified by the Carbon Trust’s Carbon Label Company (Planet Ark 2010).
Fulfilment of the PAS 2050:2008 Specification for the assessment of the life cycle greenhouse
gas emissions of goods and services, like the ISO LCA standard, is beyond the scope of this
project, especially as I look at several supply chains rather than one. For example, tracing back
to raw materials for inputs (such as packaging) at each stage of the supply chain would be too
great a task. At the same time, PAS 2050 does not cover all areas that this project intended to
explore. For example, in this edition of PAS 2050, capital goods such as machinery and
buildings are excluded due to a ‘lack of carbon footprint data currently available to identify
sectors where capital goods emissions are material, and cost/complexity of analysis’ (Carbon
Trust & Crown 2008, p32). Nevertheless, this project generally follows the spirit of PAS 2050
and concepts such as process maps are adapted from PAS 2050.
The second major effort underway in lifecycle methodology is by the World Resources Institute
and World Business Council for Sustainable Development’s Greenhouse Gas Protocol Initiative.
Having developed standards for corporations to measure GHG emissions across their business
or a specific project, they are now developing product supply chain standards (The
Greenhouse Gas Protocol 2010). There are a range of other carbon labelling schemes being
trialled in different countries (Hogan & Thorpe 2009, pp20-22). Stancich (2009) compares the
costs to business of the Carbon Reduction Label (based on the PAS 2050) and similar US and
Canadian-based schemes.
Significant work is being conducted in Australia to form or consolidate LCA data. Called the
Australian Life Cycle Inventory (AusLCI) Project, the Australian Life Cycle Assessment Society,
CSIRO, and a range of organisations are involved in this research, which covers a several
industries including agriculture (CSIRO & ALCAS n.d.). According to Verghese et al (2009, p17),
AusLCI is ‘a long-term project, and although it has provided new data developments, it is likely
to take several further years for a consistent dataset to be developed’.

24
Horne et al (2009)’s collection summarised Australian LCA progress, saying for example that
Australia is at the forefront of research on LCA for building materials (Horne 2009, p90). But
the collection also pointed to a lack of publicly available information, and ‘data remains a key
challenge’ (Verghese et al. 2009, pp18-19). There is an inherent tension between standardising
LCA approaches and the flexibility, simplicity and input data required to make LCA practical for
businesses to implement (Gerbens-Leenes et al. 2003, pp243-245; Deurer et al. 2008, p2;
regarding fertilisers O'Halloran et al. 2008, pp7-8; Verghese et al. 2009, p19). Saunders and
Hayes (2007, pp7-8, 31-32), while arguing for comprehensive studies instead of food or air mile
policies, discussed types of LCA and noted the difficulty in comparing studies that cover
different parts of the supply chain.
In March 2009 the Rural Industries Research and Development Corporation released a report
on LCA methodology for rural industries, but it was more of a guidance document rather than
providing the actual energy or GHG coefficients (Harris & Narayanaswamy 2009). Foran et al’s
(2005) triple bottom line, economy-wide input-output analysis provided overall context to
industries, including tradeoffs between environmental, social and financial factors. Other
significant research efforts on LCA in Australia include those by Treloar et al (2001). Australian
universities, including RMIT, Sydney University and the University of NSW (The University of
Sydney 2010) and Melbourne University also conduct significant LCA research. There are
various LCA software packages available and LCA consultancies, but public, usable information
appears limited and less organised.
The most significant Australian LCA for this project is Grant and Beer’s (2008) LCA of GHG
emissions from irrigated corn, including for processing into corn chips. They noted the
Australian practice of identifying GHG emissions from sectors in the production chain and
investigated whether it might be more cost-effective to find the major emission sources that
had a chance of mitigation regardless of where they lie in the chain. Although on-farm
processes, especially related to nitrogen fertiliser application, formed the single largest GHG
emission source, and the study found substantial potential to reduce GHG emissions through
stubble management, Grant and Beer found greater potential to reduce GHG emissions in
packaging and post-farm transport activities (Grant & Beer 2008, pp378-379, 381).

25
2.6.3 Embodied energy and GHG emissions
The Australian Government produces a range of emission coefficients through its National
Greenhouse Account (NGA) Factors (Department of Climate Change 2009), including for
stationary energy, transport fuel, water use and waste. While in later chapters I use these
Factors as the primary source for calculating emissions, they do not cover the full spectrum of
what this project aims to investigate, such as capital inputs.
Another approach to comparing GHG emissions between various products is to focus on their
embodied energy (and then apply GHG emission co-efficients). In the agri-food sector, key
embodied energy works are by UK-based Leach (1976) and US-based Pimentel (for example,
Pimentel & Pimentel 2008). Pimentel found that processing tomato production (presumably
outdoor-grown) in the US cost about 4kcal of energy expended for every 1kcal of tomato
produced (Pimentel 2006, p19; Pimentel & Pimentel 2008, p126). Comparisons between
systems are possible, for example Pimentel compared tomato production in the US with that in
Pakistan, finding that the input-output ratio in Pakistan was more than double that in the US
(Pimentel & Pimentel 2008, pp150-151).
Australian analysis of this sort is lacking. However there was some early energy analysis
conducted in the agri-food sector following the mid-1970s oil shock (see collection by Howes &
Rummery 1980; particularly Watt 1980). It is problematic to take figures for embodied energy
(or emissions, for that matter) from even the same crop in other countries and apply them to
Australia, due to different climate and soil conditions, and different energy efficiencies of
stationary energy and fertilisers used. Assumptions about similarities between crop inputs are
fraught with risk. Hence I have not attempted to include such analysis in this project.
I have, however, used some international figures for embodied GHG emissions for buildings
and equipment. According to CSIRO, ‘there is actually not a great deal of embodied energy
data and documentation available in Australia’ (J Davidson, 2009, pers. comm. 18 December).
CSIRO work in this area has been folded into broader LCA efforts. The Your Home Technical
Manual (Commonwealth of Australia 2008) contains figures on embodied energy (but not
emissions) for some building materials.
The most applicable embodied energy coefficients found for building materials were from the
Centre for Building Performance Research in New Zealand (Centre for Building Performance
Research no date). This research was also referred to me by CSIRO (J Davidson, 2009, pers.

26
comm. 18 December). Associated data (Alcorn 2003) provided CO2 emission coefficients.
Consequently, my project applies figures developed in a New Zealand context to materials
used in Australia but made overseas, for example glass manufactured in China, and steel and
aluminium products manufactured in the EU. More detail of how these were used is contained
in Chapter 3. It is noted that one of Alcorn’s sources was (Australian) Lawson (1996), which is
also a key reference for the embodied energy section in Your Home (Commonwealth of
Australia 2008).
Saunders et al (2006) used and modified Wells’ (2001) and some others’ energy factors and
CO2 emission factors for farm inputs in New Zealand. In the absence of similar factors for
Australian agriculture, I attempted to apply some of these factors to my data. This too involved
compromise. For example the factors for production of inputs were based on production
processes in New Zealand, and it is difficult to assess how different these would be in Australia.
The Saunders et al and Wells calculations were also based on farming systems other than
hydroponic, protected cropping (although this is the case with most literature found).
No public carbon calculators found were appropriate for studying greenhouse-grown tomatoes
in Australia. One such calculator is the Australian Government-funded FarmGAS calculator,
released in 2009. Although including a function for horticulture, it is only suitable for perennial
crops, such as fruit trees and vineyards. Even then, the only GHGs included are from an annual
amount of nitrogen applied to the crop; based on the minimal reporting used in the
government inventory (Australian Farm Institute 2009, pp48-49).
Lisson (2008) reviewed four greenhouse accounting calculators/models developed in Australia
and New Zealand. He found none to be immediately suitable for the vegetable industry, but
collectively they captured the key attributes and functions needed for calculator development
(Lisson 2008, p13).
2.6.4 What the Australian vegetable industry and supply chain is doing on carbon
footprinting
The Australian vegetable industry seeks to develop a carbon footprint tool for the industry, but
with an on-farm focus rather than full supply chain. An initial calculator has been developed
(Deuter 2009) and as of 23 July 2010 a ‘vegetable carbon footprint tool’ is ‘coming soon’
(Horticulture Australia Limited 2010a). The industry prioritises calculation of a footprint for the
national industry as well as key commodities or regions, developing on-farm emission indicator

27
tools and identifying and promoting ‘best management practices’ to minimise emissions
(Horticulture Australia Limited 2009, pp3-4).
Some initial estimates and information gaps were evident in the discussion papers from a 2008
industry workshop (Deurer et al. 2008; Deuter 2008b; East 2008; O'Halloran et al. 2008; Rab et
al. 2008). Of particular interest for this project was O’Halloran et al’s (2008) omission of
hydroponics, glasshouse systems and organic farming systems. They suggested that these
systems were likely to have different carbon footprints, and mitigation options, to
conventional production systems, and that the ‘overall effect of these systems on the carbon
footprint of a unit of produce needs investigation’ (O'Halloran et al. 2008, p26). They
considered that ‘hydroponic and glasshouse systems are likely to result in more efficient use of
input (high production per unit input), but are likely to use more energy in climate control
(heating/cooling) and have greater embodied emissions in infrastructure’ (O'Halloran et al.
2008, p26). Some European studies have shown that field tomatoes use less energy than
greenhouse-grown tomatoes (for example, see Carlsson-Kanyama et al. 2003, p298; Smith et
al. 2005, pp64-68). Smith et al essentially compared the heating energy in British greenhouses
to the transport involved in importing outdoor-grown tomatoes from Spain by road. They
noted the need for full LCA to compare the two systems more accurately. Study in this area in
the context of Australian climatic conditions would contribute to the international literature.
This thesis provides insights into the GHG emissions from the greenhouse and hydroponic
(tomato) sector in Australia.
A high-profile project (claimed by Horticulture Australia Limited [HAL] to be the first case of
vegetable industry investment into GHG emissions research) is being conducted at Houston’s
Farm, a large-scale grower and processor of fresh cut salads. Significant funding has enabled
Houston’s to analyse its carbon footprint using LCA. It has developed a calculation tool, which
although specific to its farm, HAL now seeks to develop (by August 2011) into a calculator
applicable to the wider vegetable industry (Horticulture Australia Limited 2010d). Of note is
the observation from the first part of the study that ‘for future applications of this model to
different crops and/or farming businesses…the study identified the complexity of operations
for horticulture, most specifically in the variety of other production techniques that were not
included in the model and would need to be in the future’ (Horticulture Australia Limited
2010c).
28
There are a range of studies and initiatives by different post-farm sectors with relation to
sustainable supply chains or climate change (see for example Australian Food and Grocery
Council & IBM 2010; Australian Food and Grocery Council & Net Balance 2010). However the
breadth of the sectors and the many different products that they trade or distribute makes it
difficult to critique with regard to one food chain. A case-by-case approach is required,
demonstrating the applicability of empirical research with downstream actors – I seek to do
this in this project.
2.7 The tomato
Friedland emphasised that ‘every commodity has a distinctive history and trajectory’, including
how the industry around the commodity is organised (2005, pp28, 36; see pp28-30 for
comparison between different horticultural commodities in the US). Further, a price on carbon
would affect different food commodities in different ways (Larsen et al. 2008, p25). An
exploration of the industry surrounding greenhouse-grown tomatoes in Australia is therefore
appropriate.
The tomato is a powerful symbol of industrial agriculture. The tomato’s history has been
documented in a number of books (for example Harvey et al. 2003) and it has also been
studied in the context of agri-food chains, and aspects of labour, women and migrants (see
Barndt 2008). There has been much research and development on tomato varieties and
genetic modification of the tomato. Tomatoes have also been studied with respect to food
miles, for example in Smith et al (2005).
The tomato is a major horticultural commodity and an integral component of various cuisines.
Pritchard and Burch (2003, p3) chose processed tomatoes as their subject for studying
globalisation in the agri-food sector not only because of the restructuring occurring in the
sector. They also considered important the size and reach of the industry and its position ‘at
the forefront of current trends in food consumption’ of both fast, packaged and prepared
foods, and functional foods and organic diets (Pritchard & Burch 2003, p3). In Australia,
tomato consumption has grown steadily for decades. For the three years to 1998-99, the
average per person consumption was 23.9kg of tomatoes per year, compared to an average of
13.6kg in the three years to 1978-9 and 19.3kg in the three years to 1988-89 (Australian
Government Department of Agriculture Fisheries and Forestry 2009, p67). Tomatoes and

29
potatoes are the major vegetable crops grown in Australia in terms of value and volume of
production (Crooks 2009, p4).
Tomatoes also present the image of stapleness or commonness. This is shown in a newspaper
advertisement for American Express (Figure 2). The caption reads ‘What if tomatoes could take
you shopping in Paris?’ followed by the self-explanatory ‘Earn Membership Rewards points on
the things you buy every day and use them for amazing travel experiences’ (American Express
Australia Limited 2010). A second example is contained in a radio news story about how
Australia’s standard kilogram is calibrated and new ways being developed to define the
kilogram. In the story, the reporter uses the tomato as the example of everydayness:
It may not matter to the average customer who's trying to buy a kilo of tomatoes at their local supermarket. But Peter Fisk says it matters a great deal to science (The World Today 2010).
FIGURE 2 REMOVED HERE FOR COPYRIGHT REASONS.
Figure 1. Newspaper advertisement for American Express, The Sydney Morning Herald, 29 June 2010

30
Research on tomatoes in Australia has been quite separate between the processing tomato
industry and fresh tomato industry. Much of the Australian research related to tomatoes,
especially on fresh tomatoes, has been on disease and pest management and on testing
different tomato varieties (for example, Van Brunschot et al. 2010). As reflected in the
separate research, the Australian tomato industry is really two industries: fresh and processing
tomatoes (Horticulture Australia Limited 2010b). Processing tomato farms grow varieties more
useful for processing, and grow the tomatoes outdoors. The industry is predominantly in
Victoria, with few processing companies involved. It is reasonably organised, with its own
research organisation involving both growers and processors (Australian Processing Tomato
Research Council 2010).
The fresh tomato industry, by contrast, is not represented by a single body and growers do not
pay a levy for specific fresh tomato research and development. The industry is further divided
into outdoor- and indoor-grown crops. While not exclusive to certain regions, northern
Queensland is a key growing area for east-coast field tomatoes, especially because the climate
enables production during the cooler months.
Until 2009, all tomatoes were considered as one commodity in agricultural statistics published
by the Australian Bureau of Statistics (ABS). The release of additional data for the 2007-08 and
2008-09 years allowed greater understanding of the breakdown of the industry. Data needs to
be collected over a longer period before trends can be reliably assessed, but should enable
future researchers to conduct input-output type studies focusing on the different parts of the
sector.
Thirteen per cent, or 31,313t of tomatoes grown for the fresh market in 2007-08 were grown
‘undercover’ (ABS 2009, datacube 6, tables 1-8). In 2008-09, it was 11 per cent, or 24,500t1,
with undercover production falling in NSW, Queensland, Victoria and South Australia (ABS
2010a, datacube 5, tables 1-7). It is not clear from the statistics why the amount of tomatoes
grown undercover fell in the 2008-09 year.
1 Has a relative standard error of 10-<25% and should be used with caution (ABS 2010, datacube 5).
Percentages are calculated from the figures in the ABS table.

31
Table 1. Tomato production 2008-2009, by type and state. Type of tomato production
NSW Queensland Victoria South Australia
Western Australia
Tasmania
Processing (t) 17,893 1,508 197,016 283 961 1
Fresh – outdoor (t) 3,554 134,814 41,015 570 17,940 10
Fresh – undercover (t) 6,099 1,831 5,615 9,537 639 761
(Source: Adapted from ABS 2010a, Datacube 5, Tables 1-7)
Note. Many of these production statistics contain an ABS caveat of relative standard errors between 10 and 25 or 25 and 50% and should be used with caution.
As shown in Table 1, in 2008-09 fresh tomatoes grown undercover form the majority of fresh
tomatoes grown in NSW and South Australia. Victoria produces nearly one quarter of
Australian fresh tomatoes grown undercover, but also has a substantial outdoor fresh tomato
industry, as well as the vast majority of processing tomatoes. Queensland produces the
majority of outdoor grown fresh tomatoes. Of NSW’s relatively small fresh tomato industry,
more than half of the undercover tomato production occurs in the Sydney Statistical Division,
representing 85 of 133 agricultural businesses that grow tomatoes undercover in the state.
Twenty-seven per cent occurs in the Murrumbidgee region, with just three businesses. Ten per
cent of production is on the mid-north coast, with 17 businesses (ABS 2010a, datacube 5, table
2).2 This is a snapshot only, due to lack of data before 2007-08.
Table 2 shows values for total tomatoes for 2007-09. The ABS statistics on value of tomatoes
do not distinguish between processing and fresh market, nor outdoor and undercover,
tomatoes. In the absence of this data it is difficult to gauge the contribution to the sector of
the undercover-grown tomatoes, as they tend to be sold for a higher price than the bulk of
outdoor-grown tomatoes.
Table 2. Value of tomatoes produced, Australia, 2007-2009.
Value 2007 2008 2009
Gross unit value ($/t) 1,000 1,060 777
Gross value ($m) 296.0 404.6 341.8
Local (farm-gate) value ($m) 241.3 329.3 274.5
(Source: Adapted from ABS 2010b, Datacube 2, Tables 1-3)
2 The production figures contain relative standard errors between 25 and 50% and should be used with
caution (ABS 2010, datacube 5, table 2). The business figures contain relative standard errors between 10 and 50% and should be used with caution.

32
2.7.1 Greenhouse-grown tomatoes and an industry overview
Much information relevant to a study of greenhouse-grown tomatoes comes under broader
categories such as the ‘vegetable’, ‘horticulture’ or ‘protected cropping’. A brief section on
terminology and characteristics of the industries is appropriate to understand the context that
participants work within. I have maintained the terms used by each source to preserve
accuracy.
‘Vegetable industry’ can mean indoor and outdoor-grown crops. ‘Protected cropping industry’
refers to indoor or shaded crops, including ornamentals such as flowers. ‘Horticulture’ can
include both indoor and outdoor, fruit, vegetables and ornamentals including flowers, nursery
and turf; and individual vegetables, such as tomatoes (processing, indoor and outdoor fresh
market). Industries and Investment NSW (2010a) noted that, in its broadest definition,
greenhouse horticulture includes the use of greenhouses and glasshouses, shade houses,
screen houses and crop top structures. Further, ‘controlled environment horticulture’:
combines high technology greenhouses with hydroponic (soilless) growing systems, making it possible to consistently and reliably control or manipulate the growing environment and effectively manage nutrition, pests and diseases in crops (Industries and Investment NSW - Primary Industries 2010a).
The farms in this project fall into this final category of growers.
The Australian vegetable sector supplies most of the fresh vegetables consumed domestically,
as well as inputs to processed vegetable products sold here and exported (although note
Malcolm & Fahd 2009's analysis that Australia is a net importer of overall vegetables and
vegetable products). From 1999 to 2007, vegetable growing averaged around seven per cent
of the gross value of Australia’s agricultural production. The gross value of vegetable
production in 2008-09 was around $3.5 billion (Crooks 2009, p4). Vegetable production is
labour-intensive compared to many agricultural industries, accounting for approximately 0.16
per cent of Australia’s total employment in 2005-06, perhaps even more as many seasonal
workers may not have been counted in these figures (Crooks 2009, pp4-5, citing ABS data). On
average, labour was the largest cash expenditure item for Australian vegetable farms in 2007-
08 (19 per cent), followed by fertiliser (11 per cent) (Crooks 2009, p11). About 86 per cent of
vegetable farmers surveyed in 2007-08 considered increased farm input costs to be an
impediment to future viability of vegetable farms (Crooks 2009, p43). Across a selection of
vegetables including tomatoes, production costs rose by an average of 30 per cent between

33
2004-05 and 2007-08, with the largest cost increases being for fuel, fertiliser, hired labour,
contracts paid and electricity (Crooks 2009, pp28-29).
Due to large discrepancies between ABS and industry observer data regarding the Sydney
vegetable industry, Malcolm and Fahd (2009) (funded by Horticulture Australia Limited)
investigated the size and self-sufficiency of the Sydney vegetable industry in 2008. Among their
findings were a total of about 1050 vegetable properties, with about 189ha of greenhouse
grown vegetables on 294 properties. About 115ha of these existed in Sydney’s South West and
North West Growth Centres (identified in the Metropolitan Strategy as future growth areas for
development). Their analysis of other data also found that Sydney produces less than 3 per
cent of Australia’s vegetables.
As an aside, there is a scarcity of knowledge about Sydney’s food system generally. The
Feeding Sydney project being conducted by the Urban Research Centre at the University of
Western Sydney aims to address this by studying not only local food but Sydney’s full food
production-distribution-consumption chain (University of Western Sydney 2010).
‘Horticulture’ in Australia represented less than two per cent of total agriculture GHG
emissions calculated for 2005 (calculated from Garnaut 2008, p168, Table 7.2). It is not known
whether Australian horticulture is a net emitter or sequester of GHGs (Deuter 2008a, p14).
Note, though, for this study, that transport, storage, wholesale, retail, residential and waste
elements of the fresh food system, as well as food manufacture, come under various
categories for national GHG emission reporting.
In 2007-08, 79 per cent of Australian vegetable growers rated their relationship with their
main buyer as good or excellent (Crooks 2009, p36). As shown in Table 3, most vegetable
growers (outside of Tasmania and the Northern Territory) sell to their state’s wholesale
market. As some growers sell to a range of places, though, it is not clear how much overall
produce goes through the wholesale market rather than, say, direct to retail.

34
Table 3. Vegetable selling methods 2007-2008, percentage of farms.
(Source: Crooks 2009, p35, Table 33)
2.7.2 Protected cropping / greenhouse-grown vegetables and tomatoes
In 2007-08, 51 per cent of Australian tomato growers (compared to 16 per cent of all vegetable
growers) used some form of protected cropping such as glass, poly, plastic or shadecloth
(Crooks 2009, p24). Only eight per cent of all vegetable growers grew hydroponically (Crooks
2009, p34). Nevertheless, controlled-environment horticulture, and hydroponics in particular,
is seen by some (including the Government) as horticulture for the future:
Hydroponics enables growers to produce safe, high quality fresh produce with less land, less water and less wastage. Hydroponics is one of the keys to securing food in the changing world of tomorrow (Industries and Investment NSW - Primary Industries 2010b).
In 2005 the Department of Primary Industries said that the NSW greenhouse horticulture
sector had an annual growth rate of approximately eight per cent. Including vegetables, cut
flowers and nursery production, it had an annual farm gate value of $500m, and directly
employed 5000 people. Sydney and the central and mid-north coast were the main areas of
expansion (NSW Department of Primary Industries 2005, p3). The NSW Government promoted
development of greenhouse and hydroponic horticulture as sustainable, efficient in use of
water, fertilisers and space, and a supplier of fresh and safe produce. It said that this
controlled environment horticulture was a response to consumer demand for “a reliable
supply of fresh produce that is affordable, safe and clean, free of significant blemishes or
damage, and produced from agricultural industries that are ‘environmentally neutral’”. It

35
claimed it was the basis of a new, cleaner and more productive industry (NSW Department of
Primary Industries 2005, p7).
Greenhouse-grown tomatoes, in business terms, probably have more in common with other
greenhouse crops than with outdoor-grown tomatoes. Growers often grow other crops as well
as tomatoes, and they might identify more as being part of the protected cropping industry,
focusing on the technology they have invested in rather than a single crop, and might be a
member of the main national organisation – the Australian Hydroponic and Greenhouse
Association (AHGA). A strategic plan has been developed for growth of the ‘Vegetable
Protected Cropping Industry’ from 2006 to 2020, in which the industry is identified as having
1600ha of vegetables, herbs and floriculture under protected cropping, with an expected
trebling in the next 10 years (as of 2006). Yet the industry is not well structured at the state or
national level, and there is a low level of understanding between the industry and consumers
(Horticulture Australia Limited 2007, pp 4-7). The strategic plan began with an attempt to
overview the poorly documented national profile of the sector, providing a brief explanation of
the range of technologies and levels of investment involved in different states. Of note:
...of the approximately 1500 protected cropping growers nationally about 95% are currently in low and medium tech structures with concentrations in NSW and SA. Approximately 5% have invested in modern high tech systems mostly for tomatoes and cucumbers;
And:
modern high-tech houses producing mainly hydroponic tomatoes, and to a lesser extent cucumbers, are undergoing rapid expansion in most states. (Horticulture Australia Limited 2007, p1)
2.8 The gaps: where this project fits
Conceptually, I started this project at the consumption end, thinking about what concerned
consumers can do to contribute to GHG mitigation through everyday food purchases. Culture
was a significant part of why I picked the tomato as the food to follow.
Ongoing academic debate highlights the complexities of studying agri-food chains and around
meanings of words such as ‘local’. Translating this and cutting through to develop effective
programs for conventional shoppers who do not have the inclination to commit large amounts
of time or effort to investigating these ideas (even if they want to do their bit) is challenging.
Policymakers working for GHG emission-reduction through broad instruments need to take

36
into consideration these, as Barndt (2008) put it, ‘tangled routes’. Although I situate this
project in the ‘conventional’ food system, I do not denigrate local food systems or
underestimate the benefits that they can bring to communities, and the potential that they
might have in relation to transforming broader food systems. Rather, I am investigating some
of the issues around trying to translate one ‘value’ (GHG emissions) from ideas of local to the
existing mainstream food system in Australia.
This project follows the tomato, and its embodied GHG emissions, on its journey to Sydney
fruit shops. In doing so I draw on the food geography ‘following’ literature (for example, Cook
2006), by incorporating supply chain actors’ interactions with the tomatoes. This is an
important part of assessing the potential for change along the supply chain. Although I identify
with this more relational approach, I am also influenced by political-economic approaches to
food production, manifest in my assessment of a particular policy approach. However, by
coming at this project with the consumer in mind, even though not directly engaging the
consumer, the relational approach has a lot to offer. Even if information labelling is not
considered feasible, other GHG emission-reduction methods might be identified and made
more effective by understanding the issues and connections in the supply chain. I also identify
with Hartwick’s linking of the geographies and politics of consumption, in that my project
specifically aims to analyse the feasibility of consumers’ ability to make a difference in a policy
sense, in this case everyday purchases affecting climate change.
This project contributes to the understanding of the complex dynamics of the Australian fresh
tomato industry, particularly protected cropping, and its journey to the tomato consumer.
Taking an LCA-type approach while ‘following’ the tomato through the system and engaging
with its handlers, and also having an understanding of the consumer-choice literature, enables
me to investigate practicalities of a concept such as food miles or carbon labelling in the
Australian fresh food context.

37
3 METHODOLOGY
In this chapter I set out my approach to the case study on the fresh tomato agri-food chain,
including the scope and boundaries of the study. I explain how I became familiar with the
industry and recruited participants, and how I conducted the interviews. I then explain in
greater detail the quantitative methods used to calculate relative GHG emissions from each
part of the tomato journey. This is followed by an explanation of the qualitative approach I
used to analyse interview data.
3.1 General approach to tomato case study
After the decision to investigate the fresh tomato agri-food chain I set an initial scope and
some boundaries to the project. These were:
To focus on tomatoes sold in Sydney, and grown various distances from Sydney. This
would enable analysis of the relevance to GHG emissions of the transport portion of the
chain.
To include the Sydney wholesale markets as a central reference point for the study. In a
small case study, this would allow for several plausible combinations of tomato journeys
using actors trading at the markets.
To focus on retail fruiterers rather than supermarkets (because of known difficulties of
securing supermarkets’ participation), however not to exclude supermarkets if I succeeded
in recruiting them. Including both would require investigation of the dynamics of the
supermarket centralised supply and distribution system, as well as the nature of direct
contracts with suppliers. After some initial contact with a major supermarket chain I
judged that this would be difficult and would probably broaden the study too far and not
enable enough direct comparison between participants and journeys. In mid-2009,
however, I recontacted the major supermarket chain for some general comment, even if
not full participation. Despite some indication of interest, follow-up was lacking, and I
decided not to pursue further.
To end the tomato journey at the retail level, rather than continue analysis with how
consumers relate to tomatoes. I excluded consumers from my empirical research for two
reasons. First, out of necessity, to keep the overall project manageable. Second, there is

38
already a large body of research on consumer choices and decision-making. I felt that
whatever small survey or interviewing I could incorporate into this project would not be
able to cover all of the dynamics involved. Therefore I make a distinction between what
information can be provided to the consumer, and what the consumer decides to do with
the information. The feasibility of any system of information provision about GHG
emissions embodied in the agri-food chain partly depends on what consumers do with the
information. I rely on other studies for this element of my discussion and final analysis.
To only use publicly available quantitative methodologies that I could find myself. I did not
have access to LCA or other specialised software. This would be similar to the position of a
consumer making a considerable effort into finding out about where his or her food came
from, and its emissions profile.
3.2 Industry familiarisation and participant recruitment
Because the fresh tomato industry is not particularly organised as an industry, internet and
telephone directory searches for basic information about, and contacts for, the industry
proved unsatisfactory. I visited two small vegetable farm and shop operations on the NSW
south coast; one of which I had seen in a regional advertising campaign and the other through
roadside signage. Despite some interesting industry anecdotes, I decided not to seek further
participation from these two farms because neither sold through the Sydney Markets, and I
judged that the second grower was not interested in participating.
Information on the NSW (then) Department of Primary Industries (DPI) website led me to
contact two horticulturalist extension officers for the Sydney region, one based in western
Sydney and one based at the National Centre for Greenhouse Horticulture in Gosford. I met
the latter and his colleague, a research scientist interested in energy use in greenhouse
horticulture crops. Their assistance, grower contacts and encouragement for my project,
together with separate locational, methodological and seasonal limitations relating to field
tomatoes, helped me decide to focus on greenhouse-grown tomatoes rather than field
tomatoes or a combination of both. I decided to focus initial recruitment efforts on Sydney and
other growers who used medium to high-technology greenhouses, who were also most likely
to have good records. I also met with a DPI officer based at the Sydney Markets.
I also contacted Horticulture Australia Limited (HAL) after finding mention on its website of a
carbon footprint tool and workshop. This led to a meeting with the HAL Natural Resource and

39
Climate Manager and copies of the discussion papers from the workshop. Both of these
provided me with substantially better understanding of where the vegetable industry stands
with regard to thinking on climate change, and methodology to calculate GHG emissions.
Participation in the Australian Hydroponic and Greenhouse Association (AHGA) conference in
mid-2009 also led to further contacts and participants. In early 2009 the NSW DPI staff
member sponsoring my attendance referred the keynote speaker to me, as his speech related
to climate change. I met this industry consultant and this in turn led to a meeting with the CEO
of a fresh produce marketing and value-add company. It was through this meeting that I
gained access to Farm D, which is part-owned by the marketing company, at the very high-tech
end of the greenhouse tomato industry in Australia. The packaging procurement manager
interviewed also works for this company.
Attendance at the AHGA conference itself, which included a trade exhibition, was extremely
useful. In particular it gave me access to several manufacturers of key inputs into
hydroponically grown tomatoes, including growing media, seeds, and the glasshouse
manufacturing company that built the buildings and many systems at Farm D. Information
used in my quantitative analysis comes from several of these individuals.
At the AHGA conference I displayed a poster about my project and made available information
sheets at the NSW DPI stand. The poster included a call for anyone interested in participating
to contact me, and included my contact details. Unfortunately this was unsuccessful in
recruiting participants.
I contacted directly the Sydney Markets and retail fruiterers. A snowball effect from the
Sydney Markets employee led directly to one wholesaler and a grower-trader. Although the
grower-trader is not represented as a final participant, as he no longer grew tomatoes, my
attendance at his stall at the Sydney Markets led to interviews with another wholesaler and
the transport logistics manager. This wholesaler then referred me to another. Retail fruiterers
were selected for contacting via profiles in The Sydney Morning Herald Good Living
supplement, although one was interviewed following recommendation from Wholesaler C.
Ultimately, participants were limited to those willing to participate. With the exception of
Farm D, I approached only those growers contacted through NSW DPI. One of these growers
was also the only one I had been able to identify through secondary sources (a newspaper
article). Two further growers in the Sydney Basin (referred by DPI) agreed to participate,

40
however the interviews fell through due to one farm being sold in the days prior to our
arranged interview, and the other suffering from a heavy wind storm and then the owner
being unable to reschedule for a one-on-one interview. A third referred by DPI decided not to
participate due to time constraints.
Aside from the wholesalers interviewed, I approached two others, suggested by the Markets-
based DPI official. One of these did not respond and the other expressed that he did not wish
to participate. I directly approached two transport companies based at Sydney Markets
(contact details provided to me by the Sydney Markets employee). I judged these initial
responses as dismissive and decided not to pursue further. I contacted a third fruiterer based
on a newspaper profile, however after a brief description of my project I received no call-back.
Once I had two other fruiterers participating I decided not to pursue this one.
Figure 3 represents of the final scope and participants of the case study. Figures 4 to 9
illustrate some basic differences between examples of medium-, high- and very high-tech
greenhouse tomato growing. Table 4 contains the final list and description of participants,
including pseudonyms I have applied for this thesis.
Figure 3. Case study scope.
Wholesaler C
Wholesaler B
Wholesaler A
Sydney Markets Limited
• Owns market infrastructure
• Manages water, electricity, waste.
Farmer A
Regional NSW
Farmer B
Sydney
Farmer C
Sydney
Transport/
logistics
manager:
Based at Sydney
Markets
Retailer B
Retailer A
Retailer C
Farmer D
Interstate
Farm Transport Wholesale Transport Retail
Packaging
procurement
manager
Notes:
1. Participants in blue boxes and at Sydney
Markets Limited.
2. Dotted lines indicate transport f lows.

41
Figure 4. Medium-tech growing: plants in bags, gutter at floor-level.
Figure 5. Medium-tech growing: blow heater rather than floor heating.

42
Figure 6. High-tech growing: raised gutter, heating pipes on floor.
Figure 7. High-tech growing: Greenhouse roof that opens, circulation fans.

43
Figure 8. Very high-tech growing: glasshouse.
Figure 9. Very high-tech growing: additional heating pipe, ability to supply CO2 to plants, white equipment to reflect light.

44
Table 4. Participant pseudonyms and characteristics.
Participant & Pseudonym
Interview date
Recruitment Business and participant characteristics Data & analysis details
Farmer A – Andrew
13 February 2009
Via NSW DPI staff
Regional NSW, high-tech greenhouse sells most locally to shops, farmers markets and in own shop, few to Sydney Markets via an agent when excess stock.
Has been a farmer for many years but invested in tomatoes fewer than 10 years ago.
Uses coal for heating. Relies on rainwater.
Family farmer estimated to be about 50 years of age.
Quantitative:
data from interview and follow-up.
some case-specific analysis. Qualitative:
from interview transcript.
Farmer B – Lily
21 February 2009
Via NSW DPI staff
SW Sydney, high-tech greenhouse, sells all produce through Sydney Markets via an agent.
Previously farmed in lower tech multi-span greenhouses but upgraded building and infrastructure approximately five years earlier.
Uses LPG for heating. Uses Sydney Water.
Family farmer in her thirties.
Quantitative:
data from interview only; some researcher assumptions due to gaps.
Qualitative:
from interview transcript and notes from farm tour.
Farmer C –George
14 May 2009 Via NSW DPI staff
SW Sydney, medium-tech greenhouse (hydroponic system but in tunnel houses, using blow heaters rather than floor pipes, not computer controlled), sells all produce through Sydney Markets via an agent.
Is trying to cut costs rather than increase capital investment.
Uses LPG for heating. Uses Sydney Water.
Family farmer estimated to be in his fifties.
Quantitative:
data from interview only; some researcher assumptions due to gaps.
Qualitative:
from interview transcript and notes from farm tour.

45
Participant & Pseudonym
Interview date
Recruitment Business and participant characteristics Data & analysis details
Farmer D – Lachlan
17 July 2009 Via industry consultant
Very high-tech glasshouse. Mainly in distribution system for major retailers, but still sends substantial volume of produce to Sydney Markets.
Uses a range of energy and water sources.
Manager of the glasshouse and packhouse operation.
Estimated to be in his early forties and has a business background rather than a specific tomato background.
Quantitative:
data from interview and follow-up, including with some suppliers.
including some case-specific analysis. Qualitative:
from interview transcript and notes from farm tour.
Wholesaler A – Val
7 April 2009 Via Sydney Markets employee
Relatively small turnover, specialises in tomatoes.
A senior employee of the business and has been there for many years.
Estimated to be in his late forties.
Quantitative:
data from interview Qualitative:
from interview transcript and notes.
Wholesaler B – Jason
21 May 2009 Via my presence at Sydney Markets
Sells tomatoes among other fresh produce.
Estimated to be in his late thirties and is part of a family business.
Quantitative:
data from interview and follow-up. Qualitative:
from interview transcript.
Wholesaler C – Patrick
28 May 2009 Via Wholesaler B
Sells tomatoes among other fresh produce.
Sells both to large retail chains and independent retailers.
Estimated to be in his late thirties. Wanted to be an agent from the time he was a child, and established business with his brothers.
Business appears to be growing and is probably the largest of the three wholesalers interviewed.
Quantitative:
data from interview, follow-up and notes.
Some researcher assumptions due to data gaps, as detailed in results chapter.
Qualitative:
from interview transcript.

46
Participant & Pseudonym
Interview date
Recruitment Business and participant characteristics Data & analysis details
Markets employee – Chris
12 March 2009
Direct contact by email and telephone
Environment manager.
High focus on waste management.
Water use and carbon footprint are also in his area of responsibility.
Quantitative:
data from interview and follow-up.
Analysis of waste only, due to insufficient data.
Qualitative:
from interview transcript.
Retailer A – Alex
5 May 2009 Direct contact by telephone after seeing shop profile in newspaper
Central north-west Sydney fruit shop owner.
One of the sons in a family business. Estimated to be in his thirties.
Quantitative:
data from interview and follow-up. Qualitative:
from interview transcript.
Retailer B – Steve
1 July 2009 Direct contact by telephone after seeing shop profile in newspaper
Southern Sydney fruit shop owner.
Estimated to be in his thirties.
Owns three fruit shops in different parts of Sydney.
Has previous experience in fresh produce in the large retail chain sector.
Quantitative:
data from interview and follow-up. Qualitative:
from interview transcript.
Retailer C – Carlo
5 June 2009 Via Wholesaler C
NW Sydney fruit shop employee.
Only a few comments, very little quantitative data provided in interview.
Estimated to be in his late twenties.
Quantitative:
not included as insufficient data. Qualitative:
from notes from interview and following interview.
Transporter – Marc
15 May 2009 Via my presence at Sydney Markets
Transport and logistics manager for a company contracted to a medium-sized retail fruit and vegetable chain and based at Sydney Markets.
Estimated to be in his late twenties or early thirties.
Quantitative:
data from interview only.
limited due to insufficient data. Qualitative:
from interview transcript and notes made following interview.

47
Participant & Pseudonym
Interview date
Recruitment Business and participant characteristics Data & analysis details
Packaging Procurement Manager – Michael
9 July 2009 Via industry consultant
Works for fresh produce marketing and value-add company that has interests in various fresh produce farming sectors, including Farm D here.
Estimated to be in his early thirties and has been in his current job for about five years.
Quantitative:
not conducted
some data on supplies to Farm D. Qualitative:
from interview transcript.

48
3.3 Ethics
Ethics approval was gained from the University Committee prior to approaching potential
participants. This covered the general approach, information provided to participants, consent
form and semi-structured interview questions.
I faced two main ethical situations during the course of this project. Firstly, I had to decide how far
to pursue potential participants to be involved, and how far to pursue participants for follow-up
information post-interview. I judged each case on its merits and in several instances ceased
contacting the person on judging that they did not want to give me the information requested.
This process inevitably took time. Time and resource constraints eventually meant I could not keep
looking for additional participants who might provide more comprehensive data.
The second main ethical situation was whether or not to identify participants. After completing my
data analysis, including quoting of the participants, I decided to use pseudonyms and to keep
location details of farms and fruit shops imprecise to provide a level of anonymity to participants,
to avoid any potential for grievance on their part. In particular, I felt that the assumptions I needed
to make for some of the businesses, due to gaps in the data, would be better not linked to actual
people or businesses. This was despite all formal participants having signed the consent form
agreeing to be identified.
3.4 Interviews
I conducted semi-structured interviews with all participants listed in Table 4. All were taped except
for Retailer C. The interview with Retailer C was less substantial than expected – the owner was
busy and asked an employee to talk to me. He did not appear to have prior knowledge of the
interview and did not wish to be taped. Our time was constrained and there were few specific
answers he could provide especially in terms of energy use. For this reason I did not include
Retailer C in my final quantitative analysis.
Wherever possible, prior to the interviews I provided, by email, fax, post, or in person, the
participant information sheet and consent form (Appendices A and B). I again provided these at
the beginning of the interview and participants signed the consent form. The exception was with

49
Retailer C, who did not receive the information prior to interview. However, Wholesaler C was a
joint owner of the shop and it had been his suggestion to visit there.
Most interviews took 1-2 hrs, some longer depending on time available to the participant and
whether they included a tour of the operation.
The list of questions asked is at Appendix C. In addition to these open questions, specific data was
sought on energy use, water use and waste. A data recording form is at Appendix D. This data
recording form was a starting point and other sources were sometimes identified during the
course of the interviews. The basic form was also revised before each interview depending on the
type of business being visited.
I followed up by email and/or telephone with some participants who had indicated that they
would find out specific pieces of information. This (repeated) follow-up was unsuccessful in several
instances.
3.5 Quantitative methods
The aim of the quantitative investigation was to measure relative GHG emissions of tomatoes
bought in retail shops in Sydney, from a range of plausible farm-shop journeys. I chose a functional
unit of one kilogram of tomatoes. Secondary to this aim was to see what comparisons I could
make between different parts of the supply chain in these journeys, and identify key areas of
emissions.
I asked participants for quantitative data in relation to their direct and indirect energy use, as well
as water use and waste. There is no standard methodology available for this specific agri-food
chain (tomatoes within greenhouse horticulture, within horticulture, as a subset of agriculture,
plus the transport, wholesale and retail sectors, in an Australian context). As indicated in
Chapter 2.6.3, I needed to combine aspects of several methodologies. After data collection, I
adapted my analytical methodology, due to limitations and variation of the data received from
participants.
In the planning stage of this project I assumed that LCA, in accordance with the ISO14040 series,
would be appropriate. On further investigation I concluded that this was beyond the scope of this

50
project – especially if I was to investigate more than one possible supply chain. In addition, the
level of detail required for full LCA was beyond what could be expected from participants in a two-
hour interview. Hence I sought a simpler level of information. Similarly, as discussed in the
literature review chapter, abiding strictly to the process outlined in PAS2050 (BSI 2008) was
beyond the scope of this project. I have tried to adhere to the general objectives of the PAS2050,
and the process maps for Farm D, for example, are based on those from PAS2050. Both the ISO
standard and the PAS2050 are guides to the process, but actual emissions need to be calculated
using the most relevant emission factors for the country in which the measurements take place.
I developed a data recording form using the National Greenhouse Account (NGA) Factors,
November 2008 (Department of Climate Change 2008). This was so that I could conduct some
analysis using figures that participants would have to calculate if they should ever be included in
an Australian Government reporting or emissions trading scheme (at time of writing, there is no
indication from Government that this will occur, at least for farmers and small businesses). I used
the updated June 2009 NGA factors in the final analysis. The NGA Factors were ‘designed for use
by companies and individuals to estimate greenhouse gas emissions for reporting under various
government programs and for their own purposes’ (Department of Climate Change 2009, p5).
Organisations that meet the thresholds required to report under the National Greenhouse and
Energy Reporting Act 2007 need to refer to National Greenhouse and Energy Reporting
(Measurement) Determination 2008. The NGA Factors draw on this Determination but ‘have a
general application to the estimation of a broader range of greenhouse emissions inventories’
(Department of Climate Change 2009, p5). Emissions estimates that I have based on the NGA
factors include those for stationary energy, transport fuel, water use and waste.
Where possible, I included Scope 3 emissions (emissions upstream or downstream from the
reporting business) for these supplies or activities, in order to provide more of an LCA-type
analysis, even though participants might not be accountable for those emissions in a reporting
scheme. Also, to move closer to LCA, I asked participants a range of questions regarding indirect
energy inputs not covered by the NGA Factors, such as infrastructure, buildings and fertilizer.
These questions were influenced by the general literature on carbon footprinting and LCA.

51
After collating the raw data and conducting some analysis, I re-reviewed the broader methods
literature in light of the completeness of data gained through the interviews. A summary of the
methods chosen after the second review is presented in Table 5. The table includes
emission/energy factors considered even if not used in the final analysis due to insufficient raw
data. Future research could use these sources.

52
Table 5. Methods and data sources.
Element of analysis
Sources of emission or energy factors Data source Comments
Tomatoes n/a Raw, from participants. Tomato quantities provided by wholesalers and retailers included both greenhouse-grown and outdoor grown tomatoes.
Stationary energy
NGA Factors, June 2009 Raw, from participants. Raw data of different levels of accuracy.
When participant information on electricity use was expressed in $ terms only, I estimated usage from default supplier’s standard tariffs. Assumptions explained in individual calculations in Results chapter.
Domestic road transport (fuel only)
NGA Factors, June 2009 ABS average fuel consumption (transport legs)
Raw data regarding actual transport trucks between most participants was unavailable. Therefore emissions estimates for transport legs of the supply chain were based on average diesel fuel consumption rates for articulated and/or rigid trucks operating in Australia, determined by the ABS (2008, p13). Note that the ABS calculations contain a range of caveats and assumptions and by their national nature are not specific to particular journeys.
Water NGA Factors, June 2009 Raw, from participants Raw data insufficient to calculate wastewater emissions on site. Therefore water only analysed on usage basis rather than emissions from water use.
Waste NGA Factors, June 2009 Raw, from participants NGA Factors only account for landfill. Some participants keep waste onsite. For the purpose of this analysis I treated onsite waste as per landfill factors.
Raw data varied in accuracy.
Fertilisers and trace elements
Wells (2001) Raw, from participants.
To break down product information into chemical components, used fertiliser company websites and references.
Emission factors only cover manufacture of fertilisers and are NZ-based.
Raw data in various forms (eg. product names rather than component analysis) and from some participants only.
Analysed for Farm D only, as insufficient data from other participants.

53
Element of analysis
Sources of emission or energy factors Data source Comments
Chemicals Agrichemicals - could use Saunders et al (2006)
Insufficient raw data from participants.
Insufficient raw data. Not analysed.
Machinery & vehicles
Saunders et al (2006) and Wells (2001)
Raw, from participants.
Forklift mass assumptions based on information from two forklift dealers.
New Zealand-based factors.
Raw data varied in accuracy (analysed for Farms A and D only).
Buildings CBPR list of embodied energy in materials (Centre for Building Performance Research no date). Convert to emissions from Alcorn (2003).
Raw, from participants and suppliers.
CBPR and Alcorn (NZ-based) figures used in absence of an Australian list of building materials that combined both embodied energy and CO2 emission rates.
Raw data varied between participants. To apply CBPR and Alcorn factors require volume and/or mass of materials. Therefore analysis only conducted for Farm D.
International shipping of inputs/ supplies
Saunders et al (2006, p43)
Country of destination information from participants and suppliers.
Sea distances calculated using Sea Rates.com (Farnel Capital n.d.)
Analysed for Farm D only.
Saunders et al used a UK-based factor.
I used the emission factor from Saunders et al because it was in a food-miles-related study. However, figures regarding GHG emissions from overall Australian international sea transport are available in Apelbaulm Consulting Group (2007). My calculation is that if the latter were used, a slightly lower emission factor would be applied to shipping (0.005kgCO2/t-km instead of 0.007CO2/t-km.
Domestic road distances
n/a Google maps

54
3.6 Some notes on sources in Table 5 and methods used
3.6.1 Land clearing
Land clearing is included in the NGA Factors, but due to interview time constraints I did not canvas
this with participants. If they were to report emissions, they would need to calculate potential
emissions resulting from land clearing of their property.
3.6.2 Fuel consumption rates (FCRs) for articulated and rigid trucks
I had substantial difficulty obtaining an average FCR to use for articulated and rigid trucks for
tomato transport. The Department of Climate Change referred me to EU fuel standards as they
had nothing for Australia (S. Bridge 2009, pers. comm. 14 September), but I judged that it would
be better to find any figure for Australian conditions rather than try to account for differences
between Australian and EU fuels, trucks and driving conditions. As noted in Table 5, the ABS figure
used has a range of caveats attached, but I deemed it the most authoritative. Further, a supply
chain specialist advised that vehicle, road, congestion, route and the driver all impact on actual
fuel consumption of individual journeys (T Rafferty 2009, pers. comm. 16 September).
3.6.3 Fertilisers
Wells (2001) (and Saunders et al (2006)) only calculated energy and CO2 emission rates for the
manufacture of fertilizer components, rather than emissions released on use. The exception is
lime, for which Wells incorporated CO2 emissions from reaction with the soil (Wells 2001, p29). I
did not find any literature regarding differences between the physical interactions between
fertilizers and soils and other growing media used in hydroponics, such as cocopeat and rock wool,
and the consequent GHG emissions. Without conducting direct measurements, I could not account
for emissions at point of application.
Fertilisers in particular appear to vary greatly in their energy (and emissions) profile depending on
how and where they are manufactured. Lockeretz (1980, p23) pointed out differences between
production in different countries. There is a scarcity of public information about fertiliser
manufacturing processes in Australia (see, for example, Foran et al. 2005, V3, p89), hence the use
of the NZ-based rates of Wells (2001) and Saunders et al (2006).

55
Both Saunders et al (2006) and Wells (2001) only refer to CO2 emissions, rather than other GHG
emissions. It is not clear whether or not they have incorporated some conversion factor for other
emissions such as nitrous oxide and therefore included them in the emission factors. This needs to
be borne in mind when reading my results.
3.6.4 Buildings
Further explanation of the decision to use CBPR and Alcorn figures to explore embodied emissions
from building materials demonstrates both the scarcity of research of this type in Australia, and
the interconnectedness of some of the sources reviewed:
Saunders et al (2006) and Wells (2001) had some factors for buildings, but they were based on
dairy sheds and other farm buildings. I considered these to be too unlike plastic and glass
greenhouses to use in this project.
Australian-based O’Halloran et al (2008) refer to CSIRO for a general average figure of 0.098t
CO2 per Gj embodied energy for up-stream emissions;
combined with O’Halloran et al’s reference to CBPR’s list of embodied energy in various New
Zealand building materials (Centre for Building Performance Research no date) I considered
that rough estimates could be conducted for some of the buildings in this project, if sufficient
raw data had been available for each building material (the raw data was not complete
enough for full analysis).
On further investigation of the CSIRO embodied energy figure in December 2009, I learned
that CSIRO was no longer publishing this figure on its website. On contacting CSIRO, I was
advised that it had shifted its focus from embodied energy to LCA (including embodied energy)
(J Davidson, 2009, pers. comm. 18 December). Several references were provided, including the
Centre for Building Research data also referred to in O’Halloran et al.
CSIRO also referred me to the Commonwealth Department of the Environment, Water,
Heritage and the Arts. It in turn referred me to its Your Home Technical Manual
(Commonwealth of Australia 2008) for figures on embodied energy but not emissions. Your
Home is aimed at residential information and provides figures on embodied energy for some

56
common building materials. It does not, however, include corresponding figures for CO2
emissions. The manual also explains the precautions that should be kept in mind when
exploring embodied emissions. For example, it recommends comparing figures produced by a
single source using consistent methodology and base data. It claims that different calculation
methods produce vastly different results by a factor of up to ten (Commonwealth of Australia
2008, Fact Sheet 52).
In the absence of an Australian list that combined both embodied energy and CO2 emission
rates from building materials, rates for materials in New Zealand were used, as contained in
Alcorn (2003). Available alongside it on the Centre for Building Performance Research’s
website is another document which appears to be an update of the list incorporated in Alcorn
(2003), but only for embodied energy, not for CO2 emission rates. O’Halloran (2008, p28)
refers to this second list as being from 2005. Hence, the embodied energy figures from the
updated list have been used here, in conjunction with the CO2 emission co-efficients from
2003. Some of the Alcorn figures were higher than the Your Home figures, but I considered it
more important to have a more comprehensive and consistent list of data rather than try to
combine the different data sets and methods.
The Department also referred me to the Building Products Innovation Council, which is
conducting an LCA/LCI project (Building Products Innovation Council 2008). This project is part
of the AusLCI Project included in my literature review.
Having decided to use Alcorn and associated CBPR figures, I noted that one of Alcorn’s sources
is (Australian) Lawson (1996), which is also a key reference for the embodied energy section in
Your Home (Commonwealth of Australia 2008).
Overall, the quantitative methodologies that I have used enabled a core data set of CO2-e
emissions across participants, allowing comparisons to be made between participants and
different supply chain journeys. Then, as methodologies and/or raw data quality became less
comprehensive, two things happened:
I further scrutinised data from those participants with the most credible data sets.

57
I established a broader but more basic picture for those participants. For example, a process
map of indirect inputs to Farm D could give fairly comprehensive descriptive information
about sources and quantities of inputs; but not all embodied energy and consequent
emissions.
3.6.5 Allocation
A few words on allocation are required. Emissions, water use and waste have been allocated as
well as possible for the tomato component of each participating businesses. The only participant
where this was not necessary was Farm D, which is 100 per cent for tomatoes. Farm A also grows
strawberries, and has value-add operations including using non-marketable fruit into food
products, and a café and retail outlet. It is part of a family farm that includes two houses and there
is hay made from paddocks of grass. Farm B also grows eggplants, though at the time of interview
these were new, so it was considered that the data only referred to tomatoes. A house also used
electricity but this was considered to be minor use. Farm C also grew cucumbers and an 80%
allocation was applied for tomatoes. House electricity, in this case, was considered by the
participant to be probably greater than farm electricity. However, no figure was provided for
electricity, so this was not of concern. Wholesalers all sold tomatoes to different degrees in their
businesses. Wholesalers A, B and C traded tomatoes as 90%, 40% and 30% of their businesses,
respectively. Retailers A and B traded tomatoes as approximately 1% and 8.5% of their
businesses, respectively.
Information was also provided in different ways, so there has to be an allowance for
interpretation. Farm A’s tomato-growing and other operations were fairly separate – for example
the coal-fired heater was only used for tomatoes. So the farmer was able to provide raw data for
tomatoes in most cases. An allocation was applied to much of the data from Farmer C, the
wholesalers and the retailers. However at times, such as for waste, the participants might indicate
that none of the waste related to tomatoes. In such cases, that information was reflected in the
analysis.

58
3.7 Qualitative methods
I performed a qualitative analysis of the interview texts using a human geography approach drawn
from Dunn (2005), Waitt (2005), Cope (2005) and Mansvelt and Berg (2005). I particularly tried to
scrutinize the texts with regard to two of the strategies that Waitt (2005, pp180-182) expanded on
from Rose (2001): examining the texts with new eyes and ears, and familiarisation by absorbing
oneself in the texts. I explored both manifest and latent content analyses (as described by Dunn
(2005, pp100-101). Table 6 shows the process I undertook to analyse interview data.

59
Table 6. Steps undertaken in qualitative analysis.
Step Theme identification and analysis
1 Reviewed all transcripts against audio and grouped with any field notes.
Made literal corrections to text.
Noted in margins initial obvious (largely descriptive) themes or subjects in text.
2 Using a fresh version of reviewed transcripts, coded for emergent themes.
Manual coding using a colour system with highlighters and post-it notes.
Some themes originated from interview questions, others emerged without my prompting.
Noted in right margin any observations of interplay between themes.
Noted in left margin possible suggestive questioning – took into account during further analysis.
Themes identified:
o Connections with tomatoes o Concept of ‘local’ o Location, and particular locations o Climate change o Seasons – crop season, and calendar
seasons o Knowledge about origins of product –
including perceptions about what the consumer knows
o People and supply chain connections o Supermarkets and their influence o Other influences
o Technological connections o Economic connections o The environment o Supply chain – before and after the
participant o Weather – often interspersed with what are
really matters of ‘climate’ o Business o Costs o Quality o Freshness
o Hydroponic and/or greenhouse tomatoes vs field-grown tomatoes
o Tomatoes grown in Sydney o Change in industry, and the potential for
change o General information about the tomato
industry o Culture o Flavour and taste o Health o Biological and disease aspects

60
Step Theme identification and analysis
Interplays noted between themes:
o Seasons and growing location o Environment and health o Technology and flavour o Climate change and cost o Supermarkets and weather
o Localness and freshness o Quality and economy and supply chain o Economic and weather o Economic, weather and chain o Culture and flavour
o Technology and people o Technology and weather o Biological and technological o Technology and cost
Items largely of a quantitative nature were not coded for initially, but the following were identified as themes that I could return to: o Water
o Waste o Fuel o Chemicals
o Vehicles
3 Reflected and identified other potential themes for coding and analysis: o Cool rooms (most participants had these
but could not answer questions about them). Could be an area, or example of area, where information provision might encourage emission reduction.
o Concept of responsibility o Concept of reliance o Concept of constraint
o Control o Lack of knowledge about issues raised in
interviews
4 Coded any additional field notes and notes from meetings with industry contacts (not actual participants in tomato journey).
5 Selected themes from initial list that were prominent and/or critical to project and explored further in individual documents.
Reviewed coding of individual theme
Conducted word searches in electronic versions of transcripts, if necessary
Collated quotes from all transcripts and analysed together in new document Themes analysed individually:
o Connections with tomatoes o The weather o Seasons o Climate change
o Taste/flavour o Control o Reliance o Potential for change
o Costs o Greenhouse-grown versus field tomatoes o Quality
6 Coded for intensity of feeling expressed by participants.

61
Step Theme identification and analysis
7 Considered whether other themes needed to be analysed with respect to quantitative results.
Coded for and analysed water and waste themes
8 Drew web of themes for topics to be discussed under ‘control and reliance’, and revised overall list of themes to discuss.
9 Explored two more themes that emerged after multiple readings of the transcripts:
relationships between people acting at different parts of the supply chain
the various names and labels that participants applied to tomatoes
10 Included a reflexive statement about how my own approach to the research might influence results
In discussion chapter
11 Included some discussion on the way the research was conducted, participants recruited etc, and how this might affect results.
In discussion chapter

62
As I reviewed and re-reviewed the transcripts to analyse the various themes, it became clear that
the language of control and reliance crossed over many of the subject themes. ‘Control and
reliance’ became not only an important theme in itself, but a lens through which to view and
connect a range of themes, including some which had been identified earlier but not analysed in-
depth. These included technology, people and business issues. Figure 10 shows the web, and flow,
of themes that guided this part of the results presentation.
Figure 10. Web of themes centred around control and reliance concepts.
Having established the methodologies, the next two chapters present the quantitative and
qualitative results gained in line with these methods.
1. Climate control in greenhouse
• technology – rely on to control the environment•Can’t rely totally on technology – must monitor.
6. Control of plant•via inputs (but also rely on)
• season, •production at farm level.
•Some control of product after farm in industry (gassing).
Change relies on volume and facilities across
industry/broader industry
9. Weather impacts•right through supply chain
8. Still dependent on weather
•actions and costs depend on weather.
Control by rules•use own staff
2. Reliant on energy• what is available•Knowledge of•Some backups to increase control•One wholesaler says can’t control, but Markets do make effort to control
5. Expertise essential• mainly farmers
• Some talked in terms of control, others reliance.
Control and reliance
4. Rely on people monitoring
3. TechnologyRely on to control
environment.
Quality control
10. Reliance on others in supply chain.
•Control of product specifications for customer.
•Can’t control customer satisfaction.
7. Business success/profitsControl: costs, cost control;
Reliance: on reputation, flavour, cash-flow, light
budget.
As expertise improves, so does control over plant.
Can’t totally rely on technology
but

63
4 TOMATO JOURNEYS AND THEIR GHG EMISSIONS
This chapter summarises overall results of the quantitative research about the GHG emissions,
water use and waste associated with the tomato production supply chain from farm to fruit shop.
The majority of results were around GHG emissions, and these are discussed first. Different parts
of the chain are discussed separately and then compared. This is followed by additional analysis on
Farms D and A. Waste and water use are then discussed individually.
4.1 Evaluation of overall results – GHG emissions
Tables 7 to 9 show summaries of emissions of CO2-e calculable using NGA factors (2009), for each
of the participants, and Table 10 shows their water use and waste. Detailed explanations of
assumptions and calculations for each participant on which these summary tables are based are in
Appendix F. Raw results are in Appendix I.
Throughout this chapter, where additional embodied GHG emissions have been included, they are
identified. The results contain the overall caveat that it is a small sample, and information
regarding only one year (with the exact 12 month period referred to varying across participants).

64
Table 7. Applying NGA factors to raw data for energy use.
Categories from NGA factors June 2009 Farmer A (t CO2-e)
Farmer B (t CO2-e)
Farmer C (t CO2-e)
Farmer D (t CO2-e)
Wholesaler A (t CO2-e)
Wholesaler B (t CO2-e)
Wholesaler C (t CO2-e)
Markets (t CO2-e)
Retailer A (t CO2-e)
Retailer B (t CO2-e)
Transport-logistics (t CO2-e)
Scope 1 emissions - Stationary energy (non-transport) Fuel combustion emissions – solid fuels - Black coal 953.0 nil nil nil nil nil nil nil nil nil nil
Scope 1 emissions - Combusting gaseous fuels (for heat or electricity) Natural Gas distributed in pipeline nil nil nil 452.0 nil nil nil unknown nil nil nil
Scope 1 emissions - Fuel combustion emissions – liquid fuels for stationary energy Diesel 0.6 nil 0.5 91.0 nil nil nil unknown nil nil unknown Unleaded petrol (gasoline) 1.2 unknown nil unknown nil nil nil unknown nil nil unknown Liquefied petroleum gas nil 670.0 50.1 unknown 12.6 12.3 24.0 unknown 0.0 nil 72.0
Scope 1 emissions -Transport fuel
Unleaded petrol (gasoline) 14.9 nil nil nil 10.7 nil unknown unknown nil nil 1134.0 Diesel fuel 1.1 nil nil nil nil nil 30.7 nil 0.5 nil nil Liquefied petroleum gas nil nil 1.3 nil nil nil nil nil nil nil nil
Scope 2 emissions - Consumption of purchased electricity 50.6 112.0 unknown 1290.0 16.0 29.0 61.5 unknown 3.2 16.8 94.3
Scope 3 emissions - black coal 49.7 nil nil nil nil nil nil nil nil nil nil
Scope 3 emissions - diesel 0.1 nil 0.0 6.9 nil nil 2.3 unknown 0.0 nil unknown
Scope 3 emissions - unleaded petrol 1.2 unknown nil unknown 0.8 nil unknown unknown nil nil 89.5
Scope 3 emissions - LPG stationary energy nil 55.9 4.2 unknown 1.1 1.0 2.0 unknown 0.0 nil 6.0
Scope 3 emissions - LPG transport nil nil 0.1 nil nil nil nil nil nil nil nil
Scope 3 emissions - natural gas nil nil nil 122.0 nil nil nil unknown nil nil nil
Scope 3 emissions - purchased electricity 10.2 22.7 unknown 234.0 3.2 5.9 12.4 unknown 0.6 3.4 19.1
Notes 1. Ref: NGA Factors, June 2009, Section 2 (Scope 1 and 2 emissions) and Appendix 4 (Scope 3 emissions). 2. Figures in this table rounded to 1 decimal point. Figures that present as 0.0 have real values that are less than 0.05.

65
3. LPG for stationary energy: Use Farm B results with caution as contains researcher estimate. Farm C results reflect what participant hoped to limit his usage to this year, rather than actual use. Markets usage unknown but considered insignificant.
4. Transport fuel emissions – gasoline: Farm A contracts out transport to Sydney. Farm D and Retailer B contract out transport. Transport-logistics co. result to be used with caution as includes researcher estimate of allocation between use of pre- and post-2004 vehicles.
5. Transport fuel emissions – diesel: Farm A contracts out transport to Sydney. Farm D and Retailer B contract out transport.
6. Consumption of purchased electricity: Use Farm B results and transport-logistics co. results with caution as they contain researcher estimates.
7. Scope 3 emissions – diesel: Farm D figure only accounts for stationary energy diesel use, given transport contracted out.

66
Table 8. Applying NGA factors to raw data for waste.
Categories from NGA Factors June 2009
Farmer A (t CO2-e)
Farmer B (t CO2-e)
Farmer C (t CO2-e)
Farmer D (t CO2-e)
Wholesaler A (t CO2-e)
Wholesaler B (t CO2-e)
Wholesaler C (t CO2-e)
Markets (t CO2-e)
Retailer A (t CO2-e)
Retailer B (t CO2-e)
Transport-logistics (t CO2-e)
Scope 3 emissions - Green waste
45.5 6.5 unknown nil nil nil nil nil nil nil unknown
Scope 3 emissions - Mixed waste to landfill - commercial & industrial
unknown unknown 8.7 1190.0 nil 6.3 nil 6600.0 n/a nil unknown
Scope 3 emissions - Mixed waste to landfill, calculated as food waste
nil nil nil nil nil nil nil nil 0.2 39.8 unknown
Notes 1. Ref: NGA Factors, June 2009, Appendix 4. 2. Figures in this table rounded to 1 decimal point. 3. ‘n/a’ indicates data not available. 4. Farm A’s green waste is piled on farm, and is probably contaminated with nylon string and plastic clips. I applied
Scope 3 methodology. 5. Wholesalers’ green (food) waste is recycled, therefore has value of zero emissions. 6. Farm A puts a small amount of mixed waste from tomato operation in weekly rubbish bin. Amount unknown,
considered minimal and excluded. 7. Wholesaler B's mixed waste figure may be inflated, as the best emission factor available was for paper, but it is
likely that bins also contained lighter waste. 8. Waste water could not be estimated due to insufficient data about quantity of waste water and sludge.
Participants used a variety of systems.

67
Table 9. Total CO2-e emissions (t) per tonne of tomatoes, by participant.
Farmer A (t CO2-e)
Farmer B (t CO2-e)
Farmer C (t CO2-e)
Farmer D (t CO2-e)
Wholesaler A (t CO2-e)
Wholesaler B (t CO2-e)
Wholesaler C (t CO2-e)
Markets (t CO2-e)
Retailer A (t CO2-e)
Retailer B (t CO2-e)
Transport-logistics (t CO2-e)
TOTAL for total tomatoes 1128.2 867.1 64.9 3385.9 44.4 54.5 132.9 unknown 4.6 60.0 unknown
Tomatoes (t) (yield or traded) 300.0 240.0 224.0 4421.6 2600.0 1544.2 7800.0 unknown 41.6 55.0 unknown
TOTAL per tonne of tomatoes 3.8 3.6 0.3 0.8 0.0 0.0 0.0 unknown 0.1 1.1 unknown
Notes 1. Ref: NGA Factors, June 2009, Appendix 4. 2. Figures in this table rounded to 1 decimal point for display purposes, therefore sum totals may not add up exactly.
Wholesalers A, B & C total emissions per tonne of tomatoes are less than 0.05t. 3. Farm B totals to be used with caution, as electricity and LPG figures include researcher estimates, and participant
indicated it had not be a ‘good’ yielding year. 4. Farm C ‘total per tonne of tomatoes’ figure should not be used, as electricity and green waste unknown and so not
included. 5. Use with caution Wholesaler C results expressed per tonne of tomatoes traded as figure for total tomatoes traded
based on researcher estimate from information provided (see Appendix F for calculations). 6. Markets figures too uncertain to provide credible totals. 7. Transport-logistics co. unable to estimate allocation for tomatoes, so breakdown of emissions for tomatoes not
possible.

68
Table 10. Water and waste per tonne of tomatoes, by participant.
Water or waste Farmer A Farmer B Farmer C Farmer D Wholesaler
A Wholesaler
B Wholesaler
C Markets
Retailer A
Retailer B Transport-
logistics
Total water used (L) p.a. (tomato allocation)
15,000,000 24,663,000 unknown 217,425,987 unknown unknown unknown unknown 1,560 unknown unknown
Total water (L) p.a. per tomatoes (t)
50,000 102,763 unknown 49,174 unknown unknown unknown unknown 38 unknown unknown
Total waste (t) p.a. (tomato allocation)
35.0 5.0 7.9 1079.0 1.6 7.7t 7.5m3 unknown 0.2t 66.3t unknown
Total waste (t) p.a. per tomatoes (t)
0.1 0.0 0.0 0.2 0.0 0.0 0.0m3 unknown 0.0 1.2 unknown
Notes 1. Raw data; for comparative purposes. 2. Total water (L) p.a. per tomatoes (t) rounded to nearest whole number for this table. Total waste (t) and m
3 p.a.
rounded to one decimal place for this table. Total waste (t) and m3 per tomatoes (t) also rounded to one
decimal point for this table; total waste figures reading 0.0 have actual values less than 0.05t or 0.05m3. Totals
may not add up exactly due to rounding. 3. Use Farm B water estimates with caution as based on researcher estimate from information provided (see
Appendix F for calculations) and participant indicated it had not be a ‘good’ yielding year. 4. Cannot compare waste for Farms A, B and D, as information was provided for different categories of waste, and
Farm B waste seems too small. Farm A only includes green waste on farm. 5. Use Farm B data with caution, as so different from others. Farm C mixed waste to landfill only - green waste on
farm with amount unknown. 6. Lack conversion factor for plastic waste volume to weight (Wholesaler C). 7. Sydney Markets tenants' water use not metered.

69
4.1.1 Farms
Results suggest that fuel used for stationary energy can have a substantial impact on the
emissions of an operation. Farm A’s total emissions estimated per tonne of tomatoes,
including Scope 1, 2 and 3, was 3.761t CO2-e per tonne of tomato yield, nearly five times that
of Farm D, at 0.766t CO2-e. This result for Farm A appears defendable, given the similar figure
for Farm B (3.613t CO2-e per tonne of yield). Note this is a rough comparison, bearing in mind
the poorer quality of Farm B’s figures, combined with various factors that could affect
efficiencies (such as climate, trade-offs with water and fertilisers).
The results strongly suggest that coal is causing higher GHG emissions per yield at Farm A,
compared to Farm D’s natural gas, diesel and electricity. But it is possible that other factors are
also involved. Farm B has a similar amount of overall GHG emissions per tonne of tomatoes as
Farm A (noting the caveats on Farm B’s figures mentioned above). Farm B uses LPG together
with an estimated twice the amount of electricity used by Farm A, rather than coal. Given this,
it is possible that it is not only the coal per se but efficiencies at the large-scale Farm D that
contribute to the difference in GHG emissions per tonne of yield. A larger sample size of farms
of similar scales and technologies (both of Farms A/B and D) would help determine this.
Having said this, if Farm B had its claimed typical normal higher tomato yield of 330t, its
emission profile would be significantly better, at about 2.627t CO2-e rather than 3.613t, and
therefore only about 70 per cent of the GHG emissions of Farm A. If that were the case, it
could point to coal being the main reason for higher GHG emissions per tonne of production at
Farm A. A study using several years of data would be able to better determine this.
To fully compare energy used via the fuels, usage rates need to be discussed. Table 11 shows
energy content and emission factors for four key fuels discussed here.

70
Table 11. Fuel combusted for stationary energy purposes.
Fuel combusted Energy content factor
Emission factor kg CO2-e/GJ (relevant oxidation factors incorporated)
CO2 CH4 N2O
Black coal (other than that used to produce coke) 27.0GJ/t 88.2 0.03 0.2
Natural gas distributed in a pipeline 39.3 x 10⁻³
GJ/m3 51.2 0.1 0.03
Liquefied petroleum gas 25.7GJ/kL 59.6 0.1 0.2
Diesel 38.6GJ/kL 69.2 0.1 0.2
(Source: Department of Climate Change 2009, Tables 1, 2 and 3)
Given that 1kwH converts to 3.6x10⁻³GJ (Department of Climate Change 2009, p53, Table 30),
electricity can be compared to the fuels in Table 11 on a GJ basis. The following workings
compare the major sources of stationary energy use at Farms A and D:
Stationary energy use at Farm A: 400t coal. At 27.0GJ/t, this gives 10,800GJ. + purchased electricity 56,893kWhx3.6x10-3(=205GJ) = 11,005GJ. Per tonne of tomatoes (/300) = 36.7GJ. Stationary energy use at Farm D: 8,798GJ natural gas. + 33.93kL diesel at 38.6GJ/kL (=1310GJ) + purchased electricity 1,668,913kwH x3.6x10-3 (=6008GJ) = 16,116GJ. Per tonne of tomatoes (/4421.6) = 3.6GJ.
When examined in terms of energy content, Farm D was approximately 10 times more energy
efficient than Farm A in heating/cooling/powering irrigation. This strongly points to coal use
being the primary reason for Farm A’s higher use per tonne of yield, though it is still expected
that there would be other efficiencies at Farm D contributing to its relative efficiency. The
extent to which increasing the size of the greenhouse and therefore plants heated affects
efficiency of the heating system is not known here, but (at least top-end) greenhouse
designers would know this. Availability of efficient fuels is relevant geographically; for
example, Farm A is in an area where natural gas is not piped. Figure 11 illustrates coal
combustion at Farm A.

71
Secondly, for Farm D at least, GHG emissions from stationary energy use and then waste
appeared more significant than embodied GHG emissions. Further analysis of embodied GHG
emissions at Farm D is included in Section 4.2, as are results of some embodied GHG emissions
at Farm A. Despite the various caveats around the calculations, the embodied GHG emissions
at Farm D that could be estimated here (and so are conservative, a minimum only) appear to
be about 13% of the farm’s overall annual GHG emissions estimated, and include about 8% p.a.
from annual allocation from capital building and infrastructure, and only 3% from fertilisers.
Finally, the results suggest that efficiencies by level of farm technology might be worth further
investigation. Both Farms A and C have waste piled up on the farm, and Farmer C considered
electricity to be a minor input, which it is (relative to coal) at Farm A. Going past the raw
results in which waste and electricity are unknowns at Farm C, and creating a plausible
scenario at Farm C by adding the same amount of electricity use and waste and resultant GHG
emissions as Farm A (approximately 60.8t – Scope 1 and 3 – and 45.5t CO2-e respectively),
Farm C’s emissions per tonne of tomatoes would be approximately .764t CO2-e. This would put
Farm C at approximately the same level of efficiency as Farm D. Perhaps (though only a larger
study could investigate this) medium-tech (Farm C) and very high-tech (Farm D) forms of
greenhouse growing can gain greater efficiencies than high-tech (Farms A and B), at least in
terms of GHG emissions. In this case, Farm C was experimenting with different cost
efficiencies, including minimizing heater use to save on fuel. It should be noted that it is
expected that there would be considerable economic implications if this hypothesis were
found to be accurate, as one expects that the middle level technology (represented by Farms A
and B) are the more reachable goals for family-run and small business operators. This style of
greenhouse, with 24/7 heating control and ventilation options and flow-through irrigation, and
therefore the greater control over plant conditions, is held up as best practice for pest and
disease control, and overall control of the crop, compared to the ‘medium-tech’ farming
represented by Farm C. Very high-tech farms like Farm D are in their own league regarding
levels of capital investment.
A study with greater number of participants, conducted over more than one year would
produce more conclusive results between different types of farms and whether any individual
farm is consistently more or less efficient than another.

72
Figure 11. Coal-fired water heater is located in shed behind front-end loader.

73
4.1.2 Wholesalers
Of the emission sources analysed, electricity and LPG were the main sources of GHG emissions
for wholesalers.
It is difficult to understand why Wholesaler B has roughly twice as many GHG emissions per
tonne of tomatoes than either Wholesaler A or Wholesaler C. It is possible that A and C are the
anomalies and that most wholesalers might be closer to B. In particular, the total figure for
Wholesaler C is based on an estimate by me of total tomatoes traded. A larger sample would
reduce uncertainty around anomalies.
As a group, the wholesalers were relatively easy to analyse. Being tenants at the Markets, they
share the same overall infrastructure, although the size and fit-out of their rented spaces
varies – Figure 12 shows Wholesaler B’s main space, but he also has a cool room to one side.
Specifically, installation of cool rooms and office space (including air-conditioning) depends on
the tenant and this would vary their embodied energy, perhaps substantially. Electricity use on
the tenants’ sites was incorporated in the analysis here, but embodied energy was not.
The analysis here was unable to include leakage of cool room gases as none of the participants
had knowledge of the gases or leakage rates. An allocation of embodied energy in Market
infrastructure would be desirable, but was unable to be determined due to incomplete
information on infrastructure and utility use, and on total tomatoes traded at the Markets. An
overall figure for all fruit and vegetables traded is available but this combines wholesalers with
the growers’ markets. No breakdown to tomatoes was available. It was not possible to present
a credible final figure for emissions at the Market facility level, due to lack of information on
significant inputs and the inability to allocate for tomatoes only. Industry could develop such
an assessment, as they would have the data required for emissions (deemed confidential and
therefore not provided to me). Although total tomatoes traded would likely be unknown, an
estimate of the percentage of overall trade could be determined.
Figures for tomatoes traded by both wholesalers and retailers were for all tomatoes, grown
indoors or outdoors. A range of inputs at the wholesaler level (as with all levels) were not
included in the analysis. Energy embodied in equipment and inputs such as packaging and
cleaning chemicals was not analysed or compared. It was considered that not enough data, nor
applicable coefficients with which to analyse it, was known about wholesalers’ embodied
energy costs to make it worthwhile analysing the few that could be, such as forklifts.

74
Figure 12. Some of the fresh produce stored by Wholesaler B.
4.1.3 Retailers
Without a larger sample size, it is impossible to tell whether the tenfold difference between
GHG emissions from Retailer A to Retailer B seen in Table 9 is primarily an allocation problem;
error on the part of one or both participants or actual differences in electricity use and waste. I
consider the latter to be unlikely, as both participants appeared to be established businesses,
and good business sense would not allow for such massive waste of resources.
Given the vast difference in results between Retailer A and Retailer B, it is difficult to draw
conclusions about retailers per se, or contrast between the two participants. Comparisons
between the two retailers regarding transport and water use were also difficult, as Retailer B
contracts out transport, and Retailer B did not know quantity of water used by the business.

75
Not included in GHG emissions estimates were potentially key inputs such as foam trays and
plastic shopping bags. As with wholesalers, chillers/cool rooms are important pieces of
equipment/infrastructure in fruit shops; however, participants were unable to provide
information about gas leakage. Their embodied energy is not considered here, for the same
reasons as for wholesalers.
4.1.4 Comparing farms to wholesalers to retailers
Taking into account case specifics, it appears that farms account for a far greater amount of
GHG emissions per tonne of tomatoes than wholesalers or retailers (disregarding Retailer B),
and that wholesalers have far fewer GHG emissions than retailers. Figure 13 represents the
GHG emissions per tonne of tomatoes at each step from farm to retailer. Figure 14 shows that
variance between the GHG emissions of different businesses can substantially impact the final
GHG emissions embodied in the production-shop journey of a kilogram of tomatoes.
When embodied GHG emissions of inputs are included, it is proposed that farms would have
greater embodied GHG emissions per unit of produce than wholesalers or retailers, given the
number and quantity of inputs that go into producing the crop. Infrastructure at Sydney
Markets is substantial but potentially small compared to farms once allocation among all
tenants occurs. And the sheer tonnage of tomatoes moved in a year means that, by weight of
produce, a larger wholesaler’s absolute emissions are shared across many more tomatoes than
even Farm D. It is also possible, however, that the percentage of embodied GHG emissions (of
inputs) of all GHG emissions at a wholesaler or retailer could be proportionally higher than at
farms and therefore be more significant to a business when deciding where to focus GHG
emission reduction efforts.

76
Figure 13. Schematic diagram of relative CO2-e emissions for stationary energy use, fuel and solid waste, per tonne of tomatoes by businesses/sections of tomato journey.
Notes 1. For data see Tables 9 and 12. 2. Includes some Scope 3 emissions but not all embodied emissions. 3. Totals for Farm B, Transport from Farm B to the Markets, and Wholesaler C involve substantial
unknowns or assumptions and should be used with caution. Farm C totals were judged too uncertain to include in this Figure.
4. Transport representations only include fuel-related emissions estimates. 5. Box around Sydney Markets is representative of the place and infrastructure, but is not a numerical
representation of its CO2-e emissions. Wholesalers, along with other businesses, operate within the Markets, and transport goes to and from the Markets.
Sydney
Markets
Wholesalers
A
A
A
B
B
B
C
D
RetailersFarms TransportTransport

77
Figure 14. Two potential tomato journeys and associated Scope 1 and 3 CO2-e emissions for stationary energy use, fuel and solid waste.
Note. Figures inside red dots indicate tonnes of CO2-e emissions per tonne of tomatoes grown or traded. Figures inside red dots along arrows are estimates for transport portions of each journey (fuel only).
4.1.5 Comparing farms to transport
On-farm GHG emissions appear to be far greater than GHG emissions from fuel used for
transport to market. Depending on the distance to market (and therefore GHG emissions from
transport fuel), transport legs may involve fewer or greater GHG emissions per tonne of
tomatoes than at the wholesale or retail operations. Hence transport can be a relatively
significant source of GHG emissions when compared to those businesses alone. Table 12
shows estimates of GHG emissions due to transport of tomatoes from farms to Sydney
Markets and from Sydney Markets to fruit shops. Further details and calculations are
contained in Appendices E and F. Focus in the discussion here is on transport from Farms A and
D. This is a hypothetical scenario, as neither of the actual transport companies that take
tomatoes from these farms to the markets was interviewed, and the information gained from
the transport-logistics participant lacked some key data, such as the total amount of tomatoes
carried. Several assumptions were required to create the scenario; the main one being the
application of an FCR (as discussed in Section 3.6.2). By applying one FCR, it was also necessary
Sydney Markets
Farm A
Regional NSW
Farm D
Interstate
Wholesaler A
Wholesaler B
Retailer B
Southern Sydney
Retailer A
Central-northern
Sydney
3.761 0.110
0.002
0.138
0.017
0.039
0.004
0.0350.766 1.090
Journey 1: 3.929t CO2-e per
t tomatoes
Journey 2: 2.033t CO2-e per
t tomatoes

78
to assume the same road, truck, driver and volume conditions. Therefore, the difference in
results reflects kilometres travelled and percentage of laden weight from the particular farm
(Farm A packs fewer kilograms of tomatoes onto a pallet than Farm D). Only GHG emissions
from the fuel used are considered, rather than embodied GHG emissions in the truck and
business.
Table 12. Transport from farms to Sydney Markets and from Sydney Markets to retailers.
From NGA Emission Factors June 2009
Farmer A (t CO2-e)
Farmer B (t CO2-e)
Farmer C (t CO2-e)
Farmer D (t CO2-e)
Retailer A (t CO2-e)
Retailer B (t CO2-e)
Total Scope 1 GHG emissions transport - diesel; per t tomatoes transported to Sydney Markets
0.036 0.004 0.004 0.129 0.002 0.003
Total Scope 3 emissions - diesel, per t tomatoes
0.003 0.000 0.000 0.010 0.000 0.000
Total Scopes 1 & 3 emissions - diesel, per t tomatoes
0.039 0.004 0.004 0.138 0.002 0.004
If all of participant's tomatoes went to/came from Sydney Markets this way
11.672 0.918 0.877 611.609 0.074 0.198
Transport to/from Sydney Markets as % of pre-/post-market emissions not including embodied emissions (post-market for retailers)
1.02% 0.11% 1.33% 15.30% 1.58% 0.33%
Notes 1. All figures in this table, except final percentages, displayed to three decimal places. Therefore totals
may not add up exactly. Figures reading 0.000 have actual values less than 0.0005. 2. Assuming same truck, mass and road conditions. 3. Assumes maximum 22 pallets and maximum mass from Farm D. 4. Varies depending on laden mass of truck. 5. Detailed calculations and assumptions are included in Appendix E. 6. Use comparisons with caution as level of information varied between the participants. 7. Use Farm B and C figures with caution as using on-farm GHG emission figures based on various
assumptions and unknowns. 8. For Retailer A, figures used are from the hypothetical transport scenario (rather than the raw data
provided by participant) to enable a fair comparison. If using raw data, with assumptions, result is approximately four times the GHG emissions estimated here. See Retailer A calculations in Appendix F for details.
Applying average figures, rather than actual truck, journey and volume, results in little better
than a straight metric of the kilometres travelled. It might be useful for calculating broader
categories of food, such as in Gaballa et al (2007), but not for comparing two types of
tomatoes sitting next to each other in a store.
Taking the assumptions into account, though, the figures show that transport (fuel only, Scope
1 and 3) from Farm D to Sydney Markets would involve 0.138t CO2-e emissions per tonne of

79
tomatoes, equivalent to about 16% of on-farm GHG emissions per tonne of tomatoes that
have been able to be calculated (including embodied GHG emissions). If all tomatoes from
Farm D were trucked to Sydney Markets, transport would account for about 14% of Farm D’s
pre-market GHG emissions calculable in this project, including embodied GHG emissions at
farm level. If not including embodied GHG emissions, it would account for about 15% of pre-
market GHG emissions (if Farm D sent all tomatoes to Sydney Markets). Appendix G contains
greater detail of calculations for Farm D.
If all tomatoes from Farm A went to Sydney Markets, as part of a mixed load, the fuel would
account for about 1% of pre-market GHG emissions, not including embodied GHG emissions.
Clearly, distance matters in absolute terms – Farm D has a far greater distance to travel than
Farm A – and the more efficient the farm, the greater percentage of pre-market GHG
emissions are from transport. Although there are embodied GHG emissions to investigate in
the transport sector, on-farm GHG emissions appear to be far greater than transport.
Despite the assumptions required, this analysis is useful to find areas of relative GHG emission
concentration. For example, the transport fuel, if all tomatoes from Farm D went to Sydney
Markets, is nearly five times as GHG emission-intensive per tonne of tomatoes as fertiliser use
at Farm D. So, all else being equal, in this scenario it would be preferable to improve transport
options before fertilisers. More in-depth analysis regarding the fertiliser manufacture and
transport would need to be conducted to fully assess options.
The data received from the transport-logistics company participant was incomplete and
therefore more useful in a qualitative and contextual sense. For example, Figure 15 shows a
variety of mixed pallet loads that are waiting to be transported by the participant’s company
to different retail shops across Sydney. Some of these pallets would contain some boxes of
tomatoes, but determining the percentage of load weight on the truck taken up by tomatoes
would be time consuming. Further research incorporating actual data on loads carried and
embodied energy of vehicles and supporting infrastructure and equipment would be useful to
gain a comprehensive picture of the transport component of food supply chains.

80
Figure 15. Pallet loads of mixed produce waiting at Sydney Markets to be transported to different retail stores.
4.2 Deeper analysis of farm embodied energy and associated GHG emissions
Farms A and D provided significantly more information about key inputs to their operation
than Farms B and C. Closer examination of these farms is possible. Gaps remain, however, in
each case and not all buildings, machinery and vehicles, and inputs can be accounted for in this
project. Further, the inputs calculable at one farm differ from the other, and therefore direct
comparisons are difficult. Even with the somewhat crude numbers that emerge, however,
some conclusions are possible, and areas of potential future research identifiable.
4.2.1 Vehicles and machinery
I used the method developed by Wells (2001) and adapted by Saunders et al (2006). Both had
a New Zealand context and account for embodied energy in the raw materials, construction
energy, an allowance for repairs and maintenance, and international freight (Saunders et al.
2006, p41). Table 13 is taken from Saunders et al (2006, p42) and shows energy coefficients
and CO2 emission rates, as well as the expected working life of different capital items.
Emissions are distributed over the working life of the items. Wells (2001, p36) provided figures

81
of 1400kg for average mass of light trucks and utilities in NZ; and 190kg for quad bikes, 90kg
for motorbikes. Heavy trucks were measured individually.
Table 1. Energy coefficients of vehicles and implements.
TABLE 13 REMOVED HERE FOR COPYRIGHT REASONS.
Forklifts are an important vehicle in the fruit and vegetable industry. My observation indicates
that common forklifts at Sydney Markets are around ‘15’ to ‘25’ models, indicating load
capacities of 1.5 to 2.5t. Information from a forklift manufacturer/dealer is that a forklift with
loading capacity of 1.8t would weigh 2610kg, and that a mast for 1-1.8t capacity forklifts would
be from 310kg to 660kg. A forklift with a 2-2.5t capacity would weigh between 3,560kg to
3,650kg, and would need a mast that weighed from 390kg to 770kg (Toyota Industrial Handling
representative 2009, pers. comm. 11 December). Information found on a second forklift
dealer’s website indicated that a particular 1.8t capacity forklift weighed 3,000kg. Given the
earlier information, I assume that the mast is included in this mass (Forklifts Australia 2009).
For this project, if the load capacity of a participant’s forklift is unknown, I assume that the
total mass of the forklift and mast is 3,000kg (3t). Saunders et al (2006) emission rates are then
applied as for other vehicles, and a working life of 15 years is assumed.
1.1.1 Deeper analysis for Farm D
Appendix G details the calculations made for Farm D. Clearly, the further into the capital
infrastructure and input analysis, the less comprehensive the total figures for emissions. The
figures do, however, provide an indication of where substantial GHG emissions arise.
Table 8 in Appendix G shows emissions estimates calculable for Farm D, both the initial
estimates based on NGA Emission Factors and those detailed in the Appendix. Figures 1 and 2

82
in Appendix G are process maps for Farm D, showing GHG emissions by some inputs and
outputs, by location and by category. Key observations are:
Stationary energy emissions (electricity, natural gas and diesel) are by far the largest
proportion of GHG emissions at Farm D. They account for over half of those GHG emissions
calculable, when Scope 3 emissions are included.
GHG emissions from waste at landfill are the second largest category, at over one quarter
of all GHG emissions calculable.
The annual allocation of GHG emissions embodied in capital (building) infrastructure is
substantially less than either stationary energy or waste at landfill, accounting for about
8% of Farm D GHG emissions, not including shipping. As for ongoing inputs, annual GHG
emissions embodied in fertiliser manufacture account for only about 3% of all annual GHG
emissions calculated.
Transport GHG emissions (fuel only, Scope 1 only) from trucking one year’s worth of
seedlings substantial road distances domestically accounts for less than 1% of Farm D’s
calculable GHG emissions, but represents nearly four times as many GHG emissions as
international shipping from Europe of one year’s supply of growing media. There are a
range of uncertainties around any transport generalisations.
The transport (fuel only) GHG emissions from trucking waste to landfill in this case are
minimal compared to the GHG emissions at landfill. Note that Farm D owns none of the
vehicles involved and therefore none of the associated capital or embodied GHG emissions
are included in calculations.
4.2.3 Deeper analysis for Farm A
Appendix H details the additional data and calculations possible regarding vehicles and
machinery, buildings and farm inputs at Farm A. Few embodied GHG emissions could be
calculated, particularly because, even where I collected data from the participant on capital
infrastructure and inputs, it was in a different format to that required by the methodologies
ultimately used for estimating these types of GHG emissions.

83
Given the relatively few embodied GHG emissions able to be calculated for Farm A, especially
in relation to the building, no conclusions could be drawn about the relative importance of
embodied GHG emissions. However, other observations are possible for Farm A.
Firstly, out of the GHG emissions that were able to be estimated in this project, Farm A’s
greatest by far are from its combustion of coal to fuel the greenhouse heating system. Scope 1
and 3 emissions from the coal combustion represent about 89% of all of Farm A’s Scope 1, 2
and 3 emissions included at Tables 7-9 (not including the few embodied GHG emissions that
could be calculated).
Secondly, because Farm A mostly delivers tomatoes to a nearby town, some comparison is
possible between local delivery GHG emissions (embodied in vehicle, plus Scope 1 and Scope 3
emissions for fuel use) and delivery to Sydney. Total annual GHG emissions associated with
local delivery are 16.6t CO2-e. A delivery of one tonne of tomatoes to Sydney Markets (one trip
as part of a full, larger semi-trailer load of goods, fuel Scope 1 and Scope 3 CO2-e emissions
only) involves 0.0389t CO2-e. Farm A would have to sell more than 400t of tomatoes locally to
reach the same level of efficiency as if going to Sydney in this manner, even if only comparing
fuel to fuel for the two different journeys (details of calculations are included in Appendix H).
Either way, given that Farm A sells only 300t tomatoes p.a. it appears that sending tomatoes
from Farm A to Sydney Markets as part of a semi-trailer’s full load could involve fewer CO2-e
emissions than local delivery. Note that this analysis does not include GHG emissions
embodied in the semi-trailer and assumes a full load. More detailed analysis would be needed
before reaching definitive conclusions.
In such a scenario, one would also have to consider a two-way journey if it was taken into
account that people living in the town near Farm A would have to get their tomatoes from
Sydney if there was no alternative local supplier. It is unlikely a two-way journey would still be
more CO2 efficient.

84
4.3 Evaluation of overall results – waste
How people and businesses define waste affects their GHG emissions profile. Information from
participants about waste comes in different forms, and defining waste can be difficult. One
wholesaler can quantify food waste, but it all goes to the cows on his farm. He also reuses or
‘offloads’ cardboard boxes to others who will use them, so these have not been included. He
does not consider these to be waste. Another wholesaler’s boxes go into the wheelie bin and
are collected for recycling. As such, no GHG emissions are calculated, but in a comparison on
straight quantity of waste, his boxes are included, whereas the first wholesaler’s are not. Farm
A resells its growing media at the end of the season so it is not included as waste, whereas
Farm D sends its growing media to landfill and so it is included.
Waste figures obtained for Farms B and C are considered unreliable for quantitative
comparison, given three factors around green waste, which is substantial at tomato farms.
First, Farm C’s figure did not include green waste from the tomatoes. Second, Farm B’s stated
figure for total (but green only) waste to landfill was lower than Farm C’s figure (which did not
include green waste). Third, Farm C’s stated waste to landfill was much less than Farm A’s
estimated green waste. It is possible that Farm A’s green (plant only – not growing media)
waste estimate was far too great. However because it equated to, per yield, about half of Farm
D’s total waste, including growing media, I considered that Farm A’s estimate was more likely
to be accurate than Farm B’s.
The retailers’ estimates of waste were so vastly different, even before allocation to tomatoes,
that they cannot be considered reliable. A greater sample of retailers should determine
whether such a range is realistic or whether an error has been made in at least one of the
participant’s estimates.
Farm A’s waste per tonne of tomato yield is approximately half that of Farm D’s. Farm A’s
waste figure did not include a small but undefined amount of waste that went into the weekly
domestic rubbish collection, nor ash from the coal-fired water heater. There was no coefficient
available for the ash sitting in a pile, and the farmer at least partially considered it a resource
not yet used. A relatively small amount is used as a fertiliser on the farm’s paddocks, and there
have been occasional discussions about selling it if there was a willing buyer. In pure tonnage
terms though, at approximately 35t p.a., it would double Farm A’s waste by weight, and would
bring it up to approximately the same amount of waste per tonne of tomatoes produced at
Farm D.

85
Wholesaler B appears to create more waste per tonne of tomatoes traded than either
Wholesaler A or Wholesaler C.
Despite the caveats above, the data suggests that there is substantially more waste per tonne
of tomatoes at the farm level than either at the wholesaler or retailer.
4.4 Evaluation of overall results – water
Water use among wholesalers was not known at all, as individual tenants’ water use at Sydney
Markets is not metered. The Markets kept confidential the total amount of water used at the
site. The total figure would include not only each tenant’s use but all general use such as
toilets, and significantly, washing down of market and common areas.
Retailer B did not know his water use, as it was paid by the landlord. Retailer A’s estimate
calculated to 37.5L per tonne of tomatoes sold. Clearly, on only one participant’s figures,
results are not definitive, but it is a tiny amount compared to any of the farms.
It is considered unlikely that the wholesalers’ water use, even if including a percentage of
overall water use at the Sydney Markets, would, per tonne of tomatoes traded, approach
anything like that used at the farm level. By their nature, farms, including hydroponic
operations, require substantial amounts of water for the plants to grow.
In absolute terms, Farm A and Farm D both use about 50kL water per tonne of tomatoes
produced. In relative terms though, Farm D is much more efficient at irrigation. It only uses
37.3kL of that water for irrigation; the rest is used for cooling. There are a range of possibilities
for why this might be the case, relating to the other inputs and expertise and equipment in the
precision management of the irrigation and plants, and maybe climate too.
The figure estimated for Farm B’s total water use is based on rough information from the
participant combined with Bureau of Meteorology data and my own estimates. The figure is
substantially different from either Farm A or Farm D’s water use. While potentially accurate
and explainable (the participant stated that yield is down this year due to a heat wave, so
more water would have been used for less yield), it is considered unreliable in this small
sample of farms and was not analysed further. If it was accurate, further investigation could be
conducted to determine why there is such a difference in water use, especially compared to
the similar physical setup at Farm A.

86
4.5 CONCLUSIONS
Taking into account all assumptions and caveats, key findings or areas for potential future
research include:
On-farm emissions appear to be far greater than emissions from fuel used for transport to
market, per tonne of tomatoes sold or carted.
Depending on the distance to market (and therefore emissions from transport fuel),
transport legs may involve fewer or greater emissions per tonne of tomatoes than at the
wholesale or retail operations.
It appears that farms account for a far greater amount of emissions per tonne of tomatoes
than wholesalers or retailers (disregarding Retailer B), and that wholesalers have far fewer
emissions than even retailers.
Results suggest that the type of fuel used for stationary energy can have a substantial
impact on the emissions of an operation.
For Farm D at least, stationary energy use and then waste appeared more significant than
embodied emissions. This is of particular interest given the capital intensive nature of the
infrastructure at Farm D.
The data suggests that there is substantially more waste per tonne of tomatoes at the farm
level than at either the wholesaler or retailer. Given the hydroponic style of farming
studied, it is probably the same with water, though data for water was not available from
wholesalers or one retailer.
The results suggest that further research into GHG efficiencies by level of farm technology
would be worthwhile.

87
5 STAKEHOLDER VIEWS AND KNOWLEDGE
In a suburban fruit and vegetable shop there might be six or more types of tomatoes for sale –
Figure 9 shows just one of Steve’s eight or nine varieties on display. The perhaps split-second
decision made about which tomatoes go in the trolley can position consumers as actors in
totally different supply chains. This project only looks at a handful, but demonstrates some of
the possible journeys travelled by one of the most common or everyday fruits.
You might choose the truss tomatoes picked at Lily’s farm in south-western Sydney, where
I grab the tray, put it on a scale and weigh it…and then we try to clean up as much as we can if something is not right or the colour or the shape, we cut it off, you clean, you weigh and then you put it on the table. You put stickers on, you tag and then you put them on the pallet again and that’s it, off they go to the market.
A transport company collects the tomatoes and drives them the forty-odd kilometres to
Flemington, where a wholesaler, someone like Patrick, ‘sort[s] them out, grade[s] them out
and then sell[s] them to the shopkeepers, Coles, Franklins…’. Maybe instead of the
supermarkets, it’s Alex from the fruit shop who, early in the morning when he took his truck to
the Markets, decided they were the right tomatoes for his shop and so bought them. If it is
winter, Alex probably left them in his storeroom ‘at normal room temperature for about three
or four days until they’re fully red’, then perhaps in the cool room for one or two days
maximum, to stay fresh. He may have washed them and packaged them in foam trays with
plastic wrap, so that you the customer don’t damage them when you dig around in the stack
(and so that you might buy more than one or two).
Or perhaps Andrew grew your tomatoes, in regional NSW, several hours drive from Sydney.
Although he sells mostly to local stores and through farmers markets, it might be one of the
few times a year that he has a flush of growth and sends a few pallet loads to the Sydney
Markets. His tomatoes ‘go off the vine into a bag’. Then they go into a regional transport
company’s truck for the ‘bean run’ which goes to Sydney every evening, going ‘all the way
down the coast, little frog hops, picking up little bits from all the little farms’, arriving at the
Markets by midnight. After an unpacking company unloads the truck the tomatoes will go to
Andrew’s agent, perhaps Val, who specialises in tomatoes. An hour or two later, Steve might
come by, on his daily visit to buy for his three shops. Depending on the season he will buy from
different wholesalers, and he looks for ‘[good] quality, presentation and holding ability on the

88
stack’. He’s there at 1.00 or 1.30am ‘to acquire the best quality. Because what you find is a lot
of stuff goes to export, all the good stuff, so the stuff that hits our market floor, there’s not as
much as what goes overseas.’ If Steve buys them, another transport company will deliver some
of them to his store in southern Sydney a bit later in the morning, along with whatever other
produce he buys that day.
Third, you might pick the tomatoes that were grown at the farm managed by Lachlan; grown
with the supermarkets in mind, but for whatever reason weren’t required or didn’t meet the
supermarket specifications, and so were sold at the general Markets. In this case, your
tomatoes would have been picked by people who put them in
...trays [sitting on automated trolleys] and then they dispatch the trolley back to the pack shed and that’s all robotically handled…so it travels back on its own to the pack shed. It goes to a scale, the product gets weighed and it’s all automatically removed off the trolley.
Then
...it’s either packed immediately but excess product is palletized…or processed later in the day when picking is finished or alternatively stored in a cool room and packed the following day.
The marketing side of the business will
...liaise with our production manager, who runs the pack house, about what their requirements are and it gets shipped out of here in the afternoon, basically and goes to whoever it’s going.
The tomatoes will be trucked by another transport company and
…they’ll go direct to Woolworths distribution centres or Coles distribution centres anywhere around the country. Others go to [the marketing side of the business] and are sold on the market or to smaller retailers.
Your fruit shop owner will buy from this company at the Markets, and perhaps these
tomatoes, say the ones in Figure 16, are what you choose to take home this time.

89
Figure 16.Tomatoes at Steve’s fruit shop.
5.1 Introduction
The pre-shop journey travelled by tomatoes involves numerous people, even if they do not
physically touch the tomatoes or feel any great connection to them. The way these people
think of the tomatoes, of other people in the supply chain, of the environment, and how they
run their businesses, are all key to assessing whether the industry can reduce GHG emissions
from production and supply of fresh tomatoes. Although quantitative analysis and estimation
of emissions from businesses identifies areas of greatest emission sources, qualitative analysis
helps identify areas of potential change. It identifies rather than assumes the business, and
sometimes personal, drivers of participants, as well as areas of knowledge gaps or particularly
strong attitudes that affect whether changes to reduce emissions are likely to be enacted.
This chapter first identifies participants’ connections with their tomatoes, and the breadth of
labels and definitions around the tomatoes they handle. This is followed by analysis of their
views on key themes to emerge from interviews, being weather and seasons, climate change

90
(and energy use), water and waste (the latter two also relevant to the National Greenhouse
Accounts factors (Department of Climate Change 2009)). A language of control and reliance
was recurrent throughout the interviews, across a range of subject themes. Views on
relationships with other actors in the supply chain are explored. Then I discuss potential for
change in this supply chain, focusing first on four participants with high-end GHG emissions,
then on some of the broader indicators of drivers and willingness to change. The chapter
concludes with four areas considered key for achievement of significant reduction in GHG
emissions from this fresh tomato supply chain.
5.2 Connecting with tomatoes
Understanding how participants viewed their tomatoes helps to understand how they
approached their business and their part of the supply chain.
5.2.1 Participant-tomato connections and interactions
Participants were connected to the tomatoes with which they dealt in various ways. They
defined, categorised or valued the tomatoes in different ways. There was no real pattern of
responses by different stages of the supply chain. Most viewed their connection as relative to
their job or business. The responses had the additional benefit of showing major parts of the
tomatoes’ physical journey from farm to shop, and the range of activities and roles people
have in the chain.
Some spoke of both business and personal (either their own or ‘the public’s’) connections to
tomatoes. Some saw the tomato connection as a connection to other people. For example, Val
said:
The connection is with the grower. We’ve got a number of growers and we also buy within the market. Our season’s mainly dealing with local growers and when they’re not in season then we’ve got to source it from [elsewhere in the Markets].
The connections varied from the personal (such as childhood memories), physical and at the
individual tomato scale (such as Lily’s packing activities), or physical but at the box or pallet
load level (such as Alex’s strategies to have ripe tomatoes on hand every day), to a commodity
level (such as Marc’s ‘we do a lot of tomatoes’, Patrick’s ‘major line’ and Michael’s ‘raw
product)’.

91
Val, Jason, Alex and Steve all included seasonal variation in their responses, indicating that
their specific interactions with or around tomatoes changed throughout the year. Several
responses also indicated that tomatoes are one of the key fruit commodities. They are
available in some form year round. Table 14 summarises the connections.
Table 14. Business and personal connections to tomatoes.
Participant Connection
Lily Manages packaging side of family farm, preparing tomatoes for market.
Physical handling of tomatoes.
Talked about business growth.
Lachlan General manager of large scale Farm D, coordinating tomato growing and packing operations. From a business background.
Jason Sells various types of tomatoes wholesale.
Patrick Sells various types of tomatoes wholesale – a major line.
Childhood memories of growing tomatoes and seeing what happened to them.
Talked about business growth.
Michael Packaging procurement for ‘raw product’ including tomatoes.
Chris Sydney Markets provides a trading facility and manages waste removal.
George Business decision to grow tomatoes rather than other vegetables, because highly productive, high demand and consistent quality possible in protected cropping.
Andrew Talked about business growth.
Alex Sells tomatoes retail – must have them in his shop.
Everyone eats tomatoes: ‘I think it’s part of everyone’s day, a tomato.’
Customer preferences for ripe tomatoes influence his interactions with tomatoes seasonally.
Steve Sells tomatoes retail in three shops.
Childhood memories of father growing tomatoes.
Growth of industry, much greater range of tomatoes available in shops now.
Carlo Sells tomatoes retail – tomatoes, along with potatoes, are principal vegetables in fruit shops.
Marc Tomatoes are only one item he transports, but everyone eats them, fruit and vegetable shops must have them, and they are year-round.
5.2.2 A tomato is a tomato… right? Tomato terms, brands and confusion
Tomatoes of some sort are always available: ‘There used to be seasons but not no
more…They’re growing them everywhere, glasshouses, no it doesn’t vary’ said Patrick, when
asked about whether his connections to tomatoes changed at different times.
Yet the tomatoes are not all the same. It is not just that there are different varieties of
tomatoes, and ‘hydroponic’ and ‘truss’ tomatoes. There are more. Within the small field of
participants, and despite narrowing the project (at the farm level) to greenhouse-grown
tomatoes, the descriptions in Table 15 indicate the variety and interchangeability of terms.

92
Not only is there a range of variety names and marketing terms, but their use changes.
Perhaps the best example is ‘gourmet’ tomatoes. Val referred to ‘gourmet’ tomatoes, and
within the context of his wholesale business I judge that Val means ‘gourmet’ as in ‘very high
quality’ as distinct from the marketing term ‘gourmet’ used by some in the industry for
tomatoes grown hard and for long shelf-life (and which tend to be at the inexpensive end of
the market).
A second example of (my own) confusion occurred when reviewing (Wholesaler B) Jason’s
response to my question, ‘would you say yours are more field or hydroponic?’ (noting that I
assumed that ‘greenhouse-grown’ equated with ‘hydroponic’):
Well, we deal mainly in field from North Queensland too, which is a round variety, not the gourmet types. We do sell the gourmets but we don’t have many suppliers of the gourmet varieties.
On balance I judge that Jason is referring to the marketing-defined gourmets grown outdoors,
as I think he is contrasting his round variety to other field-grown ‘gourmet’ tomatoes from
Queensland.
Alex associates truss tomatoes with vine-ripened tomatoes. But he doesn’t like ‘hydroponic’
tomatoes. All four farms in this project identify as being hydroponic. Farms A and C identify as
having ‘vine-ripened’ tomatoes; Farms B, C and D identify as producing ‘truss’ tomatoes.
Technically, truss tomatoes do not have to be ripened on the vine (before picking), as the term
‘truss’ really refers to the tomatoes being sold as a cluster, still attached by that part of the
vine.
The range of labels and understandings of their meanings by participants in this project is
reinforced by Carruthers (2003), who detailed the range of marketing names and brands used
to form discrete segments in the market. It is the fresh produce marketers (rather than the
growers) that control this process. Not all hydroponic tomatoes are marketed as such. ‘Vine-
ripened’, ‘truss’, ‘greenhouse’ and ‘gourmet’ are examples of terms used by retailers for a
range of tomatoes. The tomatoes may or may not have been grown hydroponically or in a
greenhouse. The terms do not necessarily mean what the consumer might want, or assume,
them to mean. It appears, from some of the participant responses in this project, that it is not
only consumers who can be confused by these terms.

93
As predicted in Carruthers’ article, further lines of tomatoes have become available since 2003.
A walk through Alex or Steve’s shops, or a supermarket, will reveal several varieties that may
or may not be marketed under ‘grape’, ‘cherry’ and a range of other names and brands.
Marketing of tomatoes is a moving feast. Farm D’s marketing and distribution channels mean
that many of its tomatoes are sold under certain names in certain retailers, (and incidentally,
are probably more traceable). Towards the other end of growing technology, George at Farm C
is working towards developing his own brand and his own market niche in cherry tomatoes.
Andrew, who avoids the mass markets as much as possible, sells most of his tomatoes directly
to local retailers and the public via farmers’ markets and at his own farm shop. He sells several
varieties of tomatoes, and while they are picked ripe, they are loose tomatoes, and when
packaged are sold in net bags. They have a name and a reputation that the farm has built. This
name is carried through to the consumer via a label in the bag. So the business does not seem
to rely on broad marketing terms; instead, it has found its niche. Andrew talked about how
picking ripe fruit was crucial to their reputation, for example:
we just pick it ripe because that’s the way mother nature intended it to be picked. So in that regard we’re able to deliver ripe fruit and the consumer knows that if they get a bag of [our] tomatoes they’ll taste good.
But throughout the interview he did not use the term ‘vine-ripened’. It is interesting that
Andrew did not talk in the marketing terms used by the other participants – and it may be
because he and his tomatoes are largely outside the mass market system.

94
Table 15. Tomato terms.
Participant Tomato terms Example quotes George associates hydroponic
with vine-ripened and freshness; as opposed to field-grown that he associates with bigger tomatoes picked green for longer shelf life.
…we have field growing and hydroponic growing. I mean vine ripened tomato is completely a different produce but some people understand…It’s a big difference between field tomato and vine ripened tomato. I mean normally the field tomato is big ones, it’s green, it’s coloured, it’s whatever and it have longer shelf life…[but is] not like the fresh table eating tomato, it’s not the same, it simply is not the same, the flavour is not there even though sometime they grow the same varieties.
Lachlan Truss, saladette. …what we call a truss tomato you commonly see in the supermarket, you know, in groups or sort of clusters of three or four or five, with some, what we call a calyx, the green vegetation still attached to the tomato… So we do those really in two sizes. One is sold as a truss tomato, the other is commonly sold as what we call a saladette.
Andrew No specific terms. ‘we pick here quite ripe’ and they ‘go off the vine into a bag’
Lily Aims to sell as many as possible as ‘truss’.
-
Val Hydroponic, gourmet truss, gourmet, glasshouse, trellis grown.
…hydroponic tomatoes…we specialise in glasshouse tomatoes. And there’s a thousand different varieties of tomatoes they can use or more.’ He links hydroponic and glasshouse with place: ‘…the gourmet truss tomatoes and gourmet tomatoes that we specialize in are glasshouse tomatoes and they come from around here [Sydney Basin]…The volume of tomatoes come from interstate, not from Sydney and they’re grown in the ground, they’re outside, trellis grown tomatoes.’
Jason Gourmet, saucing, vine-ripened.
[Saucing tomatoes are] picked predominantly as ripe as possible so they get the full flavour from them. They can be firm but it doesn’t matter if they’re a bit soft too, as long as they’ve been vine ripened basically.
Alex Hydroponic, truss, vine ripened, glasshouse but grown in ground.
I don’t buy hydroponic…less in flavour. They’re full of water too at the moment…but we sell truss tomatoes which are tomatoes that are ripened on the vine but they are, if I’m not mistaken they are glasshouse. They’re grown in a big shed to keep the frost off them. Yeah, they are glasshouse but because they’re ripened on the vine they have the full flavour.
No, they’re in the ground in the glasshouse...Yeah, they’re not on a hydroponic shelf. They are in the ground but they are covered in a glasshouse.
Steve Associates truss with vine-ripened. 50% of his sales are ‘gourmet’ tomatoes.
…the tomato industry’s evolved too now where we’ve got, you know, we’ve got truss tomatoes, which are vine ripened…
When asked for % of ‘glasshouse grown, hydroponic’, replied:
They’d be the other 50 but remember there’ll all different types…Grape, cherry, truss, hydroponics, ox hearts. Oh, there’s a million of them...
Marc Hydroponic as distinct from vine-ripened, gourmet, organic.
…we have the hydroponic tomatoes which are all year-round, OK, but then you have vine ripened and gourmet tomatoes, organic ones, and they’re not all year-round.

95
Having established participants’ specific connections to tomatoes, together with an
appreciation of the complexity of the production and sale of what might at first glance appear
a simple product, I now analyse how participants view a range of topics relevant to their
business and climate change.
5.3 Climate, weather and the environment
The weather and seasons were topics of much discussion with participants in the fresh
produce industry, showing a strong though sometimes implicit link to natural processes.
Despite this, few points of emphasis from participants related to climate change or the
environment, suggesting that environmental sustainability concerns are not generally a major
consideration for the participants. Factors that were considered key business issues and
personal connections to the business, such as pride of success, frustrations with other people,
and health, were more likely to be expressed with an intensity of feeling. Views and specific
information about climate change mitigation opportunities, and business water use and waste,
are also analysed here, to complement the quantitative analysis in Chapter 4.
5.3.1 The weather and seasons
One topic about which all participants in the supply chain spoke was the weather. I did not ask
a specific question about the weather, although sometimes I used it as an example when
expanding on a question (such as a question about environmental factors considered
important). Some responses were about both seasons and the weather, for example when I
asked participants if their connections to tomatoes varied at different times, such as during
different seasons. Many of the comments about the weather, however, arose in response to
other questions, such as in describing economic factors around their business, or when
explaining certain technologies. Table 16 summarises the main views expressed about the
weather.
Discussion of seasons revealed further understandings of weather and (often local) climate. I
asked participants whether their connections to tomatoes changed at different times, for
example different seasons or times of the day or year. I also asked farmers about their crop
season, if they hadn’t already volunteered the information. References to seasons also
emerged throughout the interviews, in answers to a range of questions. A summary is shown
in Table 17.

96
The weather was important to many of the participants; not only the farmers. There was good
understanding by wholesalers and retailers about the impacts on their business and on the
general produce market of weather upstream in their supply chains. These traders also had
good understandings of the seasons, whether their own business’ busy ‘season’, or the times
of year when certain varieties are in season, or grown in particular locations. Tomatoes are
available throughout the year, but some varieties have limited seasons, and tomatoes may be
sourced from different growing locations throughout the year, depending on the growing
seasons.
Discussions of weather and water are linked. As well as other areas of discussion (see section
5.3.3), water arose in discussion of rain, floods, impact on supply, resource use, water for
cleaning, the idea that different locations’ water affected the quality of the fruit, slipperiness
from rain slowing down the market and business, packaging that biodegrades in water, and the
watery (poor) flavour of some tomatoes. Water clearly pervades all sectors of the tomato
supply chain, but was only a conscious front-of-mind issue for farmers. It is possible that a
higher value applied to water combined with metering and payment by wholesale and (more)
retail tenants would change this.
There was acknowledgement that the weather and a location’s climate were outside of the
participants’ control. Instead, these were (key) factors about which they had to keep
themselves informed (for example, retailers watching weather forecasts to anticipate supply
over the next week or month), manage for (such as farmers installing backup electricity
supplies in case of power failure in a heat wave or cold snap), and adapt to (for example, by
farmers manipulating technologies and/or their watering and fertiliser regimes depending on
the weather conditions).

97
Table 16. Views on the weather
Participant Views on the weather
Andrew Factor that has to be dealt with; mother nature
Minimum and maximum temperatures matter
Rain is essential
Affects profitability
Affects use of resources
Technology required to monitor and control crop environment
Consequences with supply chain/consumers
Lily Contributes to unpredictability of yield
Affects use of resources
George Factor that has to be dealt with
Minimum and maximum temperatures matter
Affects use of resources
Lachlan Site location partly picked due to climate (light) conditions
Part of the business
Technology required to deal with weather/climate
Reliability of energy supply critical to that technology
Potential impact of weather on crop if technology fails
Light impacts yield
Included in business budgeting
Impact on diseases
Influences glasshouse design (and therefore cost and return on investment, and scale)
Val Consumer demand for tomatoes partly weather-driven
Jason (sells a lot of winter tomatoes)
Weather influences supply
Perceived lack of consumer knowledge that weather influences supply
Some climate control in greenhouses
Weather impacts disease
Patrick Weather, especially rain, floods, influences supply
Perceived lack of consumer and retailer knowledge about weather effects on supply
Volume of trade depends on supply and therefore weather
Weather’s impact on supply – not fruit quality – affects price
Chris Waste tomatoes at Markets if weather damaged
Alex Supply of some varieties is seasonal but supply of all can be affected by the weather
Considers the weather as an economic factor, as it affects prices
Impacts volume and retail trade
Business awareness of weather forecasts, (implicit) knowledge of growing locations
Steve Affects quality
Business awareness of weather forecasts and knowledge of growing locations
Impacts supply
Marc Rain slows transport operations and logistics in Markets
Michael Packaging supply chain needs to be flexible to cope with variable weather

98
Table 17. Comments on seasons.
Participant Summary of comments on seasons
Andrew
Crop season all year; though yield varies seasonally, especially due to light
Comments on site’s climate, such as heat and light (in seasonal terms)
Some energy use varies by season
Ideal temperature in the greenhouse varies throughout the year (and day)
Lily Usually nine-month crop (picking) season, with three-months in between
Quantity of packaging depends on how the crop season is progressing
George
Portion of his farm that is tomatoes is (crop) seasonal
Is changing to a crop season of about a year
Energy use changes by seasons (heating in winter)
Water managed as a cooling factor in summer
Lachlan Seasonal variation of light and therefore yield
Labour requirements, especially picking and packing, change seasonally
Crop season of 10-12 months
Val Business season is that of local growers – November to March – rest of year buys
from others at Markets.
Jason
Business’ main tomato season is winter
Their season depends on their growers’ season
Saucing tomatoes sell in summer months
Patrick Does not think in terms of traditional seasons for tomatoes, as they are available
all year
Chris Tomato waste at Markets varies from year to year
Alex
Availability of tomatoes as a whole does vary seasonally
Different varieties vary seasonally
Retailer’s buying and storage strategy changes seasonally – they are greener in winter so buys in advance and lets them ripen at the shop
Buys local (Sydney) when in season, otherwise Queensland tomatoes
Consumers do not understand seasonality, because of year-round availability of most produce in Australia
Steve Buys from different people depending on season
Buys local (NSW) in summer, usually Queensland tomatoes in winter
Over nine varieties in shop in summer
Carlo Origin of tomatoes in shop changes seasonally
Summer the best selling season for tomatoes, as high availability and low price
To reduce energy use, could store tomatoes out of cool room in winter
Marc Tomatoes are all year round, although seasons vary for different varieties
Resultant unavailability can cause hassles for transporter in chain
Michael Produce seasonal – so when one location’s season is over, another one fills the
supply.

99
5.3.2 Climate change
I asked participants whether they had any thoughts on what they or their industry/the supply
chain could do to reduce GHG emissions or energy use. Example quotes are shown in Table 18.
There appeared no correlation between participants’ comments on the weather and any
particular level of concern about climate change or desire or action to reduce GHG emissions
or energy use from their businesses.
Chris from the Markets and Michael from a large company were the only two participants that
used climate change jargon such as ‘carbon footprint’. They were both involved in programs to
reduce environmental impacts from their large organisations. While they each mentioned the
weather, it was not as pervasive in their interviews as in those of most other participants.
Andrew and Lachlan both understood climate change as something to be addressed in general,
but when it came to their own operations their primary focus was on cost. To change to a less
GHG-intensive option, it also had to be more cost-efficient than existing practice. The
remaining participants either spoke in general environmental terms, had no view or explicitly
indicated a lack of knowledge or some uncertainty about climate change.

100
Table 18. Views on reducing GHG emissions or energy use.
Participant Thoughts on reducing GHG emissions/energy use
Andrew Would be nice, but priority is avoiding extra costs to small business: …if someone came up with a viable alternative, we would entertain it straight away. If someone came to us with an alternative that was going to cost us a lot of money and take us ten years to pay for, probably wouldn’t want to know about it…
…Outside committed climate change people, who really want to play their part, I think most small businesses hope it doesn’t visit them. ‘Cos at the end of the day, everything that happens to small business is going to cost them money…
… I mean deep down we all want to do our bit. But we want to survive as well…
Lily No thoughts on climate change
George No specific response on climate change, but on various environmental matters – theme that farmers cannot bear all costs of change
(In abstract) choose better growing locations
Positive about general human ability to make improvements
Lachlan Primarily focused on financial or cost benefits, but they might also have an emission reduction benefit:
Our waste is an issue… We’ve got to get that whole area addressed. We are doing other things as well but, you know, oh they’re greenhouse gas related but they’re also financially related.
Val Cannot see how he can reduce own energy use
Jason Points to Markets’ good environmental credentials, but thinks (it) can do more
Wants to change from gas to battery-powered forklifts, but mainly for health reasons
Not sure about climate change
Patrick Cannot see how he can reduce energy use
Considers businesses already try to cut costs, so would already have their energy use as low as possible
Chris The Markets have undertaken a carbon footprint study, and have implemented various changes. They are considering further changes, including a cogeneration plant and alternative water supplies.
75 per cent of electricity use is by tenants. Each business needs to make its own decisions, but the Markets could provide advice on what it has done.
Alex
Considers most his business can do is box recycling: ‘…we’re just a retailer’
Considers that growers’ main energy use would be water-related, but could recycle boxes
Steve Said he did not understand climate change well enough to comment
Tried different organic waste collection, but machinery sub-standard
Marc Spoke of environment in general: much could be done, but comes down to people cutting corners to make money, disregarding the environment. Thinks his operation is one of the few in the Markets that recycles.
Michael Reducing footprint through thickness of plastic
Signatories to an environmental agreement
Utilising pallet and truck space
Much can be done with packaging but it all comes back to cost and volume
‘Passionate’ about compostable and biodegradable plastics across range of food industries

101
5.3.3 Water
I asked questions about how much water participants used, where it came from and where it
went. Water also arose in answers to a range of questions, and during tours of facilities.
Water was essential at farms not only for crop irrigation but for high-tech heating systems and
some cooling systems (from medium-tech use of water to cool plant roots to the very high-
tech pad and fan system). All four farmers were highly aware of water being critical to their
operation, and were keen to reduce overall water use. But farmers had different views on
water, and further research could test whether this is because of their different situations with
respect to water supply. Andrew collected rainwater, did not talk about water as a cost, but
was totally reliant on rain, as he couldn’t afford to buy water. Lily and George both buy
municipal water and do not collect rainwater. Lily’s supply was insufficient during a heatwave
and she had to buy extra water (presumably trucked in). Both Lily and George saw water as a
major business cost. Farm D has several water sources – collected rain water, recycled city
water that is purified on-site, and recycled irrigation water. Lachlan is cost-focused as shown
by his desire to increase disease control in order to have the confidence to recycle more
irrigation water. Although not discussed in the interview, I judge that he would also be water
security-focused, as it is an essential input, like energy, and he is very focused on ensuring
energy availability.
It was very difficult to compare actual water use between farms, except to some extent Farms
A and D (with Farm C water data lacking, and uncertain accuracy about Farm B’s water data).
Farm D’s overall water use per tonne of tomato yield was almost exactly the same as Farm A’s,
however with much greater irrigation efficiency. Further research could investigate whether
there are links between farmers’ attitudes to risk (of running out) and cost of water and their
ideas of water security, and also what drove water conservation more – supply (perceived
security), cost (of water and/or efficiency measures), knowledge and expertise, for example in
precision irrigation, or a combination of these factors. Also, whether farmers connected to
municipal water supplies used water differently and/or viewed risk differently to those reliant
on rain and/or their own supply and storage systems.
Wholesalers and retailers did not know their water use and/or did not consider it to be a major
factor for them. Two of the three wholesalers increased their use of packaging to keep
produce dry when raining; and Patrick emphasised rain’s affect on supply. The transporter and

102
the Markets used substantial quantities of water, especially for cleaning (trucks and floors
respectively). The Markets were investigating ways to increase access to rainwater and
recycled water.
5.3.4 Waste
Participants applied a range of strategies towards waste, with some viewing it as more of an
issue or problem than others. Defining waste, in fact, is subject to the participants’ views of
what is waste and what is resource. Implications of this in calculating GHG emissions from
waste were discussed in Chapter 4.3.
Waste was front-of-mind for Lachlan, as taking all plant and growing media waste to landfill
was a high-cost activity. He was investigating other options, perhaps in composting. When
talking of waste, Lachlan also thought of waste water, as he was trying to increase the amount
of irrigation water that was reused at the farm. Unmarketable fruit (about five per cent of
yield) was going to a pig farmer at little cost, but Lachlan was hopeful of finding a recipient
who could facilitate some form of human use for the fruit. Farm A did not waste any fruit,
instead making food products, and had room for plant waste to pile up and decompose at a
distance from the greenhouses. Andrew had considered composting but it is a ‘materials
handling issue’ and is laborious. Farms B and C in Sydney were on smaller pieces of land and
the only apparent solution was to pay to send plant waste to the tip. Lily did this, but George
did not, due to the cost involved. He had a waste pile on his farm and was not pleased about it.
He felt that others (government/industry) should develop a lower cost solution for all
greenhouse growers.
The Markets were implementing a comprehensive waste strategy to reduce waste going to
landfill, and which linked to its targets to reduce its carbon footprint. Chris considered waste
management to be the Markets ‘big-ticket item’ for environmental management, and it was
clearly an important part of ensuring a smooth running of the markets. The sizable amounts of
various waste streams makes it viable for third parties to be involved in recycling waste
collected at the Markets. About half (6000t p.a.) of all waste went to landfill; 40 per cent, being
organic, went to a food waste-to-energy facility, and the remainder was separated and
collected by various recycling companies. Implementing this strategy included workplace
changes such as altering work hours for staff to collect rubbish at the end of the day.

103
Individual wholesalers interviewed lacked much knowledge about what happened to the green
waste once it went to the Markets’ ‘Greenpoint’. They had a rough idea of how much waste
they produced (how many bins per week, for example) but did not have consistent information
about what types of waste went in their wheelie bin collections. Regardless of quantity, they
all considered their own waste to be minor. Patrick showed a greater awareness of his waste,
claiming it was ‘our worst thing’. He took green waste to his farm for stockfeed. He also passed
on to other people his used cardboard boxes, rather than recycling them – leaving only plastic
for his wheelie bin collection.
Retailer Alex recycled boxes and considered that to be all he could do to reduce GHG
emissions. All general and fruit waste went to landfill. He had a strategy for reducing the
amount of fruit waste from customers ‘digging’ in the stack; which was to pack various lines in
foam trays with plastic wrap. This also, however, was a strategy that led to greater turnover
volume (and potentially greater use of resources/waste overall, though at the consumer
household level rather than the shop). Steve calculated his general waste volume by his
knowledge of how much disposal cost him. He recycled cardboard boxes, and had previously
trialled a machine (in one of his other stores) to pulverise organic waste. The machine was a
prototype and not suitable for the shop so all organic waste still goes to landfill. Marc
considered main waste for the transporter to be cardboard and Styrofoam, which are both
recycled. The company where Michael worked recycled cardboard, Styrofoam, wax and plastic.
Recycling or reuse of boxes, particularly cardboard, appeared to be well served at both the
wholesaler and retailer level. In contrast, in these sectors of the supply chain, reuse or
recycling of fruit waste was only being implemented by the larger organisations interviewed,
such as the Markets (and therefore the wholesalers, who just handed it over), and the large
marketing/supply company for which Michael worked. The exception is Patrick, who, having
his own farm, reused the waste as stockfeed. Based on this small sample, there appears to be
room for further investigation into the viability of organic waste collection at the retail level.
Green waste was important to farmers because of the risk of disease and/or the cost of
disposal. In the case of Farm C, cost outweighed the disease risk and the waste remained on
the farm; and was a source of frustration to George. Other waste was not as great a concern to
farmers, although some were more innovative than others in their handling of it. For example,
Andrew’s resale of coco peat slabs and use of unsellable fruit in a food production side-
business. Lachlan’s relative concern about waste to other farmers is consistent with Farm D’s

104
position of a relatively high amount of waste per yield compared to Farm A (having caveated
Farm B’s and disregarded Farm C’s figures). It was the costs involved with sending waste to
landfill that was primarily driving Lachlan, rather than the GHG emissions generated (about
one quarter of Farm D’s overall GHG emissions calculable here). However, it would be fair to
say that none of the farmers, wholesalers or retailers were driven to reduce GHG emission-
intensive activities simply because they were GHG emission-intensive; they were driven much
more by costs.
Wholesalers and retailers were generally not too focussed on waste; it appeared to be just
part of the business; though as shown by Steve, if costs could be reduced, an alternative would
be considered. The exception was Patrick, who found ways to reuse a range of his waste.
While he may have also been cutting costs, this illustrates that some business people actively
think of what can be done with every resource, even ‘waste’. Transporter Marc considered his
(retailer) boss at the Markets to be unusual for the place as he had ‘spent extra just to make
sure that everything’s done right and there’s no rubbish, like, we don’t litter’. Without talking
to the ‘boss’, the driver behind this is unclear, but it demonstrates the possibilities to run a
cleaner operation.
Having said this, it is also clear that many of the same people have limits, perhaps to their
knowledge and/or their time, to investigate other efficiencies that might not only reduce GHG
emissions but business costs. Such people might be receptive to information campaigns (that
provide some ‘real’ information, not just suggestions) that encourage them to investigate
these options further (for example, solar power at a farm; or improvements to cool
room/chiller energy efficiency).
5.4 Control and reliance
So far in this chapter I have analysed key subject themes related to the participants’
connections with and thoughts on tomatoes, and their attitudes to key environmental
subjects. A complementary approach to the interview data became evident while coding the
texts. Two related themes – control and reliance – arose in participant responses often
explicitly, sometimes implicitly, although specific questions were asked about neither.
Different types of ‘reliance’ were expressed: sometimes a concept of dependence (meaning
variability of something depending on something else), sometimes a stronger form of reliance
that involved greater consequence (relying on someone or something to happen a specific way

105
for a certain result). There were several interplays between control and reliance, sometimes
presenting as a need for self-reliance.
By looking at the interview content through the language of control and reliance – implicit but
apparently key concepts to most participants – insights into and linkages between a range of
subject themes can be drawn. These include ideas around climate control, reliance on energy,
technology and people, various forms of business control, and ultimate reliance on the
weather.
5.4.1 Climate control (through technology)
All four farmers talked about control of the climate inside the greenhouse, with three of them
linking that control to technology. The farmers rely on various levels of technology to control
the climate inside their greenhouse(s). Although they manage and control the technology (or
use it as a tool), they also rely on it to work, because in extreme circumstances such as heat
waves, their crops would be in jeopardy without the technology.
Others in the supply chain also rely on their technology or equipment. Patrick talked in these
terms about his cool rooms:
…there’s no leakage, there would be no leakage in them [cool rooms]. We always get them checked up on. We can’t afford to have them not work.
5.4.2 Energy availability and security
Reliance on technology infers reliance on energy and energy availability. Farmers, particularly
the high- and very high-tech growers (whose systems are more reliant on technology than low-
medium tech growing methods), were well aware of this. The two high-tech growers
interviewed were not able to access piped natural gas, despite being their preferred option.
One therefore used coal, and the other LPG, to heat their greenhouses.
In order to reduce reliance on third party electricity providers, and the risk of losing power,
(and therefore have greater control or security over their businesses), Farms A and D had back-
up energy supplies, and Farm B knew it should invest in one. Transporter/logistics operator
Marc was acutely aware of what he relied on: LPG to run forklifts (and petrol for trucks).

106
5.4.3 Reducing energy use
In discussion about whether businesses can do anything to reduce energy use, one wholesaler
considered that they could not control what energy they used, and another thought that
wholesalers would not be able to cut energy use because they would already use as little as
possible to cut costs (a range of other responses were also expressed, but not in terms of
control).
Yet the Sydney Markets was the one organisation that had taken steps to reduce the energy
use over which it had control, and it was very conscious of what energy use it controlled and
what tenants controlled. Chris told me:
…the biggest CO2 emission was obviously electricity and 75 percent of the electricity used on site is used by our tenants, so we don’t have direct control and we understand that they need the cool room facilities to run their business, so it’s an integral part. So we could advise them, we could look at different co-generation plants for what we control and whatever infrastructure we have in place.
And:
25 percent [of electricity] is used by our external lighting, public roads and our office areas and so on…we’ve installed smart metering…sensor controlled [lights].
5.4.4 People and expertise
Farmers were aware of the limitations of their technology, and the risks to the crop of it not
working properly. They relied on people to monitor it and to be available should anything go
awry. Examples of responses are in Table 19:
Table 19. Farmers’ views on reliance on people.
Participant Example quotes Andrew …we set the computer to do a certain amount…then we do our own measurements with
the pH and the ECs – the nutrients just to make sure everything’s okay.
…if anything goes wrong an alarm will go off…like any technology, it’s great when it works, but you’ve got to keep your eye on it.
Lachlan The climate’s changing all the time. So there are some aspects of the climate control which are automated but some require, you know, some personal intervention.
…if the climate falls out of certain parameters that are not automatically controlled, the system can automatically email and text our growers and alert them to the fact that there’s a problem with something…Because like I said if the climate goes out of the control, I’m talking at extremes now…for an hour, and hour and a half, that’s it…It can cost you millions…

107
Farmers in particular talked about their expertise being either something key to controlling
their business, their inputs and specific use of technology and equipment, or as something on
which they relied. Improved farmer expertise or access to expertise about the plants,
technology, inputs and climate control leads, arguably, to greater control of the plant itself, of
inputs such as fertilisers, and of crop seasons and production. Table 20 shows examples of
expertise and subsequent manipulation of growing conditions, seasons and the plant.
Table 20. Farmer expertise and control over the plant and its environment.
Participant Example quotes
Andrew …as we become better growers we use less fertiliser, because we get our balance better. We use less heat, we use less energy...
…as we’ve become better growers, we’ve used less inputs. We’re in better control of our pests and diseases which means less chemical usage.
[Consultant advises]…for example this cloudy weather’s made one of the crops stretch a little bit, so we’ve had to raise the heat level a little bit during the day time, now that’s an increased energy use, but it’s all designed to bring the plant back to balance.
George …we have the control in a greenhouse situation, it’s just watching and knowing exactly what you’re doing.
I think it’s my knowledge, my experience as a grower or my access to information and disease control and understanding the plant…The experience, I think, without it I couldn’t, I know I couldn’t live, I couldn’t survive…
I’m trying to [move to a 12 month season]. It’s very hard with my medium-tech greenhouses but I’m trying…especially by going to cherry tomato instead of the round, big tomato. It’s more controllable...
… we’re depending fully on fertilizer in hydroponic situations…But…you don’t have to go really, really high on fertilizer…It’s a compromise, what you want to achieve really. Fertilizer is a tool…It’s not like feeding a lamb to make it fat. A plant work different.
Lachlan [In answer to my question about who are the most important people as far as this operation goes?] …definitely the growers…growing skills and experience are not generic throughout the world…And a lot of what growers do is not in a textbook…so growers are very difficult to replace…
… we’re going to end a crop at a certain date but our new crop, the plants have arrived a little bit smaller than expected so we may have a little bit of a gap of supply in the market so the growers’ are saying, well they can slow down the other ones slightly just by notching the temperature down just a couple of degrees…

108
Language of control and reliance continued regarding disease control, which was seen as a
significant hurdle to reducing water use through recycling of irrigation water. For example,
Andrew explained:
The ideal system is for us to have a recirculation system for the tomatoes…recirculate your runoff water back through the system. It does have disease implications because if you’ve got 20,000 plants and one of them’s got a disease…so there’s disinfection issues...
At the same time, some of the comments, such as Andrew’s (in Table 20) about turning the
heat up increasing energy use (and cost), illustrate a compromise between control (especially
reduction) of inputs and optimum use of inputs for ideal plant conditions. In Andrew’s case he
was increasing the heat to ‘balance’ the plant now to keep it in prime condition and avoid a
problem later. This leads to discussion of business priorities and strategy.
5.4.5 Business control (and reliance)
The language of control came through when three of the farmers touched on some of their
business strategies, planning and decisions, which sometimes further affected how they
physically controlled their crops. Arrangements with wholesalers probably also affects
business decisions at some farms, as shown by Patrick’s comment from the market end. Table
21 provides examples of different ways of controlling the business.

109
Table 21. Business control.
Participant Aspect of business control
Example quotes
George Cost of control and control of costs.
The extreme heat in summer sometime you need cooling really to get the perfect, but it’s always a compromise and everything causes something and you’ve got to compare the cost and decide…it’s a business, you know, to make a living and that’s the difference between the hi-tech, when you talk about hi-tech greenhouses it’s growing in the perfect environment where you can modify it…Some farmers afford things, some farmers can’t afford.
…for me, priority is not getting the highest yield, it’s more cutting my cost and make it running a profitable.
… for me now, at this time, wrong or right, what I try to do is to control my cost more than controlling my yield or production.
Andrew Reliance on cash-flow
…in small business the bottom line cash flow’s king. We’ve got twenty employees. Probably be 15 or 18 full-time equivalents, but there’s 20 people that have to be paid every week. We live and breathe on our cash flow…
Increased control over income by selling to the public and retailers
…We had to do it to compete. If we had to send all of our produce to market, it’d be feast or famine, we’d make money one week, we’d lose money the next three weeks, because that’s the nature of the beast. So…we’ve eliminated packing, transport, agent’s fees and all of their shenanigans, we’ve eliminated all the hassles of dealing with supermarkets…
Business relies on reputation for flavour [likely this would influence aspects of crop management].
…we live and breathe on flavour, we really do because we’re not the cheapest tomato around, although having said that sometimes we’re very cheap, depending on tomato supply…
…the consumer knows that if they get a bag of [our] tomatoes they’ll taste good. We’d die overnight if we lost the flavour.
Lachlan Budgeting on climate factors
…we actually have a light budget every week and whether we exceed it or don’t exceed the light budget because it has such a massive impact on our business.
Patrick Takes measures to ensure continuous tomato supply
...with the cherry tomatoes we only have, we program him and we’ve got another grower in Bundaberg, when he finishes off, they clash for a week or two because we have to, because we can’t take a chance of having none, because we serve Coles, we’re contracted to serve Coles. So we try to program them so they don’t clash with each other.

110
5.4.6 Weather
Despite the human control exerted over greenhouse-grown crops, the yield and profitability of
the businesses (farms particularly) substantially depends on the weather, including
temperature, water availability and light. Andrew, George and Lachlan explicitly compared
their relative control in the greenhouse to the vagaries of the weather and/or seasons, for
example, Lachlan:
…we’ve got some level of control over the environment in the greenhouses and keep temperature reasonably constant. There’s a massive variation between our activity in winter and in summer…there’s a very strong correlation between the light and yield...
There was acceptance that the weather cannot be controlled. Each section of the supply chain
is affected by the weather either directly or indirectly. Rain directly affected transporter Marc
by slowing down his work in the markets and on the road. Wholesalers and retailers had a
comprehensive understanding of how the weather affected the fruit supply and/or their trade.
Val talked of lower customer demand for tomatoes in cold weather, while Jason, Patrick and
Alex emphasised the weather’s influence on supply, thereby largely driving price in the supply
and demand economy of the central wholesale market. For example, wholesaler Patrick
described the impact of floods:
No matter how dry it is, it could be a drought, people will always find water…but when it’s raining, flooding, they can’t get in there, they can’t pick, they can’t pack, they can’t plant…We say it’s good for our industry because it lifts prices up and we don’t have to work as hard to make more money…so weather’s a big impact and no one can control that.
Alex put supply and demand in context with other business costs, showing the importance of
weather (including to his own everyday routine):
Very rarely a retailer will put up his fruit and veg for fuel or for buying new equipment, very rarely but when it comes to weather and there’s a short amount of produce available, then you’ll find the price go up…So it comes down to the weather. I mean, I sit down at home every night and watch the weather because that determines what I can buy, what’s going to be available for the week.
We can assume that the greenhouse growers would be less susceptible to the flooding
problems expressed by Patrick, due to their relative control of the climate inside the
greenhouse. But they, along with the whole supply chain, and apparently the prices that
consumers pay for tomatoes, depend largely on the weather, something they ultimately
cannot control.

111
5.4.7 Reliance on others in the supply chain
The awareness of the weather’s impact through the supply chain demonstrates the obvious
reliance on farmers by wholesalers and retailers for their product. There were other examples
of businesses relying on other parts of the supply chain, such as on transport and on
information from large retail customers. Farm D also demonstrated control within its
operation in order to respond to such customer (retailer) requirements. Retailer Steve
commented that a business can never totally ‘control’ customer satisfaction.
Some of the arrangements between different businesses in the supply chain are based on
trust. Some others are formal, such as the detailed product specifications set by customers for
Farm D, and Wholesaler Patrick’s contract to supply Coles. Vertical integration is a form of
control over business, as lamented by smaller grower George, but advantageous for larger
businesses. Farm D is at least part of a vertically integrated system, supplying directly to major
supermarket chains, but also sells into the central market system (through the marketing/sales
side of its business structure). Patrick is aiming for vertical integration, for example by
programming growers for consistent supply, and using waste vegetables to feed his own cattle.
And Wholesaler Val provided marketing material about a tomato farm that his business was
investing in. Table 22 provides some examples of how participants expressed this reliance on
others, and business control over parts of the supply chain.
Table 22. Participant views on reliance and control within the supply chain.
Participant Example quotes Andrew So it is an important run [transport to Sydney] for us, for all the farmers. If they
disappeared, I don’t know what we’d do...
We consign it to an agent in Sydney, who we deal with; it’s all based on trust…
Lachlan We can’t always pack immediately because we’re not always sure exactly what the packing configuration is going to be required by the supermarket chains.
Everything we do in the pack house and everything is focused on those customer requirements…So we have Coles and Woolworths product specifications in terms of sizes, colours and everything, is on display and it’s…checked…
Steve I reckon if they’ve [customers] got your confidence…if nine out of 10 times you’re always getting the right product and that, at the right price, I think the consumer won’t have a problem with you. And if they do, some of that you can’t control…
Jason There’s no contract [with the grower], it’s all actually just goodwill basically. So if they’re not happy with you they’ll look for someone else.
George …all the big projects in the tomato industry are connected to agents or to the chain people…Woolworths try to grow their own tomatoes and say Flavourite, they’re part agents, part growers…they have the money to invest but small farmers, it’s really, really hard to go hi-tech…you need multi million dollar.

112
5.4.8 Other types of control and reliance
Post-harvest quality control was raised by some participants further down the supply chain.
Patrick noted the importance of keeping fruit at a constant temperature. Chris from the
Markets specified pesticide tests that are conducted by the (former) Department of
Agriculture. And Marc referred to the importance placed on quality control by his (retailer)
boss at the Markets. His transport truck can be delayed if the retailer is unhappy with the
product from the wholesalers, until better produce is provided.
The Markets demonstrated a rules-and-enforcement approach for a range of factors around
safety and efficient management of the market site. These included forklift speed and truck
movements, and waste handling. The latter was largely taken out of the hands of tenants and
managed by Markets staff to ensure compliance.
Packaging manager Michael had an interest in biodegradable and compostable packaging
across the broader food industry. Innovation and change relied on volume, which was needed
for facilities to be commercially viable and therefore established:
So there’s a lot that can be done [more environmentally friendly packaging] but it’s just going to be gradual because products like that just have to get a name in the market place, volumes have to increase for the price to come down because everything’s volume driven. In packaging it’s all volume driven.
So a language of control and reliance permeated most of the interviews. While the most
obvious topics discussed in these terms dealt with controlling conditions inside greenhouses,
and not being able to control the weather, it was not only farmers that talked in these terms. I
interpret the language more broadly in a business sense – business people aiming to control
their costs, their supply, and the success of their business.
This is shown by the way many of them talked of control actions to reduce reliance on
something (such as electricity) or increasing their knowledge to increase control (such as
farmers ‘becoming better growers’) or predictability of the market (such as retailers watching
national weather forecasts to anticipate supply and therefore prices).

113
5.5 Relationships
A theme about relationships between actors at different levels of the supply chain emerged
through multiple reviews of interview transcripts, perhaps as a subset of an original theme
around everything to do with people. The relationships theme also presented itself during
coding for ‘potential to change’ and it is mainly in this context that it is explored here.
Some participants expressed a level of suspicion or scepticism about different parts of the
supply chain – and even other types of actors in their own part of the chain. Examples are
shown in Table 23 (It should be noted that this is not between any of the actual participants, at
least not known to me; it would be pure coincidence if that were to be the case).
Other comments (such as those in Table 24), not particularly negative or positive, were made
about the grower-wholesaler relationship. The comments suggest that the wholesaler is in a
position of (informal) power in relation to the farmers, including influencing the size of a crop
or when it is grown. The farmer could choose to go elsewhere if not satisfied, and if he/she
considers that a better deal can be reached with another wholesaler. According to a
horticultural consultant, growers range from those who have used the same wholesaler for
generations and place all trust in them, to others that say their wholesaler rips them off
(G McEvilly 2009, pers. comm. 5 June).
Another power relationship was seen to exist between the medium-sized retailer and the
market wholesalers, as viewed by Marc:
I have three guys sitting outside the front of the warehouse and all they do is quality control…A pallet will come in, they’ll have a look, and they’ll go, yeah, send it in or, no, send it out…
And:
...keep the agents on their toes…don’t send us the bad stuff because if you do we aren’t going to accept it and we won’t deal with you again.
The Markets (which as an organisation is owned by the tenants) deals with the wholesaler
tenants and transporters at the Markets via a range of procedures and rules. This does not
necessarily indicate suspicion but is a separation and indicates a power relationship.
Three farmers expressed dissatisfaction with government, either in general or on specific
issues. Andrew thought that ‘governments ignore farmers at their peril’, while George

114
considered that ‘growers can’t bear the cost of changes all the time…Unfortunately where I
think the problem is our government tried to shift responsibility…’. Lily was frustrated that
local government would not support expansion of piped natural gas to local growers and
chicken sheds.
There were also some positive, pragmatic, comments about working together with other parts
of a chain to achieve results. Marc had ‘a very, very strong relationship with the buyers. At the
end of the day they make my life easy and I make their life easy or it could go opposite…’.
Michael described ‘the relationship that we have with our manufacturer of [certain plastic
punnets+, they’ve gone out and purchased, like, a million dollar machine to do this *in Australia
rather than in China+’. For him,
...it’s all about building relationships because you’ll get, in packaging I could get 10 calls a week from reps…And like anything, they promise you the earth…So you just work with your current suppliers and…you try your hardest to do business with them because of the relationships, but at the end of the day you’ve got a business to run and if things aren’t working out then, you know, you look elsewhere.
Farm D’s production manager, who runs the pack house, liaises closely with the sales and
marketing side of the operation, who tells him what the packaging requirements and volumes
are for the day, for the various customers. Particular customers have different specifications
for the final product, such as size and shape. If the product falls out of these specifications, say,
at the beginning of the season when the fruit first comes on the plant, the relationships
between the marketing and sales team and the retailer are important to negotiate a standard
variation until the fruit can come back in line with the retailer’s specifications.
It should be noted that participants with these positive sentiments about relationships across
the supply chain were employees of organisations vertically integrated in some way, either
within the business itself or some business arrangement to perform tasks for another part of
the chain (such as the transporter).
Retailer Steve had visited a farm and expressed some empathy for farmers in the chain.
Overall, though, the participants’ comments suggested a disjointed chain, except for the cases
where vertical integration is occurring (which are only touched on in this study). At the same
time, protected cropping tomato growers nationally are not organised as a single horizontal
industry, potentially making it more difficult to introduce change to reduce GHG emissions at
the grower level. The greenhouse sector also has a history of not being particularly

115
cooperative, with many growers reluctant to share information and experiences with other
growers, or explore new ideas (Badgery-Parker 2001, pp34-35).
Table 23. Elements of suspicion or scepticism about others in supply chain.
Participant Example quotes Andrew [by mainly distributing produce directly and relatively locally] we’ve eliminated packing,
transport, agent’s fees and all of their shenanigans, we’ve eliminated all the hassles of dealing with supermarkets…
…it’s all based on trust, but agents haven’t got the best names in the world, that’s why we don’t like sending it [to Sydney Markets].
people with the smaller consignments got a bigger fatigue levy than the guys with the bigger consignments… Which basically said to me, the little guys are a nuisance [to transporters]…
George (Implicit comment on rest of chain, where prices increased): …I think, we’re losing the support of the community because…you see all these tomato, you think, this man must be a billionaire, because I’m paying that much for a tomato in the shop and he’s got so many of them, but…[it does not all get back to the farmers].
(Not suspicious, but difficult to go high-tech as small farmer): …all the big projects in the tomato industry are connected to agents or to the chain people, like, Woolworths try to grow their own tomatoes and say Flavourite, they’re part agents, part growers and they’re having a successful business. Moraitis used to be the agents now they’ve bought their own farms, like hi-tech farm. They have the money to invest…
Val (Not a direct quote as after formal interview): A lot of dodgy things go on in the industry, including from the growers, such as small fruit at the bottom of the box. Suggested that I would be better off looking for participants among growers rather than transporters or others around the Markets, as people there were not very sociable.
Patrick …a lot of these chain stores are going direct to growers…they bait the growers. They sort of pay more for the first, a lot of growers have gone there and come back, because they lock them in prices.
…the bigger and the richer growers will grow that many to destroy the market. That’s their aim. It’s bullshit…
Steve …I’m totally against Coles and Woolies and stuff, and I worked with them, the way they do business. I reckon they’re out to get the small bloke and hopefully close all the small blokes down.
Marc (The industry in general, in the context of generating change): …there’s too many people trying to make money. So because of that everyone cuts corners and they don’t really care about the environment…

116
Table 24. More farmer-wholesaler relationship aspects.
Participant Example quotes George I’m trying to move to a brand name, you know…I’ve got one variety now but the agent
told me not to grow more than one shed. He’s saying that top price.
Jason There’s no contract, it’s all actually just goodwill basically. So if they’re not happy with you they’ll look for someone else.
Patrick …with the cherry tomatoes we only have, we program him and…another grower in Bundaberg, when he finishes off, they clash for a week or two because we have to, because we can’t take a chance of having none, because we serve Coles, we’re contracted to serve Coles.
5.6 Potential to change
5.6.1 High-end GHG emitters – the figures versus the participants’ focus
Chapter 4 contained the full quantitative analysis. Four participants stood out as having
relatively high GHG emissions per tonne of tomatoes relative to others in this study. Here I
look at the views and motivations of those participants to gauge opportunities for GHG
emission reduction.
1. The participant with highest GHG emissions per tonne of tomatoes was Farm A, and
the vast majority of the emissions calculable here were from stationary energy use fuelled
onsite by coal. Notwithstanding the suggestion in Chapter 4.1.1 that efficiencies at the farm
level, rather than simply use of less emission-intensive fuels, might substantially influence GHG
emissions per yield figures (specifically in relation to Farm D), the use of coal at Farm A clearly
dominates its GHG emission profile. Andrew explained that the use of a coal-fired heating
system was purely related to costs, as the farm is in an area not supplied with natural gas. He
was open to change to solar with a gas (cylinder) backup system; if solar could be installed at a
reasonable cost (someone had approached him about trialling a solar system). For Andrew,
change to a less GHG-intensive energy supply would be dependent on costs.
2. Farm B, due mostly to its rate of electricity and LPG use, combined with a low yield
year, performed similarly to Farm A for GHG emissions per yield (noting the uncertainties due
to reliance on my estimations based on limited participant information). If the estimates are
accurate, it is the LPG that is creating most of Farm B’s emissions, and this is also the input that
is ‘really bad, killing us the bills’. If natural gas was available, Farm B would switch to that for
cost reasons (but it would also reduce GHG emissions).

117
3. Farm D was GHG emissions-efficient per yield compared to Farms A and B but still a
large emitter compared to wholesalers and Retailer Alex (and transport – fuel only). Farm D’s
greatest GHG emissions were from consumption of purchased electricity followed closely by
waste going to landfill. Although Lachlan listed power as one of the farm’s greatest input costs,
it was waste that he was more focused on in the interview, perhaps (though this is my
speculation) because of a view that the waste was something that could be changed, as
opposed to electricity, which is primarily used for climate control in the greenhouse, crucial for
plant survival and optimal growth, so probably not something that can be skimped on. It is also
possible that waste removal is costing the business more than the electricity.
4. Retailer Steve (despite uncertainties over emission figures, given the small retail
sample) showed most GHG emissions for waste to landfill, followed by consumption of
purchased electricity. Steve was well aware of the cost of his waste removal, and had trialled a
machine for collection of fruit and vegetable waste, which was unsuccessful. He also had a
rough idea of the cost of his electricity use, but did not express any views on reducing it or on
energy efficiencies. I interpret this as acceptance of electricity use as a cost of business.
5.6.2 Indicators of drivers and willingness to change
Despite uncertainties over the retailer figures (given the small sample) and such a large
difference in their waste and GHG emissions per kilo of tomatoes, it is noted that Steve,
despite stating that he didn’t really understand climate change, demonstrated willingness to
introduce change into the business, if presented with an alternative (that was also of cost
benefit) by someone else:
…We put [the waste] through, like a washing machine type thing and it goes into a thing and it becomes a liquid…For the environment it was 100 times better and for our cost…it was good. The problem was with these actual machines...I ended up pulling out after 6 months...it just became too hard...

118
Similarly, Andrew was prepared to consider ideas put forward by others and if cost-effective:
...obviously our energy costs are high, if someone came up with a viable alternative, we would entertain it straight away. If someone came to us with an alternative that was going to cost us a lot of money and take us ten years to pay for, probably wouldn’t want to know about it.
And:
...this solar energy proposal from this guy this morning, I said look, too right, let’s talk about it…I mean deep down we all want to do our bit. But we want to survive as well…
Or, if forced to by government:
...so unless it’s something that comes along that’s going to cost them less, they’re going to take some convincing, obviously governments that’s where they’ll step in and legislate, you know, make them do it, but I mean that’s life. We mightn’t like it but that’s life.
Alex did not show significant knowledge about how he or others in the supply chain could
reduce energy use or GHG emissions, considering the only thing he could do is separate and
recycle cardboard and foam boxes. It was not clear, however, how he would respond to
initiatives or information presented to him about what he could do. So the overall potential to
change is not known.
The interview with Lily did not yield any particular insights into the farmers’ potential to
change to reduce GHG emissions, as she had no comment to make on climate change. Yet Lily
and her partner are clearly entrepreneurial as they have invested in high-tech farm
infrastructure and have another supply business in the greenhouse industry. A focus on key
costs (water, gas and labour) suggests that the farmers would need to see cost benefits to
support change that reduced GHG emissions.
George had tried many different combinations of crops and experimented with heating,
season length, watering and so on. He was focused on minimising costs. He showed ability to
change practices provided there is a cost saving, and not too great a capital investment. He
had been involved in various industry and research initiatives, so was arguably well placed to
keep abreast of new developments. At the same time, he showed concern with what he saw as
farmers being asked to take on more and more responsibility for what he considered

119
‘community’ issues; and being required to be more multiskilled:
...I think we can contribute a lot as producers to try to minimise the impact on the environment. I believe there is no limit to what we can do but everything come at a cost…As a community, I know that the growers can’t bear the cost of changes all the time...They [government] want things solved but…we can’t carry it as growers…they should be shared costs.
And:
...farming is not anymore the same, you know, before farming as I said is growing cucumber and tomato whatever you’re growing and forget about other things, but these days you have to be a researcher, you have to be an expert with chemicals, you have to do all type of training and courses to comply, you know? It’s really becoming a lot harder.
Chris and Michael were already investigating ways to reduce GHG emissions (or sustainability
more broadly through using recyclable plastic packaging, downgauging the plastic used etc).
However, their respective employers were so large that quantifying their emissions per one
kilogram of tomatoes (or even just tomatoes) would be extremely difficult and auditing those
companies to that level would be stand alone projects. So, while their comments on ability to
change were encouraging for the supply chain as a whole, the relative influence of their
changes to date (compared to farmers, wholesalers and retailers) on the total emissions profile
for a kilogram of tomatoes is unknown.
In this respect transport companies are also an uncertainty, particularly as far as allocation to a
particular fruit or vegetable; but also because the whole company would need to be audited to
give a complete baseline from which to calculate the effect of one journey.
5.7 Conclusions
The interviews revealed the inherent but accepted conflict between ultimate reliance on
‘good’ weather and the control measures farmers put in place to try to guarantee their yields.
The supply and demand and economic flow-on effects of the weather back at the farm were
evident among wholesalers and retailers, as were their subsequent business or ‘control’
strategies. Agriculture’s interface with nature has always demanded that farmers find ways to
plan for and manage climatic and weather conditions. Here though, high-tech greenhouse
horticulture provides a stark demonstration of internal climate control competing with
outdoor conditions. The system of alarms, back-up energy supplies and expert growers and
consultants needed to deal with any contingency shows a level of fragility to the control
achieved indoors.

120
Across the board, the tomatoes were viewed in economic terms, even if some personal
interactions of memories were also relayed. Uncertainty or contradiction in identifying types
of tomatoes grew the further away from the farm-end of the supply chain, reflecting the
commerciality and branding of the commodity.
Positive relationships between actors in this supply chain did not appear to be strong enough
to focus on as an opportunity to reduce GHG emissions. Although some participants
recognised the business benefits of working well with others in the chain, or at least seeing
how they operate, it did not seem to be well-enough developed across (and within) the
sectors.
It is costs, and availability of alternatives, which I assess as key to the potential for significant
change by the four participants’ identified as high-end GHG emitters. More broadly, four
factors can be identified as important catalysts for change to occur by businesses studied in
this project. The first two are essential; the third and fourth not necessarily, as cost efficiency
on its own might be enough for an individual change to be implemented. The last two are
important though for sustained change.
1. Costs. As discussed, across the board, costs were seen as the main driver for – or against –
change. In addition, all farmers mentioned labour as significant cost, meaning that areas
such as automation of various processes, bumble bees for pollination etc, were on some
farmers’ agendas. In this vein, it is possible that revaluing and/or reattributing cost of
water to all actual users (rather than landlords) in the supply chain could increase
awareness of water use and motivation for its reduction.
2. Availability of alternatives and assistance in identifying those opportunities for change. For
example, natural gas is not available at Farm A, so change in energy type will only occur if
something cheaper than coal ‘comes along’. Waste reduction probably fits here also, as it
appears that alternatives to landfill are adopted once available and convenient, as in the
case of recycling of boxes. Further investigation into options for green and organic waste
at grower and retail levels would be beneficial.
3. Individuals to drive change and/or establish goals. For example, with reduction of waste to
landfill (increase in recycling) the Markets had an employee responsible for overseeing
waste management and there were targets in place to reduce waste to landfill each year.
Michael’s employer was a signatory to the National Packaging Covenant, which involved

121
reporting of reductions in waste, and Michael expressed personal interest in innovations in
packaging such as compostable and biodegradable packaging. Marc relayed that his boss
at the markets (owner of a medium-sized retail chain) had a personal commitment to
recycling and reducing littering by his business (expressed as being counter to most people
in the fruit and vegetable industry, ‘too many people trying to make money’).
4. Increase in knowledge about climate change or environmental issues more generally, given
several participants’ lack of connection between their business activities and climate
change. It is perhaps here that the analysis of participants’ language and themes of
control and reliance is most useful, as it revealed that it is not only costs (although these
are clearly the most obvious to note, including for the participants themselves), but control
of various business factors that drives participants. Understanding specific business
exposures and risks related to environmental factors may be key to fostering change.
Further, the widespread awareness among participants of the weather and weather
impacts on business, despite temporal differences to climate change impacts, could
perhaps be built on here when approaching actors in this supply chain.

122
6 DISCUSSION
This chapter draws together the results about GHG emissions, water use and waste from the
tomato supply chain with the views and knowledge of the participants. I reflect on the
productive nature of bringing together two ‘colliding epistemologies’ – of relational following
and quantitative accounting of GHG emissions through the tomato journeys. I also discuss the
project from a methodological stance, drawing on both the results and the literature review. I
then bring together the results and methodological experience and look at the practicalities of
providing food miles or product LCA information to consumers. In this context I consider
whether the overall system required to implement such a policy would be a feasible
contribution to reducing GHG emissions in Australia. Another option of picking high GHG
emission hotspots along the chain is considered, as is a more strategic look at Australia’s food
supply, both in the context of food security and a changing climate, and in terms of
horticulture’s place in the overall GHG emissions picture.
Individual GHG emission-reduction possibilities identified in the study are discussed. I also
reflect on how my position may have impacted on the results. Finally, I note some limitations
of the study and suggest areas for further research.
6.1 Bringing together stakeholder views and knowledge with tomato journeys and their GHG emissions
The interviews gave useful insights into the ‘stapleness’ of tomatoes, reinforcing the examples
contained in the literature review. Patrick mentioned that there are businesses (such as fast
food chains) that must buy tomatoes at any price. Retailers talked about the importance of
tomatoes to their shop, including through sales and the amount of space they occupied. Yet
the stapleness of tomatoes is not reflective of the variety of tomatoes available, their growing
methods nor their individual journeys and GHG emission profiles. The results in Chapters 4 and
5 showed the complex, variable stories behind the different tomatoes a consumer might
choose from in a given shop.

123
6.1.1 Knowledge and views affect journeys
It is clear from the interviews that participants at each stage of the tomato journey were
knowledgeable about what they could and could not control, when it came to what they saw
as their core business. This did not include climate change, but factors such as cost drivers, and
essentials such as electricity. Across the chain, there was an understanding of reliance on the
weather, yet participants aimed to manage for it as much as possible, particularly with
significant investments in technology at the farm level. Farmers in particular sought control of
the biological plant, using technical and expert manipulation of environmental temperature
and nutrient application.
These participants understood and continued to acquire knowledge, and experimented to find
better growing practices. This included not only the high technology farmers but the medium
technology farmer (George) who focused on controlling costs rather than expanding his
business. These people are not stuck in the past. Similarly, the wholesalers interviewed were
established businesses and/or finding ways to expand.
A spatial, climatic element of knowledge was evident. Wholesalers bought tomatoes from
different places depending on season. They talked in terms of seasons. They also talked in
terms of weather, particularly how it affects immediate and upcoming supply, for example if
there is a flood in a major producing region. At the same time, there was an interesting range
of statements from participants further along the chain from farmers, about produce sourced
‘locally’ or from certain areas, and about hydroponics and/or greenhouse-grown produce. The
range of comments suggested different perceptions about what is grown where.
Cultural and/or personal preferences about taste and other qualities of fresh produce also
appeared to affect the market. For example, Alex said he did not buy hydroponic tomatoes as
he considered them to have less flavour and to be full of water. On reflection of the interview
process, it appears that, the further down the supply chain, the less knowledgeable
participants were about the actual tomatoes traded (as opposed to what types of tomatoes
were available). Their knowledge appeared more mixed with use of marketing terms.
All of these factors influence the overall journey of the tomato, and its consequent GHG
emissions.

124
6.1.2 Knowledge and views affect accounting of GHG emissions (ie. methods)
The views and knowledge of participants affects how they account for GHG emissions,
particularly in a business that is at all integrated, either horizontally or vertically. For example,
perceptions and definitions of ‘waste’ have already been discussed. To extend this further,
‘waste’ can be moved around, or accounted for where most beneficial to the business. In
analysing Farm A’s tomato operation, I did not include ‘waste’ tomatoes as waste because they
all went to the cafe or food processing side of the business. Yet there would be waste in those
parts of the business arising from those tomatoes.
6.2 Tradeoffs between water, waste and GHG emissions
One of the aims of this project was to consider GHG emissions in a broader environmental
context. When considering generalisations such as ‘eat local’ to reduce GHG emissions
involved in food transport, it makes sense to consider whether that particular ‘local’ is suitable
for growing the desired food. Competition for water supply and other inputs, land availability,
waste facilities and options are all factors that may or may not be conducive to that ‘local’
providing an overall environmental benefit over the conventionally-sourced product from
further away.
Environmental tradeoffs between water, waste and GHG emissions proved difficult to assess
for several reasons, and I could not form numerical conclusions about the dynamics between
those three factors. Primarily, the quality of data from participants about waste and water use
was poor overall, meaning accurate comparisons between more than a couple of participants
were not possible. A larger study with more participants may have a greater success rate with
data, or alternatively show definitively that many (particularly small) business owners lack
knowledge about these aspects of their business. Secondly, there are a range of potential
explanations for differences in water efficiency, waste and GHG emissions between, say, two
farms. The examinations of Farms A and D in Chapter 4 demonstrate this.
Perhaps a larger study involving numerous high-tech and very high-tech farms, across a range
of climatic conditions, could draw firmer conclusions on tradeoffs. It is also possible that
climatic, environmental and infrastructure variables between farms across Australia are too
great to make general conclusions about tomatoes from particular locations or growing
technologies.

125
I was surprised that several participants did not know specific details about their water use and
waste, despite the importance they placed on it and/or problems they faced with it. Further
research into why this is the case could yield useful information for strategies to reduce water
use and waste (and compare them to GHG emissions).
6.3 The ‘following’ approach
In this project I have identified with the ‘following the thing’ stream of food geography.
Although I initially prioritised collection of the quantitative data about GHG emissions, the
semi-structured interview technique allowed me to delve into more complex dynamics of the
tomato journeys. ‘Following’ studies facilitate a comprehensive exploration of the variety of
actors and the disciplines/professions involved in methodologies that form the GHG emissions
LCA-type analysis.
As well as following the ‘thing’ and its emissions, this study really follows an economy. Retailer
Steve talked about the economy of the tomato:
…obviously it keeps a lot of people in jobs, producing the actual tomato and the transporting of tomatoes and the selling of the tomatoes and then the retail aspect of it, so economically that way it’s OK.
Within this economy are a range of relationships, just like the ‘tangled routes’ to which Barndt
(2002) referred. People rely on this journey of the tomato, and any kind of GHG emissions
‘following’ must be cognisant of this. But, I would argue that it is difficult to follow GHG
emissions and achieve reductions without following the thing or the thing’s context. After all,
there are reasons why the GHG emissions are emitted at each step of the agri-food chain.
‘Following’ studies are valuable in assessing potential to change because they help us
understand that some level of motivation is required for change, rather than assuming that an
economic indicator (such as labelling) will work. Secondly, the ‘following’ study shows the
variability of a product’s production-consumption journey, perhaps technologically, seasonally,
or because it is part of a mixed crop. This understanding helps to assess the feasibility of
labelling a product down to a one kilogram unit.
‘Following’ studies are worthwhile even if they conclude that a ‘following’ economic
instrument such as labelling is not feasible. ‘Following’ studies help to make this assessment in
the first place, and then by engaging the actors within the chain, they help identify other
opportunities for change within the chain. These might include other methods for tracing and

126
disclosure (such as business-wide rather than per unit of product) or more directed
improvements to particular parts of the chain, such as incentives to change type of stationary
energy used (under some sort of regulation).
6.4 Quantitative methods
Two of the aims of this project invite discussion of methods. Key issues noted during the
course of the project were around allocation of GHG emissions to a single unit of one product
in a diverse business, and availability of methodologies to apply to the emissions identified in
the supply chain. This section also contains a note on the application of methodologies and
discussion of the nature of participants’ involvement in the study.
6.4.1 Allocation
In this project I aimed to follow a method that would allow comparison of embodied GHG
emissions in different tomatoes within one shop, and tomatoes in two different shops. It is
difficult to assess the impact of allocation on the final estimates of GHG emissions per tonne of
tomatoes in this project. For example, I could make observations about why Wholesaler B’s
emissions per tonne of tomatoes are approximately double that of Wholesalers A or C
(remembering that Wholesaler C’s figures include a researcher estimate for total tonne
tomatoes). Electricity and LPG use, and waste, could be discussed. It is possible that
Wholesaler B is less efficient and leaves lights on constantly, or that he trades less per unit of
electricity, proportionately overall. It is possible that a larger sample size would allow better
analysis of the impact of allocating emissions to one item traded.
Difficulties with allocation are also evident when accounting for GHG emissions per tonne of
tomatoes traded at the retail level. For example, Retailer B has a much smaller business, in
estimated trade terms, than Retailer A and also uses less electricity than Retailer A. Yet his
tomatoes are a much greater relative proportion of his business than Retailer A’s tomatoes.
This creates potential implications in calculating results per tonne of tomatoes and then
allocating business-wide emissions based on the business operator’s estimate of tomatoes as a
per cent of overall trade, as these are two separate units. When a portion of electricity use is
allocated to tomatoes, Retailer B appears less efficient in terms of overall electricity use. But
this type of allocation appears the only way that I can compare the two shops.

127
Within one shop, allocating the shop’s emissions to individual product types would
disadvantage the greater selling products. In trade terms, tomatoes are one of the most
important products in a fruit and vegetable shop. Therefore, we can presume that tomatoes
would have a higher ‘shop’ emissions figure allocated than a product line such as asparagus,
which would not sell as much. If the pre-retail emissions figures were identical, customers
would be encouraged to buy the asparagus, when in fact asparagus and tomato would be
equally efficient, assuming they are treated the same way at the retailer. Allocating the shop’s
emissions by weight would not necessarily produce a fairer outcome, as the weight of a given
product is not necessarily relative to its pre-shop GHG emissions. Nor would retailers have
systems to weigh each product line whereas at least they have an idea of the percentage of
their business/trade that is accounted for by each line.
This logic undermines the ability for a consumer to simply assess the emissions profile of two
products in a shop, either two different varieties of tomatoes, or tomatoes to another fruit or
vegetable. In the above scenario, choosing to buy the asparagus over the tomato does nothing
to reduce GHG emissions; it just spreads the load differently within the one shop. It suggests
that in order for a labelling scheme to incorporate the shop’s emissions, there would need to
be two figures on every product, one accounting for pre-retailer emissions and one including
the share of retailer emissions. This could apply to other actors upstream too, such as
wholesalers.
6.4.2 Available methodologies
As indicated in Chapters 2, 3 and 4, there was no single methodology available within the
scope of this project to calculate the GHG emissions from the tomato production-consumption
chain.
In particular, the transport component of the tomato journeys proved difficult to assess in
quantitative terms. Accessing individual transport company data (providing good records were
kept) appears the only reliable way to account for GHG emissions from a particular journey. On
realisation that company data would not be available for this project, the ensuing search for
generic data regarding fuel use and GHG emissions highlighted a lack of data availability. The
ABS data used for fuel consumption rates is national, and is based on a sample representing all
articulated trucks transporting any type and quantity of freight, under any road, weather,
traffic and driver conditions (ABS 2008, p13).

128
This suggests that, should a labelling scheme for individual product journeys be introduced,
and specific journey data not be available, another (middle-road) method of calculating
generic data would need to be developed. This could involve, for example, a metric involving
road conditions, vehicle and fuel efficiencies and distance for highly productive horticultural
zones and commonly used transport routes. Clearly many assumptions would still need to be
made and a figure applied to a kilogram of produce in a shop would not be the exact figure for
that product’s journey. Such a system would need periodic updating and assessment would be
necessary before implementation to see whether it was worthwhile. Consultation with the
food freight industry on fuel consumption rates would lend some credibility to the figures.
A second observation about available methodologies is that some methodologies used in this
project accounted for GHG emissions including, but not only, CO2. The most important of these
was NGA Account Factors (Department of Climate Change 2009). Others only included CO2, or
were unclear about whether they had some conversion rate for non-CO2 emissions in their
GHG emission figures. Both Saunders et al (2006) and Wells (2001) only measured CO2
emissions (and energy use) rather than other GHG emissions. It is not clear whether or not
they have incorporated some conversion factor for other emissions such as nitrous oxide and
therefore included them in the emission factors. Alcorn (2003, p23) acknowledged that non-
CO2 GHG emissions needed to be incorporated into future research on embodied energy and
emissions in building materials. In my project I have presented the results as CO2-e emissions,
as this is more complete for the majority of emissions, particularly those calculated using the
NGA Factors. However, it should be noted that it is possible that the additional analysis that
incorporates these other methodologies underestimates emissions, with CO2 emissions alone
being included.
Part of the difficulty in finding emissions data and methodologies for this project is probably
more accurately described as a lack of consolidated and accessible data. For example, it is likely
that there is a variety of information on energy use in different types of greenhouses, but in
vastly different literatures, different spheres of science, and much more not in scientific
literature but in various industry and grey literatures. Even the quantitative side of this type of
study is interdisciplinary. Research into embodied energy and GHG emissions in building
materials might largely be carried out by architectural and engineering sectors, emissions in
vehicles and machinery by different areas of engineering and manufacturing, and emissions in
fertiliser production by others again. Agricultural (and horticultural) science, transport logistics,
and energy studies are broad areas of research that are all relevant to LCA-type studies. It is

129
challenging to get across such broad and numerous areas of literature. Many of the
components of capital equipment, infrastructure and inputs such as fertilisers have different
emissions profiles depending on where and how they were manufactured. And even when
studies are found on an input or subject basis, they need to be assessed for applicability to
Australian conditions. All of this in itself is a substantial task.
This is recognised in the literature (as discussed in Chapter 2). Many authors talk about how
difficult it is to compare studies. In studies of production, glasshouse/greenhouse production is
often not specified. But if a study is to be assessed on applicability to a particular type of
production in Australia, the type of production is critical information. From the literature, it
would appear that protected cropping is one of the most energy-intensive forms of
horticulture (for example, see Carlsson-Kanyama et al. 2003, pp298, 300). We need
overarching studies that can assess this and come to broad, standard positions on a range of
forms of glasshouse or greenhouse production. Ideally, individual production system studies
should be specific about the type of system being analysed, so that others can assess
applicability to new contexts.
Accessibility is not only about finding the data among diverse literatures but also physical
access or knowledge that the data even exists. This includes data held by individual companies
(such as manufacturers), by industry organisations (where literature might be available but on
a subscription basis) and data held by LCA professionals and in proprietary databases. This is
not necessarily an obstacle to governments or industry wanting to implement LCA type
measurements of products, as they would be able to access much of this data. It is, however,
an obstacle to members of the public (such as consumers) or businesses attempting to
calculate emissions without engaging an expert. It also suggests that any national scheme for
emissions tracking of product chains would need to involve expert auditing. Businesses would
have to engage an auditor to calculate their emissions. If this was to be avoided, a substantial
amount of work would need to be carried out before implementation of the scheme to enable
the many emission factors to be accessible to individuals and businesses. Again, this is not
necessarily negative, but it does involve cost. Businesses already rely on professional
accountants and auditors for financial obligations and having experts verify the accounting
should make a system more credible than self-regulation. A range of businesses across the
economy already engage LCA and energy experts to conduct energy audits of their businesses
or products, if they deem it worthwhile for their business.

130
6.4.3 Application of quantitative methodologies
I have taken a conservative approach when calculating emissions, especially regarding capital
infrastructure and equipment. For example, if unaware of whether pipes were made of plastic
or steel, I applied the embodied energy coefficient of steel, which is much lower than plastic.
6.4.4 Participants
Participants in this study were people willing to be involved, and as such at least prepared to
discuss GHG emissions and provide relevant business information, regardless of their attitudes
towards climate change. This potentially limits application of the results to the broader
industry. However, having a small number of participants already, I have not attempted to
extend my conclusions (particularly quantitative ones) definitively across the industry. Further,
as shown in Chapter 5, a range of views were expressed on climate change and the ability of
individual businesses to reduce emissions. These views expressed in the context of this study
should not be held against those participants. I would argue that a key part of introducing
change to an industry to reduce GHG emissions is engagement with business owners. The
participants in this study were willing to do this, at the very least.
I have tried to keep participants’ identities anonymous in this thesis. The analysis I have
conducted here regarding emissions from their operations should not be applied to their
products or business. They are meant to be seen as relative figures compared to the other
businesses in this project rather than being specifically accurate to the individual operation.
The deeper the analysis, the more assumptions are involved. In a real-world audit, more
specific data collection than that possible in this project would be required.
6.5 Policy relevance – bringing together the results and the methods
6.5.1 Usefulness of obtainable transport information (food miles)
As discussed in section 6.4.2, calculating emissions from the (road) transport leg of a tomato
journey was difficult. I found that without investigating specific transport companies, the only
data available was the average FCR, which aside from fuel did not account for any transport
company or journey-related factors influencing GHG emissions.
The result was that the figures for transport GHG emissions worked out to be little better than
a function of kilometres travelled. Yet as discussed in Chapter 2.6, distance only is not

131
sufficient data on which to base relative judgements about GHG emissions from different
journeys. Thus, with only these methods available, comparing journeys between different
actors does not appear particularly useful.
What does appear useful is the observation that the GHG emissions from fuel used for
transporting the tomatoes is minor compared to the GHG emissions calculated at the farm
level, and those calculated at the retailer level, per tonne of tomatoes grown, transported or
traded. There may be greater or fewer GHG emissions from transport fuel than calculated at
the wholesale level, per tonne of tomatoes traded.
Despite the general nature of the FCR and the omission of non-fuel transport-related GHG
emissions, the results indicate that transport is not the major source (or at least cannot be
assumed to be the major source) of GHG emissions in a given journey of tomatoes from farm
to markets or markets to fruit shop. This is consistent with other studies, as discussed in
Chapter 2. This raises doubts over the usefulness of establishing a regime to collect food miles
data and provide it to consumers.
Having said this, if comprehensive LCA data was to be collected and provided to consumers,
such a regime would need to include the transport parts of the journey.
6.5.2 Usefulness of GHG emission data from the business level – using stationary energy as
an example
As a business would expect from an energy audit or LCA study, this project was able to identify
areas of further research potentially useful to individual businesses or groups of businesses. I
discuss these further in section 6.6. Here I consider how this level of information can be
applied at a broader economy level.
I found that stationary energy formed a key part of the GHG emission profile of a tomato
operation, especially at the farm level. Stationary energy supply and reliability was also of core
concern to farmers. Continuous supply is clearly a critical input to their operation. The
indication that stationary energy use (and then waste) appeared more significant than GHG
emissions embodied in the very high tech infrastructure at Farm D strengthens the conclusion
that stationary energy use is important to any change to reduce GHG emissions.
While more in-depth study of both the situation at Farm D and across the industry would be
needed, the results suggest that a policy of targeting GHG emissions from specific

132
sources/practices should be considered instead of or alongside any consumer-based
information campaign such as LCA-type labelling. There must be some threshold whereby
identification of major emission sources (through energy audit/LCA-type studies) and action
targeting them would be more efficient than an ongoing consumer labelling program.
There may well be energy and GHG emission efficiencies that can be gained in the stationary
energy use at an existing tomato farm. The physical ability to reduce those emissions would
also need to be taken into account. This study found that availability of alternatives and
assistance in identifying opportunities for change was a limiting factor for change (hence Farm
A using coal for stationary energy). More energy-efficient sources might or might not be
available to the farm, or appropriate for the farm (for example the position of the farm might
not be appropriate for a solar energy system).
It is also possible that the industry could restructure to favour less energy-intensive tomato
farms (not necessarily greenhouse-grown), perhaps in more appropriate climates. In such an
event transport, or another factor such as fertilisers, might become a more significant part of
the GHG emission profile of the tomato. And assessment of non-GHG emission tradeoffs, such
as water use, would need to be considered. At the same time, power may not be evenly
distributed among farmers and some might be able to negotiate better contracts with
traditional energy supply companies and compete financially without reducing GHG emissions
– comprehensive economic analysis of any initiative to reduce GHG emissions would be
required before introduction.
6.5.3 Effort (and investment) required by actors not conducive to positive change
I was surprised by some participants’ lack of knowledge about key inputs to their operations,
such as water and stationary energy use at Farms B and C, despite these inputs being major
expense items at the farms. Levels of fertiliser use at Farms A, B and C was also not readily
known. An example of participant uncertainty over units was in relation to LPG, especially for
forklifts. Some participants talked in terms of litres, others in kilograms. I had to judge their
accuracy based on how certain they sounded, along with information from a gas company as
to the standard sizes of cylinders.
Farm D had good record-keeping practices but I still received a somewhat overwhelmed
response to my detailed list of questions regarding energy and infrastructure. This was perhaps
not surprising given the relatively short time commitment for the interview. But it is

133
noteworthy given that very detailed information is required to determine the embodied
energy in infrastructure and the range of inputs to a farming (or other) operation. Some of the
data collection and analysis would only be required once, with periodic updating afterwards.
But a comprehensive LCA-type program to compare tomatoes from one farm to another would
need to involve this type of data, and business owners would have to invest time in collecting
it and/or engaging an expert to audit their business.
The qualitative analysis suggests that the fresh produce supply chain is not particularly good at
working together to achieve change. Suspicion and/or scepticism about other points of the
chain were found, or were acknowledged to exist more broadly by several participants. So was
a level of dissatisfaction with some level of government, the latter by the smaller farmers.
In the case of protected cropping tomatoes, the farmers do not have a national organisation,
and anecdotal evidence was that many tomato growers tend not to share information with
their peers. My own difficulties finding participants for the project (throughout the supply
chain) could arguably be seen as evidence of an unwillingness to share information with
outsiders, even for the chance of being involved with something new or innovative.
The Sydney Markets had taken a direct-control approach to change in waste management,
water use and electricity use at the site, in two ways. It largely took over responsibility of
waste management from the tenants in order to maintain certain standards. It also made
changes (and was considering further changes) to electricity and water infrastructure under its
control. Electricity and water use under control of tenants was up to tenants to manage.
Although the Markets acknowledged that it could advise tenants on how to reduce resource
use, this did not seem to be a major part of the change strategy.
In contrast, both the transporter and packaging procurement manager talked about
relationships with individuals and companies as being important for day-to-day work and
change respectively. However the packaging procurement manager talked about cost being a
priority and the transporter referred to cost as a reason for (others) not considering
environmental factors.
For practical and resource reasons it might appear more attractive to implement the type of
accounting required within vertically integrated operations such as supermarket (direct) supply
chains. Although there might still be several companies involved there is more likely to be
traceability of produce through the chain. There is also a level of authority, whereby the

134
supermarket chain requires contracted suppliers to adhere to particular standards. However,
there are a range of issues to be considered, including transparency, independent verification
of claims, and resulting reconfigurations of power relations. This is discussed further in section
6.5.6.
6.5.4 Accuracy and currency of information to consumers
A labelling system would need to have highly accurate information not just to be credible and
therefore encourage consumers to pay attention to it, but to make purchases that are based
on the label most valuable. The consumer choice research reviewed in Chapter 2 showed that
people buy products for a range of reasons, of which we can only expect GHG emissions to be
one thing that might be considered. Consumers also need to have trust in the labelling system
for them to follow it. Further, the better the accounting scheme in place, the more each
decision based on it would count.
This project shows the variability and complexity of the tomato supply chain. There are many
combinations of the potential tomato journey, and they can change daily, as actors buy and
sell their tomatoes from and to different people and use different transport options.
The allocation of tomatoes as percentage of a business – whether wholesaler, retailer, or
transporters – would probably change daily. Farmers that grow several crops may also change
their crops throughout the year, affecting overall allocation to tomatoes, and currency of
information. But averages would have to be used in an accounting system likely to be on an
annual basis. This means the data on labels on the tomatoes in the shop would be old data
rather than for those tomatoes under the label. This raises a question over the usefulness of
the final labels on the different tomatoes in a shop on any given day. The label might still
indicate in a relative sense which businesses are using resources better and/or generating
fewer GHG emissions (or who was, up to a year ago). But the amount of variability in the
system and the frequency that it could change (daily) could lead a consumer to think that the
labels based on annual averages were probably not that reliable in comparing two types of
tomatoes sitting side by side in the same shop. This analysis raises doubt over whether relying
on consumers to choose products displaying a lower GHG emissions figure would be an
effective driver for change.

135
6.5.5 Many chains in one economy – implications of methods for policy
When focussing on one product, such as tomatoes, a study such as this one can find that farms
account for more GHG emissions, per tonne of tomatoes. But it cannot show, in absolute trade
terms, how retailers and wholesalers compare to farms. Instead, an analysis of the whole
distribution system behind all fresh produce would be necessary to fully appreciate the
practical economic situation. For example, it is likely that many retailers are needed to
distribute all of the tomatoes from a farm. And a retailer (probably) carries hundreds of
product lines from different supply chains. There is a complex web of supply chains between
farms, wholesalers and retailers. Even supermarket chains, with more centralised and
structured supply systems, are supplied by different people for different products, and their
many retail outlets are separated spatially and would have different emission profiles.
Industry or economy-wide analysis such as in Foran et al (2005) enables comparisons between
different industries. However, it is difficult to apply such broad-scale findings to the aim of
tracking a specific object, such as in food miles or LCA, or to a consumer wanting to compare
two items sitting side by side in a shop. Further research could take a middle road and
investigate the embedding of single product chains into the wholesale-retail or mass
supermarket chain economies. Both these systems contain various efficiencies which should
be assessed alongside any alternative suggestion regarding supply chain organisation. Here,
without considering those broader market systems, I must leave open the possibility that GHG
emissions involved in the whole supply and distribution system might be greater or at least
equal to what occurs at the farm. This is a limitation of a study looking at one product.
Of course, there are many factors influencing the economy within which the greenhouse-
grown tomato supply chain operates. As well as outdoor-grown tomatoes there are processed
tomatoes and other vegetables to consider. Imports are minor in the fresh tomato sector, but
with some fruit and vegetables they are major competition. GHG emission reduction is one
policy to be addressed along with many others, such as food safety.
6.5.6 Economic price signals and interactions through the supply chain
It was not an aim of this project to assess economic price signals; however, the concept came
through in broad terms during the course of the project and is worth some discussion. The
idea behind food miles or more comprehensive LCA labelling is that information flows through
the supply chain to enable consumers to influence the extent to which the chain reduces GHG

136
emissions from food. Even though it would be a non-price signal, it would have economic aims
and implications. The aim would be for carbon-intensive production chains to invest in less-
carbon-intensive practices or give way to others that were less carbon-intensive. Examples of
implications are that administrative costs of adhering to such a regime could squeeze the
producer (if he/she did not get extra sale price for their product), or raise prices at the
consumer level. I agree with Hogan and Thorpe (2009, p30) that the economic costs and
benefits would need to be further assessed prior to introduction of any LCA-type or (in their
terms) ‘carbon labelling’ scheme.
It should not be assumed that a straight price signal on GHG emissions nor energy use would
flow through the chain to consumers in a way in which consumers might be able to effectively
act on it. The fresh fruit and vegetable economy is influenced by short and long-term factors
often beyond the direct control of growers. Nicholson (1986, pp630-632) provides an overview
of a range of these influences in a (Northern European) tomato context.
The role of direct sourcing and vertical integration of supermarkets into the supply chain, and
its impact on the market, was beyond the scope of this project but has been studied by many
(for example, see the collection edited by Burch & Lawrence 2007). Anecdotal comments
received during the project suggest that a review of the effectiveness of retailer-led demands
on quality assurance requirements of suppliers would be useful. There was some suggestion
that such demands had improved monitoring at the wholesale markets, but it was also
suggested that there are still actors in the industry that make a profit without certification.
As discussed in Chapter 5, a theme about relationships between actors in the supply chain
emerged from the interviews. The power relationships observed or suggested were ones
where a business was more powerful in relation to another earlier in the chain (for example, a
wholesaler over a farmer). The more positive comments regarding relationships through the
supply chain were from those who worked in organisations vertically integrated in some way,
although I cannot be sure of the reason for this (perhaps there is more personal incentive for
employees or agents within the one business structure to get along compared to independent
business people in this industry). Also, it was notable that it was the larger organisations that
used language about climate change and carbon footprints, and had invested in relatively
sophisticated initiatives to improve some aspects of sustainability. One could take from this
that vertical integration may have some positives for sustainability and/or GHG emission
reduction.

137
In addition, literature on supermarkets indicates that, while highly integrated supply chains
might present more opportunities for innovation and collaborative information sharing, and
increase efficiencies, these opportunities are situated in specific economic power relationships
between the actors involved (Harvey 2007, pp58-59). Cox and Chicksand (2007, p97) studied
the power regime in the beef supply chain for British supermarkets and concluded that it
supported neither win-win outcomes for producers and retailers, nor fully integrated supply
chain management based on extensive collaboration throughout the chain. Harvey discussed
the trend towards large supplier companies [like that for which Michael works], rather than
individual (small) suppliers entering relationships with the large retailers (Harvey 2007, p59).
However, the power relations between actors in the tomato supply chain suggests that flow-
through of an economic carbon signal to the point where consumers can exert some influence
is questionable. Anecdotal comments received during this project indicate a view at least that
the fluctuating supply and relatively constant demand in the tomato market is such a
dominant characteristic that a price signal on carbon would be too small a component of a
product’s overall sale price to flow through the chain evenly (for example, retailers might not
pay more for the more carbon efficient tomato because other factors influencing price may be
of greater magnitude than a carbon signal). A structural economic investigation of the industry
would be required to see if this indeed would happen. It is possible that instead, a
restructuring of the industry would happen whereby those actors who could negotiate better
energy supply (and other high-carbon input) contracts would gain more market share and
smaller actors would be squeezed financially, regardless of who is more GHG efficient. An
assessment on whether this would actually help, hinder or really do nothing to reduce GHG
emissions would be required.
6.5.7 Considering another option – picking hotspots
If labelling a product’s GHG emissions at the retail (consumer) level is not feasible, LCA can at
least identify parts of a product’s production and distribution chain that are relatively
emission-intensive (such as the example in section 6.5.2). Combined with more industry-wide
analysis discussed in section 6.5.5, this could lead to targeted GHG emissions-mitigation where
firstly, relatively easy reductions could be made and then the most efficient or practical
reductions could be made. This strategy could involve some form of financial incentives or
support from government, or direct regulation, perhaps combined with strategic climate
change adaptation initiatives.

138
Even this approach needs some caution though. In this study, the farm is identified as a key
source of GHG emissions (and water use, and waste). So one approach would be to
concentrate reduction efforts at the farm level. In addition to the issues already discussed in
section 6.5.2, there would be a minimum number of emissions needed to produce the food.
The ability to reduce emissions at the farm level may not be as great as the ability to reduce
them from elsewhere in the chain.
Having already mentioned the need for expert auditors to assess GHG emissions, this comes at
a cost to business. Campbell and Le Heron (2007, p142) noted that ability (or not) to comply
with EurepGAP standards in Europe had made it difficult for some Australian fruit and
vegetable growers to maintain a position in that market, and that requirements such as
computer records and high levels of literacy will make it even more difficult for small-scale
producers in the Third World to access the European market.
6.5.8 Something more strategic... but a challenge to achieve
Another option would be to combine assessment on future food needs with climate
predictions, including water and other resource (fertiliser, energy) availability, and current and
future land use. Assessment could be done on whether some crops would be more efficiently
grown indoors or outdoors, in what climates and locations, ensuring some form of practical
distribution across the country. Given the possibilities with future predictions of different
climate/weather events, it is possible that location for optimal climate could be more
important than proximity to existing central markets (i.e. climatic limiting factors might
outweigh resource use from transport to market).
If such a comprehensive study was possible, various mechanisms could be used to support
growth of preferable types of agriculture in those areas. An example could be assessing and/or
supplying lower emissions-intensive energy (such as natural gas) to a prime location for
protected cropping that currently does not have access to natural gas. Costing for provision of
essentials would have to be part of the overall strategy to identify the prime locations.
A comprehensive study would be unlikely to be popular. It would need to consider all forms of
agriculture (of which horticulture is a small part). It would require the topic of future food
security to be higher up the political (and public) priority list. Outcomes would presumably
involve disputes over land use, both with existing landholders, those agricultural activities
found to be less preferable in GHG terms, as well as with competing interests such as mining

139
and housing. (Land use disputes between agriculture and housing and between agriculture and
mining can be seen in western Sydney and the Liverpool plains of NSW respectively.)
There is political recognition that future food security is a significant issue for Australia and the
world. A Senate inquiry into food production in Australia (Senate Select Committee on
Agriculture and Related Industries 2010) included submissions on sustainability aspects of food
production. Urban encroachment and mining (as well as biofuel production) were all topics of
concern expressed during the inquiry. The report also included evidence from the Victorian
Eco-Innovation Lab calling for a redesign of our agricultural system to make maximum use of
resources, produce greatest nutrition possible from those resources and be as GHG-efficient as
possible (Senate Select Committee on Agriculture and Related Industries 2010, para 1.22). This
inquiry process will continue to look at sustainability and emissions trading in the new
parliament (post 2010 election).
6.5.9 Linking back to national GHG emissions reporting
Horticulture is a small part of agriculture, but transport, energy, wholesale and retail are all
included in other reporting categories. This means that only looking at the GHG emissions for
agriculture will not give a full picture of emissions through the supply chain.
However, my results showed that (in this small case of greenhouse-grown tomatoes) farm
GHG emissions were a high proportion of the tomatoes’ embodied GHG emissions throughout
the supply chain to the retailer. Perhaps then, it can be suggested that, if most GHG emissions
from horticulture are at the farm level, and horticultural GHG emissions are only a fraction of
agricultural and therefore national GHG emissions, consumers should not place too much
concern on which tomatoes to pick at the fruit shop. They should focus their efforts to reduce
GHG emissions on some other product category.

140
6.6 Individual examples from the study that could be pursued
6.6.1 Farms
Farm D did sell a proportion of its product ‘locally’, meaning within its home state rather than
Sydney. An interesting research dimension would be to compare volume of product sold and
consequent GHG emissions from Farm D in its home state, and Farm A in its local area.
Businesses also placed different value on different parts of the operation. For example, the
seedlings at Farm D travelled a long distance from the propagator, with subsequent GHG
emissions higher than if a nearby propagator was used. However, seedlings are a key input to
the success of the farm. It is therefore probable that the farm would be prepared to pay more
for or accept a penalty for consequent GHG emissions if they considered closer propagators
inferior.
Lachlan had already identified waste as an area of the Farm D business that should be made
more efficient. He was open about cost being the driver for this, but it was also an opportunity
to reduce GHG emissions. Scale is probably an issue here. While Farm A could resell growing
media to locals, Farm D probably could not seriously consider this, due to the sheer volume
and type of growing media used. Farm D would need a large-scale customer who could reuse
the product or turn it into something else.
Green waste appeared to be a problem for most farmers. Concern about disease dictates that
it should be taken away from where the tomatoes are grown. The expense of sending to
municipal landfill was considered significant by smaller farmers as well as large (George cited
the cost of sending it to landfill as the reason for keeping it on his farm). Burning off was also
illegal for greenhouse grown crops (or crops that can be moved), at least in Sydney. This may
vary from council to council and state to state. Research comparing GHG emissions profiles
from burning or sending to landfill would be interesting. The amount of plastic and nylon rope
contamination drove Farm D to stop burning, even though they could legally burn off.

141
6.6.2 Wholesalers
It would be interesting to compare GHG emissions involved in using forklifts versus utilities or
light commercial vehicles. The data received from wholesalers indicates that further research
could be done in this area, but there are too many variables in my small data selection to draw
conclusions. With roughly double the mass of a light utility or vehicle using Wells’ (2001)
masses for vehicles, a forklift would (based on mass) have a greater embodied energy than the
vehicle. Fuel use would also need to be compared, as most forklifts use LPG, whereas vehicles
could use a range of fuels. It is noted that utilities could not do the same job as forklifts in
small spaces and vertical placement and lifting of goods on pallets. But, perhaps there is a
place for vehicles in travelling longer distances between each end of market. Some wholesalers
seem to use trucks, others just forklifts. There would be a range of logistical and cost benefits
to consider in such a decision.
6.6.3 Refrigeration
The NGA Factors provide a method for calculating emissions generated from the operation of
commercial chillers and refrigeration equipment. In interview, none of the participants had
knowledge of the information required to calculate these emissions (either the stated capacity
of the equipment according to the manufacturer’s nameplate or an estimate based on opening
stock of gas, together with information on additions and disposals of gas) (Department of
Climate Change 2009, pp39-40). Cool room maintenance was usually something performed by
a tradesperson. This meant calculations could not be performed within this study. More
broadly though, it suggests that it might be worthwhile to inform operators of substantial cool
rooms and chillers about efficiencies (and therefore GHG emission reduction) and/or pursue
further with the refrigeration services sector.
6.7 Reflection on my own position in relation to the study
6.7.1 Personal background
I came to this study from a position of concern regarding climate change, and desire to find
practical ways to reduce GHG emissions from one’s lifestyle without making drastic changes to
that lifestyle. My previous employment focus on national-level climate change policy and
general outlook meant that I brought to the study a starting point that, to make the greatest
reduction in GHG emissions, the conventional food and economic system should be a focus of

142
attention. This is what most people use, and why my natural inclination was to challenge
random claims, in the press for example, that buying local food is better. Having grown up on a
farm also meant that I had empathy with the hard work and 365-day-a-year nature of the
farming job, as well as the economic exposure to weather events and other ‘natural’ processes
such as pests, and finally a general understanding of time and resource pressures on small
businesses generally.
Being ‘cold’ to greenhouse horticulture and the specifics of the tomato industry in one way
makes me an objective observer but also means that I was learning as I progressed through the
interview process. If I revisited some of the early interviews I could probably ask more pointed
questions about various aspects of the tomatoes.
6.7.2 Interpretive judgements
When conducting the qualitative analysis, I considered whether I thought participants were
giving me honest answers or ones that they thought more ‘correct’ or which they thought I
was looking for.
When identifying themes in interview transcripts, I had to judge whether the participant was
really thinking – and therefore expressing a view – about climate change (or water or waste) or
whether they were just hearing ‘environment’ and responding to a broader notion. This
affected how I attributed some of their comments. In a related point, this also affects the
alignment of the qualitative and quantitative results. For example, waste does account for
some GHG emissions, so wherever possible I included participant responses in the emissions
calculations. In the analysis of stakeholder views and knowledge, though, I was aiming to tune
into the participants’ meaning and associations, so did not automatically include comments
about waste or recycling in analysis of views about GHG emissions.
6.7.3 Story choices
On reflection of the interviews, some themes were more discrete than others. For example,
the ‘interactions with tomatoes’ or ‘connections with tomatoes’ theme saw responses from
the specific question but also quotes that participants made in other parts of their interview.
At the same time a lot of the interview content was about tomatoes, and the participants
naturally have many implicit interactions with them, not all of which could be presented and
discussed in those terms. This is an example where there is a wealth of information from which

143
many stories could be revealed: I am presenting one of a diversity of views, though it is
possible that other stories could be told; even more so if different questions were asked of
participants.
6.8 Suggestions for future research, limitations of this study
It is one task to calculate a general LCA profile of a single product from one producer,
providing all the inputs can be evaluated. But when there are many production facility types it
becomes increasingly complex. This is before allowing for variability in spatial (and therefore
transport) variability. In agriculture, climate and local conditions can be the limiting factor to
the viability of a product. Other spatial conditions such as availability of energy resources,
labour or land can determine how close to market a producer can be. These factors could be
considered in greater detail in a broader economic analysis of using LCA-type information to
reduce GHG emissions.
Comparison to outdoor-grown tomatoes and other vegetables would be beneficial. It is
possible that I have chosen a very energy-intensive farm sector. GHG emissions from transport
would be more significant in an LCA in less energy-intensive farming systems. A study over
several years would account for seasonal differences and reduce uncertainty.
Comparison with other agricultural crops would also be beneficial, not only in terms of GHG
emissions at the farm level, but in terms of knowledge of the weather and its impact on supply
by actors further down the supply chain. It would be interesting to compare the potential of
actors in various food supply chains (including those not going through a central market) to
reduce GHG emissions.
The study could be expanded to include actors in the chain not included in my study. For
example, during interviews I learnt that there were companies that pack and unpack transport
trucks at the Sydney Markets. Not all transporters or wholesalers use these services, but some
do. These companies would need to be involved in any system of monitoring produce flows
and therefore GHG emissions.
Simply having a larger number of participants from comparable greenhouse operations would
be worthwhile. It was disappointing that there was insufficient accurate data from Sydney
Basin tomato-growing operations. This is partly a consequence of the difficulties in recruiting

144
participants, and partly a result of incomplete data provided by those participants interviewed.
A future, larger, study could consider other recruiting methods to gain more participants.
It is possible that a two-stage engagement with participants involving a questionnaire prior to
interview could help. This could identify interviewees that might have the most complete
datasets, and prompt participants about the data that was necessary for the project. But this
cannot be assumed. The information that I provided to participants prior to interview did
inform them of the need for specific quantitative information, and whenever possible I
reinforced this when I spoke to them prior to interview.
It is possible that few tomato growers in the Sydney Basin are interested in participating in a
project such as this. Although not all growers would be known to the NSW DPI staff who
introduced me to growers, and those staff would have made decisions about which growers to
recommend, I consider it likely that growers interested in participating, who are innovative
and also good record-keepers, would use the resources of NSW DPI to their advantage and
therefore would likely be known to the staff there.
Finally, future studies will be able to incorporate and/or analyse newer methodologies being
developed, such as the GHG Protocol Initiative.

145
7 CONCLUSION
In contrast to what at least appears to be a smooth logistical flow that keeps the shop
shelves stocked with fresh tomatoes, the production-supply chain has elements of friction
and competition as businesses negotiate the daily weather and economic conditions of
selling a fresh commodity. Businesses throughout the supply chain aim to control as much
as possible the weather’s impact on their goods, as well as other business risks such as
breaks in energy supply.
This chain is unable to report how many tonnes of tomatoes go through it per year. Putting
in place a system to track actual GHG emissions with actual shipments of produce appears
an unlikely task. The results of this study, together with my experience collecting and
analysing the data, lead me to conclude that whole-of-food-chain LCA-type or even food
mile labelling would probably not be practical for fresh fruit and vegetables going through a
central market.
More specific conclusions from this study are grouped according to the aims set out in the
Introduction. In relation to Aim 1 (to pursue two different ways of tracing fresh tomato
journeys, one based on a cluster of quantitative GHG accounting methods and the other
based on a relational cultural geographical approach):
1. Combining two distinct epistemological approaches – LCA-type accounting and
relational following – enabled productive analysis of not only certain environmental
impacts of the tomato supply chain, but of more complex human dynamics around the
commodity itself. Greater understanding of these dynamics is essential to
understanding the potential for actors to change, such as by adopting less GHG-
intensive business practices.
In respect of Aim 2 (to analyse the fresh food supply chain for one commodity – fresh
tomatoes – sold in Sydney fruit shops, including to estimate GHG emissions where possible,
and to assess the availability of accurate information about a food’s GHG emissions):
2. Factors other than transport, particularly type of fuel used for stationary energy use,
can have a substantial impact on the GHG emissions of a business. The case of Farm D
suggests that stationary energy use, and waste, can involve greater emissions than
embodied emissions in high-tech capital infrastructure.

146
3. In individual cases, estimated transport fuel based on distance can be a significant
portion of embodied GHG emissions of a product. But the variety of inputs and energy
use, particularly at farms, can be more significant when comparing tomatoes within one
chain, or between two chains.
4. In this study, on-farm GHG emissions appear far greater than emissions from fuel used
for transport to market, per unit of tomatoes sold or carried. They also appear much
greater, per unit of tomatoes, than GHG emissions at wholesalers or retailers. On the
same basis, wholesalers appear to have fewer emissions than retailers.
5. A lack of readily available information about resource use from several participants in
this project indicates that considerable education in data collection would be required
if small businesses were to audit their GHG emissions. Alternatively, businesses would
need to engage professional energy/emission auditors to determine their emissions
and establish and check record-keeping systems.
In respect of Aim 3 (to examine the feasibility of collecting food chain GHG emission
information and communicating it to shoppers, when the purpose for such an effort is to
substantially reduce the community’s GHG emissions through consumer demand):
6. On its own, food miles is not a suitable indicator for comparing GHG emissions from
different chains of one product.
7. LCA-type carbon labelling would reveal more about GHG emissions than food miles
would. While this is possible for motivated companies and their individual supply
chains, methodologies are still being developed and the effort can be substantial.
Applicability of methods or developing standard averages for businesses across a sector
appears difficult. This is especially due to the variance of practices within businesses,
even those producing the same vegetable, let alone different vegetables. Farms
(particularly) change their practices too, for example in the percentage of the operation
being used to grow tomatoes. The variance at different businesses can result in
substantial differences in the GHG emissions associated with two versions of the final
product (in this case 1kg of tomatoes) sitting side-by-side in a fruit shop.

147
8. The bureaucratic effort that would be required to implement a carbon labelling system
– one that would account for GHG emissions from actual journeys of similar products
and allow consumers to compare tomatoes in a shop – appears impractically large,
complex and labour-intensive at present. The integrity of the labelling would be reliant
on a multitude of actors in the chain undertaking accurate and considerable data
measurement and labelling on a daily basis.
In relation to Aim 4 (based on contrasting quantitative accounting and qualitative
‘following’ methods: identify other ways the conventional fresh food supply chain could
become more GHG efficient; and examine trade-offs between climate change mitigation
and other environmental concerns, specifically water use and waste):
9. Costs and availability of lower GHG-emitting practices are assessed as the key factors
for potential change among higher emitting participants.
10. Leadership by individuals to drive long-term change is important, but cost efficiencies
are still likely to motivate greater change.
11. There does not appear to be great prospect for reducing GHG emissions in this chain via
cooperation between actors along the chain.
12. Increasing supply chain actors’ knowledge of climate change and the connection to
their business would be beneficial. Understanding not only business costs but the areas
of control that business owners focus on could help foster change. Despite the
temporal differences between weather (and its impacts on business) and climate
change impacts, participant knowledge about the former could be built on in efforts to
encourage change in this supply chain.
13. The results of this study suggest that further research into GHG efficiencies by level of
farm technology would be worthwhile.
14. This thesis confirms that it is still worth gaining better relational understandings of (or
‘following’) individual product supply chains, with a view to identifying areas or
activities of high emissions. These areas could be targeted specifically rather than
implementing and relying on carbon labelling to reduce GHG emissions from the supply
chain.

148
15. Tradeoffs between GHG emissions and water use or waste proved difficult to analyse,
not least because several participants did not have sufficient data about their water use
and waste quantities. Further research into the reasons for this lack of quantitative
knowledge about important parts of participants’ businesses could reveal ways to
better manage or reduce water use and waste.
As discussed in the literature review, food can be an everyday place to start thinking about
reducing GHG emissions from a consumer perspective (for example see Weber & Matthews
2008). Chapter 2 provided the context for looking at GHG emissions for one production-
supply chain.
Considerable work remains to examine individual fresh foods, their chains, inputs and GHG
emissions, particularly in an Australian context. While recognising that there are
organisations that do this type of research, and that knowledge and methodologies
continue to improve, it was difficult to locate and apply publicly available methods to
measure GHG emissions from the array of inputs to the greenhouse-grown fresh tomato
supply chain.
The barriers to implementing a GHG emission reporting regime throughout this supply
chain, and enforcing it to the extent that enough consumers trust it and act on it, seem
large. Accurate, up-to-date and reliable ‘food miles’ or any more informative LCA-type data
per kilogram of produce would be extremely difficult to obtain and enforce, given the many
emission factors involved at multiple levels of the supply chain, allocation issues and the
speed of flow of produce.
There is a reason why full or hybrid product LCAs are still uncommon – they are complex
and laborious. Accessible, up-to-date databases of all kinds of inputs are needed, as well as
the methodologies to determine embodied energy, GHG emissions and other
environmental impacts such as water use, waste and other forms of pollution. Work is
progressing in all of these areas. But any ongoing program of comparing products via
LCA/partial LCA requires commitment to updating and development of databases, both
with new products and with efficiencies in transport and the whole range of inputs. This is a
massive undertaking and would probably require some type of public organisation
resourced to collect, manage and make available the information.

149
A main reason that I considered fresh vegetables a priority for LCA-type assessment was the
necessity of such food for human nutrition, their widespread consumption, and seemingly
simple, unprocessed state. The tomato is almost a staple and is part of many cuisines and
cultures. However the complexities or non-standard nature of inputs and influences on the
horticultural system make methods difficult to standardise. It is possible that non-food
consumer items, or even processed foods that use more standardised ingredients, could be
easier to analyse for LCA and GHG emissions. If so, perhaps the energy-conscious consumer
in Australia should not worry too much about the emissions from their fresh fruit and
vegetables but focus on reducing GHG emissions from the remaining portion of their
shopping trolley.
Although empirical research on consumer choices was outside the scope of my project,
consumer actions must be assessed rather than presumed should a policy such as food
labelling be introduced. Authors such as Eden et al remind us that the ‘knowledge-fix’ is not
easy to implement and is not alone a guarantee of success (Eden et al. 2008, p1055).
Finally, even though I do not recommend a regime providing LCA information to
consumers, a program of LCA-type ‘following’ studies of fresh fruit and vegetable
production and supply chains would contribute to GHG emission-reduction in the food
supply chain. They can identify areas of the chain that can be made more efficient and
conversely find areas that have limiting factors which prevent further GHG emission
reduction. Such studies engage participating supply chain actors on the topic of GHG
reduction, and can encourage individual businesses to consider and introduce efficiencies.
If part of a broader strategy looking at the future of food in Australia, recommendations for
GHG emission-reduction measures could complement broader climate change adaptation
and other food security efforts.

150
BIBLIOGRAPHY
AAP 2008, ''Food miles' is a con, says Burke', Sydney Morning Herald, 5 March 2008, accessed 11/4/2008, http://news.smh.com.au/food-miles-is-a-con-says-burke/20080305-1x5w.html
ABS 2008, Survey of Motor Vehicle Use: 12 Months ended 31 October 2007, Cat No. 9208.0, Canberra, accessed 10 September 2009.
ABS 2009, Agricultural commodities Australia 2007-08, Cat. no. 7121.0, Canberra, accessed 24 June 2010, http://www.ausstats.abs.gov.au.ezproxy.uow.edu.au.
ABS 2010a, Agricultural commodities: Australia 2008-09, Cat. no. 7121.0, Canberra, accessed 23 June 2010, http://www.abs.gov.au.ezproxy.uow.edu.au/.
ABS 2010b, Value of agricultural commodities produced: Australia 2008-09, Cat. no. 7503.0, Canberra, accessed 23 June 2010, http://www.abs.gov.au.ezproxy.uow.edu.au/.
Alcorn, A 2003, Embodied energy and CO2 coefficients for NZ building materials, Centre for Building Performance Research, Victoria University of Wellington, Wellington, http://www.victoria.ac.nz/cbpr/documents/pdfs/ee-co2_report_2003.pdf.
American Express Australia Limited 2010, 'What if tomatoes could take you shopping in Paris?' The Sydney Morning Herald, Good Living supplement, 29 June 2010, p10.
Apelbaum Consulting Group Pty Ltd 2007, Australian Transport Facts 2007, Apelbaum Consulting Group Pty Ltd, Mulgrave.
Atchison, J, Head, L and Gates, A 2010, 'Wheat as food, wheat as industrial substance; comparative geographies of transformation and mobility', Geoforum, vol.41, pp236-246.
Australian Farm Institute 2009, FarmGAS calculator user guide, Australian Farm Institute, Sydney.
Australian Food and Grocery Council and IBM 2010, Talking about a smarter food chain: new opportunities; new conversations, IBM Australia and New Zealand and Australian Food and Grocery Council, accessed 16 June 2010, http://www.afgc.org.au/highlands-forum.html.
Australian Food and Grocery Council and Net Balance 2010, AFGC Green shopper summary report 2010, Net Balance, accessed 16 June 2010, http://www.afgc.org.au/highlands-forum.html.
Australian Government Department of Agriculture Fisheries and Forestry 2009, Australian Food Statistics 2008, Department of Agriculture, Fisheries and Forestry, Canberra, accessed 6 June 2010, www.daff.gov.au.
Australian Greenhouse Office 2002, Developing a strategic framework for greenhouse and agriculture: an issues paper, Australian Greenhouse Office, Canberra, accessed 9 January 2009, www.climatechange.gov.au.

151
Australian Processing Tomato Research Council 2010, Australian Processing Tomato Research Council, accessed 22 June 2010, http://www.aptrc.asn.au/
Badgery-Parker, J 2001, Greenhouse Horticulture - Beyond Australia: A report on a study tour of the greenhouse and soilless horticulture industries of England, The Netherlands, Spain and Canada, Winston Churchill Memorial Trust of Australia.
Barker, T, I. Bashmakov, A. Alharthi, M. Amann, L. Cifuentes, J. Drexhage, M. Duan, O. Edenhofer, B. Flannery, M. Grubb, M. Hoogwijk, F. I. Ibitoye, C. J. Jepma, W.A. Pizer and Yamaji, K 2007. 'Mitigation from a cross-sectoral perspective', in B. Metz, O.R. Davidson, P.R. Bosch, R. Dave and L. A. Meyer (eds.), Climate Change 2007: Mitigation: Contribution of Working Group III to the Fourth Assessment Report of the Intergovernmental Panel on Climate Change, Cambridge University Press, Cambridge.
Barndt, D 2002, Tangled routes: women, work, and globalization on the tomato trail, Rowman & Littlefield, Lanham.
Barndt, D 2008, Tangled routes: women, work, and globalization on the tomato trail, Rowman & Littlefield, Lanham.
Blake, M K, Mellor, J and Crane, L 2010, 'Buying local food: shopping practices, place, and consumption networks in defining food as "local".' Annals of the Association of American Geographers, vol.100, no.2, pp409-426.
Blay-Palmer, A and Donald, B 2006, 'A Tale of Three Tomatoes: The New Food Economy in Toronto, Canada', Economic Geography, vol.82, no.4, pp383.
Borrell, B 2009, 'Sustainable salads: which fruits, vegetables, and other crops have the smallest environmental footprints?' Slate, accessed 11 November 2009, www.slate.com.
Brown, M and Knopp, L 2008, 'Queering the map: the production tensions of colliding epistemologies', Annals of the Association of American Geographers, vol.98, no.1, pp40-58.
BSI 2008, PAS 2050:2008: Specification for the assessment of the lifecycle greenhouse gas emissions of goods and services, BSI.
Building Products Innovation Council 2008, The Industry Cooperative Innovation Programme – Buildings and the Environment Full Life Cycle Assessment, accessed 15 January 2010, http://www.bpic.asn.au/index.htm.
Burch, D and Lawrence, G (eds.) 2007, Supermarkets and agri-food supply chains: transformations in the production and consumption of foods, Edward Elgar, Cheltenham, UK.
Cameron, J 2008, Thinking and practising values: community enterprises in the food sector, Centre for Urban and Regional Studies, School of Environmental and Life Sciences University of Newcastle, Callaghan.
Campbell, H and Le Heron, R 2007. 'Supermarkets, producers and audit technologies: the constitutive micro-politics of food, legitimacy and governance', in D. Burch and G.

152
Lawrence (eds.), Supermarkets and agri-food supply chains: transformations in the production and consumption of foods, Edward Elgar, Cheltenham, UK, pp131-153.
Carbon Trust and Crown 2008, Guide to PAS 2050: How to assess the carbon footprint of goods and services, BSI, London.
Carlsson-Kanyama, A, Ekström, M P and Shanahan, H 2003, 'Food and life cycle energy inputs: consequences of diet and ways to increase efficiency', Ecological Economics, vol.44, no.2-3, pp293-307.
Carruthers, S 2003, 'Battle of the tomato brands', Practical hydroponics and greenhouse magazine, vol. 72, accessed 27/11/2009, www.hydroponics.com.au
Centre for Building Performance Research no date, Embodied Energy Coefficients - Alphabetical, Wellington, accessed 8 November 2009, http://www.victoria.ac.nz/cbpr/documents/pdfs/ee-coefficients.pdf.
Cloud, J 2007, 'Eating better than organic', Time, 2 March, accessed 25/9/2009, www.time.com
Commonwealth of Australia 2007-2010 (a), Department of Climate Change and Energy Efficiency, accessed 6 June 2010, http://www.climatechange.gov.au/
Commonwealth of Australia 2007-2010 (b), Reducing Australia's emissions, accessed 18 June 2010, http://www.climatechange.gov.au/government/reduce.aspx
Commonwealth of Australia 2007 - 2010 (c), CPRS latest updates, accessed 18 June 2010, http://www.climatechange.gov.au/government/initiatives/cprs/latest-news.aspx
Commonwealth of Australia 2008, Your Home Technical Manual, 4th edition, Department of the Environment, Water, Heritage and the Arts, accessed 18/12/2009, http://www.yourhome.gov.au/technical/fs52.html
Cook, I 2006, 'Geographies of food: following', Progress in Human Geography, vol.30, no.5, pp655-666.
Cook, I 2008, 'Geographies of food: mixing', Progress in Human Geography, vol.32, no.6, pp821-833.
Cook, I, Hobson, K, Hallett, L, Guthman, J, Murphy, A, Hulme, A, Sheller, M, Crewe, L, Nally, D, Roe, E, Mather, C, Kingsbury, P, Slocum, R, Imai, S, Duruz, J, Philo, C, Buller, H, Goodman, M, Hayes-Conroy, A, Hayes-Conroy, J, Tucker, L, Blake, M, Le Heron, R, Putnam, H, Maye, D and Henderson, H 2010, 'Geographies of food: 'Afters'' Progress in Human Geography 29 April, Digital Object Identifier: 10.1177/0309132510369035.
Cope, M 2005. 'Coding Qualitative Data', in I. Hay (ed.) Qualitative research methods in human geography, 2nd edition, Oxford University Press, South Melbourne, pp223-233.
Cox, A and Chicksand, D 2007. 'Are win-wins feasible? Power relationships in agri-food supply chains and markets', in D. Burch and G. Lawrence (eds.), Supermarkets and

153
agri-food supply chains: transformations in the production and consumption of foods, Edward Elgar, Cheltenham, UK, pp74-99.
Cranfield, J 2006, 'Guest Editor's Introduction', Canadian Journal of Agricultural Economics/Revue canadienne d'agroeconomie, vol.54, no.4, pp439-441.
Crooks, S 2009, Australian vegetable growing farms: an economic survey, 2007-08: ABARE report to Horticulture Australia Ltd, 09.15, Canberra, accessed 25 June 2010, http://www.abare.gov.au.
CSIRO and ALCAS n.d., AusLCI: The Australian Life Cycle Inventory Database Initiative, accessed 26 January 2010, http://www.auslci.com.au/
Cubby, B 2010, 'The true cost of our daily bread', The Sydney Morning Herald, News Review section, 19 June, p1.
Dalmeny, K 2008, Ethical hijack: why the terms 'local', 'seasonal', and 'farmers' market' should be defended from abuse by the food industry, Sustain: the alliance for better food and farming, http://www.sustainweb.org.
Darlin, D 2010, 'A balance between the factory and the local farm', The New York Times - online version, 13 February 2010, accessed 19/2/2010, http://www.nytimes.com/2010/02/14/business/14every.html
Department of Climate Change 2008, National Greenhouse Accounts (NGA) Factors: November 2008, Canberra.
Department of Climate Change 2009, National Greenhouse Accounts (NGA) Factors, Department of Climate Change, Canberra.
Department of Climate Change and Energy Efficiency 2010a, Australia wide impacts, accessed 25 July 2010, http://www.climatechange.gov.au/climate-change/impacts/national-impacts.aspx
Department of Climate Change and Energy Efficiency 2010b, Australian National Greenhouse Accounts: National Inventory Report 2008 Volume 1, Department of Climate Change and Energy Efficiency, Canberra.
Deurer, M, Clothier, B and Pickering, A 2008, How will carbon footprinting address the issues of reduction, mitigation, emissions trading and marketing., Horticulture Australia Limited, Sydney.
Deuter, P 2008a, Defining the Impacts of Climate Change on Horticulture in Australia: Report commissioned by the Garnaut Climate Change Review, Garnaut Climate Change Review, accessed 19 October 2008, http://www.garnautreview.org.au/CA25734E0016A131/pages/all-reports--resources-commissioned-reports.
Deuter, P 2008b, Who will use the vegetable carbon tool?, Horticulture Australia Ltd.
Deuter, P 2009, HortCarbonInfo, Queensland Department of Primary Industries and Fisheries, Horticulture Australia Limited, Gatton, accessed 23 July 2010,

154
http://www.horticulture.com.au/areas_of_Investment/Environment/Climate/climate_tools.asp.
Dunn, K 2005. 'Interviewing', in I. Hay (ed.) Qualitative Research Methods in Human Geography 2nd edition, Oxford University Press, South Melbourne, pp79-105.
DuPuis, E M and Goodman, D 2005, 'Should we go "home" to eat?: toward a reflexive politics of localism', Journal of Rural Studies, vol.21, no.3, pp359-371.
East, A 2008, What is a carbon footprint? An overview of definitions and methodologies., Horticulture Australia Limited, Sydney.
Eden, S, Bear, C and Walker, G 2008, 'Mucky carrots and other proxies: problematising the knowledge-fix for sustainable and ethical consumption', Geoforum, vol.39, no.2, pp1044-1057.
Edwards-Jones, G, Milà i Canals, L, Hounsome, N, Truninger, M, Koerber, G, Hounsome, B, Cross, P, York, E H, Hospido, A, Plassmann, K, Harris, I M, Edwards, R T, Day, G A S, Tomos, A D, Cowell, S J and Jones, D L 2008, 'Testing the assertion that 'local food is best': the challenges of an evidence-based approach', Trends in Food Science & Technology, vol.19, no.5, pp265-274.
Fagan, B 2008, 'Feeding Sydney: Understanding Food miles', Geodate, vol.21, no.2, pp1-4.
Fagan, R 2006, '‘Bananas in chains’? Reflections on global commodity chains and labour movement regulatory initiatives', Employment Relations Record, vol.6, no.2, pp31-46.
Farnel Capital n.d., Sea Rates.com, accessed 23/12/2009, http://www.searates.com/
Feagan, R 2007, 'The place of food: mapping out the "local" in local food systems', Progress in Human Geography, vol.31, no.1, pp23-42.
Fold, N and Pritchard, B 2005. 'Introduction', in N. Fold and B. Pritchard (eds.), Cross-continental food chains, Routledge, London, pp1-22.
Food miles 2008, television program, kontentreal.
Foran, B, Lenzen, M and Dey, C 2005, Balancing Act: A Triple Bottom Line Analysis of the Australian Economy, accessed 28 October 2009, http://www.csiro.au/resources/BalancingAct.html.
Forklifts Australia 2009, Forklift specifications: Caterpillar 1.8 tonne, accessed 11 December 2009, http://www.forkliftsaust.com.au/Text/1127808732875-0941/uploadedFiles/1227678953390-1886.pdf
Friedland, W H 2005. 'Commodity systems: forward to comparative analysis', in N. Fold and B. Pritchard (eds.), Cross-continental food chains, Routledge, London, pp25-38.
Gaballa, S, Abraham, A B, Barber, A and Taylor, G 2007, Food Miles in Australia: a Preliminary Study of Melbourne, Victoria, CERES Community Environment Park, East Brunswick, http://nla.gov.au/anbd.bib-an42201617.

155
Galvin, N 2008, 'Eat your greens', The Sydney Morning Herald, Good Living supplement, 16 December, p22.
Garnaut, R 2008, The Garnaut Climate Change Review: Final Report, Cambridge University Press, Melbourne, accessed 3 October 2008, http://www.garnautreview.org.au/domino/Web_Notes/Garnaut/garnautweb.nsf.
Gerbens-Leenes, P W, Moll, H C and Schoot Uiterkamp, A J M 2003, 'Design and development of a measuring method for environmental sustainability in food production systems', Ecological Economics, vol.46, no.2, pp231-248.
Goodman, D 2004, 'Rural Europe Redux? Reflections on Alternative Agro-Food Networks and Paradigm Change', Sociologia Ruralis, vol.44, no.1, pp3-16.
Grant, T and Beer, T 2008, 'Life cycle assessment of greenhouse gas emissions from irrigated maize and their significance in the value chain.' Australian Journal of Experimental Agriculture, vol.2008, no.48, pp375-381.
Harris, S and Narayanaswamy, V 2009, Life cycle assessment methodology for Australian rural industries, Rural Industries Research and Development Corporation, Barton.
Hartwick, E 1998, 'Geographies of consumption: a commodity-chain approach', Environment and Planning D: Society and Space, vol.16, no.4, pp423-437.
Harvey, M 2007. 'The rise of supermarkets and asymmetries of economic power', in D. Burch and G. Lawrence (eds.), Supermarkets and agri-food supply chains: transformations in the production and consumption of foods, Edward Elgar, Cheltenham, UK, pp51-73.
Harvey, M, Quilley, S and Beynon, H 2003, Exploring the Tomato: Transformations of Nature, Society and Economy, Edward Elgar, Northhampton.
Hess, D J 2008, 'Localism and the Environment', Sociology Compass, vol.2, no.2, pp625-638.
Hickman, M 2010, 'Supermarkets shun seasonal British food', The Independent, 3 June, accessed 6/6/2010, http://www.independent.co.uk/life-style/food-and-drink/news/supermarkets-shun-seasonal-british-food-1990557.html
Hogan, L and Thorpe, S 2009, Issues in food miles and carbon labelling, 09.18, ABARE, ABARE, Canberra, accessed 9 December 2009, www.abare.gov.au.
Holt, D and Watson, A 2008, 'Exploring the dilemma of local sourcing versus international development - the case of the flower industry', Business Strategy and the Environment, vol.17, no.5, pp318-329.
Horne, R 2009. 'Life cycle assessment: applications in the built environment', in R. Horne, T. Grant and K. Verghese (eds.), Life cycle assessment: principles, practice and prospects, CSIRO Publishing, Collingwood, pp75-92.
Horne, R, Grant, T and Verghese, K 2009, Life cycle assessment: principles, practice and prospects, CSIRO Publishing, Collingwood, Vic.

156
Horticulture Australia Limited 2007, Australian Vegetable Protected Cropping Industry Strategic Plan, H. A. Limited, accessed 27 February 2009, http://outernode.pir.sa.gov.au/__data/assets/pdf_file/0016/51226/Protected_Cropping_Strategic_Plan_final.pdf.
Horticulture Australia Limited 2009, Horticulture climate change action plan, Horticulture Australia Limited, Sydney, accessed 23 july 2010, http://www.horticulture.com.au/areas_of_Investment/Environment/Climate/climate_change_action_plan.asp.
Horticulture Australia Limited 2010a, Climate tools, accessed 23 July 2010, http://www.horticulture.com.au/areas_of_Investment/Environment/Climate/climate_tools.asp
Horticulture Australia Limited 2010b, Fresh tomato industry overview, accessed 22 June 2010, http://www.horticulture.com.au/industries/Fresh_Tomatoes/
Horticulture Australia Limited 2010c, Houston's Farm (vegetable) carbon footprint project, accessed 24 July 2010, http://www.horticulture.com.au/areas_of_Investment/Environment/Climate/houstons_farm_carbon_footprint.asp
Horticulture Australia Limited 2010d, Vegetable industry carbon footprint project, accessed 24 July 2010, http://www.horticulture.com.au/areas_of_Investment/Environment/Climate/vegetable_industry_carbon_footprint_project.asp
Howes, K M W and Rummery, R A (eds.) 1980, Energy and agriculture: the impact of changes in energy costs on the rural sector of the Australian economy: Proceedings of a Workshop organised by the CSIRO Division of Land Resources Management, Western Australian Department of Agriculture and Murdoch University, Bunbury, W.A. 14-18 October 1979, CSIRO, Perth.
Industries and Investment NSW - Primary Industries 2010a, Greenhouse horticulture, accessed 25 June 2010, http://www.dpi.nsw.gov.au/agriculture/horticulture/greenhouse
Industries and Investment NSW - Primary Industries 2010b, Greenhouse hydroponics, accessed 25 June 2010, http://www.dpi.nsw.gov.au/agriculture/horticulture/greenhouse/hydroponics
Intergovernmental Panel on Climate Change 2008, Climate Change 2007 Synthesis Report, Intergovernmental Panel on Climate Change, Geneva, accessed 18 June 2010, http://www.ipcc.ch.
Jackson, P, Ward, N and Russell, P 2006, 'Mobilising the commodity chain concept in the politics of food and farming', Journal of Rural Studies, vol.22, no.2, pp129-141.
Kingsolver, B, Hopp, S L and Kingsolver, C 2007, Animal, vegetable, miracle: a year of food life, Harper Collins Publishers, New York.
Kneafsey, M, Cox, R, Holloway, L, Dowler, E, Venn, L and Tuomainen, H 2008, Reconnecting consumers, producers, and food: exploring alternatives, Berg, Oxford.

157
Lang, T 2007, 'Book review: Worlds of Food: Place, Power and Provenance in the Food Chain, by Kevin Morgan, Terry Marsden and Jonathan Murdoch, 2006.' International Journal of Sociology of Food and Agriculture, vol.15, no.3, pp126-128.
Lang, T and Barling, D 2007. 'The environmental impact of supermarkets: mapping the terrain and the policy problems in the UK', in D. Burch and G. Lawrence (eds.), Supermarkets and agri-food supply chains: transformations in the production and consumption of foods, Edward Elgar, Cheltenham, UK, pp192-215.
Larsen, K, Ryan, C and Abraham, A 2008, Sustainable and Secure Food Systems for Victoria: What do we know? What do we need to know?, Victorian Eco-Innovation Lab, University of Melbourne, Melbourne.
Lawrence, G and Burch, D 2007. 'Understanding supermarkets and agri-food supply chains', in D. Burch and G. Lawrence (eds.), Supermarkets and agri-food supply chains: transformations in the production and consumption of foods, Edwards Elgar Publishing, Cheltenham, pp1-26.
Lawson, B 1996, Building materials energy and the environment: towards ecologically sustainable development, The Royal Australian Institute of Architects, Red Hill.
Leach, G 1976, Energy and Food Production, IPC Science and Technology Press for the International Institute for Environment and Development, Guildford, England.
Lisson, S 2008, What carbon footprinting tools are currently available?, Horticulture Australia Limited, Sydney.
Lockeretz, W 1980. 'Energy inputs for nitrogen, phosphorus, and potash fertilizers', in D. Pimentel (ed.) Handbook of energy utilization in agriculture, CRC Press, Inc., Boca Raton, pp23-24.
Lockie, S 2002, ''The invisible mouth': mobilizing 'the consumer' in food production-consumption networks', Sociologia Ruralis, vol.42, no.4, pp278-294.
Lockie, S and Kitto, S 2000, 'Beyond the Farm Gate: Production-Consumption Networks and Agri-Food Research', Sociologia Ruralis, vol.40, no.1, pp3-19.
Lockie, S, Lyons, K, Lawrence, G and Mummery, K 2002, 'Eating 'Green': Motivations behind organic food consumption in Australia', Sociologia Ruralis, vol.42, no.1, pp23-40.
Lockie, S, Lyons, K., Lawrence, G. and Halpin, D. 2006, Going Organic: Mobilizing Networks for Environmentally Responsible Food Production, CABI Publishing, Wallingford.
Lockie, S and Pritchard, B (eds.) 2001a, Consuming Foods, Sustaining Environments, Australian Academic Press, Brisbane.
Lockie, S and Pritchard, B 2001b. 'Linking production, consumption and environment in agri-food research', in S. Lockie and B. Pritchard (eds.), Consuming foods, sustaining environments, Australian Academic Press, Brisbane, pp1-15.
Lyons, K, Burch, D, Lawrence, G and Lockie, S 2004. 'Contrasting paths of corporate greening in Antipodean agriculture: organics and green production', in K. Jansen and S. Vellema (eds.), Agribusiness and society: Coroporate responses to

158
environmentalism, market opportunities and public regulation, Zed Books, London, pp91-113.
Malcolm, P and Fahd, R 2009, Ground Truthing of the Sydney Vegetable Industry in 2008., Industry and Investment NSW, Sydney.
Mansvelt, J and Berg, L D 2005. 'Writing qualitative geographies, constructing geographical knowledges', in I. Hay (ed.) Qualitative research methods in human geography, 2nd edition, Oxford University Press, South Melbourne, pp248-265.
Mila i Canals, L, Cowell, S J, Sim, S and Basson, L 2007, 'Comparing domestic versus imported apples: A focus on energy use', Environmental Science and Pollution Research, vol.14, no.5, pp338-344.
Mitchell, P 2010, 'Shopping for revolution', Griffith Review, vol. 27, accessed 11/7/2010, http://www.griffithreview.com
Morgan, K, Marsden, T and Murdoch, J 2006, Worlds of Food: Place, Power, and Provenance in the Food Chain, Oxford University Press, Oxford.
Murray, S 2007, Moveable feasts: the incredible journeys of the things we eat, Aurum, London.
Nicholson, J A H 1986. 'An economic consideration of the future for glasshouse tomatoes', in J. G. Atherton and J. Rudich (eds.), The tomato crop: a scientific basis for improvement, Chapman and Hall, London, pp625-645.
No author 2008, 'Food miles: why eat local?' CHOICE, accessed 18 July 2010, http://www.choice.com.au/.
NSW Department of Primary Industries 2005, Guidelines for the development of controlled environment horticulture: striving for consistency, consensus and community, NSW Department of Primary Industries, Narara, accessed 25 June 2010, http://www.dpi.nsw.gov.au/agriculture/horticulture/greenhouse/start/guidelines.
O'Halloran, N, Fisher, P and Rab, A 2008, Options for mitigating greenhouse gas emissions for the Australian vegetable industry, Horticulture Australia Ltd, Sydney.
Packaging Council of Australia 2007, 'Food miles - a position statement', Food Australia, vol.59, no.8, pp378.
Penny, G 2005. 'Cooperating to realign supply chains: representations, networks and tacit knowledge in New Zealand's Dairy and Sheep Meat Industries', in R. Le Heron and J. W. Harrington (eds.), New economic spaces: new economic geographies, Ashgate, Aldershot, pp95-107.
Pimentel, D 2006, Impacts of Organic Farming on the Efficiency of Energy Use in Agriculture, The Organic Center, accessed 29 October 2009, http://www.organic-center.org/science.pest.php?action=view&report_id=59.
Pimentel, D and Pimentel, M H 2008, Food, Energy, and Society [electronic resource], CRC Press, Boca Raton.

159
Planet Ark 2010, Carbon reduction label, accessed 22 July 2010, http://carbonreductionlabel.com.au/
Pollan, M 2006, The omnivore's dilemma: a natural history of four meals, Penguin Press, New York.
Pollan, M 2010, 'The food movement, rising', The New York Review of Books, 10 June, accessed 10/6/2010, http://www.nybooks.com/articles/archives/2010/jun/10/food-movement-rising/
Pretty, J N, Ball, A S, Lang, T and Morison, J I L 2005, 'Farm costs and food miles: an assessment of the full cost of the UK weekly food basket', Food Policy, vol.30, no.1, pp1-19.
Pritchard, B and Burch, D 2003, Agri-food globalization in perspective: international restructuring in the processing tomato industry, Ashgate Publishing Limited, Aldershot.
Rab, M, Fisher, P and O'Halloran, N 2008, Preliminary Estimation of the Carbon Footprint of the Australian Vegetable Industry: Discussion Paper 4 for the Vegetable Industry Carbon Footprint Scoping Study - Discussion Papers and Workshop, October 2008, VGO8107 paper 4, Horticulture Australia Limited, Sydney.
Roe, E 2006, 'Things becoming food and the embodied, material practices of an organic food consumer', Sociologia Ruralis, vol.43, no.2, pp104-121.
Saunders, C, Barber, A and Taylor, G 2006, Food Miles – Comparative Energy/Emissions Performance of New Zealand’s Agriculture Industry, Research Report 285, Agribusiness & Economics Research Unit Lincoln University, Lincoln.
Saunders, C and Hayes, P 2007, Air Freight Transport of Fresh Fruit and Vegetables, 299, Agribusiness and Economics Research Unit Lincoln University, Christchurch.
Scheibehenne, B, Miesler, L and Todd, P M 2007, 'Fast and frugal food choices, uncovering individual decision heuristics', Appetite, vol.49, pp578-589.
Senate Select Committee on Agriculture and Related Industries 2010, Food production in Australia: final report, Commonwealth of Australia, Canberra, http://www.aph.gov.au/senate/committee/agric_ctte/food_production/report/index.htm.
Sirieix, L, Grolleau, G and Schaer, B 2008, 'Do consumers care about food miles? An empirical analysis in France', International Journal of Consumer Studies, vol.32, no.5, pp508-515.
Slow food revolution 2004, film, Film Australia and CM Film Productions.
Smith, A and MacKinnon, J B 2007, Plenty: one man, one woman, and a raucous year of eating locally, Three Rivers Press, New York.
Smith, A, Stancu, C and McKenzie, S 2006, Food miles - practical steps for New Zealand exporters, Landcare Research, Auckland, accessed 18 July 2010,

160
http://www.landcareresearch.co.nz/research/sustainablesoc/business/trade/food_miles.asp.
Smith, A, Watkiss, P, Tweddle, G, McKinnon, P A, Browne, P M, Hunt, A, Treleven, C, Nash, P C and Cross, S 2005, The Validity of Food Miles as an Indicator of Sustainable Development: Final Report produced for DEFRA, ED50254, Department for Environment Food and Rural Affairs, accessed 14 May 2008, https://statistics.defra.gov.uk/esg/reports/foodmiles/final.pdf.
Spencer, S and Kneebone, M 2007, Foodmap: a comparative analysis of Australian food distribution channels, Australian Government Department of Agriculture Fisheries and Forestry, Canberra.
Stancich, R 2009, 'Which carbon label is best?' Climate change corp: climate change news for business, accessed 22 July 2010, http://www.climatechangecorp.com/content.asp?ContentID=6115.
Stancu, C and Smith, A 2006, Food miles - the international debate and implications for New Zealand exporters, Landcare Research, Auckland, accessed 18 July 2010, http://www.landcareresearch.co.nz/research/sustainablesoc/business/trade/food_miles.asp.
Sydney Food Fairness Alliance 2006, Understanding food miles, http://sydneyfoodfairness.org.au/discussion_papers/.
The Digger's Club 2010, 'It's so easy growing your own', Gardening Australia, November, p3.
The Future of Food 2004, film, Lily Films.
The Greenhouse Gas Protocol 2010, The Greenhouse Gas Protocol Initiative: Standards, accessed 21 July 2010, http://www.ghgprotocol.org/standards/product-and-supply-chain-standard
The University of Sydney 2010, Integrated Sustainability Analysis @ The University of Sydney accessed 22 July 2010, http://www.isa.org.usyd.edu.au/research/lca.shtml
The World Today 2010, radio program, Australian Broadcasting Corporation, 8 July.
Treloar, G J, Love, P E D and Holt, G D 2001, 'Using national input-output data for embodied energy analysis of individual residential buildings', Construction Management and Economics, vol.19, no.1, pp49-61.
United Nations Environment Management Group and United Nations Environment Programme/GRID Arendal 2008, CCCC: Kick the habit, a UN guide to climate neutrality, United Nations Environment Programme, accessed 5/2/2009, http://www.unep.org/publications/ebooks/kick-the-habit/Pdfs.aspx
University of Western Sydney 2010, Urban Research Centre: research themes, accessed 25 July 2010, http://www.uws.edu.au/urban_research_centre/urc/research_themes#feeding
Valentine, G 1999, 'A corporeal geography of consumption', Environment and Planning D: Society and Space, vol.17, no.3, pp329-351.

161
Van Brunschot, S L, Persley, D M, Geering, A D W, Campbell, P R and Thomas, J E 2010, 'Tomato yellow leaf curl virus in Australia: distribution, detection and discovery of naturally occurring defective DNA molecules', Australasian Plant Pathology, vol.39, no.5, pp412-423.
Van Hauwermeiren, A, Coene, H, Engelen, G and Mathijs, E 2007, 'Energy Lifecycle Inputs in Food Systems: A Comparison of Local versus Mainstream Cases', Journal of Environmental Policy & Planning, vol.9, no.1, pp31-51.
Verghese, K, Grant, T and Horne, R 2009. 'The development of life cycle methods and applications', in R. Horne, T. Grant and K. Verghese (eds.), Life cycle assessment: principles, practice and prospects, CSIRO Publishing, Collingwood, pp9-22.
Waitt, G 2005. 'Doing Discourse Analysis', in I. Hay (ed.) Qualitative Research Methods in Human Geography, 2nd edition, Oxford University Press, South Melbourne, pp163-191.
Watt, M 1980. 'Energy costs and conservation potential in the Australian food system', in K. M. W. Howes and R. A. Rummery (eds.), Energy and agriculture: the impact of changes in energy costs on the rural sector of the Australian economy: Proceedings of a Workshop organised by the CSIRO Division of Land Resources Management, Western Australian Department of Agriculture and Murdoch University, Bunbury, W.A. 14-18 October 1979, CSIRO, Perth, pp200-218.
Weber, C L and Matthews, H S 2008, 'Food-miles and the relative climate impacts of food choices in the United States', Environmental Science & Technology, vol.42, no.10, pp3508-3513.
Wells, C 2001, Total Energy Indicators of Agricultural Sustainability: Dairy Farming Case Study, New Zealand Ministry of Agriculture and Forestry, Wellington.
Whatmore, S 2002, Hybrid geographies: natures culture spaces, Sage, London.
Winter, M 2003a, 'Embeddedness, the new food economy and defensive localism', Journal of Rural Studies, vol.19, no.1, pp23-32.
Winter, M 2003b, 'Geographies of food: agro-food geographies - making reconnections', Progress in Human Geography, vol.27, no.4, pp505-513.
Winter, M 2004, 'Geographies of food: agro-food geographies - farming, food and politics', Progress in Human Geography, vol.28, no.5, pp664-670.
Winter, M 2005, 'Geographies of food: agro-food geographies - food, nature, farmers and agency', Progress in Human Geography, vol.29, no.5, pp609-617.


A1
APPENDIX A – PARTICIPANT INFORMATION SHEET

A2

A3

A4

B1
APPENDIX B – CONSENT FORM

B2

C1
APPENDIX C – INTERVIEW QUESTIONS

C2
Interview Questions
(prompts and follow up questions will depend on individual responses)
1. Tell me how you are connected to tomatoes, and what your interactions are with them.
(could you talk/walk me through your tomato operation? What percentage of your operation
is related to tomatoes?)
2. How do these vary at different times?
(day, seasons, time of year)
3. What other people are important connections in your interactions with tomatoes?
4. What are your technological connections with tomatoes?
(machinery, greenhouses, hydroponic systems, heating systems, storage, transport etc)
5. What are the important economic connections in your interactions with tomatoes?
(fuel prices, interest rates?)
6. What are the important environmental factors related to your tomato operation?
(water, weather, other plants, animals?)
7. How do the tomatoes get to you?
(how much do you think about where they come from?)
8. What is your understanding of where the tomatoes go once they leave you?
(how much do you think about where they are going?)
9. What is the most important thing that the consumer (e.g. person eating tomatoes) needs to
understand about what you do?

C3
Questions with a quantitative focus – energy use, water use and waste per tomato
yield/carriage/sales
The following questions relate (in whole or part) to elements of your operations that I would
like to explore more closely in order to calculate some figures. Because this project is using an
experimental methodology I won’t necessarily know all of the inputs that we need to look at
until we start to discuss them. In general though, the likely range of inputs is listed below as part
of each question. I am flexible about how you provide me with this information – verbally at the
time of interview, in writing or verbally afterwards, or via business records – inventories/
accounts etc.
10. What are the direct energy inputs to your tomato operations?
(e.g. electricity, gas, fuel)
11. What are the indirect energy inputs to your tomato operations?
(e.g. building materials, growing medium, chemicals, seeds, vehicles, packaging. We need
to be fairly specific here about what type of chemicals, vehicles etc and quantities used.)
12. How is water used in your tomato operations?
(amount of water, where it comes from, how waste water is managed)
13. What are the waste issues for your tomato operations?
(e.g. green waste, chemicals, general waste)
General views/more unstructured discussion
14. Do you have any thoughts or views about reducing climate change emissions/energy use
from your tomato operations, or the industry more broadly?
15. Do you have any thoughts or views about improving other environmental sustainability
issues in your tomato operations, or the industry more broadly?
(e.g. water, waste, ‘food miles’)

C4

D1
APPENDIX D – DATA RECORDING FORM

D2
THIS PAGE INTENTIONALLY BLANK
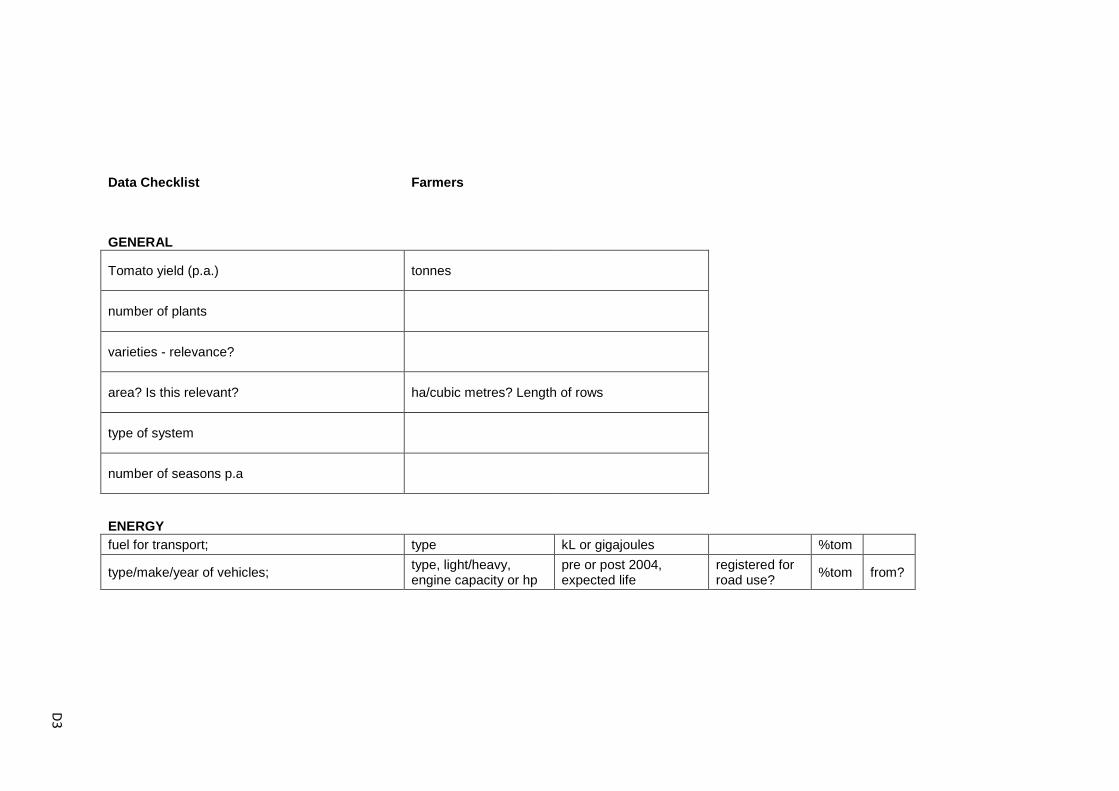
D3
Data Checklist Farmers
GENERAL
Tomato yield (p.a.) tonnes
number of plants
varieties - relevance?
area? Is this relevant? ha/cubic metres? Length of rows
type of system
number of seasons p.a
ENERGY fuel for transport; type kL or gigajoules %tom
type/make/year of vehicles; type, light/heavy, engine capacity or hp
pre or post 2004, expected life
registered for road use?
%tom from?

D4
solid fuel (incl. coal/wood) used for stationary energy such as heating;
type tonnes or gigajoules if coal - black or brown?
%tom from?
gaseous fuels for stationary energy such as heating - natural gas, LNG, town gas
type cubic metres or gigajoules
%tom from?
other liquid fuels and petroeleum products, eg LPG, greases, meths - stationary energy incl machinery, non-road reg
type kL or gigajoules %tom from?
other liquid fuels and petroeleum products, eg LPG, greases, meths - other uses
type kL or gigajoules %tom from?
electricity from the grid; kilowatt hrs or gigajoules
%tom from?
leakage rates from commercial airconditioning, chillers, refrigeration etc
type of HFC or sulphur hexaflouride gas
stock in equip - from nameplate or est based on opening stock, transfers in and out (new equip, replenish/disposals)
%tom from?
WASTE
waste to landfill type (garden/green; food; paper; etc
tonnes (pref) or volume %tom to?
other waste type (garden/green; food; paper; etc
tonnes (pref) or volume %tom to?

D5
WATER
water used type kL or cubic metres %tom from?
wastewater treated on site
kL or cubic metres into; sludge in tonnes removed; where does sludge go.
%tom
wastewater sent to municipal treatment works kL or cubic metres. %tom
INPUTS
seeds/plants quantity from?
growing medium type? tonnes from?
fertilisers type and contents? tonnes application rate?
%tom from?
nutrient stream type and contents? quantity %tom from?
chemicals/natural pesticides type and contents? quantity %tom from?
any other chemicals used to support the operation (eg for cleaning)
type and contents? quantity %tom from?
buildings type, age, materials size (floor area) use %tom from?

D6
- greenhouse(s) age, materials size
gutters
other infrastructure eg tanks, piping, cooling systems, cold storage equipment, computers.
type, age, materials %tom from?
piping - irrigation materials length replacement?
piping - drainage materials length
pumps capacity and no.
heating pipes materials length
nutrient control system size, materials
cooling system - fans etc, motors
boiler capacity age
generator capacity age
fences type, age, materials length %tom
machinery type, age, materials est. mass (kg) expected life %tom from?
- trolleys
string material, replacement? from?
packaging purpose, materials, quantity anything recycled?
%tom from?

D7
TPT, CHAIN - LOCAL/SYD
how tpt to Syd markets?
type of vehicle, proportion on truck, empty on way back? Frequency?
when did the farm begin operating? What was here before? (landuse change)
reason for location? Crop suitable/personal/market?
CLIMATE
specific climatic conditions that affect crop? Or increase need for cooling/heating/pests etc?
rainfall
Data Checklist Wholesaler
GENERAL Total sold (and what types)
% tomatoes
varieties - relevance?
how does this vary over course of year?
where do other products come from?
site area and building areas - incl storage?
Anything off-site?

D8
ENERGY fuel for transport; type kL or gigajoules %tom
type/make/year of vehicles; type, light/heavy, engine capacity or hp
pre or post 2004, expected life
registered for road use?
%tom from?
solid fuel (incl. coal/wood) used for stationary energy such as heating;
type tonnes or gigajoules if coal - black or brown?
%tom from?
gaseous fuels for stationary energy such as heating - natural gas, LNG, town gas
type cubic metres or gigajoules
%tom from?
other liquid fuels and petroeleum products, eg LPG, greases, meths - stationary energy incl machinery, non-road reg
type kL or gigajoules %tom from?
other liquid fuels and petroeleum products, eg LPG, greases, meths - other uses
type kL or gigajoules %tom from?
electricity from the grid; kilowatt hrs or gigajoules
%tom from?
leakage rates from commercial airconditioning, chillers, refrigeration etc
type of HFC or sulphur hexaflouride gas
stock in equip - from nameplate or est based on opening stock, transfers in and out (new equip, replenish/disposals)
%tom from?
WASTE
waste to landfill type (garden/green; food; paper; etc
tonnes (pref) or volume %tom to?

D9
other waste type (garden/green; food; paper; etc
tonnes (pref) or volume %tom to?
WATER
water used type kL or cubic metres %tom from?
INPUTS
chemicals/natural pesticides type and contents? quantity %tom from?
any other chemicals used to support the operation (eg for cleaning)
type and contents? quantity %tom from?
buildings type, age, materials size (floor area) use %tom from?
other infrastructure eg tanks, piping, cooling systems, cold storage equipment, computers.
type, age, materials %tom from?
pumps capacity and no.
heating pipes materials length
cooling system - fans etc, motors
boiler capacity age
generator capacity age
fences type, age, materials length %tom
machinery type, age, materials est. mass (kg) expected life %tom from?
- trolleys
- forklifts
packaging purpose, materials, quantity anything recycled?
%tom from?

D10
Data Checklist - retailer
GENERAL Total sold (and what types)
% tomatoes
varieties - relevance?
how does this vary over course of year?
where do other products come from?
site area and building areas - incl storage?
Anything off-site?
ENERGY fuel for transport; type kL or gigajoules %tom
type/make/year of vehicles; type, light/heavy, engine capacity or hp
pre or post 2004, expected life
registered for road use?
%tom from?
solid fuel (incl. coal/wood) used for stationary energy such as heating;
type tonnes or gigajoules if coal - black or brown?
%tom from?
gaseous fuels for stationary energy such as heating - natural gas, LNG, town gas
type cubic metres or gigajoules
%tom from?
other liquid fuels and petroeleum products, eg LPG, greases, meths - stationary energy incl machinery, non-road reg
type kL or gigajoules %tom from?
other liquid fuels and petroeleum products, eg LPG, greases, meths - other uses
type kL or gigajoules %tom from?
electricity from the grid; kilowatt hrs or gigajoules
%tom from?

D11
leakage rates from commercial airconditioning, chillers, refrigeration etc
type of HFC or sulphur hexaflouride gas
stock in equip - from nameplate or est based on opening stock, transfers in and out (new equip, replenish/disposals)
%tom from?
WASTE
waste to landfill type (garden/green; food; paper; etc
tonnes (pref) or volume %tom to?
other waste type (garden/green; food; paper; etc
tonnes (pref) or volume %tom to?
WATER
water used type kL or cubic metres %tom from?
waste water
INPUTS
chemicals/natural pesticides type and contents? quantity %tom from?
any other chemicals used to support the operation (eg for cleaning)
type and contents? quantity %tom from?
buildings type, age, materials size (floor area) use %tom from?
other infrastructure eg tanks, piping, cooling systems, cold storage equipment, computers.
type, age, materials %tom from?
pumps capacity and no.
heating pipes materials length
cooling system - fans etc, motors

D12
boiler capacity age
generator capacity age
fences type, age, materials length %tom
machinery type, age, materials est. mass (kg) expected life %tom from?
- trolleys
- forklifts
packaging purpose, materials, quantity anything recycled?
%tom from?

D13
Data Checklist Transport and logistics
GENERAL Tomato carriage (per year) tonnes
as % of carriage, or sales?
varieties - relevance?
ENERGY fuel for transport; type kL or gigajoules %tom
type/make/year of vehicles; refrigerated? type, light/heavy, engine capacity or hp
pre or post 2004, expected life
registered for road use?
%tom from?
solid fuel (incl. coal/wood) used for stationary energy such as heating;
type tonnes or gigajoules if coal - black or brown?
%tom from?
gaseous fuels for stationary energy such as heating - natural gas, LNG, town gas
type cubic metres or gigajoules
%tom from?
other liquid fuels and petroeleum products, eg LPG, greases, meths - stationary energy incl machinery, non-road reg
type kL or gigajoules %tom from?
other liquid fuels and petroeleum products, eg LPG, greases, meths - other uses
type kL or gigajoules %tom from?
electricity from the grid; kilowatt hrs or gigajoules
%tom from?

D14
leakage rates from commercial airconditioning, chillers, refrigeration etc
type of HFC or sulphur hexaflouride gas
stock in equip - from nameplate or est based on opening stock, transfers in and out (new equip, replenish/disposals)
%tom from?
WASTE
waste to landfill type (garden/green; food; paper; etc
tonnes (pref) or volume %tom to?
other waste type (garden/green; food; paper; etc
tonnes (pref) or volume %tom to?
WATER
water used type kL or cubic metres %tom from?
wastewater treated on site
kL or cubic metres into; sludge in tonnes removed; where does sludge go.
%tom
wastewater sent to municipal treatment works kL or cubic metres. %tom
INPUTS
chemicals/natural pesticides type and contents? quantity %tom from?
any other chemicals used to support the operation (eg for cleaning)
type and contents? quantity %tom from?
buildings type, age, materials size (floor area) use %tom from?

D15
other infrastructure eg tanks, piping, cooling systems, cold storage equipment, computers.
type, age, materials %tom from?
pumps capacity and no.
heating pipes materials length
cooling system - fans etc, motors
boiler capacity age
generator capacity age
fences type, age, materials length %tom
machinery type, age, materials est. mass (kg) expected life %tom from?
- trolleys
forklifts
string material, replacement? from?
packaging purpose, materials, quantity anything recycled?
%tom from?