2011 2012 university college program review and assessment ... · 2011 – 2012 university college...
TRANSCRIPT

2011-2012 University College PRAC Report Page 1
2011 – 2012 University College Program Review and Assessment Committee
(PRAC) Report

2011-2012 University College PRAC Report Page 2
Context and Assessment Methods
University College at IUPUI has a comprehensive range of programs, services, and polices designed to enhance student learning, academic
achievement, and persistence. The focus on continuously improving student academic achievement and persistence has made a strong commitment
to assessment and evaluation an integral aspect of the UC strategic. Assessing programs designed to enhance student educational outcomes during
the first-year of college requires careful conceptualization of the processes and relationships involved before choosing measures and evaluation
designs. As such, the UC assessment strategy includes a three-phase approach to assessment, including needs assessment, process assessment and
outcome assessment. In addition, we employ mix-method approaches that involve a combination of qualitative and quantitative methods as well as
indirect and direct measures of students learning. Please see figure below.

2011-2012 University College PRAC Report Page 3
Needs Assessment Highlights
Over the past decade we have administered two Entering Student Surveys to collect information on students’ needs. Due to concerns with these
instruments (lack of predictive validity and unfavorable testing conditions) UC, IMIR, Admissions, and Student Life representatives created an
alternative survey. Another impetus for a newly designed Entering Student Survey was the plans to develop a new survey for pre-enrolled students
that would be used to predict which students might be most apt to benefit from particular types of interventions aimed at promoting persistence
and success (associated with the IU FLAGS project). We began piloting a new instrument this past summer during New Student Orientation
sessions. The new survey has been designed to be that we far more appropriate for the diverse array of beginner and transfer students that attend
IUPUI. The survey will help us to assess a broader array of motivational, cognitive, and behavioral factors that are predictive of student learning
and success:
Sense of Belonging
Academic Hope
Academic Self-Efficacy
Behaviors in High School or Previous College
Self-Awareness
Self-Efficiency/Perseverance
Expected Time Commitments/Campus Engagement/RISE Activities
Goal Setting
Commitment to IUPUI
College Expectations
Reasons for Choosing IUPUI
Risk Factors for IUPUI Students – Associated with Low Levels of Academic Achievement and Persistence
• Gender (Males) • Being a First-Generation college student • Received a Pell Grant (proxy for low Socioeconomic Status - SES) • Low levels of academic preparation (High school GPA is a strong predictor) • Lack of rigor and intensity of High School Curriculum • Living off-campus • Institutional commitment (Intent to Transfer) • Students’ Estimates of the Hours they Expected to Devote to Non-Academic Activities (Work, Spending Time with Family, Volunteering,
Socializing) • Reporting that she/he was not careful in completing high school assignments and did not complete the assignments on time.
2011-2012 University College PRAC Report Page 4
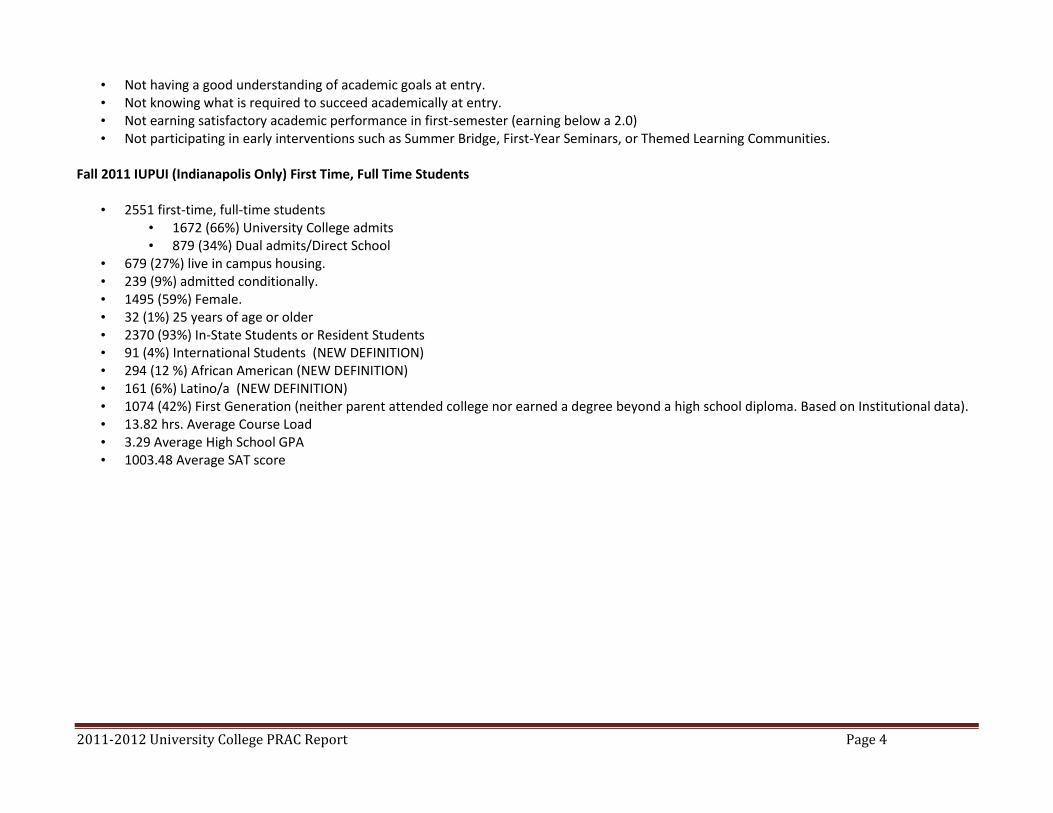
• Not having a good understanding of academic goals at entry. • Not knowing what is required to succeed academically at entry. • Not earning satisfactory academic performance in first-semester (earning below a 2.0) • Not participating in early interventions such as Summer Bridge, First-Year Seminars, or Themed Learning Communities.
Fall 2011 IUPUI (Indianapolis Only) First Time, Full Time Students
• 2551 first-time, full-time students
• 1672 (66%) University College admits • 879 (34%) Dual admits/Direct School
• 679 (27%) live in campus housing. • 239 (9%) admitted conditionally. • 1495 (59%) Female. • 32 (1%) 25 years of age or older • 2370 (93%) In-State Students or Resident Students • 91 (4%) International Students (NEW DEFINITION) • 294 (12 %) African American (NEW DEFINITION) • 161 (6%) Latino/a (NEW DEFINITION) • 1074 (42%) First Generation (neither parent attended college nor earned a degree beyond a high school diploma. Based on Institutional data). • 13.82 hrs. Average Course Load • 3.29 Average High School GPA • 1003.48 Average SAT score

2011-2012 University College PRAC Report Page 5
Process Assessment Highlights Shown in Appendix A are tables that display the characteristics of University College students. During the 2011-2012 academic year, University
College served over 6000 students. Many UC students have characteristics that place them at risk for academic failure such as having low-to-moderate levels of academic preparation (based on H.S. Grades and SAT scores), being low income and receiving financial aid, being first-generation college students, and being exploratory. As such, University College provides academic support services and courses that have been designed to serve the transitional needs of all entering students. For example, due to the positive assessment results indicating that seminar students have higher retention rates and academic performance levels compared to non-participants, the program has expanded substantially over the years. Approximately 91% of first-year students now participate in a First-Year Seminar. The tables below display the growth of programs and participation rates. Number and Percentage of First-Time Students Enrolled in Greater than or Equal to 7 Credit Hours Who Participated in First-Year Seminars.
Fall Entry Year
1999 2000 2001 2002 2003 2004 2005 2006 2007 Fall
2008 2009 2010 2011
Number 2027 1881 1626 1495 1574 1835 1927 2110 2229 2401 2394 2213 2425
Percentage 74% 73% 70% 68% 69% 81% 81% 86% 85% 92% 91% 92% 90%
Number and Percentage of First-Time, Full-Time Beginners at IUPUI (Indianapolis Only) who Participated in the Two-Week Summer Bridge program.
Fall Entry Year
2001 2002 2003 2004 2005 2006 2007 Fall
2008 2009 2010 2011 Number 16 76 182 161 172 196 335 411 389 421 455 Percentage 1% 3% 8% 8% 8% 9% 14% 16% 15% 18% 18%
Note: Bridge participants are defined as students who attended a 2-week bridge program in the summer preceding their first fall semester.

2011-2012 University College PRAC Report Page 6
Themed Learning Community Program Growth 2003 to 2011
TLC Student Groups/Underrepresented Minority Participation and Academic Success Outcomes
Analyses were also conducted to examine the effects of 2010 and 2011 TLC participation on academic success outcomes for various subgroups of
students. Results suggested that experiencing the TLC environment during the first semester seemed to benefit students from diverse backgrounds
and students from underrepresented minority groups. For example, African American TLC participants had a one-year retention rate of 77% compared
to 65% for African American nonparticipants. Additionally, first-generation college students that participated in a TLC had an 82% one-year retention
rate compared to a 67% for nonparticipating first-generation students.

2011-2012 University College PRAC Report Page 7
Fall 2010 Themed Learning Community Student Groups/Underrepresented Minority Participation and Academic Success Outcomes
TLC PARTICIPANTS NON-PARTICIPANTS
N First-Year GPA
% First-Year GPA Below 2.0.
One-Year Retention Rate
First-Year GPA
% First-Year GPA Below 2.0.
One-Year Retention Rate
Female 481 2.82 17% 78% 2.67 22% 69%
First-Generation 303 2.69 20% 82% 2.47 30% 67%
Pell Grant 316 2.59 23% 77% 2.40 32% 66%
African American 82 2.34 30% 77% 2.11 40% 65%
Asian American 14 3.19 14% 100% 3.06 8% 91%
Latino/a 35 2.76 17% 80% 2.51 29% 69%
25 or Older 7 3.30 14% 86% 2.78 29% 55%
Conditional Admit 42 2.09 36% 67% 1.92 48% 56%
Note 1: Missing cases were excluded.
Note 2: Bolded items are statistically significantly and practically different based on ANOVA results or chi-square test results (p <. 001).

2011-2012 University College PRAC Report Page 8
Fall 2011 TLC Student Groups/Underrepresented Minority Participation and Academic Success Outcomes
TLC PARTICIPANTS NONPARTICIPANTS
N Fall GPA % Fall GPA
Below 2.0.
Fall-Spring
Retention
Rate
Fall GPA % Fall GPA
Below 2.0.
Fall-Spring
Retention
Rate
Female 473 2.78 18% 93% 2.98 18% 89%
First-Generation 355 2.87 17% 93% 2.61 23% 85%
Pell Grant 340 2.74 20% 93% 2.51 26% 86%
African American 107 2.51 22% 92% 2.14 35% 83%
Asian American 10 2.81 10% 100% 2.93 15% 97%
Latino/a 46 3.11 9% 98% 2.57 26% 89%
25 or Older 3 3.67 0% 100% 2.60 30% 83%
Conditional Admit 99 2.16 40% 86% 2.12 39% 83%
Note 1: Missing cases were excluded.
Note 2: Bolded items are statistically significantly and practically different based on ANOVA results or chi-square test results (p <. 001).

2011-2012 University College PRAC Report Page 9
Academic Achievement and Progress First-Time Full Time Students
• The 2011 first-time, full-time one-year retention rate (fall-to-fall semester) was 74% (Indianapolis only). Students are retained if they enroll at any IU campus for the semester or complete a degree or certificate after the beginning of the base semester and before the start of the “retained to” semester. This retention rate in 2010 was 73%.
• The Fall-to-Spring IUPUI retention rate (returned to IUPUI) was 88%. The rate was the same in 2010 and 2009 (88%). The rate was 87% for the Fall 2008 cohort.
• The average 2011 Fall semester GPA was 2.75 compared to 2.81 in 2010. • The average cumulative first-year GPA was 2.61 compared to 2.67 in 2010. • The average fall DFW rate was 19.09 (compared to 18 12% in 2010, 17.29% in 2009 and 20.97% for the Fall 2008 cohort).
Indianapolis Only FTFT Cohort Retention and Graduation Rate (Bachelor’s, Associate, and Certificate)
62% 65% 67% 67% 66% 64%
67% 70%
74% 75% 73% 74%
12% 12% 15% 16%
28% 32% 33% 35% 35% 33%
0%
10%
20%
30%
40%
50%
60%
70%
80%
2000 2001 2002 2003 2004 2005 2006 2007 2008 2009 2010 2011
1-year retention
4-year graduation
6-year graduation

2011-2012 University College PRAC Report Page 10
Changes Made and Planned Based On Student Retention and Progress Assessment
The programs, practices, and policies in University College are designed to ensure students make progress toward their degrees and ultimately earn
degrees. Since 2000 a number of the initiatives and interventions have been implemented to improve student academic success and engagement such
as the following:
The creation of the Council for Retention and Graduation (CRG)
Organization of the curriculum and co-curriculum and other learning opportunities to get students to participate in high impact practices such
as first-year seminars, themed learning communities, service learning, and early intervention programs (experiences that have been linked to
student learning and academic success)
The expansion of Summer Bridge
The introduction of the Summer Success Academy for conditionally admitted students.
The development and implementation of the Personal Development Plan (PDP) process.
Since 2005 there has been nearly a 10% increase in one- retention rates. However, the rate has plateaued over the past two years. Listed below are a
number of data-driven plans to improve student success:
Construction of a new Entering Student Survey (partnership w/ IMIR and Student Life) to support predictive analytics related to
retention/student success [goal: serve as an institutional leader in designing an instrument that is reliable/valid for FTFT, Transfer, P/T, and
returning adult students] – piloting in Summer 2012.
Creating a Transfer Student Support Center [parallel AIP focus – distribution of transfer credit within majors]
Implementation of a required 2-day New Student Orientation (pilot: Summer, 2013; expanded pilot: Summer, 2014; all FTFT students: Summer,
2015)
Expanding scope of students’ on-campus employment, externships, and internships
Blended Learning Modules for the First-year Seminar (supported by Curriculum Enhancement Grant)
Reconsidering definitions associated with University College faculty; faculty orientation and development
Expand scope of what enhances student retention/success (cohort support programs, summer bridge, themed learning communities) beyond
the first semester and into semesters 2-4
University College Honors Program (target: entering transfer students and students that demonstrate success in first year)
Future emphases on access programs in University College (Crispus Attucks Medical Magnet High School partnership; SPAN program, Project
Lead the Way, Upward Bound)
Future plans for Summer Success Academy given shifts in admission standards

2011-2012 University College PRAC Report Page 11
University College Course Approved Student Learning Outcomes
Learning goals for beginning levels of the PULs in all University College courses (e.g., First-Seminars, Mentoring Courses, and Learning Communities)
with faculty involvement have been specified. University College First-Year Seminar course goals, templates, and corresponding syllabi contain
statements of expected learning outcomes for students that incorporate the PULs.
First-Year Seminars (FYS-U110)
Students who complete a University College First-Year Seminar should:
1. Attain beginning levels of competency in all Principles of Undergraduate Learning (PULs) areas: Core Communication; Critical Thinking; Integration and Application of
Knowledge; Intellectual Depth, Breadth, and Adaptiveness; Understanding Society and Culture, and Values and Ethics:
Demonstrate effective writing and speaking (Core Communication).
Make effective use of information resources and technology (Core Communication).
Create knowledge, procedures, processes, or products to discern bias, challenge assumptions, identify consequences, arrive at reasoned conclusions, generate and
explore new questions, solve challenging and complex problems, and make informed decisions (Critical Thinking).
Be critical thinkers who demonstrate intellectual curiosity, rational inquiry, problem solving skills, and creativity in framing problems (Critical Thinking).
Evaluate the quality of information (Critical Thinking).
Apply their skills learned in first-year seminars (e.g., career exploration, time management, and evaluation of information) to other areas or problems (Integration
and Application of Knowledge).
Compare and contrast approaches to knowledge in different disciplines and fields of study (Intellectual Depth, Breadth, and Adaptiveness).
Describe cultural traditions, appreciate the diversity of the human experience, and make sound decisions with respect to individual conduct and citizenship
(Understanding Society and Culture).
Define and develop an appreciation of social and cultural diversity (Understanding Society and Culture).
Describe ethical principles within diverse cultural, social, environmental, and personal settings (Values and Ethics).
Describe University rules regarding academic honesty (Values and Ethics).
Describe University rules regarding plagiarism (Values and Ethics).
2. Complete a Personal Development Plan (PDP).
Self-Assessment: Students will identify success-related competencies that are natural strengths as well as other skills that they need to build.
Exploration: Students will research and develop a realistic, informed, and detailed vision of related academic and career goals. Students will describe academic majors
and career options.
Evaluation: Students will analyze their academic progress over the semester in terms of academic and career success strategies.
Goal Setting: Students will connect a larger sense of personal values and life purpose to the motivation and inspiration behind their academic and career goals.
Planning: Students will locate programs, information, people, and opportunities to support and reality test their goals. They identify specific short term steps to reach
their long term goals.

2011-2012 University College PRAC Report Page 12
Career Connections (U210)
Students who complete a University College Career Connections Course should:
Identify their career-related interests, personality preferences, values, and skills based on self-assessment exercises.
Identify several academic and career options that are compatible with their self-assessment information.
Locate and utilize information resources and people to research and explore academic majors and career paths.
Evaluate the suitability of several major and career options based on an integration of self-assessment and researched major/career information.
Develop and implement a specific plan of action for subsequent semesters to assist them in confirming their tentative choice(s) of majors/careers.
Mentor Development Courses
Outdoor Leadership Experience (U 200):
Students who complete a University College Outdoor Leadership course should:
Describe their leadership development process and goals for the future.
Apply relational leadership skills in leadership experiences.
Identify factors and behaviors that influence group development.
Demonstrate effective communication skills for working in group.
Analyze through writing self reflections your strengths and limitations of group role.
Apply experiential learning skills to practical and everyday references
Introduction to Mentoring Techniques (U 201):
Students who complete a University College Introduction to Mentoring Techniques course should:
Explain your role, responsibility, and contribution to the campus community.
Explain understand traits, functions, and activities associated with mentoring.
Demonstrate how to access campus resources to support student success at IUPUI.
Apply active listening skills and communication principles when working with students in their mentoring program.
Identify characteristics of diversity within the semester about our student community to promote an inclusive learning experience.
Recognize two positive tactics to maintain life balance in order to stay motivated for yourself and your students.
Active and Collaborative Learning in Groups (U 202):
Students who complete a University College an Active and Collaborative Learning in Groups course should:
Summarize the collaborative learning process and its role in the mentoring experience.
Implement developmental and holistic approaches for student learning and academic success.
Apply positive relationship and communication skills to individual and group mentoring experiences.
Differentiate the stages of group and individual mentoring techniques and strategies.
Implement collaborative and assessment guided approaches to mentoring activities.

2011-2012 University College PRAC Report Page 13
Leadership and Transition (U 203):
Students who complete a University College a Leadership and Transition course should:
Identify relational leadership principles through readings, class discussions, and self-reflection.
Describe the role of relational leadership.
Compare and contrast relational leadership with other leadership theories.
Apply relational leadership principles by characterizing the unique traits of themselves and their group members.
Summarize the values, qualities, and skills necessary to being a relational leader through small group discussions.
Analysis through writing your self-awareness of your mentoring skills, competencies, and leadership philosophy.
Construct a leadership action plan by synthesizing the information gained from class readings and inventories completed.
Independent Study (U 204)
Students who complete a University College an Independent Study course should:
Generate a researchable question to address a mentoring issue.
Conduct a competent literature search for empirically based articles.
Apply quantitative and/or qualitative research methods to a question or problem.
Interpret results of data collected.
Synthesize the data and implications of your results as it applies to your question/problem.
Demonstrate the ability to clearly communicate and illustrate, both orally and in writing, the findings of original research on mentoring.
Summarize your individual mentoring experience within the larger mentoring context.
Direct Assessment Results Highlights
UC faculty members and instructional teams measured direct student learning outcomes by employing a course- embedded, authentic assessment
approach. Faculty members engaged in a curriculum mapping process to identify which PULs are a major or moderate emphasis in UC courses. In
some cases, we adapted AACU Value rubrics (http://www.aacu.org/value/metarubrics.cfm.) as appropriate to assess students’ learning outcomes.
Faculty members also developed local rubrics to assess the assignments, written reflections, based on the PULs.
The tables listed below are from a report entitled “IUPUI Faculty Ratings of Student Performance on Principles of Undergraduate Learning Report for
University College Spring 2010, Fall 2010, and Spring 2011, Fall 2011, and Spring 2012 prepared by IMIR.

2011-2012 University College PRAC Report Page 14
Faculty Ratings of University College Student Performance on PULs with Major Emphasis (100-Level & Lower)
PUL – Major Emphasis Mean 2
Not
Effective
Somewhat
Effective
Effective
Very
Effective
Total
1A. Written, Oral, & Visual Communication Skills 1,549 202 184 483 680 1,549
3.06 13.0% 11.9% 31.2% 43.9% 100.0%
2. Critical Thinking 24 0 2 8 14 24
3.50 0.0% 8.3% 33.3% 58.3% 100.0%
3. Integration and Application of Knowledge 7 0 0 0 7 7
4.00 0.0% 0.0% 0.0% 100.0% 100.0%
Total 1
1,580 202 186 491 701 1,580
3.07 12.8% 11.8% 31.1% 44.4% 100.0% 1
Combined number of student ratings in all 100-level courses sampled in Spring 2010, Fall 2010, Spring 2011, Fall 2011, and Spring 2012. A student may be evaluated more than once if he or she is taking more than one 100-level course.
2 Scale: 1 = “Not Effective”, 2 = “Somewhat Effective”, 3 = “Effective”, 4 = “Very Effective”
Faculty Ratings of University College Student Performance on PULs with Moderate Emphasis (100-Level & Lower)
PUL – Moderate Emphasis Mean 2
Not
Effective
Somewhat
Effective
Effective
Very
Effective
Total
2. Critical Thinking 613 88 98 147 280 613
3.01 14.4% 16.0% 24.0% 45.7% 100.0%
Total 1
613 88 98 147 280 613
3.01 14.4% 16.0% 24.0% 45.7% 100.0% 1
Combined number of student ratings in all 100-level courses sampled in Spring 2010, Fall 2010, Spring 2011, Fall 2011, and Spring 2012. A student may be evaluated more than once if he or she is taking more than one 100-level course.
2 Scale: 1 = “Not Effective”, 2 = “Somewhat Effective”, 3 = “Effective”, 4 = “Very Effective”
3Critical Thinking was added as a Moderate Emphasis in First-Year Seminars Courses in Fall 2011.

2011-2012 University College PRAC Report Page 15
Faculty Ratings of University College Student Performance on PULs with Major Emphasis (200-Level)
PUL – Major Emphasis Mean 2
Not
Effective
Somewhat
Effective
Effective
Very
Effective
Total
3. Integration and Application of Knowledge 934 24 40 172 698 934
3.65 2.6% 4.3% 18.4% 74.7% 100.0%
Total 1
934 24 40 172 698 934
3.65 2.6% 4.3% 18.4% 74.7% 100.0% 1
Combined number of student ratings in all 200-level courses sampled in Spring 2010, Fall 2010, Spring 2011, Fall 2011, and Spring 2012. A student may be evaluated more than once if he or she is taking more than one 200-level course.
2 Scale: 1 = “Not Effective”, 2 = “Somewhat Effective”, 3 = “Effective”, 4 = “Very Effective”
Faculty Ratings of University College Student Performance on PULs with Moderate Emphasis (200-Level)
PUL – Moderate Emphasis Mean 2
Not
Effective
Somewhat
Effective
Effective
Very
Effective
Total
1A. Written, Oral, & Visual Communication Skills 74 19 7 14 34 74
2.85 25.7% 9.5% 18.9% 45.9% 100.0%
5. Understanding Society and Culture 860 15 11 130 704 860
3.77 1.7% 1.3% 15.1% 81.9% 100.0%
Total 1
934 34 18 144 738 934
3.70 3.6% 1.9% 15.4% 79.0% 100.0% 1
Combined number of student ratings in all 200-level courses sampled in Spring 2010, Fall 2010, Spring 2011, Fall 2011, and Spring 2012. A student may be evaluated more than once if he or she is taking more than one 200-level course.
2 Scale: 1 = “Not Effective”, 2 = “Somewhat Effective”, 3 = “Effective”, 4 = “Very Effective”
2011-2012 University College PRAC Report Page 16
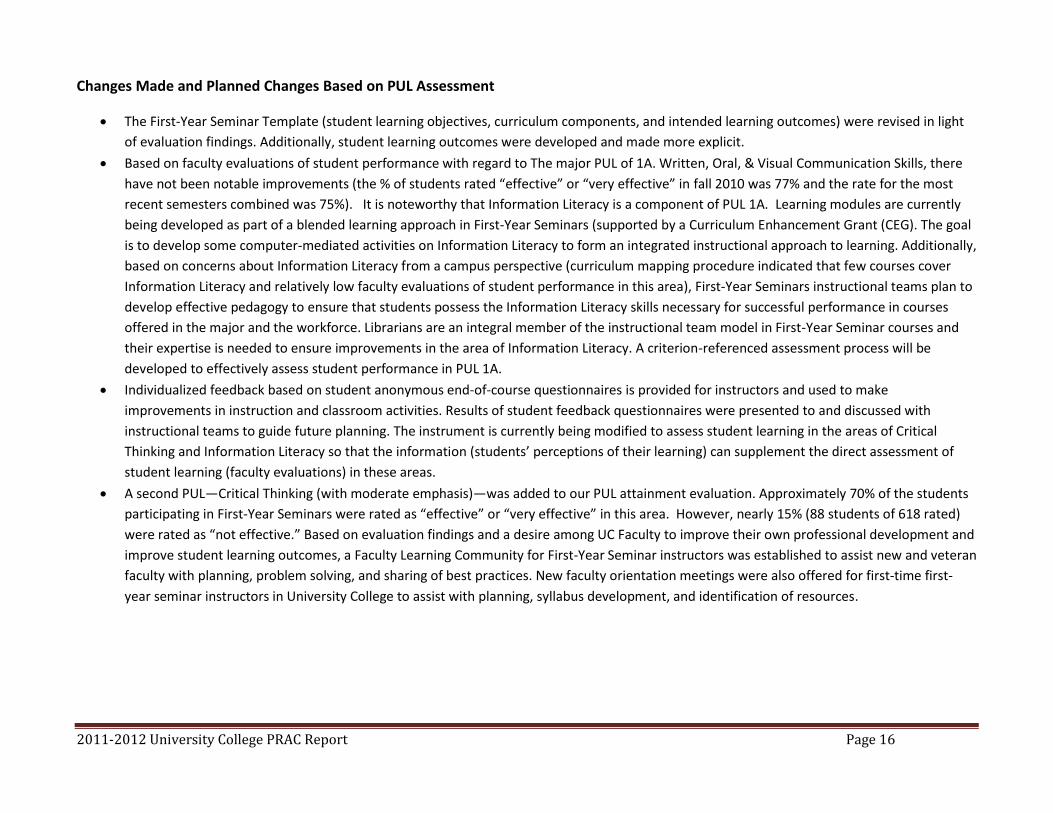
Changes Made and Planned Changes Based on PUL Assessment
The First-Year Seminar Template (student learning objectives, curriculum components, and intended learning outcomes) were revised in light
of evaluation findings. Additionally, student learning outcomes were developed and made more explicit.
Based on faculty evaluations of student performance with regard to The major PUL of 1A. Written, Oral, & Visual Communication Skills, there
have not been notable improvements (the % of students rated “effective” or “very effective” in fall 2010 was 77% and the rate for the most
recent semesters combined was 75%). It is noteworthy that Information Literacy is a component of PUL 1A. Learning modules are currently
being developed as part of a blended learning approach in First-Year Seminars (supported by a Curriculum Enhancement Grant (CEG). The goal
is to develop some computer-mediated activities on Information Literacy to form an integrated instructional approach to learning. Additionally,
based on concerns about Information Literacy from a campus perspective (curriculum mapping procedure indicated that few courses cover
Information Literacy and relatively low faculty evaluations of student performance in this area), First-Year Seminars instructional teams plan to
develop effective pedagogy to ensure that students possess the Information Literacy skills necessary for successful performance in courses
offered in the major and the workforce. Librarians are an integral member of the instructional team model in First-Year Seminar courses and
their expertise is needed to ensure improvements in the area of Information Literacy. A criterion-referenced assessment process will be
developed to effectively assess student performance in PUL 1A.
Individualized feedback based on student anonymous end-of-course questionnaires is provided for instructors and used to make
improvements in instruction and classroom activities. Results of student feedback questionnaires were presented to and discussed with
instructional teams to guide future planning. The instrument is currently being modified to assess student learning in the areas of Critical
Thinking and Information Literacy so that the information (students’ perceptions of their learning) can supplement the direct assessment of
student learning (faculty evaluations) in these areas.
A second PUL—Critical Thinking (with moderate emphasis)—was added to our PUL attainment evaluation. Approximately 70% of the students
participating in First-Year Seminars were rated as “effective” or “very effective” in this area. However, nearly 15% (88 students of 618 rated)
were rated as “not effective.” Based on evaluation findings and a desire among UC Faculty to improve their own professional development and
improve student learning outcomes, a Faculty Learning Community for First-Year Seminar instructors was established to assist new and veteran
faculty with planning, problem solving, and sharing of best practices. New faculty orientation meetings were also offered for first-time first-
year seminar instructors in University College to assist with planning, syllabus development, and identification of resources.

2011-2012 University College PRAC Report Page 17
Indirect Assessment Results Highlights
The following are some instruments and methods that we use to collect indirect Student Learning Outcomes (SLOs):
National Survey of Student Engagement (NSSE)
Continuing Student Satisfaction and Priorities Survey (CSSPS)
End-of -Course and Post-Program Questionnaires
Pre-Post Questionnaires
Focus groups and Interviews
Grade Performance Data
Retention and Graduation Rates
National Survey of Student Engagement 2002-2009: IUPUI Improved on Five Measures – First Year Students
• Active and Collaborative Learning
– How often students participate in class and collaborate with other students in solving problems or mastering difficult material.
• Active Learning
– Students learn more when they are intensely involved in their education and are asked to think about and apply what they are learning
in different settings.
• Collaborative Learning
– Collaborating with others in solving problems or mastering difficult material prepares students to deal with the messy, unscripted
problems they will encounter daily during and after college.
• Supportive Campus Environment
– The extent to which students perceive the institution is committed to their success, and provides institutional support for academic
success, and cultivates high quality student relationships with faculty and administrators, and peers.
• Student-Faculty Interaction
– How often students interact with faculty members inside and outside the classroom.

2011-2012 University College PRAC Report Page 18
The figure below displays students’ quality of TLC learning experiences from 2007 to 2011. Questionnaire results suggested that perceptions of their
overall satisfaction with experiences and quality of peer interactions have remained fairly consistent over the last 5 years. Students’ ability to
understand connections between different disciplines and courses showed fairly steady improvements from 2007-2009 and reached the highest mean
value in 2011(3.94). Based on a 5-point Liker-type scale ranging from 1= Very Little to 5=Very Much.

2011-2012 University College PRAC Report Page 19
The First-Year Seminar End-of-Course Questionnaire: Assessing Changes Made in the Curriculum All Items are significantly different based on independent samples t-tests results (p<.05) (4-point scale ranging from 0 = “Not at All” “to 4 “A Great Deal”)
The First-Year Seminar improved my ability to (or improved my understanding of): Year N Mean Std. Deviation
See multiple sides of issues
Critical Thinking PUL
Fall 2008 619 2.55 1.23
Fall 2011 447 2.80 1.17
Evaluate the quality of information
Critical Thinking and Information Literacy PUL
Fall 2008 619 2.57 1.17
Fall 2011 447 2.76 1.16
Critically examine ideas and issues
Critical Thinking PUL
Fall 2008 613 2.49 1.20
Fall 2011 445 2.78 1.14
Complete well written papers
PUL Core Communication
Fall 2008 605 2.39 1.29
Fall 2011 447 2.66 1.26
Decide on a major or future career
PDP
Fall 2008 618 2.53 1.45
Fall 2011 444 2.76 1.27
My personal goals
PDP
Fall 2008 619 2.75 1.33
Fall 2011 447 3.06 1.14
My motivations for attending college
PDP
Fall 2008 616 2.72 1.39
Fall 2011 444 3.05 1.17
Make a successful transition to IUPUI
PDP
Fall 2008 612 2.19 1.63
Fall 2011 430 2.96 1.15
Develop an appreciation of social and cultural diversity
PUL Understanding Society and Culture
Fall 2008 612 2.47 1.40
Fall 2011 443 2.87 1.19
Discuss ideas with students with views different from my own
PUL Understanding Society and Culture
Fall 2008 613 2.53 1.38
Fall 2011 433 2.89 1.12

2011-2012 University College PRAC Report Page 20
Changes Made Based on Indirect Assessments
IUPUI was invited to participate in the NSSE Institute for Effective Educational Practice Learning to Improve: A Study of Evidence‐Based
Improvement in Higher Education. IUPUI showed a pattern of improved NSSE results over time for first-year students. One of the contributing
factors to the improved scores has been sustaining University College (UC) as a student-centered, evidence-based unit that coordinates academic
support programs for entering students.
Many of the programs, practices, and policies in University College have been implemented based on assessment data collected via campus-wide
and University College specific surveys and questionnaires. The organization of the curriculum and co-curriculum and other learning opportunities
to get students to participate in high impact practices such as themed learning communities, service learning, and early intervention programs
(experiences that have been linked to student learning and academic success) have been expanded.
The First-Year Seminar curriculum was designed to place more emphasis on Critical Thinking, Information Literacy, Diversity (Understanding Society
and Culture PUL), and Personal Development Planning, An analyses of students self-reported learning outcomes in these significantly improved
from Fall 2008 to Fall 2011.
The Personal Development Planner (PDP) was developed and implemented in First-Year Seminars to serve as a multifaceted intervention to
enhance student engagement, learning, and academic success. It serves as a compass to graduation that provides opportunities for guided
reflection that facilitate goal setting (and enhancement of goal commitment), academic hope, identity development, and integration of academic
and career planning with student learning. It essentially includes the most impactful elements of electronic portfolios with the benefits of intrusive
advising. The ePDP has been successfully implemented in First-Year Seminars with promising results.
Themed Learning Community assessment results are shared during annual retreats where faculty teams work collaboratively to plan their
curricula. Based on assessment results, TLC faculty members have improved pedagogy to ensure that students integrate their learning experiences.
Students’ ability to understand connections between different disciplines and courses showed fairly steady improvements from 2007-2009 and
reached the highest mean value in 2011 (3.84 compared to a mean of 3.69 in 2007).

2011-2012 University College PRAC Report Page 21
University College Assessment and Planning Matrix (Not all of UC programs, services, policies, and assessment results are reflected in the matrix. Please see http://research.uc.iupui.edu for more comprehensive reports). Program Goals and Student Learning Outcomes Assessment Findings Highlights Changes Made Based on Assessment New Student
Orientation
Academic Integration
Students will be exposed to information related
to the purpose of higher education, the
expectations associated with higher education,
and information that can be used and applied
after orientation.
Students will have the opportunity to begin
building relationships with faculty, staff, and
peers on campus.
Students will receive information regarding
their academic programs, services, and
opportunities available to minimize their
anxiety and build a support system for their
learning.
Social Integration
Students will have the opportunity to make
connections with other students.
Students will feel supported and will have a
general sense of familiarity with the
surroundings.
Students will understand the information about
services, non-classroom-related activities,
residence opportunities, safety, and technology.
Students will feel welcomed and connected to
IUPUI.
Self-Efficacy
Students will report that they feel prepared to
meet the demands and expectations of college.
Students will report they have the ability to
make a successful transition to IUPUI.
In 2011, 2,854 beginning and 1,672 transfer
student were served.
Students who attended orientation were likely to
enroll. 95% of first-time freshmen, 96%New
Transfers, 94% New IC Transfers of who
attended enrolled in classes subsequently.
Student Exit Questionnaire Highlights:
90% of these students reported that attending New
Student Orientation improved their ability to make
a successful transition to the IUPUI campus.
92% of students reported that orientation provided
important contact information they may reference
in future semesters.
There was a 6% increase in the number of
students who reported that orientation increased
their awareness about involvement opportunities
(compared to 2010; changes were made to the
2011 program based on 2010 assessment results)
Qualitative Response Summary:
The new students overall believed they received
the information they needed to make a successful
transition to IUPUI.
A few common areas of concern were in regards
to the Tour; some students reported they would
have enjoyed a major based tour
Not seeing housing; some students would have
enjoyed the opportunity to visit campus housing
In an effort to meet all the academic and social
needs of students, an overnight or 2-day New
Student Orientation. Changes made for beginners
The feedback suggested that students wanted
to learn more about campus involvement. This
was the only major recommendation and
change that was stated.
To address the student involvement concern,
we worked collaboratively with the Office of
Student Involvement to include an involve
piece to orientation during Jag 101.
Changes made for transfer students
Explore new logistical ideas for the advising
session—to include more time, possible group
setting, etc.
Re-evaluate the flow of the day to create
smoother transitions and consider
incorporating a resource fair where transfer
students could have the opportunity to connect
with a variety of IUPUI offices.
Keep reviewing current literature regarding
transitional services for transfer students.
Changes made for family members
Explore new methods for sharing information
with family members: use of different media
to engage all learners.
Re-evaluate the type of information being
shared with the audience to make sure we are
meeting their needs at that time period of their
transition.
Keep reviewing current literature regarding
transitional services for family members.

2011-2012 University College PRAC Report Page 22
Program Goals and Student Learning Outcomes Assessment Findings Highlights Changes Made Based on Assessment Summer Bridge
The summer bridge intervention was developed
to help students perform better in first year
courses, develop better writing and quantitative
reasoning skills, feel an enhanced sense of
belonging, feel a sense of readiness to begin
college, and introduce students to high-impact
practices. Student Learning Outcomes:
Develop a comprehensive perspective on higher
education
Develop a community of learners
Develop communication skills
Develop critical thinking skills
Develop study skills
Develop college adjustment skills
Understand the demands and expectations of
college
Understand information technology
Understand and use university resources
Learning Outcome Assessment Results:
Students reported participating Summer Bridge
improved ability to (% Agree or Strongly Agree):
See multiple sides of issues (81%)
Evaluate the quality of information (82%)
Critically examine ideas and issues (82%)
Do well in math courses (71%)
Communicate my thoughts in writing (77%)
Communicate my thoughts in speaking (79%)
Succeed academically (91%)
Adjust to college life (94%)
Established close friendships (87%)
Use IUPUI technology such as Oncourse (95%)
Locate the appropriate campus resources when
help needed (92%)
A total of 455 Fall 2011first-time, full-time
(Indianapolis only) students participated in the
Summer Bridge program. 76 Summer Bridge
students were African American and 48 were
Hispanic/Latino(a). The higher proportion of African American and
Latino(a) students participating in Summer Bridge
compared to the overall cohort as well as the high
levels of academic performance among African
American scholarship recipients seems to suggest
that scholarships have some positive implications
in terms of: 1) attracting under-represented
students to the program and 2) serving as an
incentive for attaining high levels of academic
performance.
Overall, the Summer Bridge participants had
higher levels of academic performance (Fall GPA
2.90) compared to nonparticipants (Fall GPA
2.75). Students participating in Summer Bridge
also had lower DWF rates (14%) compared to
nonparticipants (19%). African American students who participated in
Summer Bridge had notably higher GPAs, lower
DFW rates, and higher fall-to-spring retention
rates compared to nonparticipating African
American Students.
Hispanic/Latino(a) students who participated in
Summer Bridge had notably higher GPAs, lower
DFW rates, and higher fall-to-spring retention
rates compared to nonparticipating
Hispanic/Latino(a) students. The first-time, full-time Summer Bridge
participants had significantly higher one-year
retention rates (81%) compared to nonparticipants
(71%). Participation in the Summer Bridge program prior
to participation in a TLC contributed to academic
success levels more than participation in TLCs or
Seminars without Summer Bridge, even when
considering student characteristics. The SB-TLC
intervention contributed to more variance in GPAs
and a larger proportion of retention than the other
interventions.
Results of student questionnaires were
presented to and discussed with instructional
teams, program staff, and academic school
liaisons to guide future planning.
In an effort to continue to increase the
enrollment of minority students, additional
scholarship funding was identified.
Scholarship amounts were decreased slightly
and scholarships were awarded to more
students.
Requirements for scholarship awards were
broadened to include post-Bridge support
including participation in co-curricular
programming and mandatory designated study
periods in the fall and spring semesters.
Minority scholarship recipients were required
to attend a co-curricular event.
A student position was created to do outreach
to potential Bridge students over the summer
and provide ongoing communications with
minority students and their families in the
months leading up to the program.
In collaboration with the Office of
International Affairs, two Summer Bridge
sections for international students were created
and all incoming international freshmen were
required to participate in the program.
In collaboration with the OIA, we integrated
International Peer Mentoring Program mentors
to provide additional support and continuity
for international participants.
Specialized sessions on topics including
academic integrity, study abroad, financial
literacy, student involvement, and student
employment were restructured to become
recommended components of the regular
instructional schedule in order to increase
participation.
Expanded number of Summer Bridge-TLC
sections.

2011-2012 University College PRAC Report Page 23
Program Goals and Student Learning Outcomes Assessment Findings Highlights Changes Made Based on Assessment First-Year
Seminars
First-Year Seminars (FYS) were designed to
facilitate student transitions to college by
introducing key information and skills needed
to succeed and by offering opportunities to
connect with faculty, staff, and other students.
The courses are taught by an instructional team,
including a faculty member, a student mentor,
an academic advisor, and a librarian.
The course aims to improve student success by
placing a strong emphasis on critical thinking,
frequent writing, information literacy,
introducing students to campus resources,
career exploration and development, and
creating opportunities for students to connect
with each other and faculty.
See page 11 for detailed SLOs.
The retention rate for First-Year Seminar
participants was 74% compared to 73% for
nonparticipants.
Overall, the first-year seminar participants earned
statistically significant higher GPAs (2.52)
compared to nonparticipants (2.20) (based on
analysis of covariance results with H.S. GPAs,
SAT scores, and gender entered as covariates).
Indirect Learning Outcome Assessment Results:
Students reported participating UC 2011 (most recent
available) First-Year Seminar improved ability to (% 4
or 5 out of a 5-point scale with 5 indicating a “great
deal”):
See multiple sides of issues (66%)
Evaluate the quality of information (66%)
Critically examine ideas and issues (66%)
Complete well-written papers (62%)
Give oral presentations (61%)
Communicate my thoughts in speaking (79%)
Succeed academically (67%)
Adjust to college life (70%)
Decide on a major of future career (66%) Developed a high appreciation of social and
cultural diversity (70%).
Discussed ideas with students with different views
than their own. (71%)
The First-Year Seminar curriculum was
designed to place more emphasis on Critical
Thinking, Information Literacy, Diversity
(Understanding Society and Culture PUL),
and Personal Development Planning, An
analyses of students self-reported learning
outcomes in these significantly improved
from Fall 2008 to Fall 2011.
The Personal Development Planner (PDP) was
developed and implemented in First-Year
Seminars to serve as a multifaceted
intervention to enhance student engagement,
learning, and academic success.
Results of student feedback questionnaires
were presented to and discussed with
instructional teams to guide future planning.
Faculty Learning Community for First-Year
Seminar instructors was established to assist
new and veteran faculty with planning,
problem solving, and sharing of best practices.
New faculty orientation meetings were offered
for first-time first-year seminar instructors in
University College to assist with planning,
syllabus development, and identification of
resources.
A task force was formed to examine hybrid-
online sections of U110. Hybrid-online
sections were made available to incoming
students earlier in the registration cycle with
an eye towards increasing the number of
academically strong students selecting these
sections.

2011-2012 University College PRAC Report Page 24
Program Goals and Student Learning Outcomes Assessment Findings Highlights Changes Made Based on Assessment ePDP Overview
The Personal Development Planner (PDP) was
developed and implemented in First-Year
Seminars to serve as a multifaceted intervention
to enhance student engagement, learning, and
academic success. It serves as a compass to
graduation that provides opportunities for
guided reflection that facilitate goal setting (and
enhancement of goal commitment), academic
hope, identity development, and integration of
academic and career planning with student
learning. It essentially includes the most
impactful elements of electronic portfolios with
the benefits of intrusive advising.
Student Learning Outcomes
Self-Assessment: Students will identify
success-related competencies that are natural
strengths as well as other skills that they need
to build.
Exploration: Students will research and
develop a realistic, informed, and detailed
vision of related academic and career goals.
Students will describe academic majors and
career options.
Evaluation: Students will analyze their
academic progress over the semester in terms of
academic and career success strategies.
Goal Setting: Students will connect a larger
sense of personal values and life purpose to the
motivation and inspiration behind their
academic and career goals.
Planning: Students will locate programs,
information, people, and opportunities to
support and reality test their goals. They
identify specific short term steps to reach their
long term goals.
A total of 346 Fall 2010 first-year students
participated in e-PDP sections. The ePDP sections
included the following: two Business, three
Engineering, two Informatics, three Nursing, two
Psychology, one Technology, and three
University College. \ Analysis of covariance (ANCOVA) results
suggested that students participating in ePDP
sections had marginally significantly higher fall
adjusted semester GPAs (2.89) compared to
nonparticipants (2.79), even after High School
GPAs, SAT scores, Gender, Ethnicity, Summer
Bridge participation, and Themed Learning
Participation were entered as covariates (p < .10). Students who completed ePDPs were most likely
to rate areas related to understanding themselves,
deciding on a major or future career, and setting
goals as the most beneficial aspects of the process. Students who reported that they completed All
Parts of the ePDP reported statistically significant
better outcomes compared to students who
completed Almost All Parts of the ePDP (or were
in sections that only required certain aspects).
Students who were enrolled in Fall 2011 First-
Year Seminar Sections that required ePDP
completion (some or all parts) had significantly
higher Fall Cumulative GPAs (M=2.82) compared
to students in First-Year Seminar sections that did
not require any aspects of the ePDP (M=2.73),
once academic preparation, sex, and income levels
were accounted for. There were no differences
with regard to First Year Cumulative GPA (fall
and spring combined) or Fall-Spring Retention
Rates between ePDP and No ePDP students.
More intrusive advising components added
(role of advisor increased).
Development of “evaluation capacity” by
developing a plan to assess direct student
learning outcomes by evaluating student
uploaded artifacts, assignments, papers,
reflections, responses to prompts, etc.
Taskforces developed to explore connections
and how ePDP will interface with the
Roadmap.
Exploration of technology that will allow
more intuitive, easy to navigate platforms, and
transportability (e.g., ePDP beyond course and
used throughout student’s academic career and
professional life).
Expansion in number of First-Year Seminar
sections that include the PDP process.

2011-2012 University College PRAC Report Page 25
Program Goals and Student Learning Outcomes Assessment Findings Highlights Changes Made Based on Assessment Themed
Learning
Community
TLCs are designed to enhance the retention and
academic success of undergraduate students.
The TLC intervention involves cohorts of
students enrolled in 3 or more thematically-
linked courses, including a first year seminar.
Instructional teams collaborate in advance to
develop an interdisciplinary theme and common
learning experiences both in and outside of the
classroom.
TLCs were designed to provide a structured
first-semester learning environment where
students could develop a strong sense of
community and explore connections across
disciplines. SLOs. Students will:
o Form one or more friendships
maintained after the semester. Make
connections between different
disciplines and courses
o Actively discuss complex issues and
ideas.
o Describe complex real world social
problems and issues
o Be effective in communicating
thoughts in writing.
The first-time, full-time Themed Learning
Community participants have significantly higher
one-year retention rates (78%) compared to
nonparticipants (71%). TLC participants have higher levels of academic
performance (FY GPA 2.78) compared to
nonparticipants (FY GPA 2.63), even when High
School GPA, SAT Score, Admit Date, and
Income Level, and Sex are entered as covariates.
Students from underrepresented minority groups
have significantly better academic success
outcomes and retention rates compared to their
peers that do not participate in TLCs. African
American TLC participants have a one-year
retention rate of 77% compared to 67% for
nonparticipating African Americans. In fact,
based on the results of a logistic regression
analysis African American TLC participants have
a 78% better odds of being retained compared to
nonparticipants, even when academic preparation
variables, income level, admit date (a good proxy
for motivation), and sex where entered in the first
step.
TLC participants have higher average 5 and 6-
year graduation rates compared to nonparticipants.
IUPUI was ranked 5th by U.S. News and World
Report in "Up-and-Coming National Universities"
in 2012. IUPUI was also cited as a top pick by
high school guidance counselors, and recognized
yet again for programs in service learning, first-
year experiences, and learning communities.
Students report that participating in a TLC help
them (% Much or Very Much):
o Form one or more friendships that I will
maintain after the semester.(75%)
o Understand connections between
different disciplines and courses (73%).
o Actively discuss complex issues and
ideas.(63%)
o Develop a better understanding of
complex real world social problems and
issues (62%).
o Become more effective with
communicating my thoughts in writing
(60%)
Analyses of student questionnaire results
suggest integrative learning is correlated with
student satisfaction of the overall TLC
experience. These findings will encourage
greater focus on integrative learning in
subsequent faculty development opportunities.
TLC faculty members have been invited to
join a committee that will begin to lay the
groundwork for investigating direct measures
of integrative learning within the TLC
program.
Plan to implement a committee of academic
advisors to guide the future growth of the
program. This committee will be informed
through students’ responses to the question
“why did you choose to enroll in this
particular TLC.”
Plan to revise the student feedback
questionnaire to include more questions to
assess integrative learning outcomes.

2011-2012 University College PRAC Report Page 26
Program Goals and Student Learning Outcomes Assessment Findings Highlights Changes Made Based on Assessment Bepko Learning
Center Peer
Mentoring
Program Description The mission of the Bepko Learning Center is to
enhance the opportunities for undergraduate
students to achieve educational goals and to
assist in their development of academic skills
through the guidance of more experienced,
highly successful student peers. Collaborative
learning, role modeling, peer interaction and
peer support play key parts in this process. To
assist students in realizing their full academic
potential, the Bepko Learning Center houses
three offices: the Office of Academic
Mentoring, the Office of Tutorial Support and
the Office of Academic Enrichment.
Program Goals To offer academic support in a variety of
subjects in order to improve educational
achievement.
To assist students in maximizing his or her full
academic potential at each stage throughout the
undergraduate experience.
To facilitate appropriate referrals to other
campus resources
To provide support systems to enhance
academic success
To help resolve the problems that caused the
student to seek help and to work towards
making the student a more independent learner.
Students who participated in the Structured
Learning Assistance program 1-10 times obtained
an average GPA of 2.05, 11-13 times obtained a
2.74 and 14 or more times obtained 2.98
Student who participated in the Supplemental
Instruction program obtained an average GPA of
3.05 and non-participants obtained an average of a
2.46.
Student who participated in the Supplemental
Instruction program had a combined DFW rate of
11.32% as compared to a 31.64% for non-
participants.
Methods used to assess student learning and
success:
End of the Semester Evaluations
Mentor Self Evaluations
Grade Report (comparing participants to non-
participants)
Program Participant Attendance
Instructor Evaluations
Program Evaluations
FLAGS Report
Based on the assessment results for programs,
the following are future changes that will be
implemented:
Increased marketing efforts for the Tutor
Matching Service to make students aware of
the new tutoring application.
Increase the number of partnerships with
gateway courses to augment academic
supports for those courses.
Further increase the email outreach used for
students who have been flagged as “at-risk” by
the new FLAGS system and follow with
instructors to communicate referral activities.
2011-2012 University College PRAC Report Page 27
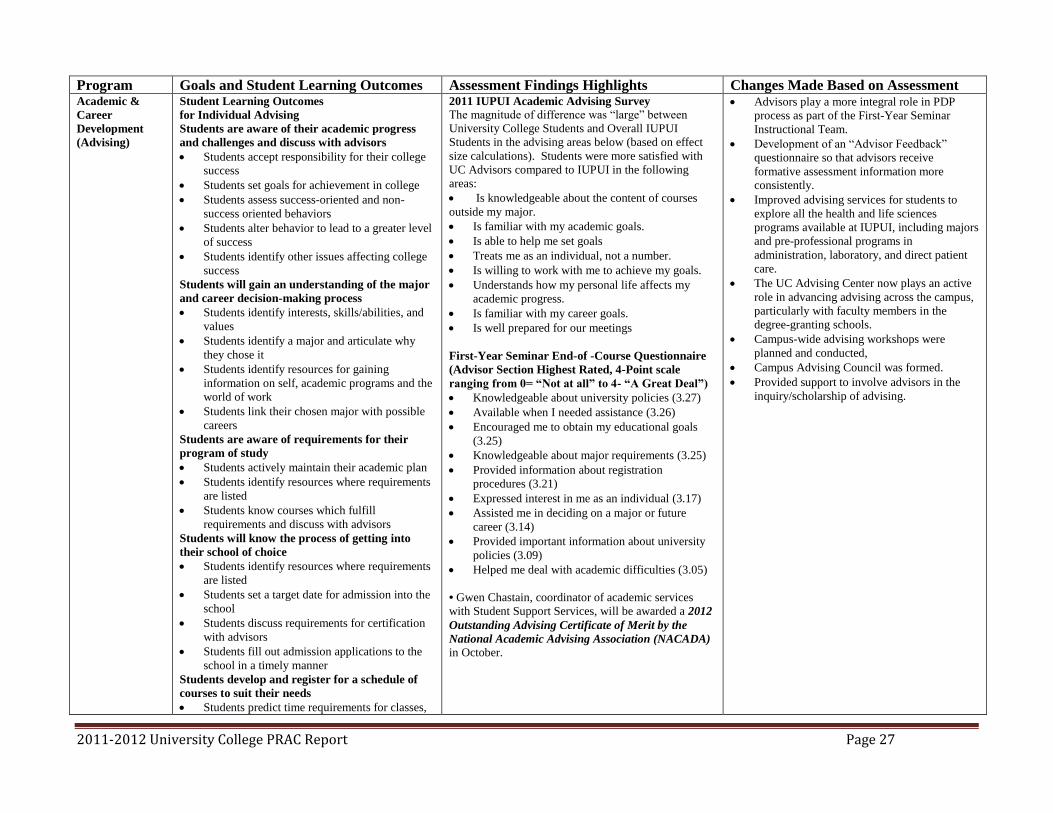
Program Goals and Student Learning Outcomes Assessment Findings Highlights Changes Made Based on Assessment Academic &
Career
Development
(Advising)
Student Learning Outcomes
for Individual Advising
Students are aware of their academic progress
and challenges and discuss with advisors
Students accept responsibility for their college
success
Students set goals for achievement in college
Students assess success-oriented and non-
success oriented behaviors
Students alter behavior to lead to a greater level
of success
Students identify other issues affecting college
success
Students will gain an understanding of the major
and career decision-making process
Students identify interests, skills/abilities, and
values
Students identify a major and articulate why
they chose it
Students identify resources for gaining
information on self, academic programs and the
world of work
Students link their chosen major with possible
careers
Students are aware of requirements for their
program of study
Students actively maintain their academic plan
Students identify resources where requirements
are listed
Students know courses which fulfill
requirements and discuss with advisors
Students will know the process of getting into
their school of choice
Students identify resources where requirements
are listed
Students set a target date for admission into the
school
Students discuss requirements for certification
with advisors
Students fill out admission applications to the
school in a timely manner
Students develop and register for a schedule of
courses to suit their needs
Students predict time requirements for classes,
2011 IUPUI Academic Advising Survey
The magnitude of difference was “large” between
University College Students and Overall IUPUI
Students in the advising areas below (based on effect
size calculations). Students were more satisfied with
UC Advisors compared to IUPUI in the following
areas:
Is knowledgeable about the content of courses
outside my major.
Is familiar with my academic goals.
Is able to help me set goals
Treats me as an individual, not a number.
Is willing to work with me to achieve my goals.
Understands how my personal life affects my
academic progress.
Is familiar with my career goals.
Is well prepared for our meetings
First-Year Seminar End-of -Course Questionnaire
(Advisor Section Highest Rated, 4-Point scale
ranging from 0= “Not at all” to 4- “A Great Deal”)
Knowledgeable about university policies (3.27)
Available when I needed assistance (3.26)
Encouraged me to obtain my educational goals
(3.25)
Knowledgeable about major requirements (3.25)
Provided information about registration
procedures (3.21)
Expressed interest in me as an individual (3.17)
Assisted me in deciding on a major or future
career (3.14)
Provided important information about university
policies (3.09)
Helped me deal with academic difficulties (3.05)
• Gwen Chastain, coordinator of academic services
with Student Support Services, will be awarded a 2012
Outstanding Advising Certificate of Merit by the
National Academic Advising Association (NACADA) in October.
Advisors play a more integral role in PDP
process as part of the First-Year Seminar
Instructional Team.
Development of an “Advisor Feedback”
questionnaire so that advisors receive
formative assessment information more
consistently.
Improved advising services for students to
explore all the health and life sciences
programs available at IUPUI, including majors
and pre-professional programs in
administration, laboratory, and direct patient
care.
The UC Advising Center now plays an active
role in advancing advising across the campus,
particularly with faculty members in the
degree-granting schools.
Campus-wide advising workshops were
planned and conducted,
Campus Advising Council was formed.
Provided support to involve advisors in the
inquiry/scholarship of advising.

2011-2012 University College PRAC Report Page 28
Program Goals and Student Learning Outcomes Assessment Findings Highlights Changes Made Based on Assessment work, family and studying
Students consider alternative courses such as
off-campus learning centers, night and weekend
courses, Internet and distance education courses
Students consider academic support programs
such as Supplemental Learning Assistance,
Thematic and regular Learning Communities,
Critical Inquiry classes
Students register for classes independently
Students know campus services relevant to their
needs
Students identify locations of campus services
Students know specific services as they relate to
their needs
Students are aware of engagement opportunities
that enhance their academic plan
Academic &
Career
Development
(Career
Services)
Major/Career Information Day
Overview: Students explore and gather
information about IUPUI’s undergraduate
majors, career possibilities, and RISE
(Research, International study, Service learning,
and Experiential education) opportunities in
this interactive walk-around fair. They network
and leave with information for their Personal
Development Plans!
Intended outcomes: Students will learn about
majors and their related careers, services and
resources related to these programs and RISE
opportunities.
Externship Program
Overview: an opportunity for students to
shadow a professional in an occupational area
within their field of interest. This opportunity
allows the extern to get an insider’s view of
what types of skills, knowledge, and
capabilities they will need to acquire or develop
in order to be successful in a particular industry.
Intended outcomes:
Through completing an externship experience
students will:
Observe professionals in their typical work
setting for a minimum of 4 hours;
Describe the specific job tasks of the person(s)
Major/Career Information Day
174 evaluations were collected. Majority of
students were very satisfied with the event and
with the information they gathered, were more
aware of resources available for possible majors
and careers.
The main question used to assess student learning
was: After attending MCID, I am better aware of
resources (people, written, online, etc.) available
regarding possible majors or careers:
o Completely agree (55%)
o Somewhat agree (39%)
o Neither agree nor disagree (6%)
o Somewhat disagree (0%)
o Disagree (0%) (only 1 student)
Externship Program
Fall 2011-110 students participated, 353 applied,
152 were offered a match, and we had 63 hosts.
Spring 2012-34 participated, 48 applied, 41 were
offered a match, and we had 55 hosts.
Administered questionnaire to students after the
externship program. The main question used to
assess student learning was:
Overall, did you learn something about a
particular major, field, or organization during your
Externship? On a scale of 1-5, the mean response
was 4.70.
Major/Career Information Day
Have requested that school representatives
bring upperclassmen and/or alumni to this
event in order to share more valuable
information with students from their
experiences and perspectives.
Externship Program
Require resume for student applications
Students choose from list of hosts in their
application (instead of coordinator choosing
for them based on interest)
Provide reflection guide in pre-externship
workshop.

2011-2012 University College PRAC Report Page 29
Program Goals and Student Learning Outcomes Assessment Findings Highlights Changes Made Based on Assessment shadowed;
Identify potential career opportunities with
possible majors of study;
Identify the interests, abilities, and values that
may align with a particular career;
Connect and evaluate the experience with
personal interest, abilities, and values relating
to self;
Create a plan of professional career
development.
Students were required to submit an externship
reflection paper. This was typically 2 pages in
length answering the prompts below:
o Provide a summary of your externship
experience that describes the specific
job tasks of the person(s) you
shadowed.
o Identify and explain how possible
academic majors connect with your
externship experience.
o Evaluate the interests, abilities, and
values necessary for a job in the field,
major or industry and compare to own. .
o What 1-2 steps will you take because of
this experience?
Approximately 80 students (out of 110) turned in
a reflection paper. There was very rich data
included and it appears that they all connected
their experience with their own career paths.
Jill Vanderwall, experiential learning coordinator,
was awarded the New Professionals Award from
the Career Development Professionals of
Indiana for her work with experiential learning
on the IUPUI campus and for chairing a statewide
conference.

2011-2012 University College PRAC Report Page 30
Program Goals and Student Learning Outcomes Assessment Findings Highlights Changes Made Based on Assessment Office of Student
Success (OSS)
Program Overview
The mission of the Office for Student Success
is to enhance the transition and success of
minority students by addressing academic,
social, and personal matters that have an impact
on persistence. Through connecting, affirming,
guiding and engaging students, we seek to
ensure the success of students of color. Offers
intensive retention programming such as
academic check-ups, tutoring, direction to
resources, workshops, and designated study
time (DST) and support through the
SAAB/B2B and SAAS/S2S organizations.
Key Retention Efforts
Communication with students upon acceptance
to IUPUI.
Encouraged participation in summer bridge
program ($ added value)
Summer Bridge – end of the day programming
for male and female students of color.
Academic course load review
In-person early-warning follow ups/academic
check-ups and development of a plan as
necessary.
Referral to campus resources – Tutoring,
CAPS, AES, Health Services, etc.
Mid and end of the semester in-person contacts
Communication to non-enrolled students (non-
returners)
Relationship Building/Mentoring
Tailored workshops/meetings such as syllabus
review, time management, financial literacy.
Professional development opportunities via
leadership conference attendance, resume
workshops, etc.
Cultivation of community building through a
variety of service opportunities year-round
(over 20 performed in 2011-2012 both on
campus and in the community).
Intended Outcomes
Developed relationships (peer-peer and Advisor-
student)
Student personal and professional development.
Student equipped with successful strategies to be
retained until graduation.
Retention Results
Program Fall 2010 Fall-to-Spring Retention
Student African American Brotherhood (SAAB)
2010 (N=19) 94% compared to AA Students at
IUPUI (158) 85%
Student African American Sisterhood (SAAS)
2010 (N=31) 97% Compared to AA STUDENTS
at IUPUI (N=258) 85% Program Fall 2010 Fall-to-Fall Retention
Student participants had a retention rate of 74%
compared to African American nonparticipants
who has a retention rate of 68%.
Program Fall 2011 Fall-to-Fall Retention
A total of 34 students participated with a retention
rate of 89% (PRELIMINARY).
Based on positive results, expanded program
to include Latino(a) students.
More intrusive advising
More extensive and frequent in-person early-
warning follow ups/academic check-ups and
development of a plan as necessary. Student will be required to respond to
academic check-ups at semester week four and
will also be subject to early warning follow-up
meetings should there be any reported issues
by faculty.
Professional development opportunities will
be presented such as providing resources (such
as transportation, registration, etc.) to
career/job fairs, leadership conferences, local
seminars, etc. that support the mission and
goals of the OSS program.
Community Service opportunities will be
highly recommended for all students to
participate in. Opportunities will be collective
(OSS) or SAAB/SAAS specific. Details will
be provided via the list-serv that all students
are subscribed to.
OSS will collaborate with various community
programs, agencies, groups, etc. that promote
the education, retention and success of African
American and/or Latino/a students to
exchange best practices as well as stay abreast
of cutting edge research in this area.
OSS has two social clubs (SAAB/SAAS)
which are officially recognized as student
organizations at IUPUI. The OSS program
will support the student organization in their
efforts to create a supportive environment,
offer social activities for bonding, academic
support, peer mentoring, etc.

2011-2012 University College PRAC Report Page 31
Program Goals and Student Learning Outcomes Assessment Findings Highlights Changes Made Based on Assessment Twenty First
Century
Scholars
Program Overview
The Twenty-first Century Scholars Success
Program is the IUPUI support service for
students who affirm their Twenty-first Century
Scholars pledge and receive a tuition
scholarship from the state of Indiana.
The mission of the Twenty- first Century
Scholars Success Program is to increase the
retention of IUPUI scholars and provide
support through degree completion To ensure a
successful transition into the college
experience.
TFCSSP offers first-year peer mentoring,
academic support, and workshops that focus on
academic success, career development and
personal growth.
Peer Mentoring Program Goals
Provide support for first-year scholars
Positively impact student success, and to
enhance student learning.
Provide each scholar participant caring
mentors, positive role models, group and
individual mentoring sessions and a series of
workshops and network events which focus on
enhancing or developing strategies for success
and referrals to academic support as well as
personal and student development services on
campus.
The program served 230 students during the 2011-
2012 academic year. While Twenty-First Century Scholars are at a
greater risk for not persisting, those who receive
additional aid from IUPUI and/or participate in
our success programs fare nearly as well and in
some cases better than the overall student
population.
Twenty-First Century Scholars are much more
likely than students overall to be African-
American, First-Generation College Students,
low-income, and to have slightly lower levels of
academic preparation.
Twenty-First Century Scholars who received the
IUPUI pledge grant were still enrolled at IUPUI in
the second year at a rate nearly the same as the
overall student population (71% vs. 73%).
The retention rates improve even more
dramatically when Scholars participate in our
success programs. The Fall 2010 to Fall 2011
one-year retention rate for Twenty-first Century
Scholars who participated in Summer Bridge and
Peer Mentoring was 6% higher than first year
students overall.
Twenty-First Century Scholars who received the
pledge grant and participated in two of our
success programs, Summer Bridge and Peer
Mentoring achieved an average GPA of 2.91 in
Fall 2009 and 3.13 in Fall 2010. Those in the
same group who did not participate in these
programs achieved an average GPA of 2.34 in Fall
2009 and 2.35 in Fall 2010.
The retention rates of TFCS students in 2006
(prior to the Twenty-first Century Scholars
Success Program interventions) was
approximately 58% and the retention rate for the
TFCS who participated in programs offered by the
Twenty-first Century Scholars Success Program
in 2010 was 74%. The increased rate was 16%
over the last five years. The TFCSSP has been awarded a 2012 NACADA
Outstanding Institutional Advising Program for
its Peer Mentoring Program.
Learning outcomes for our first-year peer
mentoring program have been created with the
intention of using these outcomes to assess
student learning and improve the effectiveness
of the program and its corresponding activities
and workshops.
Each of the outcomes will have associated
measurable criteria and one or more
assessment tools to gather the data. The results
of these assessments will be collected and
analyzed regularly.
Through group and individual mentoring of
students, we aim to achieve the following
learning outcomes:
o Students will transition from high
school to college life
o Students will be engaged in their
academic careers
o Students will build a social support
network on campus
o Students will become more aware of
self and the diversity of others
o Students will become aware of
major/career connections and steps
needed to prepare for a successful
transition to the workforce or
graduate study.

2011-2012 University College PRAC Report Page 32
Program Goals and Student Learning Outcomes Assessment Findings Highlights Changes Made Based on Assessment Nina Mason
Pulliam Scholars Our last faculty fellowship project as described
above produced the following program learning
outcomes:
Goal 1: Facilitate the academic, intellectual, and
cultural transitions of Nina Scholars
1. Develop a personal road map for success
2. Utilize goal-setting strategies
3. Develop critical thinking*
4. Develop intellectual depth, breadth, and
adaptiveness*
5. Understand and apply student learning
concepts and methods
6. Demonstrate effective executive
functioning
Goal 2: Develop a community of mutual support
and relational leadership among Nina Scholars
1. Develop meaningful connections to
fellow scholars
2. Offer academic and personal strengths to
fellow scholars
3. Participate fully in program community
service
4. Develop leadership identity and
leadership skills in Nina Scholars
Program
Goal 3: Assertively connect Nina Scholars to
campus and community resources that lead to
academic and professional success
1. Fully utilize program guidance and
support
2. Readily access unit, campus, and
community resources
3. Understand how to develop academic and
professional success networks
Goal 4: Facilitate learning and personal growth
of Nina Scholars associated with overcoming
and transcending of barriers to success
1. Understand and apply personal growth
concepts and methods
2. Engage in experiential learning
3. Develop and utilize a sense of one’s
positive core and purpose
4. Develop an understanding society and
First to second year retention for Nina Scholars,
students who face significant challenges in life,
much less in education, is significantly higher
than the University as a whole. The four, five,
and six year graduation rates for Nina Scholars are
also substantially better than IUPUI as whole
despite disadvantaged backgrounds and
experiences of marginalization.
The six year external evaluation identified the
following program strengths: scholar selection
process that balances financial need with
educational commitment and preparedness;
emphasis on academic attainment coupled with an
understanding of scholars' demanding life
circumstances; highly skilled and effective full-
time director; dedicated and diverse advisory
council; exceptional camaraderie among many
scholar cohorts. Through Fall 2012 81% of
IUPUI Nina Scholars have graduated or are still
enrolled.
Faculty fellows research has aided the program in
validating program focus on social and cultural
capital in student success. Lower socio-economic
status students with less of the social and cultural
capital associated with college and professional
success must not only catch up, but they must
make a sometimes painful transition to the
middle-class culture of the institution. Possessing
less social and cultural capital is also sources of
student identity and reinforces self-doubt and
alienation. One particular innovation of the
program has been to address social and cultural
capital development as an objective of the
program and infuse in many activities such as peer
mentoring as well as through the ethos of the
program.
Another faculty fellow project to highlight is a
study done by the IUPUI Center for Urban and
Multicultural Education that focused on scholar
loan indebtedness. That study found that scholars
are taking out fewer loans for less money than in
the past when the six year study showed that
scholars were taking nearly as much out in loans
as their matched sample peers who were eligible
Assessment Plan
The learning outcomes and assessment plan
have served as a firm foundation for us to
think about student learning in the program as
we plan and deliver programming and
interventions. It has also served as a
framework for articulating the goals of the
program to others.
Cohort 9 and 10 Workshops
After a few meetings with our career
development colleagues we determined that
the best approach short of a credited course for
both cohorts was to think more broadly about
workshops that would target success programs
like Twenty-first Century Scholars Success
Program, SAAB/SAAS, and Student Support
Services in addition to Nina Scholars. This
would give our career counselors a full
audience for their customized presentations
and would meet the career development goals
of all similarly targeted programs. Jill offered
to create webinars for scholars who are not
able to attend future workshops. In the
interim, however, I am requiring that all
cohort 9 and 10 scholars meet with a career
counselor, attend a career-related event, and
write a reflection on both. Here is the
communication to the students that we came
up with:
1. First year students will attend Major and
Career Information Day
2. Nina Scholars in the 2nd or 3rd year of the
program are required to complete a career
component. Options for completing the
career component include:
Review 6 career development
modules and successfully complete
quiz for each.
Meet with a career counselor in
University College Academic and
Career Development. You might
meet with a career counselor to:
explore majors/careers, learn about
externship and job shadowing
opportunities, develop your job

2011-2012 University College PRAC Report Page 33
Program Goals and Student Learning Outcomes Assessment Findings Highlights Changes Made Based on Assessment culture*
5. Develop a sense of values and ethical
standards*
Goal 5: Facilitate career development and
graduate school readiness
1. Understand and apply career
development concepts and methods
2. Develop commitment and motivation to
achieve a college degree and to a career
field related to natural strengths, personal
values, and life purpose
Objectives noted with an asterisk come from
IUPUI’s six Principles of Undergraduate Learning.
These expectations speak to what graduates of
IUPUI will know and what they will be able to do
upon completion of their degree.
but did not receive the Nina Scholars award. search strategy and resume for
degreed positions, or practice for an
interview. Take intentional steps
down a path to career success!
Meet with a career
advisor/counselor in your
school/unit. (To determine your
best resource, see
http://www.iupui.edu/career/invento
ry). You may meet with a staff or
faculty member for assistance with
occupational information, job search
strategies, resumes, networking and
more.
Attend a career-related event
(resume workshop, career fair,
networking event, etc.)
After the meeting or event, complete
a Letter of Participation and a
reflection. Your reflection should be
one page in length, double-spaced,
in 12-point Times New Roman or
Calibri font. Use the
guidelines/questions below in
writing your reflection:
Describe the meeting/event. (No
more than one paragraph!)
What did you HOPE to get out of
the meeting/event?
Did the meeting/event meet your
expectations?
What did you learn by participating?
How did the meeting/event relate to
your career aspirations?
What is the next step in your career
planning? What do you still need?

2011-2012 University College PRAC Report Page 34
Appendix A
Table 1: University College Students Demographic Summary, Fall 2011
Fall 2011
N % Total 6170 Ethnicity American Indian/Alaskan Native 12 0% Asian 193 3% Black 929 15% Hispanic 315 5% NR-Alien 211 3% Native Hawaiin/Pacific Islander 7 0% Two or more races 227 4% Other 4276 69% Gender Female 3585 58% Male 2585 42% SAT 1200 + 329 5% 800 - 1190 3713 60% 400 - 790 499 8% None 1629 26% High School Percentile Rank Top 10% 328 5% 11% - 25% 967 16% 26% - 50% 1659 27% Bottom 50% 951 15% Unknown 2265 37%

2011-2012 University College PRAC Report Page 35
High School GPA 3.0 - 4.0 2527 41% 2.99 - 2.0 1761 29% 1.99 - 1.0 74 1% 0.99 - 0 0 0% None 1808 29% Student Level High School Student 125 2% Certificate first year 10 0% Certificate second year 9 0% Associate Freshman 211 3% Associate Sophomore 194 3% Baccalaureate Freshman 2447 40% Baccalaureate Sophomore 1882 31% Baccalaureate Junior 931 15% Baccalaureate Senior 350 6% Undergrad Special 11 0%

2011-2012 University College PRAC Report Page 36
Table 2: University College Students’ Demographic Information Continued, Intended Majors and Academic Success Outcomes Fall 2011
Fall 2011
N % School of Intended Major Business 1066 17% Dentistry 273 4% Education 179 3% Engineering and Technology 615 10% Health & Rehab 22 0% Herron 23 0% Informatics 49 1% Journalism 41 1% Liberal Arts 178 3% Medicine 435 7% Nursing 872 14% Phys. Ed & Tourism 283 5% Science 963 16% Continuing Studies 23 0% Social Work 198 3% SPEA 191 3% University College 751 12% All others 8 0% Retention For Full-Time University College Students Only Fall To Spring 5130 83% (Note: Based on official retention as of census spring
2012)
One Year Retention 4288 70% (Note: Preliminary - official retention is not yet available.
Based on students enrolled at any IU campus or having
received a degree as of August 23, 2012) Averages
Average SAT 971.6
Average HS GPA 3.09

2011-2012 University College PRAC Report Page 37
Average High School Rank 63%
First Generation % First Generation 2430 39% Twenty-first Century Scholars Eligible 782 13% Financial Aid Status - All University College Students Applied for Financial Aid 5102 83% Received Any Financial Aid 4495 73% Financial Aid Status - Full-Time University College Students
Only Applied for Financial Aid 86% Received Any Financial Aid 78% Note: Retention reflects students enrolled on any IU campus or having received
a degree or certificate.