2011 eei-europe-results
TRANSCRIPT
Institute for Building Efficiency | www.InstituteBE.com1 Institute for Building Efficiency | www.InstituteBE.com Copyright 2011 Johnson Controls, Inc.1
ENERGY EFFICIENCY INDICATOR2011 Europe Results
Institute for Building Efficiency | www.InstituteBE.com
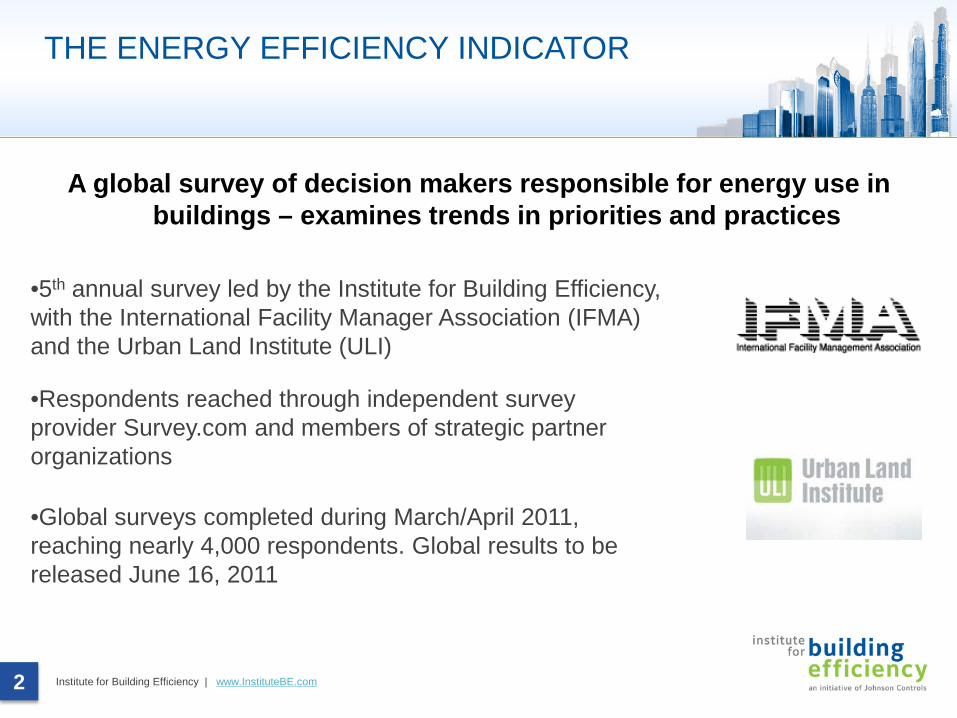
A global survey of decision makers responsible for energy use in buildings – examines trends in priorities and practices
THE ENERGY EFFICIENCY INDICATOR
•5th annual survey led by the Institute for Building Efficiency, with the International Facility Manager Association (IFMA) and the Urban Land Institute (ULI)
•Respondents reached through independent survey provider Survey.com and members of strategic partner organizations
•Global surveys completed during March/April 2011, reaching nearly 4,000 respondents. Global results to be released June 16, 2011
2
Institute for Building Efficiency | www.InstituteBE.com3
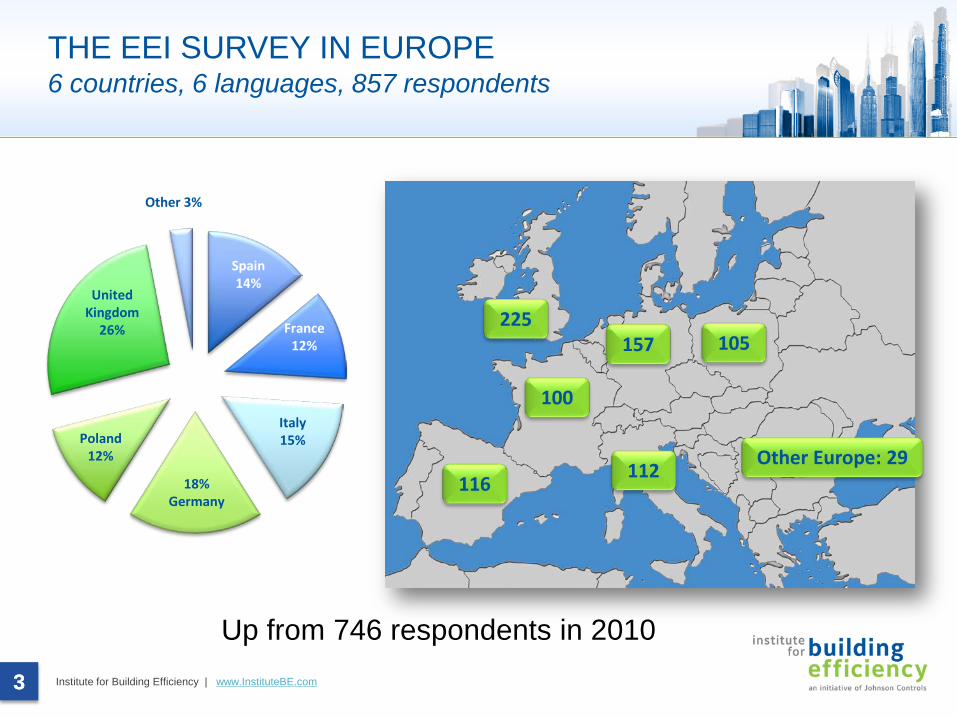
THE EEI SURVEY IN EUROPE6 countries, 6 languages, 857 respondents
3
225United
Kingdom 26%
18%Germany
Italy15%
France12%
Spain14%
Poland12%
Other 3%
Up from 746 respondents in 2010
157 105
112116
Other Europe: 29
100
Institute for Building Efficiency | www.InstituteBE.com4
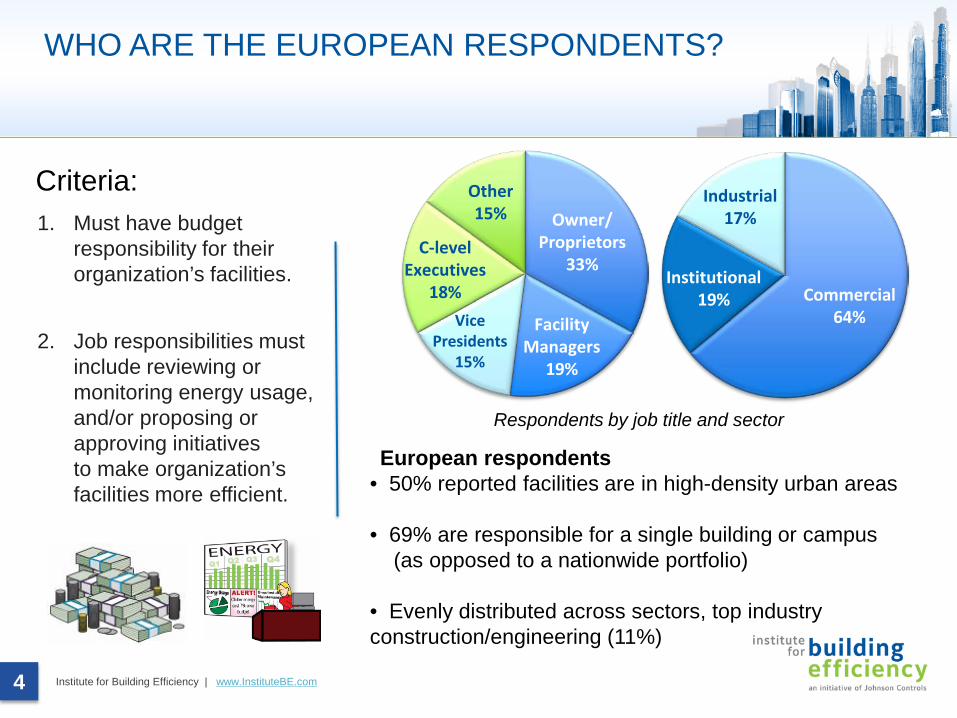
WHO ARE THE EUROPEAN RESPONDENTS?
1. Must have budget responsibility for their organization’s facilities.
2. Job responsibilities must include reviewing or monitoring energy usage, and/or proposing or approving initiatives to make organization’s facilities more efficient.
Criteria:
Respondents by job title and sector
European respondents• 50% reported facilities are in high-density urban areas
• 69% are responsible for a single building or campus (as opposed to a nationwide portfolio)
• Evenly distributed across sectors, top industry construction/engineering (11%)
Owner/Proprietors
33%
Facility Managers
19%
Vice Presidents
15%
C-level Executives
18%
Other15%
Commercial 64%
Institutional 19%
Industrial17%
Institute for Building Efficiency | www.InstituteBE.com5
ENERGY EFFICIENCY MOVING FORWARD IN EUROPEChallenges and opportunities remain
1. Steady growthThe 2011 survey shows an increasing emphasis on managing energy, driven by market and policy conditions
2. Energy efficiency in motionRespondents are taking concrete actions to increase efficiency and government policy is making an impact on decisions.
3. Challenges and opportunitiesThere continue to be significant barriers to pursuing energy efficiency in European buildings. Financial capital and human capital are limitations.
Institute for Building Efficiency | www.InstituteBE.com
ENERGY EFFICIENCY INDICATOR2011 EUROPE RESULTS
Steady Growth for Clean Energy
6
Institute for Building Efficiency | www.InstituteBE.com7
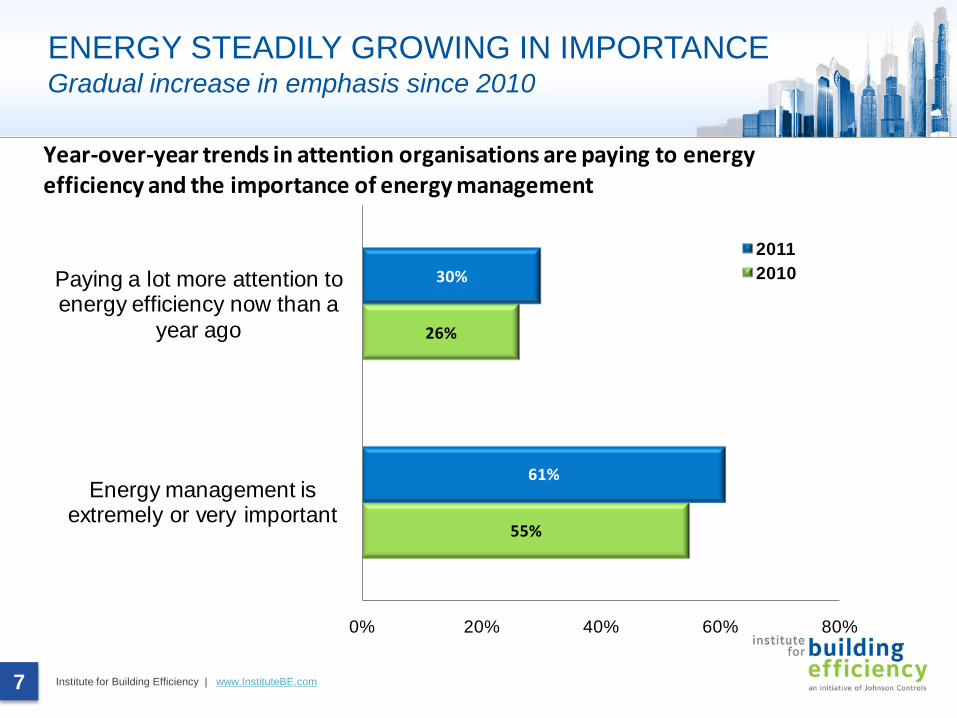
ENERGY STEADILY GROWING IN IMPORTANCEGradual increase in emphasis since 2010
55%
26%
61%
30%
0% 20% 40% 60% 80%
Energy management is extremely or very important
Paying a lot more attention to energy efficiency now than a
year ago
20112010
Year-over-year trends in attention organisations are paying to energy efficiency and the importance of energy management
Institute for Building Efficiency | www.InstituteBE.com8
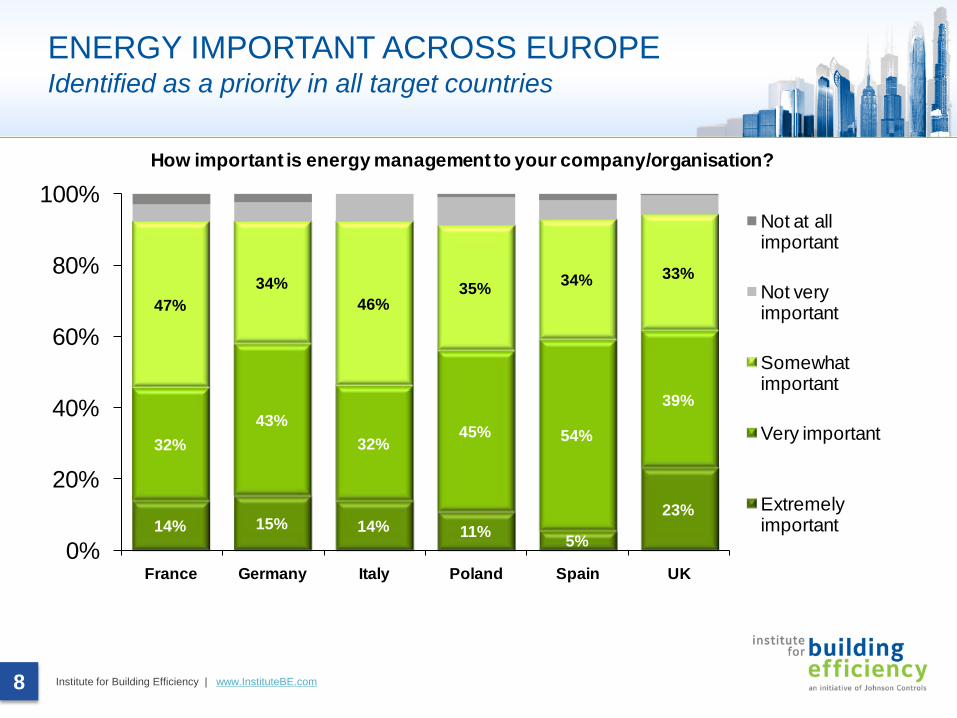
ENERGY IMPORTANT ACROSS EUROPEIdentified as a priority in all target countries
14% 15% 14% 11% 5%
23%
32%43%
32%45% 54%
39%
47%34%
46%35% 34% 33%
0%
20%
40%
60%
80%
100%
France Germany Italy Poland Spain UK
Not at all important
Not very important
Somewhat important
Very important
Extremely important
How important is energy management to your company/organisation?
Institute for Building Efficiency | www.InstituteBE.com9
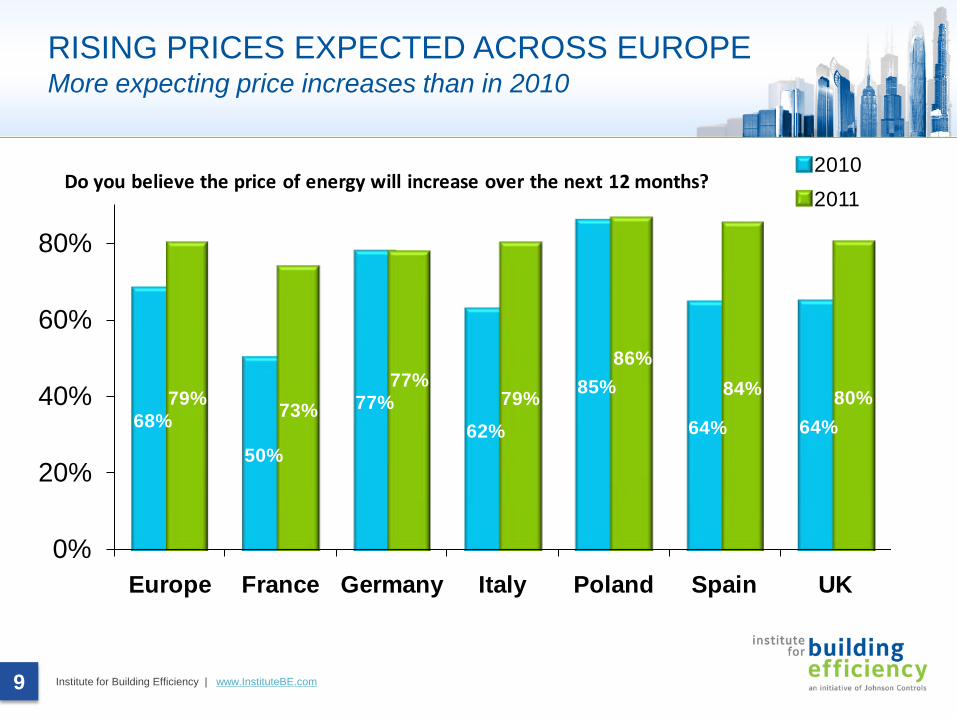
RISING PRICES EXPECTED ACROSS EUROPEMore expecting price increases than in 2010
68%
50%
77%62%
85%
64% 64%79% 73%
77%79%
86%84% 80%
0%
20%
40%
60%
80%
Europe France Germany Italy Poland Spain UK
20102011
Do you believe the price of energy will increase over the next 12 months?
Institute for Building Efficiency | www.InstituteBE.com10
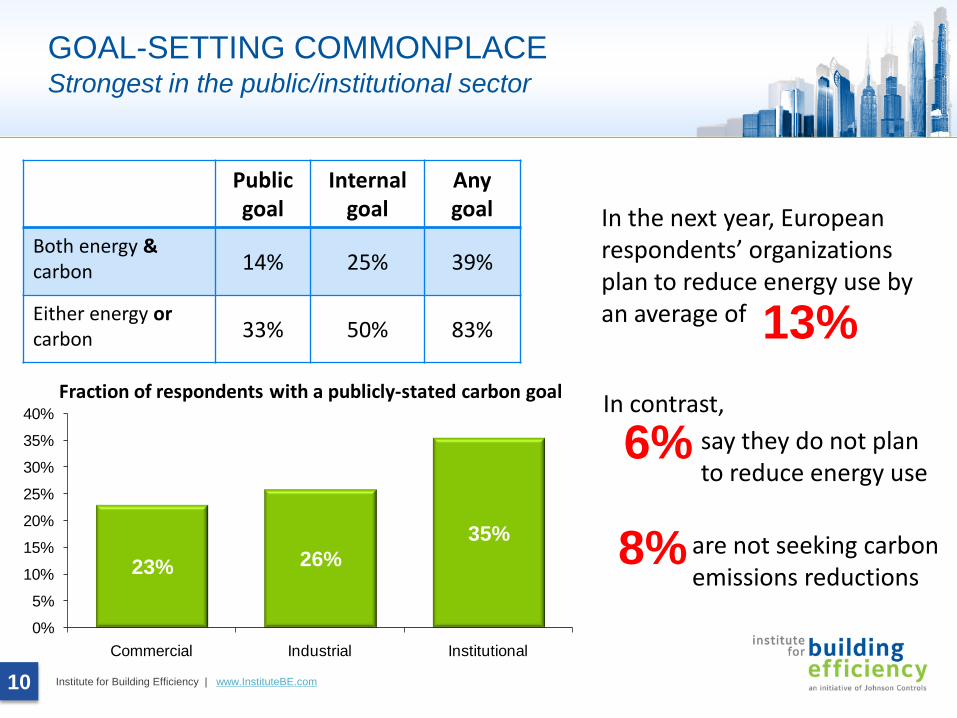
GOAL-SETTING COMMONPLACEStrongest in the public/institutional sector
Public goal
Internal goal
Anygoal
Both energy &carbon 14% 25% 39%
Either energy orcarbon 33% 50% 83%
In the next year, European respondents’ organizations plan to reduce energy use by an average of 13%
say they do not plan to reduce energy use
6%
are not seeking carbon emissions reductions
8%
In contrast,
23% 26%35%
0%
5%
10%
15%
20%
25%
30%
35%
40%
Commercial Industrial Institutional
Fraction of respondents with a publicly-stated carbon goal
Institute for Building Efficiency | www.InstituteBE.com11
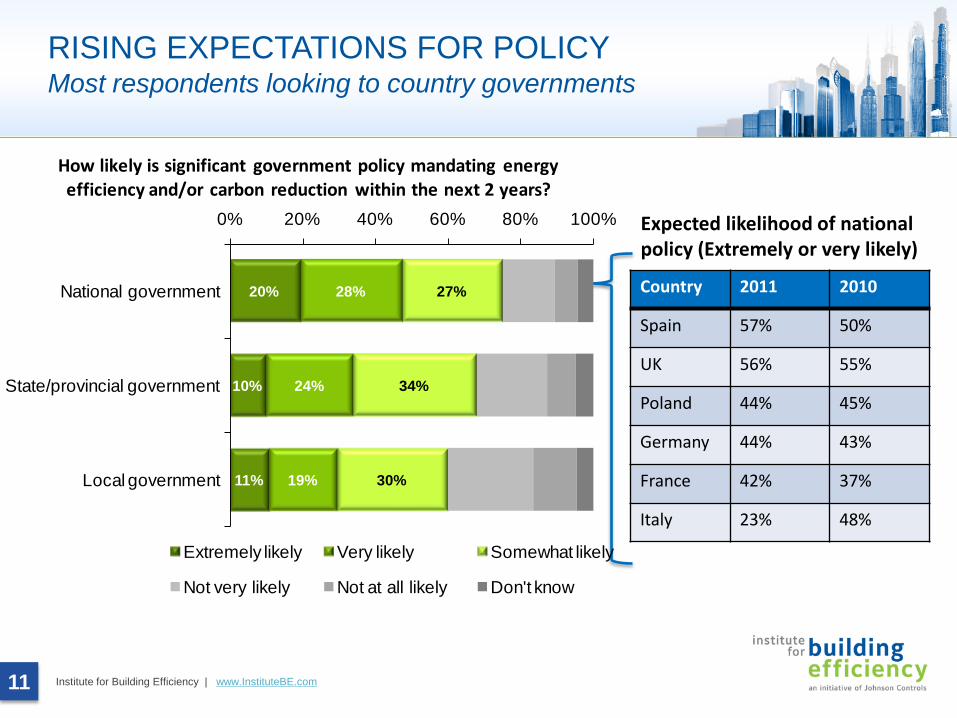
RISING EXPECTATIONS FOR POLICYMost respondents looking to country governments
Expected likelihood of national policy (Extremely or very likely)
Country 2011 2010
Spain 57% 50%
UK 56% 55%
Poland 44% 45%
Germany 44% 43%
France 42% 37%
Italy 23% 48%
20%
10%
11%
28%
24%
19%
27%
34%
30%
0% 20% 40% 60% 80% 100%
National government
State/provincial government
Local government
Extremely likely Very likely Somewhat likely
Not very likely Not at all likely Don't know
How likely is significant government policy mandating energy efficiency and/or carbon reduction within the next 2 years?
Institute for Building Efficiency | www.InstituteBE.com
ENERGY EFFICIENCY INDICATOR2011 EUROPE RESULTS
Energy Efficiency In Motion
12
Institute for Building Efficiency | www.InstituteBE.com13
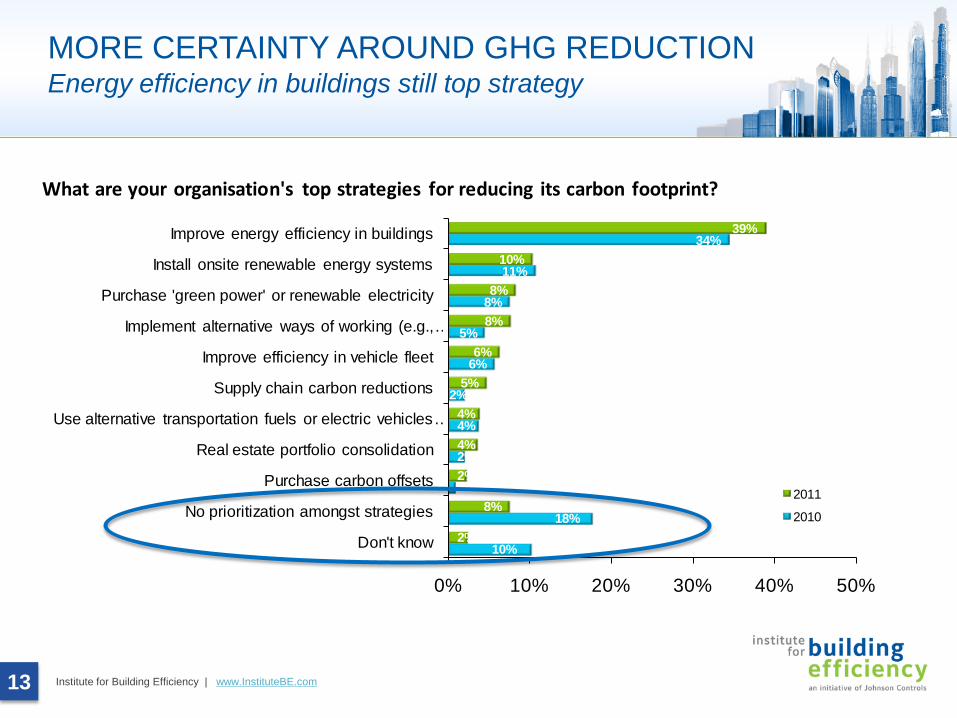
MORE CERTAINTY AROUND GHG REDUCTIONEnergy efficiency in buildings still top strategy
10%
18%
1%
2%
4%
2%
6%
5%
8%
11%
34%
2%
8%
2%
4%
4%
5%
6%
8%
8%
10%
39%
0% 10% 20% 30% 40% 50%
Don't know
No prioritization amongst strategies
Purchase carbon offsets
Real estate portfolio consolidation
Use alternative transportation fuels or electric vehicles …
Supply chain carbon reductions
Improve efficiency in vehicle fleet
Implement alternative ways of working (e.g., …
Purchase 'green power' or renewable electricity
Install onsite renewable energy systems
Improve energy efficiency in buildings
2011
2010
What are your organisation's top strategies for reducing its carbon footprint?
Institute for Building Efficiency | www.InstituteBE.com14
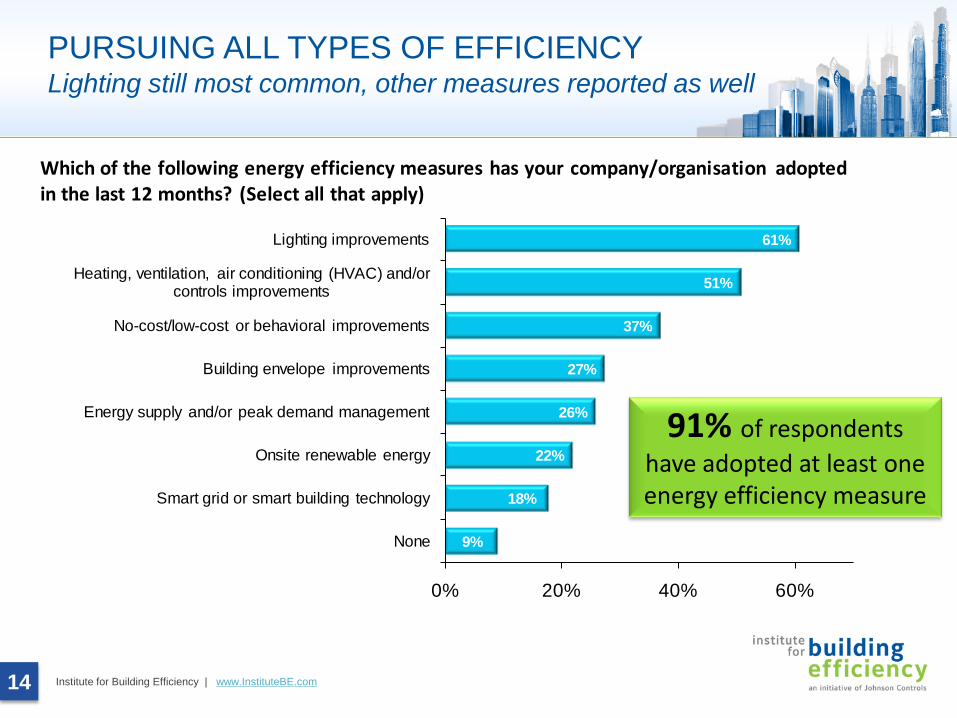
PURSUING ALL TYPES OF EFFICIENCYLighting still most common, other measures reported as well
91% of respondents have adopted at least one energy efficiency measure
9%
18%
22%
26%
27%
37%
51%
61%
0% 20% 40% 60%
None
Smart grid or smart building technology
Onsite renewable energy
Energy supply and/or peak demand management
Building envelope improvements
No-cost/low-cost or behavioral improvements
Heating, ventilation, air conditioning (HVAC) and/or controls improvements
Lighting improvements
Which of the following energy efficiency measures has your company/organisation adopted in the last 12 months? (Select all that apply)
Institute for Building Efficiency | www.InstituteBE.com15
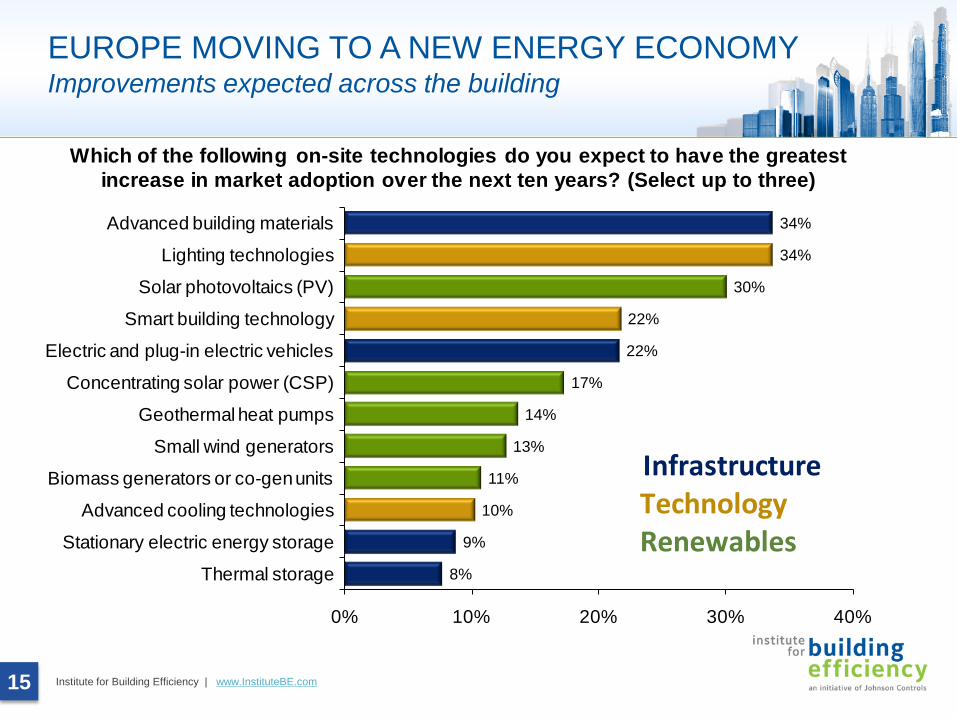
EUROPE MOVING TO A NEW ENERGY ECONOMYImprovements expected across the building
8%
9%
10%
11%
13%
14%
17%
22%
22%
30%
34%
34%
0% 10% 20% 30% 40%
Thermal storage
Stationary electric energy storage
Advanced cooling technologies
Biomass generators or co-gen units
Small wind generators
Geothermal heat pumps
Concentrating solar power (CSP)
Electric and plug-in electric vehicles
Smart building technology
Solar photovoltaics (PV)
Lighting technologies
Advanced building materials
Which of the following on-site technologies do you expect to have the greatest increase in market adoption over the next ten years? (Select up to three)
InfrastructureTechnologyRenewables
Institute for Building Efficiency | www.InstituteBE.com16
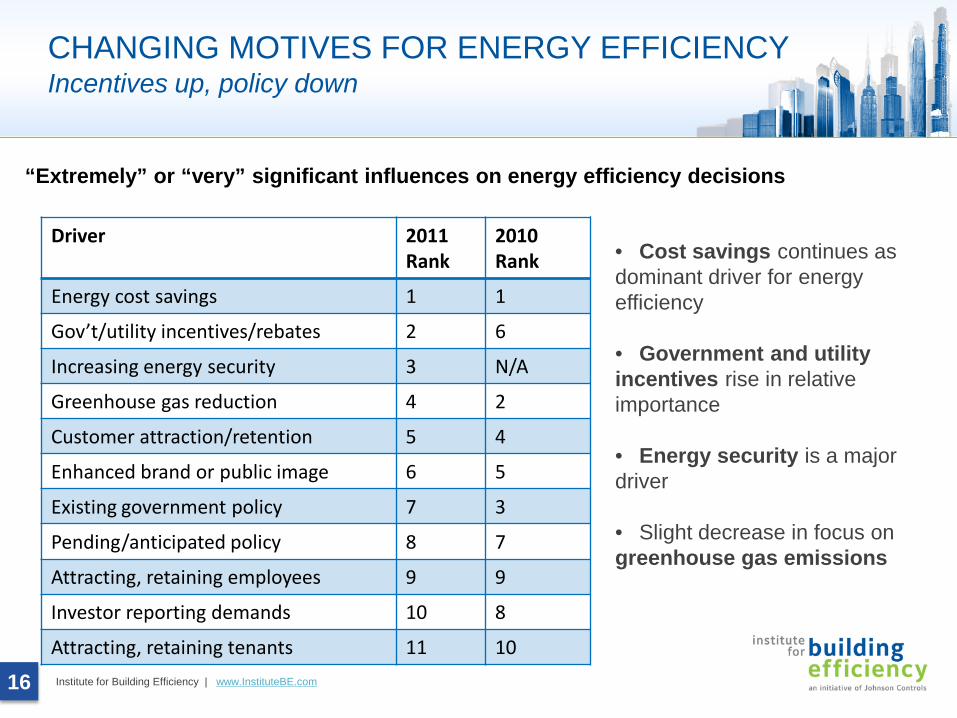
CHANGING MOTIVES FOR ENERGY EFFICIENCYIncentives up, policy down
Driver 2011 Rank
2010 Rank
Energy cost savings 1 1
Gov’t/utility incentives/rebates 2 6
Increasing energy security 3 N/A
Greenhouse gas reduction 4 2
Customer attraction/retention 5 4
Enhanced brand or public image 6 5
Existing government policy 7 3
Pending/anticipated policy 8 7
Attracting, retaining employees 9 9
Investor reporting demands 10 8
Attracting, retaining tenants 11 10
“Extremely” or “very” significant influences on energy efficiency decisions
• Cost savings continues as dominant driver for energy efficiency
• Government and utility incentives rise in relative importance
• Energy security is a major driver
• Slight decrease in focus on greenhouse gas emissions
Institute for Building Efficiency | www.InstituteBE.com17
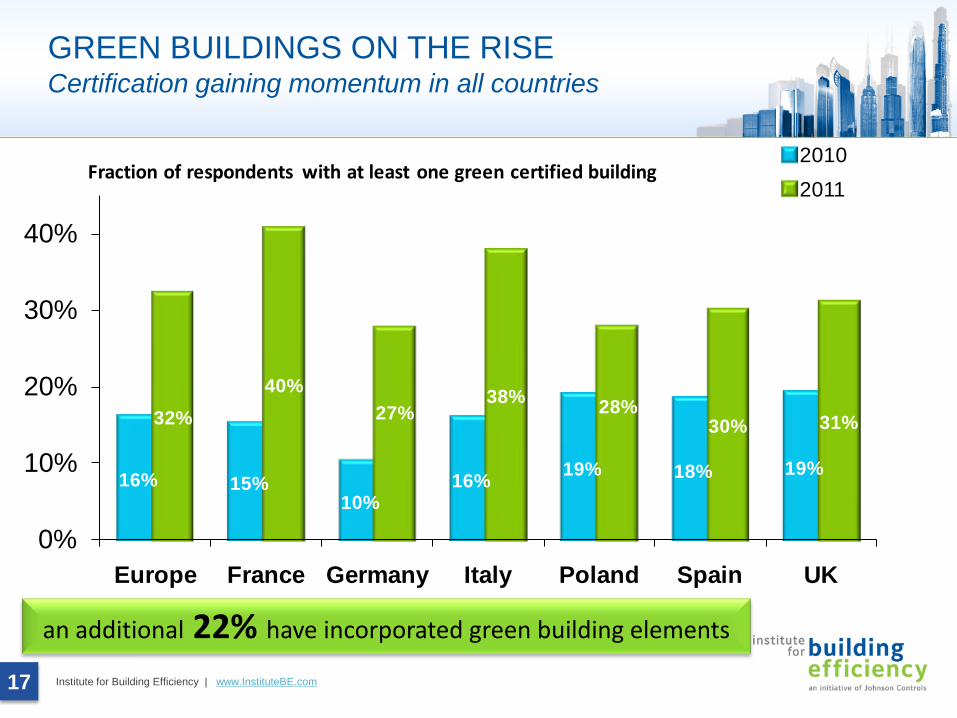
GREEN BUILDINGS ON THE RISECertification gaining momentum in all countries
an additional 22% have incorporated green building elements
16% 15%10%
16% 19% 18% 19%
32%40%
27%38% 28%
30% 31%
0%
10%
20%
30%
40%
Europe France Germany Italy Poland Spain UK
20102011
Fraction of respondents with at least one green certified building
Institute for Building Efficiency | www.InstituteBE.com
ENERGY EFFICIENCY INDICATOR 2011 EUROPE RESULTS
Challenges and Solutions
18
Institute for Building Efficiency | www.InstituteBE.com19
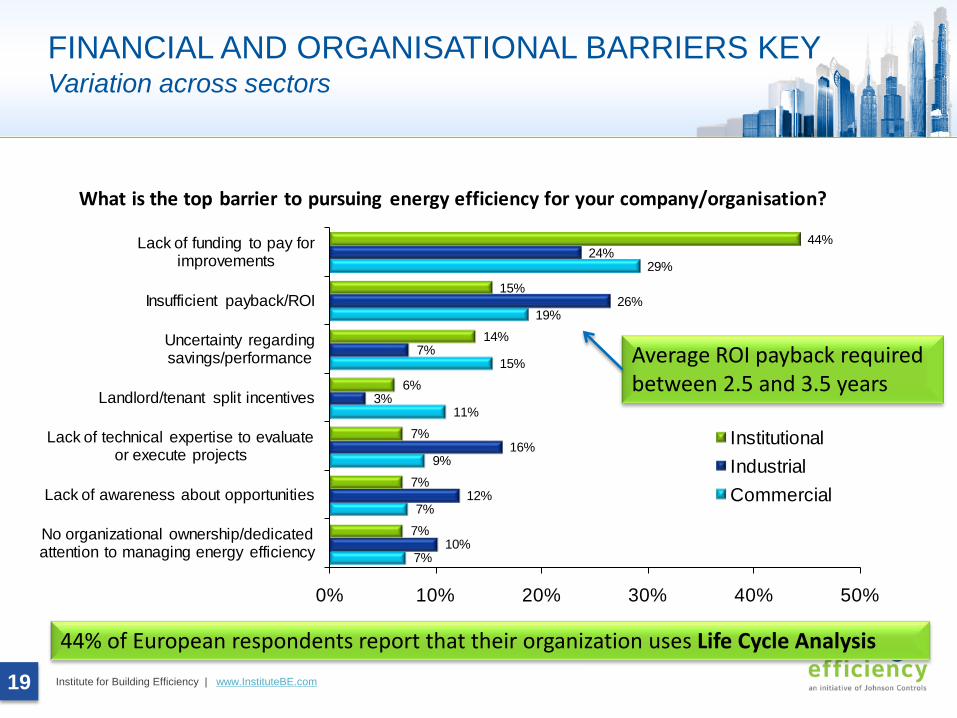
FINANCIAL AND ORGANISATIONAL BARRIERS KEYVariation across sectors
Average ROI payback required between 2.5 and 3.5 years
44% of European respondents report that their organization uses Life Cycle Analysis
7%
7%
9%
11%
15%
19%
29%
10%
12%
16%
3%
7%
26%
24%
7%
7%
7%
6%
14%
15%
44%
0% 10% 20% 30% 40% 50%
No organizational ownership/dedicated attention to managing energy efficiency
Lack of awareness about opportunities
Lack of technical expertise to evaluate or execute projects
Landlord/tenant split incentives
Uncertainty regarding savings/performance
Insufficient payback/ROI
Lack of funding to pay for improvements
InstitutionalIndustrialCommercial
What is the top barrier to pursuing energy efficiency for your company/organisation?
Institute for Building Efficiency | www.InstituteBE.com20
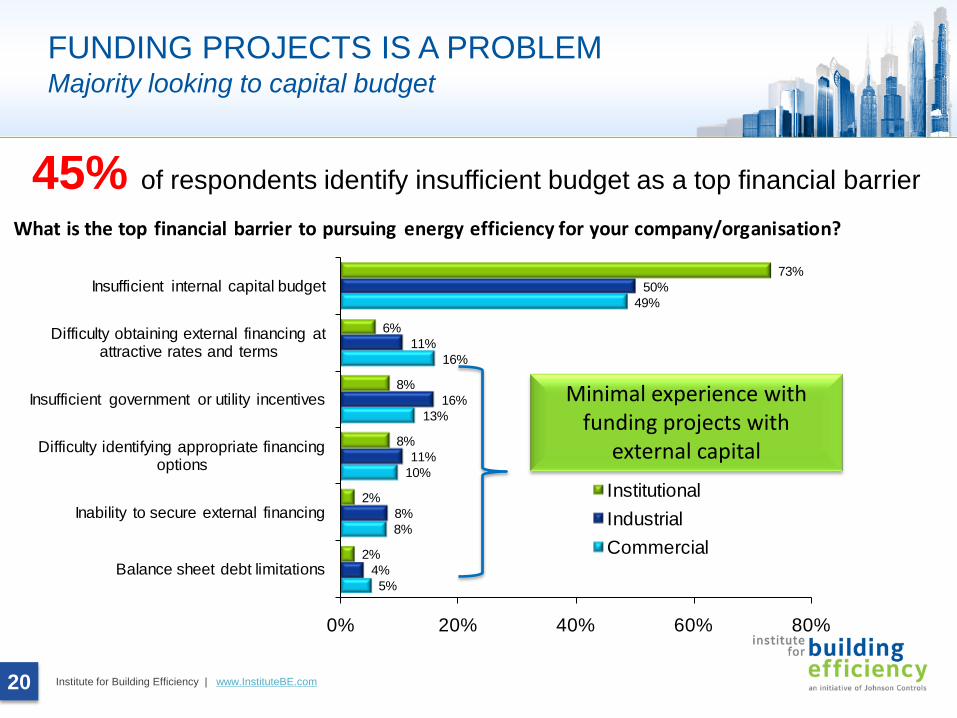
FUNDING PROJECTS IS A PROBLEMMajority looking to capital budget
45% of respondents identify insufficient budget as a top financial barrier
Minimal experience with funding projects with
external capital
5%
8%
10%
13%
16%
49%
4%
8%
11%
16%
11%
50%
2%
2%
8%
8%
6%
73%
0% 20% 40% 60% 80%
Balance sheet debt limitations
Inability to secure external financing
Difficulty identifying appropriate financing options
Insufficient government or utility incentives
Difficulty obtaining external financing at attractive rates and terms
Insufficient internal capital budget
InstitutionalIndustrialCommercial
What is the top financial barrier to pursuing energy efficiency for your company/organisation?
Institute for Building Efficiency | www.InstituteBE.com21
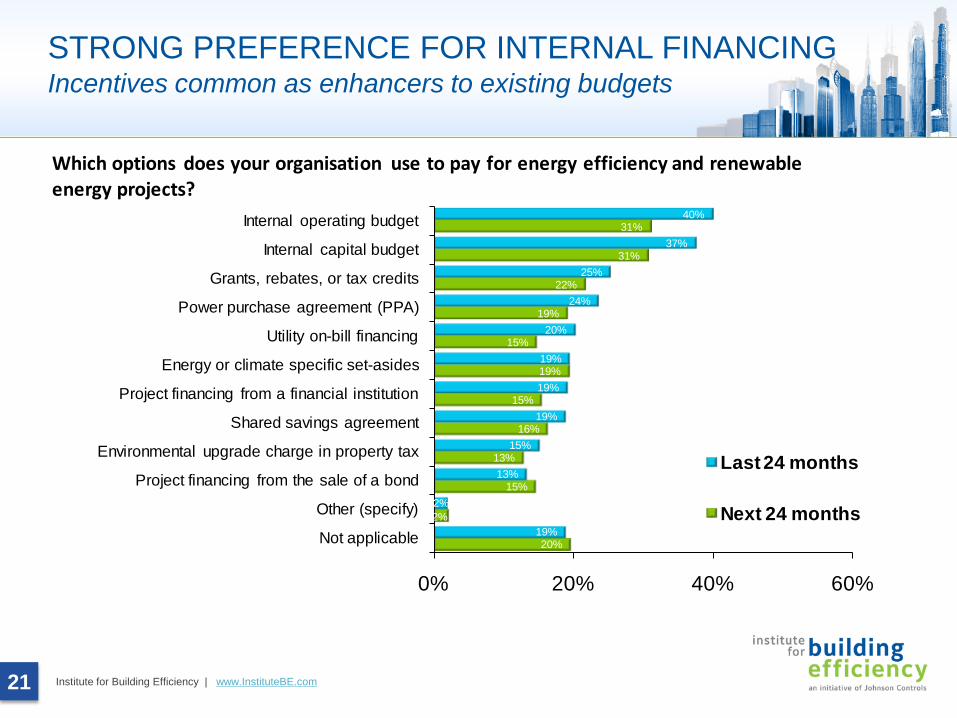
STRONG PREFERENCE FOR INTERNAL FINANCINGIncentives common as enhancers to existing budgets
20%
2%
15%
13%
16%
15%
19%
15%
19%
22%
31%
31%
19%
2%
13%
15%
19%
19%
19%
20%
24%
25%
37%
40%
0% 20% 40% 60%
Not applicable
Other (specify)
Project financing from the sale of a bond
Environmental upgrade charge in property tax
Shared savings agreement
Project financing from a financial institution
Energy or climate specific set-asides
Utility on-bill financing
Power purchase agreement (PPA)
Grants, rebates, or tax credits
Internal capital budget
Internal operating budget
Last 24 months
Next 24 months
Which options does your organisation use to pay for energy efficiency and renewable energy projects?
Institute for Building Efficiency | www.InstituteBE.com22
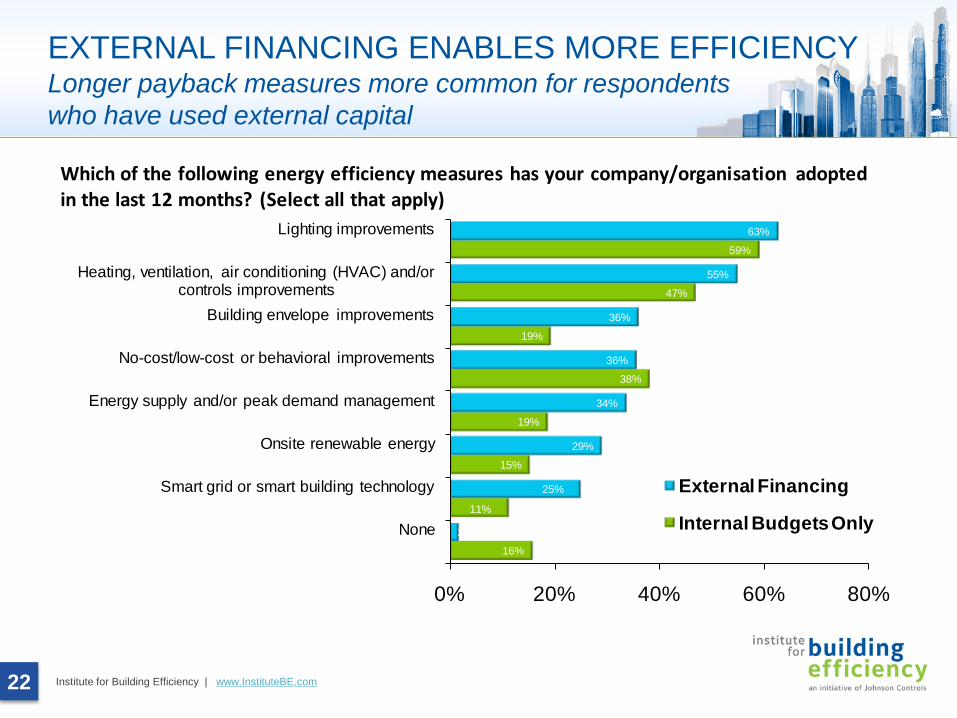
EXTERNAL FINANCING ENABLES MORE EFFICIENCYLonger payback measures more common for respondents who have used external capital
16%
11%
15%
19%
38%
19%
47%
59%
2%
25%
29%
34%
36%
36%
55%
63%
0% 20% 40% 60% 80%
None
Smart grid or smart building technology
Onsite renewable energy
Energy supply and/or peak demand management
No-cost/low-cost or behavioral improvements
Building envelope improvements
Heating, ventilation, air conditioning (HVAC) and/or controls improvements
Lighting improvements
External Financing
Internal Budgets Only
Which of the following energy efficiency measures has your company/organisation adopted in the last 12 months? (Select all that apply)
Institute for Building Efficiency | www.InstituteBE.com23
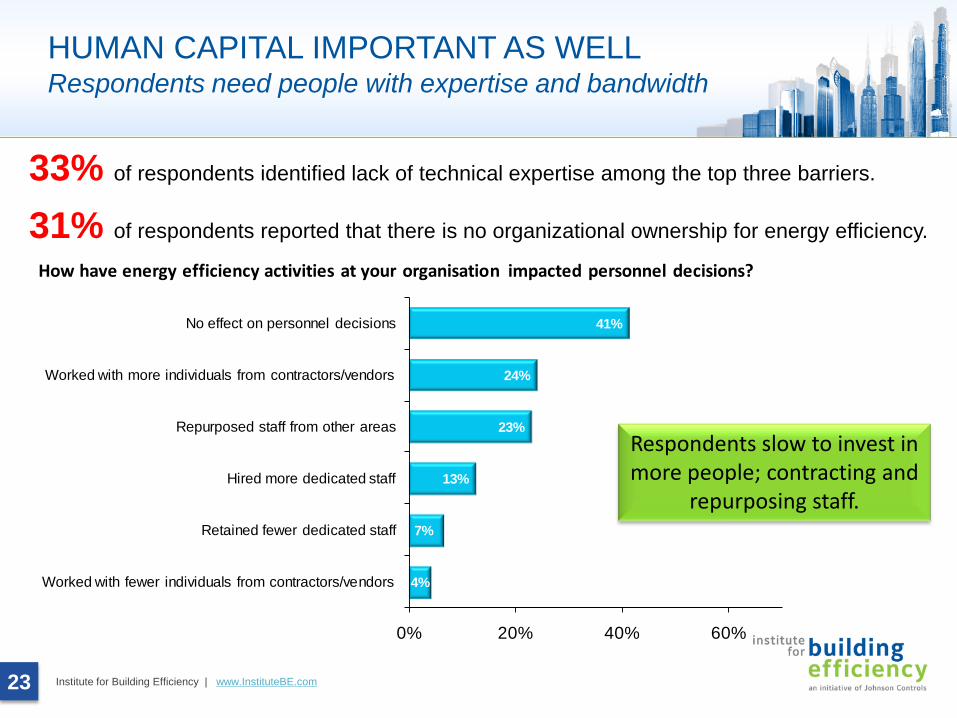
HUMAN CAPITAL IMPORTANT AS WELLRespondents need people with expertise and bandwidth
33% of respondents identified lack of technical expertise among the top three barriers.
31% of respondents reported that there is no organizational ownership for energy efficiency.
Respondents slow to invest in more people; contracting and
repurposing staff.
4%
7%
13%
23%
24%
41%
0% 20% 40% 60%
Worked with fewer individuals from contractors/vendors
Retained fewer dedicated staff
Hired more dedicated staff
Repurposed staff from other areas
Worked with more individuals from contractors/vendors
No effect on personnel decisions
How have energy efficiency activities at your organisation impacted personnel decisions?
Institute for Building Efficiency | www.InstituteBE.com24
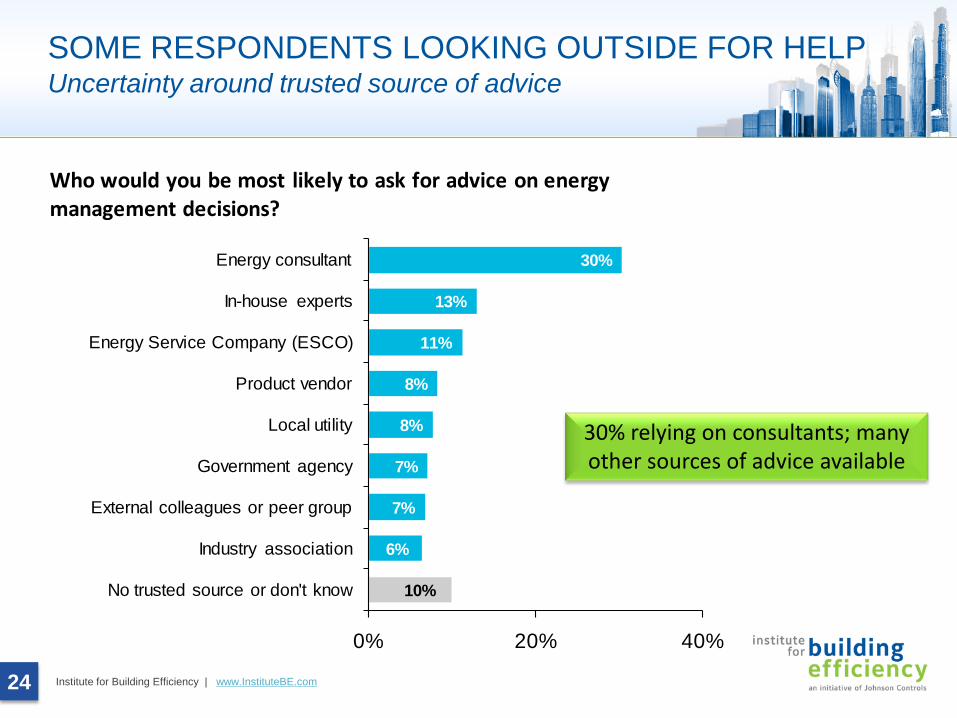
SOME RESPONDENTS LOOKING OUTSIDE FOR HELPUncertainty around trusted source of advice
10%
6%
7%
7%
8%
8%
11%
13%
30%
0% 20% 40%
No trusted source or don't know
Industry association
External colleagues or peer group
Government agency
Local utility
Product vendor
Energy Service Company (ESCO)
In-house experts
Energy consultant
Who would you be most likely to ask for advice on energy management decisions?
30% relying on consultants; many other sources of advice available
Institute for Building Efficiency | www.InstituteBE.com25
CONCLUSIONS AND IMPLICATIONS
1. Steady growthWidespread interest in energy, from market, technology and policy perspectives
2. Energy efficiency in motionClear signs of traction in green buildings, government incentives, and prioritization of strategies
3. Challenges and opportunities• Executives looking to internal funds, augmented by incentives
…Can external capital unlock more efficiency?• Need more people to do the work, but slow to hire
…Can external expertise be leveraged for more impact?