2011 michigan dairy farm business analysis summary · 2011 michigan dairy farm business analysis...
TRANSCRIPT
2011 Michigan Dairy Farm Business
Analysis Summary
Eric Wittenberg And
Christopher Wolf
Staff Paper 2012-07 October, 2012
Department of Agricultural, Food, and Resource Economics MICHIGAN STATE UNIVERSITY East Lansing, Michigan 48824 MSU is an Affirmative Action/Equal Opportunity Institution

1
2011 Michigan Dairy Farm Business Analysis Summary
Staff Paper No. 2012-07
October 2012
by
Eric Wittenberg and
Christopher Wolf
Copyright (c) 2012 by Eric Wittenberg and Christopher Wolf. Readers may make verbatim copies of this document for non-commercial purposes by any means, provided that this copyright notice appears on all such copies.

2
2011 Michigan Dairy Farm Business Analysis Summary Eric Wittenberg and Christopher Wolf1
Table of Contents Page Summary…………………………………………………………………… 3 List of Tables
Summary Tables 1. Average Farm Characteristics, 2007-2011………….… 3 2. Average Income Statement, 2007-2011………………… 3
3. Average Profitability Indicators, 2007-2011…………… 4 4. Average Income and Expenses--all herds……………… 5 5. Average Income and Expenses--herds with that item… 6
6. Average Income and Expenses, last five years………… 7 7. Characteristics by Herd Size……………………… 7
8. Income Statement by Herd Size……………………… 8 9. Profitability Indicators by Herd Size……………… 8
A) Financial Summary of Dairy farms, All Herd Sizes 10. Livestock, Crop Production and Marketing Summary… 9 11. Farm Income Statement…………………………. 10 12. Inventory Changes………………………….… 13 13. Depreciation and Other Capital Adjustment……. 14 14. Profitability Measures…………………………… 15 15. Liquidity & Repayment Capacity Measures………… 16 16. Balance Sheet at Cost Values…………………… 17 17. Balance sheet at Market Values………………… 18 18. Statement of Cash Flows……………………… 19 19. Financial Standards Measures………………… 20 20. Operator and Labor Information……….... 21 21. Financial Summary…………………………… 22 22. Summary Farm Income Statement……………. 23
B) Financial Summary of Dairy Farms with 40 to 99 Cows……… 24 Tables 23 to 35 C) Financial Summary of Dairy Farms with 100 to 249 Cows…… 39 Tables 36 to 48 D) Financial Summary of Dairy Farms with 250 to 449 Cows…. 54 Tables 49 to 61
E) Financial Summary of Dairy Farms with 450+ Cows….…. 69
Tables 62 to 74
1 Co-workers in the TelFarm project were: R. Betz, A. Kantrovich, L. Borton, P. Taylor, C. Talley, W. Schauer, D. Stein, K. Lee, and V. Varner with the assistance of Michigan State University Extension Educators. Greenstone Farm Credit Services co-workers were Kelly Tobin, Steve Eshelman, Janice Raymond, Anne Gerke, Sonya Pentecost, and Lynette Wood. Farm Credit Services of Wisconsin co-worker was Steve Zimmerman.

3
Summary
This report summarizes the financial and production records of 101 dairy farms from
throughout Michigan in 2011. To be included, the farms must have produced at least 50 percent of gross cash farm income from milk and dairy animal sales. The records came from Michigan State University’s TelFarm system and the Farm Credit Service system in Michigan. The values were pooled into averages for reporting purposes. The average herd included here is larger than would be the average dairy herd in Michigan. Average values are reported in the summary tables and discussion that follows but one should be aware that considerable variation across herds exists in virtually every measure.
In 2011, the average dairy farm in the business analysis had 303 cows producing an average of 22,340 pounds of milk per cow (Table 1). Milk price, based on gross income, averaged $20.65/cwt. Relative to 2010: average milk price increased $3.87/cwt., milk production remained constant or decreased slightly 105 pounds per cow, and average herd size increased 36 cows.
Table 1. Average Michigan Dairy Farm Business Analysis Characteristics, 2007-2011 2007 2008 2009 2010 2011
Average number of cows 217 230 243 267 303 Milk sold per cow (pounds) 21,415 20,849 21,503 22,445 22,340 Average price of milk sold ($/cwt) 20.21 19.41 13.31 16.78 20.65 Total acres owned 486 486 454 508 452 Total crop acres 811 827 862 805 736 Number of farms 132 116 104 90 101
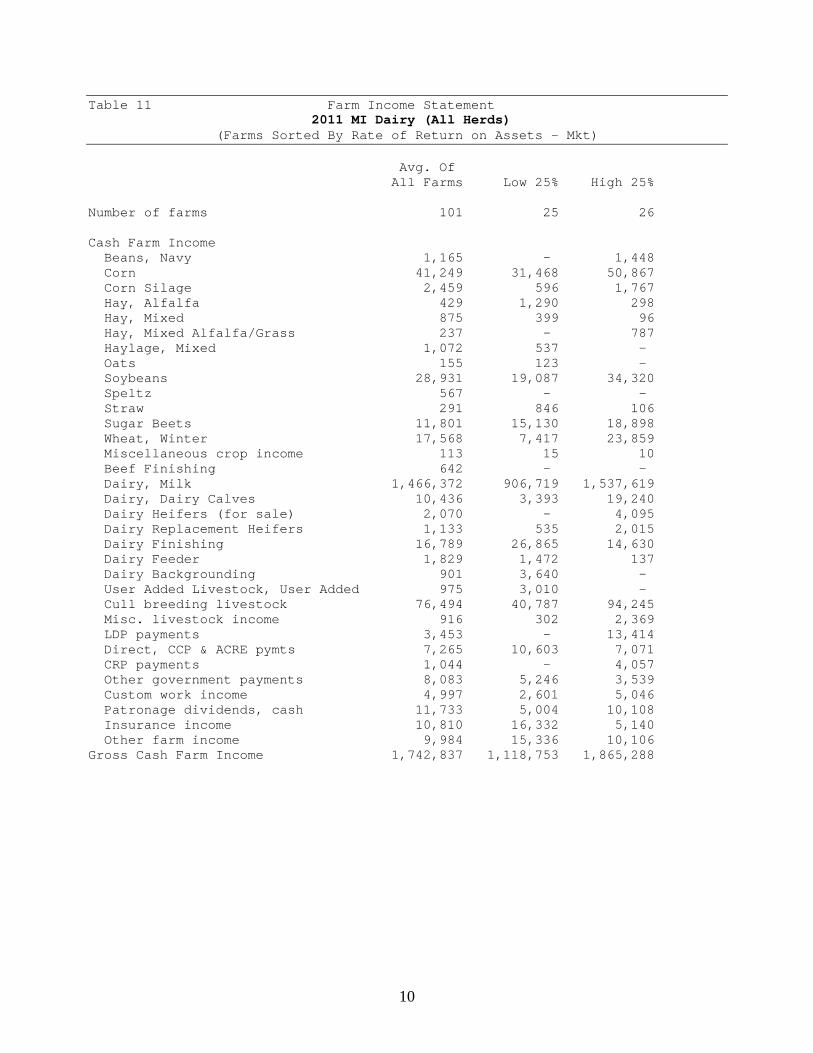
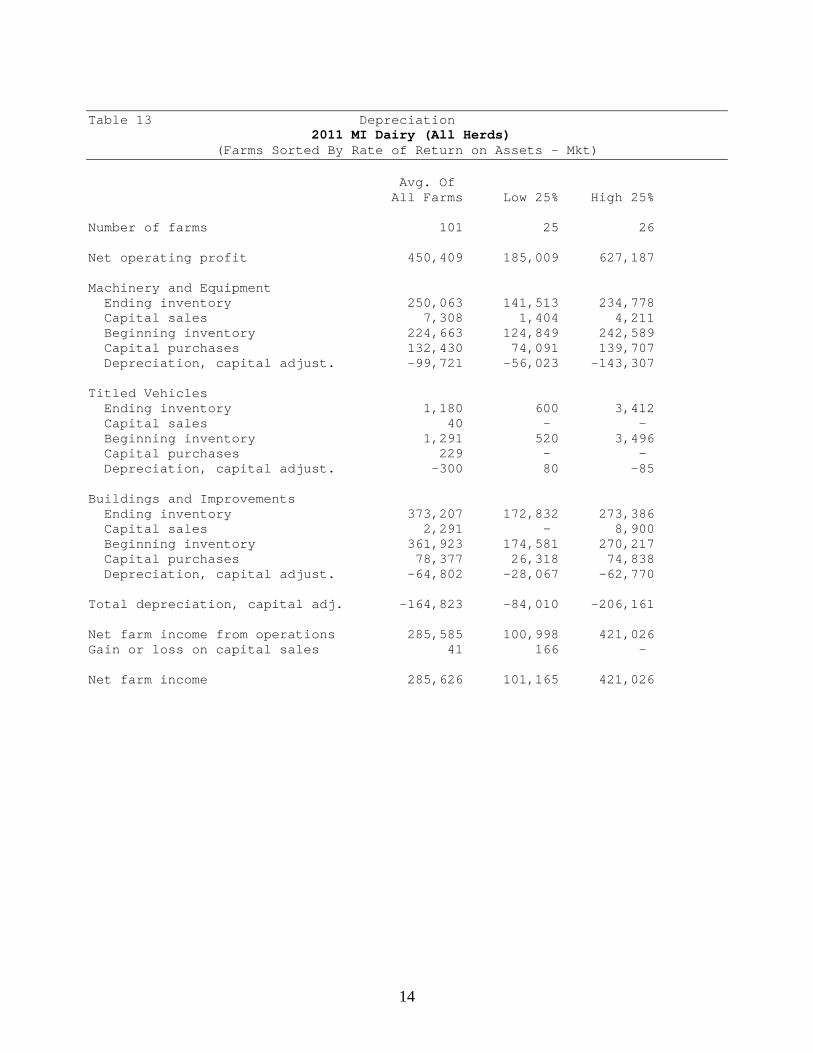
Net farm income is the return to operator unpaid management, labor and capital invested. Net farm income in 2011 averaged $285,626 which was a significant improvement over the 2008 to 2010 averages. Gross cash farm income for all farms averaged $1,742,837 in 2011. The largest component of these revenues was milk sales, which averaged $1,466,372. Sorted by rate of return on assets (market), the net farm income for the low 25% group averaged a $101,165 while the high 25% group averaged $421,026 a $319,861 difference.
Table 2. Average Michigan Dairy Farm Income Statement, 2007-2011 2007 2008 2009 2010 2011 ($) ($) ($) ($) Gross cash farm income 1,175,551 1,198,273 1,046,327 1,302,891 1,742,837- Total cash expense 949,092 959,454 937,998 1,095,827 1,408,613= Net cash farm income 226,460 238,819 108,329 207,064 334,224 + Inventory change* 94,623 2,498 -66,854 103,606 116,185 + Depreciation + capital adjust* -103,834 -127,093 -103,868 -115,560 -164,823 = Net farm income 217,248 114,224 -62,393 195,560 285,586
*Changes calculated as ending value minus beginning value.

4
To put the profit values in perspective, we calculate profitability ratios. Rate of return on assets (ROA) is the farm operating profit (equal to net farm income plus interest expense less value of operator labor and management) divided by average total farm asset value (valued at current market value). Rate of return on assets is a measure of how much profit the farm business assets generated. The average 2011 dairy farm ROA (market) was 11.2 percent. The average 2011 ROE (market) was 13.7 percent, with ROE greater then ROA an indicator of profits on borrowed money. Operating profit margin is the operating profit divided by gross revenues. Operating profit margin measures the dollars of profit generated per dollar of revenue. In 2011, Michigan dairy farms generated 33.5 cents of profit per dollar of revenue. Asset turnover (ATO) is gross farm revenue divided by average asset value. Asset turnover measures the efficiency with which farm assets generate revenue. The average ATO value was 33.3 percent in 2011.
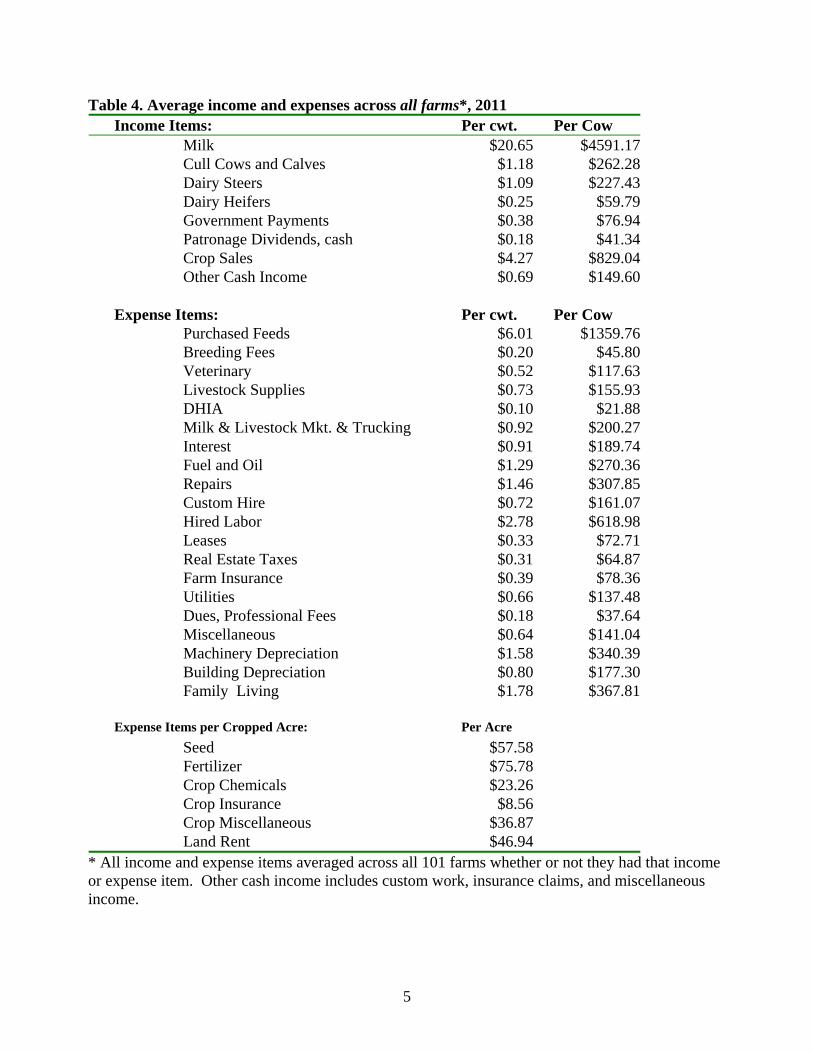
Table 3. Average Michigan Dairy Farm Profitability Indicators, 2007-2011 2007 2008 2009 2010 2011 (%) (%) (%) (%) (%) Rate of return on assets* 11.3 7.0 0.4 7.0 11.2 Rate of return on equity 13.3 7.5 -1.6 7.7 13.7 Operating profit margin 33.1 23.1 1.8 23.9 33.5 Asset turnover rate* 34.1 30.5 22.5 29.2 33.3 * Assets valued at market value. Tables 4 and 5 display average income and expenses per hundredweight (cwt) of milk and per cow. Income and expenses were adjusted to an accrual basis. Average, accrual adjusted income and expenses per cropped acre were also included. Government payments include all farm government payments as it was not possible to separate crop from dairy payments. Table 4 contains the average income and expense items across all 101 dairy farms in the 2011 summary while Table 5 displays the average income and expense items for farms that reported that item. For example, all farms had milk income so that income is identical in both tables. In contrast, only some farms reported DHIA expense so that item is larger when averaged only across those farms with that expense. These tables should not be interpreted as an estimate of the true cost of producing milk. Income related to the milking herd and cash crop sales are reported in Tables 4 and 5. Unpaid factors, including labor, management and capital, are not accounted for in the expense items. In addition, the allocation of resources amongst farm enterprises is not accurately reflected leaving the milking herd as the residual claimant on all expenses (especially labor costs).
The bottom section of Tables 4 and 5 presents crop related expenses divided by the total cropped acres. Again, these values should not be interpreted as cost of crop production--to accurately calculate a crop cost of production requires labor and management (among other) expenses that could not be separated out in these financial records.
5
Table 4. Average income and expenses across all farms*, 2011 Income Items: Per cwt. Per Cow
Milk $20.65 $4591.17Cull Cows and Calves $1.18 $262.28Dairy Steers $1.09 $227.43Dairy Heifers $0.25 $59.79Government Payments $0.38 $76.94Patronage Dividends, cash $0.18 $41.34Crop Sales $4.27 $829.04Other Cash Income $0.69 $149.60
Expense Items: Per cwt. Per Cow Purchased Feeds $6.01 $1359.76Breeding Fees $0.20 $45.80Veterinary $0.52 $117.63Livestock Supplies $0.73 $155.93DHIA $0.10 $21.88Milk & Livestock Mkt. & Trucking $0.92 $200.27Interest $0.91 $189.74Fuel and Oil $1.29 $270.36Repairs $1.46 $307.85Custom Hire $0.72 $161.07Hired Labor $2.78 $618.98Leases $0.33 $72.71Real Estate Taxes $0.31 $64.87Farm Insurance $0.39 $78.36Utilities $0.66 $137.48Dues, Professional Fees $0.18 $37.64Miscellaneous $0.64 $141.04Machinery Depreciation $1.58 $340.39Building Depreciation $0.80 $177.30Family Living $1.78 $367.81
Expense Items per Cropped Acre: Per Acre Seed $57.58Fertilizer $75.78Crop Chemicals $23.26Crop Insurance $8.56Crop Miscellaneous $36.87Land Rent $46.94
* All income and expense items averaged across all 101 farms whether or not they had that income or expense item. Other cash income includes custom work, insurance claims, and miscellaneous income.

6
Table 5. Average income and expenses across farms with that item*, 2011 Income Items: Per cwt. Per Cow
Milk $20.65 $4591.17Cull Cows and Calves $1.22 $270.31Dairy Steers $3.55 $854.52Dairy Heifers $0.52 $123.24Government Payments $0.41 $82.67Patronage Dividends, cash $0.23 $52.19Crop Sales $6.84 $1329.09Other Cash Income $0.77 $167.88
Expense Items: Per cwt. Per Cow Purchased Feeds $6.01 $1359.76Breeding Fees $0.23 $53.79Veterinary $0.52 $117.63Livestock Supplies $0.78 $165.78DHIA $0.18 $40.18Milk & Livestock Mkt. & Trucking $0.92 $200.27Interest $0.98 $203.87Fuel and Oil $1.29 $270.36Repairs $1.46 $307.85Custom Hire $0.80 $178.77Hired Labor $2.92 $651.22Leases $0.55 $120.39Real Estate Taxes $0.34 $70.45Farm Insurance $0.39 $78.36Utilities $0.66 $137.48Dues, Professional Fees $0.19 $39.01Miscellaneous $0.64 $141.04Machinery Depreciation $1.58 $340.39Building Depreciation $0.80 $177.30Family Living $1.78 $367.81
Expense Items per Cropped Acre: Per AcreSeed $59.34Fertilizer $84.11Crop Chemicals $27.01Crop Insurance $18.39Crop Miscellaneous $36.87Land Rent $50.98
* Income and expense items averaged only across farms with that item.
7
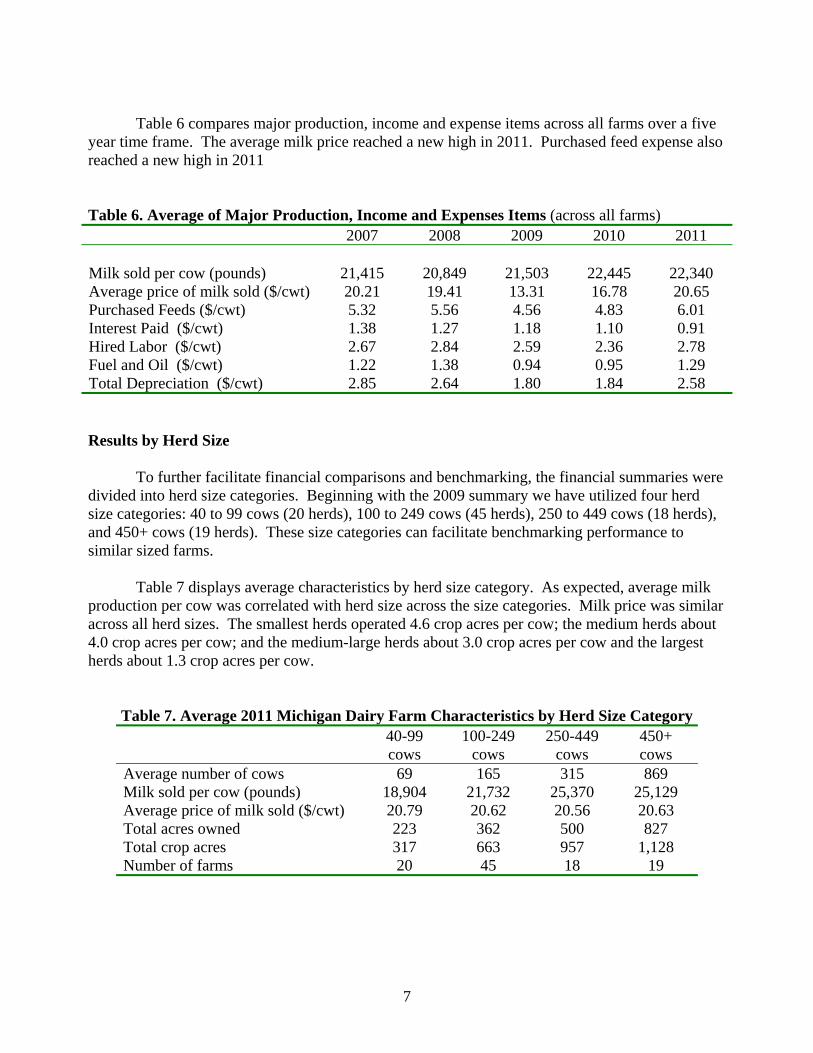
Table 6 compares major production, income and expense items across all farms over a five
year time frame. The average milk price reached a new high in 2011. Purchased feed expense also reached a new high in 2011 Table 6. Average of Major Production, Income and Expenses Items (across all farms)
2007 2008 2009 2010 2011 Milk sold per cow (pounds) 21,415 20,849 21,503 22,445 22,340 Average price of milk sold ($/cwt) 20.21 19.41 13.31 16.78 20.65 Purchased Feeds ($/cwt) 5.32 5.56 4.56 4.83 6.01 Interest Paid ($/cwt) 1.38 1.27 1.18 1.10 0.91 Hired Labor ($/cwt) 2.67 2.84 2.59 2.36 2.78 Fuel and Oil ($/cwt) 1.22 1.38 0.94 0.95 1.29 Total Depreciation ($/cwt) 2.85 2.64 1.80 1.84 2.58 Results by Herd Size
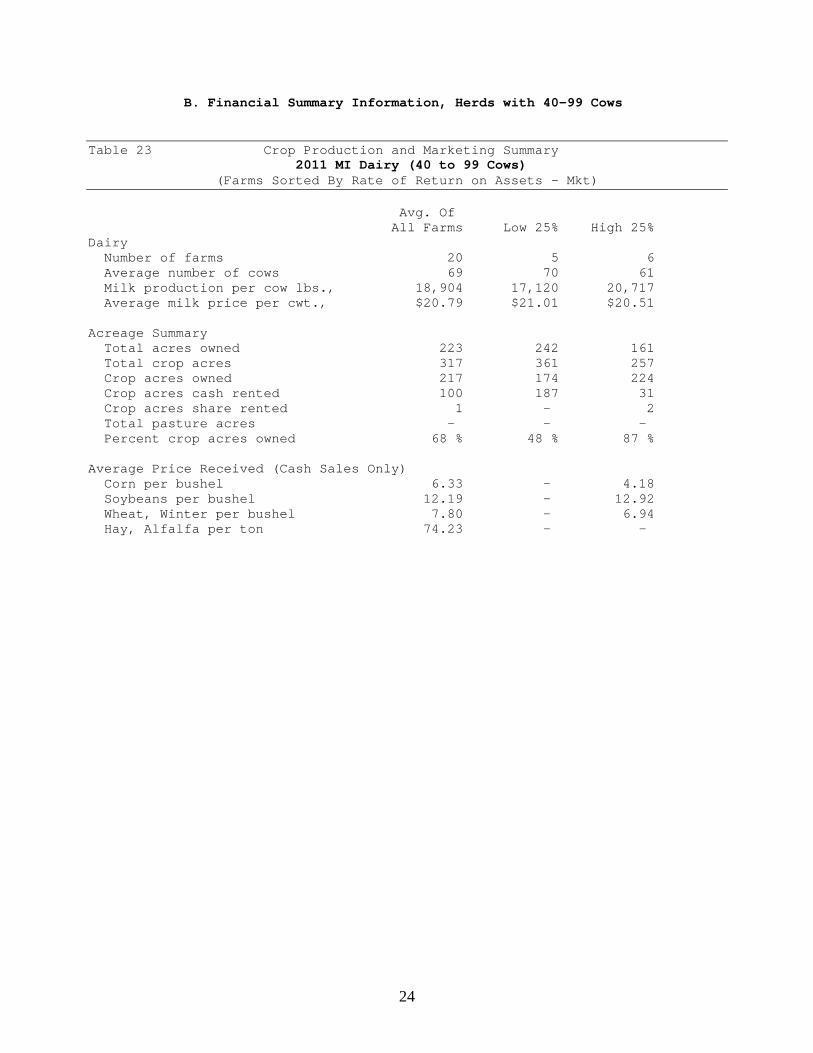
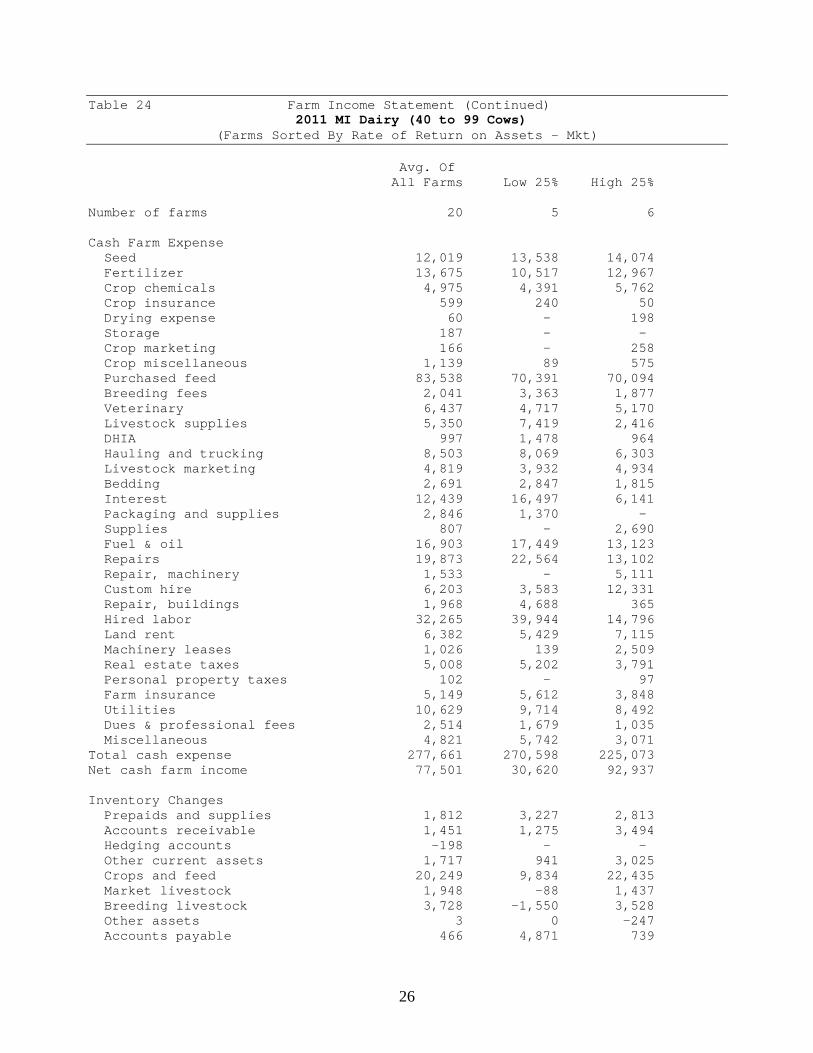
To further facilitate financial comparisons and benchmarking, the financial summaries were divided into herd size categories. Beginning with the 2009 summary we have utilized four herd size categories: 40 to 99 cows (20 herds), 100 to 249 cows (45 herds), 250 to 449 cows (18 herds), and 450+ cows (19 herds). These size categories can facilitate benchmarking performance to similar sized farms. Table 7 displays average characteristics by herd size category. As expected, average milk production per cow was correlated with herd size across the size categories. Milk price was similar across all herd sizes. The smallest herds operated 4.6 crop acres per cow; the medium herds about 4.0 crop acres per cow; and the medium-large herds about 3.0 crop acres per cow and the largest herds about 1.3 crop acres per cow.
Table 7. Average 2011 Michigan Dairy Farm Characteristics by Herd Size Category 40-99
cows 100-249
cows 250-449
cows 450+ cows
Average number of cows 69 165 315 869 Milk sold per cow (pounds) 18,904 21,732 25,370 25,129 Average price of milk sold ($/cwt) 20.79 20.62 20.56 20.63 Total acres owned 223 362 500 827 Total crop acres 317 663 957 1,128 Number of farms 20 45 18 19

8
Table 8 displays the average farm income statement by herd size. Net farm income represents the returns to unpaid factors (i.e., labor, management and equity capital). All herd sizes recorded a positive net income for 2011. Table 8. Average 2011 Michigan Dairy Farm Income Statement by Herd Size
40-99 cows
100-249 cows
250-449 cows
450+ cows
($) ($) ($) ($) Gross cash farm income 355,162 909,577 1,963,964 5,036,463 - Total cash expense 277,661 723,307 1,548,008 4,139,222 = Net cash farm income 77,501 186,269 415,956 897,241 + Inventory change * 31,401 38,906 182,800 323,443 + Depreciation and capital adjustments* -31,612 -78,470 -179,759 -506,362 = Net farm income 77,290 146,798 418,996 712,322
*Changes calculated as ending value minus beginning value. Table 9 compares profitability measures across herd size with assets valued at market value. All herd sizes realized positive values in 2011. Table 9. Average 2011 Michigan Dairy Farm Profitability Indicators by Herd Size
40-99 cows
100-249 cows
250-449 cows
450+ cows
(%) (%) (%) (%) Rate of return on assets* 10.5 8.8 12.0 12.1 Rate of return on equity 11.8 10.6 15.0 15.1 Operating profit margin 44.8 28.5 34.1 34.2 Asset turnover rate 23.5 31.1 35.3 35.3
* Assets valued at market value.
9
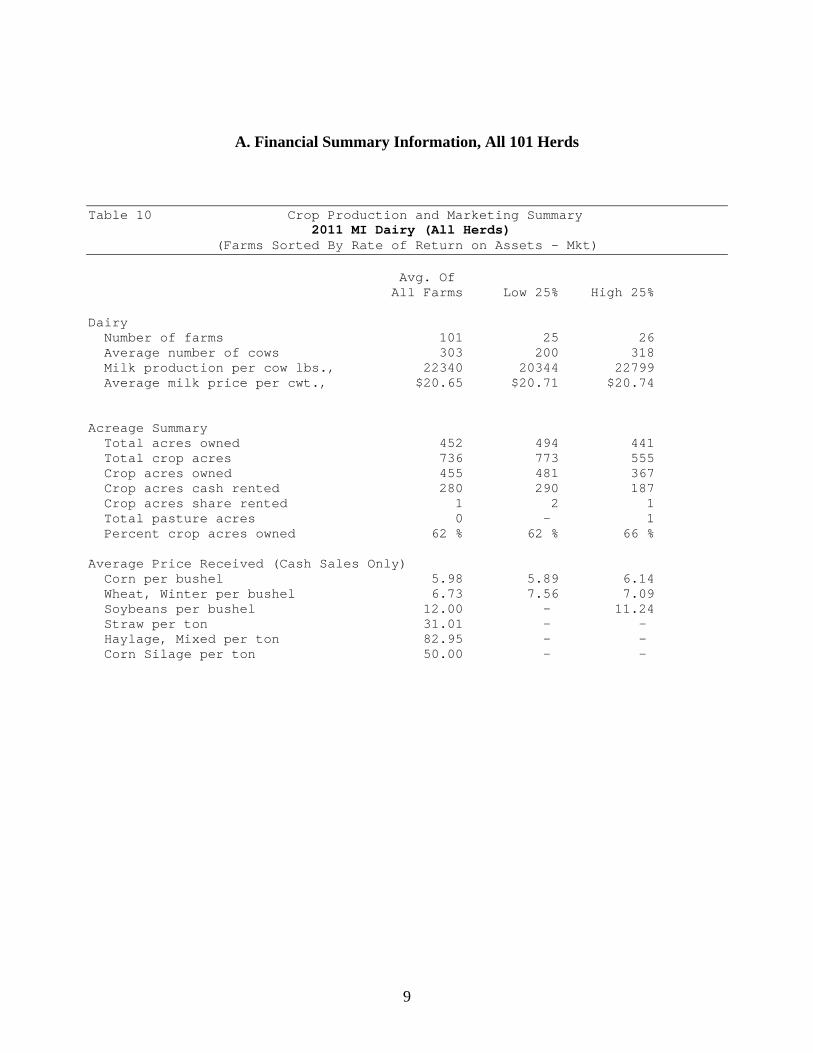
A. Financial Summary Information, All 101 Herds Table 10 Crop Production and Marketing Summary 2011 MI Dairy (All Herds) (Farms Sorted By Rate of Return on Assets - Mkt) Avg. Of All Farms Low 25% High 25% Dairy Number of farms 101 25 26 Average number of cows 303 200 318 Milk production per cow lbs., 22340 20344 22799 Average milk price per cwt., $20.65 $20.71 $20.74 Acreage Summary Total acres owned 452 494 441 Total crop acres 736 773 555 Crop acres owned 455 481 367 Crop acres cash rented 280 290 187 Crop acres share rented 1 2 1 Total pasture acres 0 - 1 Percent crop acres owned 62 % 62 % 66 % Average Price Received (Cash Sales Only) Corn per bushel 5.98 5.89 6.14 Wheat, Winter per bushel 6.73 7.56 7.09 Soybeans per bushel 12.00 - 11.24 Straw per ton 31.01 - - Haylage, Mixed per ton 82.95 - - Corn Silage per ton 50.00 - -
10
Table 11 Farm Income Statement 2011 MI Dairy (All Herds) (Farms Sorted By Rate of Return on Assets - Mkt) Avg. Of All Farms Low 25% High 25% Number of farms 101 25 26 Cash Farm Income Beans, Navy 1,165 - 1,448 Corn 41,249 31,468 50,867 Corn Silage 2,459 596 1,767 Hay, Alfalfa 429 1,290 298 Hay, Mixed 875 399 96 Hay, Mixed Alfalfa/Grass 237 - 787 Haylage, Mixed 1,072 537 - Oats 155 123 - Soybeans 28,931 19,087 34,320 Speltz 567 - - Straw 291 846 106 Sugar Beets 11,801 15,130 18,898 Wheat, Winter 17,568 7,417 23,859 Miscellaneous crop income 113 15 10 Beef Finishing 642 - - Dairy, Milk 1,466,372 906,719 1,537,619 Dairy, Dairy Calves 10,436 3,393 19,240 Dairy Heifers (for sale) 2,070 - 4,095 Dairy Replacement Heifers 1,133 535 2,015 Dairy Finishing 16,789 26,865 14,630 Dairy Feeder 1,829 1,472 137 Dairy Backgrounding 901 3,640 - User Added Livestock, User Added 975 3,010 - Cull breeding livestock 76,494 40,787 94,245 Misc. livestock income 916 302 2,369 LDP payments 3,453 - 13,414 Direct, CCP & ACRE pymts 7,265 10,603 7,071 CRP payments 1,044 - 4,057 Other government payments 8,083 5,246 3,539 Custom work income 4,997 2,601 5,046 Patronage dividends, cash 11,733 5,004 10,108 Insurance income 10,810 16,332 5,140 Other farm income 9,984 15,336 10,106 Gross Cash Farm Income 1,742,837 1,118,753 1,865,288

11
Table 11 Farm Income Statement (Continued) 2011 MI Dairy (All Herds) (Farms Sorted By Rate of Return on Assets - Mkt) Avg. Of All Farms Low 25% High 25% Number of farms 101 25 26 Cash Farm Expense Seed 45,651 32,178 45,948 Fertilizer 57,403 51,982 60,207 Crop chemicals 17,357 12,489 16,826 Crop insurance 4,718 1,887 2,804 Drying expense 717 1,414 46 Storage 252 495 - Crop packaging and supplies 505 1,192 330 Crop hauling and trucking 222 - 9 Crop marketing 141 8 123 Crop miscellaneous 5,473 1,337 13,049 Feeder livestock purchase 5,371 63 20,606 Livestock packaging and supplies 598 - 2,325 Purchased feed 455,180 288,592 489,560 Breeding fees 11,743 7,061 11,424 Veterinary 36,868 21,251 41,546 Livestock supplies 43,479 35,997 27,598 DHIA 2,722 2,052 2,384 Contract production exp. 1,629 - - Livestock leases 2,992 79 9,990 Livestock utilities 513 - - Livestock hauling and trucking 34,639 24,283 39,055 Livestock marketing 15,403 9,298 13,542 Bedding 19,230 13,817 17,839 Livestock miscellaneous 776 - 612 Interest 52,540 32,467 49,291 Packaging and supplies 4,093 3,769 7,156 Supplies 4,106 - 7,030 Fuel & oil 70,482 57,361 64,453 Repairs 71,005 57,202 65,346 Repair, machinery 3,311 - 5,493 Repair, livestock equip 90 - 350 Custom hire 76,158 25,825 46,056 Repair, buildings 8,552 5,422 2,022 Hired labor 198,935 136,190 175,008 Land rent 39,501 28,316 30,340 Machinery leases 11,085 10,887 14,768 Building leases 7,479 260 28,802 Real estate taxes 14,635 10,079 13,189 Personal property taxes 323 163 512 Farm insurance 19,071 18,927 20,697 Utilities 34,977 27,730 31,689 Hauling and trucking 2,219 1,500 3,184 Dues & professional fees 7,019 7,821 5,310 Miscellaneous 19,448 13,671 13,565 Total cash expense 1,408,613 943,064 1,400,080 Net cash farm income 334,223 175,688 465,208

12
Inventory Changes Prepaids and supplies 22,353 -6,062 22,235 Accounts receivable 14,235 3,615 19,414 Hedging accounts -738 - -178 Other current assets 11,163 1,840 41,051 Crops and feed 50,695 9,556 78,172 Market livestock 2,531 -3,034 10,244 Breeding livestock 11,278 5,809 -9,334 Other assets 2,096 27 8,355 Accounts payable 1,867 -2,444 -8,170 Accrued interest 705 13 190 Total inventory change 116,185 9,320 161,979 Net operating profit 450,409 185,009 627,187 Depreciation Machinery and equipment -99,721 -56,023 -143,307 Titled vehicles -300 80 -85 Buildings and improvements -64,802 -28,067 -62,770 Total depreciation -164,823 -84,010 -206,161 Net farm income from operations 285,585 100,998 421,026 Gain or loss on capital sales 41 166 - Net farm income 285,626 101,165 421,026

13
Table 12 Inventory Changes 2011 MI Dairy (All Herds) (Farms Sorted By Rate of Return on Assets - Mkt) Avg. Of All Farms Low 25% High 25% Number of farms 101 25 26 Net cash farm income 334,223 175,688 465,208 Crops and Feed Ending inventory 399,952 277,907 434,068 Beginning inventory 349,257 268,350 355,896 Inventory change 50,695 9,556 78,172 Market Livestock Ending inventory 22,319 27,271 35,490 Beginning inventory 19,788 30,304 25,246 Inventory change 2,531 -3,034 10,244 Accts Receivable Ending inventory 63,194 25,143 78,944 Beginning inventory 48,960 21,529 59,530 Inventory change 14,235 3,615 19,414 Prepaid Expenses and Supplies Ending inventory 69,356 38,765 92,879 Beginning inventory 47,003 44,828 70,644 Inventory change 22,353 -6,062 22,235 Hedging Activities Ending inventory 331 142 187 Withdrawals -654 - -178 Beginning inventory 376 142 187 Deposits 39 - - Gain or loss -738 - -178 Other Current Assets Ending inventory 33,771 18,451 63,955 Beginning inventory 22,608 16,611 22,904 Inventory change 11,163 1,840 41,051 Breeding Livestock Ending inventory 727,625 503,033 649,822 Capital sales 5,877 905 15,165 Beginning inventory 701,152 468,140 648,993 Capital purchases 21,073 29,990 25,328 Depreciation, capital adjust 11,278 5,809 -9,334 Other Capital Assets Ending inventory 86,805 34,621 70,601 Capital sales 6,686 671 11,288 Beginning inventory 66,262 32,291 64,594 Capital purchases 25,132 2,974 8,939 Depreciation, capital adjust 2,096 27 8,355 Accounts Payable Beginning inventory 38,292 40,791 20,377 Ending inventory 36,425 43,235 28,547 Inventory change 1,867 -2,444 -8,170 Accrued Interest Beginning inventory 2,724 620 1,424 Ending inventory 2,019 607 1,234 Inventory change 705 13 190 Total inventory change 116,185 9,320 161,979 Net operating profit 450,409 185,009 627,187
14
Table 13 Depreciation 2011 MI Dairy (All Herds) (Farms Sorted By Rate of Return on Assets - Mkt) Avg. Of All Farms Low 25% High 25% Number of farms 101 25 26 Net operating profit 450,409 185,009 627,187 Machinery and Equipment Ending inventory 250,063 141,513 234,778 Capital sales 7,308 1,404 4,211 Beginning inventory 224,663 124,849 242,589 Capital purchases 132,430 74,091 139,707 Depreciation, capital adjust. -99,721 -56,023 -143,307 Titled Vehicles Ending inventory 1,180 600 3,412 Capital sales 40 - - Beginning inventory 1,291 520 3,496 Capital purchases 229 - - Depreciation, capital adjust. -300 80 -85 Buildings and Improvements Ending inventory 373,207 172,832 273,386 Capital sales 2,291 - 8,900 Beginning inventory 361,923 174,581 270,217 Capital purchases 78,377 26,318 74,838 Depreciation, capital adjust. -64,802 -28,067 -62,770 Total depreciation, capital adj. -164,823 -84,010 -206,161 Net farm income from operations 285,585 100,998 421,026 Gain or loss on capital sales 41 166 - Net farm income 285,626 101,165 421,026

15
Table 14 Profitability Measures 2011 MI Dairy (All Herds) (Farms Sorted By Rate of Return on Assets - Mkt) Avg. Of All Farms Low 25% High 25% Number of farms 101 25 26 Profitability (assets valued at cost) Net farm income from operations 285,585 100,998 421,026 Rate of return on assets 10.9 % 5.0 % 16.1 % Rate of return on equity 16.6 % 5.5 % 25.1 % Operating profit margin 19.5 % 9.7 % 26.0 % Asset turnover rate 56.0 % 51.7 % 62.1 % Farm interest expense 51,835 32,454 49,101 Value of operator lbr and mgmt. 71,258 51,462 89,231 Return on farm assets 266,162 81,990 380,896 Average farm assets 2,435,639 1,635,378 2,362,744 Return on farm equity 214,327 49,536 331,796 Average farm equity 1,291,108 896,274 1,321,330 Value of farm production 1,363,409 846,053 1,467,111 Avg. Of All Farms Low 25% High 25% Number of farms 101 25 26 Profitability (assets valued at market) Net farm income from operations 475,782 79,751 857,099 Rate of return on assets 11.2 % 2.0 % 19.2 % Rate of return on equity 13.7 % 1.2 % 23.9 % Operating profit margin 33.5 % 7.2 % 55.7 % Asset turnover rate 33.3 % 27.2 % 34.5 % Farm interest expense 51,835 32,454 49,101 Value of operator lbr and mgmt. 71,258 51,462 89,231 Return on farm assets 456,359 60,742 816,969 Average farm assets 4,091,141 3,111,726 4,252,715 Return on farm equity 404,523 28,289 767,868 Average farm equity 2,945,550 2,372,622 3,211,301 Value of farm production 1,363,409 846,053 1,467,111

16
Table 15 Liquidity & Repayment Capacity Measures 2011 MI Dairy (All Herds) (Farms Sorted By Rate of Return on Assets - Mkt) Avg. Of All Farms Low 25% High 25% Number of farms 101 25 26 Liquidity Current ratio 2.88 2.51 4.37 Working capital 429,192 261,926 618,696 Working capital to gross inc 23.5 % 23.1 % 31.3 % Current assets 657,190 435,205 802,389 Current liabilities 227,998 173,278 183,694 Gross revenues (accrual) 1,823,960 1,134,708 1,977,276 Repayment capacity Net farm income from operations 285,585 100,998 421,026 Depreciation 164,823 84,010 206,161 Personal income 11,764 10,214 16,398 Family living/owner withdrawals -77,050 -59,557 -103,633 Payments on personal debt -1,453 -551 -1,810 Income taxes paid -3,552 -2,166 -10,591 Interest on term debt 55,194 32,513 44,463 Capital debt repayment capacity 435,311 165,460 572,015 Scheduled term debt payments -139,143 -79,602 -127,395 Capital debt repayment margin 296,168 85,857 444,620 Cash replacement allowance -25,861 -19,480 -30,148 Replacement margin 270,307 66,377 414,472 Term debt coverage ratio 3.13 2.08 4.49 Replacement coverage ratio 2.64 1.67 3.63

17
Table 16 Balance Sheet at Cost Values 2011 MI Dairy (All Herds)
(Farms Sorted By Rate of Return on Assets - Mkt) Avg. Of All Farms Low 25% High 25% Number of farms 101 25 26 Beginning Ending Beginning Ending Beginning Ending Assets Current Farm Assets Cash and checking balance 48,698 66,933 47,239 47,525 58,594 96,866 Prepaid expenses & supplies 47,003 69,356 44,828 38,765 70,644 92,879 Growing crops 20,196 30,333 16,426 18,284 15,510 51,246 Accounts receivable 48,960 63,194 21,529 25,143 59,530 78,944 Hedging accounts 376 331 142 142 187 187 Crops held for sale or feed 350,591 398,619 268,350 277,907 355,896 434,068 Crops under government loan 0 2,667 0 0 0 0 Market livestock held for sale 19,788 22,319 30,304 27,271 25,246 35,490 Other current assets 2,412 3,438 185 167 7,394 12,709 Total current farm assets 538,022 657,190 429,003 435,205 593,001 802,389 Intermediate Farm Assets Breeding livestock 701,152 727,625 468,140 503,033 648,993 649,822 Machinery and equipment 224,663 250,063 124,849 141,513 242,589 234,778 Titled vehicles 1,291 1,180 520 600 3,496 3,412 Other intermediate assets 52,907 74,795 21,207 22,557 56,494 59,872 Total intermediate farm assets 980,013 1,053,664 614,716 667,703 951,572 947,884 Long Term Farm Assets Farm land 425,272 456,622 369,152 384,416 400,598 467,611 Buildings and improvements 361,923 373,207 174,581 172,832 270,217 273,386 Other long-term assets 13,355 12,010 11,084 12,064 8,100 10,729 Total long-term farm assets 800,550 841,839 554,817 569,312 678,916 751,725 Total Farm Assets 2,318,585 2,552,693 1,598,537 1,672,219 2,223,489 2,501,999 Total Nonfarm Assets 188,703 197,591 121,158 125,602 417,751 438,293 Total Assets 2,507,288 2,750,284 1,719,694 1,797,822 2,641,240 2,940,291 Liabilities Current Farm Liabilities Accrued interest 2,724 2,019 620 607 1,424 1,234 Accounts payable 38,292 36,425 40,791 43,235 20,377 28,547 Current notes 78,949 95,113 72,851 72,839 71,828 69,773 Government crop loans 0 757 0 0 0 0 Principal due on term debt 83,949 93,684 47,090 56,598 82,931 84,140 Total current farm liabilities 203,914 227,998 161,352 173,278 176,560 183,694 Total intermediate farm liabs 251,489 244,242 168,634 159,004 256,306 246,020 Total long term farm liabilities 671,690 689,729 396,397 419,543 614,931 605,317 Total farm liabilities 1,127,093 1,161,969 726,384 751,825 1,047,798 1,035,030 Total nonfarm liabilities 15,075 14,453 9,257 8,699 13,217 10,681 Total liabilities 1,142,168 1,176,422 735,640 760,524 1,061,015 1,045,712 Net worth (farm and nonfarm) 1,365,121 1,573,862 984,054 1,037,298 1,580,225 1,894,580 Net worth change 208,741 53,244 314,354 Percent net worth change 15 % 5 % 20 % Ratio Analysis Current farm liabilities / assets 38 % 35 % 38 % 40 % 30 % 23 % Intermediate farm liab. / assets 26 % 23 % 27 % 24 % 27 % 26 % Long term farm liab. / assets 84 % 82 % 71 % 74 % 91 % 81 % Total debt to asset ratio 46 % 43 % 43 % 42 % 40 % 36 %

18
Table 17 Balance Sheet at Market Values 2011 MI Dairy (All Herds)
(Farms Sorted By Rate of Return on Assets - Mkt) Avg. Of All Farms Low 25% High 25% Number of farms 101 25 26 Beginning Ending Beginning Ending Beginning Ending Assets Current Farm Assets Cash and checking balance 48,698 66,933 47,239 47,525 58,594 96,866 Prepaid expenses & supplies 47,003 69,356 44,828 38,765 70,644 92,879 Growing crops 20,196 30,333 16,426 18,284 15,510 51,246 Accounts receivable 48,960 63,194 21,529 25,143 59,530 78,944 Hedging accounts 376 331 142 142 187 187 Crops held for sale or feed 350,591 398,619 268,350 277,907 355,896 434,068 Crops under government loan 0 2,667 0 0 0 0 Market livestock held for sale 19,788 22,319 30,304 27,271 25,246 35,490 Other current assets 2,412 3,438 185 167 7,394 12,709 Total current farm assets 538,022 657,190 429,003 435,205 593,001 802,389 Intermediate Farm Assets Breeding livestock 745,906 775,397 508,442 519,681 696,970 719,081 Machinery and equipment 584,241 691,437 442,051 467,179 610,828 714,332 Titled vehicles 11,366 15,956 16,460 16,884 9,458 23,611 Other intermediate assets 56,921 79,456 33,238 34,646 58,548 64,299 Total intermediate farm assets 1,398,434 1,562,246 1,000,191 1,038,391 1,375,805 1,521,322 Long Term Farm Assets Farm land 1,260,989 1,364,782 1,222,586 1,235,114 1,344,893 1,648,398 Buildings and improvements 661,112 699,664 420,494 415,359 549,237 601,589 Other long-term assets 20,432 19,412 13,234 13,876 32,488 36,308 Total long-term farm assets 1,942,532 2,083,857 1,656,314 1,664,349 1,926,618 2,286,294 Total Farm Assets 3,878,989 4,303,293 3,085,508 3,137,944 3,895,424 4,610,006 Total Nonfarm Assets 268,515 286,261 190,943 199,759 457,078 490,250 Total Assets 4,147,503 4,589,554 3,276,451 3,337,702 4,352,503 5,100,256 Liabilities Current Farm Liabilities Accrued interest 2,724 2,019 620 607 1,424 1,234 Accounts payable 38,292 36,425 40,791 43,235 20,377 28,547 Current notes 78,949 95,113 72,851 72,839 71,828 69,773 Government crop loans 0 757 0 0 0 0 Principal due on term debt 83,949 93,684 47,090 56,598 82,931 84,140 Total current farm liabilities 203,914 227,998 161,352 173,278 176,560 183,694 Total intermediate farm liabs 251,489 244,242 168,634 159,004 256,306 246,020 Total long term farm liabilities 671,690 689,729 396,397 419,543 614,931 605,317 Total farm liabilities 1,127,093 1,161,969 726,384 751,825 1,047,798 1,035,030 Total nonfarm liabilities 15,075 14,453 9,257 8,699 13,217 10,681 Total liabs excluding deferreds 1,142,168 1,176,422 735,640 760,524 1,061,015 1,045,712 Total deferred liabilities 1,060 1,060 0 0 0 0 Total liabilities 1,143,228 1,177,482 735,640 760,524 1,061,015 1,045,712 Retained earnings 1,365,121 1,573,862 984,054 1,037,298 1,580,225 1,894,580 Market valuation equity 1,639,155 1,838,210 1,556,757 1,539,881 1,711,262 2,159,965 Net worth (farm and nonfarm) 3,004,276 3,412,072 2,540,811 2,577,179 3,291,487 4,054,545 Net worth excluding deferreds 3,005,336 3,413,132 2,540,811 2,577,179 3,291,488 4,054,545 Net worth change 407,796 36,367 763,057 Percent net worth change 14 % 1 % 23 % Ratio Analysis Current farm liabilities / assets 38 % 35 % 38 % 40 % 30 % 23 % Intermediate farm liab. / assets 18 % 16 % 17 % 15 % 19 % 16 % Long term farm liab. / assets 35 % 33 % 24 % 25 % 32 % 26 % Total debt to asset ratio 28 % 26 % 22 % 23 % 24 % 21 % Debt to assets excl deferreds 28 % 26 % 22 % 23 % 24 % 21 %

19
Table 18 Statement Of Cash Flows 2011 MI Dairy (All Herds) (Farms Sorted By Rate of Return on Assets - Mkt) Avg. Of All Farms Low 25% High 25% Number of farms 101 25 26 Beginning cash (farm & nonfarm) 58,201 83,289 59,460 Cash Provided By Operating Activities Gross cash farm income 1,742,837 1,118,753 1,865,288 Total cash farm expense -1,408,613 -943,064 -1,400,080 Net cash from hedging transactions -693 - -178 Cash provided by operating 333,530 175,688 465,030 Cash Provided By Investing Activities Sale of breeding livestock 5,877 905 15,165 Sale of machinery & equipment 7,350 1,571 4,211 Sale of titled vehicles 40 - - Sale of farm land 3,033 - 135 Sale of farm buildings 2,291 - 8,900 Sale of other farm assets 6,686 671 11,288 Sale of nonfarm assets 1 - 3 Purchase of breeding livestock -21,073 -29,990 -25,328 Purchase of machinery & equip. -132,430 -74,091 -139,707 Purchase of titled vehicles -229 - - Purchase of farm land -36,188 -16,294 -59,842 Purchase of farm buildings -78,377 -26,318 -74,838 Purchase of other farm assets -25,132 -2,974 -8,939 Purchase of nonfarm assets -5,964 -8,686 -13,601 Cash provided by investing -274,117 -155,205 -282,554 Cash Provided By Financing Activities Money borrowed 298,476 201,016 181,636 Principal payments -262,411 -178,549 -204,919 Personal income 11,764 10,214 16,398 Family living/owner withdrawals -77,050 -59,557 -103,633 Income and social security tax -3,552 -2,166 -10,591 Capital contributions 2,526 2,475 - Capital distributions -6,535 -3,223 -1,200 Dividends paid 79 320 - Cash gifts and inheritances 4,214 10,260 1,341 Gifts given -8,995 -2,984 -22,521 Other cash flows - - - Cash provided by financing -41,485 -22,195 -143,489 Net change in cash balance 17,928 -1,712 38,987 Ending cash (farm & nonfarm) 76,130 81,577 98,447

20
Table 19 Financial Standards Measures 2011 MI Dairy (All Herds) (Farms Sorted By Rate of Return on Assets - Mkt) Avg. Of All Farms Low 25% High 25% Number of farms 101 25 26 Liquidity Current ratio 2.88 2.51 4.37 Working capital 429,192 261,926 618,696 Working capital to gross inc 23.5 % 23.1 % 31.3 % Solvency (market) Farm debt to asset ratio 27 % 24 % 22 % Farm equity to asset ratio 73 % 76 % 78 % Farm debt to equity ratio 0.37 0.32 0.29 Profitability (cost) Rate of return on farm assets 10.9 % 5.0 % 16.1 % Rate of return on farm equity 16.6 % 5.5 % 25.1 % Operating profit margin 19.5 % 9.7 % 26.0 % Net farm income 285,626 101,165 421,026 EBIDTA 502,244 217,462 676,288 Repayment Capacity Capital debt repayment capacity 435,311 165,460 572,015 Capital debt repayment margin 296,168 85,857 444,620 Replacement margin 270,307 66,377 414,472 Term debt coverage ratio 3.13 2.08 4.49 Replacement coverage ratio 2.64 1.67 3.63 Efficiency Asset turnover rate (cost) 56.0 % 51.7 % 62.1 % Operating expense ratio 72.5 % 80.8 % 65.8 % Depreciation expense ratio 9.0 % 7.4 % 10.4 % Interest expense ratio 2.9 % 2.9 % 2.5 % Net farm income ratio 15.7 % 8.9 % 21.3 %

21
Table 20 Operator and Labor Information 2011 MI Dairy (All Herds) (Farms Sorted By Rate of Return on Assets - Mkt) Avg. Of All Farms Low 25% High 25% Number of farms 101 25 26 Operator Information Average number of operators 1.5 1.8 1.4 Average age of operators 47.9 44.3 47.5 Average number of years farming 24.2 23.0 24.6 Results Per Operator Working capital 277,875 142,351 434,759 Total assets (market) 2,971,442 1,813,969 3,583,964 Total liabilities 762,344 413,328 734,824 Net worth (market) 2,209,098 1,400,641 2,849,140 Net worth excl deferred liabs 2,209,784 1,400,641 2,849,140 Gross farm income 1,180,897 616,689 1,389,437 Total farm expense 995,999 561,799 1,093,581 Net farm income from operations 184,898 54,890 295,856 Net nonfarm income 7,616 5,551 11,523 Family living & tax withdrawals 52,185 33,546 80,266 Total acres owned 292.8 268.2 309.9 Total crop acres 476.3 420.2 389.7 Crop acres owned 294.5 261.5 257.9 Crop acres cash rented 181.3 157.6 131.1 Crop acres share rented 0.5 1.0 0.7 Total pasture acres 0.3 - 0.4 Labor Analysis Number of farms 100 25 26 Total unpaid labor hours 4,952 5,337 4,383 Total hired labor hours 12,903 9,919 10,111 Total labor hours per farm 17,855 15,256 14,494 Unpaid hours per operator 3,195 2,900 3,044 Value of farm production / hour 76.48 55.46 102.06 Net farm income / unpaid hour 57.68 18.93 97.33 Average hourly hired labor wage 15.36 13.73 17.71 Partnerships & LLCs Number of farms 41 14 9 Number of operators 2.1 2.2 2.1 Owner withdrawals per farm 302,119 - - Withdrawals per operator 116,200 - - Corporations Number of farms 4 1 - Number of operators 1.8 - -

22
Table 21 Financial Summary 2011 MI Dairy (All Herds) (Farms Sorted By Rate of Return on Assets - Mkt) Avg. Of All Farms Low 25% High 25% Number of farms 101 25 26 Income Statement Gross cash farm income 1,742,837 1,118,753 1,865,288 Total cash farm expense 1,408,613 943,064 1,400,080 Net cash farm income 334,223 175,688 465,208 Inventory change 116,185 9,320 161,979 Depreciation -164,823 -84,010 -206,161 Net farm income from operations 285,585 100,998 421,026 Gain or loss on capital sales 41 166 - Average net farm income 285,626 101,165 421,026 Median net farm income 140,647 68,956 210,515 Profitability (cost) Rate of return on assets 10.9 % 5.0 % 16.1 % Rate of return on equity 16.6 % 5.5 % 25.1 % Operating profit margin 19.5 % 9.7 % 26.0 % Asset turnover rate 56.0 % 51.7 % 62.1 % Profitability (market) Rate of return on assets 11.2 % 2.0 % 19.2 % Rate of return on equity 13.7 % 1.2 % 23.9 % Operating profit margin 33.5 % 7.2 % 55.7 % Asset turnover rate 33.3 % 27.2 % 34.5 % Liquidity & Repayment (end of year) Current assets 657,190 435,205 802,389 Current liabilities 227,998 173,278 183,694 Current ratio 2.88 2.51 4.37 Working capital 429,192 261,926 618,696 Working capital to gross inc 23.5 % 23.1 % 31.3 % Term debt coverage ratio 3.13 2.08 4.49 Replacement coverage ratio 2.64 1.67 3.63 Solvency (end of year at cost) Number of farms 101 25 26 Total farm assets 2,552,693 1,672,219 2,501,999 Total farm liabilities 1,161,969 751,825 1,035,030 Total assets 2,750,284 1,797,822 2,940,291 Total liabilities 1,176,422 760,524 1,045,712 Net worth 1,573,862 1,037,298 1,894,580 Net worth change 208,741 53,244 314,354 Farm debt to asset ratio 46 % 45 % 41 % Total debt to asset ratio 43 % 42 % 36 % Solvency (end of year at market) Number of farms 101 25 26 Total farm assets 4,303,293 3,137,944 4,610,006 Total farm liabilities 1,163,029 751,825 1,035,031 Total assets 4,589,554 3,337,702 5,100,256 Total liabilities 1,177,482 760,524 1,045,712 Net worth 3,412,072 2,577,179 4,054,545 Net worth change 407,796 36,367 763,057 Farm debt to asset ratio 27 % 24 % 22 % Total debt to asset ratio 26 % 23 % 21 % Nonfarm Information Net nonfarm income 11,764 10,214 16,398 Crop Acres Total acres owned 452 494 441 Total crop acres 736 773 555 Total crop acres owned 455 481 367 Total crop acres cash rented 280 290 187 Total crop acres share rented 1 2 1

23
Table 22 Summary Farm Income Statement 2011 MI Dairy (All Herds) (Farms Sorted By Rate of Return on Assets - Mkt) Avg. Of All Farms Low 25% High 25% Number of farms 101 25 26 Crop sales 106,911 76,909 132,457 Crop inventory change 50,695 9,556 78,172 Gross crop income 157,606 86,465 210,629 Livestock sales 1,501,268 945,730 1,577,736 Livestock inventory change 2,531 -3,034 10,244 Gross livestock income 1,503,799 942,696 1,587,980 Government payments 19,899 15,849 28,082 Other cash farm income 114,759 80,266 127,013 Change in accounts receivable 14,235 3,615 19,414 Gain or loss on hedging accounts -738 - -178 Change in other assets 3,123 9 13,670 Gain or loss on breeding lvst 11,278 5,809 -9,334 Gross farm income 1,823,960 1,134,708 1,977,276 Cash operating expenses 1,356,073 910,597 1,350,789 Change in prepaids and supplies -22,353 6,062 -22,235 Change in growing crops -10,137 -1,858 -35,736 Change in accounts payable -1,867 2,444 8,170 Depreciation 164,823 84,010 206,161 Total operating expense 1,486,539 1,001,256 1,507,149 Interest paid 52,540 32,467 49,291 Change in accrued interest -705 -13 -190 Total interest expense 51,835 32,454 49,101 Total expenses 1,538,375 1,033,710 1,556,250 Net farm income from operations 285,585 100,998 421,026 Gain or loss on capital sales 41 166 - Net farm income 285,626 101,165 421,026
24
B. Financial Summary Information, Herds with 40-99 Cows Table 23 Crop Production and Marketing Summary 2011 MI Dairy (40 to 99 Cows) (Farms Sorted By Rate of Return on Assets - Mkt) Avg. Of All Farms Low 25% High 25% Dairy Number of farms 20 5 6 Average number of cows 69 70 61 Milk production per cow lbs., 18,904 17,120 20,717 Average milk price per cwt., $20.79 $21.01 $20.51 Acreage Summary Total acres owned 223 242 161 Total crop acres 317 361 257 Crop acres owned 217 174 224 Crop acres cash rented 100 187 31 Crop acres share rented 1 - 2 Total pasture acres - - - Percent crop acres owned 68 % 48 % 87 % Average Price Received (Cash Sales Only) Corn per bushel 6.33 - 4.18 Soybeans per bushel 12.19 - 12.92 Wheat, Winter per bushel 7.80 - 6.94 Hay, Alfalfa per ton 74.23 - -

25
Table 24 Farm Income Statement 2011 MI Dairy (40 to 99 Cows) (Farms Sorted By Rate of Return on Assets - Mkt) Avg. Of All Farms Low 25% High 25% Number of farms 20 5 6 Cash Farm Income Beans, Navy 2,184 - - Corn 11,412 281 10,624 Hay, Alfalfa 1,048 - 684 Hay, Mixed 3,288 578 - Soybeans 11,564 13,644 9,951 Straw 59 297 - Sugar Beets 16,116 - - Wheat, Winter 5,563 - 7,038 Miscellaneous crop income 95 96 - Beef Bulls 50 252 - Beef Cow-Calf, Beef Calves 353 - - Dairy, Milk 271,851 263,843 255,562 Dairy, Dairy Calves 1,158 3,185 625 Dairy Heifers (for sale) 400 - 1,333 Dairy Replacement Heifers 507 - 430 Dairy Finishing 4,135 - 2,588 Cull breeding livestock 16,226 9,014 17,878 Misc. livestock income 1 - - Direct, CCP & ACRE pymts 812 943 1,375 Other government payments 2,230 4,793 1,450 Patronage dividends, cash 2,189 1,635 1,287 Insurance income 1,469 1,215 3,950 Other farm income 2,449 1,443 3,236 Gross Cash Farm Income 355,162 301,218 318,010
26
Table 24 Farm Income Statement (Continued) 2011 MI Dairy (40 to 99 Cows) (Farms Sorted By Rate of Return on Assets - Mkt) Avg. Of All Farms Low 25% High 25% Number of farms 20 5 6 Cash Farm Expense Seed 12,019 13,538 14,074 Fertilizer 13,675 10,517 12,967 Crop chemicals 4,975 4,391 5,762 Crop insurance 599 240 50 Drying expense 60 - 198 Storage 187 - - Crop marketing 166 - 258 Crop miscellaneous 1,139 89 575 Purchased feed 83,538 70,391 70,094 Breeding fees 2,041 3,363 1,877 Veterinary 6,437 4,717 5,170 Livestock supplies 5,350 7,419 2,416 DHIA 997 1,478 964 Hauling and trucking 8,503 8,069 6,303 Livestock marketing 4,819 3,932 4,934 Bedding 2,691 2,847 1,815 Interest 12,439 16,497 6,141 Packaging and supplies 2,846 1,370 - Supplies 807 - 2,690 Fuel & oil 16,903 17,449 13,123 Repairs 19,873 22,564 13,102 Repair, machinery 1,533 - 5,111 Custom hire 6,203 3,583 12,331 Repair, buildings 1,968 4,688 365 Hired labor 32,265 39,944 14,796 Land rent 6,382 5,429 7,115 Machinery leases 1,026 139 2,509 Real estate taxes 5,008 5,202 3,791 Personal property taxes 102 - 97 Farm insurance 5,149 5,612 3,848 Utilities 10,629 9,714 8,492 Dues & professional fees 2,514 1,679 1,035 Miscellaneous 4,821 5,742 3,071 Total cash expense 277,661 270,598 225,073 Net cash farm income 77,501 30,620 92,937 Inventory Changes Prepaids and supplies 1,812 3,227 2,813 Accounts receivable 1,451 1,275 3,494 Hedging accounts -198 - - Other current assets 1,717 941 3,025 Crops and feed 20,249 9,834 22,435 Market livestock 1,948 -88 1,437 Breeding livestock 3,728 -1,550 3,528 Other assets 3 0 -247 Accounts payable 466 4,871 739

27
Accrued interest 227 370 42 Total inventory change 31,401 18,879 37,267 Net operating profit 108,902 49,499 130,204 Depreciation Machinery and equipment -19,505 -14,944 -16,071 Titled vehicles -1,115 - -167 Buildings and improvements -10,991 -4,258 -19,611 Total depreciation -31,612 -19,201 -35,849 Net farm income from operations 77,290 30,298 94,355 Gain or loss on capital sales - - - Net farm income 77,290 30,298 94,355

28
Table 25 Inventory Changes 2011 MI Dairy (40 to 99 Cows) (Farms Sorted By Rate of Return on Assets - Mkt) Avg. Of All Farms Low 25% High 25% Number of farms 20 5 6 Net cash farm income 77,501 30,620 92,937 Crops and Feed Ending inventory 109,529 81,004 106,146 Beginning inventory 89,281 71,170 83,710 Inventory change 20,249 9,834 22,435 Market Livestock Ending inventory 6,083 2,238 6,250 Beginning inventory 4,134 2,325 4,813 Inventory change 1,948 -88 1,437 Accts Receivable Ending inventory 8,075 3,150 10,041 Beginning inventory 6,624 1,875 6,546 Inventory change 1,451 1,275 3,494 Prepaid Expenses and Supplies Ending inventory 11,961 10,672 15,737 Beginning inventory 10,149 7,445 12,925 Inventory change 1,812 3,227 2,813 Hedging Activities Ending inventory - - - Withdrawals - - - Beginning inventory 1 - - Deposits 197 - - Gain or loss -198 - - Other Current Assets Ending inventory 7,046 4,374 6,262 Beginning inventory 5,329 3,434 3,237 Inventory change 1,717 941 3,025 Breeding Livestock Ending inventory 159,824 192,063 125,800 Capital sales 130 263 17 Beginning inventory 155,659 193,600 121,217 Capital purchases 567 275 1,072 Depreciation, capital adjust 3,728 -1,550 3,528 Other Capital Assets Ending inventory 10,993 15,304 7,768 Capital sales 139 316 - Beginning inventory 10,073 15,620 7,332 Capital purchases 1,057 0 683 Depreciation, capital adjust 3 0 -247 Accounts Payable Beginning inventory 9,227 20,842 7,591 Ending inventory 8,761 15,971 6,852 Inventory change 466 4,871 739 Accrued Interest Beginning inventory 1,489 458 194 Ending inventory 1,263 88 151 Inventory change 227 370 42 Total inventory change 31,401 18,879 37,267 Net operating profit 108,902 49,499 130,204

29
Table 26 Depreciation 2011 MI Dairy (40 to 99 Cows) (Farms Sorted By Rate of Return on Assets - Mkt) Avg. Of All Farms Low 25% High 25% Number of farms 20 5 6 Net operating profit 108,902 49,499 130,204 Machinery and Equipment Ending inventory 55,308 14,576 30,405 Capital sales 559 - 582 Beginning inventory 44,812 27,657 29,620 Capital purchases 30,561 1,863 17,439 Depreciation, capital adjust. -19,505 -14,944 -16,071 Titled Vehicles Ending inventory 556 - 833 Capital sales 200 - - Beginning inventory 723 - 1,000 Capital purchases 1,148 - - Depreciation, capital adjust. -1,115 - -167 Buildings and Improvements Ending inventory 43,332 15,674 43,897 Capital sales - - - Beginning inventory 45,098 19,932 48,437 Capital purchases 9,225 - 15,071 Depreciation, capital adjust. -10,991 -4,258 -19,611 Total depreciation, capital adj. -31,612 -19,201 -35,849 Net farm income from operations 77,290 30,298 94,355 Gain or loss on capital sales - - - Net farm income 77,290 30,298 94,355

30
Table 27 Profitability Measures 2011 MI Dairy (40 to 99 Cows) (Farms Sorted By Rate of Return on Assets - Mkt) Avg. Of All Farms Low 25% High 25% Number of farms 20 5 6 Profitability (assets valued at cost) Net farm income from operations 77,290 30,298 94,355 Rate of return on assets 11.0 % 2.1 % 16.8 % Rate of return on equity 15.7 % -3.4 % 23.9 % Operating profit margin 19.6 % 4.1 % 26.8 % Asset turnover rate 56.0 % 50.6 % 62.8 % Farm interest expense 12,213 16,127 6,098 Value of operator lbr and mgmt. 31,003 36,641 25,833 Return on farm assets 58,500 9,784 74,620 Average farm assets 533,681 474,982 443,882 Return on farm equity 46,287 -6,343 68,522 Average farm equity 294,666 185,449 286,442 Value of farm production 298,870 240,298 278,564 Avg. Of All Farms Low 25% High 25% Number of farms 20 5 6 Profitability (assets valued at market) Net farm income from operations 152,554 49,539 268,289 Rate of return on assets 10.5 % 2.5 % 22.5 % Rate of return on equity 11.8 % 1.5 % 25.6 % Operating profit margin 44.8 % 12.1 % 89.2 % Asset turnover rate 23.5 % 20.8 % 25.2 % Farm interest expense 12,213 16,127 6,098 Value of operator lbr and mgmt. 31,003 36,641 25,833 Return on farm assets 133,764 29,025 248,554 Average farm assets 1,271,705 1,157,631 1,103,269 Return on farm equity 121,551 12,898 242,455 Average farm equity 1,027,336 868,098 945,828 Value of farm production 298,870 240,298 278,564

31
Table 28 Liquidity & Repayment Capacity Measures 2011 MI Dairy (40 to 99 Cows) (Farms Sorted By Rate of Return on Assets - Mkt) Avg. Of All Farms Low 25% High 25% Number of farms 20 5 6 Liquidity Current ratio 2.90 2.78 3.80 Working capital 103,762 69,960 121,914 Working capital to gross inc 27.1 % 22.5 % 35.0 % Current assets 158,474 109,247 165,384 Current liabilities 54,712 39,287 43,469 Gross revenues (accrual) 382,408 310,689 348,658 Repayment capacity Net farm income from operations 77,290 30,298 94,355 Depreciation 31,612 19,201 35,849 Personal income 9,420 6,898 9,825 Family living/owner withdrawals -40,211 -41,353 -30,657 Payments on personal debt -841 - - Income taxes paid -1,429 -996 -1,743 Interest on term debt 7,764 13,579 7,037 Capital debt repayment capacity 83,605 27,628 114,665 Scheduled term debt payments -27,912 -31,824 -26,495 Capital debt repayment margin 55,693 -4,196 88,171 Cash replacement allowance -13,376 -8,873 -7,783 Replacement margin 42,317 -13,069 80,388 Term debt coverage ratio 3.00 0.87 4.33 Replacement coverage ratio 2.02 0.68 3.35

32
Table 29 Balance Sheet at Cost Values 2011 MI Dairy (40 to 99 Cows)
(Farms Sorted By Rate of Return on Assets - Mkt) Avg. Of All Farms Low 25% High 25% Number of farms 20 5 6 Beginning Ending Beginning Ending Beginning Ending Assets Current Farm Assets Cash and checking balance 18,288 15,781 23,589 7,810 18,692 20,949 Prepaid expenses & supplies 10,149 11,961 7,445 10,672 12,925 15,737 Growing crops 4,750 6,402 3,403 4,344 3,220 6,245 Accounts receivable 6,624 8,075 1,875 3,150 6,546 10,041 Hedging accounts 1 0 0 0 0 0 Crops held for sale or feed 89,281 109,529 71,170 81,004 83,710 106,146 Crops under government loan 0 0 0 0 0 0 Market livestock held for sale 4,134 6,083 2,325 2,238 4,813 6,250 Other current assets 579 644 31 31 17 17 Total current farm assets 133,806 158,474 109,837 109,247 129,922 165,384 Intermediate Farm Assets Breeding livestock 155,659 159,824 193,600 192,063 121,217 125,800 Machinery and equipment 44,812 55,308 27,657 14,576 29,620 30,405 Titled vehicles 723 556 0 0 1,000 833 Other intermediate assets 9,733 10,647 15,620 15,304 6,819 7,238 Total intermediate farm assets 210,927 226,334 236,877 221,942 158,655 164,276 Long Term Farm Assets Farm land 119,190 129,515 118,228 118,228 70,867 105,284 Buildings and improvements 45,098 43,332 19,932 15,674 48,437 43,897 Other long-term assets 340 347 0 0 513 530 Total long-term farm assets 164,628 173,194 138,160 133,902 119,816 149,711 Total Farm Assets 509,361 558,002 484,874 465,091 408,394 479,370 Total Nonfarm Assets 78,247 83,470 55,344 54,094 46,770 52,622 Total Assets 587,608 641,472 540,218 519,185 455,164 531,992 Liabilities Current Farm Liabilities Accrued interest 1,489 1,263 458 88 194 151 Accounts payable 9,227 8,761 20,842 15,971 7,591 6,852 Current notes 29,580 28,303 11,200 10,118 15,111 17,290 Government crop loans 0 0 0 0 0 0 Principal due on term debt 20,148 16,385 18,245 13,110 19,457 19,176 Total current farm liabilities 60,444 54,712 50,745 39,287 42,353 43,469 Total intermediate farm liabs 31,180 35,725 54,867 47,982 36,934 28,490 Total long term farm liabilities 147,842 148,129 199,004 187,181 75,354 88,280 Total farm liabilities 239,465 238,566 304,616 274,450 154,641 160,240 Total nonfarm liabilities 9,834 10,404 0 0 0 0 Total liabilities 249,300 248,969 304,616 274,450 154,641 160,240 Net worth (farm and nonfarm) 338,308 392,503 235,602 244,735 300,523 371,752 Net worth change 54,195 9,134 71,229 Percent net worth change 16 % 4 % 24 % Ratio Analysis Current farm liabilities / assets 45 % 35 % 46 % 36 % 33 % 26 % Intermediate farm liab. / assets 15 % 16 % 23 % 22 % 23 % 17 % Long term farm liab. / assets 90 % 86 % 144 % 140 % 63 % 59 % Total debt to asset ratio 42 % 39 % 56 % 53 % 34 % 30 %

33
Table 30 Balance Sheet at Market Values 2011 MI Dairy (40 to 99 Cows)
(Farms Sorted By Rate of Return on Assets - Mkt) Avg. Of All Farms Low 25% High 25% Number of farms 20 5 6 Beginning Ending Beginning Ending Beginning Ending Assets Current Farm Assets Cash and checking balance 18,288 15,781 23,589 7,810 18,692 20,949 Prepaid expenses & supplies 10,149 11,961 7,445 10,672 12,925 15,737 Growing crops 4,750 6,402 3,403 4,344 3,220 6,245 Accounts receivable 6,624 8,075 1,875 3,150 6,546 10,041 Hedging accounts 1 0 0 0 0 0 Crops held for sale or feed 89,281 109,529 71,170 81,004 83,710 106,146 Crops under government loan 0 0 0 0 0 0 Market livestock held for sale 4,134 6,083 2,325 2,238 4,813 6,250 Other current assets 579 644 31 31 17 17 Total current farm assets 133,806 158,474 109,837 109,247 129,922 165,384 Intermediate Farm Assets Breeding livestock 165,735 170,912 193,600 196,513 154,191 153,487 Machinery and equipment 207,998 267,083 187,364 185,948 140,920 270,873 Titled vehicles 1,853 4,170 0 0 2,333 2,333 Other intermediate assets 9,833 10,772 15,620 15,304 6,819 7,238 Total intermediate farm assets 385,419 452,937 396,584 397,764 304,264 433,931 Long Term Farm Assets Farm land 571,675 587,365 583,480 583,480 391,750 444,050 Buildings and improvements 118,513 134,535 68,001 66,870 154,365 181,829 Other long-term assets 340 347 0 0 513 530 Total long-term farm assets 690,528 722,246 651,481 650,350 546,628 626,409 Total Farm Assets 1,209,753 1,333,657 1,157,902 1,157,361 980,814 1,225,724 Total Nonfarm Assets 122,806 138,865 127,561 120,450 77,710 132,206 Total Assets 1,332,559 1,472,523 1,285,462 1,277,810 1,058,523 1,357,929 Liabilities Current Farm Liabilities Accrued interest 1,489 1,263 458 88 194 151 Accounts payable 9,227 8,761 20,842 15,971 7,591 6,852 Current notes 29,580 28,303 11,200 10,118 15,111 17,290 Government crop loans 0 0 0 0 0 0 Principal due on term debt 20,148 16,385 18,245 13,110 19,457 19,176 Total current farm liabilities 60,444 54,712 50,745 39,287 42,353 43,469 Total intermediate farm liabs 31,180 35,725 54,867 47,982 36,934 28,490 Total long term farm liabilities 147,842 148,129 199,004 187,181 75,354 88,280 Total farm liabilities 239,465 238,566 304,616 274,450 154,641 160,240 Total nonfarm liabilities 9,834 10,404 0 0 0 0 Total liabs excluding deferreds 249,300 248,969 304,616 274,450 154,641 160,240 Total deferred liabilities 5,354 5,354 0 0 0 0 Total liabilities 254,654 254,323 304,616 274,450 154,641 160,240 Retained earnings 338,308 392,503 235,602 244,735 300,523 371,752 Market valuation equity 739,597 825,696 745,245 758,625 603,359 825,937 Net worth (farm and nonfarm) 1,077,905 1,218,200 980,846 1,003,360 903,882 1,197,689 Net worth excluding deferreds 1,083,259 1,223,553 980,846 1,003,360 903,882 1,197,689 Net worth change 140,295 22,514 293,807 Percent net worth change 13 % 2 % 33 % Ratio Analysis Current farm liabilities / assets 45 % 35 % 46 % 36 % 33 % 26 % Intermediate farm liab. / assets 8 % 8 % 14 % 12 % 12 % 7 % Long term farm liab. / assets 21 % 21 % 31 % 29 % 14 % 14 % Total debt to asset ratio 19 % 17 % 24 % 21 % 15 % 12 % Debt to assets excl deferreds 19 % 17 % 24 % 21 % 15 % 12 %

34
Table 31 Statement Of Cash Flows 2011 MI Dairy (40 to 99 Cows) (Farms Sorted By Rate of Return on Assets - Mkt) Avg. Of All Farms Low 25% High 25% Number of farms 20 5 6 Beginning cash (farm & nonfarm) 21,892 23,589 22,025 Cash Provided By Operating Activities Gross cash farm income 355,162 301,218 318,010 Total cash farm expense -277,661 -270,598 -225,073 Net cash from hedging transactions -197 - - Cash provided by operating 77,303 30,620 92,937 Cash Provided By Investing Activities Sale of breeding livestock 130 263 17 Sale of machinery & equipment 559 - 582 Sale of titled vehicles 200 - - Sale of farm land - - - Sale of farm buildings - - - Sale of other farm assets 139 316 - Sale of nonfarm assets - - - Purchase of breeding livestock -567 -275 -1,072 Purchase of machinery & equip. -30,561 -1,863 -17,439 Purchase of titled vehicles -1,148 - - Purchase of farm land -8,550 - -28,500 Purchase of farm buildings -9,225 - -15,071 Purchase of other farm assets -1,057 0 -683 Purchase of nonfarm assets -879 - - Cash provided by investing -50,958 -1,559 -62,166 Cash Provided By Financing Activities Money borrowed 46,090 9,566 38,374 Principal payments -45,978 -34,493 -31,994 Personal income 9,420 6,898 9,825 Family living/owner withdrawals -40,211 -41,353 -30,657 Income and social security tax -1,429 -996 -1,743 Capital contributions - - - Capital distributions -270 -1,350 - Dividends paid - - - Cash gifts and inheritances 12,151 16,887 - Gifts given -7,440 - -9,219 Other cash flows - - - Cash provided by financing -27,668 -44,840 -25,414 Net change in cash balance -1,322 -15,779 5,357 Ending cash (farm & nonfarm) 20,569 7,810 27,382
35
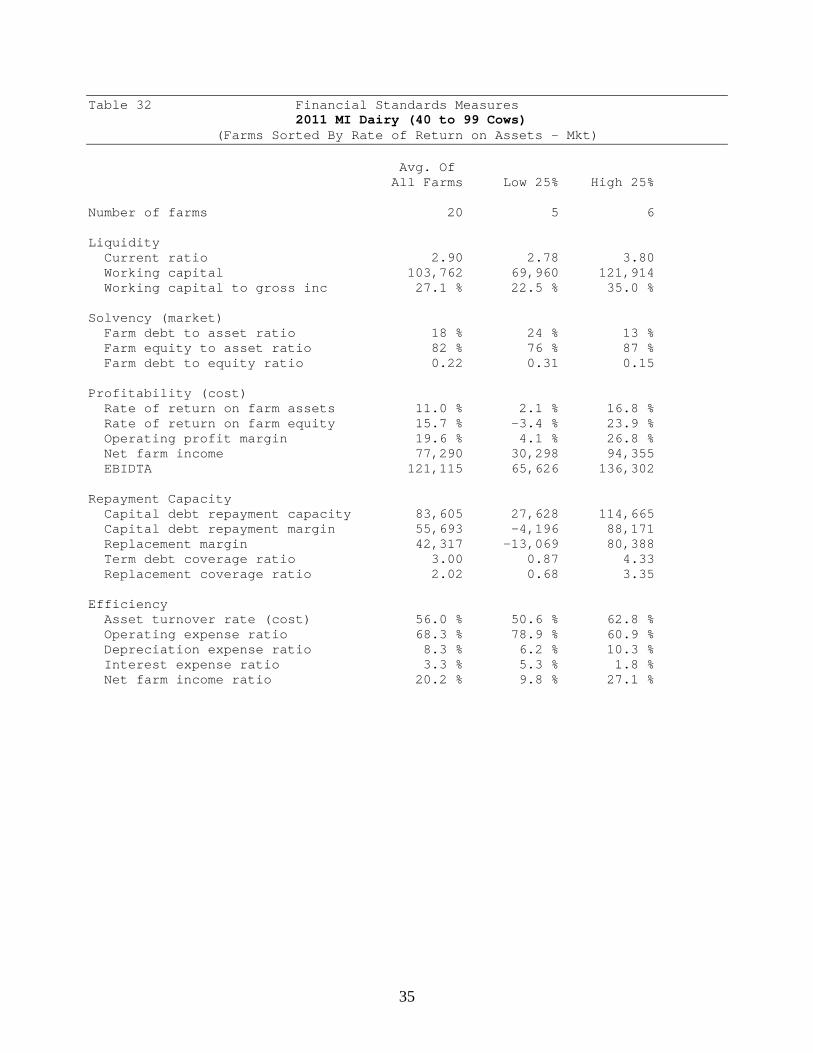
Table 32 Financial Standards Measures 2011 MI Dairy (40 to 99 Cows) (Farms Sorted By Rate of Return on Assets - Mkt) Avg. Of All Farms Low 25% High 25% Number of farms 20 5 6 Liquidity Current ratio 2.90 2.78 3.80 Working capital 103,762 69,960 121,914 Working capital to gross inc 27.1 % 22.5 % 35.0 % Solvency (market) Farm debt to asset ratio 18 % 24 % 13 % Farm equity to asset ratio 82 % 76 % 87 % Farm debt to equity ratio 0.22 0.31 0.15 Profitability (cost) Rate of return on farm assets 11.0 % 2.1 % 16.8 % Rate of return on farm equity 15.7 % -3.4 % 23.9 % Operating profit margin 19.6 % 4.1 % 26.8 % Net farm income 77,290 30,298 94,355 EBIDTA 121,115 65,626 136,302 Repayment Capacity Capital debt repayment capacity 83,605 27,628 114,665 Capital debt repayment margin 55,693 -4,196 88,171 Replacement margin 42,317 -13,069 80,388 Term debt coverage ratio 3.00 0.87 4.33 Replacement coverage ratio 2.02 0.68 3.35 Efficiency Asset turnover rate (cost) 56.0 % 50.6 % 62.8 % Operating expense ratio 68.3 % 78.9 % 60.9 % Depreciation expense ratio 8.3 % 6.2 % 10.3 % Interest expense ratio 3.3 % 5.3 % 1.8 % Net farm income ratio 20.2 % 9.8 % 27.1 %

36
Table 33 Operator and Labor Information 2011 MI Dairy (40 to 99 Cows) (Farms Sorted By Rate of Return on Assets - Mkt) Avg. Of All Farms Low 25% High 25% Number of farms 20 5 6 Operator Information Average number of operators 1.4 1.5 1.2 Average age of operators 52.0 49.2 53.9 Average number of years farming 26.3 28.5 26.3 Results Per Operator Working capital 76,861 46,640 104,498 Total assets (market) 1,090,757 851,874 1,163,939 Total liabilities 188,387 182,967 137,349 Net worth (market) 902,370 668,907 1,026,591 Net worth excl deferred liabs 906,336 668,907 1,026,591 Gross farm income 283,265 207,126 298,850 Total farm expense 226,013 186,928 217,974 Net farm income from operations 57,252 20,198 80,876 Net nonfarm income 6,978 4,599 8,421 Family living & tax withdrawals 30,845 28,232 27,772 Total acres owned 165.1 161.0 137.7 Total crop acres 235.1 240.5 220.3 Crop acres owned 161.0 116.2 192.0 Crop acres cash rented 73.7 124.3 26.9 Crop acres share rented 0.4 - 1.4 Total pasture acres - - - Labor Analysis Number of farms 20 5 6 Total unpaid labor hours 4,113 4,608 3,277 Total hired labor hours 2,209 2,635 933 Total labor hours per farm 6,322 7,243 4,210 Unpaid hours per operator 3,047 3,072 2,809 Value of farm production / hour 47.27 33.18 66.17 Net farm income / unpaid hour 18.79 6.57 28.80 Average hourly hired labor wage 15.21 15.16 31.71 Partnerships & LLCs Number of farms 5 2 1 Number of operators 2.0 2.0 - Owner withdrawals per farm - - - Withdrawals per operator - - -

37
Table 34 Financial Summary 2011 MI Dairy (40 to 99 Cows) (Farms Sorted By Rate of Return on Assets - Mkt) Avg. Of All Farms Low 25% High 25% Number of farms 20 5 6 Income Statement Gross cash farm income 355,162 301,218 318,010 Total cash farm expense 277,661 270,598 225,073 Net cash farm income 77,501 30,620 92,937 Inventory change 31,401 18,879 37,267 Depreciation -31,612 -19,201 -35,849 Net farm income from operations 77,290 30,298 94,355 Gain or loss on capital sales - - - Average net farm income 77,290 30,298 94,355 Median net farm income 69,123 19,580 104,129 Profitability (cost) Rate of return on assets 11.0 % 2.1 % 16.8 % Rate of return on equity 15.7 % -3.4 % 23.9 % Operating profit margin 19.6 % 4.1 % 26.8 % Asset turnover rate 56.0 % 50.6 % 62.8 % Profitability (market) Rate of return on assets 10.5 % 2.5 % 22.5 % Rate of return on equity 11.8 % 1.5 % 25.6 % Operating profit margin 44.8 % 12.1 % 89.2 % Asset turnover rate 23.5 % 20.8 % 25.2 % Liquidity & Repayment (end of year) Current assets 158,474 109,247 165,384 Current liabilities 54,712 39,287 43,469 Current ratio 2.90 2.78 3.80 Working capital 103,762 69,960 121,914 Working capital to gross inc 27.1 % 22.5 % 35.0 % Term debt coverage ratio 3.00 0.87 4.33 Replacement coverage ratio 2.02 0.68 3.35 Solvency (end of year at cost) Number of farms 20 5 6 Total farm assets 558,002 465,091 479,370 Total farm liabilities 238,566 274,450 160,240 Total assets 641,472 519,185 531,992 Total liabilities 248,969 274,450 160,240 Net worth 392,503 244,735 371,752 Net worth change 54,195 9,134 71,229 Farm debt to asset ratio 43 % 59 % 33 % Total debt to asset ratio 39 % 53 % 30 % Solvency (end of year at market) Number of farms 20 5 6 Total farm assets 1,333,657 1,157,361 1,225,724 Total farm liabilities 243,919 274,450 160,240 Total assets 1,472,523 1,277,810 1,357,929 Total liabilities 254,323 274,450 160,240 Net worth 1,218,200 1,003,360 1,197,689 Net worth change 140,295 22,514 293,807 Farm debt to asset ratio 18 % 24 % 13 % Total debt to asset ratio 17 % 21 % 12 % Nonfarm Information Net nonfarm income 9,420 6,898 9,825 Crop Acres Total acres owned 223 242 161 Total crop acres 317 361 257 Total crop acres owned 217 174 224 Total crop acres cash rented 100 187 31 Total crop acres share rented 1 - 2

38
Table 35 Summary Farm Income Statement 2011 MI Dairy (40 to 99 Cows) (Farms Sorted By Rate of Return on Assets - Mkt) Avg. Of All Farms Low 25% High 25% Number of farms 20 5 6 Crop sales 51,330 14,896 28,297 Crop inventory change 20,249 9,834 22,435 Gross crop income 71,579 24,730 50,733 Livestock sales 278,454 267,280 260,538 Livestock inventory change 1,948 -88 1,437 Gross livestock income 280,402 267,192 261,975 Government payments 3,042 5,736 2,824 Other cash farm income 22,335 13,306 26,351 Change in accounts receivable 1,451 1,275 3,494 Gain or loss on hedging accounts -198 - - Change in other assets 68 0 -247 Gain or loss on breeding lvst 3,728 -1,550 3,528 Gross farm income 382,408 310,689 348,658 Cash operating expenses 265,222 254,101 218,932 Change in prepaids and supplies -1,812 -3,227 -2,813 Change in growing crops -1,652 -941 -3,025 Change in accounts payable -466 -4,871 -739 Depreciation 31,612 19,201 35,849 Total operating expense 292,904 264,264 248,205 Interest paid 12,439 16,497 6,141 Change in accrued interest -227 -370 -42 Total interest expense 12,213 16,127 6,098 Total expenses 305,117 280,391 254,303 Net farm income from operations 77,290 30,298 94,355 Gain or loss on capital sales - - - Net farm income 77,290 30,298 94,355

39
C. Financial Summary Information, Herds with 100-249 Cows Table 36 Crop Production and Marketing Summary 2011 MI Dairy (100 to 249 Cows) (Farms Sorted By Rate of Return on Assets - Mkt) Avg. Of All Farms Low 25% High 25% Dairy Number of farms 45 11 12 Average number of cows 165 165 158 Milk production per cow lbs., 21,732 18,572 22,636 Average milk price per cwt., $20.62 $20.84 $21.13 Acreage Summary Total acres owned 362 541 327 Total crop acres 663 897 500 Crop acres owned 361 493 339 Crop acres cash rented 302 405 161 Crop acres share rented - - - Total pasture acres 1 - 1 Percent crop acres owned 54 % 55 % 68 % Average Price Received (Cash Sales Only) Corn per bushel 5.67 - - Wheat, Winter per bushel 7.05 - -

40
Table 37 Farm Income Statement 2011 MI Dairy (100 to 249 Cows) (Farms Sorted By Rate of Return on Assets - Mkt) Avg. Of All Farms Low 25% High 25% Number of farms 45 11 12 Cash Farm Income Asparagus 222 - - Beans, Navy 836 - 3,422 Corn 33,533 56,251 26,720 Corn Silage 4,036 - 669 Hay, Alfalfa 453 1,422 150 Hay, Mixed 303 111 - Hay, Mixed Alfalfa/Grass 78 - 318 Haylage, Mixed 1,003 1,173 - Oats 279 - - Soybeans 9,588 12,309 22,559 Straw 603 105 439 Wheat, Winter 7,108 9,332 11,154 Miscellaneous crop income 14 - - Beef Finishing 1,441 - - Dairy, Milk 742,649 653,511 716,203 Dairy, Dairy Calves 3,134 2,717 2,848 Dairy Heifers (for sale) 2,507 - 9,493 Dairy Replacement Heifers 342 528 352 Dairy Finishing 11,515 6,000 16,755 Dairy Feeder 2,606 3,346 5,028 Dairy Backgrounding 448 1,831 - User Added Livestock, User Added 2,188 6,841 - Cull breeding livestock 41,259 30,965 52,033 Misc. livestock income 191 125 221 Direct, CCP & ACRE pymts 10,412 18,544 11,980 Livestock govt payments 119 - - Other government payments 5,293 4,583 3,693 Custom work income 3,778 2,803 1,360 Patronage dividends, cash 4,072 3,334 2,465 Insurance income 14,368 20,616 19,950 Other farm income 5,198 5,062 6,644 Gross Cash Farm Income 909,577 841,510 914,454

41
Table 37 Farm Income Statement (Continued) 2011 MI Dairy (100 to 249 Cows) (Farms Sorted By Rate of Return on Assets - Mkt) Avg. Of All Farms Low 25% High 25% Number of farms 45 11 12 Cash Farm Expense Seed 29,523 35,342 28,911 Fertilizer 41,980 72,254 44,168 Crop chemicals 9,531 12,197 4,588 Crop insurance 2,343 2,223 2,019 Drying expense 399 1,634 - Storage 243 993 - Crop packaging and supplies 315 - 1,289 Crop hauling and trucking 240 - 22 Crop marketing 41 18 149 Crop miscellaneous 2,028 940 15 Feeder livestock purchase 355 144 970 Livestock packaging and supplies 1,343 - 5,495 Purchased feed 210,281 180,770 187,819 Breeding fees 6,308 3,724 7,411 Veterinary 17,043 14,263 17,590 Livestock supplies 24,946 24,887 18,367 DHIA 2,042 1,185 2,337 Livestock leases 944 180 - Livestock hauling and trucking 20,505 17,004 21,172 Livestock marketing 9,122 8,796 5,679 Bedding 8,493 7,660 7,719 Interest 26,833 26,238 20,534 Packaging and supplies 1,309 - 683 Supplies 1,223 - 521 Fuel & oil 47,621 51,373 39,564 Repairs 45,365 49,895 30,506 Repair, machinery 5,091 - 10,189 Repair, livestock equip 202 - 827 Custom hire 20,431 17,720 11,798 Repair, buildings 1,437 3,975 1,428 Hired labor 90,750 83,339 70,559 Land rent 19,214 13,945 18,664 Machinery leases 9,550 16,875 10,554 Building leases 865 - 3,540 Real estate taxes 10,000 10,249 4,756 Personal property taxes 215 196 378 Farm insurance 13,150 15,110 11,244 Utilities 20,633 21,437 21,302 Hauling and trucking 1,791 3,408 3,918 Dues & professional fees 7,644 4,254 6,908 Miscellaneous 11,957 14,387 4,999 Total cash expense 723,307 716,615 628,592 Net cash farm income 186,269 124,895 285,862 Inventory Changes Prepaids and supplies 8,898 6,843 20,959

42
Accounts receivable 3,466 1,151 3,311 Hedging accounts -103 - -420 Other current assets -948 1,910 520 Crops and feed 16,714 3,011 26,726 Market livestock -2,104 -7,300 -1,893 Breeding livestock 11,654 2,731 14,034 Other assets 4,067 -929 15,096 Accounts payable -2,887 -11,490 -8,260 Accrued interest 147 -52 -40 Total inventory change 38,906 -4,125 70,033 Net operating profit 225,175 120,770 355,895 Depreciation Machinery and equipment -53,349 -30,084 -62,947 Titled vehicles - - - Buildings and improvements -25,121 -29,858 -34,799 Total depreciation -78,470 -59,942 -97,745 Net farm income from operations 146,705 60,828 258,149 Gain or loss on capital sales 92 378 - Net farm income 146,798 61,206 258,149

43
Table 38 Inventory Changes 2011 MI Dairy (100 to 249 Cows) (Farms Sorted By Rate of Return on Assets - Mkt) Avg. Of All Farms Low 25% High 25% Number of farms 45 11 12 Net cash farm income 186,269 124,895 279,132 Crops and Feed Ending inventory 229,988 233,955 230,824 Beginning inventory 213,274 230,944 205,407 Inventory change 16,714 3,011 25,417 Market Livestock Ending inventory 14,720 15,324 16,131 Beginning inventory 16,824 22,624 17,867 Inventory change -2,104 -7,300 -1,736 Accts Receivable Ending inventory 26,236 22,100 27,831 Beginning inventory 22,770 20,949 24,796 Inventory change 3,466 1,151 3,036 Prepaid Expenses and Supplies Ending inventory 33,502 47,344 49,575 Beginning inventory 24,604 40,500 30,363 Inventory change 8,898 6,843 19,212 Hedging Activities Ending inventory 108 - 406 Withdrawals -103 - -385 Beginning inventory 108 - 406 Deposits - - - Gain or loss -103 - -385 Other Current Assets Ending inventory 15,674 16,047 12,616 Beginning inventory 16,622 14,138 12,240 Inventory change -948 1,910 376 Breeding Livestock Ending inventory 398,603 424,648 323,408 Capital sales 7,878 755 27,520 Beginning inventory 391,754 420,714 331,088 Capital purchases 3,072 1,959 5,431 Depreciation, capital adjust 11,654 2,731 14,410 Other Capital Assets Ending inventory 41,484 22,048 60,369 Capital sales 3,960 1,316 12,716 Beginning inventory 37,766 20,345 57,660 Capital purchases 3,611 3,949 1,587 Depreciation, capital adjust 4,067 -929 13,838 Accounts Payable Beginning inventory 27,892 29,372 4,954 Ending inventory 30,779 40,862 12,573 Inventory change -2,887 -11,490 -7,619 Accrued Interest Beginning inventory 1,034 892 10 Ending inventory 887 944 46 Inventory change 147 -52 -36 Total inventory change 38,906 -4,125 66,513 Net operating profit 225,175 120,770 345,645

44
Table 39 Depreciation 2011 MI Dairy (100 to 249 Cows) (Farms Sorted By Rate of Return on Assets - Mkt) Avg. Of All Farms Low 25% High 25% Number of farms 45 11 12 Net operating profit 225,175 120,770 345,645 Machinery and Equipment Ending inventory 146,372 163,205 133,322 Capital sales 1,993 3,085 311 Beginning inventory 124,568 134,851 112,798 Capital purchases 77,145 61,523 81,227 Depreciation, capital adjust. -53,349 -30,084 -60,392 Titled Vehicles Ending inventory 1,322 - 4,958 Capital sales - - - Beginning inventory 1,322 - 4,958 Capital purchases - - - Depreciation, capital adjust. - - - Buildings and Improvements Ending inventory 156,565 161,626 186,084 Capital sales 4,111 - 15,417 Beginning inventory 147,246 165,979 174,571 Capital purchases 38,551 25,504 60,772 Depreciation, capital adjust. -25,121 -29,858 -33,842 Total depreciation, capital adj. -78,470 -59,942 -94,235 Net farm income from operations 146,705 60,828 251,410 Gain or loss on capital sales 92 378 - Net farm income 146,798 61,206 251,410

45
Table 40 Profitability Measures 2011 MI Dairy (100 to 249 Cows) (Farms Sorted By Rate of Return on Assets - Mkt) Avg. Of All Farms Low 25% High 25% Number of farms 45 11 12 Profitability (assets valued at cost) Net farm income from operations 146,705 60,828 251,410 Rate of return on assets 9.1 % 3.1 % 16.4 % Rate of return on equity 13.8 % 2.4 % 27.2 % Operating profit margin 16.5 % 7.5 % 26.1 % Asset turnover rate 55.3 % 41.3 % 62.7 % Farm interest expense 26,686 26,290 22,145 Value of operator lbr and mgmt. 52,871 37,727 66,667 Return on farm assets 120,520 49,390 206,888 Average farm assets 1,322,819 1,597,922 1,264,972 Return on farm equity 93,834 23,100 184,743 Average farm equity 681,618 976,068 678,045 Value of farm production 731,850 659,261 793,737 Avg. Of All Farms Low 25% High 25% Number of farms 45 11 12 Profitability (assets valued at market) Net farm income from operations 234,709 14,262 504,660 Rate of return on assets 8.8 % 0.1 % 19.5 % Rate of return on equity 10.6 % -1.1 % 24.7 % Operating profit margin 28.5 % 0.4 % 58.0 % Asset turnover rate 31.1 % 23.1 % 33.6 % Farm interest expense 26,686 26,290 22,145 Value of operator lbr and mgmt. 52,871 37,727 66,667 Return on farm assets 208,523 2,825 460,138 Average farm assets 2,356,371 2,851,168 2,359,369 Return on farm equity 181,838 -23,465 437,993 Average farm equity 1,715,171 2,229,314 1,772,442 Value of farm production 731,850 659,261 793,737

46
Table 41 Liquidity & Repayment Capacity Measures 2011 MI Dairy (100 to 249 Cows) (Farms Sorted By Rate of Return on Assets - Mkt) Avg. Of All Farms Low 25% High 25% Number of farms 45 11 12 Liquidity Current ratio 2.68 2.32 4.49 Working capital 223,026 226,916 278,725 Working capital to gross inc 23.7 % 27.0 % 28.0 % Current assets 356,053 398,393 358,674 Current liabilities 133,027 171,477 79,949 Gross revenues (accrual) 942,486 840,174 995,578 Repayment capacity Net farm income from operations 146,705 60,828 251,410 Depreciation 78,470 59,942 94,235 Personal income 6,356 5,542 3,500 Family living/owner withdrawals -59,553 -54,198 -73,542 Payments on personal debt -723 - -651 Income taxes paid -1,332 -4,197 23 Interest on term debt 32,074 29,068 24,918 Capital debt repayment capacity 201,997 96,985 299,893 Scheduled term debt payments -77,158 -63,122 -77,342 Capital debt repayment margin 124,839 33,863 222,551 Cash replacement allowance -23,628 -29,340 -20,301 Replacement margin 101,211 4,522 202,250 Term debt coverage ratio 2.62 1.54 3.88 Replacement coverage ratio 2.00 1.05 3.07

47
Table 42 Balance Sheet at Cost Values 2011 MI Dairy (100 to 249 Cows)
(Farms Sorted By Rate of Return on Assets - Mkt) Avg. Of All Farms Low 25% High 25% Number of farms 45 11 12 Beginning Ending Beginning Ending Beginning Ending Assets Current Farm Assets Cash and checking balance 23,259 35,825 61,024 63,622 14,005 21,290 Prepaid expenses & supplies 24,604 33,502 40,500 47,344 30,363 49,575 Growing crops 15,836 15,674 14,138 16,047 12,240 12,616 Accounts receivable 22,770 26,236 20,949 22,100 24,796 27,831 Hedging accounts 108 108 0 0 406 406 Crops held for sale or feed 213,274 229,988 230,944 233,955 205,407 230,824 Crops under government loan 0 0 0 0 0 0 Market livestock held for sale 16,824 14,720 22,624 15,324 17,867 16,131 Other current assets 786 0 0 0 0 0 Total current farm assets 317,460 356,053 390,179 398,393 305,084 358,674 Intermediate Farm Assets Breeding livestock 391,754 398,603 420,714 424,648 331,088 323,408 Machinery and equipment 124,568 146,372 134,851 163,205 112,798 133,322 Titled vehicles 1,322 1,322 0 0 4,958 4,958 Other intermediate assets 26,570 29,038 11,442 12,313 51,645 52,441 Total intermediate farm assets 544,215 575,335 567,007 600,166 500,489 514,130 Long Term Farm Assets Farm land 261,860 263,260 446,929 446,929 235,859 241,109 Buildings and improvements 147,246 156,565 165,979 161,626 174,571 186,084 Other long-term assets 11,196 12,446 8,903 9,735 6,015 7,928 Total long-term farm assets 420,303 432,271 621,811 618,289 416,445 435,121 Total Farm Assets 1,281,978 1,363,659 1,578,996 1,616,848 1,222,018 1,307,925 Total Nonfarm Assets 76,401 79,570 196,622 196,243 54,171 55,155 Total Assets 1,358,379 1,443,230 1,775,619 1,813,091 1,276,189 1,363,081 Liabilities Current Farm Liabilities Accrued interest 1,034 887 892 944 10 46 Accounts payable 27,892 30,779 29,372 40,862 4,954 12,573 Current notes 57,695 54,166 81,900 85,125 43,165 14,862 Government crop loans 0 0 0 0 0 0 Principal due on term debt 45,084 47,195 34,054 44,546 52,425 52,468 Total current farm liabilities 131,705 133,027 146,218 171,477 100,553 79,949 Total intermediate farm liabs 180,077 166,479 133,618 117,674 274,101 257,994 Total long term farm liabilities 328,390 342,724 332,740 341,981 241,810 219,448 Total farm liabilities 640,171 642,229 612,576 631,132 616,464 557,390 Total nonfarm liabilities 6,818 5,384 3,875 2,663 3,433 0 Total liabilities 646,989 647,613 616,451 633,795 619,897 557,390 Net worth (farm and nonfarm) 711,390 795,616 1,159,168 1,179,297 656,292 805,691 Net worth change 84,227 20,128 149,399 Percent net worth change 12 % 2 % 23 % Ratio Analysis Current farm liabilities / assets 41 % 37 % 37 % 43 % 33 % 22 % Intermediate farm liab. / assets 33 % 29 % 24 % 20 % 55 % 50 % Long term farm liab. / assets 78 % 79 % 54 % 55 % 58 % 50 % Total debt to asset ratio 48 % 45 % 35 % 35 % 49 % 41 %

48
Table 43 Balance Sheet at Market Values 2011 MI Dairy (100 to 249 Cows)
(Farms Sorted By Rate of Return on Assets - Mkt) Avg. Of All Farms Low 25% High 25% Number of farms 45 11 12 Beginning Ending Beginning Ending Beginning Ending Assets Current Farm Assets Cash and checking balance 23,259 35,825 61,024 63,622 14,005 21,290 Prepaid expenses & supplies 24,604 33,502 40,500 47,344 30,363 49,575 Growing crops 15,836 15,674 14,138 16,047 12,240 12,616 Accounts receivable 22,770 26,236 20,949 22,100 24,796 27,831 Hedging accounts 108 108 0 0 406 406 Crops held for sale or feed 213,274 229,988 230,944 233,955 205,407 230,824 Crops under government loan 0 0 0 0 0 0 Market livestock held for sale 16,824 14,720 22,624 15,324 17,867 16,131 Other current assets 786 0 0 0 0 0 Total current farm assets 317,460 356,053 390,179 398,393 305,084 358,674 Intermediate Farm Assets Breeding livestock 419,400 427,885 420,714 424,648 389,492 385,592 Machinery and equipment 414,067 462,991 430,306 435,668 403,571 468,338 Titled vehicles 8,875 10,907 8,591 8,409 12,067 17,733 Other intermediate assets 34,934 37,417 36,169 37,041 60,301 61,153 Total intermediate farm assets 877,275 939,200 895,780 905,766 865,431 932,816 Long Term Farm Assets Farm land 720,325 775,595 1,181,698 1,181,698 633,631 822,344 Buildings and improvements 342,595 355,931 374,548 347,798 378,021 407,255 Other long-term assets 13,873 14,434 13,320 13,157 7,623 7,858 Total long-term farm assets 1,076,793 1,145,960 1,569,566 1,542,653 1,019,276 1,237,457 Total Farm Assets 2,271,529 2,441,214 2,855,525 2,846,811 2,189,791 2,528,948 Total Nonfarm Assets 185,738 194,419 283,058 300,608 149,454 152,632 Total Assets 2,457,266 2,635,632 3,138,583 3,147,418 2,339,244 2,681,580 Liabilities Current Farm Liabilities Accrued interest 1,034 887 892 944 10 46 Accounts payable 27,892 30,779 29,372 40,862 4,954 12,573 Current notes 57,695 54,166 81,900 85,125 43,165 14,862 Government crop loans 0 0 0 0 0 0 Principal due on term debt 45,084 47,195 34,054 44,546 52,425 52,468 Total current farm liabilities 131,705 133,027 146,218 171,477 100,553 79,949 Total intermediate farm liabs 180,077 166,479 133,618 117,674 274,101 257,994 Total long term farm liabilities 328,390 342,724 332,740 341,981 241,810 219,448 Total farm liabilities 640,171 642,229 612,576 631,132 616,464 557,390 Total nonfarm liabilities 6,818 5,384 3,875 2,663 3,433 0 Total liabs excluding deferreds 646,989 647,613 616,451 633,795 619,897 557,390 Total deferred liabilities 0 0 0 0 0 0 Total liabilities 646,989 647,613 616,451 633,795 619,897 557,390 Retained earnings 711,390 795,616 1,159,168 1,179,297 656,292 805,691 Market valuation equity 1,098,887 1,192,403 1,362,965 1,334,327 1,063,056 1,318,499 Net worth (farm and nonfarm) 1,810,277 1,988,019 2,522,133 2,513,624 1,719,348 2,124,190 Net worth excluding deferreds 1,810,277 1,988,019 2,522,133 2,513,624 1,719,348 2,124,190 Net worth change 177,742 -8,509 404,842 Percent net worth change 10 % 0 % 24 % Ratio Analysis Current farm liabilities / assets 41 % 37 % 37 % 43 % 33 % 22 % Intermediate farm liab. / assets 21 % 18 % 15 % 13 % 32 % 28 % Long term farm liab. / assets 30 % 30 % 21 % 22 % 24 % 18 % Total debt to asset ratio 26 % 25 % 20 % 20 % 26 % 21 % Debt to assets excl deferreds 26 % 25 % 20 % 20 % 26 % 21 %

49
Table 44 Statement Of Cash Flows 2011 MI Dairy (100 to 249 Cows) (Farms Sorted By Rate of Return on Assets - Mkt) Avg. Of All Farms Low 25% High 25% Number of farms 45 11 12 Beginning cash (farm & nonfarm) 42,987 141,504 14,213 Cash Provided By Operating Activities Gross cash farm income 909,577 841,510 940,999 Total cash farm expense -723,307 -716,615 -661,867 Net cash from hedging transactions -103 - -385 Cash provided by operating 186,167 124,895 278,747 Cash Provided By Investing Activities Sale of breeding livestock 7,878 755 27,520 Sale of machinery & equipment 2,085 3,463 311 Sale of titled vehicles - - - Sale of farm land - - - Sale of farm buildings 4,111 - 15,417 Sale of other farm assets 3,960 1,316 12,716 Sale of nonfarm assets 2 - 7 Purchase of breeding livestock -3,072 -1,959 -5,431 Purchase of machinery & equip. -77,145 -61,523 -81,227 Purchase of titled vehicles - - - Purchase of farm land -4,279 -2,341 -13,901 Purchase of farm buildings -38,551 -25,504 -60,772 Purchase of other farm assets -3,611 -3,949 -1,587 Purchase of nonfarm assets -147 -29 -438 Cash provided by investing -108,769 -89,769 -107,386 Cash Provided By Financing Activities Money borrowed 194,100 228,577 92,823 Principal payments -196,097 -222,291 -162,985 Personal income 6,356 5,542 3,500 Family living/owner withdrawals -59,553 -54,198 -73,542 Income and social security tax -1,332 -4,197 23 Capital contributions 4,692 - 1,404 Capital distributions -6,524 582 - Dividends paid 178 727 - Cash gifts and inheritances -729 6,699 2,301 Gifts given -7,137 1,061 -27,600 Other cash flows - - - Cash provided by financing -66,047 -37,498 -164,076 Net change in cash balance 11,351 -2,372 7,285 Ending cash (farm & nonfarm) 54,338 139,132 21,499

50
Table 45 Financial Standards Measures 2011 MI Dairy (100 to 249 Cows) (Farms Sorted By Rate of Return on Assets - Mkt) Avg. Of All Farms Low 25% High 25% Number of farms 45 11 12 Liquidity Current ratio 2.68 2.32 4.49 Working capital 223,026 226,916 278,725 Working capital to gross inc 23.7 % 27.0 % 28.0 % Solvency (market) Farm debt to asset ratio 26 % 22 % 22 % Farm equity to asset ratio 74 % 78 % 78 % Farm debt to equity ratio 0.36 0.28 0.28 Profitability (cost) Rate of return on farm assets 9.1 % 3.1 % 16.4 % Rate of return on farm equity 13.8 % 2.4 % 27.2 % Operating profit margin 16.5 % 7.5 % 26.1 % Net farm income 146,798 61,206 251,410 EBIDTA 251,861 147,060 367,790 Repayment Capacity Capital debt repayment capacity 201,997 96,985 299,893 Capital debt repayment margin 124,839 33,863 222,551 Replacement margin 101,211 4,522 202,250 Term debt coverage ratio 2.62 1.54 3.88 Replacement coverage ratio 2.00 1.05 3.07 Efficiency Asset turnover rate (cost) 55.3 % 41.3 % 62.7 % Operating expense ratio 73.3 % 82.5 % 63.1 % Depreciation expense ratio 8.3 % 7.1 % 9.5 % Interest expense ratio 2.8 % 3.1 % 2.2 % Net farm income ratio 15.6 % 7.3 % 25.3 %
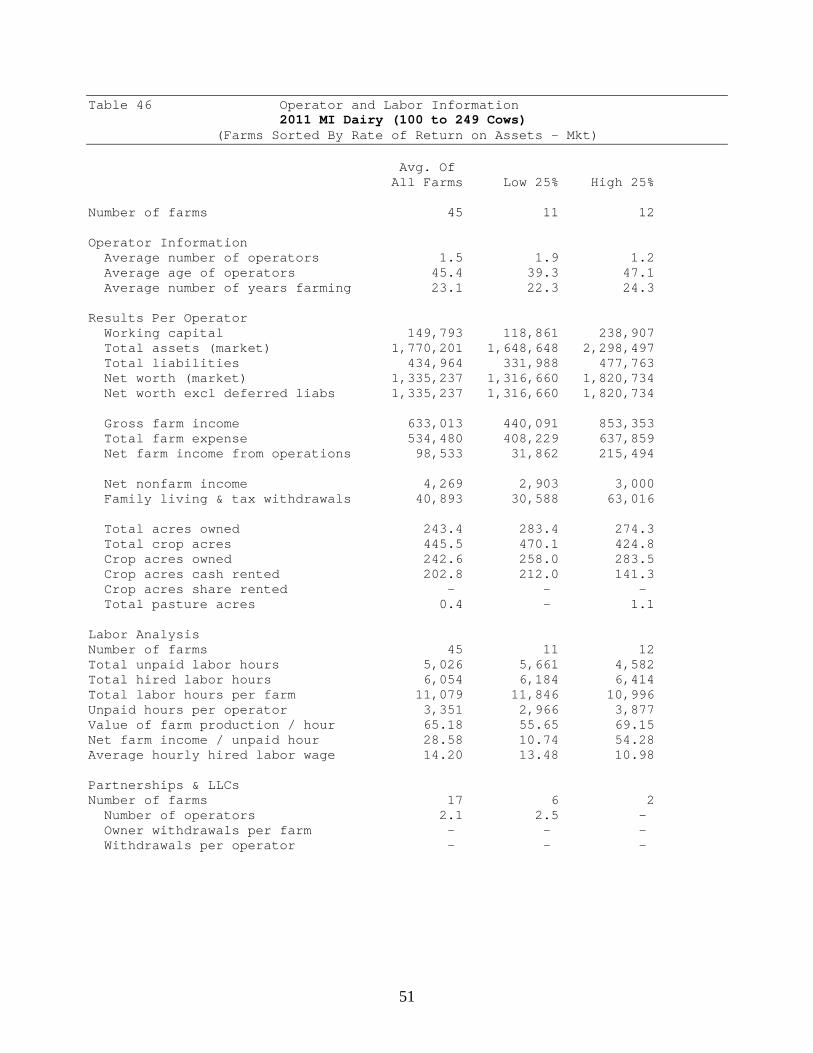
51
Table 46 Operator and Labor Information 2011 MI Dairy (100 to 249 Cows) (Farms Sorted By Rate of Return on Assets - Mkt) Avg. Of All Farms Low 25% High 25% Number of farms 45 11 12 Operator Information Average number of operators 1.5 1.9 1.2 Average age of operators 45.4 39.3 47.1 Average number of years farming 23.1 22.3 24.3 Results Per Operator Working capital 149,793 118,861 238,907 Total assets (market) 1,770,201 1,648,648 2,298,497 Total liabilities 434,964 331,988 477,763 Net worth (market) 1,335,237 1,316,660 1,820,734 Net worth excl deferred liabs 1,335,237 1,316,660 1,820,734 Gross farm income 633,013 440,091 853,353 Total farm expense 534,480 408,229 637,859 Net farm income from operations 98,533 31,862 215,494 Net nonfarm income 4,269 2,903 3,000 Family living & tax withdrawals 40,893 30,588 63,016 Total acres owned 243.4 283.4 274.3 Total crop acres 445.5 470.1 424.8 Crop acres owned 242.6 258.0 283.5 Crop acres cash rented 202.8 212.0 141.3 Crop acres share rented - - - Total pasture acres 0.4 - 1.1 Labor Analysis Number of farms 45 11 12 Total unpaid labor hours 5,026 5,661 4,582 Total hired labor hours 6,054 6,184 6,414 Total labor hours per farm 11,079 11,846 10,996 Unpaid hours per operator 3,351 2,966 3,877 Value of farm production / hour 65.18 55.65 69.15 Net farm income / unpaid hour 28.58 10.74 54.28 Average hourly hired labor wage 14.20 13.48 10.98 Partnerships & LLCs Number of farms 17 6 2 Number of operators 2.1 2.5 - Owner withdrawals per farm - - - Withdrawals per operator - - -

52
Table 47 Financial Summary 2011 MI Dairy (100 to 249 Cows) (Farms Sorted By Rate of Return on Assets - Mkt) Avg. Of All Farms Low 25% High 25% Number of farms 45 11 12 Income Statement Gross cash farm income 909,577 841,510 940,999 Total cash farm expense 723,307 716,615 661,867 Net cash farm income 186,269 124,895 279,132 Inventory change 38,906 -4,125 66,513 Depreciation -78,470 -59,942 -94,235 Net farm income from operations 146,705 60,828 251,410 Gain or loss on capital sales 92 378 - Average net farm income 146,798 61,206 251,410 Median net farm income 116,888 50,670 219,213 Profitability (cost) Rate of return on assets 9.1 % 3.1 % 16.4 % Rate of return on equity 13.8 % 2.4 % 27.2 % Operating profit margin 16.5 % 7.5 % 26.1 % Asset turnover rate 55.3 % 41.3 % 62.7 % Profitability (market) Rate of return on assets 8.8 % 0.1 % 19.5 % Rate of return on equity 10.6 % -1.1 % 24.7 % Operating profit margin 28.5 % 0.4 % 58.0 % Asset turnover rate 31.1 % 23.1 % 33.6 % Liquidity & Repayment (end of year) Current assets 356,053 398,393 358,674 Current liabilities 133,027 171,477 79,949 Current ratio 2.68 2.32 4.49 Working capital 223,026 226,916 278,725 Working capital to gross inc 23.7 % 27.0 % 28.0 % Term debt coverage ratio 2.62 1.54 3.88 Replacement coverage ratio 2.00 1.05 3.07 Solvency (end of year at cost) Number of farms 45 11 12 Total farm assets 1,363,659 1,616,848 1,307,925 Total farm liabilities 642,229 631,132 557,390 Total assets 1,443,230 1,813,091 1,363,081 Total liabilities 647,613 633,795 557,390 Net worth 795,616 1,179,297 805,691 Net worth change 84,227 20,128 149,399 Farm debt to asset ratio 47 % 39 % 43 % Total debt to asset ratio 45 % 35 % 41 % Solvency (end of year at market) Number of farms 45 11 12 Total farm assets 2,441,214 2,846,811 2,528,948 Total farm liabilities 642,229 631,132 557,390 Total assets 2,635,632 3,147,418 2,681,580 Total liabilities 647,613 633,795 557,390 Net worth 1,988,019 2,513,624 2,124,190 Net worth change 177,742 -8,509 404,842 Farm debt to asset ratio 26 % 22 % 22 % Total debt to asset ratio 25 % 20 % 21 % Nonfarm Information Net nonfarm income 6,356 5,542 3,500 Crop Acres Total acres owned 362 541 320 Total crop acres 663 897 496 Total crop acres owned 361 493 331 Total crop acres cash rented 302 405 165 Total crop acres share rented - - -

53
Table 48 Summary Farm Income Statement 2011 MI Dairy (100 to 249 Cows) (Farms Sorted By Rate of Return on Assets - Mkt) Avg. Of All Farms Low 25% High 25% Number of farms 45 11 12 Crop sales 58,058 80,702 65,430 Crop inventory change 16,714 3,011 26,726 Gross crop income 74,772 83,714 92,156 Livestock sales 766,859 674,900 750,680 Livestock inventory change -2,104 -7,300 -1,893 Gross livestock income 764,756 667,601 748,786 Government payments 15,824 23,127 15,672 Other cash farm income 68,835 62,781 82,672 Change in accounts receivable 3,466 1,151 3,311 Gain or loss on hedging accounts -103 - -420 Change in other assets 3,282 -929 15,096 Gain or loss on breeding lvst 11,654 2,731 14,034 Gross farm income 942,486 840,174 971,308 Cash operating expenses 696,474 690,377 608,058 Change in prepaids and supplies -8,898 -6,843 -20,959 Change in growing crops 163 -1,910 -520 Change in accounts payable 2,887 11,490 8,260 Depreciation 78,470 59,942 97,745 Total operating expense 769,095 753,057 692,584 Interest paid 26,833 26,238 20,534 Change in accrued interest -147 52 40 Total interest expense 26,686 26,290 20,574 Total expenses 795,781 779,347 713,158 Net farm income from operations 146,705 60,828 258,149 Gain or loss on capital sales 92 378 - Net farm income 146,798 61,206 258,149

54
D. Financial Summary Information, Herds with 250 – 449 Cows Table 49 Crop Production and Marketing Summary 2011 MI Dairy (250 to 449 Cows) (Farms Sorted By Rate of Return on Assets - Mkt) Avg. Of All Farms Low 25% High 25% Dairy Number of farms 18 5 5 Average number of cows 315 315 311 Milk production per cow lbs., 25,370 25,130 26,444 Average milk price per cwt., $20.56 $20.66 $20.76 Acreage Summary Total acres owned 514 718 444 Total crop acres 997 1,092 809 Crop acres owned 630 850 422 Crop acres cash rented 365 230 387 Crop acres share rented 3 12 - Total pasture acres - - - Percent crop acres owned 63 % 78 % 52 % Average Price Received (Cash Sales Only) Corn per bushel 5.74 - - Wheat, Winter per bushel 7.37 - - Soybeans per bushel 12.64 - - Corn Silage per ton 50.08 - -

55
Table 50 Farm Income Statement 2011 MI Dairy (250 to 449 Cows) (Farms Sorted By Rate of Return on Assets - Mkt) Avg. Of All Farms Low 25% High 25% Number of farms 18 5 5 Cash Farm Income Corn 49,183 36,385 17,594 Corn Silage 11,441 3,728 - Hay, Mixed 184 - 500 Haylage, Mixed 1,897 - - Oats 656 767 - Soybeans 29,852 68,479 - Sugar Beets 28,902 - 98,268 Wheat, Winter 19,591 20,696 37,360 Miscellaneous crop income 12 - - Dairy, Milk 1,624,723 1,740,522 1,689,782 Dairy, Dairy Calves 19,514 3,361 46,728 Dairy Replacement Heifers 113 - - Dairy Finishing 12,372 50,705 - Dairy Feeder 3,863 - - Dairy Backgrounding 4,168 17,714 - Cull breeding livestock 80,725 78,618 91,214 Misc. livestock income 1,637 1,283 4,343 Direct, CCP & ACRE pymts 5,606 14,228 4,276 Other government payments 10,138 7,306 7,494 Custom work income 8,214 5,446 1,312 Patronage dividends, cash 12,090 6,968 14,363 Insurance income 13,244 38,474 10,062 Other farm income 25,840 73,841 10,707 Gross Cash Farm Income 1,963,964 2,168,518 2,034,001

56
Table 50 Farm Income Statement (Continued) 2011 MI Dairy (250 to 449 Cows) (Farms Sorted By Rate of Return on Assets - Mkt) Avg. Of All Farms Low 25% High 25% Number of farms 18 5 5 Cash Farm Expense Seed 50,804 47,045 46,819 Fertilizer 68,782 87,029 38,461 Crop chemicals 16,834 23,543 8,667 Crop insurance 4,052 4,284 -51 Drying expense 1,710 4,343 - Storage 556 365 - Crop miscellaneous 6,535 4,850 2,313 Feeder livestock purchase 87 - 296 Purchased feed 526,071 555,568 586,017 Breeding fees 15,475 19,836 17,384 Veterinary 50,613 53,175 41,650 Supplies 52,485 78,736 36,910 DHIA 4,500 3,264 4,953 Livestock hauling and trucking 41,114 49,655 38,236 Marketing 17,152 12,808 18,622 Bedding 26,462 27,609 23,646 Interest 51,567 75,524 23,447 Packaging and supplies 3,859 - 13,119 Fuel & oil 82,978 111,263 72,185 Repairs 87,370 117,634 66,306 Custom hire 46,513 62,109 36,605 Repair, buildings 1,458 1,018 1,767 Hired labor 214,646 256,496 186,989 Land rent 53,171 92,022 34,695 Machinery leases 7,534 8,854 915 Building leases 4,109 1,625 12,672 Real estate taxes 13,792 17,841 11,333 Personal property taxes 509 - 1,490 Farm insurance 23,107 46,372 16,773 Utilities 38,502 51,340 32,435 Hauling and trucking 4,599 - 7,935 Dues & professional fees 9,352 11,558 5,470 Miscellaneous 21,711 23,354 13,250 Total cash expense 1,548,008 1,849,117 1,401,310 Net cash farm income 415,956 319,401 632,691 Inventory Changes Prepaids and supplies 15,016 -12,317 17,318 Accounts receivable 15,154 17,400 56,558 Hedging accounts -2,947 - - Other current assets 2,057 721 3,394 Crops and feed 105,610 -3,039 206,704 Market livestock 4,135 4,631 13,725 Breeding livestock 28,762 31,109 31,815 Other assets -1,911 - 8,440 Accounts payable 16,253 12,296 17,331

57
Accrued interest 671 -142 132 Total inventory change 182,800 50,659 355,415 Net operating profit 598,756 370,059 988,106 Depreciation Machinery and equipment -109,890 -79,873 -174,981 Titled vehicles -847 -3,250 -240 Buildings and improvements -69,022 -38,542 -130,675 Total depreciation -179,759 -121,665 -305,895 Net farm income from operations 418,996 248,394 682,211 Gain or loss on capital sales - - - Net farm income 418,996 248,394 682,211
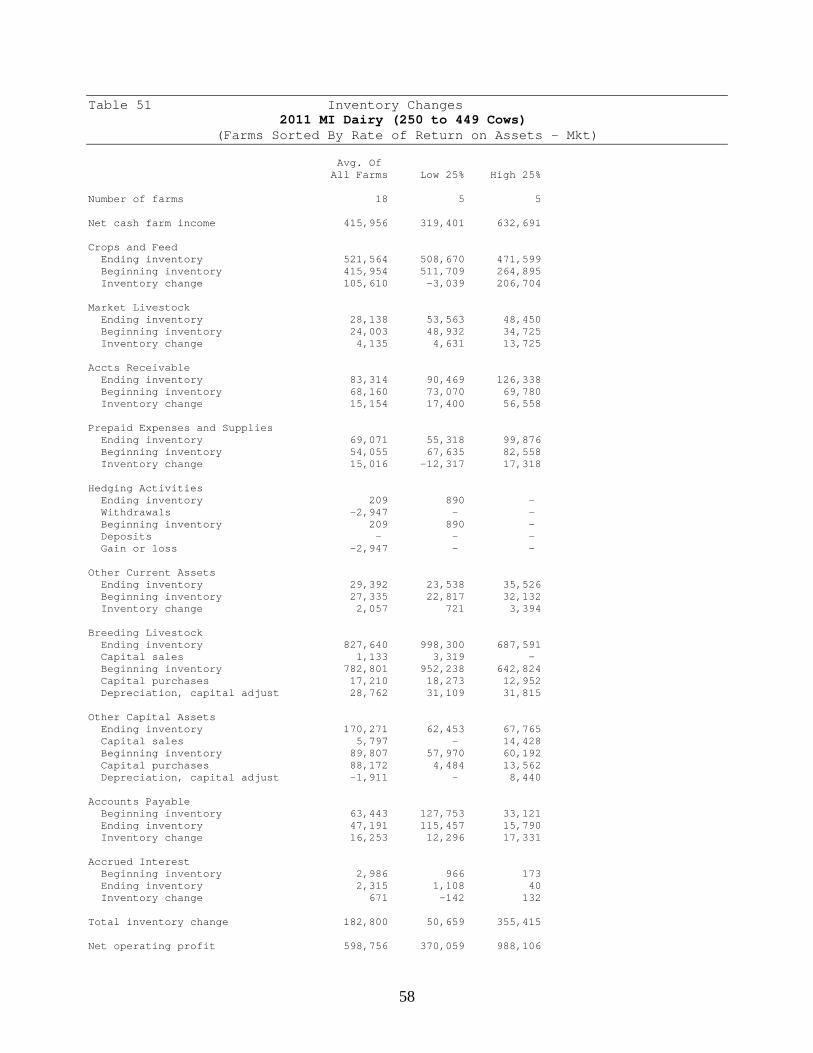
58
Table 51 Inventory Changes 2011 MI Dairy (250 to 449 Cows) (Farms Sorted By Rate of Return on Assets - Mkt) Avg. Of All Farms Low 25% High 25% Number of farms 18 5 5 Net cash farm income 415,956 319,401 632,691 Crops and Feed Ending inventory 521,564 508,670 471,599 Beginning inventory 415,954 511,709 264,895 Inventory change 105,610 -3,039 206,704 Market Livestock Ending inventory 28,138 53,563 48,450 Beginning inventory 24,003 48,932 34,725 Inventory change 4,135 4,631 13,725 Accts Receivable Ending inventory 83,314 90,469 126,338 Beginning inventory 68,160 73,070 69,780 Inventory change 15,154 17,400 56,558 Prepaid Expenses and Supplies Ending inventory 69,071 55,318 99,876 Beginning inventory 54,055 67,635 82,558 Inventory change 15,016 -12,317 17,318 Hedging Activities Ending inventory 209 890 - Withdrawals -2,947 - - Beginning inventory 209 890 - Deposits - - - Gain or loss -2,947 - - Other Current Assets Ending inventory 29,392 23,538 35,526 Beginning inventory 27,335 22,817 32,132 Inventory change 2,057 721 3,394 Breeding Livestock Ending inventory 827,640 998,300 687,591 Capital sales 1,133 3,319 - Beginning inventory 782,801 952,238 642,824 Capital purchases 17,210 18,273 12,952 Depreciation, capital adjust 28,762 31,109 31,815 Other Capital Assets Ending inventory 170,271 62,453 67,765 Capital sales 5,797 - 14,428 Beginning inventory 89,807 57,970 60,192 Capital purchases 88,172 4,484 13,562 Depreciation, capital adjust -1,911 - 8,440 Accounts Payable Beginning inventory 63,443 127,753 33,121 Ending inventory 47,191 115,457 15,790 Inventory change 16,253 12,296 17,331 Accrued Interest Beginning inventory 2,986 966 173 Ending inventory 2,315 1,108 40 Inventory change 671 -142 132 Total inventory change 182,800 50,659 355,415 Net operating profit 598,756 370,059 988,106

59
Table 52 Depreciation 2011 MI Dairy (250 to 449 Cows) (Farms Sorted By Rate of Return on Assets - Mkt) Avg. Of All Farms Low 25% High 25% Number of farms 18 5 5 Net operating profit 598,756 370,059 988,106 Machinery and Equipment Ending inventory 290,425 161,327 241,556 Capital sales 2,040 293 2,240 Beginning inventory 228,127 150,620 209,442 Capital purchases 174,229 90,872 209,334 Depreciation, capital adjust. -109,890 -79,873 -174,981 Titled Vehicles Ending inventory 1,424 - 4,840 Capital sales - - - Beginning inventory 2,259 3,250 5,080 Capital purchases 12 - - Depreciation, capital adjust. -847 -3,250 -240 Buildings and Improvements Ending inventory 343,535 316,342 310,861 Capital sales - - - Beginning inventory 319,345 324,370 269,373 Capital purchases 93,212 30,514 172,162 Depreciation, capital adjust. -69,022 -38,542 -130,675 Total depreciation, capital adj. -179,759 -121,665 -305,895 Net farm income from operations 418,996 248,394 682,211 Gain or loss on capital sales - - - Net farm income 418,996 248,394 682,211

60
Table 53 Profitability Measures 2011 MI Dairy (250 to 449 Cows) (Farms Sorted By Rate of Return on Assets - Mkt) Avg. Of All Farms Low 25% High 25% Number of farms 18 5 5 Profitability (assets valued at cost) Net farm income from operations 418,996 248,394 682,211 Rate of return on assets 13.5 % 8.0 % 25.7 % Rate of return on equity 20.9 % 15.0 % 33.3 % Operating profit margin 23.4 % 14.2 % 33.0 % Asset turnover rate 57.7 % 56.4 % 78.0 % Farm interest expense 50,896 75,666 23,315 Value of operator lbr and mgmt. 99,309 87,500 123,000 Return on farm assets 370,584 236,561 582,526 Average farm assets 2,750,094 2,948,418 2,262,399 Return on farm equity 319,687 160,894 559,211 Average farm equity 1,526,750 1,071,112 1,678,960 Value of farm production 1,586,812 1,662,938 1,765,709 Avg. Of All Farms Low 25% High 25% Number of farms 18 5 5 Profitability (assets valued at market) Net farm income from operations 589,500 272,387 1,144,324 Rate of return on assets 12.0 % 5.0 % 23.8 % Rate of return on equity 15.0 % 5.5 % 26.9 % Operating profit margin 34.1 % 15.7 % 59.2 % Asset turnover rate 35.3 % 31.7 % 40.2 % Farm interest expense 50,896 75,666 23,315 Value of operator lbr and mgmt. 99,309 87,500 123,000 Return on farm assets 541,087 260,554 1,044,639 Average farm assets 4,496,698 5,242,293 4,387,047 Return on farm equity 490,190 184,887 1,021,324 Average farm equity 3,273,354 3,364,987 3,803,608 Value of farm production 1,586,812 1,662,938 1,765,709

61
Table 54 Liquidity & Repayment Capacity Measures 2011 MI Dairy (250 to 449 Cows) (Farms Sorted By Rate of Return on Assets - Mkt) Avg. Of All Farms Low 25% High 25% Number of farms 18 5 5 Liquidity Current ratio 3.96 2.10 10.00 Working capital 581,439 394,009 767,289 Working capital to gross inc 27.5 % 17.8 % 32.6 % Current assets 777,746 750,598 852,523 Current liabilities 196,307 356,588 85,234 Gross revenues (accrual) 2,112,970 2,218,505 2,352,022 Repayment capacity Net farm income from operations 418,996 248,394 682,211 Depreciation 179,759 121,665 305,895 Personal income 8,773 16,703 4,969 Family living/owner withdrawals -90,136 -91,665 -127,667 Payments on personal debt -1,356 - -4,611 Income taxes paid -59 - - Interest on term debt 53,658 80,179 18,476 Capital debt repayment capacity 569,636 375,276 879,274 Scheduled term debt payments -138,397 -185,258 -66,541 Capital debt repayment margin 431,239 190,018 812,733 Cash replacement allowance -31,231 -11,952 -67,167 Replacement margin 400,008 178,065 745,566 Term debt coverage ratio 4.12 2.03 13.21 Replacement coverage ratio 3.36 1.90 6.58

62
Table 55 Balance Sheet at Cost Values 2011 MI Dairy (250 to 449 Cows)
(Farms Sorted By Rate of Return on Assets - Mkt) Avg. Of All Farms Low 25% High 25% Number of farms 18 5 5 Beginning Ending Beginning Ending Beginning Ending Assets Current Farm Assets Cash and checking balance 43,489 46,058 24,315 18,150 51,111 70,736 Prepaid expenses & supplies 54,055 69,071 67,635 55,318 82,558 99,876 Growing crops 27,011 28,866 21,692 22,527 31,932 34,546 Accounts receivable 68,160 83,314 73,070 90,469 69,780 126,338 Hedging accounts 209 209 890 890 0 0 Crops held for sale or feed 415,954 521,564 511,709 508,670 264,895 471,599 Crops under government loan 0 0 0 0 0 0 Market livestock held for sale 24,003 28,138 48,932 53,563 34,725 48,450 Other current assets 324 526 1,125 1,012 200 980 Total current farm assets 633,206 777,746 749,367 750,598 535,201 852,523 Intermediate Farm Assets Breeding livestock 782,801 827,640 952,238 998,300 642,824 687,591 Machinery and equipment 228,127 290,425 150,620 161,327 209,442 241,556 Titled vehicles 2,259 1,424 3,250 0 5,080 4,840 Other intermediate assets 70,852 147,764 26,205 26,856 41,902 39,073 Total intermediate farm assets 1,084,039 1,267,253 1,132,312 1,186,483 899,248 973,060 Long Term Farm Assets Farm land 489,525 544,079 637,302 732,702 325,814 311,737 Buildings and improvements 319,345 343,535 324,370 316,342 269,373 310,861 Other long-term assets 18,955 22,507 31,765 35,597 18,289 28,692 Total long-term farm assets 827,825 910,121 993,437 1,084,641 613,477 651,290 Total Farm Assets 2,545,069 2,955,119 2,875,116 3,021,721 2,047,925 2,476,873 Total Nonfarm Assets 298,445 299,858 37,696 47,309 783,893 776,689 Total Assets 2,843,514 3,254,977 2,912,811 3,069,031 2,831,818 3,253,562 Liabilities Current Farm Liabilities Accrued interest 2,986 2,315 966 1,108 173 40 Accounts payable 63,443 47,191 127,753 115,457 33,121 15,790 Current notes 64,171 62,821 159,590 142,939 7,734 26,561 Government crop loans 0 0 0 0 0 0 Principal due on term debt 84,739 83,980 105,079 97,084 48,064 42,843 Total current farm liabilities 215,339 196,307 393,388 356,588 89,092 85,234 Total intermediate farm liabs 283,759 315,406 370,692 370,600 189,345 206,090 Total long term farm liabilities 684,205 751,674 1,119,574 1,143,771 337,989 259,128 Total farm liabilities 1,183,302 1,263,387 1,883,654 1,870,959 616,426 550,452 Total nonfarm liabilities 13,045 11,088 0 0 37,008 32,061 Total liabilities 1,196,347 1,274,475 1,883,654 1,870,959 653,434 582,512 Net worth (farm and nonfarm) 1,647,167 1,980,502 1,029,157 1,198,071 2,178,384 2,671,049 Net worth change 333,335 168,915 492,665 Percent net worth change 20 % 16 % 23 % Ratio Analysis Current farm liabilities / assets 34 % 25 % 52 % 48 % 17 % 10 % Intermediate farm liab. / assets 26 % 25 % 33 % 31 % 21 % 21 % Long term farm liab. / assets 83 % 83 % 113 % 105 % 55 % 40 % Total debt to asset ratio 42 % 39 % 65 % 61 % 23 % 18 %

63
Table 56 Balance Sheet at Market Values 2011 MI Dairy (250 to 449 Cows)
(Farms Sorted By Rate of Return on Assets - Mkt) Avg. Of All Farms Low 25% High 25% Number of farms 18 5 5 Beginning Ending Beginning Ending Beginning Ending Assets Current Farm Assets Cash and checking balance 43,489 46,058 24,315 18,150 51,111 70,736 Prepaid expenses & supplies 54,055 69,071 67,635 55,318 82,558 99,876 Growing crops 27,011 28,866 21,692 22,527 31,932 34,546 Accounts receivable 68,160 83,314 73,070 90,469 69,780 126,338 Hedging accounts 209 209 890 890 0 0 Crops held for sale or feed 415,954 521,564 511,709 508,670 264,895 471,599 Crops under government loan 0 0 0 0 0 0 Market livestock held for sale 24,003 28,138 48,932 53,563 34,725 48,450 Other current assets 324 526 1,125 1,012 200 980 Total current farm assets 633,206 777,746 749,367 750,598 535,201 852,523 Intermediate Farm Assets Breeding livestock 808,889 862,310 952,238 998,300 731,524 805,471 Machinery and equipment 709,432 833,775 766,425 815,791 887,167 974,502 Titled vehicles 9,595 24,511 35,250 32,150 1,723 55,018 Other intermediate assets 70,461 147,434 26,205 26,856 41,902 39,073 Total intermediate farm assets 1,598,377 1,868,030 1,780,117 1,873,097 1,662,316 1,874,064 Long Term Farm Assets Farm land 1,311,854 1,417,633 1,970,641 2,048,499 1,077,026 1,258,032 Buildings and improvements 606,645 660,397 630,066 624,136 523,125 683,066 Other long-term assets 56,339 63,168 26,803 31,263 143,849 164,892 Total long-term farm assets 1,974,838 2,141,199 2,627,510 2,703,898 1,744,001 2,105,990 Total Farm Assets 4,206,421 4,786,975 5,156,994 5,327,593 3,941,517 4,832,577 Total Nonfarm Assets 358,919 381,860 59,910 67,024 817,573 820,769 Total Assets 4,565,340 5,168,835 5,216,904 5,394,616 4,759,090 5,653,346 Liabilities Current Farm Liabilities Accrued interest 2,986 2,315 966 1,108 173 40 Accounts payable 63,443 47,191 127,753 115,457 33,121 15,790 Current notes 64,171 62,821 159,590 142,939 7,734 26,561 Government crop loans 0 0 0 0 0 0 Principal due on term debt 84,739 83,980 105,079 97,084 48,064 42,843 Total current farm liabilities 215,339 196,307 393,388 356,588 89,092 85,234 Total intermediate farm liabs 283,759 315,406 370,692 370,600 189,345 206,090 Total long term farm liabilities 684,205 751,674 1,119,574 1,143,771 337,989 259,128 Total farm liabilities 1,183,302 1,263,387 1,883,654 1,870,959 616,426 550,452 Total nonfarm liabilities 13,045 11,088 0 0 37,008 32,061 Total liabs excluding deferreds 1,196,347 1,274,475 1,883,654 1,870,959 653,434 582,512 Total deferred liabilities 0 0 0 0 0 0 Total liabilities 1,196,347 1,274,475 1,883,654 1,870,959 653,434 582,512 Retained earnings 1,647,167 1,980,502 1,029,157 1,198,071 2,178,384 2,671,049 Market valuation equity 1,721,826 1,913,858 2,304,093 2,325,586 1,927,272 2,399,785 Net worth (farm and nonfarm) 3,368,993 3,894,360 3,333,250 3,523,657 4,105,656 5,070,834 Net worth excluding deferreds 3,368,993 3,894,360 3,333,250 3,523,657 4,105,656 5,070,834 Net worth change 525,367 190,407 965,178 Percent net worth change 16 % 6 % 24 % Ratio Analysis Current farm liabilities / assets 34 % 25 % 52 % 48 % 17 % 10 % Intermediate farm liab. / assets 18 % 17 % 21 % 20 % 11 % 11 % Long term farm liab. / assets 35 % 35 % 43 % 42 % 19 % 12 % Total debt to asset ratio 26 % 25 % 36 % 35 % 14 % 10 % Debt to assets excl deferreds 26 % 25 % 36 % 35 % 14 % 10 %

64
Table 57 Statement Of Cash Flows 2011 MI Dairy (250 to 449 Cows) (Farms Sorted By Rate of Return on Assets - Mkt) Avg. Of All Farms Low 25% High 25% Number of farms 18 5 5 Beginning cash (farm & nonfarm) 43,489 24,315 51,111 Cash Provided By Operating Activities Gross cash farm income 1,963,964 2,168,518 2,034,001 Total cash farm expense -1,548,008 -1,849,117 -1,401,310 Net cash from hedging transactions -2,947 - - Cash provided by operating 413,009 319,401 632,691 Cash Provided By Investing Activities Sale of breeding livestock 1,133 3,319 - Sale of machinery & equipment 2,040 293 2,240 Sale of titled vehicles - - - Sale of farm land - - - Sale of farm buildings - - - Sale of other farm assets 5,797 - 14,428 Sale of nonfarm assets 0 - 0 Purchase of breeding livestock -17,210 -18,273 -12,952 Purchase of machinery & equip. -174,229 -90,872 -209,334 Purchase of titled vehicles -12 - - Purchase of farm land -39,875 -95,400 - Purchase of farm buildings -93,212 -30,514 -172,162 Purchase of other farm assets -88,172 -4,484 -13,562 Purchase of nonfarm assets -1,217 -3,958 -971 Cash provided by investing -404,956 -239,889 -392,314 Cash Provided By Financing Activities Money borrowed 368,881 314,230 177,775 Principal payments -273,330 -314,771 -231,234 Personal income 8,773 16,703 4,969 Family living/owner withdrawals -90,136 -91,665 -127,667 Income and social security tax -59 - - Capital contributions - - - Capital distributions -12,562 -7,223 -6,240 Dividends paid - - - Cash gifts and inheritances 7,739 10,153 1,450 Gifts given -14,790 -13,103 -39,805 Other cash flows - - - Cash provided by financing -5,484 -85,677 -220,752 Net change in cash balance 2,569 -6,165 19,625 Ending cash (farm & nonfarm) 46,058 18,150 70,737

65
Table 58 Financial Standards Measures 2011 MI Dairy (250 to 449 Cows) (Farms Sorted By Rate of Return on Assets - Mkt) Avg. Of All Farms Low 25% High 25% Number of farms 18 5 5 Liquidity Current ratio 3.96 2.10 10.00 Working capital 581,439 394,009 767,289 Working capital to gross inc 27.5 % 17.8 % 32.6 % Solvency (market) Farm debt to asset ratio 26 % 35 % 11 % Farm equity to asset ratio 74 % 65 % 89 % Farm debt to equity ratio 0.36 0.54 0.13 Profitability (cost) Rate of return on farm assets 13.5 % 8.0 % 25.7 % Rate of return on farm equity 20.9 % 15.0 % 33.3 % Operating profit margin 23.4 % 14.2 % 33.0 % Net farm income 418,996 248,394 682,211 EBIDTA 649,652 445,726 1,011,421 Repayment Capacity Capital debt repayment capacity 569,636 375,276 879,274 Capital debt repayment margin 431,239 190,018 812,733 Replacement margin 400,008 178,065 745,566 Term debt coverage ratio 4.12 2.03 13.21 Replacement coverage ratio 3.36 1.90 6.58 Efficiency Asset turnover rate (cost) 57.7 % 56.4 % 78.0 % Operating expense ratio 69.3 % 79.9 % 57.0 % Depreciation expense ratio 8.5 % 5.5 % 13.0 % Interest expense ratio 2.4 % 3.4 % 1.0 % Net farm income ratio 19.8 % 11.2 % 29.0 %
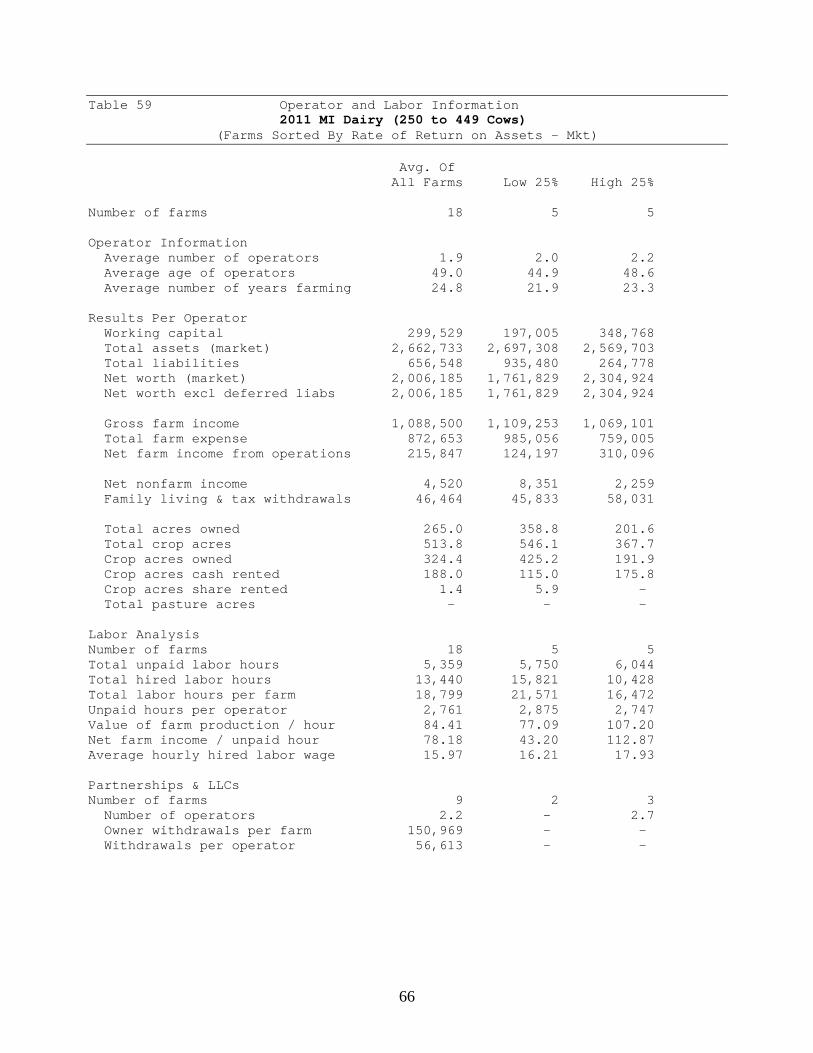
66
Table 59 Operator and Labor Information 2011 MI Dairy (250 to 449 Cows) (Farms Sorted By Rate of Return on Assets - Mkt) Avg. Of All Farms Low 25% High 25% Number of farms 18 5 5 Operator Information Average number of operators 1.9 2.0 2.2 Average age of operators 49.0 44.9 48.6 Average number of years farming 24.8 21.9 23.3 Results Per Operator Working capital 299,529 197,005 348,768 Total assets (market) 2,662,733 2,697,308 2,569,703 Total liabilities 656,548 935,480 264,778 Net worth (market) 2,006,185 1,761,829 2,304,924 Net worth excl deferred liabs 2,006,185 1,761,829 2,304,924 Gross farm income 1,088,500 1,109,253 1,069,101 Total farm expense 872,653 985,056 759,005 Net farm income from operations 215,847 124,197 310,096 Net nonfarm income 4,520 8,351 2,259 Family living & tax withdrawals 46,464 45,833 58,031 Total acres owned 265.0 358.8 201.6 Total crop acres 513.8 546.1 367.7 Crop acres owned 324.4 425.2 191.9 Crop acres cash rented 188.0 115.0 175.8 Crop acres share rented 1.4 5.9 - Total pasture acres - - - Labor Analysis Number of farms 18 5 5 Total unpaid labor hours 5,359 5,750 6,044 Total hired labor hours 13,440 15,821 10,428 Total labor hours per farm 18,799 21,571 16,472 Unpaid hours per operator 2,761 2,875 2,747 Value of farm production / hour 84.41 77.09 107.20 Net farm income / unpaid hour 78.18 43.20 112.87 Average hourly hired labor wage 15.97 16.21 17.93 Partnerships & LLCs Number of farms 9 2 3 Number of operators 2.2 - 2.7 Owner withdrawals per farm 150,969 - - Withdrawals per operator 56,613 - -

67
Table 60 Financial Summary 2011 MI Dairy (250 to 449 Cows) (Farms Sorted By Rate of Return on Assets - Mkt) Avg. Of All Farms Low 25% High 25% Number of farms 18 5 5 Income Statement Gross cash farm income 1,963,964 2,168,518 2,034,001 Total cash farm expense 1,548,008 1,849,117 1,401,310 Net cash farm income 415,956 319,401 632,691 Inventory change 182,800 50,659 355,415 Depreciation -179,759 -121,665 -305,895 Net farm income from operations 418,996 248,394 682,211 Gain or loss on capital sales - - - Average net farm income 418,996 248,394 682,211 Median net farm income 387,340 233,804 709,950 Profitability (cost) Rate of return on assets 13.5 % 8.0 % 25.7 % Rate of return on equity 20.9 % 15.0 % 33.3 % Operating profit margin 23.4 % 14.2 % 33.0 % Asset turnover rate 57.7 % 56.4 % 78.0 % Profitability (market) Rate of return on assets 12.0 % 5.0 % 23.8 % Rate of return on equity 15.0 % 5.5 % 26.9 % Operating profit margin 34.1 % 15.7 % 59.2 % Asset turnover rate 35.3 % 31.7 % 40.2 % Liquidity & Repayment (end of year) Current assets 777,746 750,598 852,523 Current liabilities 196,307 356,588 85,234 Current ratio 3.96 2.10 10.00 Working capital 581,439 394,009 767,289 Working capital to gross inc 27.5 % 17.8 % 32.6 % Term debt coverage ratio 4.12 2.03 13.21 Replacement coverage ratio 3.36 1.90 6.58 Solvency (end of year at cost) Number of farms 18 5 5 Total farm assets 2,955,119 3,021,721 2,476,873 Total farm liabilities 1,263,387 1,870,959 550,452 Total assets 3,254,977 3,069,031 3,253,562 Total liabilities 1,274,475 1,870,959 582,512 Net worth 1,980,502 1,198,071 2,671,049 Net worth change 333,335 168,915 492,665 Farm debt to asset ratio 43 % 62 % 22 % Total debt to asset ratio 39 % 61 % 18 % Solvency (end of year at market) Number of farms 18 5 5 Total farm assets 4,786,975 5,327,593 4,832,577 Total farm liabilities 1,263,387 1,870,959 550,452 Total assets 5,168,835 5,394,616 5,653,346 Total liabilities 1,274,475 1,870,959 582,512 Net worth 3,894,360 3,523,657 5,070,834 Net worth change 525,367 190,407 965,178 Farm debt to asset ratio 26 % 35 % 11 % Total debt to asset ratio 25 % 35 % 10 % Nonfarm Information Net nonfarm income 8,773 16,703 4,969 Crop Acres Total acres owned 514 718 444 Total crop acres 997 1,092 809 Total crop acres owned 630 850 422 Total crop acres cash rented 365 230 387 Total crop acres share rented 3 12 -

68
Table 61 Summary Farm Income Statement 2011 MI Dairy (250 to 449 Cows) (Farms Sorted By Rate of Return on Assets - Mkt) Avg. Of All Farms Low 25% High 25% Number of farms 18 5 5 Crop sales 141,717 130,053 153,721 Crop inventory change 105,610 -3,039 206,704 Gross crop income 247,327 127,015 360,425 Livestock sales 1,664,799 1,812,302 1,736,510 Livestock inventory change 4,135 4,631 13,725 Gross livestock income 1,668,934 1,816,932 1,750,235 Government payments 15,744 21,534 11,770 Other cash farm income 141,705 204,629 132,000 Change in accounts receivable 15,154 17,400 56,558 Gain or loss on hedging accounts -2,947 - - Change in other assets -1,708 -114 9,220 Gain or loss on breeding lvst 28,762 31,109 31,815 Gross farm income 2,112,970 2,218,505 2,352,022 Cash operating expenses 1,496,441 1,773,593 1,377,863 Change in prepaids and supplies -15,016 12,317 -17,318 Change in growing crops -1,855 -835 -2,614 Change in accounts payable -16,253 -12,296 -17,331 Depreciation 179,759 121,665 305,895 Total operating expense 1,643,077 1,894,445 1,646,496 Interest paid 51,567 75,524 23,447 Change in accrued interest -671 142 -132 Total interest expense 50,896 75,666 23,315 Total expenses 1,693,974 1,970,111 1,669,811 Net farm income from operations 418,996 248,394 682,211 Gain or loss on capital sales - - - Net farm income 418,996 248,394 682,211

69
E. Financial Summary Information, Herds with 450+ Cows
Table 62 Crop Production and Marketing Summary 2011 MI Dairy (450 plus Cows) (Farms Sorted By Rate of Return on Assets - Mkt) Avg. Of All Farms Low 25% High 25% Dairy Number of farms 19 5 5 Average number of cows 869 562 839 Milk production per cow lbs., 25,129 25,772 26,780 Average milk price per cwt., $20.63 $20.34 $19.85 Acreage Summary Total acres owned 827 620 1,062 Total crop acres 1,128 1,107 881 Crop acres owned 785 509 677 Crop acres cash rented 342 598 201 Crop acres share rented 1 - 3 Total pasture acres 1 - - Percent crop acres owned 70 % 46 % 77 % Average Price Received (Cash Sales Only) Corn per bushel 6.57 - - Wheat, Winter per bushel 6.29 - - Soybeans per bushel 12.22 - -

70
Table 63 Farm Income Statement 2011 MI Dairy (450 plus Cows) (Farms Sorted By Rate of Return on Assets - Mkt) Avg. Of All Farms Low 25% High 25% Number of farms 19 5 5 Cash Farm Income Beans, Navy 1,912 - - Corn 79,269 8,667 175,381 Corn Silage 2,446 1,969 7,719 Hay, Alfalfa 105 - 400 Hay, Mixed 339 1,608 - Hay, Mixed Alfalfa/Grass 1,077 - 4,093 Haylage, Mixed 3,241 131 - Soybeans 89,379 57,014 116,896 Speltz 3,015 - - Sugar Beets 19,907 94,559 - Wheat, Winter 53,168 39,715 53,722 Miscellaneous crop income 66 - 52 Beef Cow-Calf, Beef Calves 111 - - Dairy, Milk 4,338,064 2,959,051 4,300,869 Dairy, Dairy Calves 30,164 4,643 45,449 Dairy Heifers (for sale) 4,645 22,063 - Dairy Replacement Heifers 4,579 - 8,223 Dairy Finishing 46,551 95,704 42,795 Dairy Feeder 94 - 357 Cull breeding livestock 223,004 121,466 247,070 Misc. livestock income 2,414 1,500 7,975 LDP payments 18,357 - 69,755 Direct, CCP & ACRE pymts 8,091 10,582 19,473 CRP payments 5,552 - 21,099 Other government payments 18,864 16,584 2,324 Custom work income 15,995 32,902 21,920 Patronage dividends, cash 40,373 31,536 32,108 Insurance income 10,976 5,482 9,753 Other farm income 14,706 12,867 21,057 Gross Cash Farm Income 5,036,463 3,518,043 5,208,489
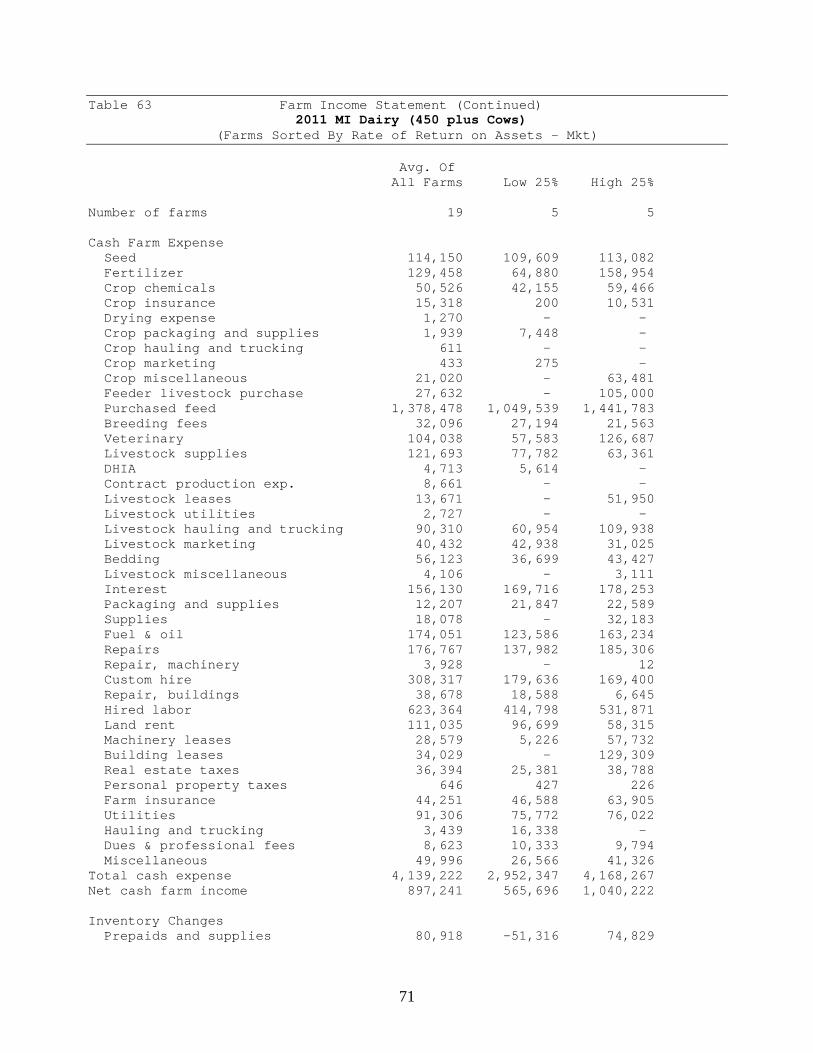
71
Table 63 Farm Income Statement (Continued) 2011 MI Dairy (450 plus Cows) (Farms Sorted By Rate of Return on Assets - Mkt) Avg. Of All Farms Low 25% High 25% Number of farms 19 5 5 Cash Farm Expense Seed 114,150 109,609 113,082 Fertilizer 129,458 64,880 158,954 Crop chemicals 50,526 42,155 59,466 Crop insurance 15,318 200 10,531 Drying expense 1,270 - - Crop packaging and supplies 1,939 7,448 - Crop hauling and trucking 611 - - Crop marketing 433 275 - Crop miscellaneous 21,020 - 63,481 Feeder livestock purchase 27,632 - 105,000 Purchased feed 1,378,478 1,049,539 1,441,783 Breeding fees 32,096 27,194 21,563 Veterinary 104,038 57,583 126,687 Livestock supplies 121,693 77,782 63,361 DHIA 4,713 5,614 - Contract production exp. 8,661 - - Livestock leases 13,671 - 51,950 Livestock utilities 2,727 - - Livestock hauling and trucking 90,310 60,954 109,938 Livestock marketing 40,432 42,938 31,025 Bedding 56,123 36,699 43,427 Livestock miscellaneous 4,106 - 3,111 Interest 156,130 169,716 178,253 Packaging and supplies 12,207 21,847 22,589 Supplies 18,078 - 32,183 Fuel & oil 174,051 123,586 163,234 Repairs 176,767 137,982 185,306 Repair, machinery 3,928 - 12 Custom hire 308,317 179,636 169,400 Repair, buildings 38,678 18,588 6,645 Hired labor 623,364 414,798 531,871 Land rent 111,035 96,699 58,315 Machinery leases 28,579 5,226 57,732 Building leases 34,029 - 129,309 Real estate taxes 36,394 25,381 38,788 Personal property taxes 646 427 226 Farm insurance 44,251 46,588 63,905 Utilities 91,306 75,772 76,022 Hauling and trucking 3,439 16,338 - Dues & professional fees 8,623 10,333 9,794 Miscellaneous 49,996 26,566 41,326 Total cash expense 4,139,222 2,952,347 4,168,267 Net cash farm income 897,241 565,696 1,040,222 Inventory Changes Prepaids and supplies 80,918 -51,316 74,829

72
Accounts receivable 52,338 4,719 12,514 Hedging accounts -834 - - Other current assets 56,769 5,729 29,552 Crops and feed 109,835 24,659 236,565 Market livestock 12,397 -3,530 42,094 Breeding livestock 4,707 5,156 -121,302 Other assets 3,061 0 0 Accounts payable 1,730 50,862 10,902 Accrued interest 2,522 971 718 Total inventory change 323,443 37,250 285,871 Net operating profit 1,220,684 602,945 1,326,093 Depreciation Machinery and equipment -290,470 -231,734 -432,029 Titled vehicles 337 1,601 - Buildings and improvements -216,229 -99,454 -105,720 Total depreciation -506,362 -329,587 -537,750 Net farm income from operations 714,322 273,358 788,343 Gain or loss on capital sales - - - Net farm income 714,322 273,358 788,343
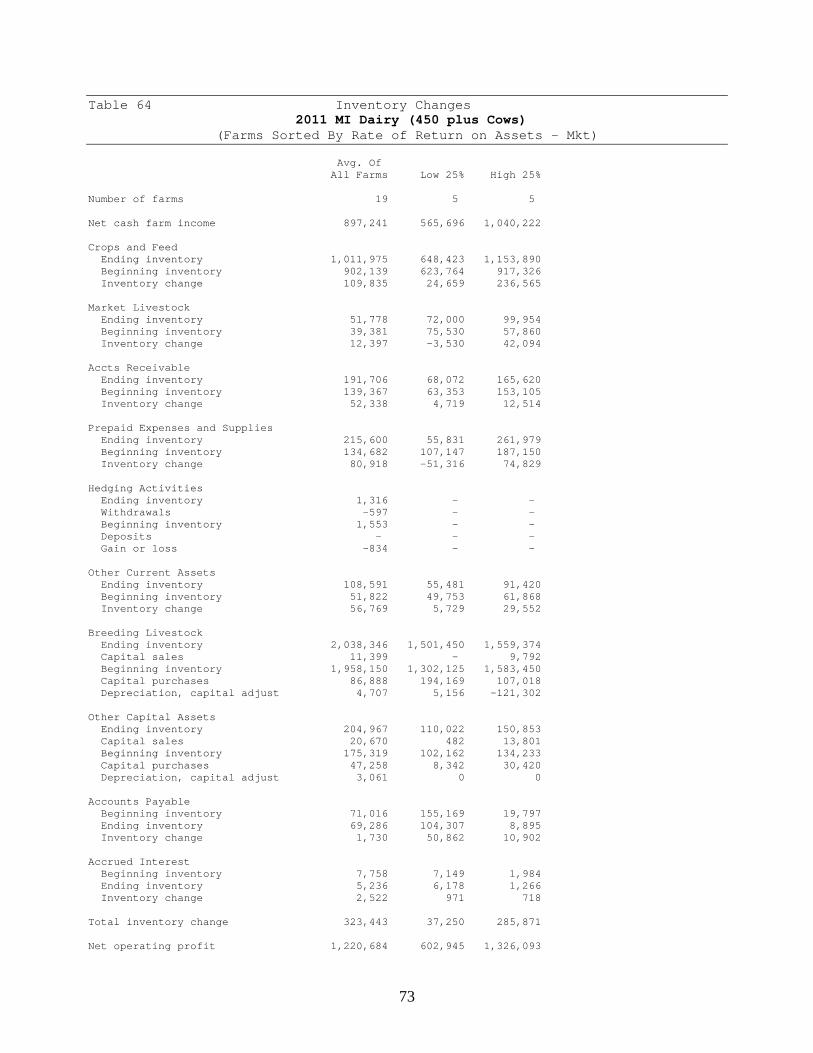
73
Table 64 Inventory Changes 2011 MI Dairy (450 plus Cows) (Farms Sorted By Rate of Return on Assets - Mkt) Avg. Of All Farms Low 25% High 25% Number of farms 19 5 5 Net cash farm income 897,241 565,696 1,040,222 Crops and Feed Ending inventory 1,011,975 648,423 1,153,890 Beginning inventory 902,139 623,764 917,326 Inventory change 109,835 24,659 236,565 Market Livestock Ending inventory 51,778 72,000 99,954 Beginning inventory 39,381 75,530 57,860 Inventory change 12,397 -3,530 42,094 Accts Receivable Ending inventory 191,706 68,072 165,620 Beginning inventory 139,367 63,353 153,105 Inventory change 52,338 4,719 12,514 Prepaid Expenses and Supplies Ending inventory 215,600 55,831 261,979 Beginning inventory 134,682 107,147 187,150 Inventory change 80,918 -51,316 74,829 Hedging Activities Ending inventory 1,316 - - Withdrawals -597 - - Beginning inventory 1,553 - - Deposits - - - Gain or loss -834 - - Other Current Assets Ending inventory 108,591 55,481 91,420 Beginning inventory 51,822 49,753 61,868 Inventory change 56,769 5,729 29,552 Breeding Livestock Ending inventory 2,038,346 1,501,450 1,559,374 Capital sales 11,399 - 9,792 Beginning inventory 1,958,150 1,302,125 1,583,450 Capital purchases 86,888 194,169 107,018 Depreciation, capital adjust 4,707 5,156 -121,302 Other Capital Assets Ending inventory 204,967 110,022 150,853 Capital sales 20,670 482 13,801 Beginning inventory 175,319 102,162 134,233 Capital purchases 47,258 8,342 30,420 Depreciation, capital adjust 3,061 0 0 Accounts Payable Beginning inventory 71,016 155,169 19,797 Ending inventory 69,286 104,307 8,895 Inventory change 1,730 50,862 10,902 Accrued Interest Beginning inventory 7,758 7,149 1,984 Ending inventory 5,236 6,178 1,266 Inventory change 2,522 971 718 Total inventory change 323,443 37,250 285,871 Net operating profit 1,220,684 602,945 1,326,093

74
Table 65 Depreciation 2011 MI Dairy (450 plus Cows) (Farms Sorted By Rate of Return on Assets - Mkt) Avg. Of All Farms Low 25% High 25% Number of farms 19 5 5 Net operating profit 1,220,684 602,945 1,326,093 Machinery and Equipment Ending inventory 702,954 486,199 513,257 Capital sales 32,575 6,148 11,714 Beginning inventory 674,098 459,881 641,271 Capital purchases 351,901 264,200 315,729 Depreciation, capital adjust. -290,470 -231,734 -432,029 Titled Vehicles Ending inventory 1,284 4,851 - Capital sales - - - Beginning inventory 947 3,250 - Capital purchases - - - Depreciation, capital adjust. 337 1,601 - Buildings and Improvements Ending inventory 1,266,234 1,052,589 481,665 Capital sales 2,442 - 9,280 Beginning inventory 1,252,683 866,995 533,986 Capital purchases 232,222 285,048 62,680 Depreciation, capital adjust. -216,229 -99,454 -105,720 Total depreciation, capital adj. -506,362 -329,587 -537,750 Net farm income from operations 714,322 273,358 788,343 Gain or loss on capital sales - - - Net farm income 714,322 273,358 788,343

75
Table 66 Profitability Measures 2011 MI Dairy (450 plus Cows) (Farms Sorted By Rate of Return on Assets - Mkt) Avg. Of All Farms Low 25% High 25% Number of farms 19 5 5 Profitability (assets valued at cost) Net farm income from operations 714,322 273,358 788,343 Rate of return on assets 10.7 % 6.7 % 13.4 % Rate of return on equity 15.9 % 8.6 % 19.8 % Operating profit margin 19.2 % 11.7 % 20.5 % Asset turnover rate 55.8 % 57.3 % 65.4 % Farm interest expense 153,608 168,745 177,536 Value of operator lbr and mgmt. 133,135 150,000 176,000 Return on farm assets 734,794 292,103 789,879 Average farm assets 6,846,463 4,359,037 5,896,758 Return on farm equity 581,186 123,358 612,343 Average farm equity 3,646,026 1,426,688 3,098,254 Value of farm production 3,818,926 2,499,507 3,858,435 Avg. Of All Farms Low 25% High 25% Number of farms 19 5 5 Profitability (assets valued at market) Net farm income from operations 1,284,130 318,454 1,876,330 Rate of return on assets 12.1 % 4.2 % 18.1 % Rate of return on equity 15.1 % 3.3 % 22.4 % Operating profit margin 34.2 % 13.5 % 48.7 % Asset turnover rate 35.3 % 31.1 % 37.2 % Farm interest expense 153,608 168,745 177,536 Value of operator lbr and mgmt. 133,135 150,000 176,000 Return on farm assets 1,304,603 337,199 1,877,866 Average farm assets 10,821,146 8,027,373 10,373,761 Return on farm equity 1,150,995 168,454 1,700,330 Average farm equity 7,620,709 5,095,023 7,575,258 Value of farm production 3,818,926 2,499,507 3,858,435
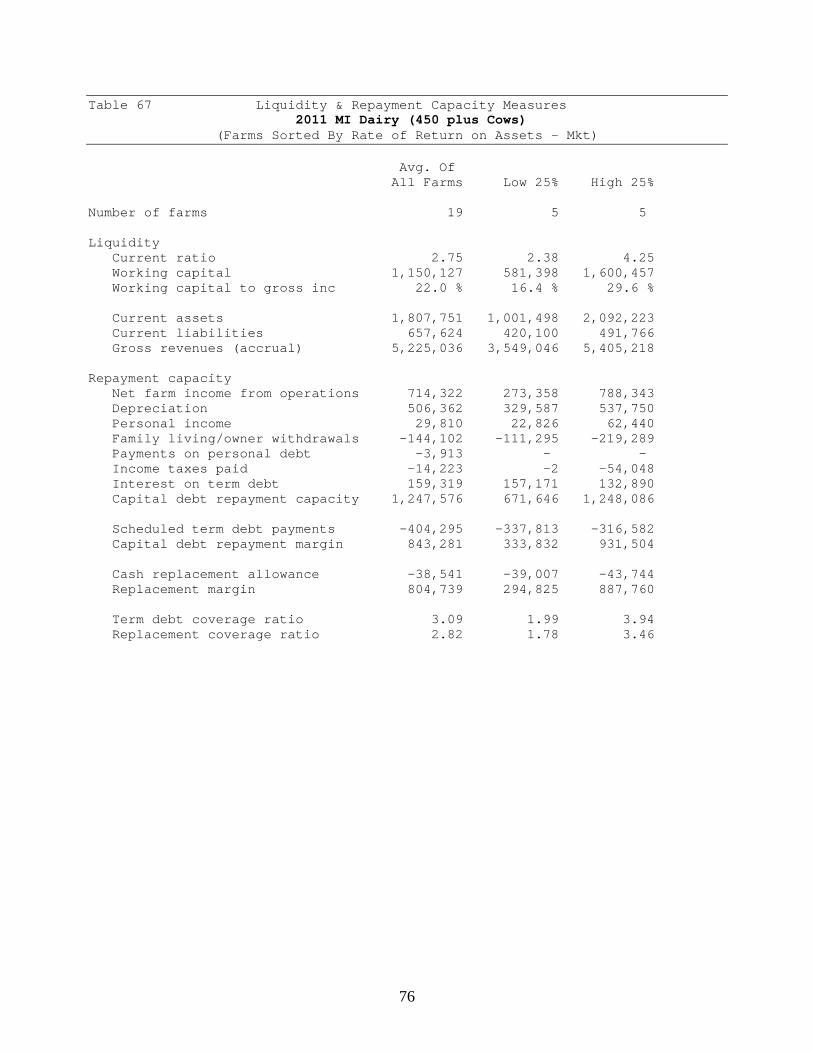
76
Table 67 Liquidity & Repayment Capacity Measures 2011 MI Dairy (450 plus Cows) (Farms Sorted By Rate of Return on Assets - Mkt) Avg. Of All Farms Low 25% High 25% Number of farms 19 5 5 Liquidity Current ratio 2.75 2.38 4.25 Working capital 1,150,127 581,398 1,600,457 Working capital to gross inc 22.0 % 16.4 % 29.6 % Current assets 1,807,751 1,001,498 2,092,223 Current liabilities 657,624 420,100 491,766 Gross revenues (accrual) 5,225,036 3,549,046 5,405,218 Repayment capacity Net farm income from operations 714,322 273,358 788,343 Depreciation 506,362 329,587 537,750 Personal income 29,810 22,826 62,440 Family living/owner withdrawals -144,102 -111,295 -219,289 Payments on personal debt -3,913 - - Income taxes paid -14,223 -2 -54,048 Interest on term debt 159,319 157,171 132,890 Capital debt repayment capacity 1,247,576 671,646 1,248,086 Scheduled term debt payments -404,295 -337,813 -316,582 Capital debt repayment margin 843,281 333,832 931,504 Cash replacement allowance -38,541 -39,007 -43,744 Replacement margin 804,739 294,825 887,760 Term debt coverage ratio 3.09 1.99 3.94 Replacement coverage ratio 2.82 1.78 3.46

77
Table 68 Balance Sheet at Cost Values 2011 MI Dairy (450 plus Cows)
(Farms Sorted By Rate of Return on Assets - Mkt) Avg. Of All Farms Low 25% High 25% Number of farms 19 5 5 Beginning Ending Beginning Ending Beginning Ending Assets Current Farm Assets Cash and checking balance 147,042 219,697 73,508 101,691 207,260 319,360 Prepaid expenses & supplies 134,682 215,600 107,147 55,831 187,150 261,979 Growing crops 41,762 91,463 49,753 55,481 23,640 26,334 Accounts receivable 139,367 191,706 63,353 68,072 153,105 165,620 Hedging accounts 1,553 1,316 0 0 0 0 Crops held for sale or feed 909,229 1,004,885 623,764 648,423 917,326 1,153,890 Crops under government loan 0 14,180 0 0 0 0 Market livestock held for sale 39,381 51,778 75,530 72,000 57,860 99,954 Other current assets 10,060 17,128 0 0 38,228 65,086 Total current farm assets 1,423,076 1,807,751 993,055 1,001,498 1,584,570 2,092,223 Intermediate Farm Assets Breeding livestock 1,958,150 2,038,346 1,302,125 1,501,450 1,583,450 1,559,374 Machinery and equipment 674,098 702,954 459,881 486,199 641,271 513,257 Titled vehicles 947 1,284 3,250 4,851 0 0 Other intermediate assets 149,713 192,659 58,761 62,611 124,073 142,010 Total intermediate farm assets 2,782,909 2,935,243 1,824,017 2,055,111 2,348,794 2,214,641 Long Term Farm Assets Farm land 1,041,730 1,145,386 416,999 416,999 1,104,995 1,413,637 Buildings and improvements 1,252,683 1,266,234 866,995 1,052,589 533,986 481,665 Other long-term assets 25,605 12,308 43,401 47,411 10,161 8,843 Total long-term farm assets 2,320,019 2,423,928 1,327,395 1,516,999 1,649,142 1,904,145 Total Farm Assets 6,526,004 7,166,922 4,144,467 4,573,608 5,582,506 6,211,009 Total Nonfarm Assets 471,336 504,252 133,544 172,745 1,275,340 1,382,339 Total Assets 6,997,340 7,671,175 4,278,011 4,746,353 6,857,846 7,593,348 Liabilities Current Farm Liabilities Accrued interest 7,758 5,236 7,149 6,178 1,984 1,266 Accounts payable 71,016 69,286 155,169 104,307 19,797 8,895 Current notes 178,896 280,048 223,481 69,926 237,485 278,845 Government crop loans 0 4,022 0 0 0 0 Principal due on term debt 244,976 299,032 180,643 239,690 183,692 202,759 Total current farm liabilities 502,645 657,624 566,441 420,100 442,958 491,766 Total intermediate farm liabs 625,180 594,938 847,502 1,147,584 400,660 360,236 Total long term farm liabilities 2,014,649 2,005,837 1,369,765 1,513,307 1,927,343 1,974,044 Total farm liabilities 3,142,474 3,258,400 2,783,709 3,080,991 2,770,961 2,826,046 Total nonfarm liabilities 41,964 43,205 31,850 54,500 0 0 Total liabilities 3,184,439 3,301,605 2,815,559 3,135,491 2,770,961 2,826,046 Net worth (farm and nonfarm) 3,812,901 4,369,570 1,462,452 1,610,862 4,086,885 4,767,302 Net worth change 556,669 148,410 680,417 Percent net worth change 15 % 10 % 17 % Ratio Analysis Current farm liabilities / assets 35 % 36 % 57 % 42 % 28 % 24 % Intermediate farm liab. / assets 22 % 20 % 46 % 56 % 17 % 16 % Long term farm liab. / assets 87 % 83 % 103 % 100 % 117 % 104 % Total debt to asset ratio 46 % 43 % 66 % 66 % 40 % 37 %

78
Table 69 Balance Sheet at Market Values 2011 MI Dairy (450 plus Cows)
(Farms Sorted By Rate of Return on Assets - Mkt) Avg. Of All Farms Low 25% High 25% Number of farms 19 5 5 Beginning Ending Beginning Ending Beginning Ending Assets Current Farm Assets Cash and checking balance 147,042 219,697 73,508 101,691 207,260 319,360 Prepaid expenses & supplies 134,682 215,600 107,147 55,831 187,150 261,979 Growing crops 41,762 91,463 49,753 55,481 23,640 26,334 Accounts receivable 139,367 191,706 63,353 68,072 153,105 165,620 Hedging accounts 1,553 1,316 0 0 0 0 Crops held for sale or feed 909,229 1,004,885 623,764 648,423 917,326 1,153,890 Crops under government loan 0 14,180 0 0 0 0 Market livestock held for sale 39,381 51,778 75,530 72,000 57,860 99,954 Other current assets 10,060 17,128 0 0 38,228 65,086 Total current farm assets 1,423,076 1,807,751 993,055 1,001,498 1,584,570 2,092,223 Intermediate Farm Assets Breeding livestock 2,096,629 2,180,243 1,519,475 1,574,663 1,588,930 1,643,274 Machinery and equipment 1,289,850 1,582,363 859,007 1,014,285 1,143,028 1,316,567 Titled vehicles 25,971 29,770 38,625 41,250 15,700 22,400 Other intermediate assets 151,486 197,753 65,834 70,041 125,153 155,426 Total intermediate farm assets 3,563,937 3,990,129 2,482,940 2,700,239 2,872,811 3,137,667 Long Term Farm Assets Farm land 3,144,036 3,453,716 2,326,973 2,326,711 3,969,804 4,885,673 Buildings and improvements 2,059,849 2,163,021 1,947,310 2,191,408 1,078,170 1,106,959 Other long-term assets 24,884 11,893 39,977 44,635 10,161 9,485 Total long-term farm assets 5,228,770 5,628,629 4,314,259 4,562,754 5,058,135 6,002,116 Total Farm Assets 10,215,78311,426,510 7,790,255 8,264,491 9,515,51611,232,006 Total Nonfarm Assets 545,115 581,398 351,368 390,695 1,313,219 1,412,909 Total Assets 10,760,89812,007,907 8,141,623 8,655,18610,828,73512,644,915 Liabilities Current Farm Liabilities Accrued interest 7,758 5,236 7,149 6,178 1,984 1,266 Accounts payable 71,016 69,286 155,169 104,307 19,797 8,895 Current notes 178,896 280,048 223,481 69,926 237,485 278,845 Government crop loans 0 4,022 0 0 0 0 Principal due on term debt 244,976 299,032 180,643 239,690 183,692 202,759 Total current farm liabilities 502,645 657,624 566,441 420,100 442,958 491,766 Total intermediate farm liabs 625,180 594,938 847,502 1,147,584 400,660 360,236 Total long term farm liabilities 2,014,649 2,005,837 1,369,765 1,513,307 1,927,343 1,974,044 Total farm liabilities 3,142,474 3,258,400 2,783,709 3,080,991 2,770,961 2,826,046 Total nonfarm liabilities 41,964 43,205 31,850 54,500 0 0 Total liabs excluding deferreds 3,184,439 3,301,605 2,815,559 3,135,491 2,770,961 2,826,046 Total deferred liabilities 0 0 0 0 0 0 Total liabilities 3,184,439 3,301,605 2,815,559 3,135,491 2,770,961 2,826,046 Retained earnings 3,812,901 4,369,570 1,462,452 1,610,862 4,086,885 4,767,302 Market valuation equity 3,763,558 4,336,733 3,863,612 3,908,833 3,970,889 5,051,567 Net worth (farm and nonfarm) 7,576,459 8,706,303 5,326,064 5,519,695 8,057,774 9,818,869 Net worth excluding deferreds 7,576,459 8,706,303 5,326,064 5,519,695 8,057,774 9,818,869 Net worth change 1,129,844 193,631 1,761,095 Percent net worth change 15 % 4 % 22 % Ratio Analysis Current farm liabilities / assets 35 % 36 % 57 % 42 % 28 % 24 % Intermediate farm liab. / assets 18 % 15 % 34 % 42 % 14 % 11 % Long term farm liab. / assets 39 % 36 % 32 % 33 % 38 % 33 % Total debt to asset ratio 30 % 27 % 35 % 36 % 26 % 22 % Debt to assets excl deferreds 30 % 27 % 35 % 36 % 26 % 22 %

79
Table 70 Statement Of Cash Flows 2011 MI Dairy (450 plus Cows) (Farms Sorted By Rate of Return on Assets - Mkt) Avg. Of All Farms Low 25% High 25% Number of farms 19 5 5 Beginning cash (farm & nonfarm) 147,042 73,508 207,260 Cash Provided By Operating Activities Gross cash farm income 5,036,463 3,518,043 5,208,489 Total cash farm expense -4,139,222 -2,952,347 -4,168,267 Net cash from hedging transactions -597 - - Cash provided by operating 896,644 565,696 1,040,222 Cash Provided By Investing Activities Sale of breeding livestock 11,399 - 9,792 Sale of machinery & equipment 32,575 6,148 11,714 Sale of titled vehicles - - - Sale of farm land 16,121 75,700 700 Sale of farm buildings 2,442 - 9,280 Sale of other farm assets 20,670 482 13,801 Sale of nonfarm assets - - - Purchase of breeding livestock -86,888 -194,169 -107,018 Purchase of machinery & equip. -351,901 -264,200 -315,729 Purchase of titled vehicles - - - Purchase of farm land -137,555 -75,000 -243,615 Purchase of farm buildings -232,222 -285,048 -62,680 Purchase of other farm assets -47,258 -8,342 -30,420 Purchase of nonfarm assets -28,883 -50,000 -69,755 Cash provided by investing -801,499 -794,429 -783,929 Cash Provided By Financing Activities Money borrowed 739,098 756,302 454,343 Principal payments -622,192 -407,186 -387,638 Personal income 29,810 22,826 62,440 Family living/owner withdrawals -144,102 -111,295 -219,289 Income and social security tax -14,223 -2 -54,048 Capital contributions 2,316 - - Capital distributions -7,764 -13,169 - Dividends paid - - - Cash gifts and inheritances 4,416 17,500 - Gifts given -9,850 -8,061 - Other cash flows - - - Cash provided by financing -22,491 256,916 -144,192 Net change in cash balance 72,655 28,183 112,100 Ending cash (farm & nonfarm) 219,697 101,691 319,360

80
Table 71 Financial Standards Measures 2011 MI Dairy (450 plus Cows) (Farms Sorted By Rate of Return on Assets - Mkt) Avg. Of All Farms Low 25% High 25% Number of farms 19 5 5 Liquidity Current ratio 2.75 2.38 4.25 Working capital 1,150,127 581,398 1,600,457 Working capital to gross inc 22.0 % 16.4 % 29.6 % Solvency (market) Farm debt to asset ratio 29 % 37 % 25 % Farm equity to asset ratio 71 % 63 % 75 % Farm debt to equity ratio 0.40 0.59 0.34 Profitability (cost) Rate of return on farm assets 10.7 % 6.7 % 13.4 % Rate of return on farm equity 15.9 % 8.6 % 19.8 % Operating profit margin 19.2 % 11.7 % 20.5 % Net farm income 714,322 273,358 788,343 EBIDTA 1,374,292 771,690 1,503,629 Repayment Capacity Capital debt repayment capacity 1,247,576 671,646 1,248,086 Capital debt repayment margin 843,281 333,832 931,504 Replacement margin 804,739 294,825 887,760 Term debt coverage ratio 3.09 1.99 3.94 Replacement coverage ratio 2.82 1.78 3.46 Efficiency Asset turnover rate (cost) 55.8 % 57.3 % 65.4 % Operating expense ratio 73.7 % 78.3 % 72.2 % Depreciation expense ratio 9.7 % 9.3 % 9.9 % Interest expense ratio 3.0 % 4.8 % 3.3 % Net farm income ratio 13.7 % 7.7 % 14.6 %

81
Table 72 Operator and Labor Information 2011 MI Dairy (450 plus Cows) (Farms Sorted By Rate of Return on Assets - Mkt) Avg. Of All Farms Low 25% High 25% Number of farms 19 5 5 Operator Information Average number of operators 1.6 2.0 1.2 Average age of operators 48.1 55.1 37.2 Average number of years farming 24.7 25.4 24.7 Results Per Operator Working capital 728,414 290,699 1,333,714 Total assets (market) 7,605,008 4,327,593 10,537,429 Total liabilities 2,091,016 1,567,745 2,355,038 Net worth (market) 5,513,992 2,759,848 8,182,391 Net worth excl deferred liabs 5,513,992 2,759,848 8,182,391 Gross farm income 3,309,190 1,774,523 4,504,348 Total farm expense 2,856,786 1,637,844 3,847,396 Net farm income from operations 452,404 136,679 656,953 Net nonfarm income 18,880 11,413 52,033 Family living & tax withdrawals 100,272 55,648 227,781 Total acres owned 523.7 309.9 885.2 Total crop acres 714.6 553.7 734.1 Crop acres owned 497.3 254.6 563.9 Crop acres cash rented 216.7 299.1 167.3 Crop acres share rented 0.6 - 2.8 Total pasture acres 0.7 - - Labor Analysis Number of farms 19 5 5 Total unpaid labor hours 5,326 7,053 3,700 Total hired labor hours 39,926 30,822 24,798 Total labor hours per farm 45,252 37,875 28,498 Unpaid hours per operator 3,373 3,527 3,083 Value of farm production / hour 84.39 65.99 135.39 Net farm income / unpaid hour 134.12 38.76 213.07 Average hourly hired labor wage 15.61 13.46 21.45 Partnerships & LLCs Number of farms 11 3 2 Number of operators 2.0 2.3 - Owner withdrawals per farm - - - Withdrawals per operator - - -

82
Table 73 Financial Summary 2011 MI Dairy (450 plus Cows) (Farms Sorted By Rate of Return on Assets - Mkt) Avg. Of All Farms Low 25% High 25% Number of farms 19 5 5 Income Statement Gross cash farm income 5,036,463 3,518,043 5,208,489 Total cash farm expense 4,139,222 2,952,347 4,168,267 Net cash farm income 897,241 565,696 1,040,222 Inventory change 323,443 37,250 285,871 Depreciation -506,362 -329,587 -537,750 Net farm income from operations 714,322 273,358 788,343 Gain or loss on capital sales - - - Average net farm income 714,322 273,358 788,343 Median net farm income 625,384 251,087 629,683 Profitability (cost) Rate of return on assets 10.7 % 6.7 % 13.4 % Rate of return on equity 15.9 % 8.6 % 19.8 % Operating profit margin 19.2 % 11.7 % 20.5 % Asset turnover rate 55.8 % 57.3 % 65.4 % Profitability (market) Rate of return on assets 12.1 % 4.2 % 18.1 % Rate of return on equity 15.1 % 3.3 % 22.4 % Operating profit margin 34.2 % 13.5 % 48.7 % Asset turnover rate 35.3 % 31.1 % 37.2 % Liquidity & Repayment (end of year) Current assets 1,807,751 1,001,498 2,092,223 Current liabilities 657,624 420,100 491,766 Current ratio 2.75 2.38 4.25 Working capital 1,150,127 581,398 1,600,457 Working capital to gross inc 22.0 % 16.4 % 29.6 % Term debt coverage ratio 3.09 1.99 3.94 Replacement coverage ratio 2.82 1.78 3.46 Solvency (end of year at cost) Number of farms 19 5 5 Total farm assets 7,166,922 4,573,608 6,211,009 Total farm liabilities 3,258,400 3,080,991 2,826,046 Total assets 7,671,175 4,746,353 7,593,348 Total liabilities 3,301,605 3,135,491 2,826,046 Net worth 4,369,570 1,610,862 4,767,302 Net worth change 556,669 148,410 680,417 Farm debt to asset ratio 45 % 67 % 46 % Total debt to asset ratio 43 % 66 % 37 % Solvency (end of year at market) Number of farms 19 5 5 Total farm assets 11,426,510 8,264,491 11,232,006 Total farm liabilities 3,258,400 3,080,991 2,826,046 Total assets 12,007,907 8,655,186 12,644,915 Total liabilities 3,301,605 3,135,491 2,826,046 Net worth 8,706,303 5,519,695 9,818,869 Net worth change 1,129,844 193,631 1,761,095 Farm debt to asset ratio 29 % 37 % 25 % Total debt to asset ratio 27 % 36 % 22 % Nonfarm Information Net nonfarm income 29,810 22,826 62,440 Crop Acres Total acres owned 827 620 1,062 Total crop acres 1,128 1,107 881 Total crop acres owned 785 509 677 Total crop acres cash rented 342 598 201 Total crop acres share rented 1 - 3

83
Table 74 Summary Farm Income Statement 2011 MI Dairy (450 plus Cows) (Farms Sorted By Rate of Return on Assets - Mkt) Avg. Of All Farms Low 25% High 25% Number of farms 19 5 5 Crop sales 253,925 203,663 358,264 Crop inventory change 109,835 24,659 236,565 Gross crop income 363,760 228,322 594,828 Livestock sales 4,424,207 3,081,461 4,397,692 Livestock inventory change 12,397 -3,530 42,094 Gross livestock income 4,436,604 3,077,931 4,439,786 Government payments 50,863 27,166 112,650 Other cash farm income 307,468 205,753 339,883 Change in accounts receivable 52,338 4,719 12,514 Gain or loss on hedging accounts -834 - - Change in other assets 10,129 0 26,858 Gain or loss on breeding lvst 4,707 5,156 -121,302 Gross farm income 5,225,036 3,549,046 5,405,218 Cash operating expenses 3,983,093 2,782,631 3,990,014 Change in prepaids and supplies -80,918 51,316 -74,829 Change in growing crops -49,701 -5,729 -2,694 Change in accounts payable -1,730 -50,862 -10,902 Depreciation 506,362 329,587 537,750 Total operating expense 4,357,107 3,106,943 4,439,339 Interest paid 156,130 169,716 178,253 Change in accrued interest -2,522 -971 -718 Total interest expense 153,608 168,745 177,536 Total expenses 4,510,714 3,275,688 4,616,875 Net farm income from operations 714,322 273,358 788,343 Gain or loss on capital sales - - - Net farm income 714,322 273,358 788,343