2011 nsse report - und: university of north dakota · involved in both academic and out-of-class...
TRANSCRIPT


Executive Summary
University of North Dakota Page i Office of Institutional Research 2011 NSSE Benchmarks at UND
The National Survey for Student Engagement (NSSE) is the best known national project for measuring student engagement. The survey, administered by the Indiana Center for Postsecondary Research, measures the extent to which students engage in practices understood to be effectively linked with learning outcomes, personal development, student satisfaction, and graduation. Students actively involved in both academic and out-of-class activities have been found to gain more from the college experience than those who are not involved. In the spring of 2011, 2,031first-year (FY) students and 2,620 senior (SR) students were invited to participate in NSSE at UND. 548 FY students and 795 SR students responded to the survey, for a response rate of 29%. This was the sixth time UND has participated in NSSE.
NSSE summarizes results into 5 benchmarks:
1. Level of Academic Challenge – an institution’s ability to establish a challenging intellectual and creative environment for students.
2. Active and Collaborative Learning – The level at which students are asked to collaborate with others in solving problems or mastering difficult material.
3. Student Interactions with Faculty Members – The extent to which students interact with faculty members inside and outside of the classroom.
4. Enriching Educational Experiences – An institution’s ability to foster complementary learning opportunities both inside and outside of the classroom to augment academic programs.
5. Supportive Campus Environment – The extent to which institutions cultivate positive working and social relations among different groups on campus.
In 2011, UND results are mixed, as all FY benchmark mean scores show an increase over 2009 mean scores, while four of the five SR benchmark means have decreased. Additionally, all 2009 benchmark scores for FY respondents at UND showed an increase over 2007 scores, showing some very positive trends for these FY students.
Both FY and SR respondents at UND score the highest benchmark mean scores for the Supportive Campus Environment benchmark. UND respondents indicate relatively high quality relationships with their fellow students, their faculty, and administrative personnel. In 2011, UND SR respondents report improved relationships with both faculty and administrative staff over 2009, while FY respondents indicate lower quality relationships with these groups when compared to 2009 results.
The lone benchmark where both FY and SR respondents from UND are significantly behind their peers from research universities with high activity is Enriching Educational Experiences, which focuses on student participation in high-impact learning activities (internships, study abroad, service learning, and senior capstone projects) and student interaction with diverse populations. Historically, UND has typically performed poorly in this benchmark area. Respondents are significantly less likely to report having conversations with fellow students different than themselves in terms of race, religion, political affiliation, or personal values. Just 40% of UND SR respondents indicate they have completed an internship or cooperative experience, and 11% have done a study abroad.Most respondents (90% of FY and 86% of SR) evaluate their entire educational experience at UND as good or excellent. 87% of FY and 83% of SR respondents would again choose to attend UND given the chance to start over.

2011 National Survey of Student Engagement at UND A total of 1,343 students (548 first‐year and 795 seniors) participated in the 2011 NSSE.______
FY = first‐year students, SR = seniors, RU/H = Research Universities – High Activity
University of North Dakota Page ii Office of Institutional Research 2011 NSSE Benchmarks at UND
49.4
39.1
30.7
23.2
56.5
48.2
36.6
27.9
21.3
57.5
51.1
39.4
31.1
22.7
60.2
52.6
41.2
33.1
24.9
61.5
53.4
42.3
33.5
28.1
61.5
55.2
49.8
40.9
34.2
55.3
53.3
47.5
39.3
34.7
54.9
55.6
49.9
41.3
37.1
55.7
55.0
46.8
39.7
35.6
57.2
56.7
50.6
40.9
40.0
57.4
Level of AcademicChallenge
Active and CollaborativeLearning
Student‐FacultyInteraction
Enriching EducationalExperiences
Supportive CampusEnvironment
NSSE Benchmark Mean ScoresNumbers for UND are weighted against RU/H respondents by gender, FT/PT status, and institutional size
First Year UND 05 First Year UND 07 First Year UND 09 First Year UND 11 First Year RU/H 11Seniors UND 05 Seniors UND 07 Seniors UND 09 Seniors UND 11 Seniors RU/H 11
50%
20%
14%
32%
24%
39%
40%
18%
11%
30%
8%
41%
50%
18%
10%
21%
9%
33%
40%
16%
8%
22%
8%
28%
45%
15%
8%
14%
11%
32%
Practicum, Internship, Co‐op
Research with Faculty
Study Abroad
Culminating Senior Exper
Learning Communities
Community Service
Senior
First‐Year
Percent of Students Participating in High‐Impact Educational Practices
UND 05 UND 07 UND 09 UND 11 RU/H 11
70% 74% 76% 78% 79%65% 69% 70% 71% 67%
30% 26% 24% 22% 21%35% 31% 30% 29% 33%
UND05
UND07
UND09
UND11
RU/H11
UND05
UND07
UND09
UND11
RU/H11
First Year Seniors
Academic Advisingrate the quality you have received
Excellent / Good Fair / Poor
87% 84% 87% 87% 84% 81% 84% 85% 83% 80%
13% 16% 13% 13% 16% 19% 16% 15% 17% 20%
UND05
UND07
UND09
UND11
RU/H11
UND05
UND07
UND09
UND11
RU/H11
First Year Seniors
Would You Attend Again?if you could start over
Yes No

Table of Contents
University of North Dakota Page iii Office of Institutional Research 2011 NSSE Benchmarks at UND
Executive Summary ....................................................................................................................................... i
NSSE Dashboard .......................................................................................................................................... ii
Table of Contents .......................................................................................................................................... ii
I. 2011 National Survey of Student Engagement at UND .............................................................. 1 II. Statistical Evaluation ..................................................................................................................... 2 III. Chart Explanation ......................................................................................................................... 3 IV. UND Response Numbers ............................................................................................................... 3 V. UND Performance Overall on NSSE Benchmarks ..................................................................... 4 VI. Level of Academic Challenge (LAC) ............................................................................................ 5
Behind the Data ............................................................................................................................... 6 Over Time ........................................................................................................................................ 7 Comparison by College .................................................................................................................... 8
VII. Active and Collaborative Learning (ACL) .................................................................................. 9 Behind the Data ............................................................................................................................. 10 Over Time ...................................................................................................................................... 11 Comparison by College .................................................................................................................. 12
VIII. Student and Faculty Interaction (SFI) ....................................................................................... 13 Behind the Data ............................................................................................................................. 14 Over Time ...................................................................................................................................... 14 Comparison by College .................................................................................................................. 15
IX. Enriching Educational Experiences (EEE)................................................................................ 17 Behind the Data ............................................................................................................................. 18 Over Time ...................................................................................................................................... 19 Comparison by College .................................................................................................................. 20
X. Supportive Campus Environment (SCE) .................................................................................. 21 Behind the Data ............................................................................................................................. 22 Over Time ...................................................................................................................................... 22 Comparison by College .................................................................................................................. 23
XI. Summary Questions ..................................................................................................................... 25 Academic Advising ........................................................................................................................ 25 Entire Educational Experience ....................................................................................................... 27 Attend Again .................................................................................................................................. 29
XII. Summary Questions ..................................................................................................................... 31

University of North Dakota Page 1 Office of Institutional Research 2011 NSSE Benchmarks at UND
I. 2011 National Survey of Student Engagement at UND
The National Survey for Student Engagement (NSSE) is the best known and longest running national project for measuring student engagement. The survey, administered by the Indiana Center for Postsecondary Research, measures the extent to which students engage in practices generally understood to be effectively linked with learning outcomes, personal development, student satisfaction, persistence, and graduation. Students actively involved in both academic and out-of-class activities have been found to gain more from the college experience than those who are not involved.
NSSE has been collecting information annually from samples of first-year and senior students about the nature and quality of their undergraduate experience. The 2011 represents the sixth administration of NSSE at UND. In the spring of 2011, 2,031 UND FY students and 2,620 UND SR students were invited to participate in NSSE via e-mail; 548 FY students and 795 SR students responded to the survey, for a response rate of 29%. 2011 represents the sixth administration of NSSE at UND, with prior administrations in 2001, 2003, 2005, 2007, and 2009
In order to measure student engagement in broad terms, NSSE has developed five benchmarks of effective educational practice. These benchmarks are based on 42 key questions from the NSSE survey that capture many vital aspects of the student experience. These questions point to key behaviors and institutional features that are the more powerful contributors to learning and personal development. These key indicators include:
1. Level of Academic Challenge (LAC) – an institution’s ability to establish a challenging intellectual and creative environment for students.
2. Active and Collaborative Learning (ACL) – The level at which students are asked to collaborate with others in solving problems or mastering difficult material.
3. Student Interactions with Faculty Members (SFI) – The extent to which students interact with faculty members inside and outside of the classroom.
4. Enriching Educational Experiences (EEE) – An institution’s ability to foster complementary learning opportunities both inside and outside of the classroom to augment academic programs.
5. Supportive Campus Environment (SCE) – The extent to which institutions cultivate positive working and social relations among different groups on campus.
Each benchmark is measured on a 100-point scale; a score of 100 indicates every respondent records the highest possible answer for each of the component questions, while a score of zero would indicate every respondent records the lowest possible answer for each of the component questions. This methodology leads to typical benchmark scores being in the 50-60 point range. Scoring these benchmarks allows for more accurate comparison over time and across institutions. The benchmarks are developed as a tool for campuses to stimulate conversations on campus. Comparing scores to institutional peers and national scores, comparing scores year-to-year may point to key areas for improving the student experience. Campuses can determine if scores are aligned with their institutional mission. Scores can also be used to measure the success of recent institutional initiatives.

University of North Dakota Page 2 Office of Institutional Research 2011 NSSE Benchmarks at UND
The following sections of this report will provide a summary of each benchmark, UND’s performance in 2011 on the particular benchmark, compare UND’s performance to that of similar sized institutions, and finally look at specific items contributing to the resulting score on the given benchmark.
II. Statistical Evaluation
NSSE provides two variables, statistical significance and effect size, from which institutions can compare their survey results to selected comparison groups. Statistical significance indicates items with mean differences larger than would be expected by chance alone. The larger the significance level, the greater probability the difference between UND results and the comparison group is not due to chance.
Since NSSE results are generated from large sample sizes, statistically significant results can appear even though the difference between two values is small. To combat this issue, NSSE also provides effect size as a statistical measure. Effect size measures the practical significance of the mean difference. Effect sizes less than 0.2 are often considered small, 0.5 moderate, and 0.8 large. Combining effect size with statistical significance can point to those areas where UND may want to focus attention to improve the student experience.
NSSE also cites evidence that a very small portion of the benchmark scales is attributable to institutions themselves. As Figure 1 shows, a much larger portion of each benchmark scale is attributed to differences between students. The experience of individual students can vary greatly at a given institution depending on their particular personality, level of involvement, and academic ability. A student who reports being highly engaged at UND would also be likely to report being highly engaged at a different
94.3 93.0 94.9 94.6 95.7 95.5 93.5 92.2 85.594.6
5.7 7.0 5.1 5.4 4.3 4.5 6.5 7.8 14.55.4
0%
20%
40%
60%
80%
100%
LAC ACL SFI EEE SCE LAC ACL SFI EEE SCE
FY SR
Figure 1. Allocation of Benchmark Score Variation Percent of Benchmark Score Attributable to Institution Versus Within Institutions
Within Institution/Between Students Between Institutions

University of North Dakota Page 3 Office of Institutional Research 2011 NSSE Benchmarks at UND
institution; likewise, a student showing low engagement at UND would tend to show low engagement at another institution.
III. Chart Explanation
UND’s performance on each benchmark will be shown in a box and whisker chart as shown in Figure 2. This chart provides a good overview of the entire span of scores UND has recorded on a particular benchmark. The box outlines the 25th percentile, 50th percentile (median), and 75th percentile scores. The whiskers on either side of the box identify the 5th percentile and the 95th percentile. The dot indicates the mean score for the particular benchmark. In this report, this type of graph will be used to display UND benchmark results from both 2009 and 2011 NSSE administrations, along with the 2011 benchmark scores from all RU/H institutions participating in NSSE 2011.
IV. UND Response Numbers
Invitations to participate in NSSE were sent to 2,031 first-year students and 2,620 senior students at UND. Of these, 548 FY and 795 SR students completed the survey for a response rate of 29%. This report includes information regarding performance of UND colleges on the NSSE benchmarks. Table 1 provides an accounting of the numbers of students involved in NSSE for each college. Although some numbers appear low, all colleges have respondent sample large enough to be generalizable.
First Year
Figure 2. Chart Description95th Percentile
75th Percentile
50th Percentile (Median)
25th Percentile
5th Percentile
Mean

University of North Dakota Page 4 Office of Institutional Research 2011 NSSE Benchmarks at UND
Table 1. Respondents by UND College
College
FY SR
2009 2011 2009 2011College of Arts & Sciences (A&S) 132 157 133 237 College of Business & Public Administration (BPA) 52 59 76 118 College of Education & Human Development (EHD) 32 20 48 78 JD Odegaard School of Aerospace (JDO) 80 78 42 92 College of Nursing (NUR) 44 60 50 81 School of Engineering & Mines (SEM) 49 52 54 139 School of Medicine & Health Sciences (SMHS) 34 36 16 29 Undecided (Undec) 103 84 NA NA Not Defined (UND/PRVS/Blank) 0 21 6 21 Total 528 567 425 795
V. UND Performance Overall on NSSE Benchmarks
UND’s best performance occurs in the Supportive Campus Environment benchmark, with both FY and SR students recording benchmark mean scores that are statistically significantly higher than FY and SR respondents from those of UND’s institutional peers participating in NSSE 2011 (Figure 3). UND’s worst performance, on the other hand, is for the Enriching Educational Experiences benchmark, where both FY and SR respondents from UND record significantly lower benchmark mean scores than their peers from UND’s institutional peer universities, research universities with high activity(RU/H), and universities in the upper Midwest.
UND’s 2011 mean benchmark scores for FY respondents show improvement over 2009 scores for all five benchmark areas. This continues a trend as all of UND’s FY benchmarks in 2009 showed increases over 2007 mean scores. UND FY respondents score significantly lower than their peers from RU/H institutions in just one benchmark area: Enriching Educational Experiences. This is an improvement over 2009 when FY respondents from UND scores benchmark means that were significantly lower than FY respondents from RU/H institutions on four of the five benchmark areas.
Results on the NSSE benchmark areas are not nearly as positive when UND SR responses are evaluated. Just one benchmark area, Supportive Campus Environment, records a mean higher in 2011 than was recorded in 2009. The largest drop in benchmark mean score is seen in the ACL benchmark. 2011 results show UND SR respondents record benchmark means that are significantly lower than their Carnegie peers (RU/H institutions) on three of the five benchmarks; in 2009, EEE was the only benchmark where UND SR respondents lagged RU/H respondents.

University of North Dakota Page 5 Office of Institutional Research 2011 NSSE Benchmarks at UND
Figure 3. NSSE Benchmark Summary
VI. Level of Academic Challenge (LAC)
Challenging intellectual and creative work is central to student learning and collegiate quality. Colleges and universities promote high levels of student achievement by emphasizing the importance of academic effort and setting high expectations for student performance.
Nine items are identified in the NSSE survey to evaluate the level of academic challenge at an institution:
Hours spent preparing for class (studying, reading, writing, doing homework or lab work)
Number of assigned textbooks, books, or book-length packs of course readings
Number of written papers or reports of 20 pages or more, number of written papers or reports between 5 and 19 pages, and number of written papers or reports fewer than 5 pages
ClassUND 2009
Scores UND
Institutional Peers
Carnegie Peers (RU/H)
Plains Public
Level of Academic Challenge (LAC)First-Year 51 53 ------ ------ ------
Senior 56 55 ------
Active and Collaborative Learning (ACL)First-Year 39 41 ------ ------ ------
Senior 50 47 ------
Student-Faculty Interaction (SFI)First-Year 31 33 ------ ------ ------
Senior 41 40 ------ ------ ------
Enriching Educational Experiences (EEE)First-Year 23 25
Senior 37 36 *
Supportive Campus Environment (SCE)First-Year 60 62 ------ ------
Senior 56 57 ------ ------
Indicates UND's score is statistically lower than the comparison group.
Indicates UND's score is statistically higher than the comparison group.
*
** Indicates an Effect Size greater than 0.20, implying more than a small significance. (Effect size equals mean difference divided by the pooled
standard deviation.)
Do your students feel the college is committed to their success?
7 of UND's 15 Institutionally defined peers participated in NSSE 2011; 49 RU‐H institutions participated (UND's 2010 Carnegie Class); 27
Plains Public institutions participated (including public institutions from IA, KS, MN, MO, NE, ND, & SD
University of North DakotaBenchmark Results from the 2011 National Survey of Student Engagement (NSSE)Five benchmarks are created from clusters of NSSE questions. The below table summarizes UND's results compared to peer groups. When 2011 scores are compared to 2009, UND first-year scores show improvement while scores for seniors are on the decline. UND's worst performance is in the area of enriching educational experiences.
Comparison Groups*
How challenging is your institution's intellectual and creative work?
Are your students intensely involved in their education?
Do your students work with faculty members inside and outside the classroom?
Do your students take advantage of complementary learning opportunities?
**
**
**
**

University of North Dakota Page 6 Office of Institutional Research 2011 NSSE Benchmarks at UND
Coursework emphasizing analysis of the basic elements of an idea, experience, or theory
Coursework emphasizing synthesis and organizing of ideas, information, or experiences into new, more complex interpretations and relationships
Coursework emphasizing making judgments about the value of information, arguments, or methods
Coursework emphasizing applying theories or concepts to practical problems or in new situations
Working harder than you thought you could to meet an instructor’s expectations
Campus environment emphasizing spending significant amount of time studying and on academic work
UND results for level of academic challenge for senior respondents is statistically significantly lower than their counterparts at research universities with high activity. UND’s SR mean score for LAC is 55.0, compared to 56.7 for SR students from RU/H institutions(Figure 4). The effect size on the LAC mean, however, is -0.12, which means the practical significance of the difference is small.
UND FY respondent mean LAC score of 52.6 is lower than the 53.4 reported by FY students at RU/H institutions however the difference is not statistically significantly different .
Behind the Data
Several items stand out when evaluating UND’s scores with regard to overall level of academic challenge.
Both FY and SR respondents report spending similar amounts of time preparing for class as their RU/H counterparts. 38% of UND FY respondents and 37% of UND SR respondents report
0
25
50
75
100
UND 2009 UND 2011 RU/H 2011 UND 2009 UND 2011 RU/H 2011
First Year Senior
Figure 4. Level of Academic ChallengeMean, 5th, 25th, 50th, 75th, and 95th Percentile

University of North Dakota Page 7 Office of Institutional Research 2011 NSSE Benchmarks at UND
spending 10 or fewer hours per week preparing for class. 19% of UND FY respondents and 25% of UND SR respondents report spending more than 20 hours per week preparing for class.
UND FY respondents report writing significantly more mid-length papers (those between 5 and 19 pages) than their RU/H counterparts, while at the same time they report significantly fewer long papers (20 or more pages). 12% of UND FY respondents indicate they wrote at least one long paper compared to 18% of RU/H FY respondents.
UND SR respondents are significantly less likely to report their coursework emphasizes analysis of basic elements of an idea, synthesis and organizing of ideas into new, complex interpretations, and making judgments about the value of information than their RU/H counterparts.
UND FY respondents are also less likely to report emphasis on synthesis of ideas into more complex interpretations.
UND FY and UND SR respondents are less likely than their RU/H peers to report they worked harder than they thought they could to meet instructor standards.
80% of FY respondents and 75% of SR respondents at UND say there is quite a bit or very much emphasis on spending significant amounts of time studying and academic work.
UND SR respondents are less likely to report the campus environment emphasizes spending significant amount of time studying and on academic work.
One-half of SR respondents (52%) report never having written papers 20 pages or longer.
Over Time
While the LAC benchmark for FY respondents from UND shows progress (Figure 5), the benchmark for UND SR respondents has declined.
50.549.4
48.2
51.152.6
54.6 55.2
53.3
55.6 55.0
2003 2005 2007 2009 2011
Figure 5. Level of Academic Challenge (LAC) Over Time At UND
UND FY UND SR

University of North Dakota Page 8 Office of Institutional Research 2011 NSSE Benchmarks at UND
With regard to critical thinking skills, FY respondents say they are increasingly seeing coursework that emphasizes analysis of basic elements of concepts, and making judgments about the value of information. Over one-half of FY respondents (52%) indicate they frequently work harder than they thought they could to meet an instructor’s standards. As was the case in 2009, UND FY respondents write significantly more papers between 5 and 19 pages than their RU/H counterparts.
SR respondents report writing fewer papers of all lengths in 2011 than was reported in 2009. When asked about writing papers longer than 20 pages, 52% of 2011 SR respondents reported none compared to 46% in 2009. Thirty-nine percent of 2011 SR respondents report having written five or more papers between 5 and 19 pages compared to 48% in 2009. When asked about writing short papers (fewer than 5 pages), 57% of SR respondents say they wrote five or more in 2011 compared to 67% reporting such in 2009.
When compared to 2009, both SR and FY students at UND report increased amounts of time spent preparing for class. On a scale of 1 to 8, where 1 represents 0 hours per week and 8 represents more than 30 hours per week, UND FY respondents report a mean score of 4.10 in 2009 compared to 4.18 in 2011. SR students at UND show improvement by scoring 4.46 in 2011 over 4.27 in 2009. Both groups also showed increased time preparing for class in 2009 over 2007 NSSE results, establishing a positive trend over this time.
Comparison By College
With regard to the level of academic challenge benchmark, students from the various colleges perform at different levels. For FY students at UND, those from the College of Nursing score the highest at 55.4, while those from the College of Education score the lowest (Figure 6). The College of Education also is the college representing the greatest decline in benchmark score from 2009, while the College of Business and Public Administration reports the greatest benchmark score increase.
**Numbers for UND are weighted against RU/H institutions by gender, enrollment status, and institutional size. College level
data is not weighted as such, therefore direct comparison may be skewed.
50.4
45.2
48.8
49.7
46.4
48.2
49.0
49.2
51.8
51.8
47.7
51.9
49.4 54.6
51.1
52.5
52.7
53.9
47.1
49.7
51.7
52.5
52.6
52.6
52.7
54.3
55.4
0
25
50
75
100
EHD JDO UNDEC BPA SMHS UNDInstitution
**
SEM A&S NUR
Figure 6. Level of Academic Challenge (LAC)By UND College For FY Respondents
2007 2009 2011

University of North Dakota Page 9 Office of Institutional Research 2011 NSSE Benchmarks at UND
**Numbers for UND are weighted against RU/H institutions by gender, enrollment status, and institutional size. College level
data is not weighted as such, therefore direct comparison may be skewed.
When SR students are asked to report items relating to their level of academic challenge, JDO students are again reporting the lowest mean score (47.8), while Nursing students report the highest level of academic challenge benchmark with a mean score of 64.6 (Figure 7). When compared to means scored in 2007, SR students from the Odegaard School of Aerospace are the lone group to report a lower mean benchmark in 2009 ( 50.9 in 2007 dropping to 47.8 in 2009). SR students from the School of Medicine showed the largest increase over 2007 benchmark mean scores, increasing from 56.9 in 2007 to 63.9 in 2009. SR students from the College of Nursing also show a large increase in benchmark mean for level of academic challenge, scoring 64.6 in 2009 after scoring 58.3 in 2007.
VII. Active and Collaborative Learning
Students learn more when they are intensely involved in their education and are asked to think about and apply what they are learning in different settings. Collaborating with others in solving problems or mastering difficult material prepares students for the messy, unscripted problems they will encounter daily during and after college.
NSSE identifies seven items defining active and collaborative learning experiences:
Asked questions in class or contributed to class discussions.
Made a class presentation.
Worked with other students on projects during class.
Worked with classmates outside of class to prepare class assignments.
Tutored or taught other students, either paid or voluntary.
50.9
52.9
53.9
55.0
56.9
53.3
54.3 58.3
47.8 53.5
55.8
56.3 63.9
55.6
56.9 64.6
49.5
52.5
54.6
55.1
55.3
55.6
56.4 60.5
0
25
50
75
100
JDO BPA EHD A&S SMHS UNDInstitution**
SEM NUR
Figure 7. Level of Academic Challenge (LAC)By UND College For SR Respondents
2007 2009 2011

University of North Dakota Page 10 Office of Institutional Research 2011 NSSE Benchmarks at UND
Participated in a community-based project (service learning) as part of a regular course.
Discussed ideas from your readings or classes with others outside of class.
When evaluating active and collaborative learning, UND SR respondents are statistically significantly behind their peers at RU/H institutions. UND’s mean score for SR students is 46.8, compared to a mean of 50.6 at RU/H institutions (Figure 8). The effect size on this benchmark is -0.21, which is just slightly higher than meaning a small practical difference.
UND FY respondents report a mean for ACL of 41.2, which is lower than the ACL benchmark of 42.3 for FY students at RU/H institutions, however this difference is not statistically significant.
UND FY respondents report a higher ACL benchmark mean in 2011 than was recorded in 2009, while UND SR respondents record a significantly lower mean in 2011 compared to 2009.
Behind the Data
When defining UND’s performance in the active and collaborative learning benchmark, a few items stand out.
UND respondents are significantly less likely to work with other students outside of class. Just 39% of FY students report working with classmates frequently, compared to 45% of FY respondents from RU/H institutions; 57% of UND SR respondents frequently work with peers while 60% of RU/H SR respondents frequently do.
UND FY students are significantly more likely to work with other students on projects during class, with 54% reporting this occurs frequently compared to 43% at RU/H institutions. On the
0
25
50
75
100
UND 2009 UND 2011 RU/H 2011 UND 2009 UND 2011 RU/H 2011
First Year Senior
Figure 8. Active and Collaborative LearningMean, 5th, 25th, 50th, 75th, and 95th Percentile

University of North Dakota Page 11 Office of Institutional Research 2011 NSSE Benchmarks at UND
other hand, UND SR students are significantly less likely to report working with classmates during class; 45% of UND SR students report this behavior occurs frequently compared to 48% of SR students at RU/H institutions.
UND students, both FY and SR, are significantly less likely than their RU/H peers to frequently make class presentations. 22% of UND FY respondents and 15% of UND SR respondents report they never make presentations in class. Less than one-half of UND SR respondents (47%) report making class presentations frequently.
UND SR respondents are significantly less likely than their RU/H peers to have discussed ideas from class with others outside of class. While over one-half (59%) do so frequently, 63% of seniors from RU/H institutions report doing so frequently.
Over Time
Scores on the ACL benchmark have moved in a positive direction for UND FY respondents while declining for SR respondents when 2011 benchmarks are compared to 2009 benchmarks (Figure 9).
As stated above, UND FY students are significantly less likely to work with classmates outside of class, however there is a significant increase in numbers reporting such; in 2009, 32% of UND FY respondents reported this collaboration frequently occurred, while in 2011 this increased to 39%.
Increasing numbers of UND FY respondents are also reporting they participated in service learning, with 43% indicating this has happened compared to 35% in 2009.
UND SR respondents were significantly less likely to report the occurrence of several active and collaborative learning items. These include making a class presentation, where 59% of UND SR respondents reported class presentations were made often or very often in 2009 compared to 47% in 2011.
35.3
39.1
36.6
39.441.2
46.4
49.8
47.5
49.9
46.8
2003 2005 2007 2009 2011
Figure 9. Active and Collaborative Learning (ACL) Over Time At UND
UND FY UND SR

University of North Dakota Page 12 Office of Institutional Research 2011 NSSE Benchmarks at UND
UND SR respondents are also less likely to report working with classmates outside of class, with 57% reporting this occurs often in 2011 compared to 64% reporting such in 2009.
Comparison By College
As shown below (Figure 10), FY respondents from the College of Arts and Sciences report the highest level of collaborative learning. It is worth noting that the College of Education and Development, while scoring the highest ACL mean in 2009 dropped to the bottom in 2011; this may be an anomaly in the particular survey administration, as 2007 and 2009 scores were relatively flat for EHD, and EHD had only 20 FY respondents in 2011. The largest increases in FY ACL scores occur in the School of Engineering and Mines and the College of Nursing.
**Numbers for UND are weighted against RU/H institutions by gender, enrollment status, and institutional size. College level
data is not weighted as such, therefore direct comparison may be skewed.
For senior respondents (Figure 11), those from the College of Nursing report the highest levels of active learning and collaboration. Respondents from EHD also score high, indicating again the low score for FY respondents may be an anomaly. Respondents from the School of Medicine and the School of Engineering report the lowest levels of active and collaborative learning; both colleges see a significant drop in mean score when 2011 is compared to 2009.
44.9
37.2
36.9
36.0
36.6
35.7
37.8
34.3
35.145.5
38.3
39.1
39.5
39.4
37.6
38.4
39.1
41.3
35.3
38.2
38.5
40.2
41.2
42.1
43.0
43.0
43.8
0
25
50
75
100
EHD UNDEC BPA JDO UNDInstitution
**
NUR SEM SMHS A&S
Figure 10. Active and Collaborative Learning(ACL)By UND College For FY Respondents
2007 2009 2011

University of North Dakota Page 13 Office of Institutional Research 2011 NSSE Benchmarks at UND
**Numbers for UND are weighted against RU/H institutions by gender, enrollment status, and institutional size. College level
data is not weighted as such, therefore direct comparison may be skewed.
VIII. Student‐Faculty Interaction
Students learn firsthand how experts think about and solve practical problems by interacting with faculty members inside and outside the classroom. As a result, their teachers become role models, mentors, and guides for continuous, life-long learning.
To determine student-faculty interaction, NSSE evaluates the following six items:
Discussed grades or assignments with an instructor.
Talked about career plans with a faculty member or advisor.
Discussed ideas from your readings or classes with faculty members outside of class.
Worked with faculty members on activities other than coursework, such as committees, orientation, or student-life activities.
Received prompt written or oral feedback from faculty on your academic performance.
Worked on a research project with a faculty member outside of course or program requirements.
When evaluating student-faculty interaction, UND respondents, both FY and SR, are not statistically different from their RU/H peers (Figure 12). It is worth noting that in 2009, UND FY respondents scored significantly behind their RU/H peers, so gains are apparent. The SFI benchmark mean for UND’s SR respondents dropped slightly from 41.3 in 2009 to 39.7 in 2011.
44.5
41.7 47.5
45.9 50.4
50.9
54.6
54.2
47.8
48.3
49.9
50.5
46.7
50.5 55.5
53.0
34.5 40.2 46.8
47.0
47.1 51.9
53.2
57.2
0
25
50
75
100
SMHS SEM UNDInstitution**
A&S BPA JDO EHD NUR
Figure 11. Active and Collaborative Learning (ACL)By UND College For SR Respondents
2007 2009 2011

University of North Dakota Page 14 Office of Institutional Research 2011 NSSE Benchmarks at UND
Behind the Data
As a general rule, UND respondents look very much like their RU/H peers for items related to faculty interaction. Just two significant differences occur.
UND FY respondents are significantly more likely to have talked about career plans with a faculty member or advisor. This can be seen as positive, since other research points to career preparation being important to incoming UND students.
UND SR respondents are significantly less likely to have discussed grades or assignments with an instructor. Just over one-half of respondents (53%) report they do so often.
A few notes on items pertaining to SFI where UND respondents are similar to RU/H respondents:
54% of UND FY respondents and 63% of UND SR respondents say they often receive prompt written or oral feedback from faculty about their academic performance.
18% of UND SR respondents indicate they have worked on a research project with a faculty member outside of program requirements.
Over Time
Once again, UND FY respondents show an increase over prior administrations, while UND SR respondent’s mean score drops in 2011 from what was recorded in 2009 (Figure 13).
0
25
50
75
100
UND 2009 UND 2011 RU/H 2011 UND 2009 UND 2011 RU/H 2011
First Year Senior
Figure 12. Student‐Faculty Interaction (SFI)Mean, 5th, 25th, 50th, 75th, and 95th Percentile

University of North Dakota Page 15 Office of Institutional Research 2011 NSSE Benchmarks at UND
*Due to changes in the NSSE questions asked, SFI calculated in 2003 cannot be compared to succeeding years.
It appears that UND FY respondents are spending more time communicating with faculty. The percentage of respondents saying they often discuss grades and assignments with faculty increased from 44% in 2009 to 48% in 2011; they are also increasingly indicating they receive feedback from faculty, with 54% of 2011 respondents saying this happens often compared to 49% in 2009. Lastly, while the percentage is still small, FY respondents are more likely to report they work with faculty on activities outside of coursework (things such as committees, orientation, etc.), with 15% indicating they frequently work with faculty in this way.
The drop in the benchmark for SR respondents can be traced to two component items. SR respondents discussed grades and/or assignments with instructors less frequently than in the past, with 53% of 2011 respondents reporting this happened often compared to 59% in 2009. SR respondents also report fewer discussions regarding career plans, with 36% of respondents in 2011 saying they had frequent discussions with faculty regarding career plans compared to 44% reporting frequent career plan discussions in 2009.
Comparison By College
Figures 14 and 15 show college performance with regard to student-faculty interaction as identified in NSSE. Respondents from the School of Aerospace leads the way for FY students in 2011, and the increase in the 2011 administration follow an increase in 2009. The general trend for most colleges is increasing SFI mean scores; exceptions include EHD and A&S, where the mean declined in 2011 compared to 2009. On the other hand, it appears reported SFI for most SR respondents is decreasing, with just NUR and EHD reporting higher benchmark means in 2011 compared to 2009. SR respondents from the College of Arts and Sciences score the highest mean in 2011.
30.7
27.9
31.1
33.1
40.939.3
41.339.7
2003 * 2005 2007 2009 2011
Figure 13. Student ‐ Faculty Interaction (SFI)Over Time At UND*
UND FY UND SR

University of North Dakota Page 16 Office of Institutional Research 2011 NSSE Benchmarks at UND
**Numbers for UND are weighted against RU/H institutions by gender, enrollment status, and institutional size. College level
data is not weighted as such, therefore direct comparison may be skewed.
**Numbers for UND are weighted against RU/H institutions by gender, enrollment status, and institutional size. College level
data is not weighted as such, therefore direct comparison may be skewed.
SR respondents from the School of Engineering and Mines are reporting a significant decline in SFI in 2011. This follows a decline from 2007 to 2009.
25.2
25.4 31.7
26.6
26.0
27.9
28.5
28.4
29.9
28.6
28.1 35.3
28.1
29.6
31.1
34.6
26.8 33.3
28.4
29.4
29.5
31.2
31.8
33.1
33.4
33.7 39.1
0
25
50
75
100
SMHS SEM EHD BPA UNDEC UNDInstitution
**
A&S NUR JDO
Figure 14. Student‐Faculty Interaction (SFI)By UND College For FY Respondents
2007 2009 2011
41.3
39.1
40.0
39.3
37.7
36.7 41.6
40.4
40.1
36.2 40.6
41.3
43.8
39.3
41.6
45.2
34.9
36.0
37.8
39.7
40.4
40.5
42.9
44.1
0
25
50
75
100
SEM BPA SMHS UNDInstitution**
JDO NUR EHD A&S
Figure 15. Student‐Faculty Interaction (SFI)By UND College For SR Respondents
2007 2009 2011

University of North Dakota Page 17 Office of Institutional Research 2011 NSSE Benchmarks at UND
IX. Enriching Educational Experiences
Complementary learning opportunities enhance academic programs. Diversity experiences teach students valuable things about themselves and others. Technology facilitates collaboration between peers and instructors. Internships, community service, and senior capstone courses provide opportunities to integrate and apply knowledge.
NSSE uses eleven elements of the survey to define this particular benchmark:
Participating in co-curricular activities such as organizations, campus publications, student government, and fraternities or sororities.
Practicum, internship, field experience, co-op experience, or clinical assignment.
Community service or volunteer work.
Foreign language coursework or study abroad.
Independent study or self-designed major.
Culminating senior experience such as a capstone course, senior project, or comprehensive exam.
Serious conversations with students of different religious beliefs, political opinions, or personal values.
Serious conversations with students of a different race or ethnicity than your own.
Using electronic medium to discuss or complete an assignment.
Campus environment encouraging contact among students from different economic, social, and racial or ethnic backgrounds.
Participate in a learning community or some other formal program where groups of students take two or more classes together.
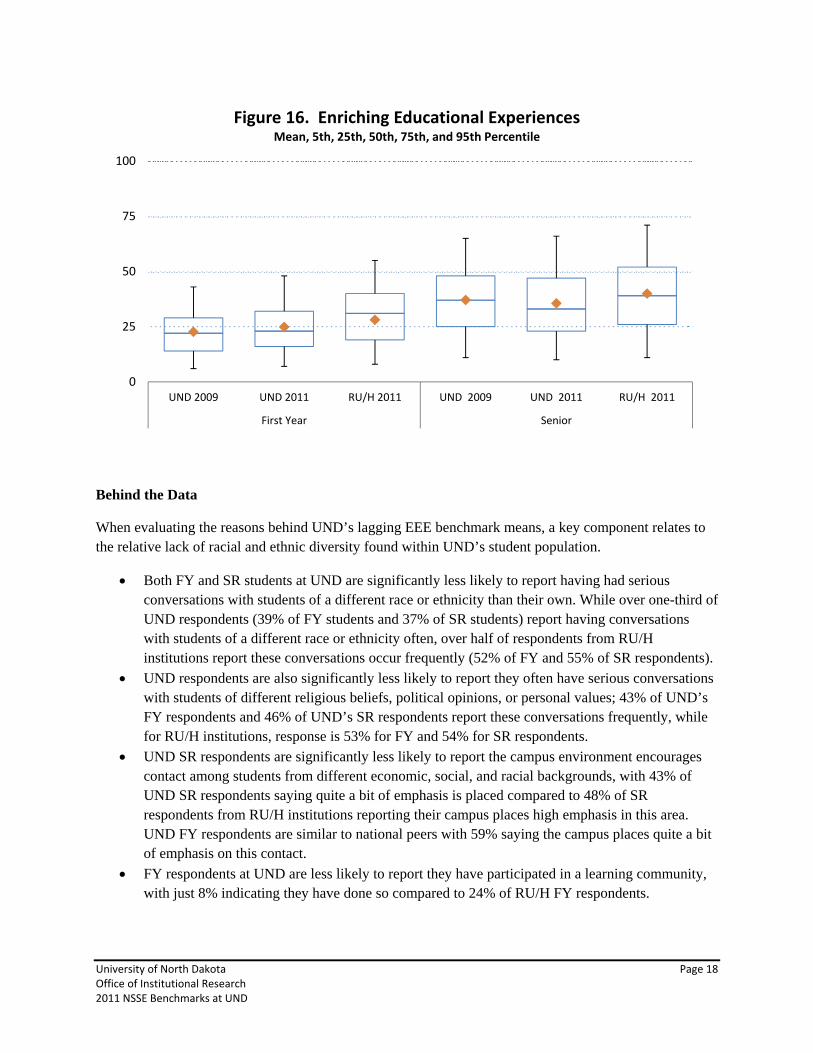
EEE represents the NSSE benchmark where UND scores the poorest scores with relation to their peers, with both FY and SR respondents recording means significantly behind their RU/H peers (Figure 16). The effect size for both FY and SR respondent is greater than 0.20, indicating there is more than a slight actual difference in addition to the statistical difference. Historically, UND lags peer groups in this benchmark, which focuses on enhanced learning opportunities and contact with diverse populations.
University of North Dakota Page 18 Office of Institutional Research 2011 NSSE Benchmarks at UND
Behind the Data
When evaluating the reasons behind UND’s lagging EEE benchmark means, a key component relates to the relative lack of racial and ethnic diversity found within UND’s student population.
Both FY and SR students at UND are significantly less likely to report having had serious conversations with students of a different race or ethnicity than their own. While over one-third of UND respondents (39% of FY students and 37% of SR students) report having conversations with students of a different race or ethnicity often, over half of respondents from RU/H institutions report these conversations occur frequently (52% of FY and 55% of SR respondents).
UND respondents are also significantly less likely to report they often have serious conversations with students of different religious beliefs, political opinions, or personal values; 43% of UND’s FY respondents and 46% of UND’s SR respondents report these conversations frequently, while for RU/H institutions, response is 53% for FY and 54% for SR respondents.
UND SR respondents are significantly less likely to report the campus environment encourages contact among students from different economic, social, and racial backgrounds, with 43% of UND SR respondents saying quite a bit of emphasis is placed compared to 48% of SR respondents from RU/H institutions reporting their campus places high emphasis in this area. UND FY respondents are similar to national peers with 59% saying the campus places quite a bit of emphasis on this contact.
FY respondents at UND are less likely to report they have participated in a learning community, with just 8% indicating they have done so compared to 24% of RU/H FY respondents.
0
25
50
75
100
UND 2009 UND 2011 RU/H 2011 UND 2009 UND 2011 RU/H 2011
First Year Senior
Figure 16. Enriching Educational ExperiencesMean, 5th, 25th, 50th, 75th, and 95th Percentile

University of North Dakota Page 19 Office of Institutional Research 2011 NSSE Benchmarks at UND
Under one-half (40%) of SR respondents from UND indicate they have completed a practicum, internship, or co-op experience, with an additional 33% still planning on participating in such an activity. Nationally, 50% of SR students report having completed an internship, with an additional 28% still planning to do so.
UND SR respondents are also significantly less likely to have completed a study abroad experience, with 11% indicating they have done study abroad and 5% indicating they still plan to, compared to RU/H SR respondents where 14% have completed study abroad and 10% indicate plans to. FY respondents from UND are also less likely to report they plan to study abroad, with 31% reporting plans compared to 45% at RU/H institutions.
UND respondents report similar participation in community service or volunteer work compared to their RU/H peers.
Over Time
Following trends on the other benchmarks, UND mean scores for enriching educational experiences show an increase over 2009 for FY respondents while SR mean score decreases (Figure 17). Contributing to the FY increase are nice increases in the percentages of students who indicate they have frequent conversations with students of a different race or ethnicity (31% to 39%) and an increase in the frequency with which FY students indicate they use electronic means to discuss or complete an assignment (45% indicated this occurred often in 2009 compared to 53% in 2011).
*Due to changes in the NSSE questions asked, EEE calculated in 2003 cannot be compared to succeeding years.
The decline in benchmark score for UND SR respondents can be linked to decreased participation in high-impact learning practices. The percentage of SR respondents indicating they have completed an internship or practicum has decreased from 50% in 2009 to 40% in 2011; the percentage of SR
23.221.3
22.7
24.9
34.2 34.7
37.135.6
2003* 2005 2007 2009 2011
Figure 17. Enriching Educational Experiences (EEE)Over Time At UND*
UND FY UND SR

University of North Dakota Page 20 Office of Institutional Research 2011 NSSE Benchmarks at UND
respondents indicating they have done community service or volunteer work has decreased from 64% in 2009 to 56% in 2011.
It may be cautionary to UND as a whole that both FY and SR respondents are reporting less time spent participating in co-curricular activities. Students indicate the amount of time they spend on an 8-point scale, where 1 equates to zero hours per week and 8 equates to more than 30 hours per week. FY respondents mean score dropped from 2.29 in 2009 to 2.18 in 2011. The drop in reported hours by SR respondents is even more pronounced, moving from 2.43 in 2009 to 2.00 in 2011.
Comparison By College
UND as an institution scores lowest in the enriching educational experiences benchmark. When looking at the contributing college components, the School of Medicine and Health Sciences scores lowest for SR students with a mean EEE benchmark of 30.2 and undecided respondents score lowest for FY students with a mean EEE benchmark of 22.1. On the high end, SR respondents from Arts & Sciences score the highest benchmark mean at 40.4, and FY respondents from the College of Business score a high mean of 26.5. Figures 18 and 19 summarize the EEE benchmark by college for FY and SR students respectively.
**Numbers for UND are weighted against RU/H institutions by gender, enrollment status, and institutional size. College level
data is not weighted as such, therefore direct comparison may be skewed.
For FY students, those from the College of Business show the greatest increase in EEE benchmark mean over the mean scored in 2009 (increase from 21.9 to 26.5). The College of Education is on a downward trajectory with regard to the EEE benchmark.
21.9
25.4
22.1
20.0
21.3
21.4
22.4
20.4
20.5
22.0
24.6
19.5
24.4
22.7
21.9
24.4
22.8
21.9
22.1
22.8
23.8
24.5
24.9
25.1
25.7
25.8
26.5
0
25
50
75
100
UNDEC EHD SMHS NUR UNDInstitution
**
SEM A&S JDO BPA
Figure 18. Enriching Educational Experiences (EEE)By UND College For FY Respondents
2007 2009 2011

University of North Dakota Page 21 Office of Institutional Research 2011 NSSE Benchmarks at UND
**Numbers for UND are weighted against RU/H institutions by gender, enrollment status, and institutional size. College level
data is not weighted as such, therefore direct comparison may be skewed.
When the EEE benchmark mean is evaluated for SR students, both the School of Engineering and the School of Medicine see significant drops in mean.
X. Supportive Campus Environment
Students perform better and are more satisfied at colleges that are committed to their success and cultivate positive working and social relations among different groups on campus.
Supportive campus environment is measured by six elements of the NSSE survey:
Campus environment provides the support you need to help you succeed academically.
Campus environment helps you cope with your non-academic responsibilities including work and family.
Campus environment provides the support you need to thrive socially.
Quality of relationships with other students.
Quality of relationships with faculty members.
Quality of relationships with administrative personnel and offices.
UND SCE benchmark means are equivalent to those at other research universities with high activity (Figure 20). FY respondents for both groups score benchmark means of 61.5. SR respondents at UND score a mean of 57.2, just two-tenths point lower than the 57.4 benchmark mean scored by SR respondents from RU/H institutions.
36.6
35.0
34.7
36.0
34.7
34.9
35.4
35.5
36.5
37.7
31.7
33.8
37.1
34.6
38.1 42.8
30.2
31.1
33.5
34.6
35.6
36.2
37.6
40.4
0
25
50
75
100
SMHS SEM JDO BPA UNDInstitution**
NUR EHD A&S
Figure 19. Enriching Educational Experiences (EEE)By UND College For SR Respondents
2007 2009 2011

University of North Dakota Page 22 Office of Institutional Research 2011 NSSE Benchmarks at UND
Behind the Data
UND students report high-quality relationships with their fellow students, with FY students scoring their relationships 5.49 on a scale of 1-to-7, and SR students scoring 5.62. These are very similar to the scores of 5.46 and 5.58 scored by FY and SR students at RU/H institutions.
The reported quality of relationships with faculty varies little when UND means are compared to those of RU/H respondents.
UND SR mean of 4.68 for relationships with administrative personnel is significantly higher than the RU/H SR mean of 4.55.
UND students are significantly less likely to say UND’s campus environment provides them the support needed to succeed academically when compared to respondents from RU/H institutions, with UND reporting averages of 3.02 versus 3.10 for FY respondents and 2.83 versus 2.89 for SR respondents.
Over Time
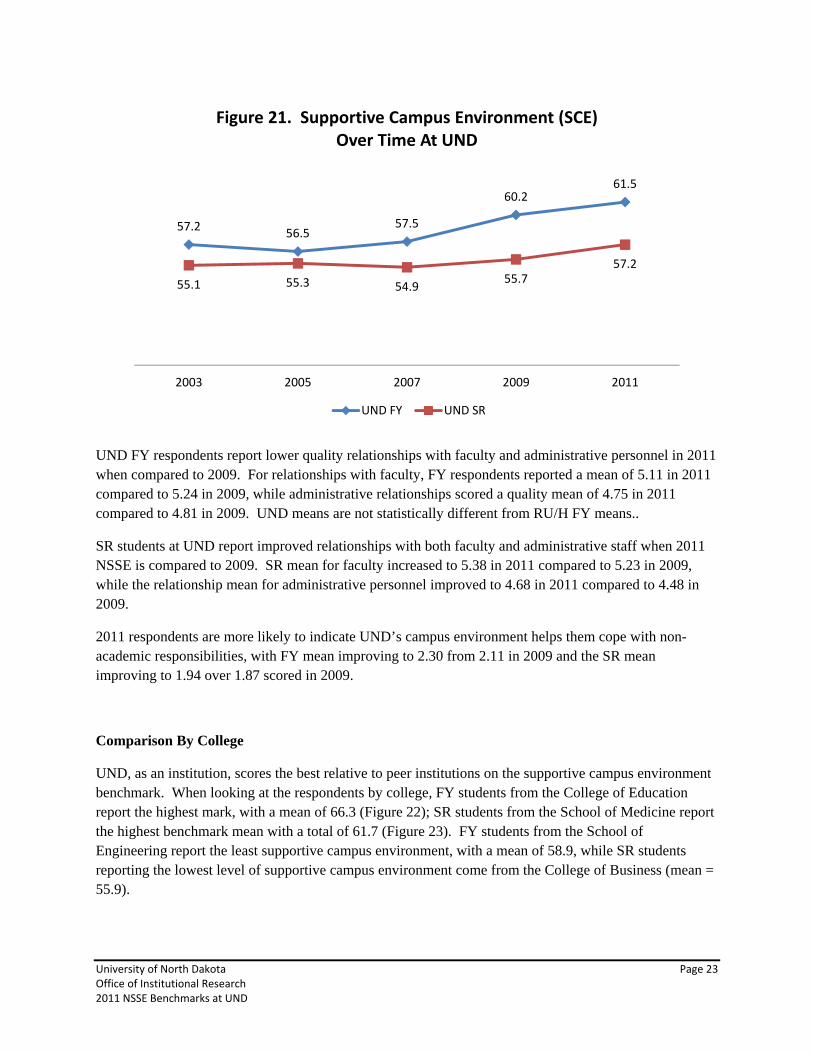
Improvements seen in the SCE benchmark in 2009 continue in 2011, with both FY and SR mean scores increasing (Figure 21).
0
25
50
75
100
UND 2009 UND 2011 RU/H 2011 UND 2007 UND 2011 RU/H 2011
First Year Senior
Figure 20. Supportive Campus Environment (SCE)Mean, 5th, 25th, 50th, 75th, and 95th Percentile
University of North Dakota Page 23 Office of Institutional Research 2011 NSSE Benchmarks at UND
UND FY respondents report lower quality relationships with faculty and administrative personnel in 2011 when compared to 2009. For relationships with faculty, FY respondents reported a mean of 5.11 in 2011 compared to 5.24 in 2009, while administrative relationships scored a quality mean of 4.75 in 2011 compared to 4.81 in 2009. UND means are not statistically different from RU/H FY means..
SR students at UND report improved relationships with both faculty and administrative staff when 2011 NSSE is compared to 2009. SR mean for faculty increased to 5.38 in 2011 compared to 5.23 in 2009, while the relationship mean for administrative personnel improved to 4.68 in 2011 compared to 4.48 in 2009.
2011 respondents are more likely to indicate UND’s campus environment helps them cope with non-academic responsibilities, with FY mean improving to 2.30 from 2.11 in 2009 and the SR mean improving to 1.94 over 1.87 scored in 2009.
Comparison By College
UND, as an institution, scores the best relative to peer institutions on the supportive campus environment benchmark. When looking at the respondents by college, FY students from the College of Education report the highest mark, with a mean of 66.3 (Figure 22); SR students from the School of Medicine report the highest benchmark mean with a total of 61.7 (Figure 23). FY students from the School of Engineering report the least supportive campus environment, with a mean of 58.9, while SR students reporting the lowest level of supportive campus environment come from the College of Business (mean = 55.9).
57.256.5
57.5
60.261.5
55.1 55.3 54.955.7
57.2
2003 2005 2007 2009 2011
Figure 21. Supportive Campus Environment (SCE) Over Time At UND
UND FY UND SR

University of North Dakota Page 24 Office of Institutional Research 2011 NSSE Benchmarks at UND
**Numbers for UND are weighted against RU/H institutions by gender, enrollment status, and institutional size. College level
data is not weighted as such, therefore direct comparison may be skewed.
FY respondents from the College of Business record the largest increase in benchmark mean over 2009, returning to a level achieved in 2007. As a general rule, all colleges follow the pattern of increasing SCE benchmark mean. Nursing sees the largest decrease, after showing a large increase in 2009.
**Numbers for UND are weighted against RU/H institutions by gender, enrollment status, and institutional size. College level
data is not weighted as such, therefore direct comparison may be skewed.
57.8
55.2
58.9
57.5
61.6
59.1
58.4
56.3
60.3
58.7
61.2
55.8 60.2
61.1 65.9
60.6
61.2
62.5
58.9
60.6
60.6
61.5
61.7
62.5
62.8
62.8
66.3
0
25
50
75
100
SEM A&S BPA UNDInstitution
**
SMHS NUR JDO UNDEC EHD
Figure 22. Supportive Campus Environment (SCE)By UND College For FY Respondents
2007 2009 2011
54.7
56.3
54.9
51.8 58.2 63.2
57.8
52.8
56.8
55.4
57.7
56.0
50.1 55.5
56.4 61.9
55.9
56.8
57.2
57.2
57.7
58.9
59.5
61.7
0
25
50
75
100
BPA NUR UNDInstitution**
A&S JDO SEM EHD SMHS
Figure 23. Supportive Campus Environment (SCE)By UND College For SR Respondents
2007 2009 2011

University of North Dakota Page 25 Office of Institutional Research 2011 NSSE Benchmarks at UND
For SR respondents, results by college tend to show a fairly flat benchmark mean scores. Two exceptions, JDO and SEM, record somewhat larger increases in 2011, however this follows a relatively large drop in mean score when 2009 is compared to 2007.
XI. Summary Questions
NSSE asks three summary questions to allow institutions to see an overall level of satisfaction of their first-year and senior students.
Academic Advising
The first question asks students to rate the quality, overall, of the academic advising they have received. UND continues to see positive increases in this area when 2011 results are compared to prior surveys (Figure 24).
Nearly eight out of ten (79%) FY respondents from UND rate the quality of the academic advising they receive as being good or excellent (Figure 24). Seven out of ten (71%) SR UND respondents report high quality advising as well. While the reported level of satisfaction with advising continues to increase, FY scores from RU/H institutions surpassed UND’s in 2011. SR respondents from UND, however, continue to exceed their national RU/H peers.
70%74% 76% 78% 79%
65%69% 70% 71% 67%
UND2005
UND2007
UND2009
UND2011
RU/H2011
UND2005
UND2007
UND2009
UND2011
RU/H2011
FY SR
Figure 24. Quality of Academic Adivising Received At UNDPercent of Students Responding "Excellent" or "Good"

University of North Dakota Page 26 Office of Institutional Research 2011 NSSE Benchmarks at UND
When looking at college-level academic advising, FY students from the College of Education are the most satisfied, with 90% of respondents saying their advising was either excellent or good (Figure 25). This college shows continued high satisfaction with advising following a large increase in 2009. Three groups (Nursing, Aerospace, and Undecided respondents) report drops in the level of satisfaction in 2011 after significant gains were reported in 2011. Engineering FY respondents show a significant gain in satisfaction with advising.
73%
73%
68% 74%
67% 78%
77%
77%
70%77%
80%
66% 76%
73%
87%
75% 84% 92%
72%
73%
77%
78%
78%
79%
79% 85% 90%
Undec JDO SEM UNDInstitution
A&S NUR BPA SMHS EHD
Figure 25. Quality of Academic Advising Received At UND,Percent of FY Reporting Excellent or Good, Increasing By 2011 Total
2007 2009 2011
63%
65%
93%
57% 69%
65%
79%
65%72%
69%
66%
69%
70%
63% 73%
100%
69%
70%
70%
70%
71%
72% 82%
86%
BPA A&S SEM NUR UNDInstitution
EHD JDO SMHS
Figure 26. Quality of Academic Advising Received At UND,Percent of SR Reporting Excellent or Good, Increasing By 2011 Total
2007 2009 2011

University of North Dakota Page 27 Office of Institutional Research 2011 NSSE Benchmarks at UND
The percentages of SR students reporting they receive excellent or good academic advising is lower than the percentages of FY students. Leading the way is the School of Medicine where in 2011, 86% of NSSE respondents report they receive high-quality advising(Figure 26). While the College of Education has high levels of satisfaction by FY students with regard to academic advising, they score just an average level of satisfaction. Many trends for reported advising by SR respondents appear to be positive.
Entire Educational Experience
NSSE asks students to rate their entire educational experience thus far at this institution. Students indicate on a 4-point scale where 1 = poor, 2 = fair, 3 = good, and 4 = excellent.
Ninety percent of UND FY students report their entire educational experience thus far as being excellent or good, while 86% of SR respondents state such (Figure 27).
When the overall mean for this measure is evaluated, UND SR respondents rate a mean of 3.13, which is significantly behind the 3.19 mean from SR respondents at RU/H institutions. UND has a lower percentage of respondents reporting their entire experience is “excellent” (32% versus 37% at RU/H institutions). The mean score for UND FY respondents is 3.24 which mirrors the mean of 3.22 from RU/H FY respondents.
85% 84%90% 90% 87% 84% 85% 84% 86% 84%
UND2005
UND2007
UND2009
UND2011
RU/H2011
UND2005
UND2007
UND2009
UND2011
RU/H2011
FY SR
Figure 27. Mean Score For Entire Educational ExperiencePercent Reporting "Excellent" or "Good"

University of North Dakota Page 28 Office of Institutional Research 2011 NSSE Benchmarks at UND
Various colleges again have differing responses when their students are asked to rate their educational experiences. For FY students, those from the College of Education report the highest level of satisfaction with their experience, as was the case in 2009 (Figure 28). EHD SR respondents also indicate the highest level of overall educational experience, rebounding to high levels following a dip in 2009 (Figure 29).
FY respondents from JDO, SEM, and SMHS all show nice increasing trends for reported educational experience. SR respondents, on the other hand, tend to record relatively flat or declining trends. There is
82%
83%
87% 93%
84%
85%
83% 93%
90%
91%
82% 92%
95%
90%
87%
91% 96%
100%
87%
88%
89%
89%
90%
94%
96%
97%
100%
A&S BPA Undec NUR UNDInstitution
JDO SEM SMHS EHD
Figure 28. Entire Educational Experience By College,Percent of FY Reporting Excellent or Good, Increasing By 2011 Total
2007 2009 2011
86%
75% 85%
88%
85% 92%
93%
90%
73%
93%
85%
85%
84% 90%
87%
79%
82%
82%
83%
85%
86%
88%
88% 94%
JDO SMHS BPA A&S UNDInstitution
SEM NUR EHD
Figure 29. Entire Educational Experience By College,Percent of SR Reporting Excellent or Good, Increasing By 2011 Total
2007 2009 2011

University of North Dakota Page 29 Office of Institutional Research 2011 NSSE Benchmarks at UND
also a bit of up-and-down being seen in a few colleges at the SR respondent level, making trends difficult to determine.
Attend Again
The last question NSSE asks students is if they could start over again, would they go to the same institution they are now attending. At UND, high numbers of respondents state that yes, they would attend again, with 87% of FY students and 83% of SR students reporting they would definitely or probably again choose UND (Figure 30). Both are higher than the percentage of students at RU/H institutions saying they would again choose their particular institutions, however the difference is not statistically significant.
When looking at the historical numbers, UND scores in 2011 mirror levels seen in prior years for FY respondents while the SR respondent percentage dropped just slightly.
At the college level, respondents from the College of Education report the highest likelihood to again choose UND if given the chance to start over for both FY and SR respondents (Figures 31 and 32). FY respondents from Arts & Sciences and FY undecided respondents are least likely to report they would again choose UND, while SR respondents from Nursing are least likely to report so.
87% 84% 87% 87% 84% 81% 84% 85% 83% 80%
UND2005
UND2007
UND2009
UND2011
RU/H2011
UND2005
UND2007
UND2009
UND2011
RU/H2011
FY SR
Figure 30. Percentage of Students Who Would Again Choose Their Institution If Given the Chance To Start Over

University of North Dakota Page 30 Office of Institutional Research 2011 NSSE Benchmarks at UND
88%
91%
83%
86%
88%
84%
85%
87%
87%
85% 94%
88%
90%
92%
89%
84%
84% 90%
81%
81%
91%
83%
84% 92% 100%
96%
95%
'07 '09 '11 '07 '09 '11 '07 '09 '11 '07 '09 '11 '07 '09 '11 '07 '09 '11 '07 '09 '11 '07 '09 '11 '07 '09 '11
A&S Undec UND Inst SMHS NUR JDO BPA SEM EHD
Figure 31. If You Could Start Over, Would You Attend UND?FY Respondents Saying "Definitely yes" or "Probably yes"
86%
80%
79%
77% 86%
81%
100%
89%
82%
84%
85%
83%
80%
79%
89% 93%
88%
89%
74% 83%
94%
95%
81%
94%
'07 '09 '11 '07 '09 '11 '07 '09 '11 '07 '09 '11 '07 '09 '11 '07 '09 '11 '07 '09 '11 '07 '09 '11
NUR BPA JDO UND Inst SMHS SEM A&S EHD
Figure 32. If You Could Start Over, Would You Attend UND?SR Respondents Saying "Definitely yes" or "Probably yes"

University of North Dakota Page 31 Office of Institutional Research 2011 NSSE Benchmarks at UND
XII. Summary Conclusions
For the 2011 administration of NSSE, UND FY respondents show marked improvement in benchmark results when compared to earlier versions of the survey; four of the five benchmark means for FY respondents moved from being significantly behind their peers from high-activity research universities to there being no statistical difference. On the other hand, results from UND SR respondents show declining benchmark mean scores for four of the five NSSE benchmarks when 2011 is compared to 2009.
Providing UND students more opportunities for working together would enhance the Active and Collaborative Learning benchmark scores, as both FY and SR respondents from UND indicate they are less likely to work with fellow students outside of class. UND students, both FY and SR are less likely to report doing presentations in class, so faculty may look for ways to include additional presentation activities to the syllabi of their courses to promote this activity.
While UND respondents report increased time spent preparing for class, significantly less time is being spent participating in co-curricular activities. This implies that UND students may be more focused on their studies, which is a positive outcome, however these students may not be honing those skills that are developed through participation in student activities.
UND respondents continue to fall significantly behind peer groups with regard to Enriching Educational Experiences. Two components contribute to this particular benchmark: interacting with persons different from yourself and participation in what are called high-impact learning practices (internships, service work, study abroad, and senior capstone projects). While the general makeup of the UND student body tends to be limited with regard to racial diversity, the institution could look for new ways to engage students in communication about diverse perspectives. Continuing focus on increasing participation in the high-impact learning practices would also increase UND performance in this benchmark area.
Lastly, UND performs well on the Supportive Campus Environment benchmark. Respondents report positive relationships with fellow students, faculty, and administrative staff. Continuing to be responsive to the student experience will only enhance this benchmark further.
For additional information or further data from UND’s 2011 National Survey of Student Engagement, contact the Office of Institutional Research. The website is http://und.edu/research/institutional-research/ .