2012-2013 psu econ dept seminar · 2012-2013 psu econ dept seminar ... brain drain is considered in...
TRANSCRIPT

Ryu, Jangsoo (Prof., Pukyung Univ.)
Park, Sungik (Prof., Kyungsung Univ.)
Kim, Jonghan(Prof., Kyungsung Univ.)
Cho, Jangsik (Prof., Kyungsung Univ.)
Kwak, Sohui (Researcher, BHRDI)
2012-2013 PSU Econ Dept Seminar

Contents Introduction Ⅰ
Research Contents and Methods Ⅱ
Ⅲ
The 1st Stage of Brain Drain 4 Ⅳ
Graduate Characteristics
Ⅴ The 2nd Stage of Brain Drain
5 The Regression and Decision Tree Analysis Ⅵ
Summary Ⅶ
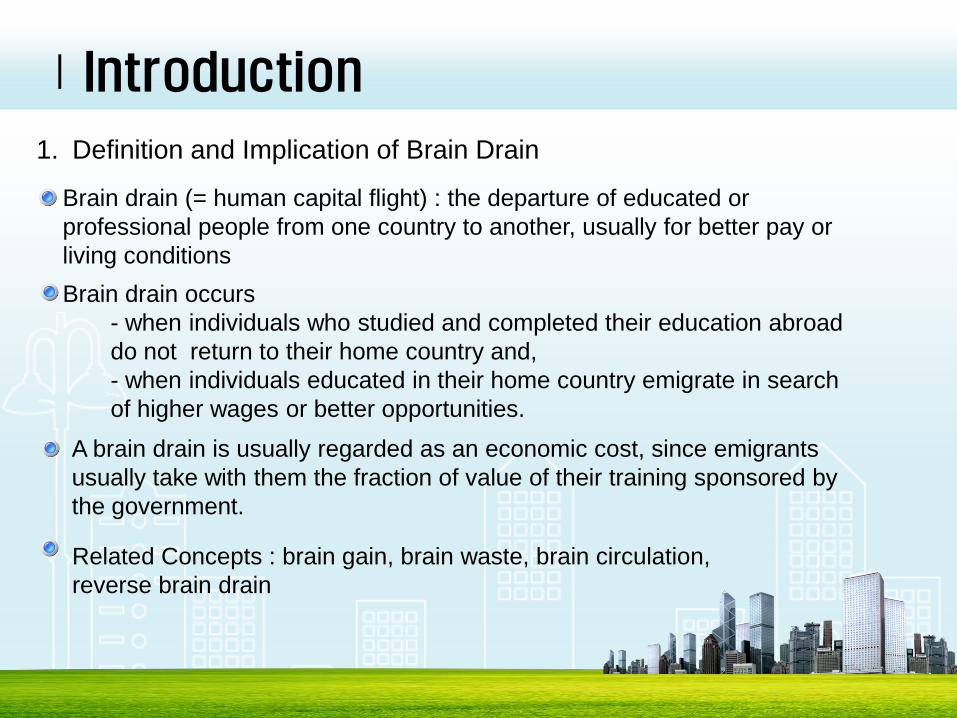
1. Definition and Implication of Brain Drain
ⅠIntroduction
Related Concepts : brain gain, brain waste, brain circulation,
reverse brain drain
Brain drain (= human capital flight) : the departure of educated or
professional people from one country to another, usually for better pay or
living conditions
Brain drain occurs
- when individuals who studied and completed their education abroad
do not return to their home country and,
- when individuals educated in their home country emigrate in search
of higher wages or better opportunities.
A brain drain is usually regarded as an economic cost, since emigrants
usually take with them the fraction of value of their training sponsored by
the government.

ⅠIntroduction 2. Scope of Brain Drain
⇒ Research purpose of our study is to :
- study the amount of brain drain
- figure out the characteristics of brain drain
- find policy to curb brain drain in Busan,
which is the second-largest city of Korea.
In general, brain drain is considered in terms of international scope.
- Major concern is brain drain of skilled and trained persons from
developing to developed countries
- It is an abnormal form of scientific exchange between countries,
characterized by a one-way flow in favor of the most highly developed
countries (1969 UNESCO report)
However, the concept of brain drain may be applied to a national scope.
- Rapid urbanization in developing countries is related to brain drain.
- However, relatively developed countries such as Korea are also
experiencing brain drain in provincial areas.

ⅠIntroduction
Brain drain by states
☞ The Case of Brain Drain in the US.
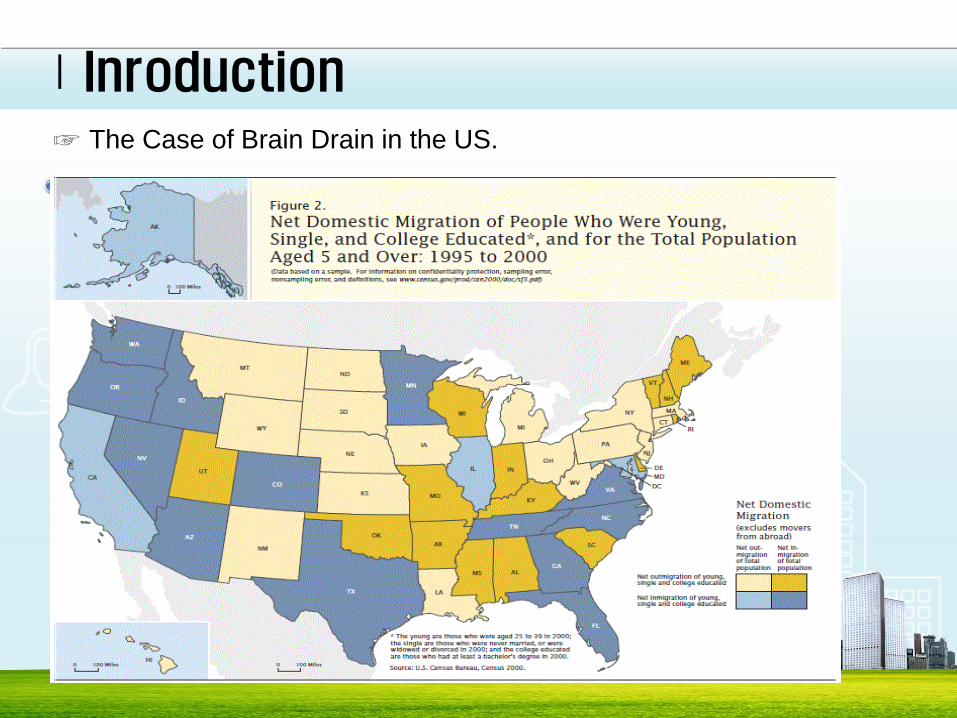
ⅠInroduction ☞ The Case of Brain Drain in the US.

ⅠIntroduction
A major finding is that young educated people tend to be moving to cities,
while young people without a college education tend to be moving to rural
areas.
☞ The Case of Brain Drain in the US.
Why did they go or stay? (from Maine’s College Graduates: Where They Go and Why?)
- Keeping young people in state for their college educations was important
in curbing brain drain.
- College reputation was the most important factor determining whether
Maine’s high school graduates attended college in Maine or out of state.
The next most important factors were affordability and financial assistance.
- Graduates who stayed in Maine rated social issues, such as family and
cultural ties, as the main reasons why they live in state, while graduates
living out of state rated career opportunities as the main reason why they
left the state.

☞ Map of Korea
ⅠIntroduction
SMA(Seoul Metropolitan Area)
includes Seoul, Incheon and
Gyeonggi
Busan, Ulsan and Gyeongnam
are neighbors and form close
ties with each other

ⅠIntroduction Concentration of population and economic power to SMA is so severe in
Korea.
Population share GRDP share
SMA Busan SMA Busan
1985 39.0% 8.7% 46.1% 7.1%
2000 46.3% 7.9% 47.7% 5.7%
2010 49.1% 7.0% 48.8% 5.0%
Need to figure out the current situation of brain drain in Busan
- Many high school graduates in Busan go to universities in other regions.
- Lots of college graduates in Busan also go to other regions to get better jobs
due to lack of decent jobs
Need to figure how many, where and why do they go

Ⅱ. Research Contents and Methods
Contents: the current situation of brain drain in Busan
In- and out-migration of high school graduates to universities in other regions
: 1st stage of brain drain
Determinants of out-migration utilizing regression and decision tree analysis
The comparision between who stays and who goes out
In- and out-migration of college graduates to other regions to get jobs
: 2nd stage of brain drain
Net balance of brain drain

Ⅱ. Research Contents and Methods
Methods: Utilizing Graduate Occupational Mobility Survey(GOMS)
Population are graduates of colleges and universities. Sample size is about
18,000.
Questionnaire includes education history, job careers, current job information,
personal information and family background, etc…
GOMS has geographical information on high school, college or university and
workplace Limitation is that persons without college diploma are not covered in the
sample.
Our research is based on the cohort analysis of the young adults who
graduated on Aug. 2008 and Feb. 2009.

Ⅱ. Research Contents and Methods
☞ Things to keep in mind to better understand our research
College is 2 or 3 years and university is 4 years. In general, university is
preferred to college.
Public university is preferred to private university. Tuition and fees are cheaper
in public than private university.
English ability is important to get admission from university and job offer from
company as well. Many university students take TOEIC(test of English for
international communication)
In general, big company in terms of the number of employees is better than small company.

Ⅲ. Graduate characteristics
<Table 1> Graduate characteristics (classified by college location)
Unit: %, persons
Busan Ulsan Kyungnam SMA Other sum
Regional sum 8.5 1.3 5 39.3 45.9 480,192
Sex
Male 46.6 48.6 47.2 47.3 50.6 245,973
Female 53.4 51.4 52.8 52.7 49.4 234,219
Education
level
College diploma 34.7 50.3 52.9 43.1 39.2 197,623
University diploma 65.3 49.7 47.1 56.9 60.8 282,571
Parents’
income
when they
enter
college
Less than U$900 6.8 6.9 10.6 13.1 13.3 59,723
U$900~2,700 38.3 42.2 40.8 33.7 46.6 194,314
U$2,700~4,500 47.3 45.5 43.9 37 32.7 174,535
More than U$4,500 7.6 5.4 4.6 16.3 7.4 51,620
Father’s
education
level
Less than high school 65.9 74.1 75.6 62.9 73.4 330,139
College 12 13.7 10.2 4.6 5.2 28,310
Higher than university 22.1 12.2 14.2 32.5 21.4 121,741
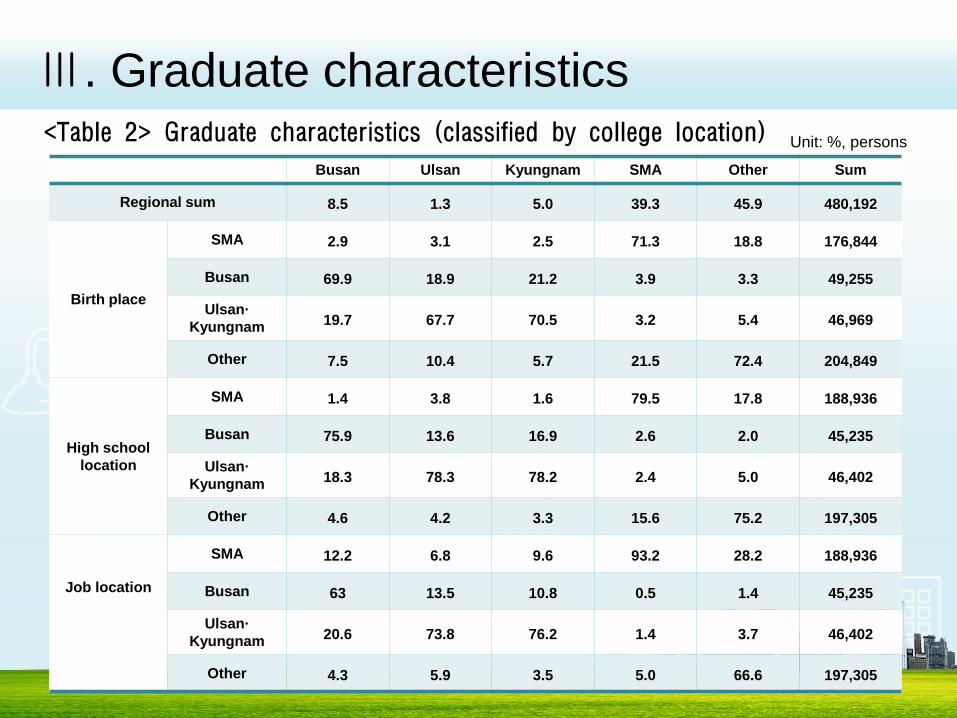
Ⅲ. Graduate characteristics <Table 2> Graduate characteristics (classified by college location) Unit: %, persons
Busan Ulsan Kyungnam SMA Other Sum
Regional sum 8.5 1.3 5.0 39.3 45.9 480,192
Birth place
SMA 2.9 3.1 2.5 71.3 18.8 176,844
Busan 69.9 18.9 21.2 3.9 3.3 49,255
Ulsan·
Kyungnam 19.7 67.7 70.5 3.2 5.4 46,969
Other 7.5 10.4 5.7 21.5 72.4 204,849
High school
location
SMA 1.4 3.8 1.6 79.5 17.8 188,936
Busan 75.9 13.6 16.9 2.6 2.0 45,235
Ulsan·
Kyungnam 18.3 78.3 78.2 2.4 5.0 46,402
Other 4.6 4.2 3.3 15.6 75.2 197,305
Job location
SMA 12.2 6.8 9.6 93.2 28.2 188,936
Busan 63 13.5 10.8 0.5 1.4 45,235
Ulsan·
Kyungnam 20.6 73.8 76.2 1.4 3.7 46,402
Other 4.3 5.9 3.5 5.0 66.6 197,305

Ⅳ. The 1st Stage of Brain Drain
1. In- and Out-Migration(high school⇒ college or university)
68.6% to Busan, 1.9% to Ulsan, 8.9% to Kyungnam, 10.7% to SMA
Ulsan 12.1%, Kyungnam 17.4% to Busan. SMA Only 0.3% to Busan
⇒ Out-migration to SMA from Busan is pronounced, while in-migration to
Busan from Ulsan and Kyungnam is notable.
<Table 3> In- and out-migration of 1st stage(college and university)
College or university location
Total Busan Ulsan Kyungnam SMA Other
High
school
location
Busan 68.6 1.9 8.9 10.7 9.9 45,235
Ulsan 12.1 37.4 5.7 9.7 35.1 11,453
Kyungnam 17.4 1.5 51.5 9.6 20.0 34,951
SMA 0.3 0.1 0.2 78.7 20.7 188,936
other 0.9 0.1 0.4 14.8 83.8 197,306
total 40,874 6,164 23,863 187,202 219,778 477,881
Unit: %, persons

Ⅳ. The 1st Stage of Brain Drain
For the case of university, 67.5% to Busan, 13.7%(>10.7%) to SMA.
⇒ Brain drain is more severe in university than college.
<Table 4> In- and out-migration of 1st stage(university) Unit: %, persons
University location
Total
Busan Ulsan Kyungnam SMA Other
High school
location
Busan 67.5 0.7 8.5 13.7 9.5 29,161
Ulsan 13 30.6 4.3 14.2 37.9 7,466
Kyungnam 21.5 1.2 40.9 13.2 23.2 18,990
SMA 0.4 0.1 0.1 73 26.3 106,447
Other 1.2 0.2 0.4 17.8 80.3 119,128
Total 26,670 3,066 11,249 106,473 133,734 281,192

Ⅳ. The 1st Stage of Brain Drain
Net balances of Busan show surplus to Ulsan(544 persons) and to
Kyungnam(2,052 persons). Hence, there is brain gain. However, net balance of
Busan show deficit to SMA(-4,306 persons) and other(-2,651 persons). Hence
there is brain drain
⇒ In total, net balance of Busan is –4,361 persons.
<Table 5> Net balance of 1st stage of brain drain
University location
total Busan Ulsan Kyungnam SMA other
High
school
location
Busan 544 2,052 -4,306 -2,651 -4,361
Ulsan -544 -110 -880 -3,755 -5,289
Kyungnam -2,052 110 -2,973 -6,173 -11,088
SMA 4,306 880 2,973 -9,893 -1,734
other 2,651 3,755 6,173 9,893 22,472
Unit : person

Ⅳ. The 1st Stage of Brain Drain
2. Comparision of characteristics
The shares of persons whose parents’ income is more than U$2,700 are 55.6%
in Busan and 65.9% in SMA
<Table 6> characteristics of high school graduates by university regions Unit: %, persons
Busan Ulsan·Kyungnam SMA other sum
Parents’
income
when they
enter
university
Less than U$900 7.1 8.3 11.6 14.6 3821
U$900~2,700 37.3 42.6 22.5 36.6 16398
U$2,700~4,500 47.2 45.5 42.4 34.8 20466
More than U$4,500 8.4 3.5 23.5 13.9 4550
Father’s
education
level
Less than high
school 65.6 78.6 51.7 61.9 29459
College 12.5 7.5 4.5 15.3 5155
Higher than
university 21.9 13.9 43.8 22.9 10623
The shares of persons whose parents’ education level is higher than university
are 21.9% in Busan and 43.8% in SMA

Ⅳ. The 1st Stage of Brain Drain
<Table 7> Employment performances by university regions
Busan Ulsan·Kyungnam SMA Other Sum
Employed 70.3 73.9 69.4 78 32,272
Number of
employees
less than 10 19.8 20 11.2 31.5 6,513
10~499 51.2 43.7 38.7 42.7 15,528
more than 500 29.0 36.3 50.2 25.9 10,230
Company
location
SMA 10.4 9.8 81.6 21 6,050
Busan 75.5 47.7 8.9 28.4 19,425
Ulsan·Kyungnam 11.8 35.7 3.0 11.1 4,329
other 2.3 6.9 6.5 39.5 2,335
Unit: %, persons
The shares of employed persons are about the same across regions.
The size of companies, in terms of the number of employees, is bigger in SMA
than Busan.
Once they leave Busan for SMA, they are not likely to come back for jobs.

Ⅳ. The 1st Stage of Brain Drain
<Table 8> Degree of satisfaction by university regions
Busan Ulsan·Kyungnam SMA Other Sum
Degree of
satisfaction
to company
Very unsatisfactory 0.3 1.0 0.0 0.0 91
Unsatisfactory 4.5 5.0 4.3 5.0 1,482
middle 42.5 30.5 33.3 38.7 12,852
Satisfactory 48.8 60.3 47.3 51.8 16,212
Very satisfactory 3.9 3.2 15.1 4.5 1,633
Degree of
satisfaction
to main
business
Very unsatisfactory 0.4 1.0 0.4 0.0 145
Unsatisfactory 3.5 3.3 4.1 1.8 1,088
middle 43.0 33.5 30.6 36.0 12,880
Satisfactory 49.3 57.4 52.3 57.5 16,588
Very satisfactory 3.7 4.8 12.6 4.7 1,573
(unit: %, persons)

Ⅳ. The 1st Stage of Brain Drain
The shares of persons whose salary is more than U$2,700 are 6.2% in Busan
and 18.0% in SMA
<Table 9> Salary by university regions
Busan Ulsan·Kyungnam SMA other sum
Sum 67.8 10.9 10.5 10.8 32,157
Salary
Less than U$900 34.1 30.7 33.8 27.7 14,944
U$900~U$2,700 59.7 63.1 48.2 65.1 26,847
More than U$2,700 6.2 6.3 18.0 7.3 3,444
(unit: %, persons)
Ⅴ. The 2nd Stage of Brain Drain
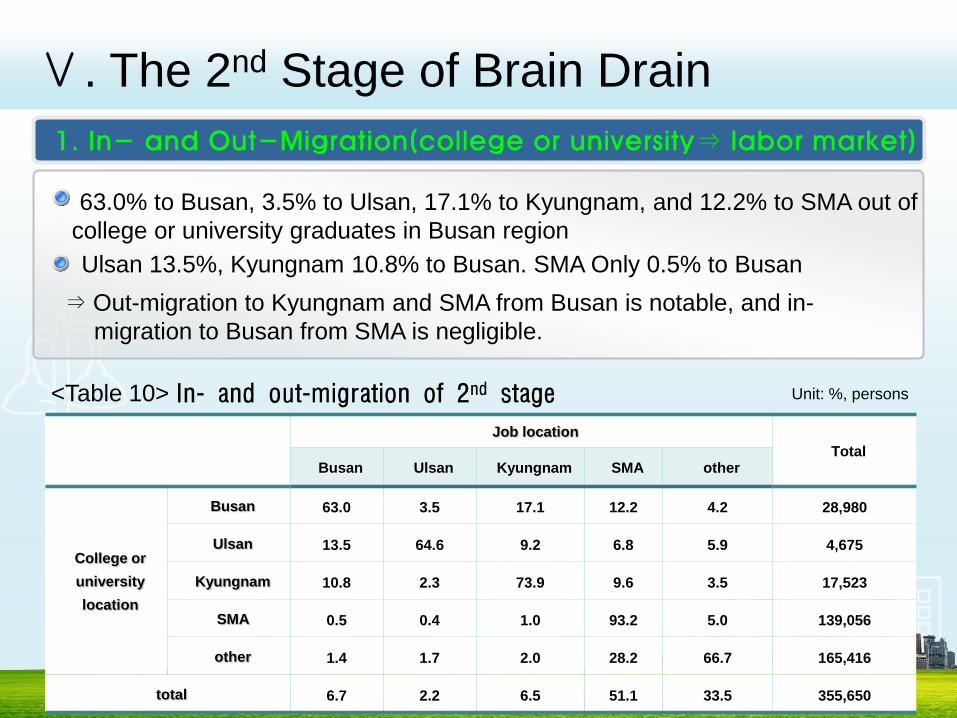
1. In- and Out-Migration(college or university⇒ labor market)
63.0% to Busan, 3.5% to Ulsan, 17.1% to Kyungnam, and 12.2% to SMA out of
college or university graduates in Busan region
Ulsan 13.5%, Kyungnam 10.8% to Busan. SMA Only 0.5% to Busan
<Table 10> In- and out-migration of 2nd stage
Job location
Total Busan Ulsan Kyungnam SMA other
College or
university
location
Busan 63.0 3.5 17.1 12.2 4.2 28,980
Ulsan 13.5 64.6 9.2 6.8 5.9 4,675
Kyungnam 10.8 2.3 73.9 9.6 3.5 17,523
SMA 0.5 0.4 1.0 93.2 5.0 139,056
other 1.4 1.7 2.0 28.2 66.7 165,416
total 6.7 2.2 6.5 51.1 33.5 355,650
Unit: %, persons
⇒ Out-migration to Kyungnam and SMA from Busan is notable, and in-
migration to Busan from SMA is negligible.

Ⅴ. The 2nd Stage of Brain Drain
For the case of university, 57.8% to Busan, 16.0%(>12.2%) to SMA.
⇒ Brain drain is more severe in university than college.
<Table 11> In- and out-migration of 2nd stage(university) Unit: %, persons
Job location
total
Busan Ulsan Kyungnam SMA Other
university
location
Busan 57.8 4.0 16.7 16.0 5.5 18,935
Ulsan 4.5 63.6 9.6 13.3 9.1 2,060
Kyungnam 15.6 1.2 64.9 13.7 4.6 7,344
SMA 0.6 0.7 1.4 90.5 6.8 76,842
Other 1.3 1.9 2.0 34.4 60.4 98,069
total 6.8 2.2 5.5 53.0 32.5 203,250

Ⅴ. The 2nd Stage of Brain Drain
Net balances of Busan show deficit to Ulsan(-381 persons) and to Kyungnam(-
3,069 persons). Hence, there is brain drain. In addition, net balance of Busan
show deficit to SMA(-2,890 persons). Hence there is brain drain.
⇒ In total, net balance of Busan is –5,302 persons.
<Table 12> Net balance of 2nd stage of brain drain
Job location
Total Busan Ulsan Kyungnam SMA other
College or
university
location
Busan -381 -3,069 -2,890 1,038 -5,302
Ulsan 381 -29 275 2,573 3,200
Kyungnam 3,069 29 -347 2,699 5,450
SMA 2,890 -275 347 39,789 42,751
other -1,038 -2,573 -2,699 -39,789 -46,099
Unit : person

Ⅴ. The 2nd Stage of Brain Drain
By adding up the 1st and 2nd net balances, we can calculate net balance from
high school graduation to employment.
<Table 13> aggregate balances from high school graduation to employment
Net balances of Busan show surplus only to Ulsan(163 persons) but deficit to
Kyungnam(-1,017), SMA(-7,196 persons). Hence there is brain drain. ⇒ In total, aggregate net balance of Busan is –9,663 persons.
Job location
Total Busan Ulsan Kyungnam SMA other
High school
location
Busan 163 -1,017 -7,196 -1,613 -9,663
Ulsan -163 -139 -605 -1,182 -2,089
Kyungnam 1,017 139 -3,320 -3,474 -5,638
SMA 7,196 605 3,320 29,896 41,017
other 1,613 1,182 3,474 -29,896 -23,627
Unit : persons

Ⅴ. The 2nd Stage of Brain Drain
High school university Job
Busan
Ulsan
Kyungnam
SMA
other
Busan
Ulsan
Kyungnam
SMA
other
Busan
Ulsan
Kyungnam
SMA
other
68.6
37.4
51.5
78.7
83.8
63.0
64.6
73.9
66.7
Unit : %
Ⅴ. The 2nd Stage of Brain Drain
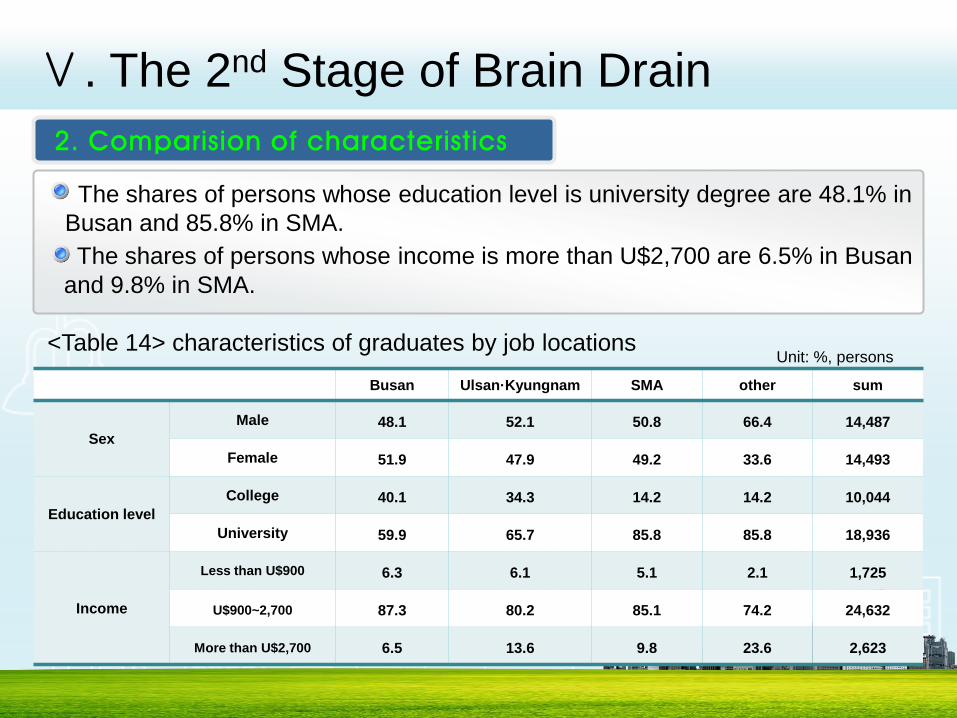
2. Comparision of characteristics
The shares of persons whose education level is university degree are 48.1% in
Busan and 85.8% in SMA.
The shares of persons whose income is more than U$2,700 are 6.5% in Busan
and 9.8% in SMA.
<Table 14> characteristics of graduates by job locations Unit: %, persons
Busan Ulsan·Kyungnam SMA other sum
Sex
Male 48.1 52.1 50.8 66.4 14,487
Female 51.9 47.9 49.2 33.6 14,493
Education level
College 40.1 34.3 14.2 14.2 10,044
University 59.9 65.7 85.8 85.8 18,936
Income
Less than U$900 6.3 6.1 5.1 2.1 1,725
U$900~2,700 87.3 80.2 85.1 74.2 24,632
More than U$2,700 6.5 13.6 9.8 23.6 2,623

Ⅴ. The 2nd Stage of Brain Drain
The shares of TOEIC score more than 700 are 12.8% in Busan and 21.5% in
SMA.
The degrees of satisfaction toward Busan college or university are lower in graduates working in SMA than in Busan.
<Table 15> characteristics of graduates by job locations
Busan Ulsan·Kyungnam SMA Other Sum
TOEIC scores
More than 700 12.8 18.4 21.5 37.7 4,655
500~700 7.0 9.3 5.5 3.6 2,081
Less than 500 0.7 1.2 0.0 0.0 202
degree of
satisfaction to
college or
university
Faculty 3.33 3.39 3.32 3.33 3.34
Quality of class 3.33 3.45 3.22 3.46 3.35
Satisfaction to major 3.48 3.52 3.35 3.4 3.47
Satisfaction to school 3.42 3.47 3.18 3.52 3.41
Experience of foreign study 12.7 11.9 22.4 18.4 4,051
Unit: %, persons

Ⅴ. The 2nd Stage of Brain Drain
The size of companies, in terms of the number of employees, is bigger in SMA
than Busan.
<Table 16> characteristics of graduates by job locations
Busan Ulsan·Kyungnam SMA Other Sum
Number of
employees
1~4 11.6 7.0 5.8 12.9 2,895
5~9 10.6 9.3 7.1 3.7 2,788
10~99 37.1 33.7 35.0 28.9 10,379
100~499 15.7 19.9 17.4 9.9 4,792
500~999 4.5 4.9 5.5 9.2 1,428
More than 1,000 20.4 25.2 29.1 35.5 6,698
(Unit: %, persons)
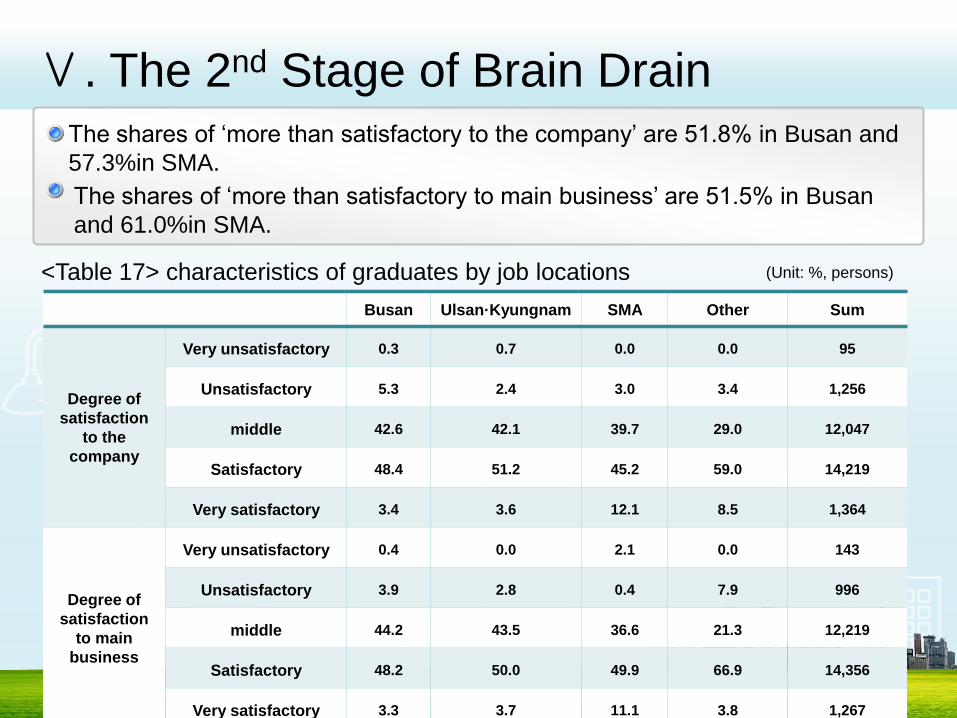
Ⅴ. The 2nd Stage of Brain Drain The shares of ‘more than satisfactory to the company’ are 51.8% in Busan and
57.3%in SMA.
<Table 17> characteristics of graduates by job locations
Busan Ulsan·Kyungnam SMA Other Sum
Degree of
satisfaction
to the
company
Very unsatisfactory 0.3 0.7 0.0 0.0 95
Unsatisfactory 5.3 2.4 3.0 3.4 1,256
middle 42.6 42.1 39.7 29.0 12,047
Satisfactory 48.4 51.2 45.2 59.0 14,219
Very satisfactory 3.4 3.6 12.1 8.5 1,364
Degree of
satisfaction
to main
business
Very unsatisfactory 0.4 0.0 2.1 0.0 143
Unsatisfactory 3.9 2.8 0.4 7.9 996
middle 44.2 43.5 36.6 21.3 12,219
Satisfactory 48.2 50.0 49.9 66.9 14,356
Very satisfactory 3.3 3.7 11.1 3.8 1,267
(Unit: %, persons)
The shares of ‘more than satisfactory to main business’ are 51.5% in Busan
and 61.0%in SMA.
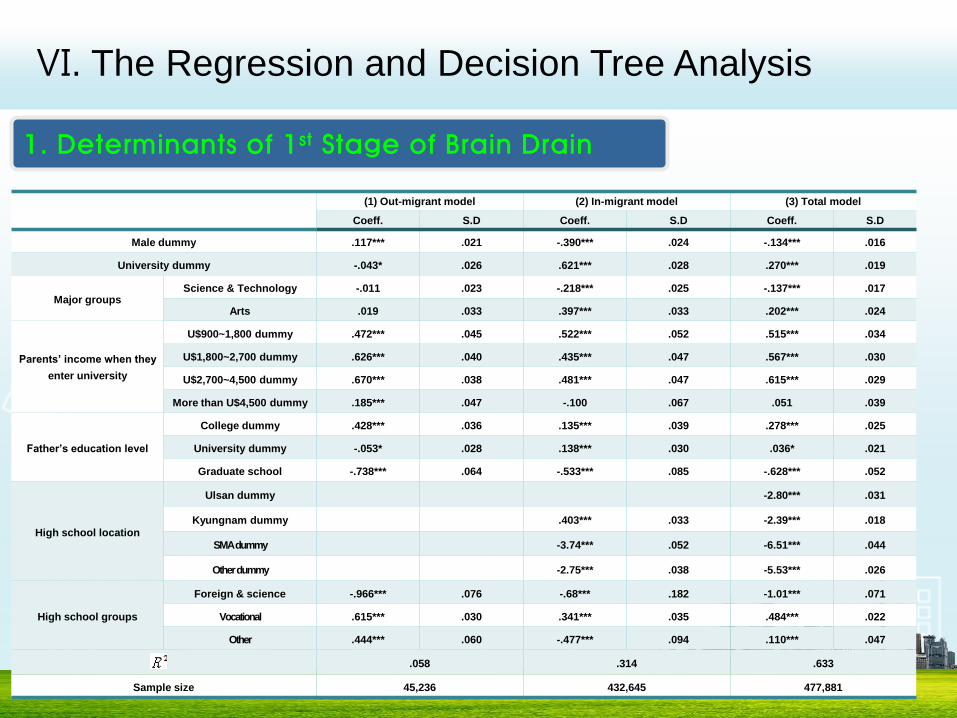
Ⅵ. The Regression and Decision Tree Analysis
1. Determinants of 1st Stage of Brain Drain
(1) Out-migrant model (2) In-migrant model (3) Total model
Coeff. S.D Coeff. S.D Coeff. S.D
Male dummy .117*** .021 -.390*** .024 -.134*** .016
University dummy -.043* .026 .621*** .028 .270*** .019
Major groups Science & Technology -.011 .023 -.218*** .025 -.137*** .017
Arts .019 .033 .397*** .033 .202*** .024
Parents’ income when they
enter university
U$900~1,800 dummy .472*** .045 .522*** .052 .515*** .034
U$1,800~2,700 dummy .626*** .040 .435*** .047 .567*** .030
U$2,700~4,500 dummy .670*** .038 .481*** .047 .615*** .029
More than U$4,500 dummy .185*** .047 -.100 .067 .051 .039
Father’s education level
College dummy .428*** .036 .135*** .039 .278*** .025
University dummy -.053* .028 .138*** .030 .036* .021
Graduate school -.738*** .064 -.533*** .085 -.628*** .052
High school location
Ulsan dummy -2.80*** .031
Kyungnam dummy .403*** .033 -2.39*** .018
SMA dummy -3.74*** .052 -6.51*** .044
Other dummy -2.75*** .038 -5.53*** .026
High school groups
Foreign & science -.966*** .076 -.68*** .182 -1.01*** .071
Vocational .615*** .030 .341*** .035 .484*** .022
Other .444*** .060 -.477*** .094 .110*** .047
.058 .314 .633
Sample size 45,236 432,645 477,881

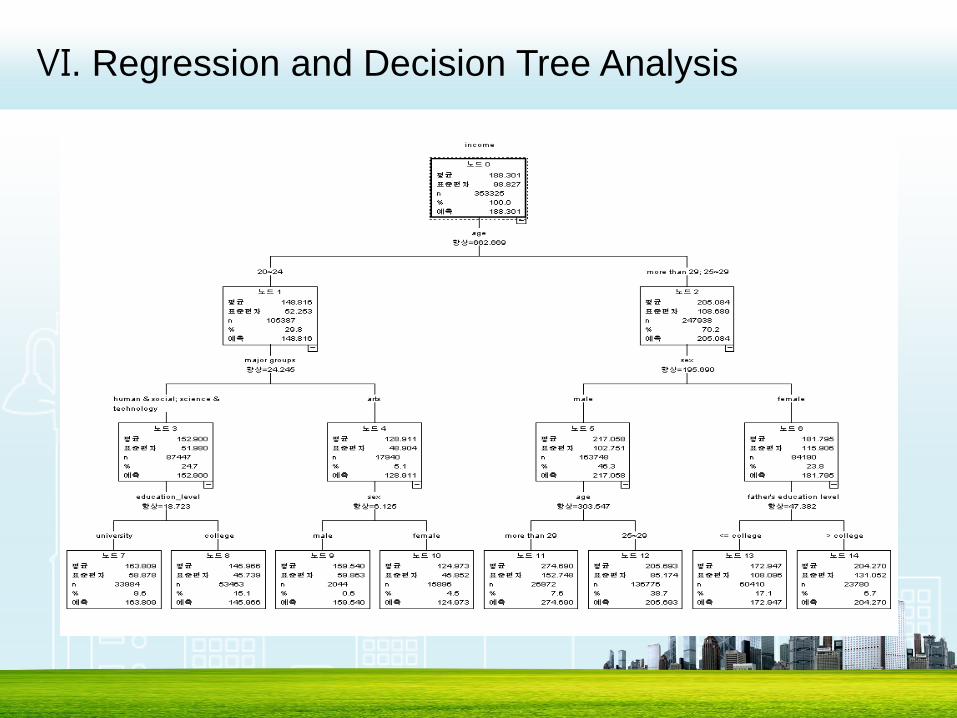
Ⅵ. Regression and Decision Tree Analysis

Ⅵ. The Regression and Decision Tree Analysis
2. Determinants of 2nd Stage of Brain Drain
(1) Out-migrant model (2) In-migrant model (3) Total model
Coeff. S.D Coeff. S.D Coeff. S.D
Male dummy .035 .032 -.422*** .035 -.132*** .023
University dummy -.223*** .033 .410*** .091 .091*** .024
Ages 25~30 dummy -.106*** .036 .041 -.081 -.081*** .026
More than 30 dummy .376*** .056 .250*** .174 .174*** .034
Major groups Science & Technology -.384*** .029 .214*** .032 -.118*** .021
Arts -.411*** .041 .121** .048 -.129*** .031
university location
Ulsan dummy -2.727*** .046
Kyungnam dummy .072 .052 -2.802*** .029
SMA dummy -3.30*** .061 -6.122*** .043
Other dummy -2.05*** .051 -4.937*** .026
Father’s education level
College dummy .486*** .044 1.07*** .041 .845*** .032
University dummy -.014 .035 -.034 .042 -.020 .027
Graduate school -.401*** .091 -16.54 337.2 -.807*** .076
Public university dummy -.803*** .033 -1.26*** .055 -.993*** .027
Toeic score
500~600 dummy -.138 .098 .372*** .091 .147** .072
600~700 dummy -.182*** .058 .462*** .067 .054 .048
700~850 dummy -.232*** .045 .272*** .052 .014 .036
More than 850 dummy -.292* .053 -.364*** .093 -.290*** .046
Experience of foreign study dummy -.113*** .039 .021 .047 -.025 .031
.105 .191 .586
Sample size 28,981 326,669 355,650

Ⅵ. Regression and Decision Tree Analysis

Ⅵ. The Regression and Decision Tree Analysis
3. Determinants of Employment and Salary
(1) Employment (2) Salary
Coeff. S.D Coeff. S.D
Male dummy .234*** .008 38.326*** .363
University dummy -.192*** .009 19.560*** .381
Ages 25~30 dummy .121*** .009 11.737*** .421
More than 30 dummy .411*** .013 68.555*** .546
Major groups Science & Technology .086*** .008 13.217*** .342
Arts -.122*** .010 -16.694*** .493
Father’s education level
College dummy .035** .015 .341 .659
University dummy -.086*** .009 10.235*** .407
Graduate school -.237*** .017 7.906*** .826
Public university dummy -.037*** .010 5.355*** .448
Double major dummy .087*** .011 1.871*** .504
Toeic score
500~600 dummy -.335*** .024 -16.222*** 1.191
600~700 dummy -.437*** .017 -12.002*** .872
700~850 dummy -.499*** .011 9.099*** .575
More than 850 dummy -.224*** .015 37.841*** .706
Degree of satisfaction to university .015** .006 5.121*** .260
Experience of foreign study dummy .249*** .011 9.467*** .474
.048 .174
Sample size 480,193 353,259

Ⅵ. Regression and Decision Tree Analysis
Ⅵ. Regression and Decision Tree Analysis
Ⅶ. Summary
Busan is experiencing brain drain.
- Many high school graduates out-migrate to SMA, while lots of high school
graduates in-migrate to Busan. Net balance exhibits deficit, which implies brain
drain in Busan.
- A lot of college and university graduates out-migrate to SMA and Kyungnam.
Net balance exhibits deficit, which implies brain drain in Busan.
- Adding up 1st and 2nd balances reveals deficit of –9,663 persons in Busan.
It is shown that out-migrants from Busan are in general better than people who
stay in Busan.
- High income and highly educated families are more likely to let their
sons/daughters enter universities in SMA.
- English ability and job market performance of the out-migrants to SMA is better
than people who stay in Busan.

Ⅶ. Summary
Only 8.9% of out-migrants to SMA universities get jobs in Busan, while 81.6%
get jobs in SMA.
- Once high school graduates leave Busan for SMA, they are not likely to come
back for jobs in Busan.
- Keeping young people in Busan for their college educations is important in
curbing brain drain.

Thank you for listening