2012 cacehr external internal data community & child issues
TRANSCRIPT

2012 CACEHR EXTERNAL / INTERNAL DATA FOR COMMUNITY & CHILD ISSUES

Community Action Commission of Erie, Huron & Richland Counties, Inc. APPENDIX B: EXTERNAL DATA: COMMUNITY & CHILD ISSUES
CACEHR 2012 APPENDIX B - EXTERNAL DATA: Community & Child Issues Page 2 of 22
Sub-Issue Erie County Huron County Richland County
ISSU
E: 20
11 S
elf-
Suff
icienc
y St
anda
rdi .
Hou
rly
Wag
e as
sumes
a 4
0 ho
ur w
ork
week
or
eac
h ad
ult
in t
he H
ouse
hold.
Adult
2008 $7.62 Hr.
$1,341 Monthly $16,098 Annual
2011 $8.30 Hr.
$1,416 Monthly $17,527 Annual
2008 $7.67 Hr.
$1,350 Monthly $16,199 Annual
2011 $8.29 Hr.
$1,458 Monthly $17,502 Annual
2008 $7.36 Hr.
$1,269 Monthly $15,548 Annual
2011 $7.91 Hr.
$1,392 Monthly $16,708 Annual
Adult + Preschooler
2008 $13.20 Hr.
$2,322 Monthly $27,868 Annual
2011 $15.64 Hr.
$2,752 Monthly $33,026 Annual
2008 $12.00 Hr.
$2,112 Monthly $25,339 Annual
2011 $14.83 Hr.
$2,611 Monthly $31,326 Annual
2008 $11.55 Hr.
$2,033 Monthly $24,395 Annual
2011 $14.17 Hr.
$2,495 Monthly $29,936 Annual
Adult + Infant + Preschooler
2008 $17.81 Hr.
$3,135 Monthly $37,621 Annual
2011 $21.52 Hr.
$3,788 Monthly $45,458 Annual
2008 $16.17 Hr.
$2,847 Monthly $34,158 Annual
2011 $20.71 Hr.
$3,645 Monthly $43,740 Annual
2008 $15.57 Hr.
$2,740 Monthly 32,874 Annual
2011 $20.18 Hr.
$3,551 Monthly $42,617 Annual
Adult + Preschooler + School-age
2008 $17.05 Hr.
$3,000 Monthly $36,005 Annual
2011 $19.22 Hr.
$3,382 Monthly $40,588 Annual
2008 $15.20 Hr.
$2,675 Monthly $32,101 Annual
2011 $17.65 Hr.
$3,107 Monthly $37,287 Annual
2008 $14.87 Hr.
$2,617 Monthly $31,400 Annual
2011 $16.19 Hr.
$2,976 Monthly $35,716 Annual
Adult + School-age + Teenager
2008 $12.48 Hr.
$2,196 Monthly $26,351 Annual
2011 $13.50 Hr.
$2,375 Monthly $28,503 Annual
2008 $11.93 Hr.
$2,100 Monthly $25,194 Annual
2011 $12.89 Hr.
$2,268 Monthly $27,2218 Annual
2008 $11.69 Hr.
$2,058 Monthly $24,690 Annual
2011 $12.38 Hr.
$2,178 monthly $26,136 Annual
Adult + Infant + Preschooler + School-age
2008 $23.98 Hr.
$4,221 Monthly $50,655 Annual
2011 $26.77 Hr.
$4,711 Monthly $56,532 Annual
2008 $22.95 Hr.
$4,040 Monthly $48,477 Annual
2011 $26.08 Hr.
$4,590 Monthly $55,081 Annual
2008 $22.05 Hr.
$3,881 Monthly $46,567 Annual
2011 $25.01 Hr.
$4,401 Monthly $52,814 Annual
2 Adults + Infant + Preschooler
2008 $10.53 Hr. Per Adult
$3,705 Monthly $44,467 Annual
2011 $12.25 Hr. Per Adult
$4,313 Monthly $51,762 Annual
2008 $9.99 Hr. Per Adult
$3,515 Monthly $42,182 Annual
2011 $11.85 Hr. Per Adult
$4,171 Monthly $50,054 Annual
2008 $9.80 Hr. Per Adult
$3,448 Monthly $41,378 Annual
2011 $11.60 Hr. Per
Adult $4,084 Monthly $49,011 Annual
2 Adults + Preschooler + School-age
2008 $10.27 Hr. Per Adult
$3,613 Monthly $43,359 Annual
2011 $11.15 Hr. Per Adult
$3,926 Monthly $47,116 Annual
2008 $9.51 Hr. Per Adult
$3,348 Monthly $40,177 Annual
2011 $10.73 Hr. Per Adult
$3,778 Monthly $45,335 Annual
2008 $9.22 Hr. Per Adult
$3,245 Monthly $38,944 Annual
2011 $10.40 Hr. Per
Adult $3,692 Monthly $44,300 Annual

Community Action Commission of Erie, Huron & Richland Counties, Inc. APPENDIX B: EXTERNAL DATA: COMMUNITY & CHILD ISSUES
CACEHR 2012 APPENDIX B - EXTERNAL DATA: Community & Child Issues Page 3 of 22
Sub-Issue Erie County Huron County Richland County All 3 Counties
ISSU
E:
Sup
port
s To
Self S
ufficien
cyii
Ohio Works First TANF
Recipients Receiving Cash +217%
91% are children 1,113 in 2010 442 in 2008 524 in 2000
Recipients Receiving Cash +402%
73% are children 1,094 in 2010 356 in 2008 196 in 2000
Recipients Receiving Cash +161%
67% are children 3,158 in 2010 1,318 in 2008 1,954 in 2000
5,365 in 2010 2,116 in 2008 2,674 in 2000
Family of 3 Receives Cash of $434 monthly Statewide. CHILD ONLY
OH WORKS 1st TANF (# Children Living
w/Caregivers)
347 - 2010 336 - 2008 293 - 2000
379 in 2010 263 in 2008 155 in 2000
648 in 2010 646 in 2008 535 in 2000
1,374 in 2010 1,245 in 2008 983 in 2000
# Residents Receiving OH Direction Card
Formerly Food Stamps 10,807 - 2010 ( + 101% ) 5,383 - 2005
8,697 - 2010 ( + 107% )
4,193 - 2005 19,712 - 2010 ( + 74% )
11,326 - 2005 329,216 - 2010
Avg. Card value $128 County-wide - 2009 $119 County-wide - 2009 $128 County-wide - 2009 $125 Service Area Subsidized Child Care:
# of Children 674 - 2010 ( + 36% ) 494 - 2005
448 - 2010 ( + 6% ) 422 - 2005
1,008 -2010 ( + 30% ) 775 - 2005
2,130 - 2010
Children’s Medicaid: # of Children Insured
7,605 - 2009 ( + 14% ) 6,665 - 2005
7,819 - 2009 ( + 19% ) 6,558 - 2005
14,367 - 2009 ( + 10% ) 13,106 - 2005
29,791 - 2009 26,329 - 2005
Help Me Grow (Newborn Home Visits)
2009: # of Kids = 439 2009: # Home Visits = 205
2009: # of Kids = 584 2009: # Home Visits = 349
2009: # of Kids = 961 2009: # Home Visits = 538
2009: # of Kids = 1,984 2009: # Home Visits = 1,029
$ in 2009; Child Support Collections; Paternity
Establishments
$15.9 m - 2009 Collections = - 9%. Paternities est. for non-marital births = - 4%.
$12.6 m - 2009 Collections = -1%. Paternities est. for non-marital births = + 9%.
$23.8 m - 2009 Collections = -4%. Paternities est. for non- Marital births = + 2%.
$52.3 m - 2009

Community Action Commission of Erie, Huron & Richland Counties, Inc. APPENDIX B: EXTERNAL DATA: COMMUNITY & CHILD ISSUES
CACEHR 2012 APPENDIX B - EXTERNAL DATA: Community & Child Issues Page 4 of 22
ISSU
E:
Popu
lation
iii
Sub-Issue Erie County (# - %)
Huron County (# - %)
Richland County (# - %)
3 Counties (# - %)
< 5 years 4,375 (5.7%) in 2011 5,714 ( 7.2%) in 2008
4,345 (7.2%) in 2011 5,566 (9.4%) in 2008 7,665 (6.1%) in 2011 16,385 in 2011
5 - 17 13,076 (16.9%) in 2011 13,879 (17.4%) in 2008
11,806 (19.7) in 2011 11,239 (18.9%) in 2008 21,424 (17%) in 2011 46,306 in 2011
18 – 24 6,131 (7.9%) in 2011 5,726 (7.2%) in 2008
4,924 (8.2) in 2011 5,106 (8.6%) in 2008 10,705 (8.5%) in 2011 21,760 in 2011
25 – 44 17,516 (22.6%) in 2011 21,636 (27.2%) in 2008
15,240 (25.4%) in 2011 17,129 (28.8%) in 2008 31,848 (25.3%) in 2011 64,604 in 2011
45 – 64 23,099 (29.8%) in 2011 20,222 (25.4%) in 2008
15,771 (26.3%) in 2011 13,059 (22%) in 2008 34,491 (27.4%) in 2011 73,361 in 2011
65 years + 13,203 (17.1%) in 2011 12,375 (15.6%) in 2008
7,893 (12.2%) in 2011 7,388 (12.4%) in 2008 19,665 (15.6%) in 2011 40,761 in 2011
Total 77,400 (100%) in 2011 79,551 (100%) in 2008
59,997 (100%) in 2011 59,487 (100%) in 2008 125,791 (100%) in 2011 263,188 in 2011
Proj
ecte
d Po
pulation
Distr
ibut
ion
2020
iv
82,400 63,430 130,050 275,588
ISSU
E:
Popu
lation
of
Larg
est
Plac
esv Erie County Huron County Richland County
Sandusky City = 25,793 Norwalk City = 17,012 Mansfield city = 47,821 Perkins Twp = NA Willard City = 6,236 Shelby city = 9,317 Huron City = 7,149 Bellevue city (pt) = 3,673 Ontario city = 6,225
Vermilion City (pt) = 4,742 New London village = 2,461 Lexington village = 4,822 Milan village = 1,004 Greenwich village = 1,476 Belleville village = 1,918 Castalia village = 852 Monroeville village = 1,400 Plymouth village = 948
Berlin Heights village= 632 Wakeman village - 1,047 Butler village = 933 Kelleys Island village = 312 Plymouth village (pt) = 909 Shiloh village = 649
Bellevue city (pt) = 2 North Fairfield village = 560 Lucas village = 615 Milan village (pt) = 363 Crestline city (pt) = 18
Total = 40,486 Total = 35,137 Total = 73,266

Community Action Commission of Erie, Huron & Richland Counties, Inc. APPENDIX B: EXTERNAL DATA: COMMUNITY & CHILD ISSUES
CACEHR 2012 APPENDIX B - EXTERNAL DATA: Community & Child Issues Page 5 of 22
ISSU
E:
By R
acevi
Sub-Issue Erie County Huron County Richland County 3 Counties
White 67,709 87% 2011 70,427 88.5% 2008
56,667 94.4% 2011 56,764 95.4% 2008
109,888 87.4% 2011 113,743 88.3% 2008 234,242 89% 2011
African American
6,519 8.4% 2011 6,863 8.6% 2008
526 .9% 2011 574 1% 2008
11,824 9.4% 2011 11,377 8.8% 2008 18,869 7.1% 2011
Native American
245 .3% 2011 163 .2% 2008
195 .3% 2011 120 .2% 2008
366 .3% 2011 372 .3% 2008 806 .3% 2011
Asian 498 .6% 2011 332 .4% 2008
219 .4% 2011 150 .3% 2008
832 .7% 2011 709 .6% 2008 1,549 0.5% 2011
Pacific Islander
0 2011 6 .0%) 2008
209 .3% 2011 8 .0% 2008
14 .0% 2011 73 .1% 2008 233 .08% 2011
Other 953 1.2% 2011 441 .6% 2008
1,493 2.5% 2011 1,022 1.7% 2008
609 .5% 2011 409 (.3) 2008 3,056 1.% 2011
2 or More Races
1,476 1.9% 2011 1,319 1.7% 2008
688 1.1% 2011 849 1.4% 2008
2,258 1.8% 2011 2,169 1.7% 2008 4,422 1.6% 2011
Hispanic (of any race) 1,976 2.6% 2011 3,221 5.4% 2011 1,458 1.2% in 2011 5,655 2.1% 2011
Total 77,400 100% 2011 79,551 100% 2008
59,997 100% 2011 59,487 100% 2008
125,791 100% 2011 128,853 100% 2008
263,188 100% 2011 267,891 100% 2008
Total Minority 10,519 13.6% 2011 4,786 8% 2011 16,669 13.3% 2011 31,974 12.1% 2011

Community Action Commission of Erie, Huron & Richland Counties, Inc. APPENDIX B: EXTERNAL DATA: COMMUNITY & CHILD ISSUES
CACEHR 2012 APPENDIX B - EXTERNAL DATA: Community & Child Issues Page 6 of 22
Issue Sub-Issue Erie County Huron County Richland County 3 Counties
Educ
ation
Leve
ls
Pers
ons
25 &
Ove
rvii
Total 53,818 100% 2011 54,232 100% 2008
38,904 100% 2011 37,576 100% 2008
86,004 100% 2011 178,726 100% 2011 91,808 100% 2008
No HS Diploma 6,530 12.1% 2011 8,699 16% 2008
5,893 15.1% 2011 7,123 19% 2008
14,117 16.4% 2011 26,540 14.5% 2011 15,822 17.2% 2008
HS Graduate 21,416 39.8% 2011 22 ,227 41% 2008
19,595 50.4% 2011 18,320 48.8% 2008
37,053 43.1% 2011 78,064 44.4% 2011 40,547 44.1% 2008
Some College, No Degree
11,042 20.5% 2011 11,109 20.5% 2008
6,223 16% 2011 6,281 16.7% 2008
16,298 19% 2011 33,563 18.5% 2011 17,390 18.9% 2008
Associate Degree 4,262 7.9% 2011 3,170 5.8% 2008
2,746 7.1% 2011 1,750 4.7% 2008
6,060 7% 2011 13,068 7.3% 2011 4,290 5.3% 2008
Bachelor Degree 6,892 12.8% 2011 5,976 11% 2008
2,850 7.3% 2011 2,862 7.6%
8,218 9.6% 2011 17,960 9.9% 2011 8,838 9.6% 2008
MA Degree + 3,676 6.8% 2011 3,501 5.6% 2008
1,597 4.1% 2011 1,240 3.3% 2008
4,258 5% 2011 9,531 5.3% 2011 4,741 5.1% 2008
Family
Typ
e by
Employ
men
tviii
Total # Families 21,468 100% 2011 21,939 100% 2008
16,667 100% 2011 16,239 100% 2008
33,727 100% 2011 71,862 100% 2011 38,178 100% 2008
Married, Both in Workforce
8,889 41.4% 2011 9,204 42% 2008
7,568 45.4% 2011 6,927 42.7% 2008
13,916 41.3% 2011 30,373 42.7% 2011 16,131 42.2% 2008
Married, Husband Only In Workforce
3,080 14.3% 2011 3,398 15.5% 2008
2,369 14.2% 2011 2,956 18.2% 2008
4,698 13.9% 2011 10,147 14.1$ 2011 6,354 16.6% 2008
Married, Wife Only In Workforce
1,361 6.3% 2011 1,367 6.2% 2008
995 6% 2011 876 5.4% 2008
2,098 6.2% 2011 4,454 6.1% 2011 2,243 5.8% 2008
Married, Neither In Workforce
3,685 17.2% 2011 3,471 15.8% 2008
2,320 13.9% 2011 2,281 14% 2008
5,157 15.3% 2011 11,162 15.4% 2011 5,752 15% 2008
Male Householder, In Work Force
725 3.4% 2011 807 3.7% 2008
765 4.6% 2011 666 4.1% 2008
1,184 3.5% 2011 2,674 3.8% 2011 1,473 3.8% 2008
Male Householder, Not In Work Force
331 1.5% 2011 283 1.3% 2008
160 1% 2011 194 1.2% 2008
451 1.3% 2011 942 1.2% 2011 477 1.2% 2008
Female Householder, In Work Force
2,426 11.3% 2011 2,509 11.4% 2008
1,671 10% 2011 1,691 10.4% 2008
4,721 14% 2011 8,818 11.7% 2011 4.200 11% 2008
Single Female, Not in Work Force
981 4.6% 2011 900 4.1% 2008
819 4.9% 2011 648 4% 2008
1,502 4.5% 2011 3,302 4.6% 2011 1.548 4% 2008

Community Action Commission of Erie, Huron & Richland Counties, Inc. APPENDIX B: EXTERNAL DATA: COMMUNITY & CHILD ISSUES
CACEHR 2012 APPENDIX B - EXTERNAL DATA: Community & Child Issues Page 7 of 22
Issue Sub-Issue Erie County Huron County Richland County 3 Counties
Hou
seho
ld I
ncom
e In
199
9ix
Total Households 31,755 100% 2011 31,756 100% 2008
223,109 100% 2011 22,258 100% 2008
49,595 100% 2011 104,459 100% 2011 54,014 100% 2008
< $10,000 2,512 7.9% 2011 2,151 6.8% 2008
1,117 4.84.8% 2011 1,512 6.8% 2008
3,190 6.4% 2011 6,819 6.4% 2011 3,663 6.7% 2008
$10 – 19,999 3,644 11.5% 2011 4,010 12.6% 2008
3,148 13.6% 2011 2,817 12.7% 2008
6,277 12.7% 2011 13,069 12.6% 2011 6,827 12.6% 2008
$20 – 29,999 3,606 11.4% 2011 4,782 15.1%
2,839 12.3% 2011 3,342 15% 2008
7,394 14.9% 2011 13,839 12.8% 2011 8,124 15% 2008
$30 – 39,999 3,722 11.7% 2011 3,876 12.2% 2008
2,484 10.7% 2011 3,372 14.7% 2008
6,533 13.2% 2011 12,739 11.8% 2011 7,148 13.2% 2008
$40 – 49,999 3,387 10.7% 2011 3,517 11.1% 2008
2,801 12.1% 2011 2,804 12.6% 2008
4,921 9.99.9% 2011 11,109 11.6% 2011 6,321 11.7% 2008
$50 – 59,999 2,459 7.7% 2011 3,232 10.2% 2008
2,301 10% 2011 2,624 11.8% 2008
4,645 9.4% 2011 9,405 9% 2011 5,856 10.8% 2008
$60 – 74,999 3,450 10.9% 2011 3,851 12.1% 2008
2,854 12.4% 2011 2,706 12.2% 2008
5,180 10.4% 2011 11,484 11.2% 2011 6,557 12.1% 2008
$75 – 99,999 4,058 12.8% 2011 3,459 10.9% 2008
3,047 13.2% 2011 1,915 8.6% 2008
5,783 11.7% 2011 12,888 12.5% 2011 5,374 9.9% 2008
$100 – 149,999 3,715 11.7% 2011 1,991 6.3% 2008
1,892 8.2% 2011 975 4.4% 2008
4,324 8.7% 2011 9,910 9.5% 2011 2,966 5.4% 2008
$150 – 199,999 650 2% 2011 420 1.3% 2008
384 1.7% 2011 93 .4% 2008
814 1.6% 2011 1,848 1.7% 2011 513 .9% 2008
$200,000 + 552 1.7% 2011 465 1.5% 2008
242 1% 2011 198 .9% 2008
534 1.1% 2011 1,328 1.2% 2011 663 1.2% 2008
Median HH Income $46,403 2011 $46,896 2011
$42,223 2011 $45,174 2011

Community Action Commission of Erie, Huron & Richland Counties, Inc. APPENDIX B: EXTERNAL DATA: COMMUNITY & CHILD ISSUES
CACEHR 2012 APPENDIX B - EXTERNAL DATA: Community & Child Issues Page 8 of 22
Issue Sub-Issue: Erie County Huron County Richland County Total Service Area
Wor
kfor
cex
Labor Force 2009 Labor Force 2008 Labor Force 2007
43,100 42,700 42,600
29,200 29,100 29,700
62,600 62,400 62,400
134,900 134,200 134,700
Unemployment Rate 2009 Unemployment Rate 2008 Unemployment Rate 2007
11.5% 7.3% 6%
15.4% 9.7% 8.1%
12.6% 7.4% 6.5%
13.1% 8.1% 6.8%

Community Action Commission of Erie, Huron & Richland Counties, Inc. APPENDIX B: EXTERNAL DATA: COMMUNITY & CHILD ISSUES
CACEHR 2012 APPENDIX B - EXTERNAL DATA: Community & Child Issues Page 9 of 22
Issue Sub-Issue Erie County (#, %)
Huron County (#, %)
Richland County (#, %)
Pove
rty
Rate
sxi
POPULATION Total Population 2009 76,963 59,849 124,490
Minority Population (%) 13.6% 8% 13.3% Population Change 2000-2009 -2,640 +264 -4,307
POVERTY RATES Poverty Rate 1969 7.9% 8.5% 9.1% Poverty Rate 2009 14.6% 12.4% 14.8%
Overall Poverty 12.1% 14% 12.2% Male Poverty 10.5% 12.4% 10.7%
Female Poverty 13.6% 15.5% 13.6% Poverty Under age 5 19.1% 24% 18.7%
Poverty Under age 18 14% 22.1% 18.1% Poverty age 65 + 9.6% 7.5% 7.9%
White, Non-Hispanic Poverty 9.9% 12.6% 11.1% Black African Amer. Poverty 30.5% 30.7% 23.7%
Asian Poverty 5.2% - 1% Hispanic or Latino Poverty 16.8% 37.1% 20% <50% FPL severe poverty 4.4% 4.7% 4.2%
<200 FPL-below self sufficiency poverty 28.9% 33% 32.7% OTHER MEASURES OF ECONOMIC NEED
SNAP Recipients 9,860 7,968 18,130 Medicaid eligible persons 12,230 10,920 22,857
Li-HEAP recipients 5,005 5,290 9,434 Uninsured working-age (18-64) persons 1,841 2,150 2,637 Renters paying 35%+ of income on rent 3,301 1,919 4,931

Community Action Commission of Erie, Huron & Richland Counties, Inc. APPENDIX B: EXTERNAL DATA: COMMUNITY & CHILD ISSUES
CACEHR 2012 APPENDIX B - EXTERNAL DATA: Community & Child Issues Page 10 of 22
Issue Sub-Issue Erie County Huron County Richland County
Hom
eles
s Dat
axii
2011 Key Homeless Data Homeless 221 8 86
Sheltered Homeless 110 8 85 Unsheltered Homeless 111 0 1
Homeless Persons in Family 39 4 24 Homeless Individuals 182 4 62
Total Homelessness 2008-2011 2011 221 8 86 2010 256 62 115 2009 205 27 104 2008 217 21 114
Sheltered Homelessness 2008-2011 2011 110 8 85 2010 89 22 102 2009 81 19 89 2008 98 17 90
Unsheltered Homelessness 2008-2011 2011 111 0 1 2010 167 40 13 2009 124 8 15 2008 119 4 24
Family Homelessness 2008-2011 2011 39 4 24 2010 40 27 29 2009 24 22 32 2008 73 20 26
Individual Homelessness 2008-2011 2011 182 4 62 2010 216 35 86 2009 181 5 72 2008 144 1 88

Community Action Commission of Erie, Huron & Richland Counties, Inc. APPENDIX B: EXTERNAL DATA: COMMUNITY & CHILD ISSUES
CACEHR 2012 APPENDIX B - EXTERNAL DATA: Community & Child Issues Page 11 of 22
Issue Sub-Issue Erie County Huron County Richland County Total Service Area
Vete
rans
Dat
axiii
Veterans Population 2006-2010 7,795 5,010 12,370 26,175 By Educational Attainment
Less than High School Graduate 644 325 1,104 2,073 High School Grad / Equivalency 3,115 2,281 5,122 10,518
Some College / Assoc. Degree 1,741 1,383 3,411 6,535 BA / Higher 1,482 675 1,485 3,624
Median Income Past 12 Months by Sex All Veterans $32,104 $35,769 $29,017 $32,296
Male Veterans $32,385 $36,545 $29,575 $32,835 Female Veterans $20,800 $23,500 $17,933 $20,744
Ohio Veterans Homelessness: 2011 Point In Time Dataxiv
Senior
xv
Sub-Issue Erie County Huron County Richland County Total Service Area
Age # Age 65-74 7,015 4,397 10,571 21,983 # Age 75-84 4,334 2,652 6,928 13,914
# Age 85+ 1,956 1,034 2,761 5,751 TOTAL Population # Age 65+ 13,305 8,083 20,260 41,648
Poverty 65 Years & + Below Poverty Level 666 5.4% 452 5.8% 1,665 8.5% 2,783 6.5%

Community Action Commission of Erie, Huron & Richland Counties, Inc. APPENDIX B: EXTERNAL DATA: COMMUNITY & CHILD ISSUES
CACEHR 2012 APPENDIX B - EXTERNAL DATA: Community & Child Issues Page 12 of 22
Busine
ss Num
bers
xvi
Sub-Issue Erie County Huron County Richland County
Business Starts 128 2008 141 2007
98 2008 101 2007
230 2008 271 2007
Active Businesses 1,675 2008 1,702 2007
1,313 2008 1,358 2007
2,333 2008 2,333 2007
Taxes Expenditures Value of
Real Property $1,985,940,240 $974,887,490 $1,987,587,320
Ohio Income Tax Liability $50,204,675 $31,158,984 $63,266,358
Average per return $1,343 2011 $1,580 2008
$1,092 2011 $1,147 2008 $1,134 2011
Federal Expenditures $557,646,393 $375,177,131 $814,632,381
Voting
xvii Sub-Issues Erie County Huron County Richland County
% Turnout 72% 2012 Election 54.6% 2010 Election 61.3% 2007 Election
79% 2012 Election 45.7% 2010 Election 54.9% 2007 Election
48.2% 2010 Election
Tran
spor
tation
xviii
Sub-Issues Erie County Huron County Richland County Registered Vehicles 91,309 72,067 137,686
Total # Workers 16 yrs & +
34,319 26,186 52,964
Travel < 15 min 15,756 11,496 19,926 Travel 15-29 min 12,067 7,480 23,199 Travel 30-44 min 3,870 4,398 5,339 Travel 45-59 min 1,314 1,301 1,308 Travel 60 min + 1,312 1,511 3,192
Mean Travel Time 18.4 min 21.2 min 20.5

Community Action Commission of Erie, Huron & Richland Counties, Inc. APPENDIX B: EXTERNAL DATA: COMMUNITY & CHILD ISSUES
CACEHR 2012 APPENDIX B - EXTERNAL DATA: Community & Child Issues Page 13 of 22
Hea
lth/
Med
ical C
arexi
x
Sub-Issues Erie County Huron County Richland County
# Physicians (MDs & DOs) 179 2011 191 2008
65 2011 65 2008 223 2011
Registered Hospitals/# Beds 2 hospitals; 401 beds 2011 2 hospitals; 401 beds 2008
2 hospitals; 138 beds 2011 2 hospitals; 138 beds 2008 2 hospitals; 398 beds 2011
Licensed Nursing Homes/# Beds 10 homes; 1,212 beds 2011 17 homes; 1,905 beds 2008
6 homes; 430 beds 2011 15 homes; 1,244 beds 2008 11 homes; 895 beds 2011
Licensed Residential Care/# Beds 5 care; 419 beds 2011 9 care; 652 beds 2008
3 care; 162 beds 2011 4 care; 200 beds 2008 7 care; 520 beds 2011
Adults w/Employer-based Insurance 63.5% 2011 63.5% 2008
67.3% 2011 67.3% 2008 64.2% 2011
Children w/Employer- based Insurance
60.1% 2011 60.1% 2008
76.8% 76.8% 58.7% 2011
Tota
l Hou
sing
Units
xx
Sub-Issues Erie County Huron County Richland County
Occupied 31,755 84.7% 2011 31,727 88.4% 2008
23,109 93.1% 2011 22,307 94.5% 2008
49,595 90.3% 2011
By Owner 23,205 73.1% 2011 22,854 63.6% 2008
17,122 74.1% 2011 16,113 68.3% 2008
35,491 71.6% 2011
By Renter 8,550 26.9% 2011 8,873 24.7% 2008
5,987 25.9% 2011 6,194 26.3% 2008
14,104 28.4% 2011
Vacant 5,743 15.3% 2011 4,182 11.6% 2008
1,701 6.9% 2011 1,287 5.5% 2008
5,352 9.7% 2011
Median Year Structure Built 1963 1961; 48 yrs. Old 2008
1965 1960; 49 yrs. Old 2008
1961
Community Action Commission of Erie, Huron & Richland Counties, Inc. APPENDIX B: EXTERNAL DATA: COMMUNITY & CHILD ISSUES
CACEHR 2012 APPENDIX B - EXTERNAL DATA: Community & Child Issues Page 14 of 22
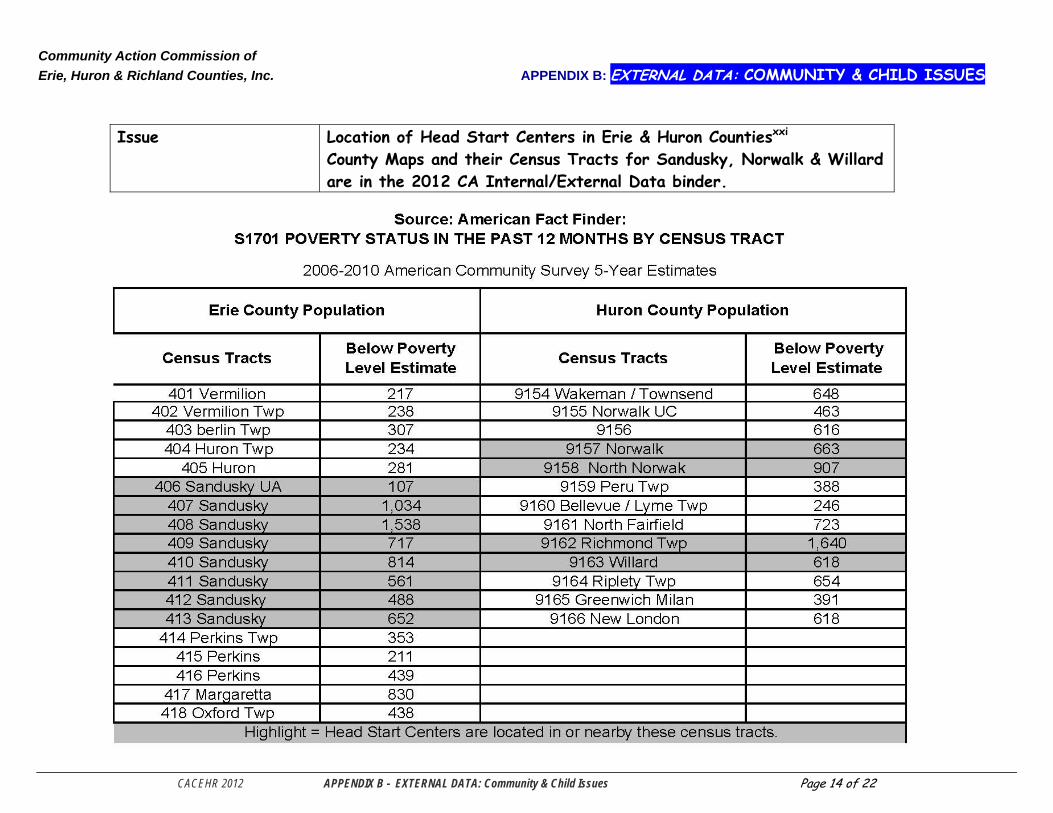
Issue Location of Head Start Centers in Erie & Huron Countiesxxi County Maps and their Census Tracts for Sandusky, Norwalk & Willard are in the 2012 CA Internal/External Data binder.

Community Action Commission of Erie, Huron & Richland Counties, Inc. APPENDIX B: EXTERNAL DATA: COMMUNITY & CHILD ISSUES
CACEHR 2012 APPENDIX B - EXTERNAL DATA: Community & Child Issues Page 15 of 22
Issue Sub-Issue Erie County Huron County Richland County Total Service Area Ch
ildre
n &
Pove
rty
xxii
Children Living in Poverty 2,780 2012 2,987 2008
3,150 2012 2,552 2008 5,805 2012 11,735 2012
5,539 2008
Poverty Rate for Children 17% 2008 17% 2005
21% 2008 16% 2005
21% 2008 18% 2005
19.6% 2008 17% 2005
Est. # of Children by Single Ages in 2010xxiii
844 - 3 yrs old 2010 843 – 4 yrs old 2010
1,687 3+4 Yrs.
792 - 3 yrs. old 2010 893 - 4 yrs old 2010
1,685 3+4 Yrs.
NA For Head Start
1,636 – 3 yrs. old 2010 1,736 – 4 yrs. Old 20??
3,372 3+4 Yrs.
Aff
orda
ble
Hou
sing
xxiv
RENTAL: Fair Market Rent
(2 BR apt.) $666 mo. 2012 $646 mo. 2008
$636 mo. 2012 $618 mo. 2008
$607 mo. 2012
Hr. Wage Needed (2 BR Apt.) @ 40 Hr. Work week
$12.81 2012 $12.42 2008
$12.23 2012 $11.88 2008 $11.67 2012
Renters Who Cannot Afford 2 BR Apt.
42% 2012 42% 2008
39% 2012 40% 2008 42% 2012
Median Gross RENTxxv $639 2011 $496 2008
$592 2011 $474 2008 $579 2011
OWNER:
Median Monthly Owner’s Cost $1,259 2011 $949 2008
$1,135 2011 $849 2008 $1,103 2011
Family
Typ
e w/
Own
Ch
ildre
n <1
8xxv
i
Married couple, w own children 5,925 2011 7,100 2008
5,235 2011 6,089 2008
9,279 2011
Male Householder, no wife present, w/Own children
587 2011 595 2008
632 2011 481 2008
905 2011
Female Householder, no husband present, w/Own children
2,110 2011 2,208 2008
1,805 2011 1,606 2008
4,001 2011
Families with No Own Children
12,846 2011 12,036 2008
8,995 2011 8,054 2008
460 2011
Grandparents Raising Grandkidsxxvii 529 2009 844 2000
723 2009 381 2000
1,214 2009 1,225 2000

Community Action Commission of Erie, Huron & Richland Counties, Inc. APPENDIX B: EXTERNAL DATA: COMMUNITY & CHILD ISSUES
CACEHR 2012 APPENDIX B - EXTERNAL DATA: Community & Child Issues Page 16 of 22
Pove
rty
Stat
us o
f Fa
milies
By
Fam
ily T
ype
by p
rese
nce
of R
elat
ed C
hildre
nxxv
iii Sub-Issue Erie County Huron County Richland County Total Service
Area Families
Total Families 21,468 100% 16,667 100% 33,727 100% 71,862 100% Family Income Above Poverty 19,684 91.7% 14,873 89.2% 30,945 91.8% 65,502 91.1% Family Income Below Poverty 1,784 8.3% 1,794 10.8% 2,782 8.2% 6,360 8.9%
Only Families Below Poverty Married w/ Children 247 13.8% 383 21.3% 644 23.1% 1,274 20%
Single Male w/ Children 143 8% 204 11.4% 192 6.9% 539 8.4% Single Female w/ Children 907 50.8% 979 54.6% 1,486 53.4% 3,372 53%
Families No Related Children 487 27.3% 228 12.7% 460 16.5% 1,175
Scho
ol
Lunc
h &
SFSP
xxix Child Nutrition
Low-Income Average Daily Participation 6,816 2011 4,104 2002
5,628 2011 2,804 2002
11,757 2011 7,785 2002
24,201 2011 14,693 2002
Pre-
scho
ol D
isab
ility
Dat
axxx
Public School District with pre-Schools / # of children with disabilities
Berlin-Milan 21 Huron City 20 Margaretta 25 Perkins Local 26 Sandusky City 102 Vermilion 31
225
Bellevue City 41 Monroeville 13 New London 13 Norwalk City 53 South Central 9 Western Res. 5 Willard 30
156
NA For Head Start 381
Obe
sity
xxxi
Youth Obesity Rate 19% 2011 18.5% 2008
15% 2011 15.5% 2008 14% 2011
Teen
Pr
egna
ncy
xxxi
i
Teen Births 102 teens, age 15-19 gave birth in 2008 Rate: 45/1,000
105 teens, age 15-19 gave birth in 2008 Rate: 57/1,000
230 teens, age 15-19 gave birth in 2008
Rate: 62./1,000

Community Action Commission of Erie, Huron & Richland Counties, Inc. APPENDIX B: EXTERNAL DATA: COMMUNITY & CHILD ISSUES
CACEHR 2012 APPENDIX B - EXTERNAL DATA: Community & Child Issues Page 17 of 22
Sub-Issue Erie County Huron County Richland County
Acc
ess
to
Hea
lth
xxxi
ii +
xx
xiv Children’s Medicaid 7,605 2012
6,665 2005 7,819 2012 314 2005
14,367 2009 13,106 2005
Adults w/o Health Insurance 9% 12% 13%
Child
Abu
se &
Neg
lect
xxxv
Children in Custody: 1/2010 63 21 46
Neglect 19% 5% 2%
Dependency 34% 14% 28%
Physical Abuse 2% - 7%
Sexual Abuse 13% - -
Delinquency/Unruly 2% 5% 2%
Multiple Safety Issues 30% 76% 61%
Issue Sub-Issue Erie County Huron County Richland County
Help
Me
Grow
xxxv
i
Help Me Grow 439 2009 367 2005
584 2009 314 2005
NA For Head Start
Mon
thly C
hild C
are
Cost
sxxxv
ii
Adult & Preschooler $616 20011 $543 2008
$575 2011 $451 2008
$575 2011
Adult, Infant & Preschooler $1,291 2011 $1,081 2008
$1,226 2011 $972 2008
$1,226 2011
Adult & Preschooler & School-age $967 2011 $956 2008
$897 2011 $824 2008
$897 2011
Adult, School Age & Teenager $351 2011 $413 2008
$322 2011 $372 2008
$322 2011
Adult, Infant, Preschooler & School Age $1,643 2011
$1,494 2008
$1,548 2011 $1,344 2008
$1,548 2011
2 Adults, Infant & Preschooler $1,291 2011 $1,081 2008
$1,226 2011 $972 2008
$1,226 2011
2 adults, Preschooler & School-age
$967 2011 $956 2008
$897 2011 $824 2008
$897 2011

Community Action Commission of Erie, Huron & Richland Counties, Inc. APPENDIX B: EXTERNAL DATA: COMMUNITY & CHILD ISSUES
CACEHR 2012 APPENDIX B - EXTERNAL DATA: Community & Child Issues Page 18 of 22
Competing Child Care Providers in Erie & Huron Countiesxxxviii

Community Action Commission of Erie, Huron & Richland Counties, Inc. APPENDIX B: EXTERNAL DATA: COMMUNITY & CHILD ISSUES
CACEHR 2012 APPENDIX B - EXTERNAL DATA: Community & Child Issues Page 19 of 22
Grad
uation
Rat
esxx
xix
Erie County Huron County Richland County Berlin Milan Local
97.8% Bellevue City
94.8% Clear Fork Valley Local
94.4% Huron City Schools
95.6% Monroeville Local
98.4% Crestview Local
94.6% Margaretta Local District
92.8% New London Local
94% Lexington Local
97.1% Perkins Local
97.3% Norwalk City
91.7% Lucas Local
90.9% Sandusky City
85.4% South Central Local
96.7% Madison Local
86.7% Vermilion Local
96% Western Reserve Local
91.6% Mansfield City
83.7%
Willard City 90.6%
Ontario Local 98.3%
Plymouth-Shiloh Local 93.7%
Shelby City 92.1%
Den
tal Ca
rexl
Sub Issue Erie County Huron County Richland County
% with dental visit in 1 year
<18 Yrs: 76.5% 18-64 Yrs: 63% 65+ Yrs: 63.8%
<18 Yrs: 68% 18-64 Yrs: 50.3% 65+ Yrs: 41.3%
<18 Yrs: 81.9% 18-64 Yrs: 61% 65+ Yrs: 56.2%
% Never Visited Dentist
<18 Yrs: 10.2% 18-64 Yrs: NA 65+ Yrs: NA
<18 Yrs: 13.6% 18-64 Yrs: NA 65+ Yrs: NA
<18 Yrs: 9.5% 18-64 Yrs: NA 65+ Yrs: NA
% Uninsured for Dental Care
<18 Yrs: 23.2% 18-64 Yrs: 40.9% 65+ Yrs: 53.6%
<18 Yrs: 22.4% 18-64 Yrs: 50.6%
65+ Yrs: 65%
<18 Yrs: 18% 18-64 Yrs: 34.4% 65+ Yrs: 58.1%
% Could Not Receive Dental Care
<18 Yrs: 5.2% 18-64 Yrs: 16.4%
65+ Yrs: 1.2%
<18 Yrs: 7.2% 18-64 Yrs: 20.1%
65+ Yrs: 3.2%
<18 Yrs: 4.1% 18-64 Yrs: 12.6%
65+ Yrs: 6.7%

Community Action Commission of Erie, Huron & Richland Counties, Inc. APPENDIX B: EXTERNAL DATA: COMMUNITY & CHILD ISSUES
CACEHR 2012 APPENDIX B - EXTERNAL DATA: Community & Child Issues Page 20 of 22
Sources: i Erie Huron Richland County Data, The Self-Sufficiency Standard for OHIO Publications from 2011 & 2008. OACAA. ii Erie Huron Richland County Profiles, 2011-2012 Public Children’s Service Association of Ohio Factbook, 10th Edition. iii Erie Huron Richland County Profiles, Ohio Department of Research, 2011 & 2008. iv Ibid. v Ibid. viIbid. vii Ibid. viii Ibid. ix Ibid. xIbid. xi Erie Huron Richland Counties, The State of Poverty in Ohio - A Path to Recovery, May 2011. xii 2011 Ohio Homelessness Report, COHHIO. xiii US Census Bureau: Quick Facts for Population, American Fact Finder for Educational Attainment & Median Income. xiv 2011 Ohio Homelessness Report, pg. 11: Veteran Homelessness. xv Mehdizadeh, S., Kunkel, S., & Yamashita, T. (2012). Aging in Ohio: Population Age 65+ 2000 and 2010 by County. Scripps Gerontology Center, Miami University: Oxford, OH. xvi Erie Huron Richland County Profiles, Ohio Department of Research, 2011 & 2008. xvii Erie Huron Richland County Profiles, Ohio Department of Research, 2011 & 2008. 2012 Results: Board of Election for Erie, Huron & Richland Counties; Websites. xviii Erie Huron Richland County Profiles, Ohio Department of Research, 2011. xix Ibid. xx Ibid. xxi Extract of Data from Original Source: American Fact Finder: S1701 Poverty Status in the past 12 Months By Census Tract By County. xxii Erie Huron Richland County Profiles, Ohio Department of Research, 2011 & 2008. 2012 Public, Children’s Service Association of Ohio Factbook, 10th Edition. Erie & Huron County Profiles, 2009-2010 Public Children’s Service Association Factbook, 9th Edition. xxiii U.S. Census Bureau, American Fact Finder, Single Year of Age and Sex: 2010, Erie Huron Counties, Ohio. xxiv Erie Huron Richland County Profiles, 2011 & 2008. xxv Ibid. xxvi Erie Huron Richland County Profiles, Ohio Department of Research, 2011 & 2008 xxvii 2012 Public Children’s Service Association of Ohio Factbook, 10th Edition. xxviii Erie Huron Richland County Profiles, Ohio Department of Research, 2011. xxix Children’s Hunger Alliance, Erie Huron Richland Counties Profiles, 2012. xxx Elizabeth N. Lord, Regional Coordinator of Early Learning & School Readiness. State Support Team 2 serving Erie Huron Lorain Counties. xxxi 2011 Health Assessments: Erie Huron Richland. xxxii 2012 Public Children’s Service Association of Ohio Factbook, 10th Edition. xxxiii Ibid. xxxiv 2011 Health Assessments: Erie Huron Richland. xxxv 2011 Public Children’s Service Association of Ohio Factbook, 10th Edition.

Community Action Commission of Erie, Huron & Richland Counties, Inc. APPENDIX B: EXTERNAL DATA: COMMUNITY & CHILD ISSUES
CACEHR 2012 APPENDIX B - EXTERNAL DATA: Community & Child Issues Page 21 of 22
xxxvi Ibid. xxxvii Erie Huron Richland County Data, The Self-Sufficiency Standard for OHIO 2011 & 2008, OACAA. xxxviii www.odjfs.state.oh.us/cdc. xxxix ODE website: iLRC - Reports for Erie Huron Richland Counties Local School Districts. xlOhio Department of Health, Oral Health Surveillance System 2011, Erie Huron Richland Counties.

Community Action Commission of Erie, Huron & Richland Counties, Inc. APPENDIX B: EXTERNAL DATA: COMMUNITY & CHILD ISSUES
CACEHR 2012 APPENDIX B - EXTERNAL DATA: Community & Child Issues Page 22 of 22
Community Action Commission of Erie, Huron & Richland Counties, Inc. 908 Seavers Way
Sandusky, OH 44870
Please Contact: Jan ice W. Warner, President / CEO or Debra S. Fisher, Director of Research & Development for more information. PH: 419-626-4320 www.cacehr.org
Published November 14, 2012